
Study on the Structure, Efficiency, and Driving Factors of an Eco-Agricultural Park Based on Emergy: A Case Study of Jinchuan Eco-Agricultural Park
 ,
,
Abstract
:1. Introduction
2. Methods
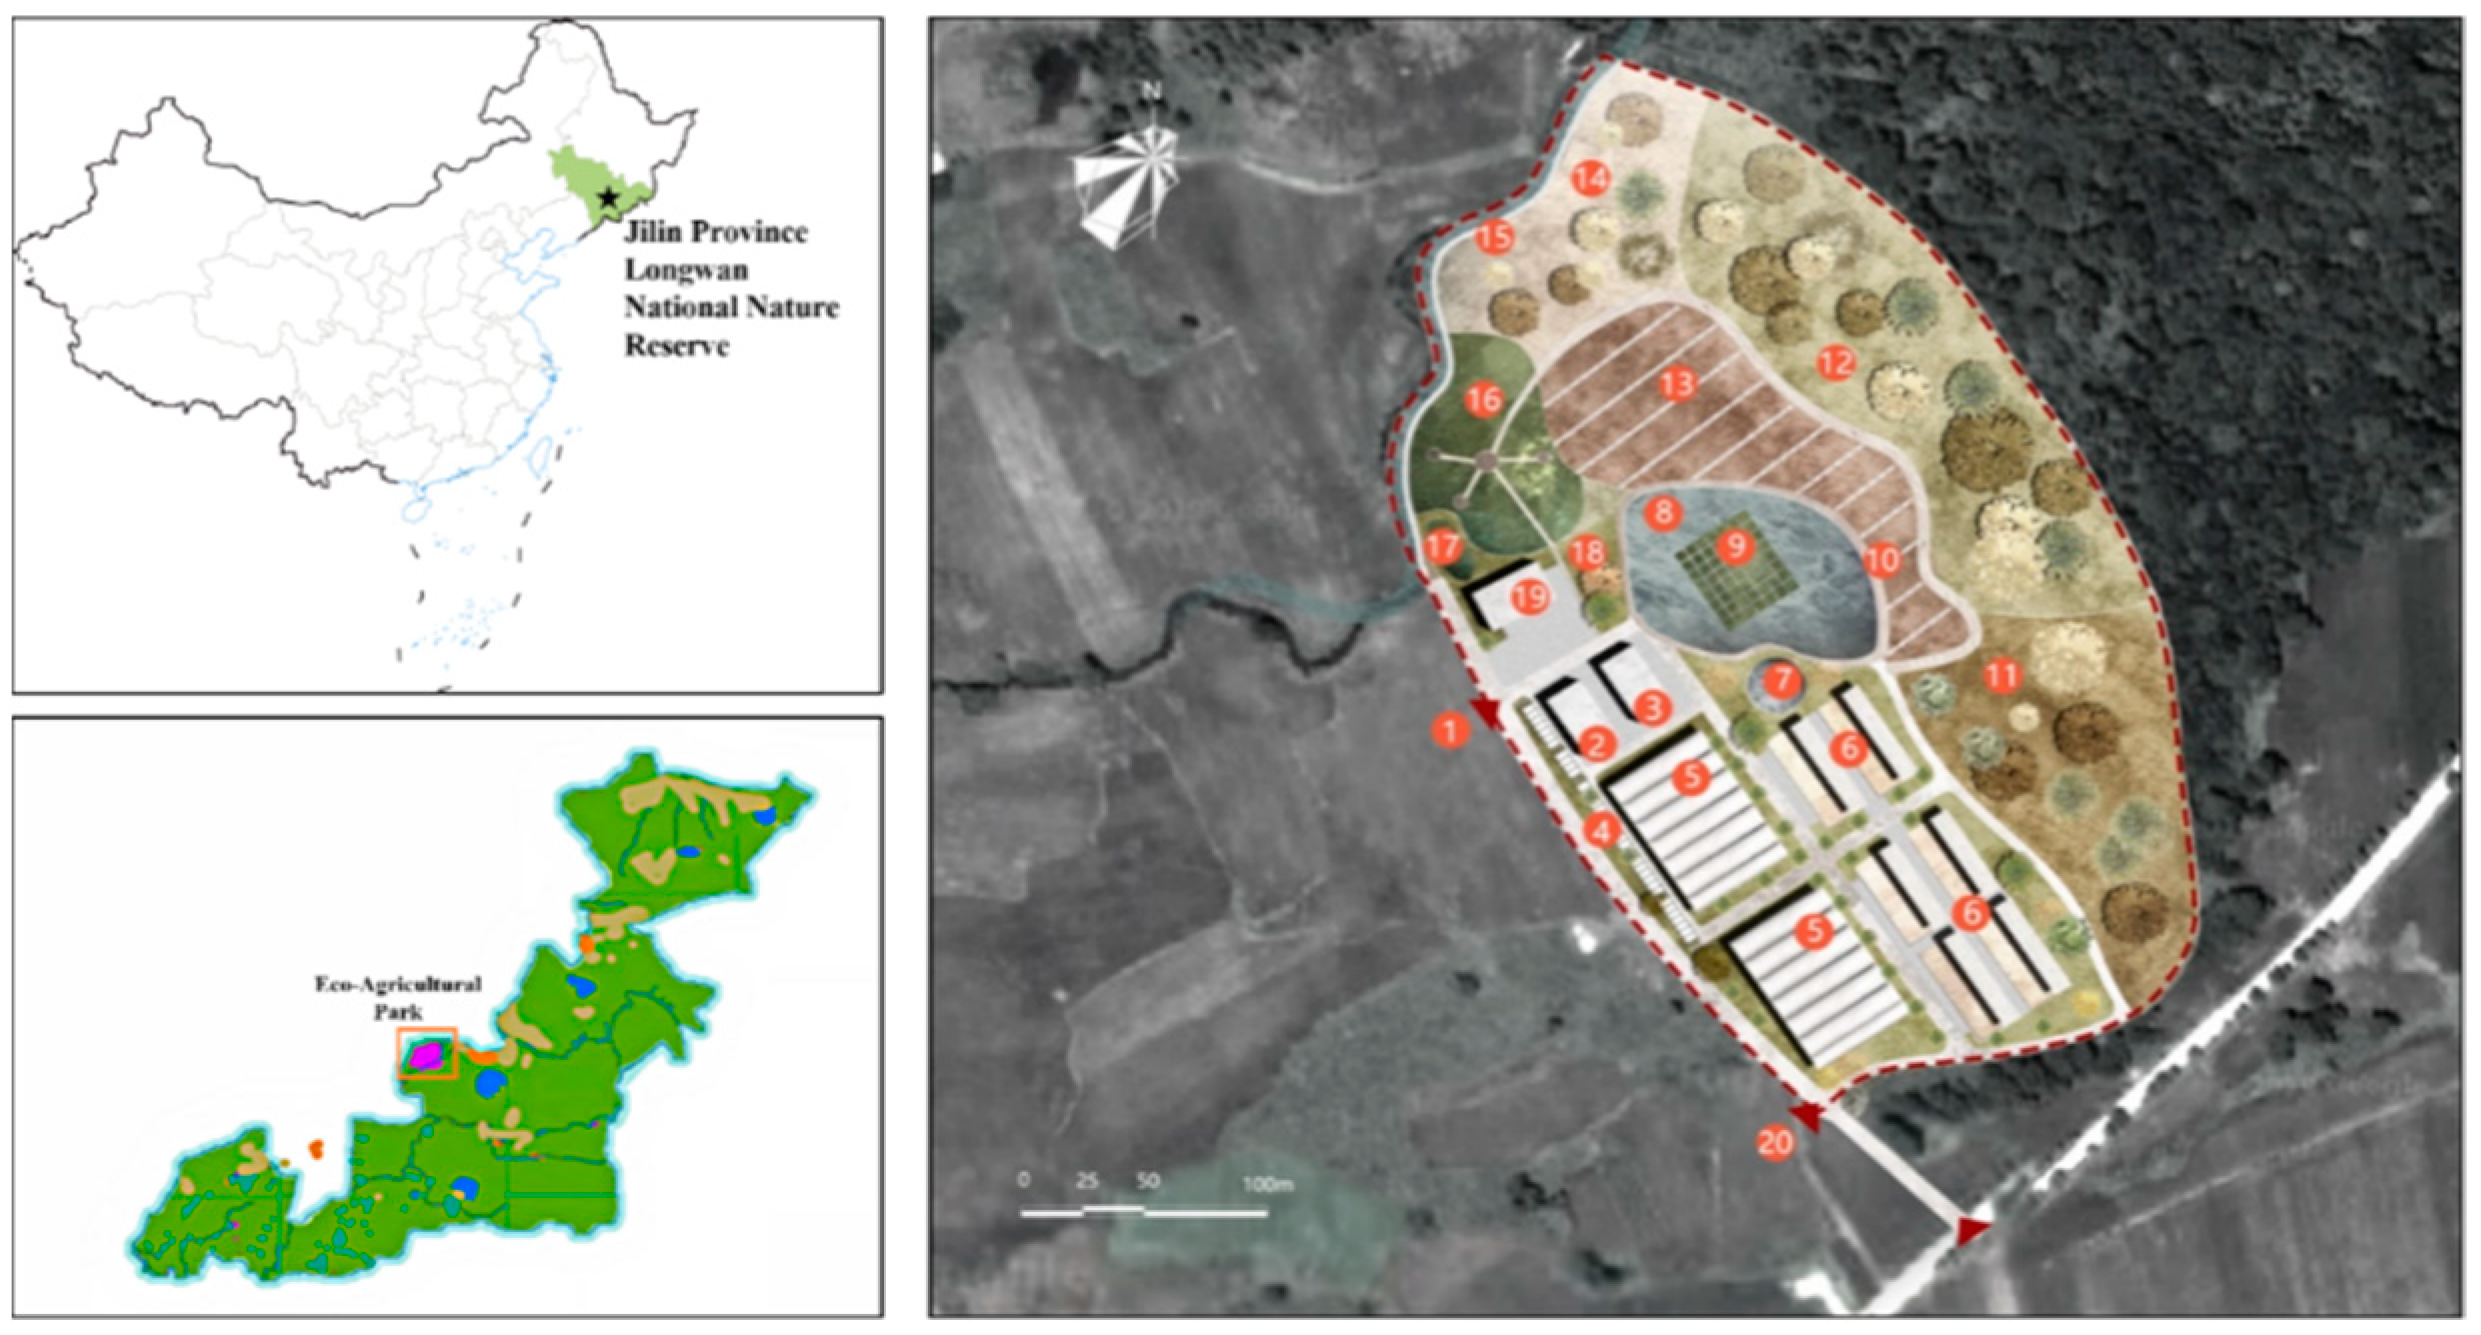
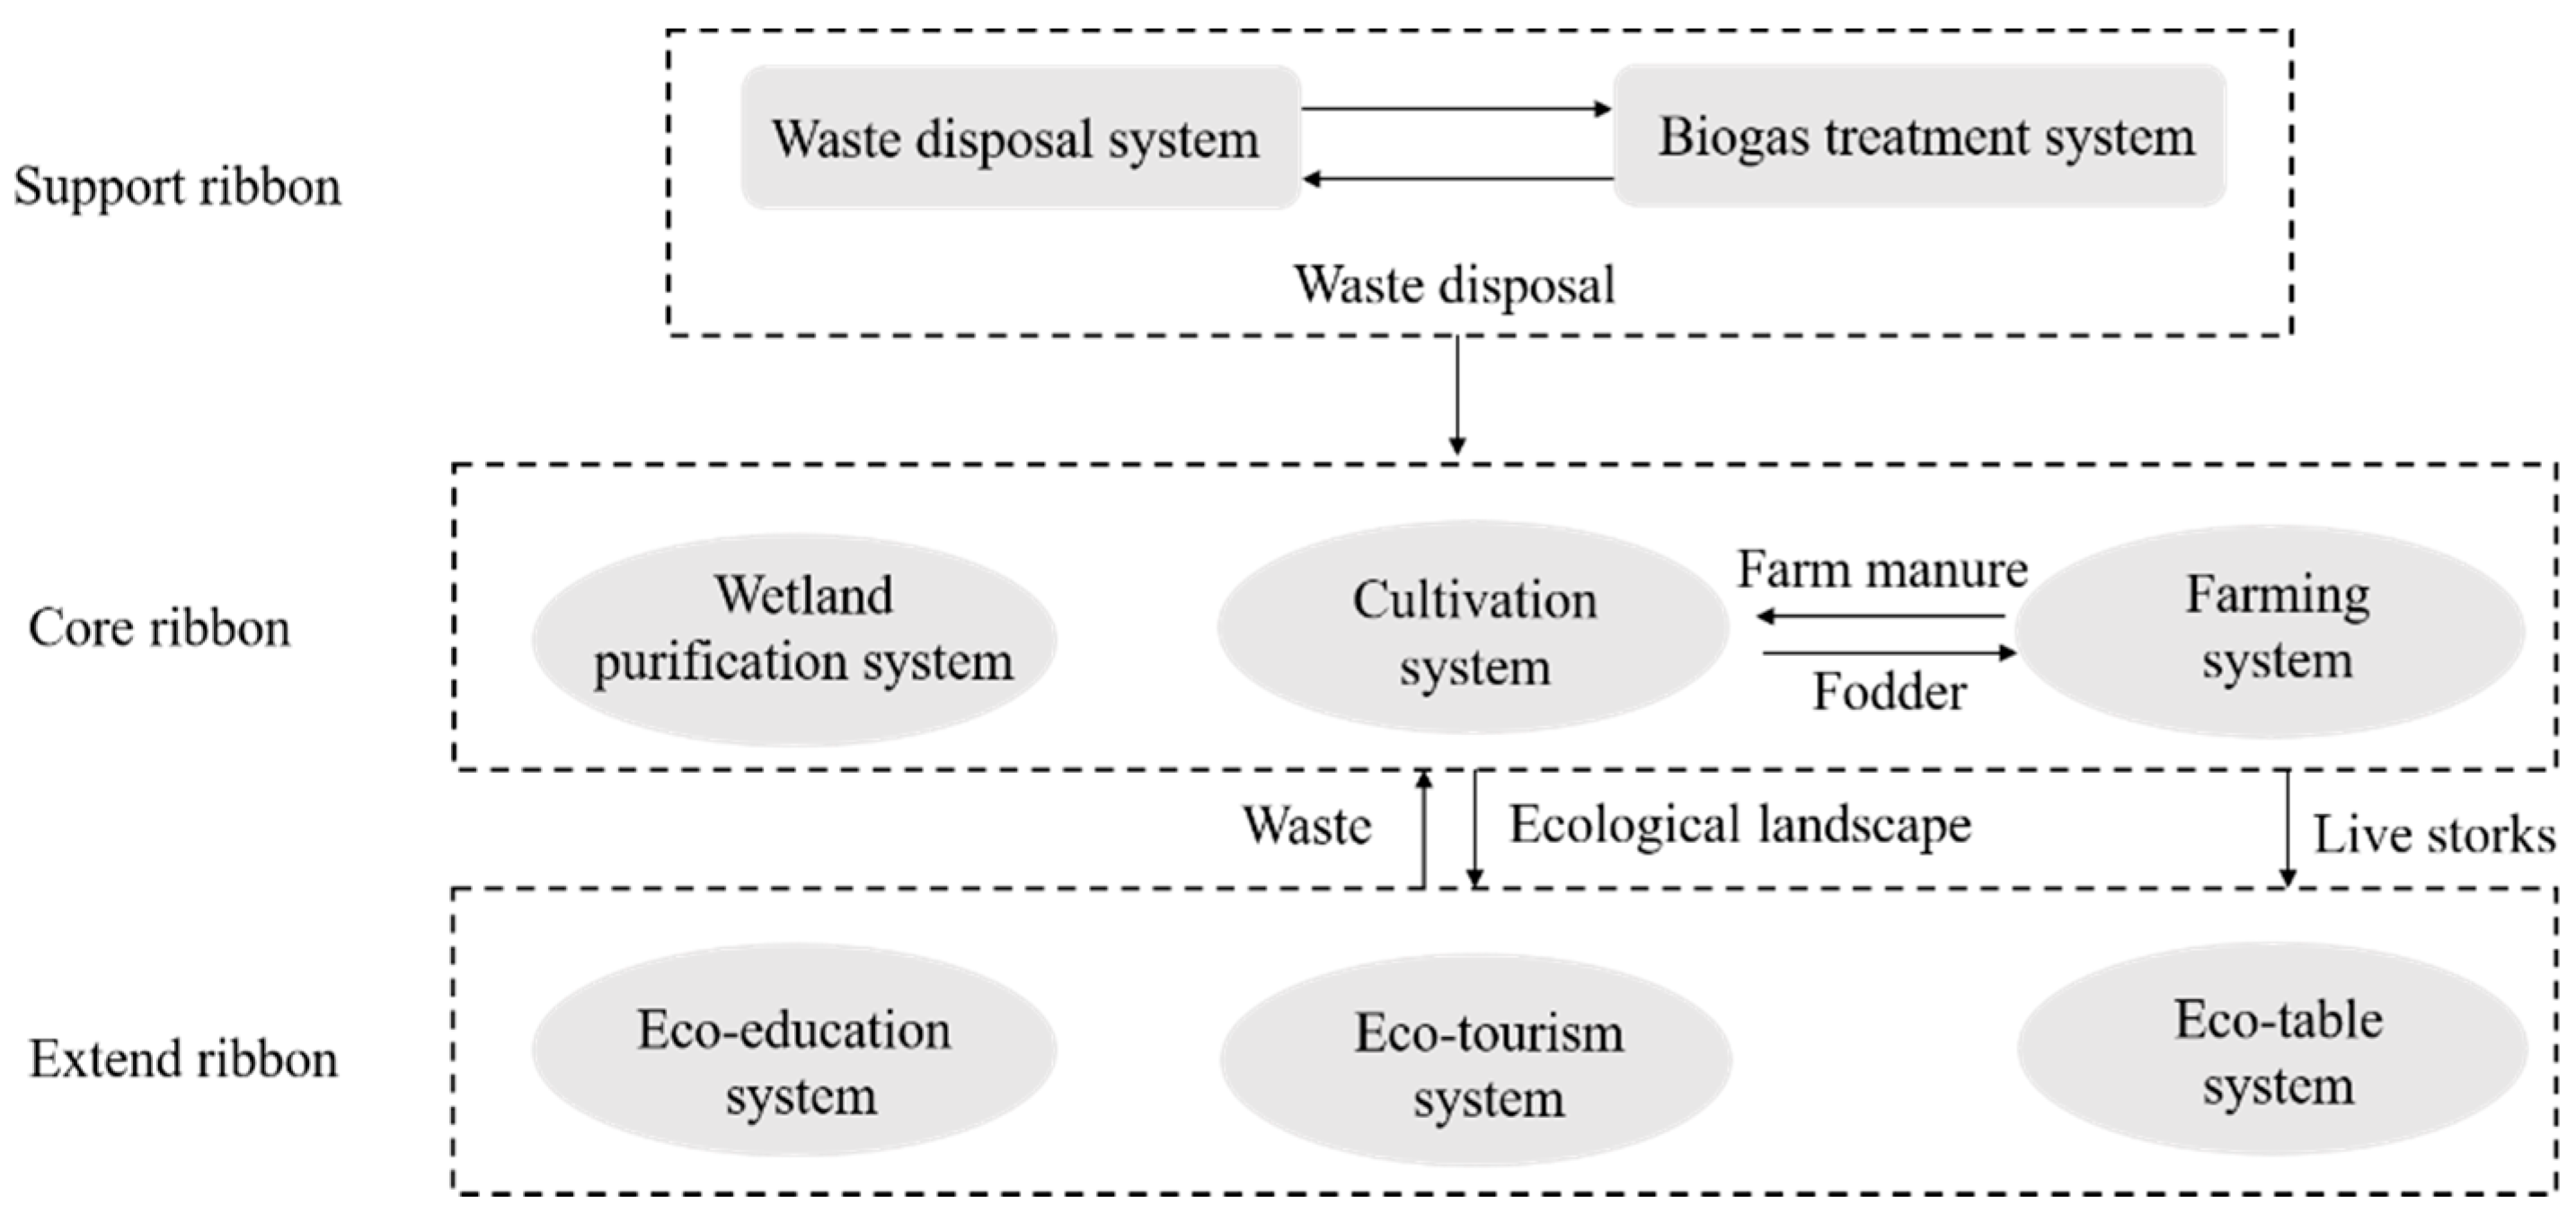
2.1. Research Area
2.2. Emergy Analysis
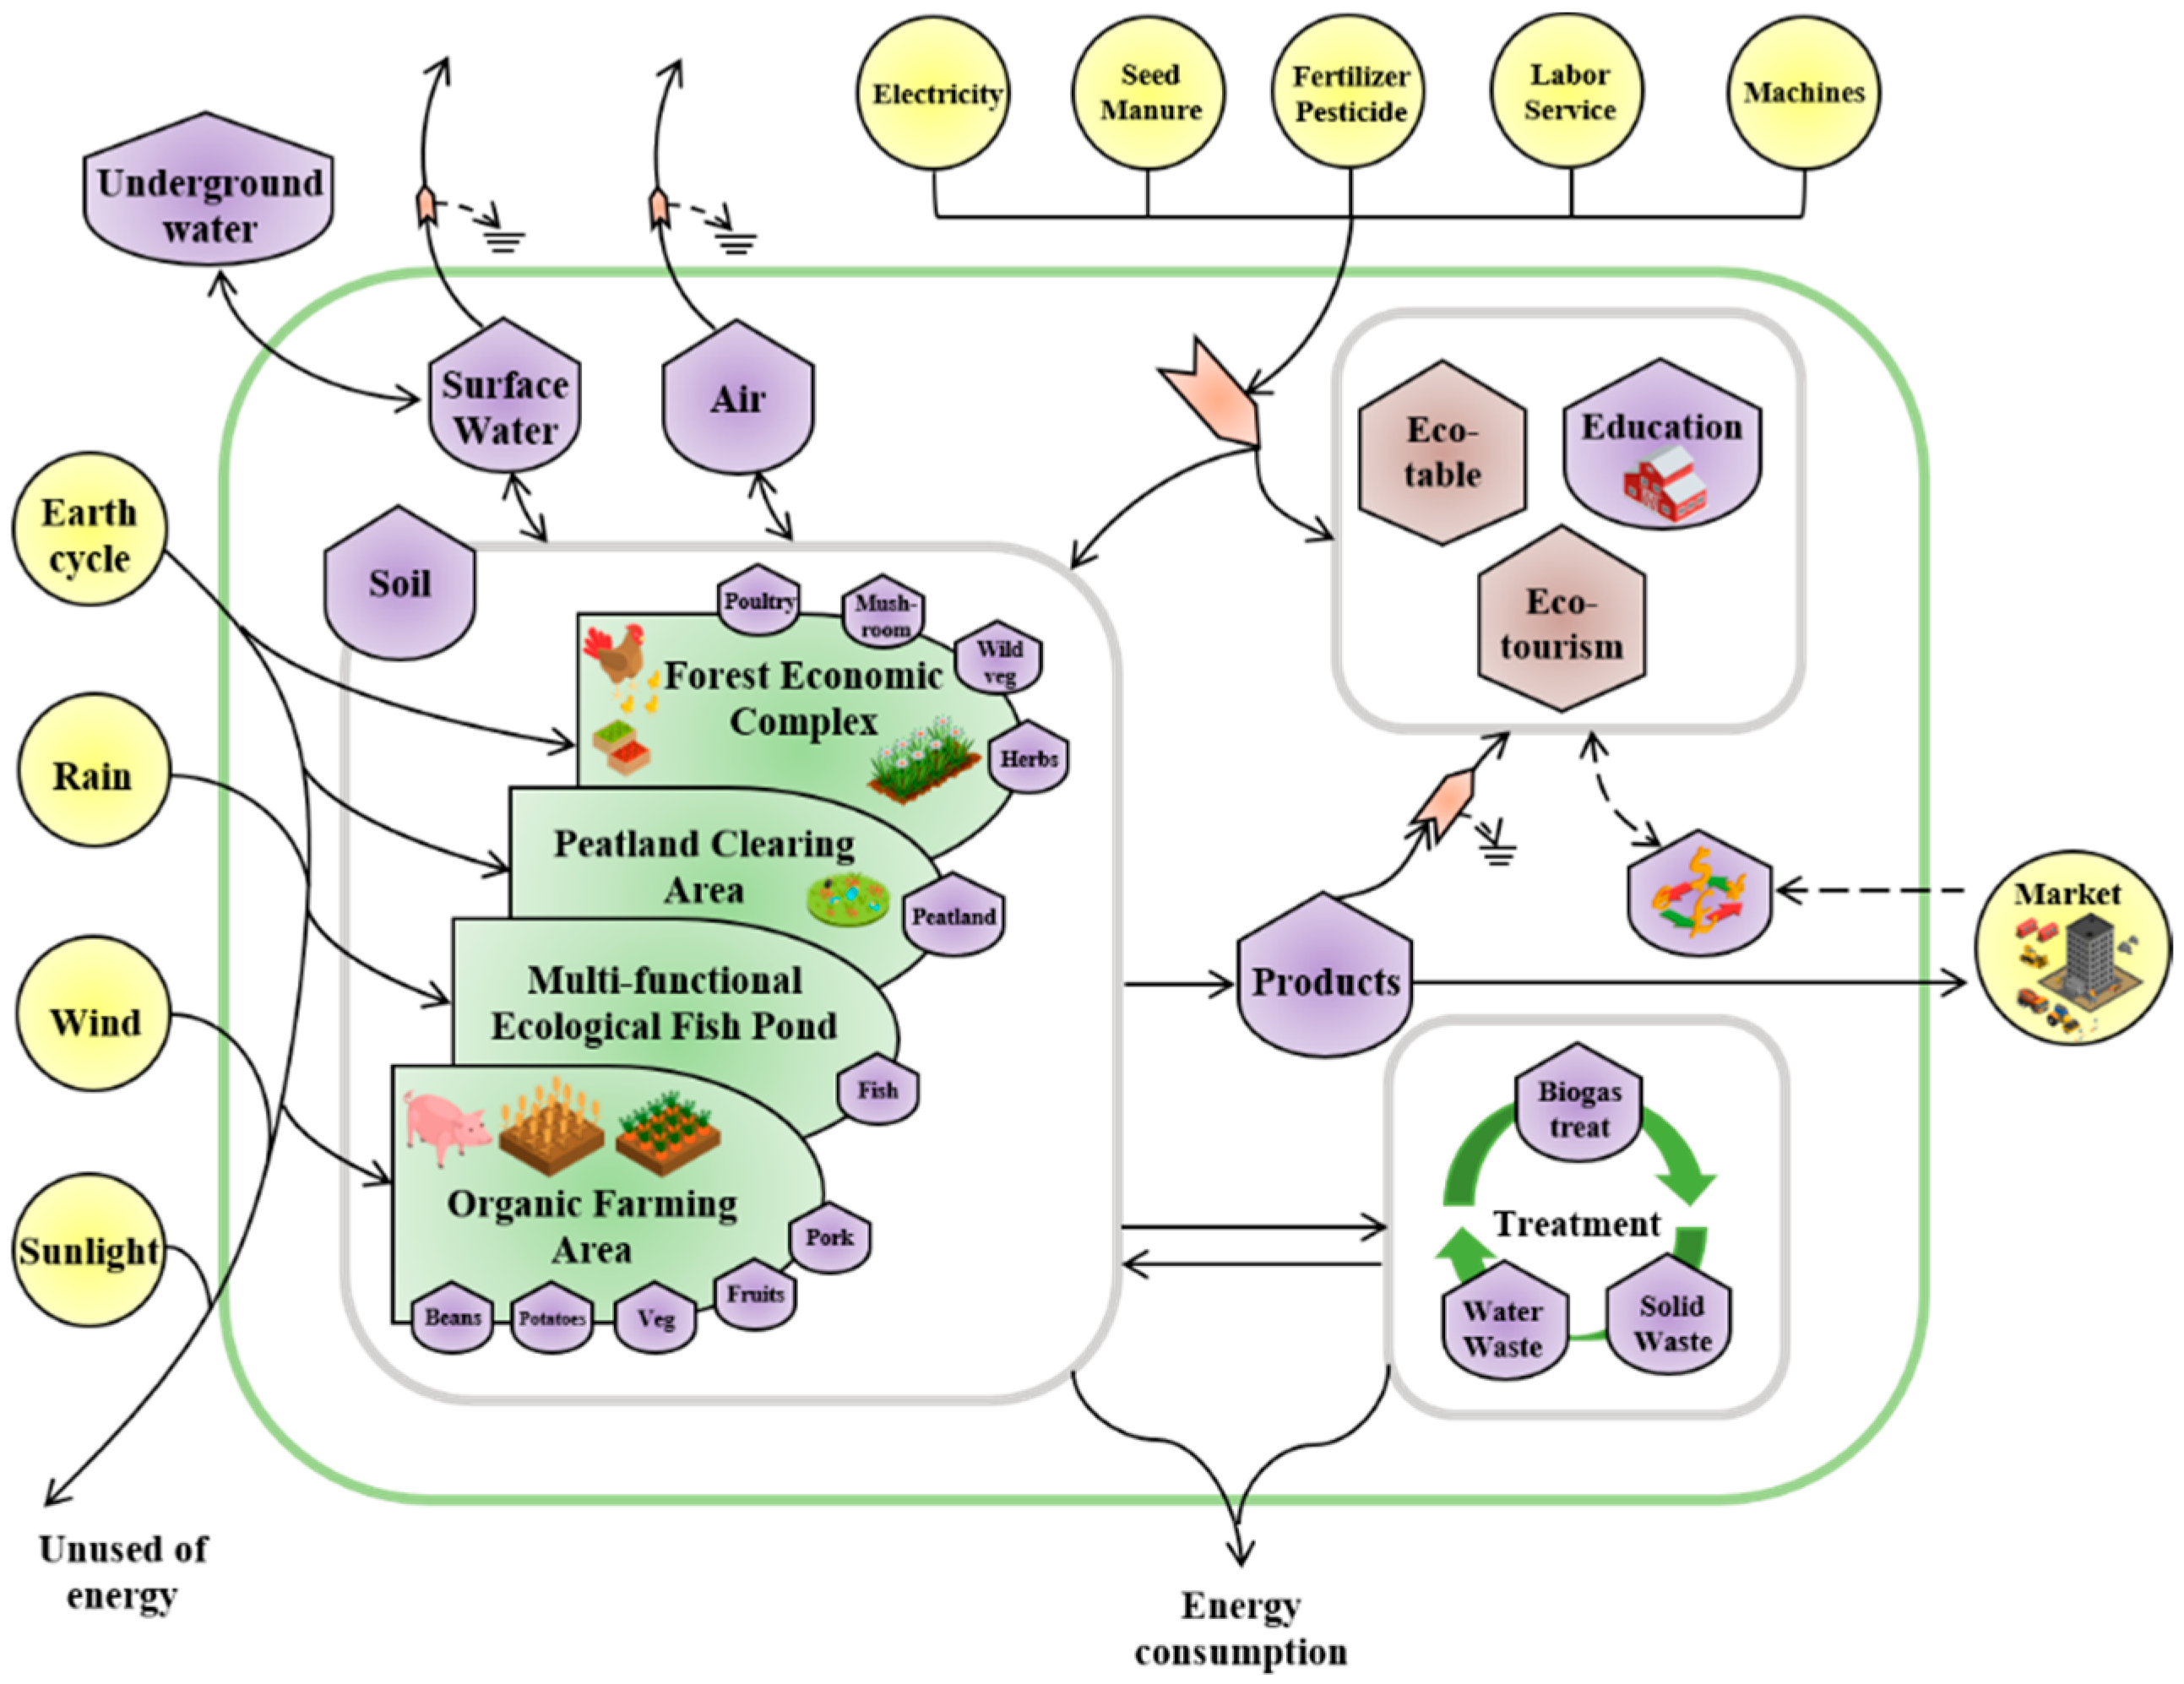
2.3. Energy System Diagram
2.4. Comprehensive Index of Emergy
2.4.1. Emergy Source Indicators
2.4.2. Social Subsystem Evaluation Indicators
2.4.3. Economic Subsystem Evaluation Indicators
2.4.4. Natural Subsystem Evaluation Indicators
2.4.5. Environment Sustainability Indicators
2.4.6. Unique Indicators of the Eco-Agricultural System
2.5. Data Collection
3. Results
3.1. Emergy Characteristics
3.2. Emergy Evaluation Indexes
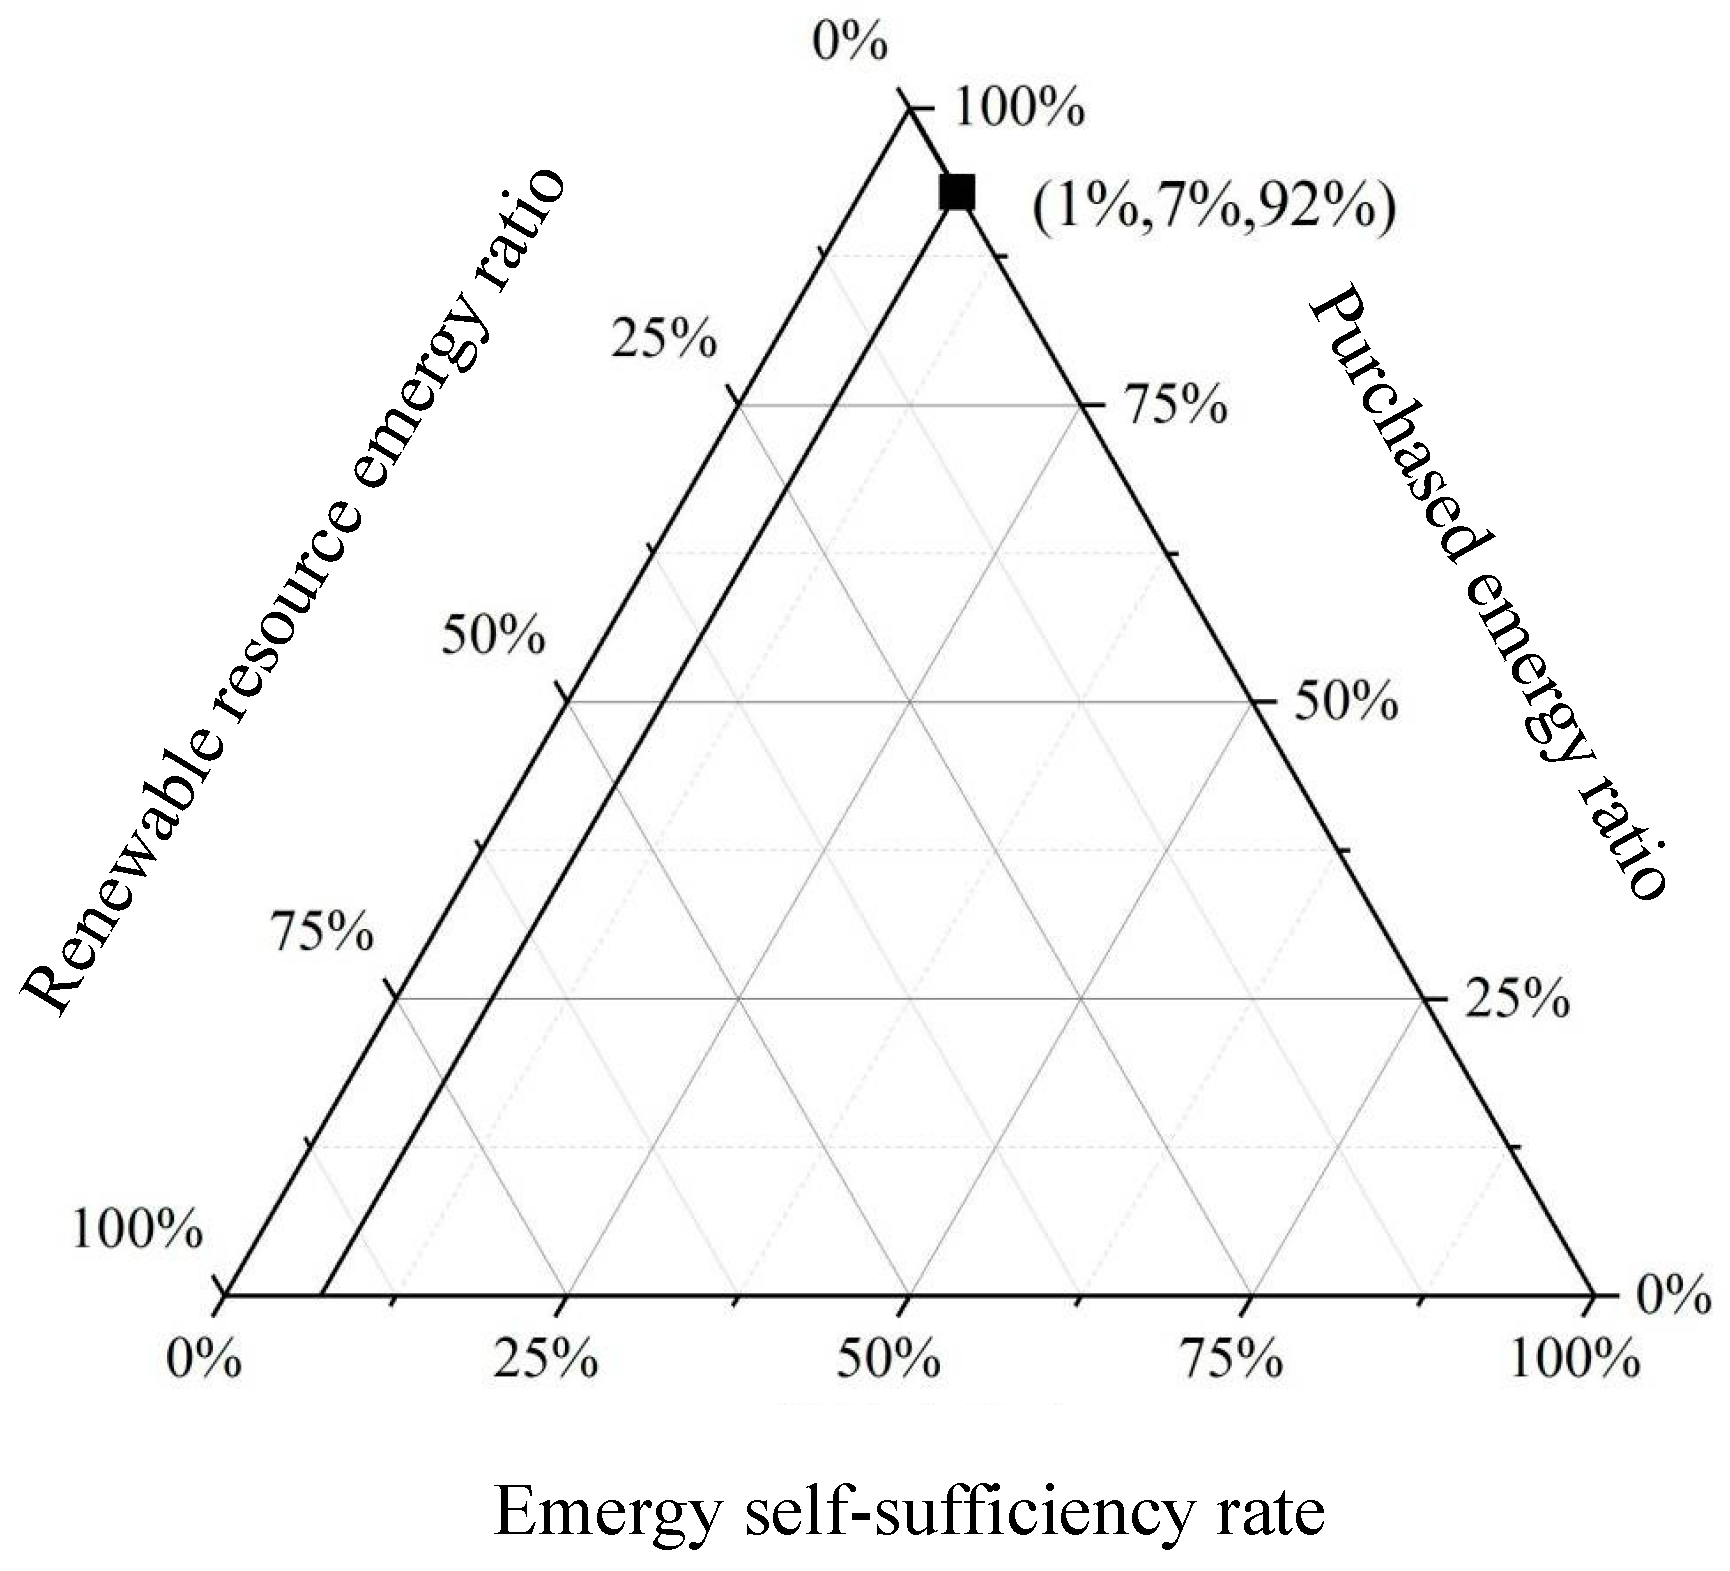
3.2.1. Emergy Source Structure Index
3.2.2. Emergy Analysis of Social Subsystems
3.2.3. Economic Subsystem Emergy Indicators
3.2.4. Natural Subsystem Emergy Indicators
3.2.5. Unique Indicators of the Eco-Agricultural System
4. Discussion
4.1. Analysis of Influencing Factors
4.2. The Limitation of This Study
5. Conclusions
Author Contributions
Funding
Institutional Review Board Statement
Informed Consent Statement
Data Availability Statement
Conflicts of Interest
Appendix A

| Note | Item | Data Processing | Units |
|---|---|---|---|
| Input | |||
| RENEWABLE RESOURCES | |||
| 1 | Solar Energy | ||
| Emergy = | (Land Area) × (Avg. Insolation) × (1-Albedo) × UEV | ||
| = | (1.0E+05) × (3.42E+06) × (1–10%) × 1 | ||
| = | 3.08E+11 | seJ/a | |
| 2 | Rain (chemical energy) | ||
| Emergy = | (Land Area) × (Rain Land) × (Gibbs no.)× UEV | ||
| = | (1.0E+05) × (0.704) × (1.0E+06) × (4.94) × (7.01E+03) | ||
| = | 2.44E+15 | seJ/a | |
| 3 | Wind Energy | ||
| Emergy = | (Ave.Altitude) × (Density of Air) × (Drag Coeff.) × (Grace gradient) × (Land Area) × UEV | ||
| = | (500 m) × (1.23 kg/m³) × (1.38 m2/s) × (3.154E+07 s/a) × (1.0E+05 m2) × (7.90E+02) | ||
| = | 2.11E+18 | seJ/a | |
| 4 | Earth Cycle | ||
| Emergy = | (Land Area) × (Heat Flow) × UEV | ||
| = | (1.0E+05) × (1E+06 J/(m2a)) × (5.80E+04) | ||
| = | 5.80E+14 | seJ/a | |
| Total | 2.12E+18 | ||
| NON-RENEWABLE RESOURCES | |||
| 1 | Topsoil Loss | ||
| Emergy = | (Land Area) × (Organic matter content) × (Gibbs free energy of Topsoil) × UEV | ||
| = | (1.0E+05 m2) × (52.78 ± 2.62 g/kg) × (45 × 667 × 1400) × (2.26044 J/g) × (6.25E+04) | ||
| = | 3.13E+19 | seJ/a | |
| 2 | Water for Agriculture | ||
| Emergy = | (Water consumption) × (Emergy conversion factor) × UEV | ||
| = | (20 × 1000 × 54) × (8.58 J/kg) × (5.01E+04) | ||
| = | 4.64E+12 | seJ/a | |
| 3 | Electricity Loss | ||
| Emergy = | (Electricity consumption per unit time) × (Emergy conversion factor) × UEV | ||
| = | (1.0E+04) × (3.60E+06 J/kWh) × (7.96E+11) | ||
| = | 2.87E+22 | seJ/a | |
| Total | 2.87E+23 | ||
| RENEWABLE ORGANIC ENERGY INPUTS | |||
| 1 | Human Labor | ||
| Emergy = | (Labor quantity) × (Emergy conversion factor) × UEV | ||
| = | (40) × (1.64E+09 J/person) × (5.72E+13) | ||
| = | 3.75E+24 | seJ/a | |
| 2 | Seed | ||
| Emergy = | (Seed purchase amount) × (Emergy conversion factor) × UEV | ||
| = | (6.85139+05E) × (0.7 $/¥) × (2.4E+12) | ||
| = | 1.15E+18 | seJ/a | |
| 3 | Nitrogen Fertilizer | ||
| Emergy = | (Nitrogen fertilizer usage) × UEV | ||
| = | (4.65E+05) × (4.826E+09) | ||
| = | 2.24E+15 | seJ/a | |
| 4 | Phosphate Fertilizer | ||
| Emergy = | (Phosphate fertilizer usage) × UEV | ||
| = | (2.34E+05) × (4.953E+09) | ||
| = | 1.16E+15 | seJ/a | |
| 5 | Potash fertilizer | ||
| Emergy = | (Potash fertilizer usage) × UEV | ||
| = | (1.8E+06) × (1.397E+09) | ||
| = | 2.51E+15 | seJ/a | |
| 6 | Investment in the construction of Eco-agricultural park | ||
| Emergy = | (Fixed assets investment amount) × (Emergy conversion factor) × UEV | ||
| = | (3.18+06E) × (0.7 $/¥) × (2.4E+12) | ||
| = | 5.34E+18 | seJ/a | |
| Total | 3.75E+24 | ||
| Output | |||
| Forest products | |||
| 1 | Herbal medicine | ||
| Emergy = | (Yield)× (Emergy conversion factor) × UEV | ||
| = | (5.04E+04) × (2.09E+07 J/kg) × (1.11E+12) | ||
| = | 1.17E+24 | seJ/a | |
| 2 | Wild vegetables | ||
| Emergy = | (Yield) × (Emergy conversion factor) × UEV | ||
| = | (2.53E+04) × (2.09E+07 J/kg) × (5.43E+11) | ||
| = | 2.87E+23 | seJ/a | |
| 3 | Fungus | ||
| Emergy = | (Yield) × (Emergy conversion factor) × UEV | ||
| = | (2.55E+05) × (2.09E+07 J/kg) × (5.38E+10) | ||
| = | 2.86E+23 | seJ/a | |
| 4 | Poultry | ||
| Emergy = | (Yield) × (Emergy conversion factor) × UEV | ||
| = | (9.00E+04) × (2.09E+07 J/kg) × (1.53E+11) | ||
| = | 2.88E+23 | seJ/a | |
| Total | 2.90E+24 | ||
| Fishery products | |||
| 1 | Fishes | ||
| Emergy = | (Yield) × (Emergy conversion factor) × UEV | ||
| = | (2.0E+04) × (2.09E+07 J/kg) × (6.8E+11) | ||
| = | 2.84E+23 | seJ/a | |
| Plantation products | |||
| 1 | Legume | ||
| Emergy = | (Yield) × (Emergy conversion factor) × UEV | ||
| = | (1.0E+04) × (2.09E+07 J/kg) × (1.37E+12) | ||
| = | 2.86E+23 | seJ/a | |
| 2 | Potato | ||
| Emergy = | (Yield) × (Emergy conversion factor) × UEV | ||
| = | (3.75E+06) × (1.30E+10 J/kg) × (5.88E+09) | ||
| = | 2.87E+23 | seJ/a | |
| 3 | Vegetable | ||
| Emergy = | (Yield) × (Emergy conversion factor) × UEV | ||
| = | (8.85E+04) × (2.50E+06 J/kg) × (1.30E+12) | ||
| = | 2.87E+23 | seJ/a | |
| 4 | Fruit | ||
| Emergy = | (Yield) × (Emergy conversion factor) × UEV | ||
| = | (1.7E+05) × (3.30E+06 J/kg) × (1.85E+12) | ||
| = | 1.04E+24 | seJ/a | |
| 5 | Pork | ||
| Emergy = | (Yield) × (Emergy conversion factor) × UEV | ||
| = | (5t) × (4.598E+09 J/t) × (1.25E+13) | ||
| = | 2.88E+23 | seJ/a | |
| Total | 2.19E+24 | ||
Appendix B
| Name | Value | Unit |
|---|---|---|
| Water for agriculture | 8.58 | J/kg |
| Electricity | 3.60+06E | J/kwh |
| Labor | 1.64+09E | J/Person |
| Seed | 1.60+10E | J/t |
| Beans | 2.09+07E | J/kg |
| Potato | 4.00+06E | J/kg |
| Vegetable | 2.50+06E | J/kg |
| Fruit | 3.30+06E | J/kg |
| Aquatic products | 5.50+06E | J/kg |
Appendix C
| Project | Annual Average Data |
|---|---|
| The amount of solar radiation | 3.42E+06 J/m2/a |
| Wind velocity | 1.38 m2/s |
| Rainfall | 0.704 m |
| Loss of soil organic matter | 52.78 ± 2.62 g/kg |
References
- Boix, M.; Montastruc, L.; Azzaro-Pantel, C.; Domenech, S. Optimization methods applied to the design of eco-industrial parks: A literature review. J. Clean. Prod. 2015, 87, 303–317. [Google Scholar] [CrossRef]
- Meyer, K.M.; Hopple, A.M.; Klein, A.M.; Morris, A.H.; Bridgham, S.D.; Bohannan, B.J.M. Community structure—Ecosystem function relationships in the Congo Basin methane cycle depend on the physiological scale of function. Mol. Ecol. 2020, 29, 1806–1819. [Google Scholar] [CrossRef] [PubMed]
- Castellini, C.; Bastianoni, S.; Granai, C.; Dal Bosco, A.; Brunetti, M. Sustainability of poultry production using the emergy approach: Comparison of conventional and organic rearing systems. Agric. Ecosyst. Environ. 2006, 114, 343–350. [Google Scholar] [CrossRef]
- Wang, X.; Chen, Y.; Sui, P.; Gao, W.; Qin, F.; Zhang, J.; Wu, X. Emergy analysis of grain production systems on large-scale farms in the North China Plain based on LCA. Agric. Syst. 2014, 128, 66–78. [Google Scholar] [CrossRef]
- Wang, X.; Shen, J.; Zhang, W. Emergy evaluation of agricultural sustainability of Northwest China before and after the grain-for-green policy. Energy Policy 2014, 67, 508–516. [Google Scholar] [CrossRef]
- Li, T.; Chen, W.; Liu, F.; Yao, H.; Huo, Q.; Zhang, W.; Yin, P.; Feng, D.; Yuan, J.; Wang, X.; et al. Benefits through Innovative Cropping Patterns in the Hilly Regions of Southwest China: An Integrated Assessment of Emergy and Economic Returns. Agronomy 2023, 13, 2640. [Google Scholar] [CrossRef]
- Vigne, M.; Peyraud, J.L.; Lecomte, P.; Corson, M.S.; Wilfart, A. Emergy evaluation of contrasting dairy systems at multiple levels. J. Environ. Manag. 2013, 129, 44–53. [Google Scholar] [CrossRef]
- Liu, S.; Min, Q.; Jiao, W.; Liu, C.; Yin, J. Integrated Emergy and Economic Evaluation of Huzhou Mulberry-Dyke and Fish-Pond Systems. Sustainability 2018, 10, 3860. [Google Scholar] [CrossRef]
- Ghisellini, P.; Zucaro, A.; Viglia, S.; Ulgiati, S. Monitoring and evaluating the sustainability of Italian agricultural system. An emergy decomposition analysis. Ecol. Model. 2014, 271, 132–148. [Google Scholar] [CrossRef]
- Su, Y.; He, S.; Wang, K.; Shahtahmassebi, A.R.; Zhang, L.; Zhang, J.; Zhang, M.; Gan, M. Quantifying the sustainability of three types of agricultural production in China: An emergy analysis with the integration of environmental pollution. J. Clean. Prod. 2020, 252, 119650. [Google Scholar] [CrossRef]
- Cuadra, M.; Rydberg, T. Emergy evaluation on the production, processing and export of coffee in Nicaragua. Ecol. Model. 2006, 196, 421–433. [Google Scholar] [CrossRef]
- de Barros, I.; Blazy, J.M.; Rodrigues, G.S.; Tournebize, R.; Cinna, J.P. Emergy evaluation and economic performance of banana cropping systems in Guadeloupe (French West Indies). Agric. Ecosyst. Environ. 2009, 129, 437–449. [Google Scholar] [CrossRef]
- Patrizi, N.; Niccolucci, V.; Castellini, C.; Pulselli, F.; Bastianoni, S. Sustainability of agro-livestock integration: Implications and results of emergy evaluation. Sci. Total Environ. 2018, 622, 1543–1552. [Google Scholar] [CrossRef] [PubMed]
- Zheng, X.; Liu, X.; Pan, H. Co-benefits assessment of integrated livestock and cropland system based on emergy, carbon footprint and economic return. Environ. Sci. Pollut. Res. 2023, 30, 6117–6131. [Google Scholar] [CrossRef] [PubMed]
- Rodríguez-Ortega, T.; Bernués, A.; Olaizola, A.M.; Brown, M.T. Does intensification result in higher efficiency and sustainability? An emergy analysis of Mediterranean sheep-crop farming systems. J. Clean. Prod. 2017, 144, 171–179. [Google Scholar] [CrossRef]
- Lin, Y.; Ye, J.; Liu, C.; Wang, Y. Evaluation of the production efficiency and sustainability ofgrape- Ganoderma lucidum ’compoundsystem based on emergy analysis. J. China Agric. Univ. 2022, 27, 103–115. [Google Scholar] [CrossRef]
- Luo, X.; Du, L.; Chen, H.; Liu, C.; Price, G.W.; Liu, P.; Zhang, J.; Wong, B. Emergy Analysis on Two Typical Peach Cultivation Modes atVillages in Fujian. Fujian J. Agric. Sci. 2020, 35, 111–116. [Google Scholar] [CrossRef]
- Zhang, X.-H.; Zhang, R.; Wu, J.; Zhang, Y.-Z.; Lin, L.-L.; Deng, S.-H.; Li, L.; Yang, G.; Yu, X.-Y.; Qi, H.; et al. An emergy evaluation of the sustainability of Chinese crop production system during 2000–2010. Ecol. Indic. 2016, 60, 622–633. [Google Scholar] [CrossRef]
- Yao, Y.; Li, G.; Wang, J.; Liu, Q.; Lu, Y. Emergy dynamics of cropping system in Gansu Province. Pratacultural Sci. 2021, 38, 785–795. [Google Scholar] [CrossRef]
- Chu, T.; Song, Y.; Yang, Z. Evaluation of sustainable development of production system of planting and breeding industry in reclamation area of Heilongjiang. Chin. J. Agric. Resour. Reg. Plan. 2022, 43, 8–18. [Google Scholar]
- Odum, H.T. Self-organization, transformity, and information. Science 1988, 242, 1132–1139. [Google Scholar] [CrossRef] [PubMed]
- Brown, M.T.; Herendeen, R.A. Embodied energy analysis and EMERGY analysis: A comparative view. Ecol. Econ. 1996, 19, 219–235. [Google Scholar] [CrossRef]
- Campbell, D.E. Emergy baseline for the Earth: A historical review of the science and a new calculation. Ecol. Model. 2016, 339, 96–125. [Google Scholar] [CrossRef]
- Lan, S.; Qin, P.; Lu, H. Emergy Analysis of the Economic System; Chemical Industry Press: Beijing, China, 2002. [Google Scholar]
- Wang, K. Planning and Design of Ecological Agricultural Park in Eastern Mountainous Areas of Jilin Province. Master’s Thesis, Northeast Normal University, Changchun, China, 2019. [Google Scholar]
- Zhang, X.; Cai, Z. Research on environmental management in universities based on emergy analysis method. Manag. Mod. 2021, 41, 85–88. [Google Scholar] [CrossRef]
- Brown, M.T.; Campbell, D.E.; De Vilbiss, C.; Ulgiati, S. The geobiosphere emergy baseline: A synthesis. Ecol. Model. 2016, 339, 92–95. [Google Scholar] [CrossRef]
- Zhang, Y. Dynamic evaluation of agro-ecological economic system in Guangxi. J. South. Agric. Sci. 2021, 52, 3185–3194. [Google Scholar] [CrossRef]
- Shi, F.; Yang, Q.; Wang, C.; Jiang, J.; Hu, R. A Study on the Scale of Cultivated Land Fallow Based on Cultivated Land Emergy-Ecological Footprint: A Case Study of Songtao County, Guizhou Province. Acta Ecol. Sin. 2021, 41, 5747–5763. [Google Scholar] [CrossRef]
- Shi, F. Study on the Spatial Allocation of Cultivated Land Fallow in Severely Degraded Areas. Ph.D. Thesis, Southwest University, Chongqing, China, 2020. Available online: https://link.cnki.net/doi/10.27684/d.cnki.gxndx.2020.005288 (accessed on 22 March 2024).
- Bai, X. Study on Sustainable Development of Agro-Ecosystem in the Loess Hilly Area of Ningnan Based on Emergy. Ph.D. Thesis, University of Chinese Academy of Sciences, Beijing, China, 2015. [Google Scholar]
- Xie, H.; Huang, Y.; Choi, Y.; Shi, J. Evaluating the sustainable intensification of cultivated land use based on emergy analysis. Technol. Forecast. Soc. Chang. 2021, 165, 120449. [Google Scholar] [CrossRef]
- Wang, X.; Tan, W.; Zhou, S.; Xu, Y.; Cui, T.; Gao, H.; Chen, M.; Dong, X.; Sun, H.; Yang, J.; et al. Converting maize production with low emergy cost and high economic return for sustainable development. Renew. Sustain. Energy Rev. 2021, 136, 110443. [Google Scholar] [CrossRef]
- Yang, X.; Sui, P.; Shen, Y.; Gerber, J.S.; Wang, D.; Wang, X.; Dai, H.; Chen, Y. Sustainability Evaluation of the Maize–Soybean Intercropping System and Maize Monocropping System in the North China Plain Based on Field Experiments. Agronomy 2018, 8, 268. [Google Scholar] [CrossRef]
- Lyu, Y.; Raugei, M.; Zhang, X.; Mellino, S.; Ulgiati, S. Environmental cost and impacts of chemicals used in agriculture: An integration of emergy and Life Cycle Assessment. Renew. Sustain. Energy Rev. 2021, 151, 111604. [Google Scholar] [CrossRef]
- Liu, H.; Dong, X. Research on the energy value structure, efficiency and driving factors of agricultural input and output in the Yangtze River Economic Belt. China Agron. Bull. 2022, 38, 130–138. Available online: https://kns.cnki.net/kcms/detail/11.1984.S.20220412.1523.004.html (accessed on 22 March 2024).
| Emergy Value Indicator | Formula | Explanation |
|---|---|---|
| Social–Economic–Natural Composite Ecosystem Valuation Index | ||
| Renewable source Emergy flow (EmR) | Existing wealth foundation of the system | |
| Nonrenewable resource Emergy flow (EmN) | ||
| Input Emergy (Em1) | ||
| Total Emergy (EmU) | EmU = EmR + EmN + Em1 | Total wealth of input resources and commodity assets. |
| Output Emergy (EmO) | Output of resources and material wealth | |
| Emergy source indicators | ||
| Emergy Self-sufficiency rate | (EmR + EmN)/EmU | Assessment of natural environment carrying capacity |
| Purchase emergy ratio | Em1/EmU | Degree of dependence on external resources |
| Renewable resource emergy ratio | EmR/EmU | Evaluation of potential of natural environment |
| Input emergy and own emergy ratio | Em1/EmR + EmN | Assessment of industrial competitiveness |
| Social subsystem evaluation indicators | ||
| Emergy per capita | EmU/P | Standards of living and quality of life. |
| Emergy density | EmU/(Land area) | Rating the intensity and efficiency of resource utilization. |
| Population carrying capacity | (EmR + Em1)/(EmU/P) | The current carrying capacity of the environment in terms of population. |
| Economic subsystem evaluation indicators | ||
| Emergy/currency ratio | EmU/(GNP) | The level of economic modernization. |
| Emergy exchange rate | Em1/EmO | Evaluating the gains and losses of international exchanges. |
| The emergy of money | Emergy/(Emergy/Currency Ratio) | The equivalent amount of currency in terms of value. |
| Natural subsystem evaluation indicators | ||
| Emergy investment rate | (EmR + EmN)/ EmR | The capacity of the natural environment to accommodate economic activities. |
| Updatable emergy ratio | EmR/EmU | The potential for utilization of the natural environment. |
| Population affordability | EmR/(EmU/P) | The population carrying capacity of the natural environment. |
| Environment Sustainability Indicators | EISD = EYR × EER/ELR | The calculation results of EISD can reflect the benefits of the emergy output of the system and the satisfaction of the system’s needs for economic development. The higher the calculation results, the stronger the system promotes economic development.If EISD is less than 2, the system has no development potential. If the EISD is between 2 and 18, the system is considered to be full of vitality and development potential. If the EISD is greater than 18, the system is considered to have high social and economic benefits. |
| ESI = EYR/ELR | ESI < 1, the system is a resource-consuming system and is unsustainable; 1 < ESI < 10, the system is highly resilient and has room for development; ESI > 10, the system is economically underdeveloped, has strong sustainability and has room for development. | |
| Unique Indicators of Eco-agricultural systems | ||
| Environmental carrying capacity | ELC = (EmN + EmF + EmT)/EmR | In a certain period, under a certain environmental condition, the limit of the capacity of a regional environment to support human and economic activities. |
| Emergy–labor productivity | EmO/H | The emergy output obtained from investing 1 h of labor. |
| System production advantage | C = ∑(Emyi/Emy)^2 | i = 1, 2, 3, 4; Emyi represents the energy output of the ith subsystem, and Emy represents the total energy output of the system. The system advantage degree of the agricultural ecological economic system reflects the overall balance of production units in the structure. The system advantage degree indicator can be used for comparison of different agricultural ecological economic systems. The closer the system advantage degree is to 0, the smaller the differences in advantage degree of each production unit; the closer the system advantage degree is to 1, the more a certain industrial structure in the system is in absolute advantage, and the distribution among units is more uneven. |
| Stability Index of the System | S = ∑[(Emyi/Emy)ln(Emyi/Emy)] | Among them, i = 1, 2, 3, 4; Emyi represents the energy output of the i-th subsystem, and Emy represents the total energy output of the system. The stability index of the system represents the magnitude of the production stability of the system. If the stability index of the system is high, it indicates that the material flow and energy flow network of the agricultural system are developed, and the system’s self-control, regulation, and feedback effects are strong, resulting in greater self-stability. |
| No | Item | Emergy | Unit | UEVs | Ref. | Em$/$ |
|---|---|---|---|---|---|---|
| Input | ||||||
| Renewable resources | ||||||
| 1 | Sunlight | 3.08E+11 | seJ/a | 1 | Brown and Ulgiati (2016) [27] | |
| 2 | Rain (chemical energy) | 2.44E+15 | seJ/a | 7.010E+03 | ||
| 3 | Wind | 2.11E+18 | seJ/a | 7.900E+02 | ||
| 4 | Earthcycle | 5.80E+14 | seJ/a | 5.800E+04 | ||
| Total | 2.12E+18 | seJ/a | 2.23E+05 | |||
| Nonrenewable resources | ||||||
| 1 | Soil Erosion | 3.13E+19 | seJ/a | 6.250E+04 | Brown and Ulgiati (2016) [27] | |
| 2 | Irrigating water | 4.64E+12 | seJ/a | 5.010E+04 | ||
| 3 | Electricity | 2.87E+23 | seJ/a | 7.960E+11 | ||
| Total | 2.87E+23 | seJ/a | 3.02E+10 | |||
| Updatable organic resources | ||||||
| 1 | Human labor | 3.75E+24 | seJ/a | 5.720E+13 | Brown and Ulgiati (2016) [27] | |
| 2 | Seed | 1.15E+18 | seJ/a | 2.400E+12 | ||
| 3 | Nitrogen fertilizer | 2.24E+15 | seJ/a | 4.826E+09 | ||
| 4 | Phosphate fertilizer | 1.16E+15 | seJ/a | 4.953E+09 | ||
| 5 | Potash fertilizer | 2.51E+15 | seJ/a | 1.397E+09 | ||
| 6 | Investment in the Construction of ecological agricultural parks | 5.34E+18 | seJ/a | 2.400E+12 | Lan et al. (2002) [24] | |
| Total | 3.75E+24 | seJ/a | 3.95E+11 | |||
| Total Input | 4.04E+24 | seJ/a | 4.25E+11 | |||
| Output | ||||||
| Forest products | ||||||
| 1 | Herbal medicine | 1.17E+24 | seJ/a | 1.110E+12 | Lan et al. (2002) [24] | |
| 2 | Wild vegetables | 2.88E+23 | seJ/a | 5.430E+11 | ||
| 3 | Fungus | 2.87E+23 | seJ/a | 5.380E+10 | ||
| 4 | Poultry | 2.88E+23 | seJ/a | 1.530E+11 | ||
| Total | 2.03E+24 | seJ/a | 2.13E+11 | |||
| Fishery products | ||||||
| Fishes | 2.84E+23 | seJ/a | 6.800E+11 | Lan et al. (2002) [24] | 2.99E+10 | |
| Plantation products | ||||||
| 1 | Legume | 2.87E+23 | seJ/a | 1.370E+12 | Lan et al. (2002) [24] | |
| 2 | Potato | 2.87E+23 | seJ/a | 5.880E+09 | ||
| 3 | Vegetable | 2.87E+23 | seJ/a | 1.300E+12 | ||
| 4 | Fruit | 1.04E+24 | seJ/a | 1.850E+12 | ||
| 5 | Pork | 2.88E+23 | seJ/a | 1.250E+13 | ||
| Total | 2.19E+24 | seJ/a | 2.30E+11 | |||
| Total Output | 4.50E+24 | seJ/a | 4.73E+11 | |||
Disclaimer/Publisher’s Note: The statements, opinions and data contained in all publications are solely those of the individual author(s) and contributor(s) and not of MDPI and/or the editor(s). MDPI and/or the editor(s) disclaim responsibility for any injury to people or property resulting from any ideas, methods, instructions or products referred to in the content. |
© 2024 by the authors. Licensee MDPI, Basel, Switzerland. This article is an open access article distributed under the terms and conditions of the Creative Commons Attribution (CC BY) license (https://creativecommons.org/licenses/by/4.0/).
Share and Cite
Li, Z.; Ma, Q.; Wang, Y.; Shi, F.; Jiang, H.; He, C. Study on the Structure, Efficiency, and Driving Factors of an Eco-Agricultural Park Based on Emergy: A Case Study of Jinchuan Eco-Agricultural Park. Sustainability 2024, 16, 3060. https://doi.org/10.3390/su16073060
Li Z, Ma Q, Wang Y, Shi F, Jiang H, He C. Study on the Structure, Efficiency, and Driving Factors of an Eco-Agricultural Park Based on Emergy: A Case Study of Jinchuan Eco-Agricultural Park. Sustainability. 2024; 16(7):3060. https://doi.org/10.3390/su16073060
Chicago/Turabian StyleLi, Ziwei, Qiuying Ma, Yong Wang, Fengxue Shi, Haibo Jiang, and Chunguang He. 2024. "Study on the Structure, Efficiency, and Driving Factors of an Eco-Agricultural Park Based on Emergy: A Case Study of Jinchuan Eco-Agricultural Park" Sustainability 16, no. 7: 3060. https://doi.org/10.3390/su16073060