Article

Assessment of Greywater Reuse in a University Building in a Hyper-Arid Region: Quantity, Quality, and Social Acceptance

by
Teresa Lanchipa-Ale
1,
Ana Cruz-Baltuano
2,3,
Nahuel Molero-Yañez
3,
Samuel Chucuya
3,
Bertha Vera-Barrios
4 and
Edwin Pino-Vargas
3,*
1
Faculty of Engineering, Tacna’s Private University, Tacna 23000, Peru
2
School of Civil Engineering, Tacna’s Private University, Tacna 23000, Peru
3
Department of Civil Engineering, Jorge Basadre Grohmann National University, Tacna 23000, Peru
4
Faculty of Mining Engineering, Moquegua National University, Moquegua 18000, Peru
*
Author to whom correspondence should be addressed.
Sustainability 2024, 16(7), 3088; https://doi.org/10.3390/su16073088
Submission received: 14 March 2024 / Revised: 1 April 2024 / Accepted: 4 April 2024 / Published: 8 April 2024

Abstract

:
Since Tacna is a hyper-arid region, greywater is a potential alternative water source. This study aimed to quantify and characterize greywater in a university building with 732 students, as well as assess their perception of greywater reuse. Water meters were used to calculate greywater quantity. To assess untreated greywater quality, physical–chemical and microbiological parameters were analyzed. Questionnaires were used to measure students’ acceptance regarding greywater reuse using a Likert scale. The greywater quantity recorded in this study was 426.85 L/d, which is less than reported in previous global research. The greywater quality showed relatively low values regarding physical–chemical parameters; however, microbial contamination was higher compared to international permissible limits for wastewater reuse. Furthermore, it was found that the generated greywater has little biodegradability (0.38). Students disclosed a lower acceptance of reusing untreated greywater compared to a 77.05% acceptance of reusing treated greywater for green areas. According to the greywater characterization, biological treatment will not be enough to ensure environmental protection and user health; thus, physical–chemical treatment will also be needed. The produced greywater quantities would generate a 12.67% water saving if used for toilet flushing. The greywater volume fulfills the whole demand for watering green areas or green roofs. Students would assent to the reuse of treated greywater.

1. Introduction

Decreasing potable water availability around the world is a rising issue and is attributed to pollution, climate change, and the growing population, among other factors [1,2,3]. In Peru, despite being one of the richest countries in terms of freshwater volume, these water resources are unevenly distributed across the three main hydrographic basins. Most of the coastal region (Pacific Basin) experiences the greatest water deficit as it is an arid region; however, it is Peru’s most populated and productive area [4]. This is one of the reasons why millions of Peruvians face water scarcity daily. Only 50 percent of the population has access to safe drinking water services, and 43 percent have access to safely managed sanitation facilities [4]. In this context, only two-thirds of public schools have acceptable sanitation facilities, and only 20 percent have access to adequate drinking water [5]. Although there is no specific research on water and sanitation in university buildings, considering the national figures, we can deduce that the situation is not better at that level.
Tacna is a Peruvian city located in the southern coastal region. It is a hyper-arid area, situated at the head of the Atacama Desert [6,7], where precipitation does not exceed 10 mm per year in some areas [8,9]. In 2022, Tacna’s Special Project conducted an update of the water balance for reserve purposes, indicating that the water supply is 13.2 m3/s, with a demand of 21.7 m3/s (for surface and groundwater sources), resulting in a water deficit of 8.45 m3/s [10]. Specifically, in the sub-basin where the building under study is located (Caplina–Uchusuma Basin), the demand with licenses for various uses (excluding the La Yarada sector) is 1.95 m3/s, which is met with a flow rate of 2.01 m3/s, resulting in an unmet demand of 0.26 m3/s for population use [10]. Due to this scenario, water is constantly rationed in the urban sector, and many neighborhoods of Tacna do not have 24/7 access to potable water [11]. Water scarcity in Tacna constrains its development possibilities, which are further threatened by social conflicts arising from the implementation of hydraulic transfer projects conceptualized and formulated as measures to mitigate the water deficit [12].
Therefore, the national framework combined with the condition of the study area itself, makes it extremely necessary to seek alternative non-traditional sources of water. Greywater is one of those alternatives, especially for reuse in activities that do not require high-quality water, such as toilet flushing, construction, car washing, garden watering, and others [1,13,14]. It is abundant and sustainable because its availability does not rely on precipitation, and its treatment requires less energy than mixed wastewater [2,15,16]. Regarding households, light greywater is the wastewater produced by bathing, handwashing, and showers, whereas dark greywater includes kitchen basins and laundry [15,17]. In general, greywater is wastewater that does not consider any blackwater discharge, such as toilet effluents [1].
Much research has been conducted on greywater generation, quality, and reuse [2,14,17,18,19,20,21,22,23,24,25,26,27,28,29,30,31,32,33,34,35,36]; however, few studies have focused on educational buildings, such as schools or universities [37,38,39,40,41,42,43,44]. In many low-income countries, the majority of these buildings do not have or have limited access to potable water [5]. Providing potable water to educational buildings ensures a better learning environment for the young population, avoiding health issues and odor nuisances.
The potential of greywater and other non-conventional water reuse was assessed in a university building in Brazil, where greywater from handwashing and drinking fountains could be reused for toilet flushing, reducing potable water usage by approximately 25.73% [39]. Additionally, the water consumption pattern and its possible conservation measures in an academic building in Pakistan were analyzed, concluding that it could save 42% of potable water in the present and 25% in the future by reusing greywater for toilet flushing [38]. Finally, at the Abu Dhabi University campus, the economic feasibility of a greywater treatment plant for reuse for horticulture and irrigation of green areas was designed and evaluated, determining that the decentralization of greywater treatment is economically viable and environmentally sustainable [3].
In some countries, greywater accounts for 40% to 91% of wastewater [16]. This range is extensive due to variations in greywater generation based on social and economic factors, including culture, habits, gender, infrastructure, and more [45]. Greywater quality differences are based on the source and previous criteria [1,16]. Thus, assessing greywater quantity and quality for each location is necessary.
Furthermore, public acceptance of wastewater reuse varies worldwide and, according to the factors mentioned above, makes it a major obstacle for executing reuse projects [46,47]. Public perception of greywater reuse has been assessed worldwide using questionnaires, group discussions, surveys, and other methods [20]. Most respondents agree on the need to protect water resources by reusing greywater; however, acceptance decreases if it involves closer physical contact with treated greywater [20,48,49]. According to [41,48], users are more encouraged to use recycled greywater if it is colorless and odorless.
After analyzing the existing problem, the proposed hypothesis is that, based on the quantity and quality of greywater generated in the university building, its reuse will be feasible and accepted.
Following what has been stated above, this study aimed to (1) determine the feasibility of greywater reuse for low-quality water requirements in a university building by quantifying the greywater generated in restroom hand basins, (2) assess greywater quality, and (3) describe the social acceptance of greywater reuse among the students through questionnaires. This is the first study that aims to measure the quantity, quality, and acceptance of greywater in a university building located in the hyper-arid region of Tacna to determine its potential reuse as an alternative water source. The results will guide future studies on the design of treatment plants, distribution systems, and economic analyses to assess viability.

2. Materials and Methods

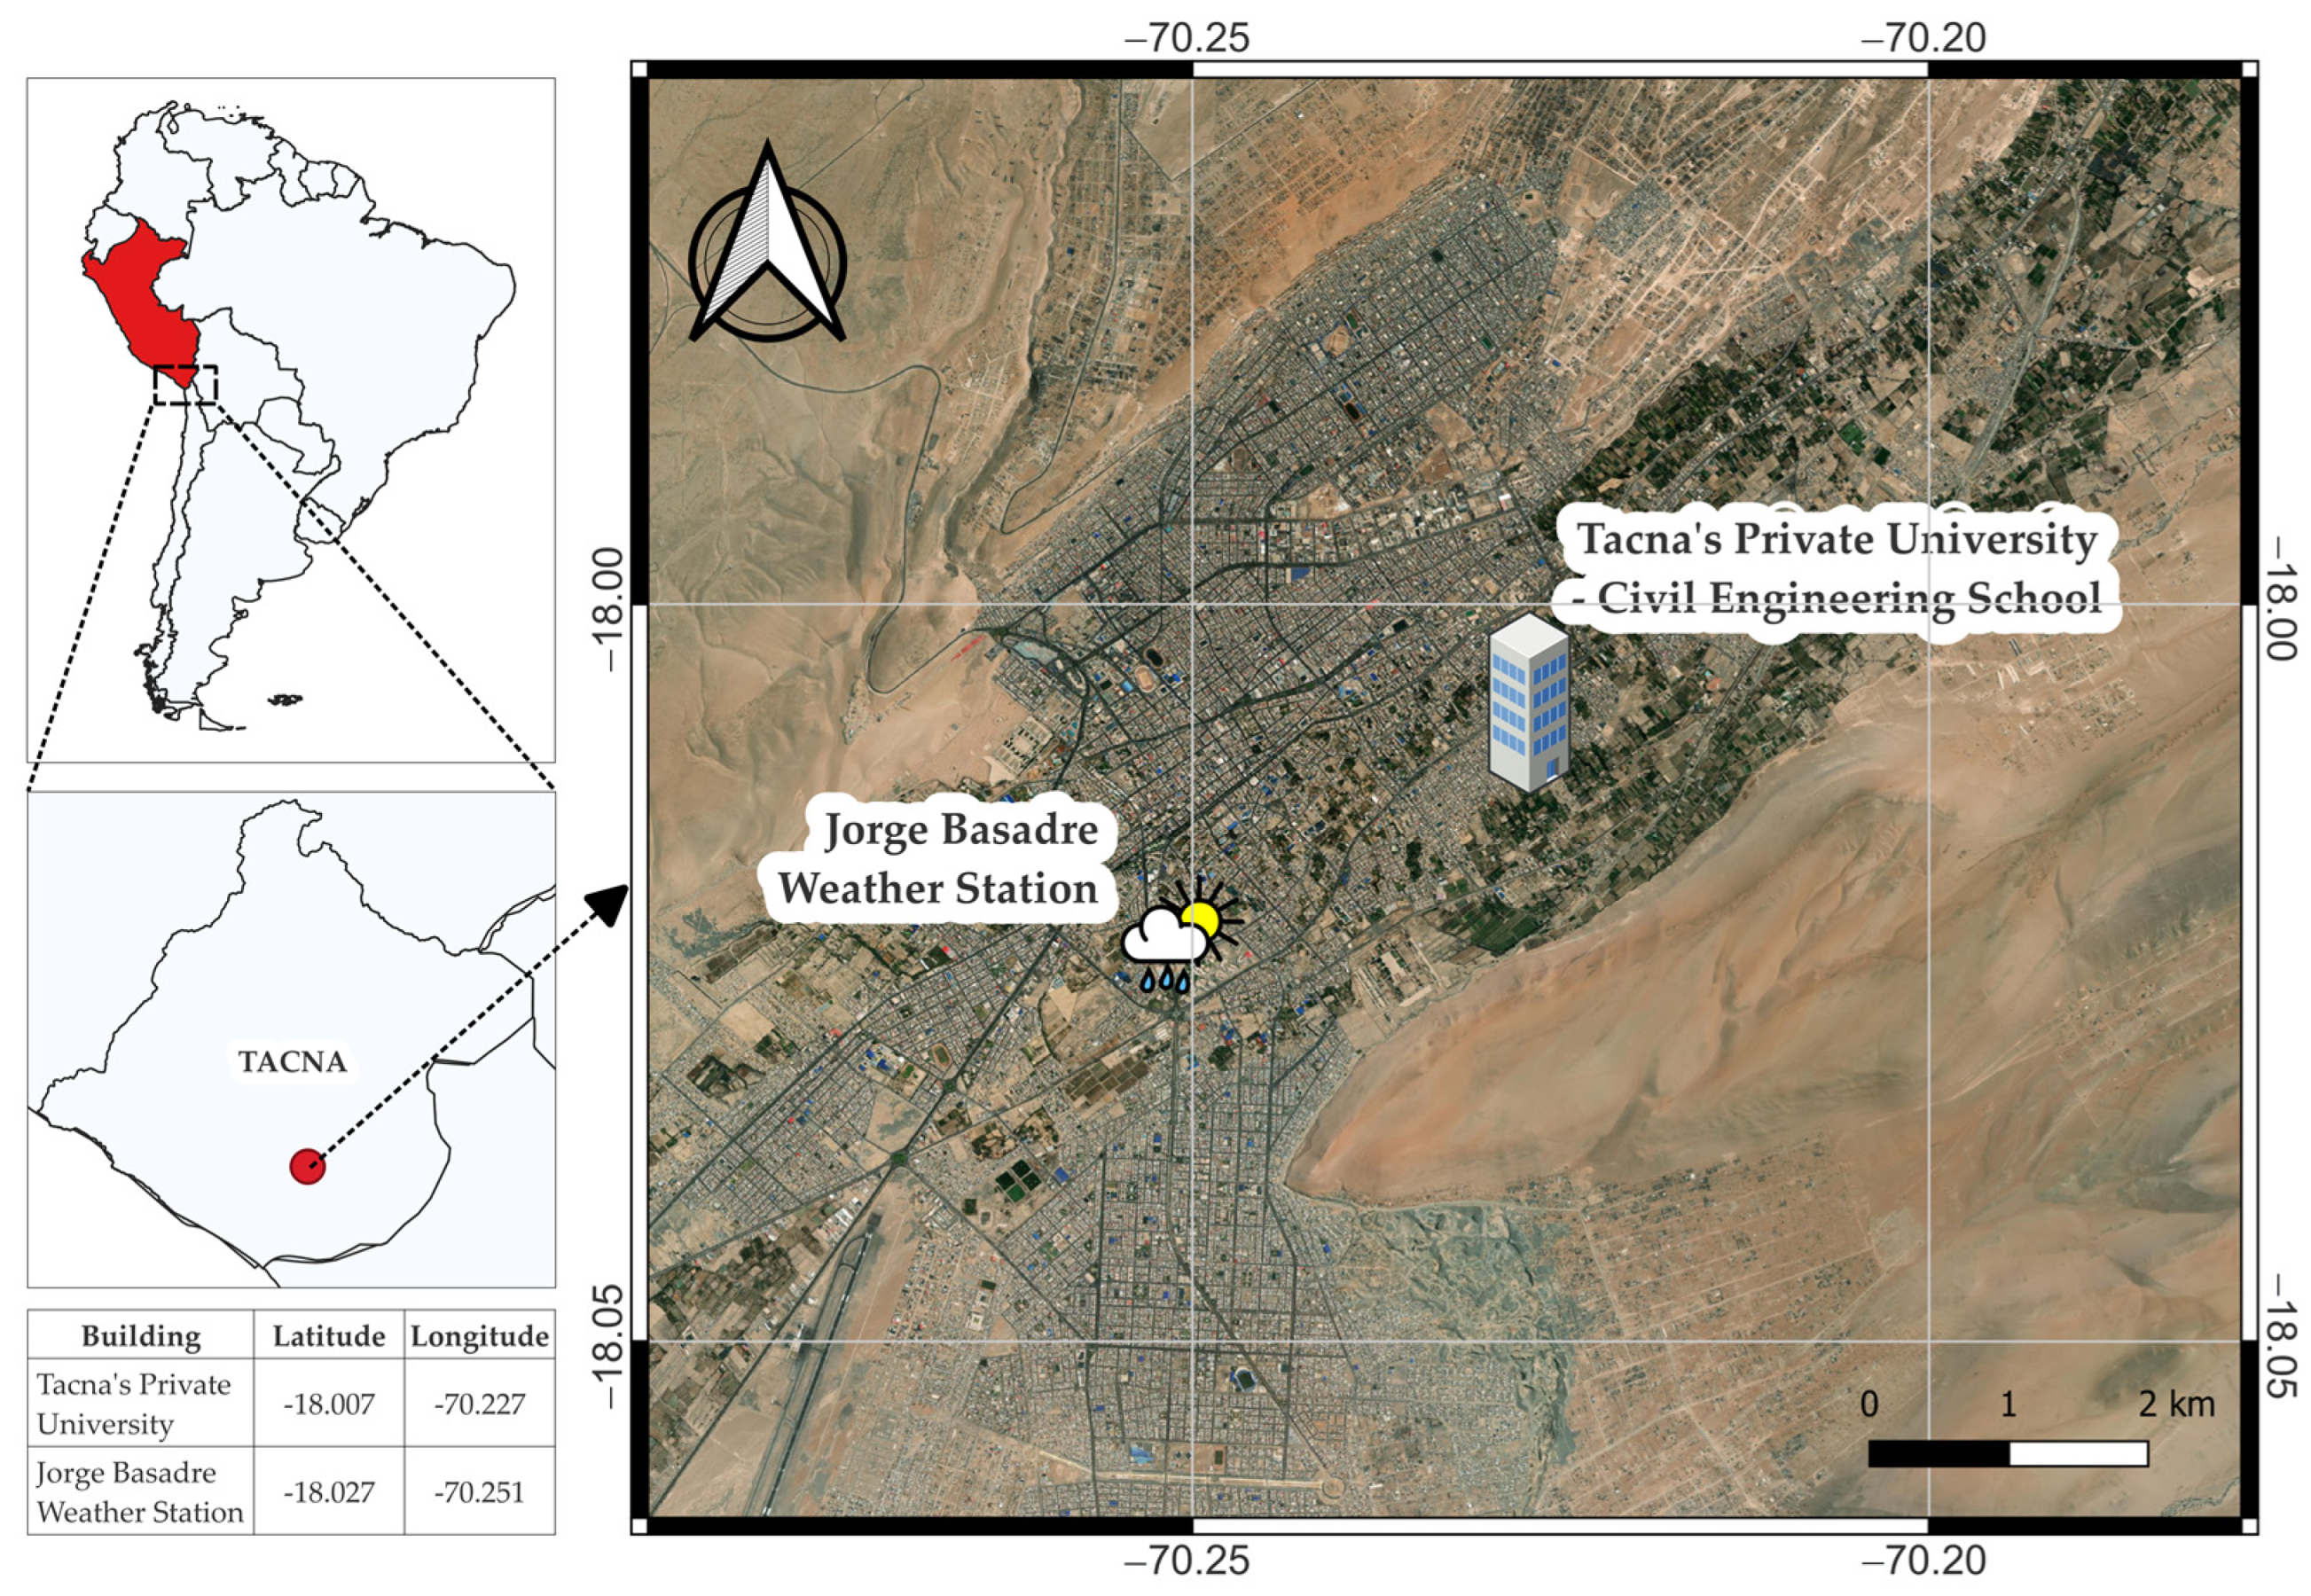
The research was conducted in the Civil Engineering School building of Tacna’s Private University (18°00′24.71″ S;70°13′38.13″ W) within the Capanique Campus, located on Jorge Basadre Grohmann Avenue in the Pocollay District, Tacna (Figure 1).
As mentioned above, the building is situated in a hyper-arid region, receiving an average annual rainfall of 20mm according to data extracted from the Jorge Basadre Weather Station, which is the closest to the case study building (Figure 2).
The case study building is a four-story building that hosts 732 students during this research. All its facilities have a combined wastewater system (blackwater and greywater) connected to the campus’s centralized sewerage network.
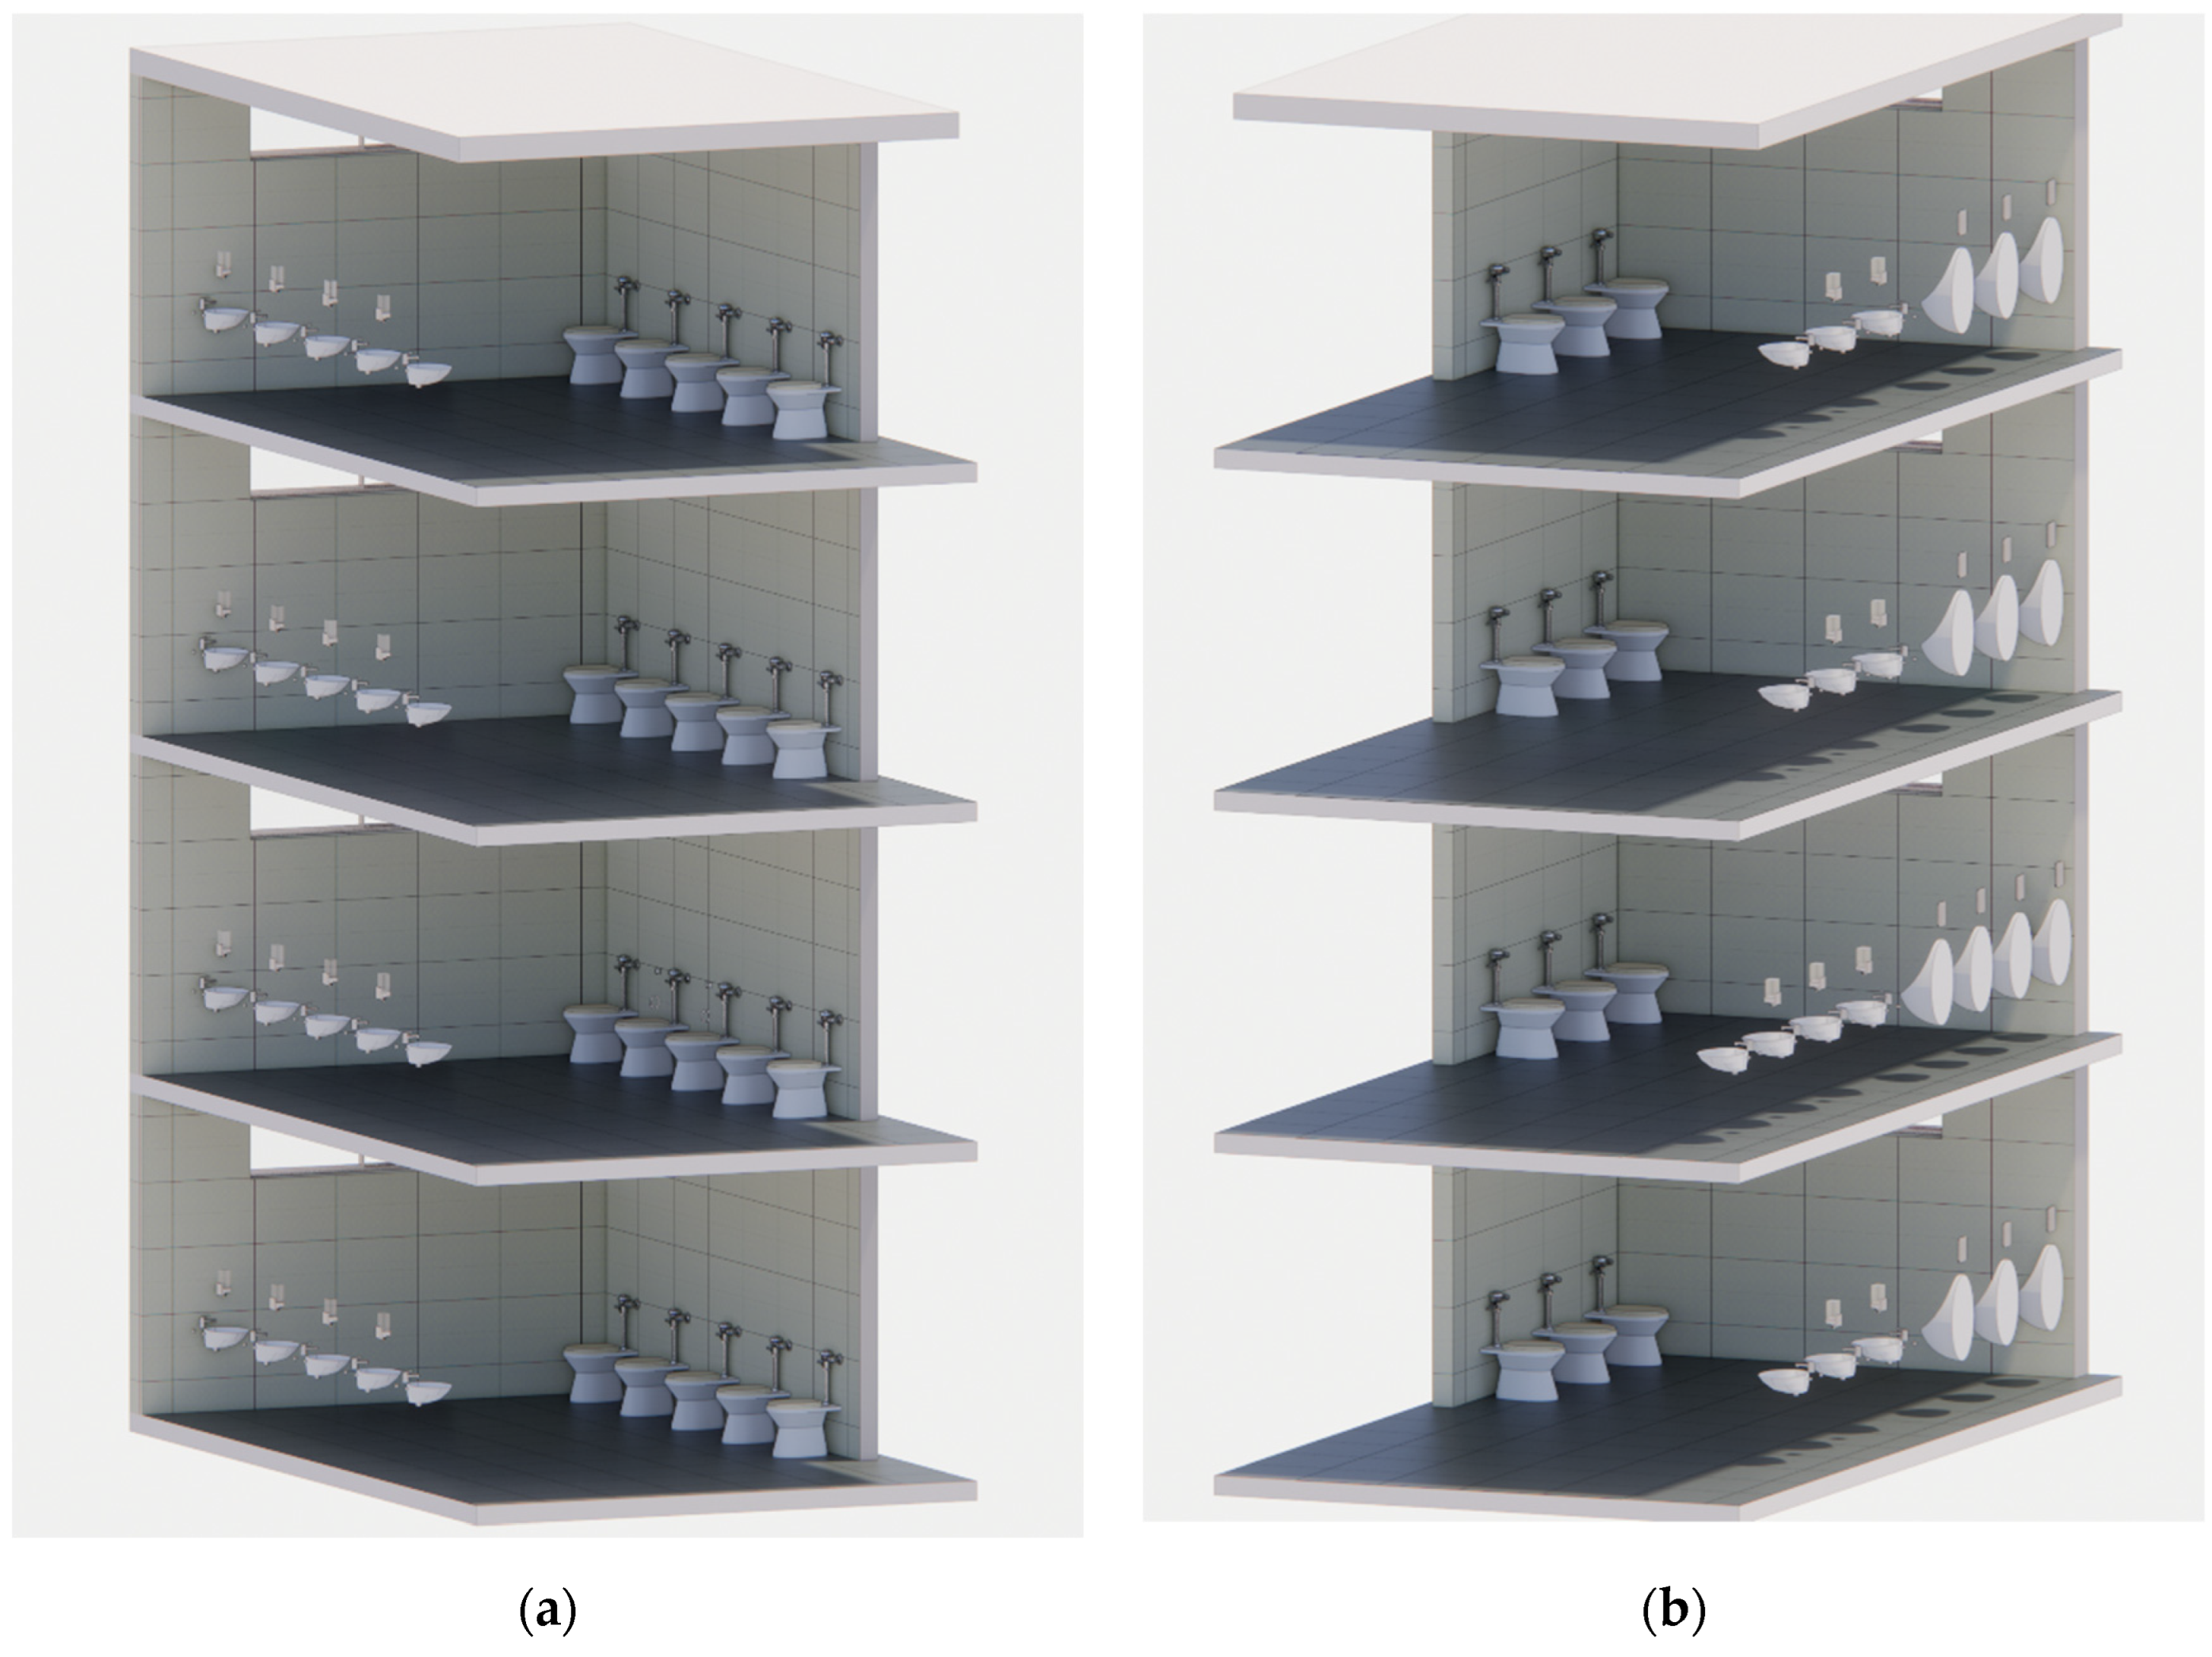
This study focused on the students’ restrooms, divided into female and male restrooms (Figure 3). Some features of the sanitary fixtures installed in the students’ restrooms are shown in Table 1. Most of them are relatively new devices and are in good condition.
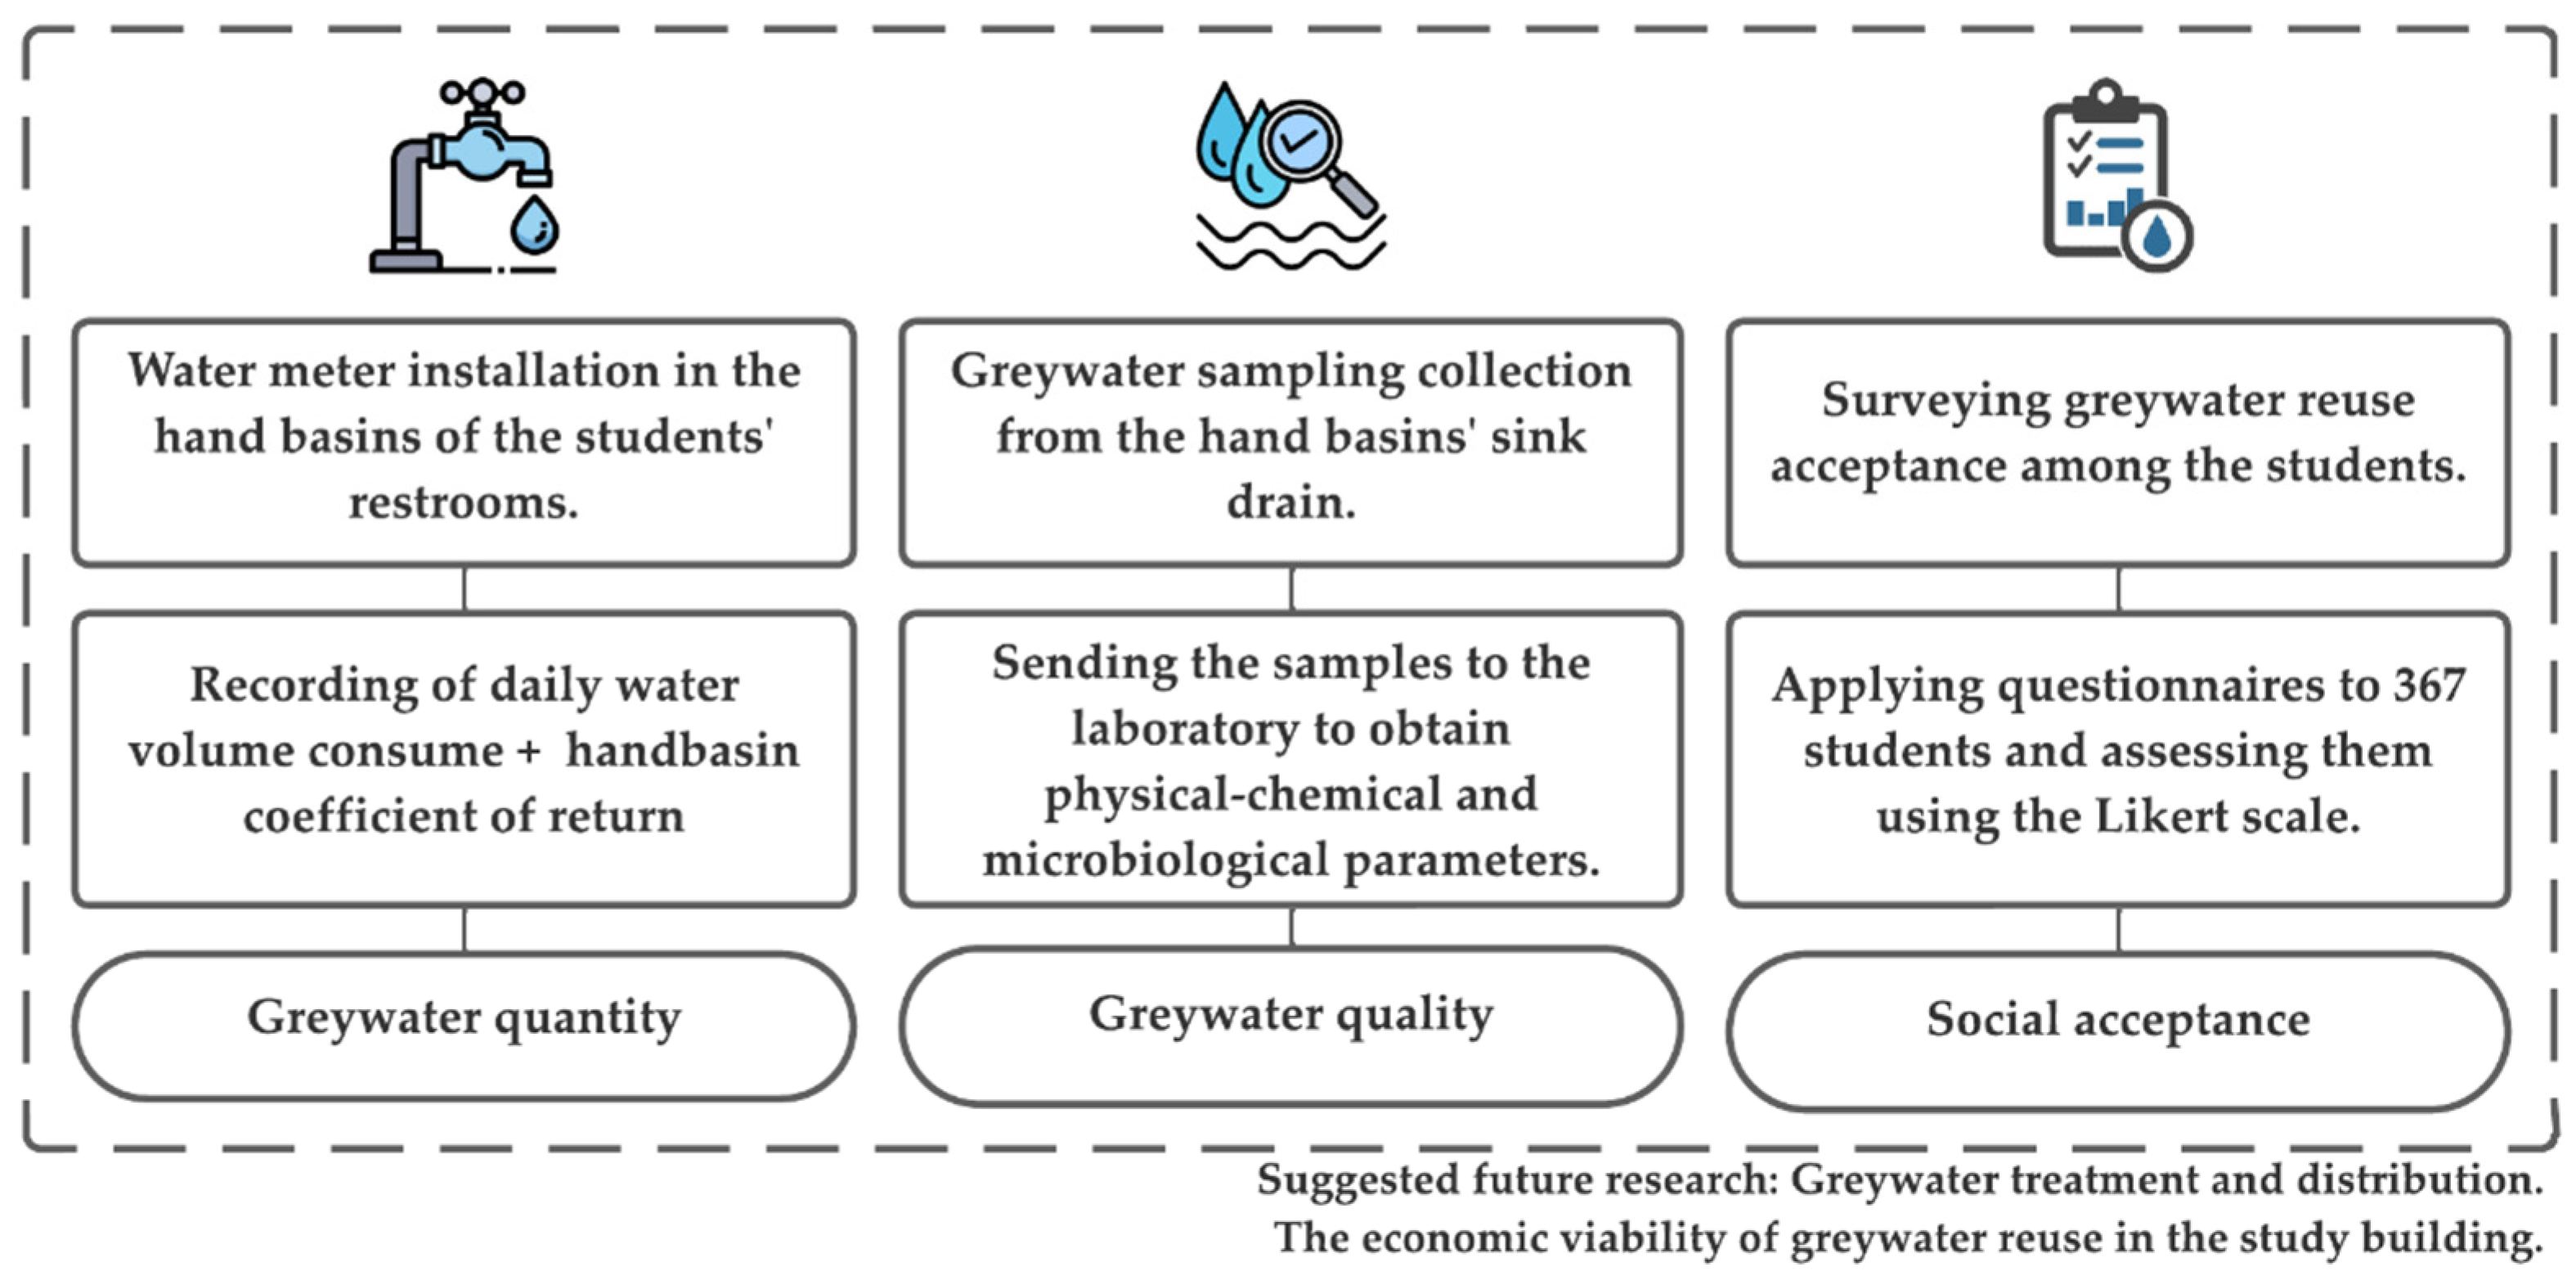
Finally, Figure 4 summarizes the methods used to accomplish the study’s aims.

2.1. Greywater Sample Collection

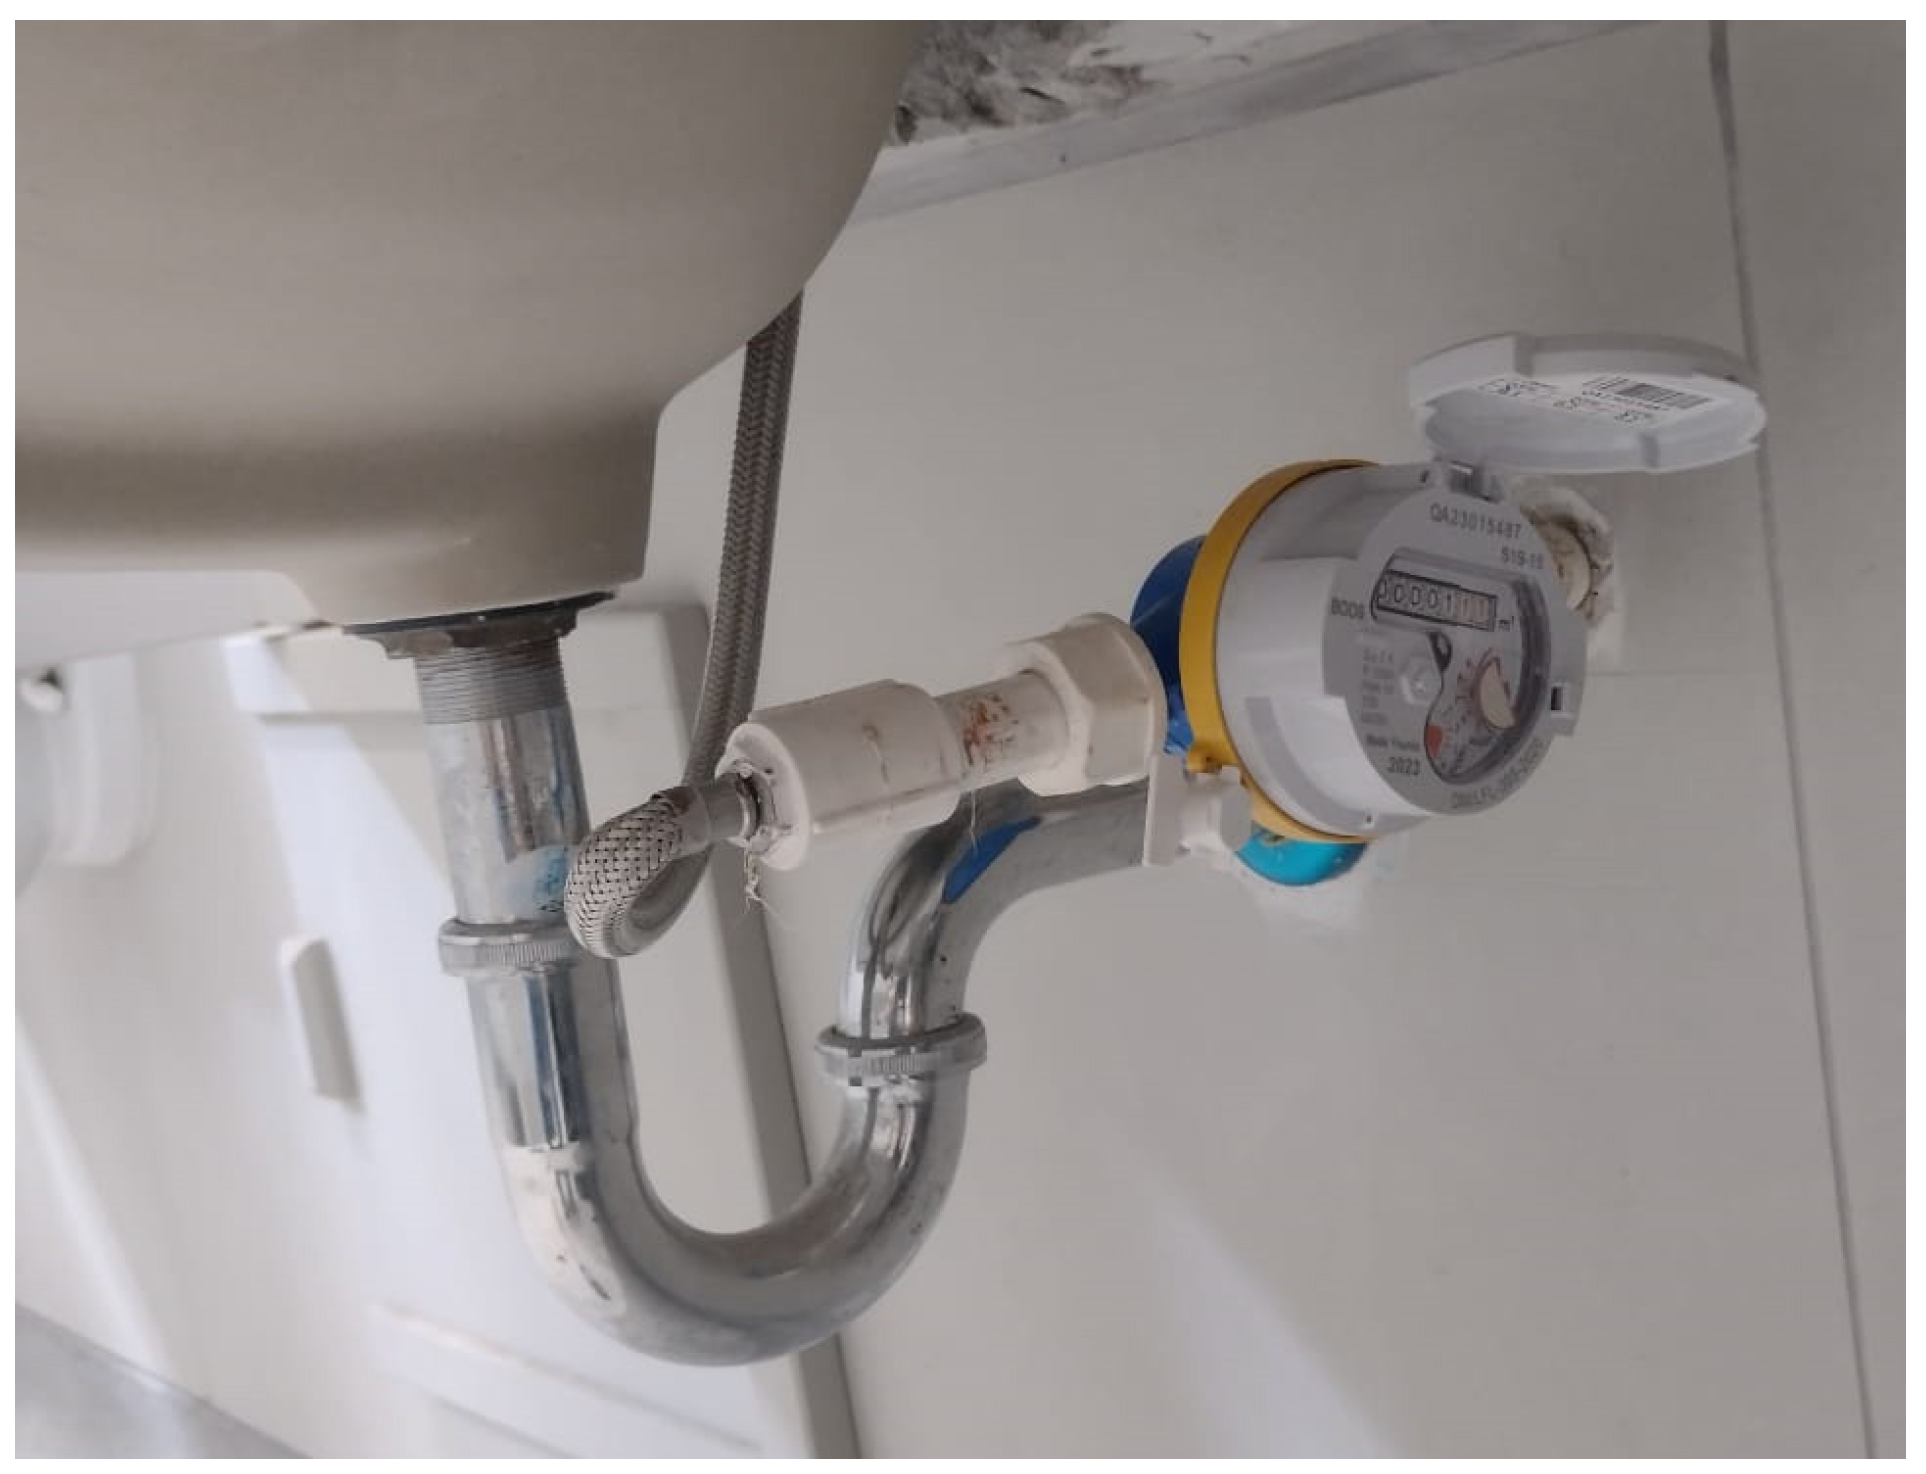
The greywater from the hand basins was measured daily from the 1st to the 4th floor. For that purpose, a water meter was installed in the flexible supply tube of each hand basin (Figure 5). The single-jet water meters were manufactured in 2023 and have a nominal diameter of 15mm. They operated at a medium temperature of 30 °C and a medium pressure of 10 bar. They were previously tested for errors by the supplier, according to the Peruvian metrological standard NMP 005-1:2018 (static pressure test and indication error test) [50].
The classes at the civil engineering school extend from eight to twelve hours. The daily volume of water used in each hand basin was documented during the last trimester of the 2023 academic year (October–December) at 19:00 h. This means that the reading of each water meter was recorded and summed daily, grouping it according to the restroom (male or female). In this way, the daily volume of water consumed in the female restroom and the male restroom separately was obtained. Subsequently, using descriptive statistics, the daily average for the three months studied was calculated. Finally, considering a hand basin coefficient of return, the quantity of greywater generated in each hand basin was determined.
Additionally, once the daily volume of greywater is calculated, three options for reusing that water are assessed, obtaining the percentage of water saving in each activity.

2.2. Greywater Sample Analysis

To analyze the greywater quality, the hand basin sink drain was removed so that the greywater could flow into a 20 L container. For the analysis, a composite mixture was obtained from the collected greywater.
For physical, chemical, and microbiological greywater analysis, plastic and glass bottles were used to store greywater samples, depending on the type of test. These bottles were kept in containers at 4 °C and transported to an accredited laboratory for analysis.
The physical and chemical parameters analyzed include pH, turbidity, conductivity, total suspended solids (TSS), dissolved oxygen (DO), biochemical oxygen demand (BOD5), chemical oxygen demand (COD), oils and grease, total Kjeldahl nitrogen, and anions, such as nitrate, nitrite, and phosphate (as phosphorus). The microbiological parameters are related to heterotrophic plate counting, total coliforms, and thermotolerant coliforms. Each parameter was evaluated according to the Standard Methods of the American Public Health Association (APHA) and the United States Environmental Protection Agency (EPA).
Additionally, to understand the potential complexity of treating the produced greywater, its characteristics are compared with the World Health Organization guidelines [51,52], EPA standards [53], and NSF/ANSI Standard 350 [53]. Similarly, they are compared with similar research.
Finally, to ensure quality control and prevent sample interference from external factors, nitrile gloves were used for sample collection. The containers were previously washed with distilled water. Samples were kept at the temperature requested by the laboratory (4 °C) before being processed in a nationally accredited laboratory that complies with all quality standards. During the analysis, previously filtered distilled water was used as a blank sample in laboratory procedures, and the quantification limit, process standard recovery percentage, and added sample recovery percentage were determined. Each method used in each test is detailed in Table 2.

2.3. Student Questionnaire

This study was carried out on a population of 732 students. Considering a 5% tolerance level and a 95% confidence level, a minimum sample of 253 students was calculated. However, the questionnaires were administered to 367 students of both genders using a paper-based method. Participation was strictly voluntary, anonymous, and accompanied by an Informed Consent Statement. Participants had the right to skip any questions they found offensive.
The questionnaire was previously validated to assess its reliability and understanding. It was tested with a pilot group of students to verify comprehension.
The questionnaires aimed to determine students’ perceptions of the reuse of greywater generated in the sinks of the student restrooms of the Civil Engineering School of the Private University of Tacna.
The questions covered criteria ranging from habitual water usage to the frequency of restroom use at the university, perceptions of how treated and untreated greywater could be used, and acceptance of greywater reuse to address water shortages. Finally, responses were evaluated using a Likert scale.

2.4. Reuse Strategies

2.4.1. Toilet Flushing

The questionnaires provided insight into how many times a day students visit the restrooms according to gender. In addition to that information, a count was conducted daily for two weeks, tallying the number of students entering each restroom within a two-hour period. This count was conducted on all four stories.
Finally, knowing the water consumption of each sanitary fixture (Table 1), it was possible to determine the amount of water required for toilet/urinal flushing.

2.4.2. Green Roof and Garden Watering

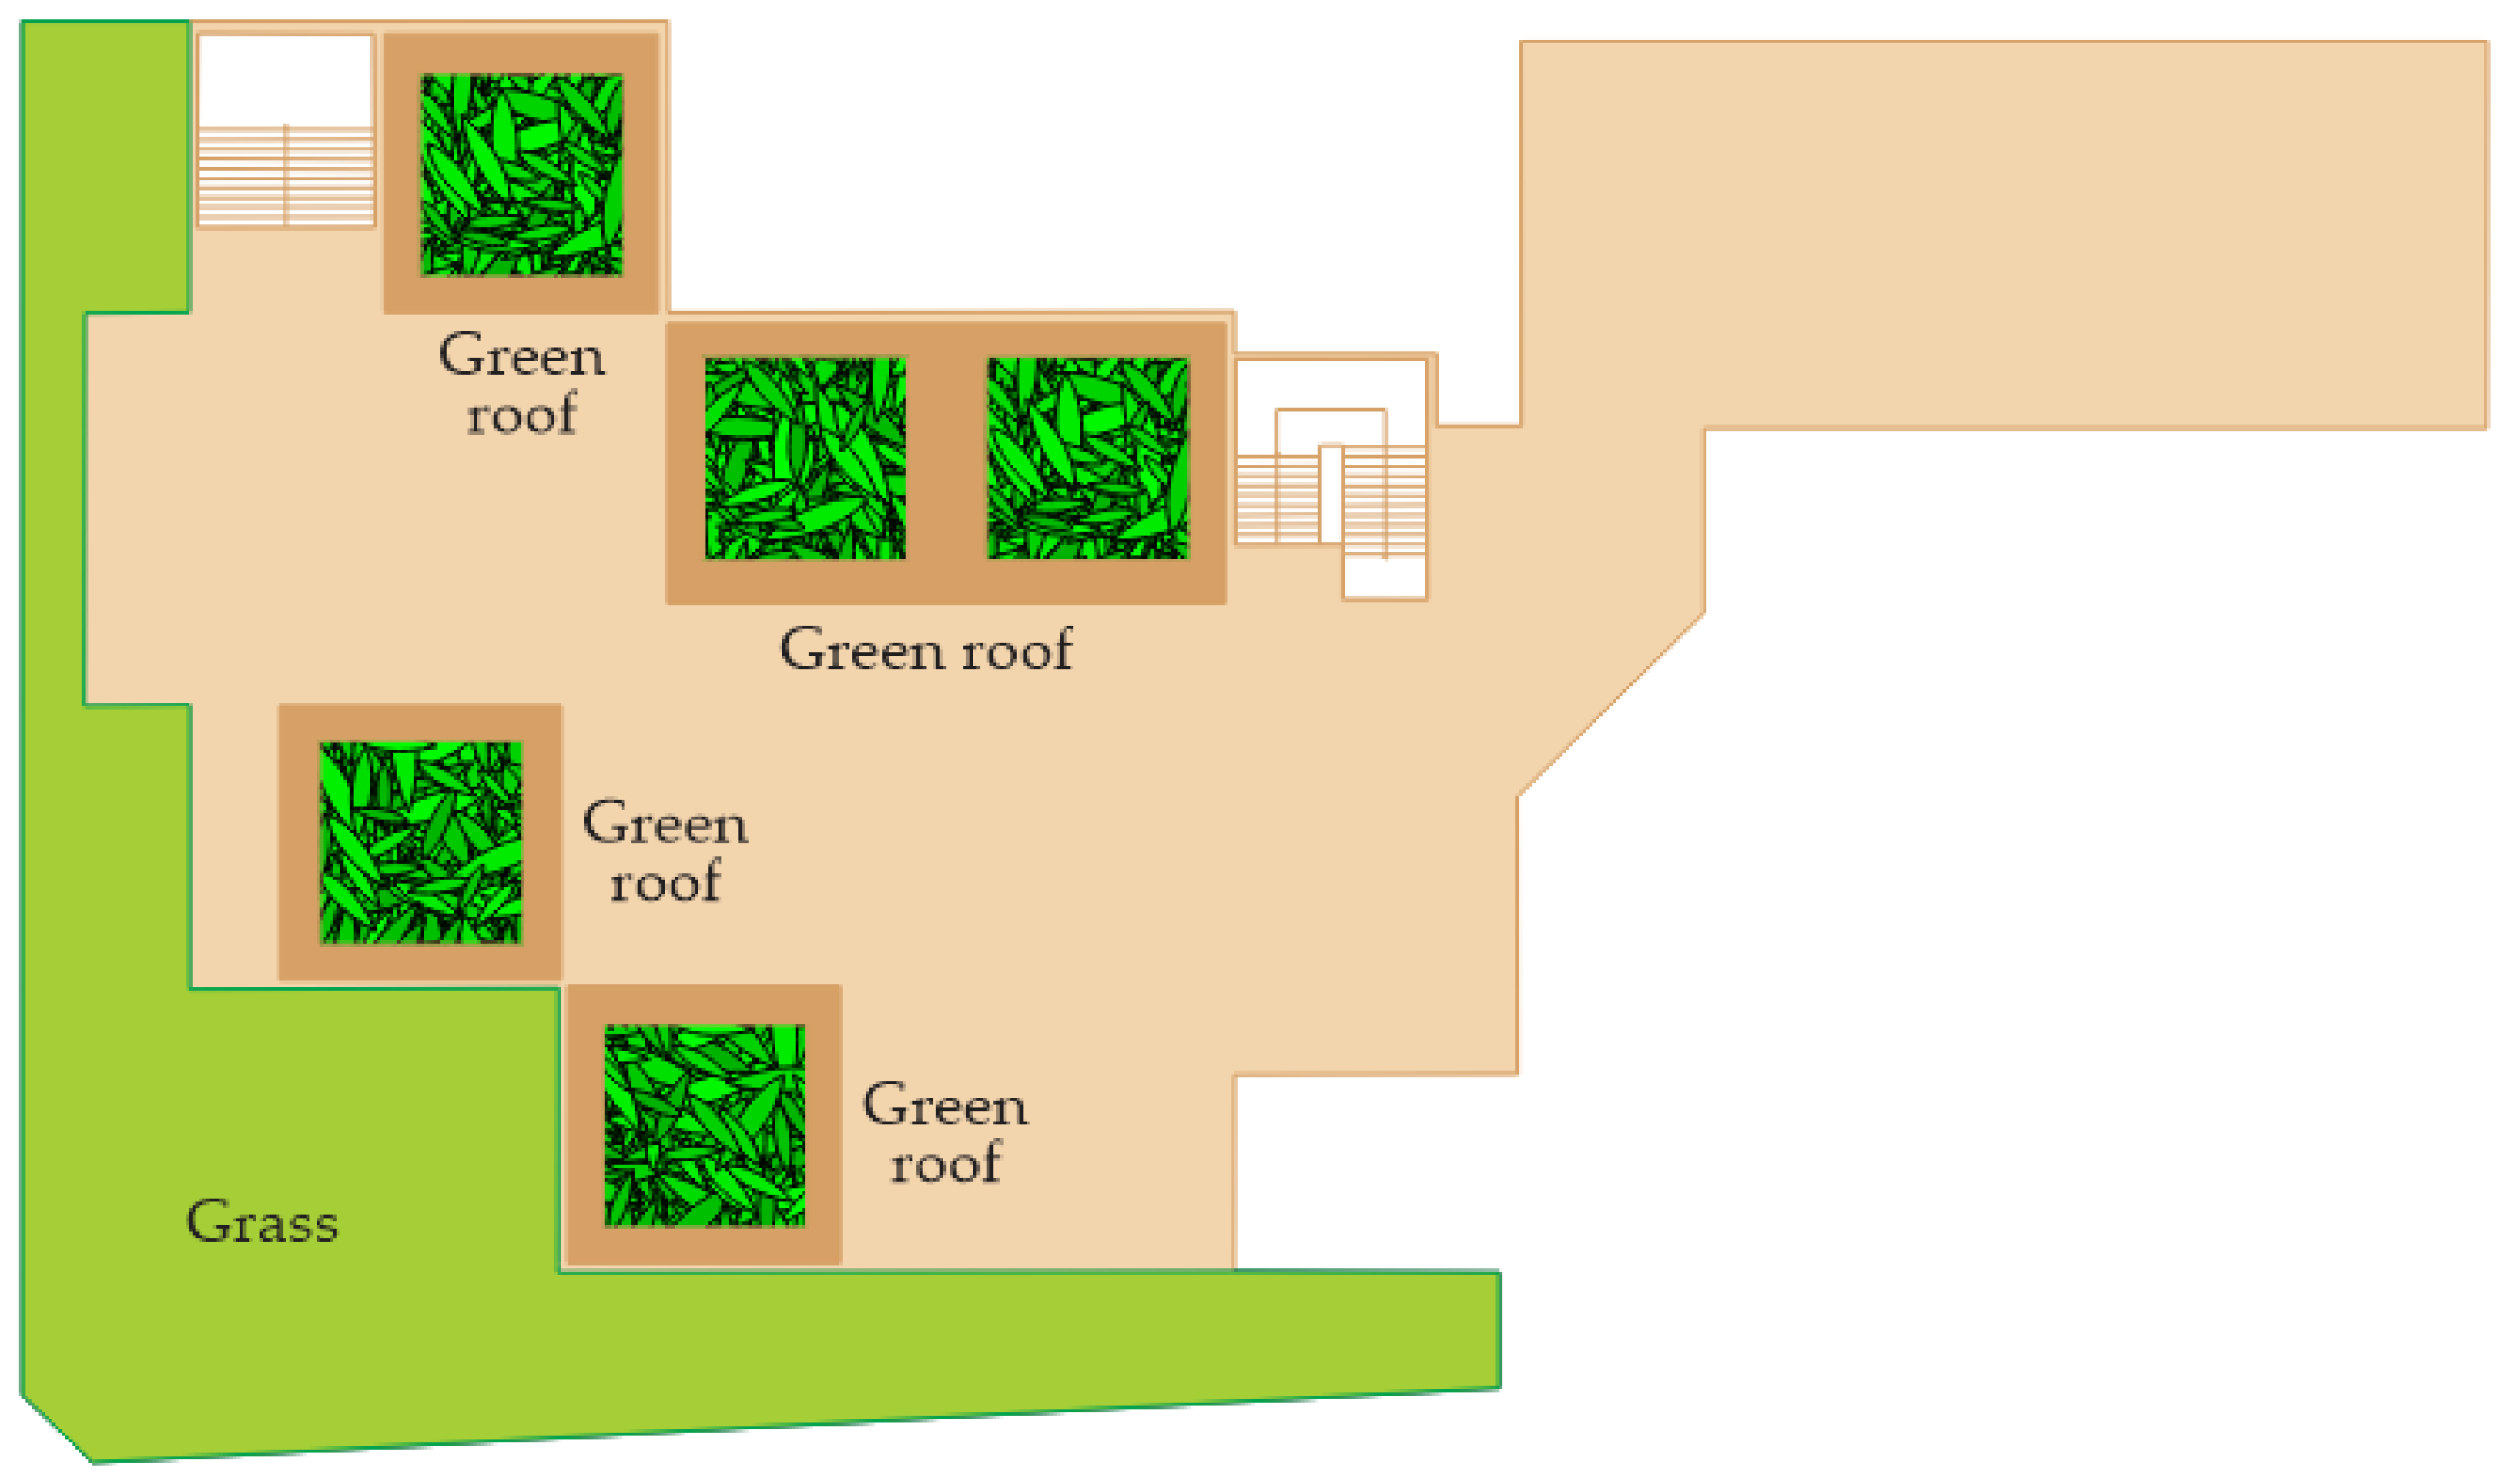
Green roofs have become innovative nature-based solutions to some of the most concerning urban and environmental challenges [16,58]. Their benefits include the improvement of air quality through carbon dioxide concentration reduction, the reduction in heat island effects, and the urban aesthetics improvement that leads to community psychological benefits [58]. According to [59], during the summer, in arid regions, the average water consumption of a green roof is 2.7 L/m2/day. Then, it is possible to determine the extension of a green roof that could be watered with the greywater generated in the building.
Regarding garden watering, according to the Peruvian Government Department of Housing, Construction, and Sanitation [60], the water requirement for green areas is 2 L/m2/day.

3. Results and Discussion

3.1. Greywater Quantity

It has been mentioned that the amount of greywater generated daily in a given building can vary greatly depending on many factors, such as gender, age, culture, weather, infrastructure, etc. However, schools usually do not produce as much greywater volume per person as a household building due to the absence of the greywater generated by the laundry and the showers [61].
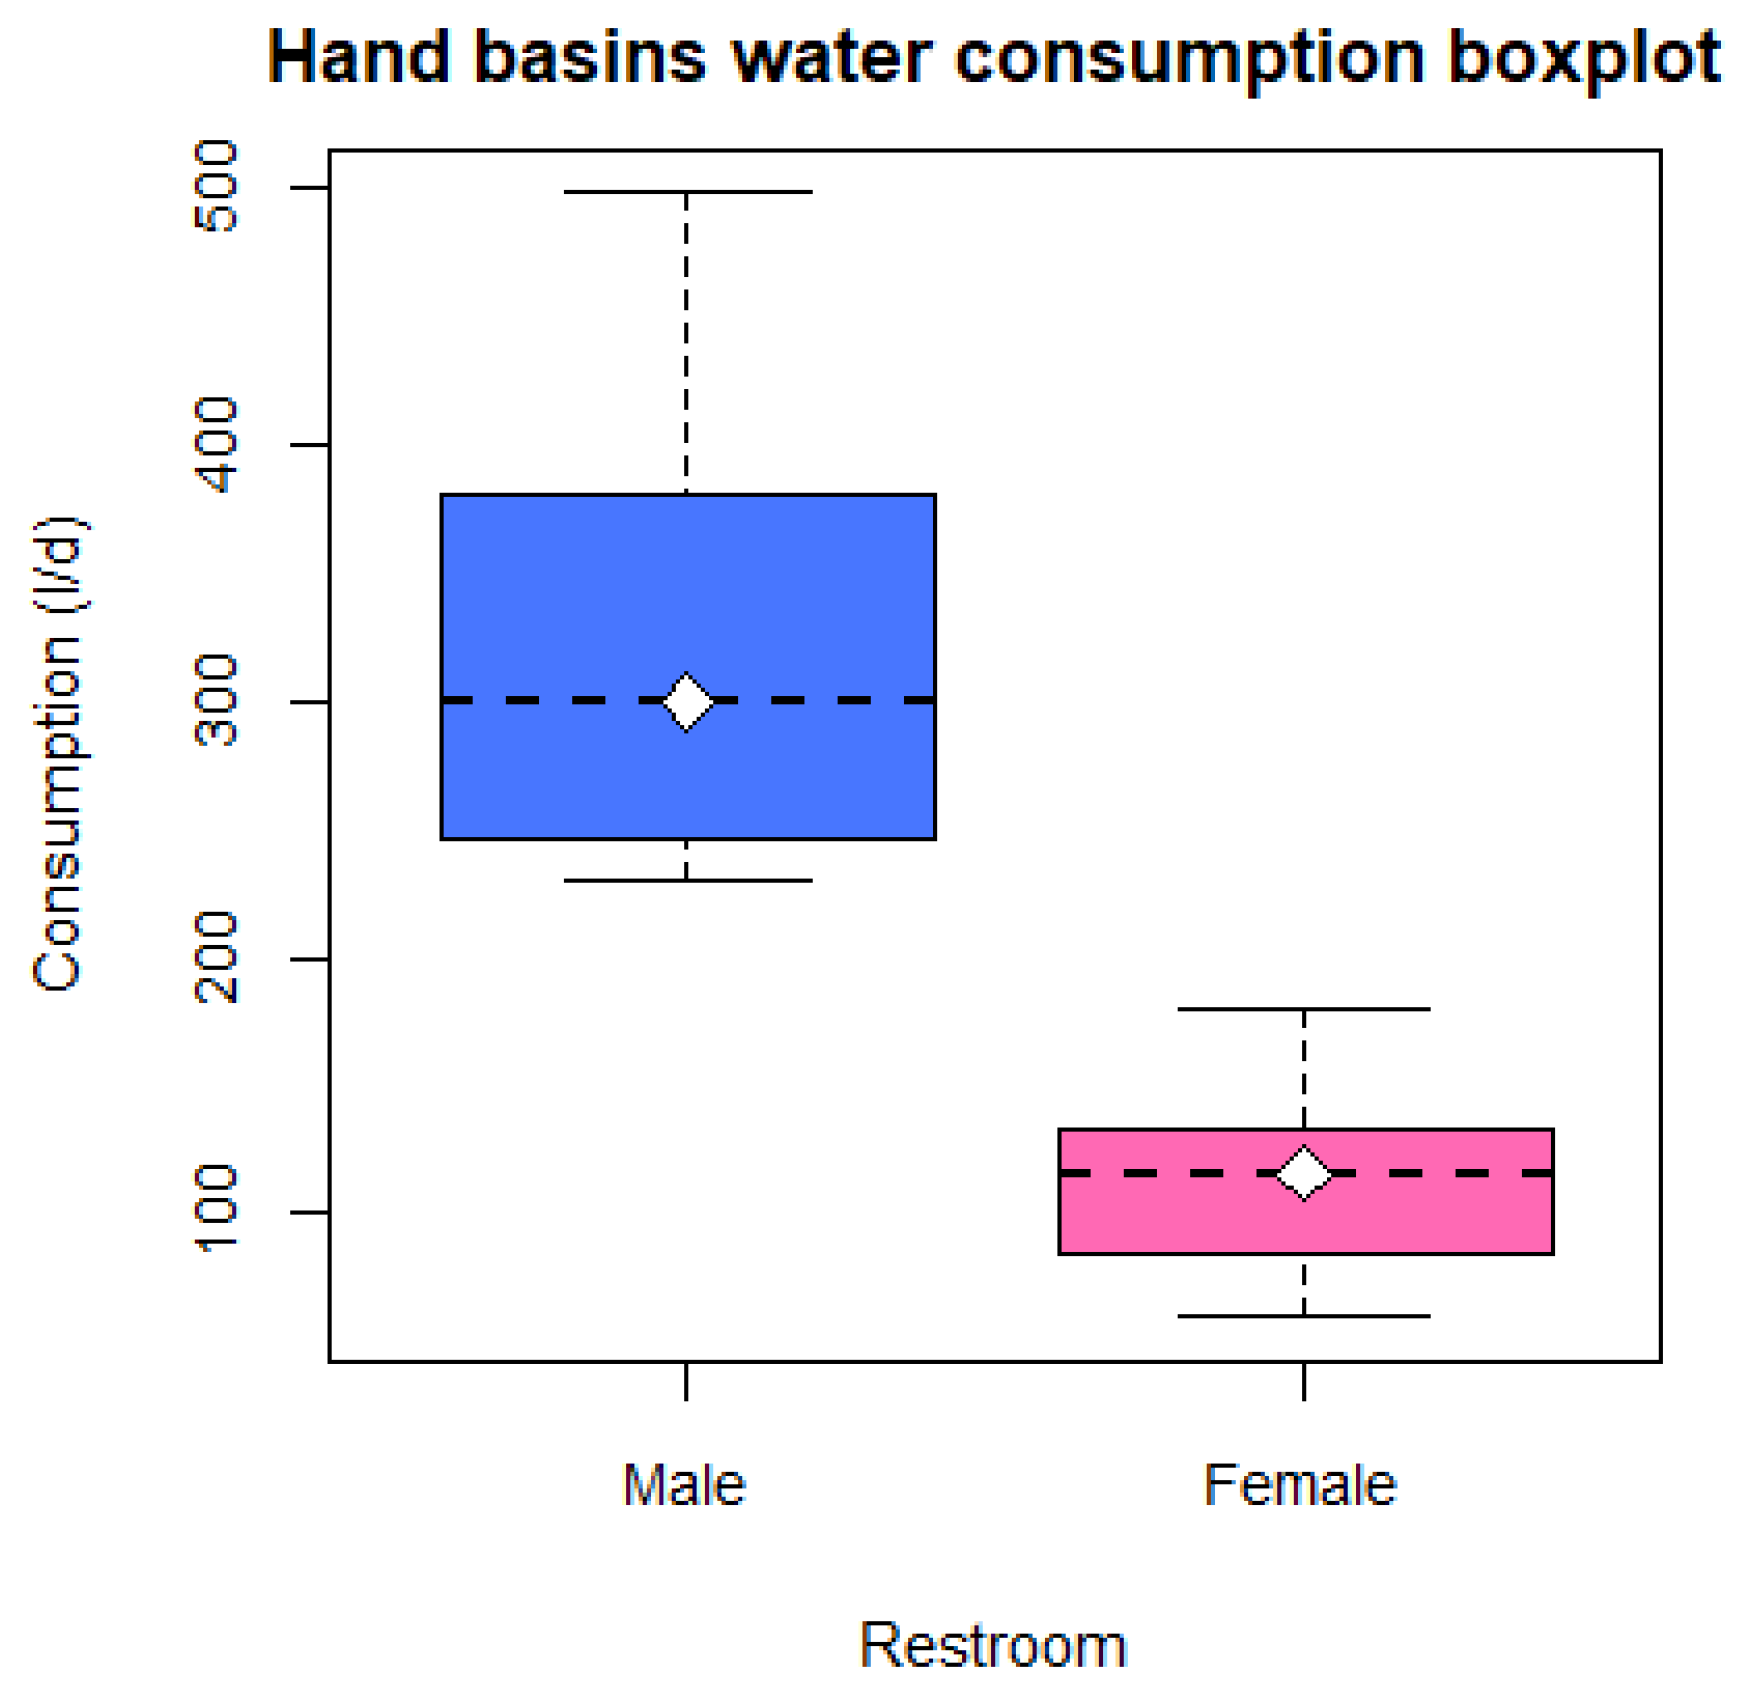
In this study, the daily water consumption of each hand basin was recorded using a water meter. Then, each record was added, grouping them into female and male student restrooms for the entire building. Figure 6 shows the boxplot and the mean of the three-month daily records.
The handbasin coefficient of return was assumed to be 0.97. This means that out of the total volume from the tap, 97% becomes greywater, while 3% is lost around the handbasin or elsewhere. This coefficient was established based on field observations.
Finally, considering the daily average water consumption of all hand basins and the coefficient of return, the daily greywater generated in the building is 426.85 L/d (Table 3).
The greywater quantity obtained in this study is lower compared to similar research (Table 4) due to the following factors:
1.
Although the study buildings are of an educational type, it has been observed that the maturity of users leads to greater awareness of adequate water usage [37]. Therefore, older students tend to conserve more water by using less for handwashing;
2.
Most previous research has involved manually operated taps [37,39,40,61], while those installed in this case study building are self-closing taps. This results in less greywater production and significant savings in potable water;
3.
The methodology used to estimate greywater production varies from study to study. Research that relied on surveys to calculate greywater production might overestimate this quantity, mainly due to people’s lack of attention to their daily water consumption habits [40]. Studies that determined greywater quantity using equations and literature reviews might not be accurate due to various factors that affect greywater generation, especially infrastructure and cultural-related factors.

3.2. Greywater Quality

The characteristics of greywater can be influenced by various factors, including the quality of the water source, the distribution system, and usage activities [37,62]. Given that the greywater in this study originates from hand basins, it can be classified as light greywater.
Table 5 presents the physical, chemical, and microbiological characteristics of the untreated greywater analyzed in this research.
Most previous research on greywater focuses on households and residential buildings, with only a few studies related to schools. There is a lack of research characterizing greywater in universities, where its characteristics can vary significantly. Table 6 presents the greywater characteristics from studies conducted in schools and universities in other countries, with their results compared to those of this study.

3.2.1. Physical and Chemical Characteristics

The physical and chemical characteristics of the greywater in this study align closely with previous research conducted in schools and universities (Table 6). The physical parameters analyzed include turbidity, total suspended solids (TSS), and electrical conductivity (EC).
Turbidity ranged between 12.2 and 15.4 NTU, with an average of 13.4 NTU, while total suspended solids varied from 13 to 21 mg/L, with an average of 17 mg/L. These parameters are primarily influenced by food particles, hair, and fibers [37].
The recorded turbidity levels are relatively low, consistent with the light greywater from hand basins, resulting in similarly low total suspended solids values. According to [21], high turbidity is often associated with suspended solids, which can vary depending on the types of chemicals and detergents used. Therefore, the relatively low turbidity levels suggest minimal use of chemical products.
In terms of water reuse criteria, the average turbidity exceeds the recommended limits. For total suspended solids, their levels suggest feasibility only for the irrigation of green areas (Table 7). Additionally, the pH and TSS values are generally lower compared to those reported in the literature (Table 6).
For water reuse, the control of turbidity and TSS is essential, which leads to enhancing the aesthetic quality of the water [27,66]. This can contribute to improving the public acceptance of greywater reuse.
The electrical conductivity values are between 817 and 820 μS/cm, which is a minimal variation, with an average of 818.3 μS/cm. In previous research, the maximum value was 1446 μS/cm EC [37]. The average EC reported is due to ionized substances, such as soap used for handwashing—the more soap in water, the greater the electrical conductivity.
pH is among the analyzed chemical parameters, whose value ranges between 6.64 and 6.73, with an average of 6.67 (close to neutrality). The pH of greywater can be influenced by the potable water source [62] and by chemical substances, such as cleaners, bleaches, and disinfectants [19]. On the other hand, international guidelines and standards for wastewater reuse establish a range between 6 and 9 for pH [52,53]; thus, the values found in the greywater samples are within that range [37,63]. Shaikh and Ahammed [33] mentioned that the higher the pH value is, the lower the disinfection efficiency might result. Therefore, the obtained value of 6.67 is ideal for better disinfection performance. Then, this pH value is fundamental for choosing the possible chemical or biological treatment of the generated greywater.
Dissolved oxygen (DO) ranged between 5.7 and 7.5 mg/L with a mean value of 6.73 mg/L. This value exceeds the limit established in Jordan by the WHO [51], as can be seen in Table 7. The DO value is related to the amount of total suspended solids, which can affect turbidity. This is also related to COD. According to [45], the greater the amount of organic contaminant present, the greater the oxygen necessary to decompose those contaminants (COD).
Organic pollution was measured by biochemical oxygen demand (BOD5) and chemical oxygen demand (COD). The first has values between 33.9 and 39.7 mg/L with an average value of 37 mg/L, while the second ranges between 95 and 98.8 mg/L with an average value of 97.23 mg/L. The average values are relatively low, as stated by [33], who mentioned that greywater from bathrooms and sinks contains little organic content compared to that from the kitchen and laundry. These concentrations are attributed to the hygiene of the students, the types of detergents used [25], and the use of hand soap [37].
The chemical oxygen demand (COD) values are within the range presented in the literature [37,65]. In the international water reuse guides and standards, the COD parameter is not largely considered, except for the Mediterranean area in Jordan [51], where our result is within the limit established for reuse in green areas (Table 7).
Biodegradability must be determined to know the suitability of wastewater for biological treatment [33]. According to [67], biodegradability is defined as the capacity of bacteria to decompose organic matter and convert it into CO2 and H2O, and it relates to BOD5/COD. The criteria to determine biodegradability follow what was proposed by Ardila Arias et al. [68], who established that values < 3 are considered non-biodegradable effluents. In this study, biodegradability shows a value of 0.38, which means that the effluent is poorly biodegradable; therefore, biological treatment would not be sufficient to eliminate the organic matter.
Among the anions, phosphate (as phosphorus) has a concentration <0.033 mg/L, a lower result compared to previous studies that range from 0.05 to 6 mg/L (Table 5). The FAO [69] states that the range for reuse of phosphate–phosphorus (PO4-P) in wastewater is 0 to 6.13 mg/L. Total Kjeldahl nitrogen values are between 2 and 23 mg/L and have an average of 5.33 mg/L, even though few previous studies in schools and universities considered this parameter (Table 6). Furthermore, nitrate is found at <0.014 mg/L and nitrite at an average of 0.07 mg/L. According to previous studies, nitrite and nitrate concentrations can vary broadly. In the Jordanian standards [51], both total nitrogen and nitrate are considered compared to others where they are not mentioned. Therefore, the average values in this study are within the limits established for reuse in green areas.
Regarding cations, some metals were considered, which, according to [33], are essential for plant growth. However, if cations are found at high levels, they can affect the soil when used for irrigation. The presence of Na and Mg is found in small amounts according to Table 5. Higher levels are related to the presence of detergents or personal care products [20], indicating that not much detergent is used as these are waters obtained from sinks. Meanwhile, aluminum is also found in low levels (<0.003). This element is also attributed to the presence of detergents [70].
Oils and fats are present with values between 7.4 and 13.2 mg/L and have an average value of 10.03 mg/L. Regarding previous studies in schools and universities, this parameter was not analyzed. However, the presence of fats and oils is an important factor in greywater, which mostly occurs in greywater from bathroom showers and kitchen sinks [71]. In this study, since the water comes from hand basins, it was found at lower levels compared to other studies that contained between 100 and 331 mg/L [26,72]. The low quantity of the values found is attributed to the minimal use of soap during handwashing. It is known that high levels lead to a reduction in oxygen, hindering aerobic filtration treatments [73]. Likewise, if water is used for watering plants without proper treatment, it will result in the presence of oils and fats in the soil, causing soil hydrophobicity, which would affect the plants [74].
Summarizing, Table 6 shows that the physical and chemical characteristics of the untreated greywater collected in this study are similar to previous research [13,37,44,63,75].

3.2.2. Microbiological Characteristics

Microbiological parameters include total coliforms, fecal or thermotolerant coliforms, and heterotrophic bacteria counts. Microorganisms indicating contamination were present in all the analyzed samples. It was found that the greywater from the hand basins contained between 11,000 and 540,000 MPN/100 mL, with an average of 214,000 MPN/100 mL of total coliforms, while the values of fecal or thermotolerant coliforms ranged between 4900 and 110,000 MPN/100 mL, with an average 41,900 MPN/100 mL, respectively. A higher count of total coliforms with a value of 540,000 MPN/100 mL (similar to the thermotolerant ones with a value of 110,000 MPN/100 mL) was detected in Sample 2 compared to the other two samples. This variability could be related to hygiene conditions. It has been stated that the number of fecal coliforms is strongly influenced by habits and lifestyle [45], exposing a high level of human bacterial contamination due to the presence of bacteria on the skin, and fecal contamination [76]. Considering that handwashing after using the toilets is probably a potential source of fecal coliforms [77], greywater fecal pollution could turn into a hazard for the users that could be in contact with these waters, inferring a greater probability of infections and diseases [52]. Regarding heterotrophic bacteria, counts vary from 28,000 to 370,000 CFU/100 mL, with an average of 143,000 CFU/100 mL.
The total coliform and fecal or thermotolerant coliform samples are lower than the range reported in previous research (Table 6). Regarding international standards and guides, the obtained values far exceed the established limits (Table 7).
Although the presence of SARS-CoV-2 was not analyzed in this study, it is important to emphasize that many studies in mixed wastewater have detected the presence of the virus [78,79,80,81]. Filali et al. [1] mentioned that because greywater has a simpler treatment than mixed wastewater, it would be more likely to spread the coronavirus; therefore, it could affect both the environment and people’s health. Thus, it becomes necessary to carry out studies focused on determining the presence of the virus in greywater. Likewise, governments must safeguard people’s health by developing regulations related to the proper use of greywater. Also, they should install surveillance systems, like Denmark [82], which, during the pandemic, executed a national-level monitoring system for SARS-CoV-2 in wastewater.

3.3. Social Acceptance

People’s perception is a very significant factor when promoting a water reuse project since even well-designed plans have not been able to prosper due to the lack of support from potential users [20]. Therefore, as it is highly recommended to assess users’ perception of water reuse, this study evaluated the students’ opinions about greywater-related topics.
Each part of the questionnaire was focused on knowing the interaction of the students with water when using the restrooms. Through the answers, it has been possible to complement the greywater quantity and quality data. Furthermore, the acceptance of greywater reuse has been assessed.
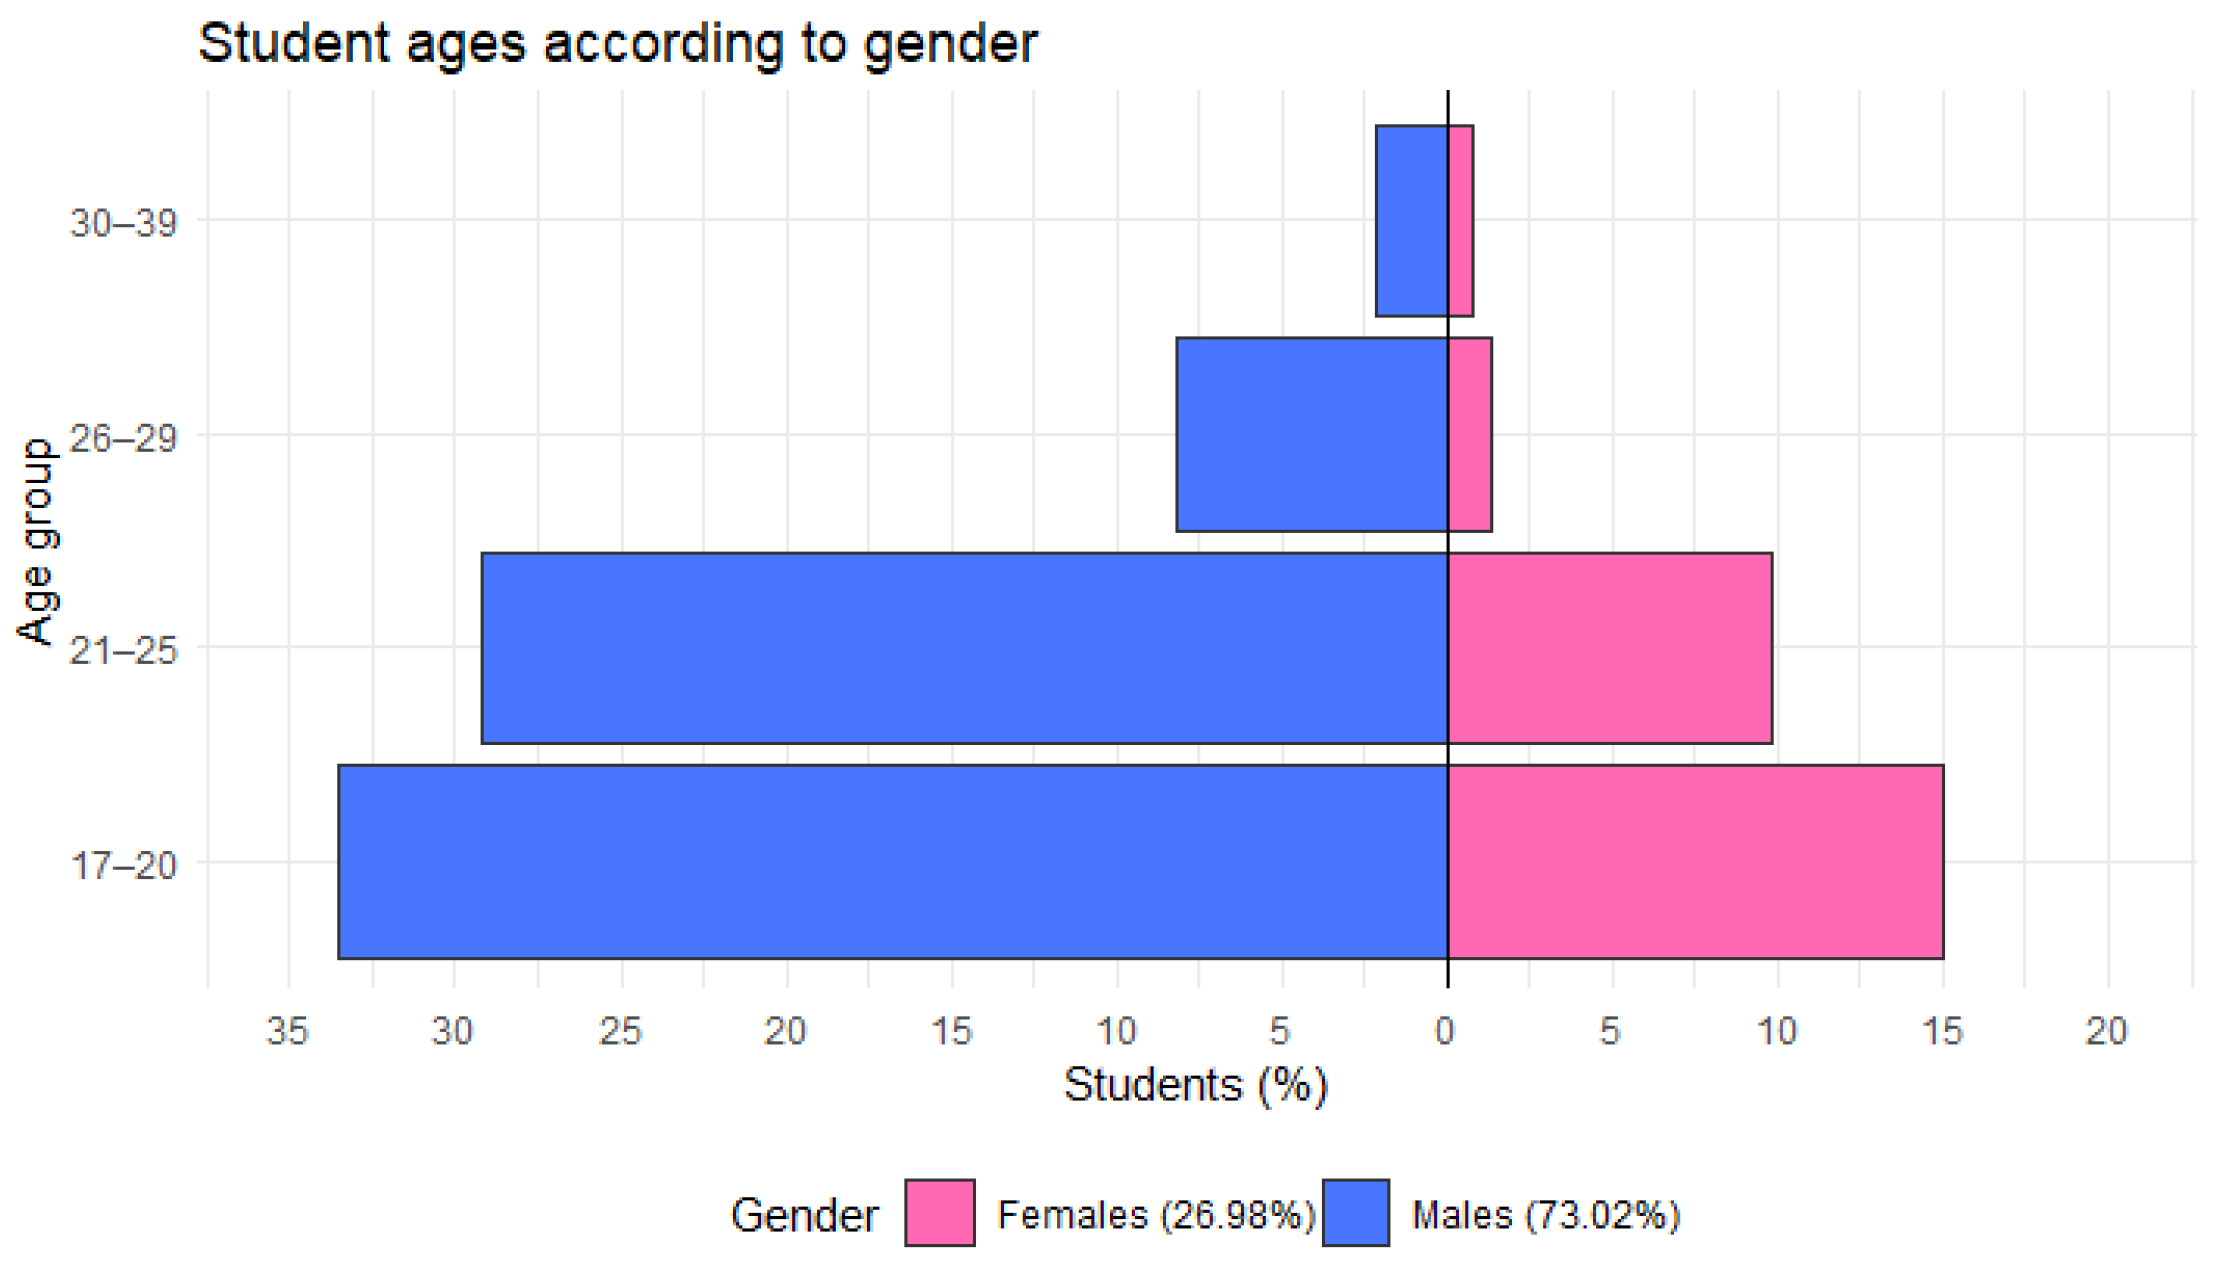
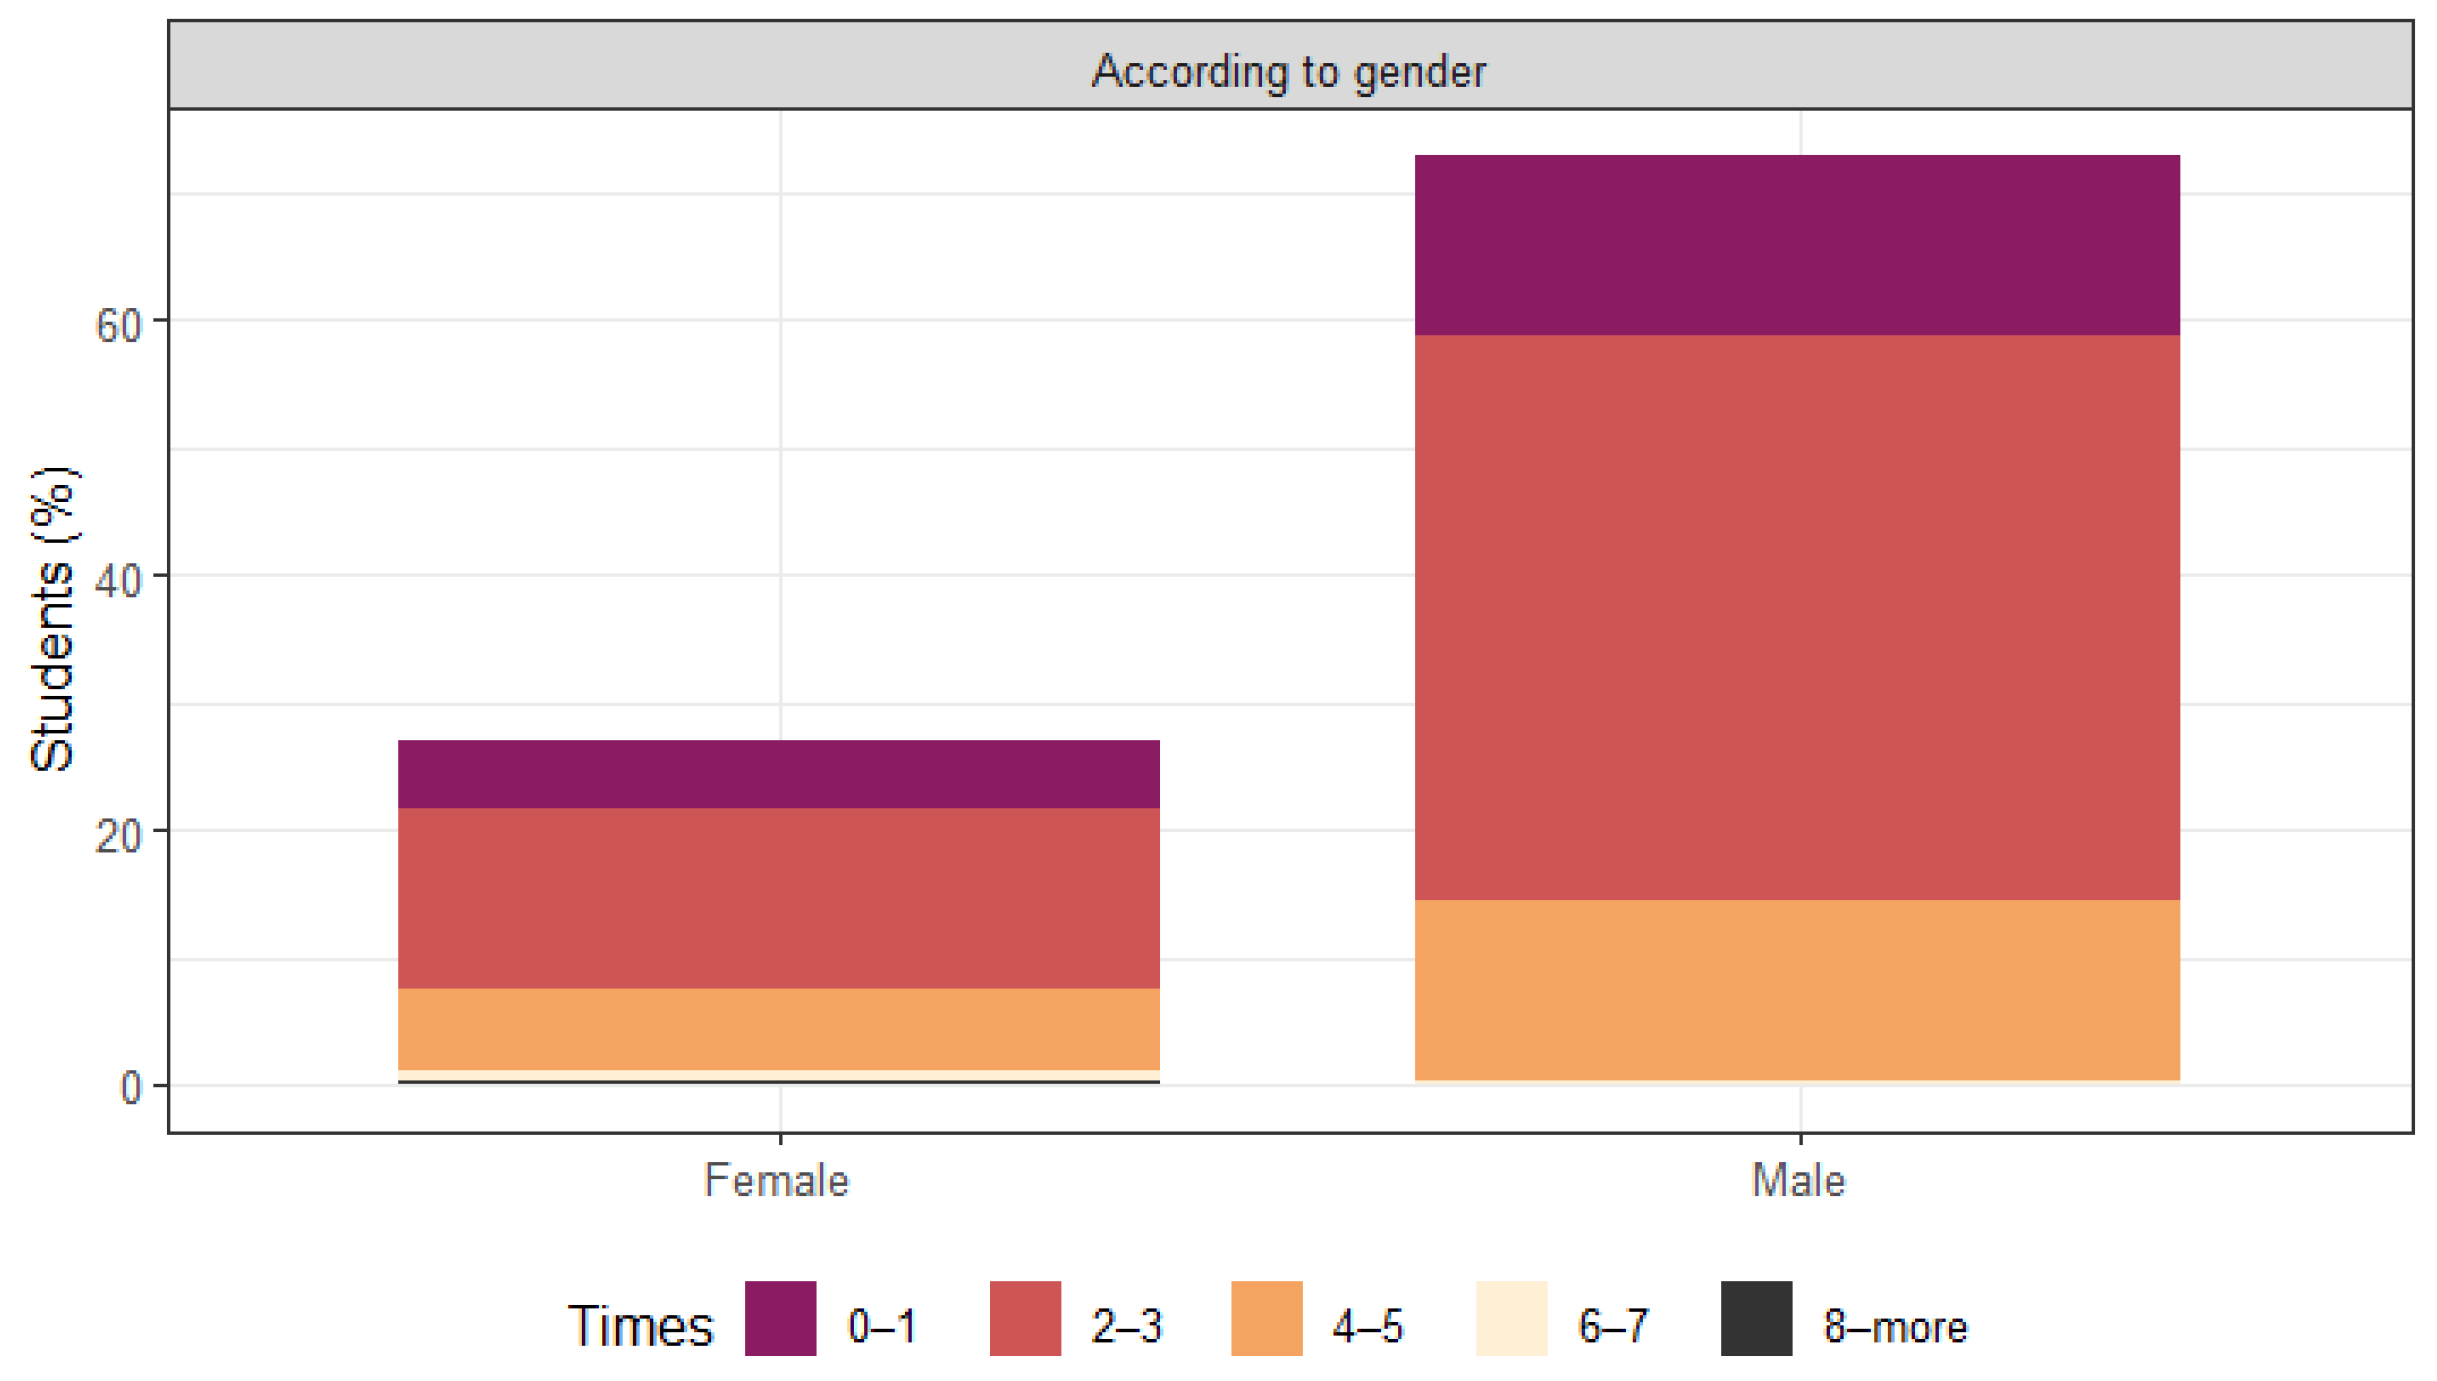
Of the total respondents, 73.02% are male and 26.98% are female. Additionally, 17- to 20-year-old students predominate (33.51% male and 14.99% female), and then students between 21 and 25 years old (29.16% male and 9.81% female), followed by students between 26 and 29 years old (8.17% male and 1.36% female), and finally, 30- to 39-year-old students (2.18% males and 0.82% females) (Figure 7).
Regarding the question of how often students save water at the university, respondents mentioned that they save water by flushing the toilet/urinal only once as necessary and by washing their hands with the minimum amount of water without wasting it.
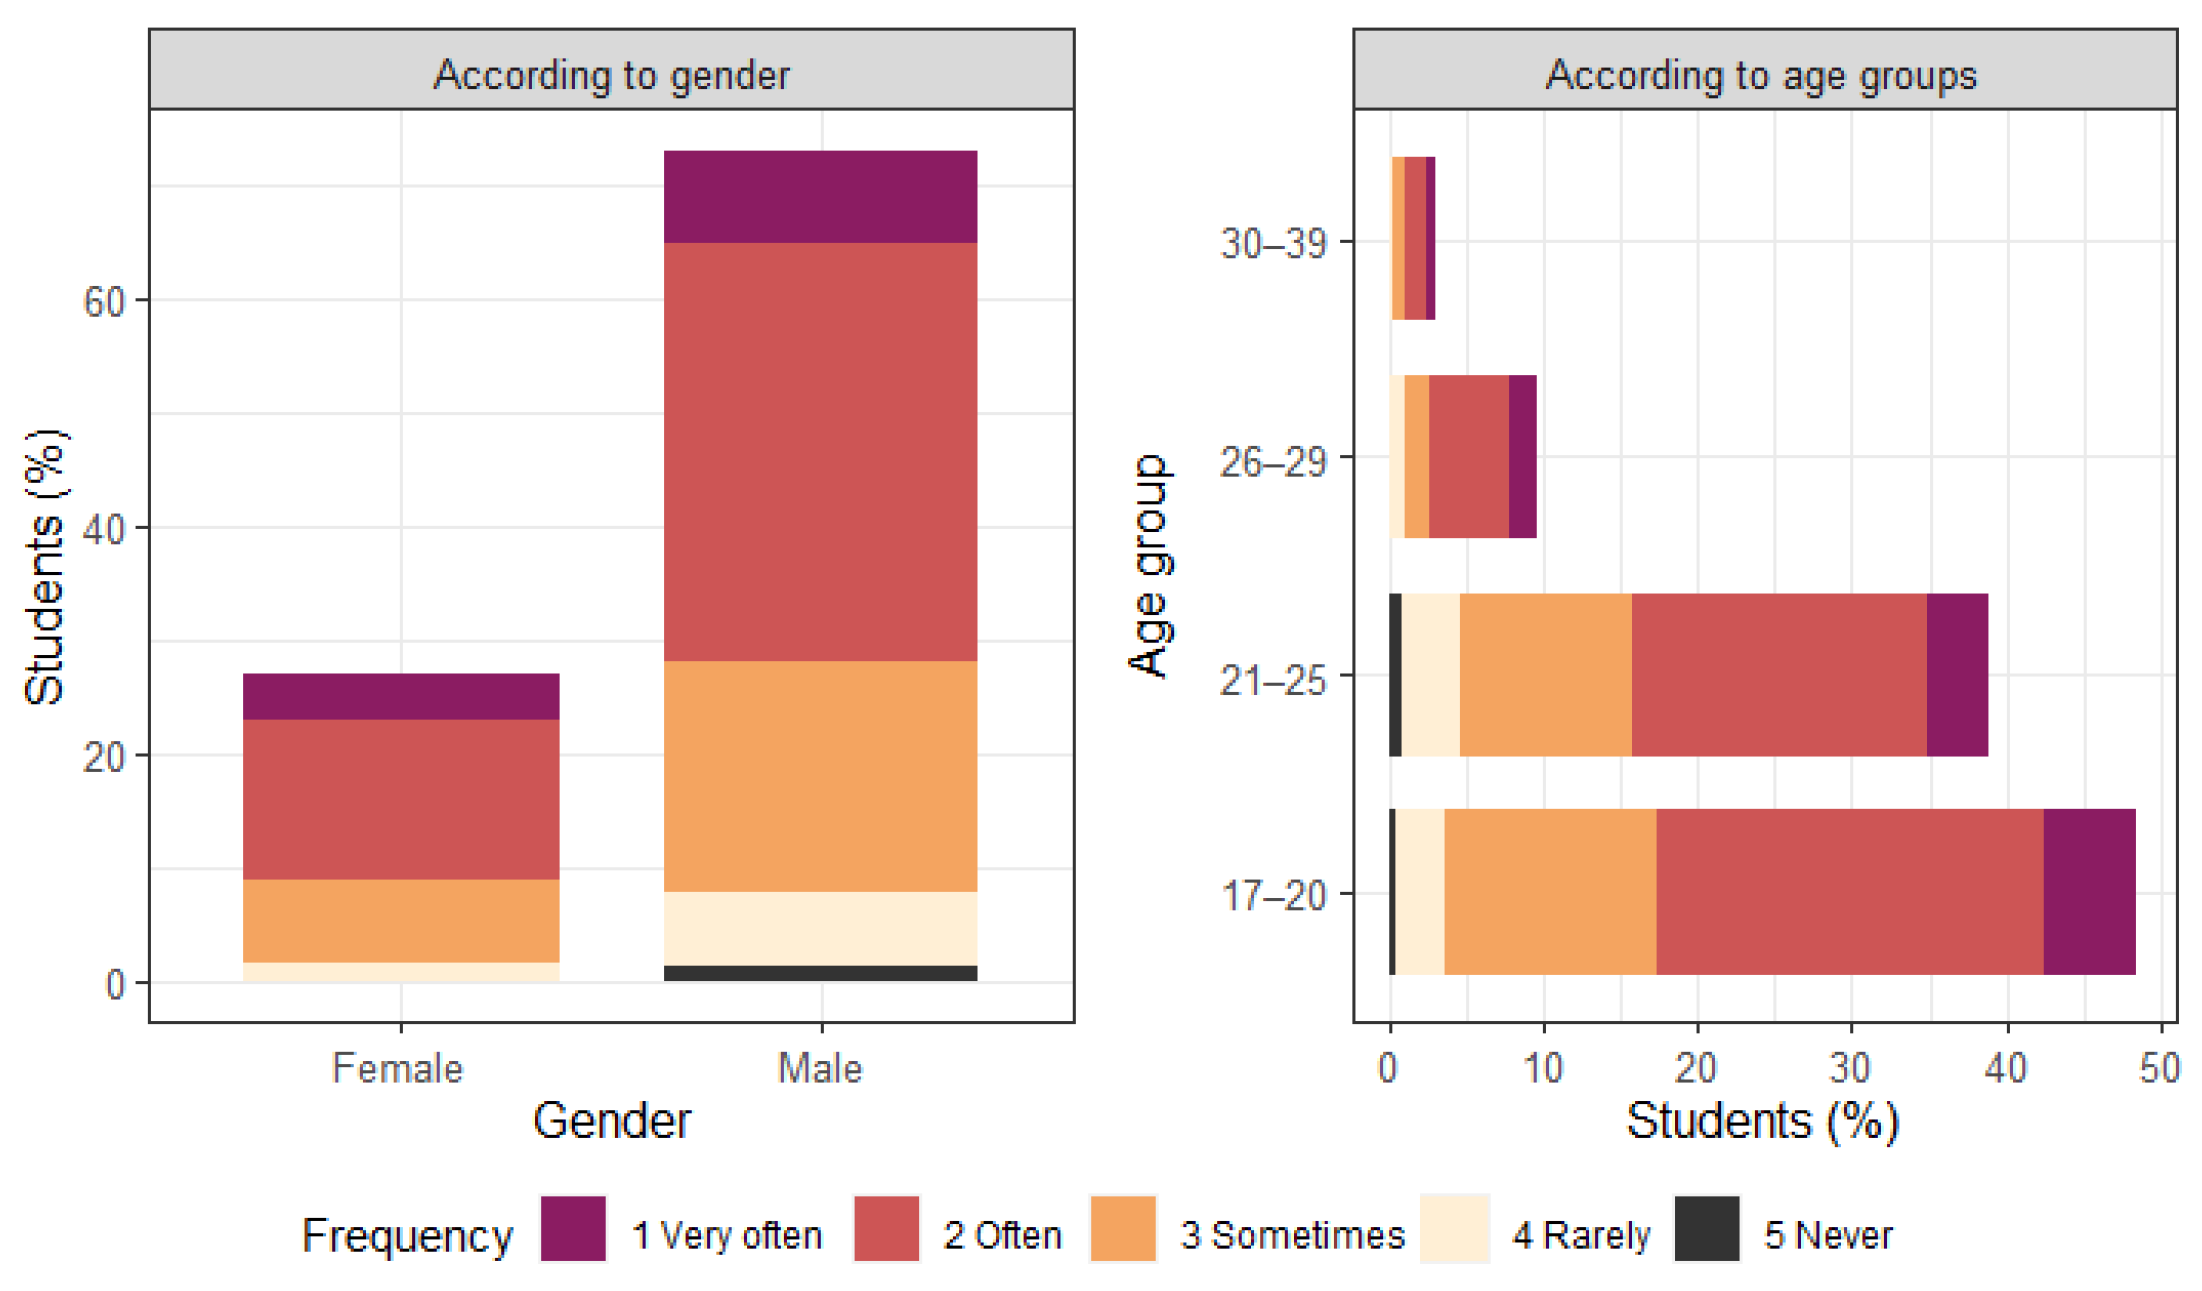
The answers were analyzed by gender, and it has been determined that of the total number of respondents, males answered Very often 8.17%, Often 36.78%, Sometimes 20.16%, Rarely 6.54%, and Never 1.36%. On the other hand, females responded Very often 4.08%, Often 13.90%, Sometimes 7.36%, Rarely 1.63%, and Never 0.00%. Therefore, the majority of males and females mention that they often and sometimes save water at the university (Figure 8).
Likewise, all age ranges agree that they often and sometimes save water at the university, and only a minority say that they rarely or never do it (Figure 8).

3.3.1. Handwashing Practices

After analyzing the students’ opinions about to what extent they agree or disagree with the need to wash their hands after using the restrooms (Figure 9a), by gender, males answered Strongly agree 41.53%, Agree 27.05%, Neither agree nor disagree 1.91%, Disagree 1.09%, and Strongly disagree 1.37%. Females answered Strongly agree 13.39%, Agree 10.38%, Neither agree nor disagree 3.01%, Disagree 0.27%, and Strongly disagree 0.00%. Therefore, it can be seen that most men and women show a great predisposition to wash their hands after using the toilet services, and only 2.46% of men and 0.27% of women show less tendency to wash their hands after using the toilets.
According to the age range analysis (Figure 9a), the most selected answers were “Strongly agree” (27.05%) in the age range between 17 and 20 years, followed by the same response at 20.49% in the age range between 21 and 25 years, and “Agree” (17.21%) in the age range between 17 and 20 years. The least chosen were “Strongly disagree” in the age ranges of 17–20 and 30–39 years and “Disagree” in the age range of 21–25 years; all of them with 0.00%. This information will lead to a better understanding of the greywater quantity that could be generated in the study building.
Regarding the frequency with which students use soap to wash their hands (Figure 9b), men responded Very often 31.97%, Often 30.33%, Sometimes 9.29%, Rarely 1.37%, and Never 0.00%. Women answered Very often 13.93%, Often 9.29%, Sometimes 3.28%, Rarely 0.55%, and Never 0.00%. Therefore, both genders mentioned they most probably will use soap when washing their hands; only 1.37% of men and 0.55% of women would probably not use soap to wash their hands.
Likewise, according to the age range analysis (Figure 9b), the most selected answers were “Very often” (22.68%) in the age range between 17 and 20 years, followed by “Often” at 18.57% in the age range between 17 and 20 years, and “Often” at 16.94%, in the age range between 21 and 25 years. The least chosen response was “Never” (0.00%) in all age ranges of the total surveys. This information might lead to a better understanding of the greywater quality regarding physical–chemical parameters; however, according to the analysis of the studied greywater, this quantity does not reflect a recurrent use of soap in the study population.

3.3.2. Non-Treated Greywater Reuse Acceptance

When using restrooms, good hygiene habits, such as handwashing, become a potential greywater source that could be reused to reduce water scarcity in arid regions. Additionally, it could represent economic savings in the medium or long term; thus, it is important to promote this alternative water source. Most similar research exposed great support for greywater reuse, especially due to climate change. The public identifies it as a method to protect freshwater resources and reduce pollution [20]. Through this part of the questionnaire, it was possible to determine students’ awareness of water treatment and their opinions about reusing untreated greywater.
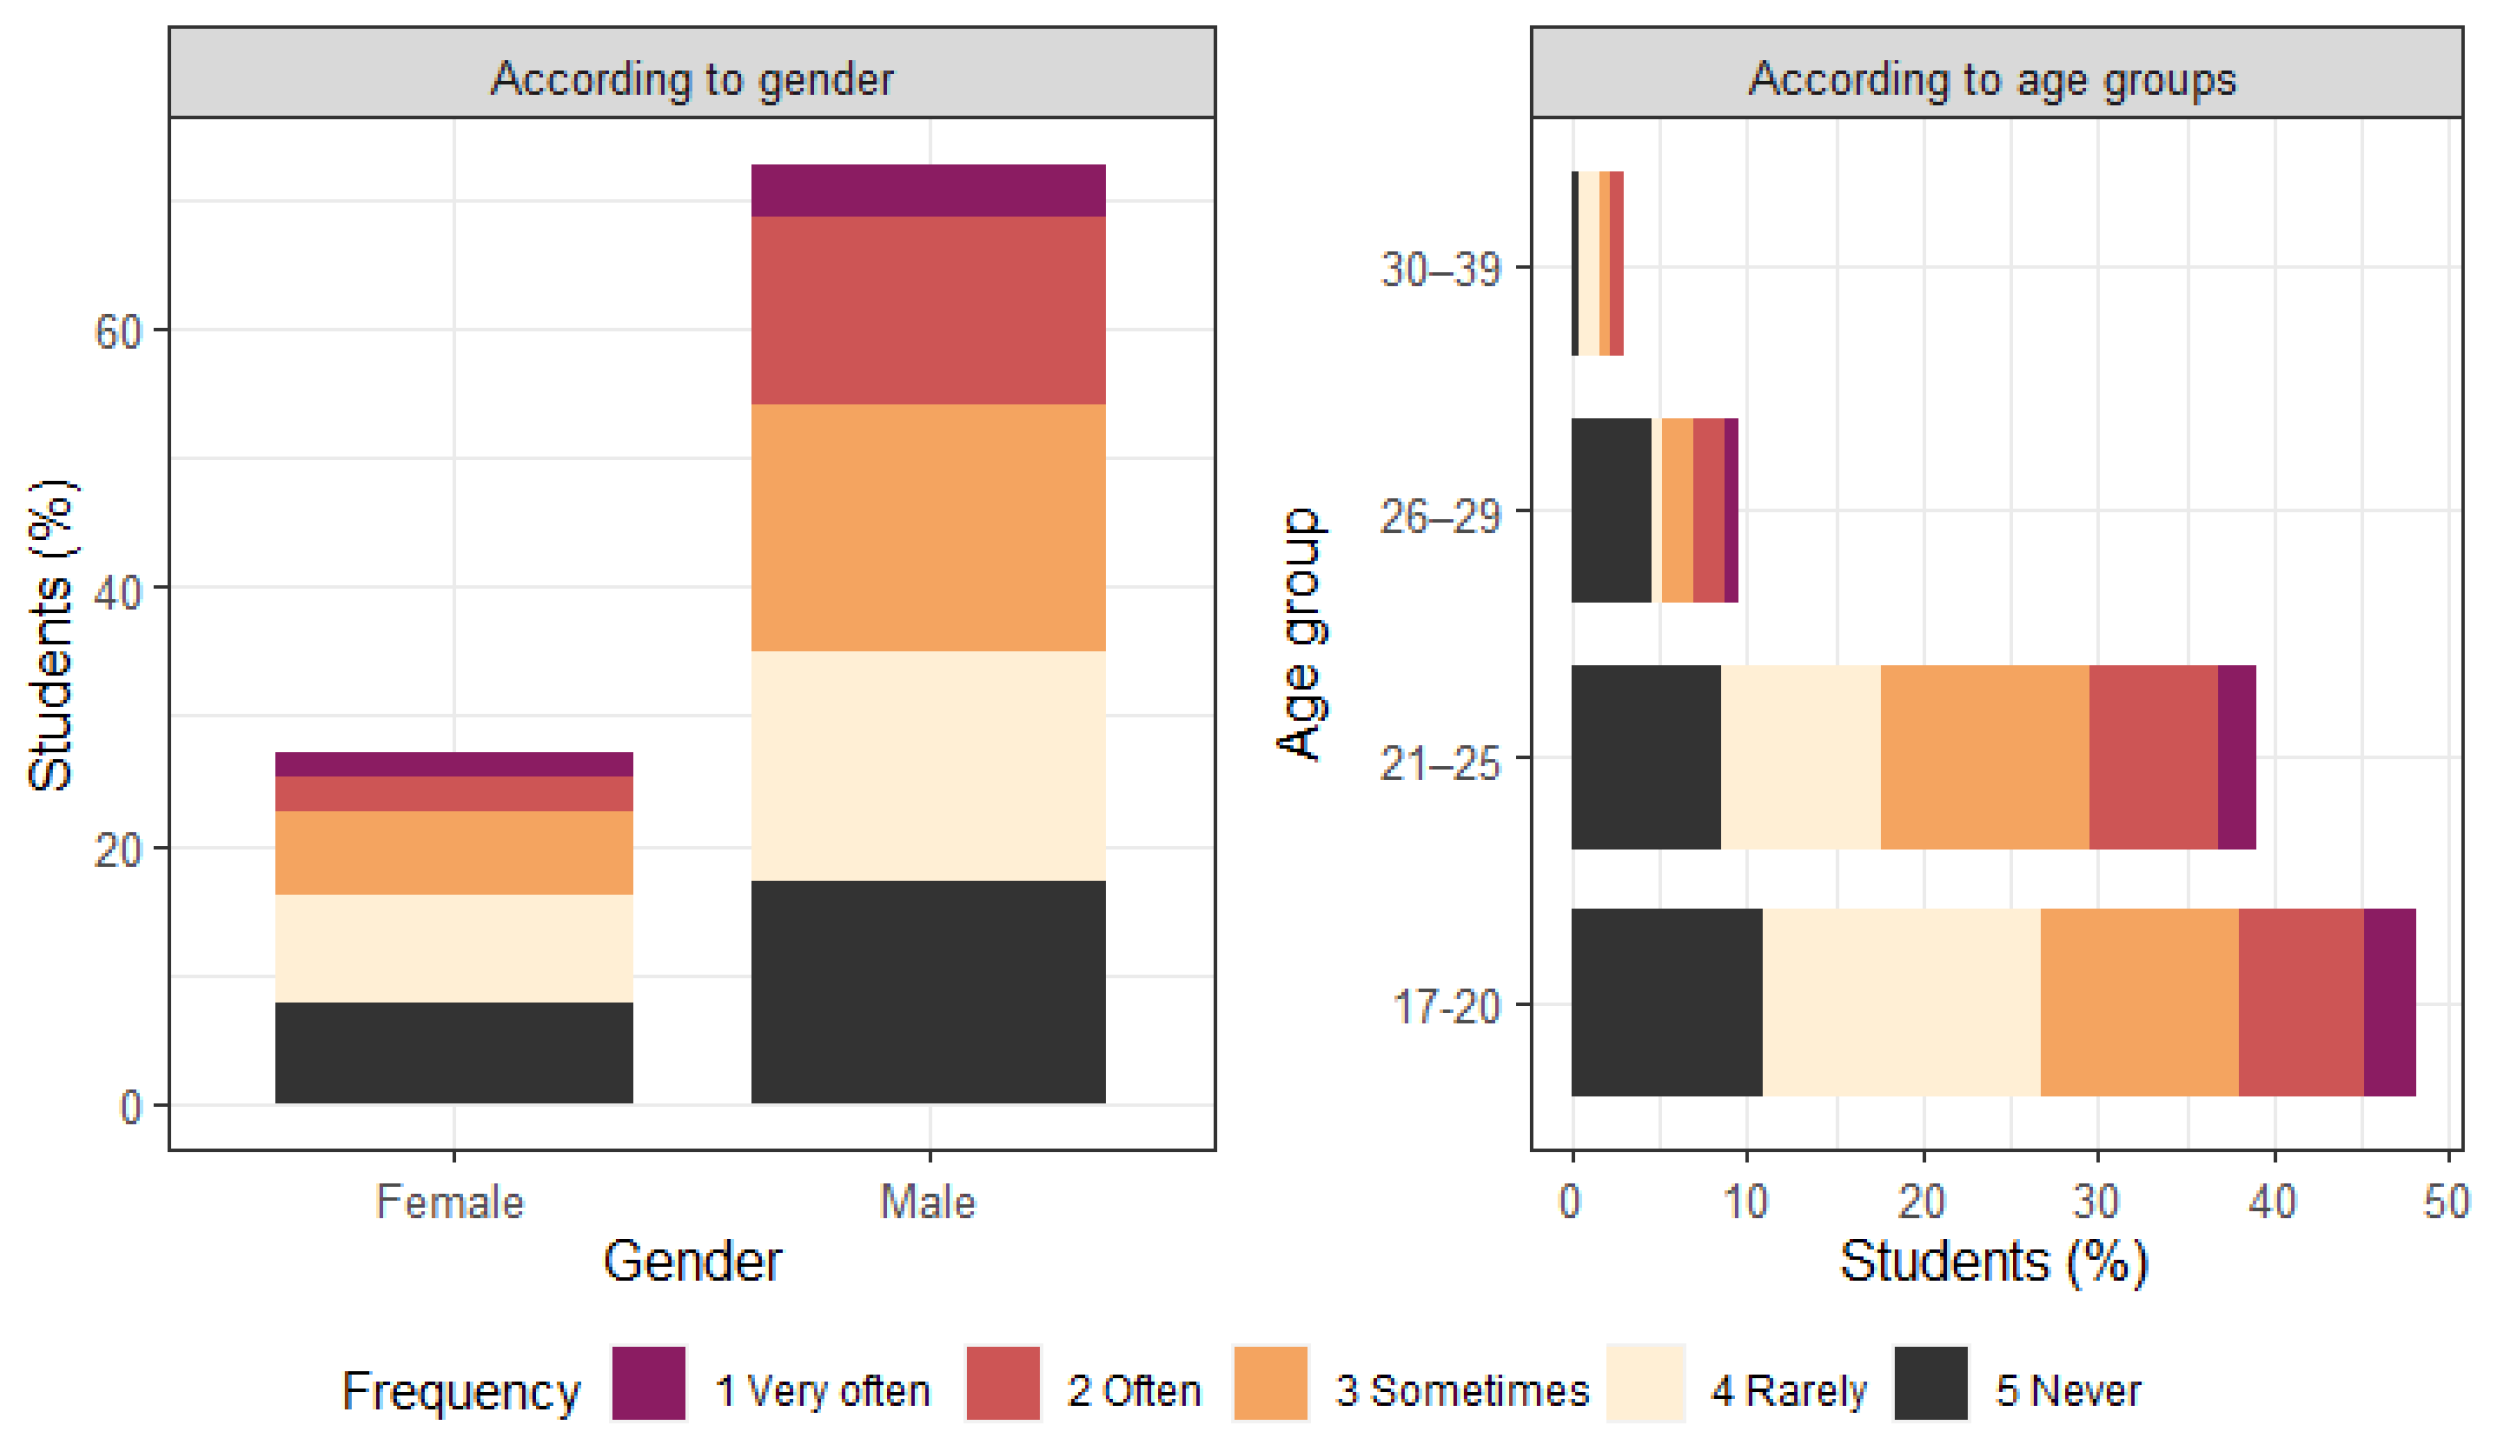
Regarding how frequently students would use green areas watered with untreated greywater (Figure 10), the answers by gender determined men would do it Very often 4.13%, Often 14.60%, Sometimes 19.01%, Rarely 17.91%, and Never 17.08%. Women responded Very often 1.93%, Often 2.75%, Sometimes 6.34%, Rarely 8.54%, and Never 7.71%. Therefore, both genders show no or little willingness to use or sit in green areas that have been irrigated with untreated greywater. On the other hand, only 18.73% of men and 4.68% of women would agree to using or sitting in those green areas.
According to the age range analysis (Figure 10), the most selected answers were Rarely (15.70%), followed by Sometimes (11.29%) and Never (11.02%); all in the age range between 17 and 20 years.
Previous studies stated that the greatest acceptance for greywater reuse is for non-potable uses and when the source of the greywater is their own, while the lowest acceptance occurs when the reuse is for activities that may have direct contact with people and when the source is unknown [20].
Similarly, in this research, it has been identified that most students have a low propensity to have any contact with areas where untreated greywater is reused; then, it is important to execute a greywater treatment before its reuse, especially to avoid perceptible discomfort, such as the emission of bad odors.

3.3.3. Treated Greywater Reuse Acceptance

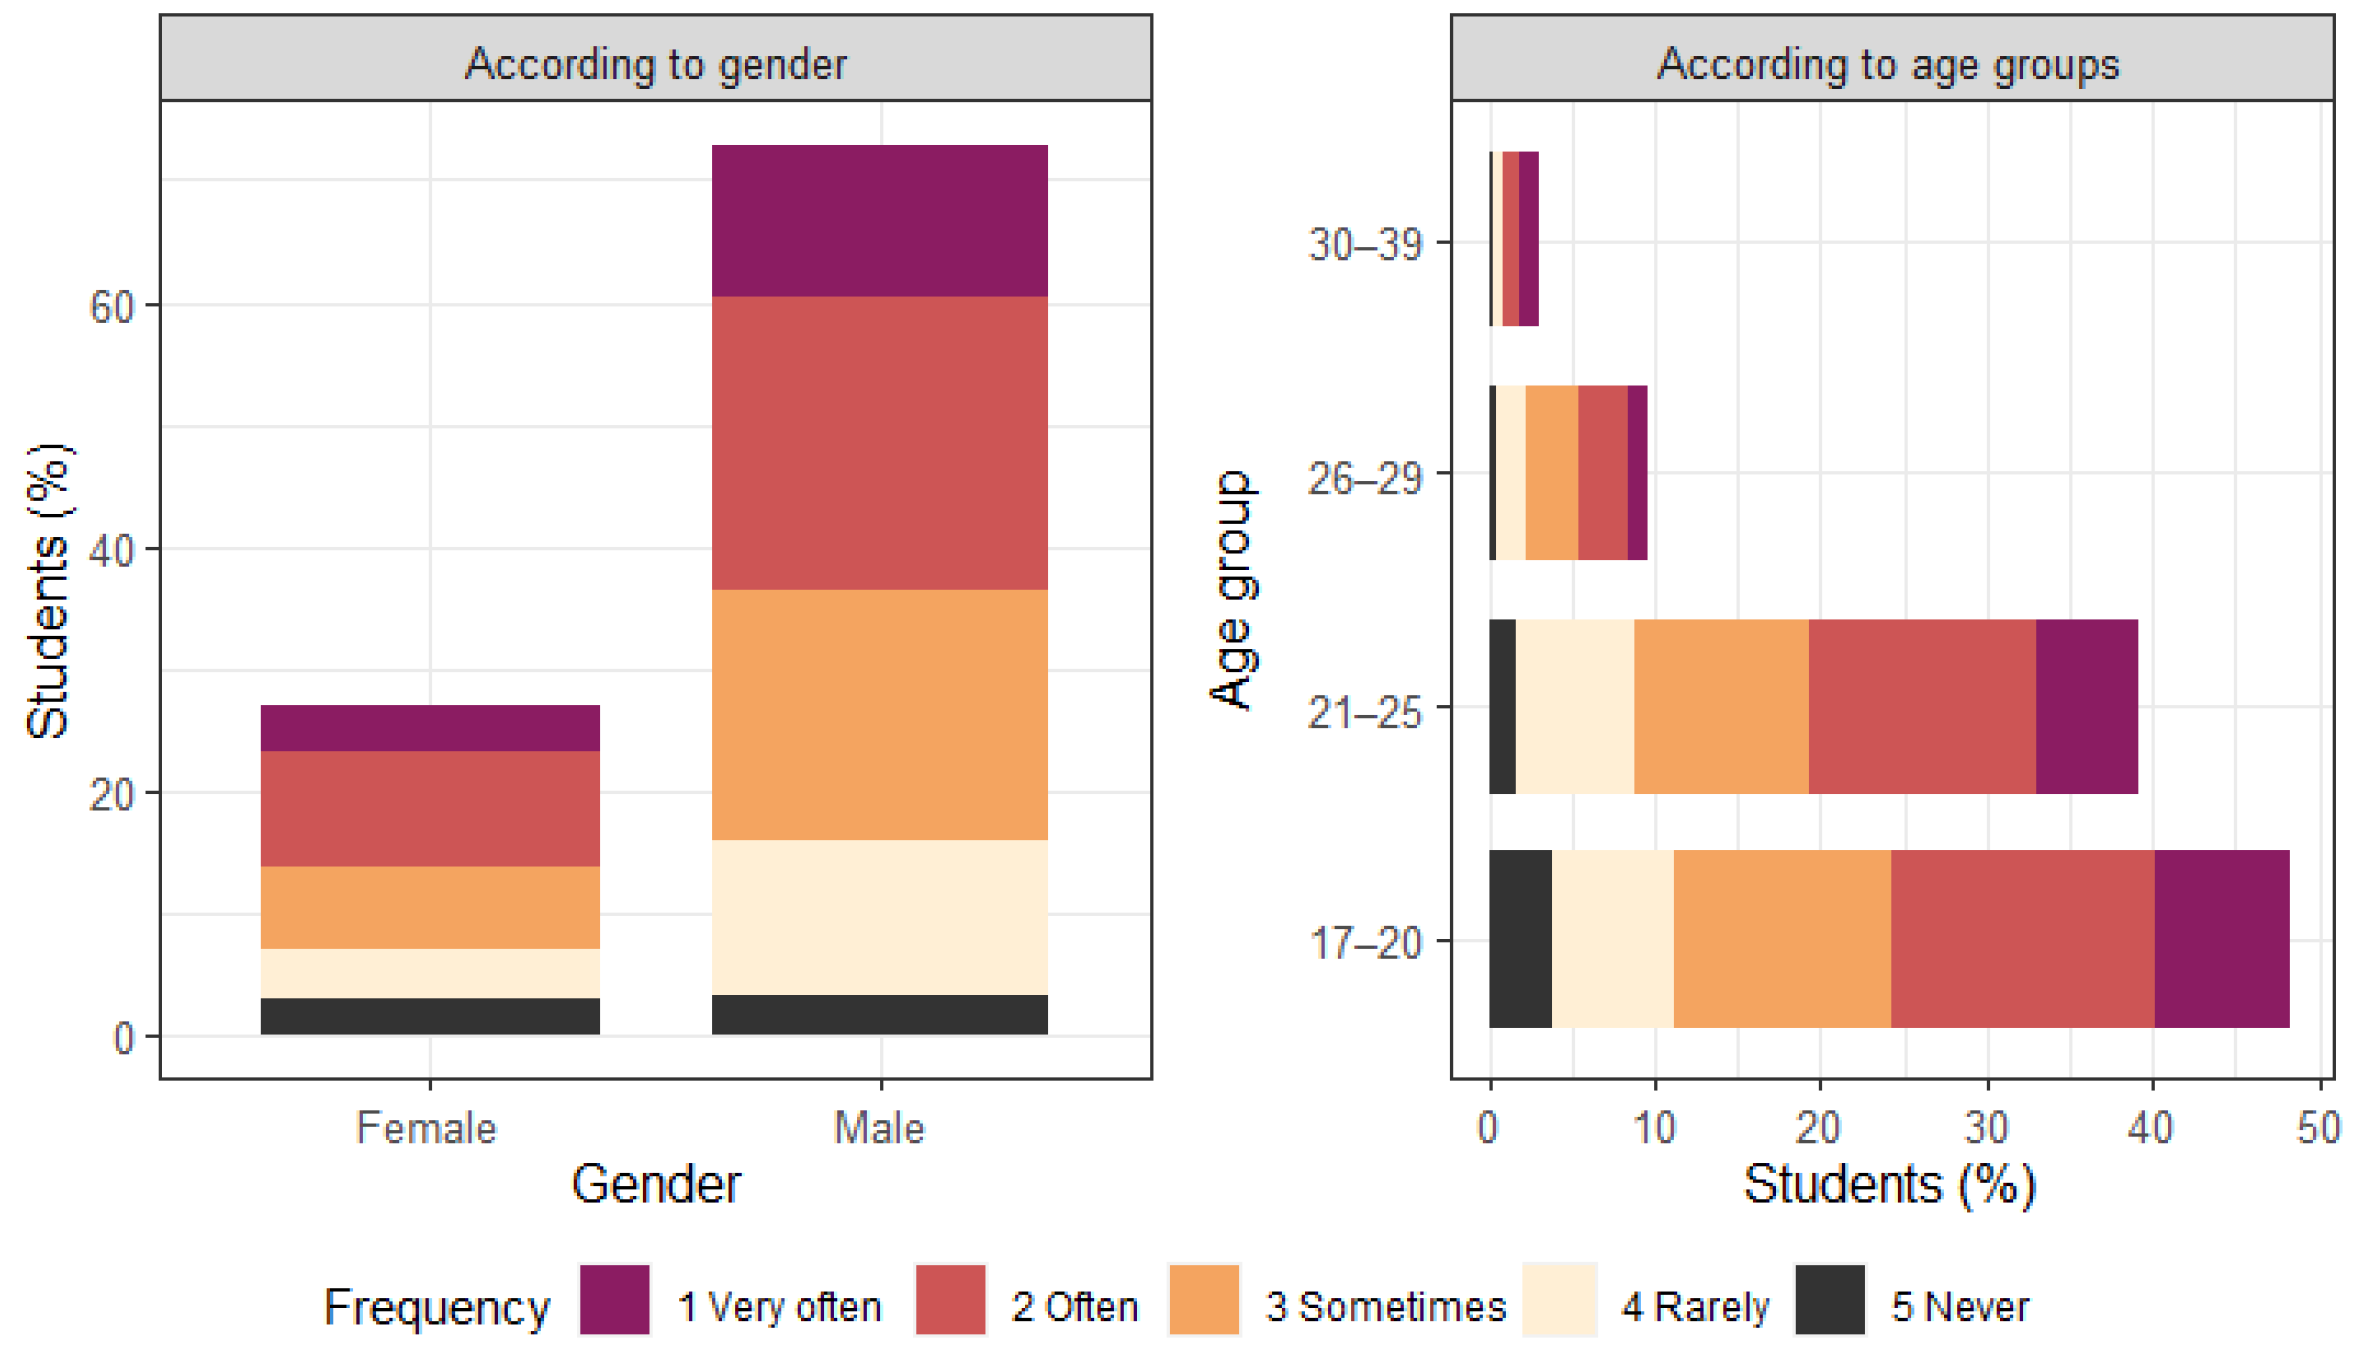
Regarding how frequently students would use green areas watered with treated greywater (Figure 11), men responded Very often 12.57%, Often 24.04%, Sometimes 20.49%, Rarely 12.57%, and Never 3.28%. Women said Very often 3.83%, Often 9.56%, Sometimes 6.56%, Rarely 4.10%, and Never 3.00%. Therefore, most men and women show the propensity to use or sit in green areas that have been irrigated with treated greywater. Only 15.84% of men and 7.10% of women would not be willing to use or sit in green areas that have been irrigated with treated greywater. This means that 77.05% of students show a willingness to reuse treated greywater to water green areas.
According to the age range analysis (Figure 11), the most selected answers were Often (15.87%) in the age range between 17 and 20 years, followed by the same response at 13.66% in the age range between 21 and 25 years, and Sometimes (13.11%) in the age range between 17 and 20 years. The least chosen answer was Never (0.27%) in the age range between 30 and 39 years.
Although there are many studies, greywater reuse is still a controversial issue around the world. The perception of its reuse varies depending on education, age, socioeconomic level, gender, etc.; although the idea that its use should be limited to non-direct contact activities (toilet flushing, non-food crop irrigation, road cleaning, or construction), is a constant [46].
Thus, public acceptance is crucial to promote greywater reuse; then, it is necessary to improve the perspective efficiency of treatment systems [47]. However, the fact that greywater reuse could reduce water deficiencies makes it an alternative that is increasingly accepted by more people.

3.4. Reuse Strategies

Characterizing greywater is crucial in determining the type and complexity of treatment required. Additionally, the feasibility of its reuse depends on the quality of the greywater, which dictates whether it can be reused indoors (for toilet flushing) or outdoors [37]. It is essential not to underestimate or overlook the impact of water reuse projects on user perception, as this is a key factor for their success [41].
The development of greywater policies and guidelines assists in establishing its reuse as a national priority and provides decision-making criteria for its implementation [80]. Australia was one of the first countries that developed guidelines for greywater management as a remediation of freshwater shortages [83]. Australian standards cover the implementation of devices for diverting greywater, as well as greywater treatment and reuse systems [84]. Likewise, the United States of America has state-based policies for greywater use founded on the ANSI and NSF standards for on-site greywater treatment and reuse [83]. NSF/ANSI 350 focuses on non-potable uses of greywater for toilet flushing and irrigation. In South America, Brazil has developed the Association of Technical Standards, NBR 13.969/97 [85], for the reuse and management of greywater considering the use of rinse water from laundry (with or without treatment) for toilet flushing [86].
In Peru, the situation is markedly different, as there has been little progress in greywater reuse policies due to the complexity of implementation in existing buildings, leading to a lack of guidelines and standards for greywater reuse. This poses a development constraint in hyper-arid regions like Tacna, which face water scarcity and climatological crises.
When evaluating the feasibility of greywater reuse systems, in addition to operational and maintenance costs, it is essential to consider who bears the costs and who benefits from greywater reuse [47]. Therefore, further research is necessary to determine the feasibility of developing a greywater reuse network in the study building.

3.4.1. Toilet Flushing Water Consumption

The frequency of restroom usage by students in an 8 h day was determined through the questionnaires (Figure 12). Subsequently, the average restroom usage by students at the university was calculated based on gender (Table 8). Despite differences in water consumption patterns between females and males [38], it is evident that both genders use the restrooms almost equally frequently, with males using them an average of 2.51 times per day and females 2.74 times per day.
The frequency of restroom usage obtained using the questionnaires is very similar to the one stated by the EPA [87,88]. According to their report, female occupants of institutional buildings use the toilet an average of three times per day, while male occupants use the urinal an average of two times per day.
The number of students using the restrooms was obtained through gauging. Furthermore, knowing the usage of the restrooms and the sanitary fixture water consumption, the total water demand for toilet/urinal flushing was calculated as 3368.34 L/d (Table 9).

3.4.2. Green Roof and Garden Watering Consumption

The rooftop of the study building has already implemented five areas for green roof growth at 25 m2 each (Figure 13). Therefore, it has the pipes and valves required. On the other hand, around the civil engineering school building, the garden area is small and is mainly composed of grass. Thus, the total water demand for watering the green roof is 337.5 L/d, and for watering the garden it is 719.66 L/d (Table 10).

3.4.3. Water Saving

Due to the university’s location (hyper-arid region) and the current challenges brought by climate change, most buildings need to focus on implementing water conservation policies so they can satisfy the green building criteria [38].
Table 11 shows the three activities this study proposes to reuse greywater, such as toilet flushing, green roof watering, and garden watering. Those three activities were chosen because they do not require high-quality water, and they are also common activities in the study building.
The feasibility of irrigating the entire existing green roof and garden areas using only the greywater generated in the students’ hand basins has been demonstrated.
Regarding toilet flushing, 12.67% of potable water can be saved. This percentage is close to the one obtained by [39], who stated that 14.01% of potable water could be saved by reusing greywater from taps with aerators and drinking fountains for low-pressure toilet flushing. Furthermore, water saving would increase if dual-flushing system toilets were installed due to the possibility of using half of the discharge when it is only liquid waste.
Although the potential for saving potable water through greywater reuse has been demonstrated, the possibility of its implementation is reduced since it is an already constructed building. This is because the drainage system is combined, and substantial changes would be required in the building, leading to the breaking of floors and walls. Additionally, a more detailed study of the available area for the installation of the greywater treatment plant would be necessary.
Finally, policies focused on ensuring that future constructions in Peru incorporate greywater recycling systems from the planning phase must be implemented, especially in areas with intense water scarcity, such as Tacna. Alternatively, if necessary, regional standards and guidelines should be implemented, as performed in other countries that lack national regulations but have local-level regulations [83].

4. Conclusions

Greywater reuse is a sustainable alternative to cope with one of the most important worldwide issues, water scarcity, especially in hyper-arid regions. Recovering and reusing greywater helps regulate the demand for potable water. To implement this in a university building, it is crucial to quantify the amount of greywater generated, characterize its quality, and assess its acceptance for reuse among the students (users). This study provides the necessary data to initiate a detailed examination of the feasibility and viability of installing a greywater reuse network in the Engineering School Building of Tacna’s Private University.
The volume of greywater generated in the building is 426.85 L per day, which is sufficient to irrigate the surrounding green areas or existing green roofs. If greywater were reused for toilet flushing, it could result in a 12.67% saving of potable water.
To select an adequate greywater treatment system, it is fundamental to know first the quality of the raw greywater. The analysis conducted shows that the characteristics exhibited by greywater depend significantly on the water source, as well as the habits of individuals when using hand basins. Considering that Peru is a developing country, water consumption is lower, leading to variations in the parameters analyzed, and at the same time, microbiological levels may increase. When considering only the use of greywater from hand basins, it contains a lower amount of organic matter and fewer bacteria compared to greywater from sources, such as the kitchen and showers, making it more feasible to carry out simpler treatments on greywater. Similarly, more thorough studies are required to determine the presence of certain medically significant coliform species, such as E. coli, as well as the implications that greywater reuse may have regarding SARS-CoV-2, which could have negative consequences for human health. Also, considering that Peru does not have any greywater policy, the reuse of greywater needs to meet international guides and standards. Therefore, this constitutes a preliminary step towards proper management of greywater, considering its production and collection, ultimately aiming to find an optimal treatment for reuse.
According to the students’ questionnaires, 77.05% show willingness to reuse treated greywater to water green areas. Knowing students’ greywater reuse perception and acceptance is crucial for the implementation to succeed.
To implement the proposed reuse strategies outlined in this manuscript, it is necessary to conduct further detailed research. This research would involve analyzing the existing drainage networks to assess the modifications required to separate greywater from blackwater throughout the building. Additionally, it will be necessary to determine the availability of areas for the installation of the greywater treatment plant, which would also need to be designed in more detail in subsequent research.
Considering that greywater quantity, quality, and reuse acceptance could vary due to many different factors, more research is needed in educational buildings, especially in arid regions, where greywater reuse could play an important role as an alternative source of water. Finally, it is necessary to develop policies that secure water resource sustainability in the short and long term, especially regarding greywater reuse; thus, solid legislation should promote greywater reuse in new buildings and in those that undergo major rehabilitation.

Author Contributions

Conceptualization, T.L.-A. and A.C.-B.; methodology, T.L.-A., A.C.-B. and N.M.-Y.; software, A.C.-B.; validation, S.C., E.P.-V. and B.V.-B.; formal analysis, T.L.-A., A.C.-B. and N.M.-Y.; investigation, T.L.-A., A.C.-B. and N.M.-Y.; resources, E.P.-V. and B.V.-B.; data curation, T.L.-A., A.C.-B. and N.M.-Y.; writing—original draft preparation, T.L.-A., A.C.-B. and N.M.-Y.; writing—review and editing, A.C.-B. and S.C.; visualization, A.C.-B.; supervision, S.C., E.P.-V. and B.V.-B.; project administration, T.L.-A.; funding acquisition, T.L.-A. and E.P.-V. All authors have read and agreed to the published version of the manuscript.

Funding

This research was funded by Tacna’s Private University and the APC was funded by the research project “Study of Hydraulic Recharge and Salinization Processes in the Caplina Aquifer, Tacna, Peru, for a Sustainable Management of Groundwater” at Jorge Basadre Grohmann National University.

Institutional Review Board Statement

Ethical review and approval were waived for this study due to the anonymity of the questionnaires.

Informed Consent Statement

Informed consent was obtained from all subjects involved in the study anonymously.

Data Availability Statement

The raw data supporting the conclusions of this article will be made available by the authors upon request.

Acknowledgments

The authors thank the Engineering and Sustainability Research Group (Tacna’s Private University) formed by students Rosemary Alexandra Sardón Calizaya, Jhonatan Mamani Sanizo, Luis David Mamani Quispe, Jaime Eduardo Quispe Chambe, Rafael Jesús Valdez Apaza, and Cassandra Cavagnaro Contreras who recorded daily hand basin water consumption and collected some questionnaires.

Conflicts of Interest

The authors declare no conflicts of interest.

Abbreviations

ANSIAmerican National Standards Institute
APHAAmerican Public Health Association
ASTMAmerican Society for Testing and Materials
AWWAAmerican Water Works Association
BOD5Biochemical oxygen demand
CFUColony-forming unit
CO2Carbon dioxide
CODChemical oxygen demand
DODissolved oxygen
ECElectrical conductivity
EPAUnited States Environmental Protection Agency
FAOFood and Agriculture Organization of the United Nations
H2OWater
MCMMillion cubic meters
MPNMost Probable Number
NSFNational Science Foundation
NTUNephelometric Turbidity Unit
pHPotential of hydrogen
PO4-PPhosphate–phosphorus
ppmParts per million
SMEWWStandard Methods for the Examination of Water and Wastewater
TOCTotal organic carbon
TSSTotal suspended solids
WEFWater Environment Federation
WHOWorld Health Organization
μSMicro-siemens

References

  1. Filali, H.; Barsan, N.; Souguir, D.; Nedeff, V.; Tomozei, C.; Hachicha, M. Greywater as an Alternative Solution for a Sustainable Management of Water Resources—A Review. Sustainability 2022, 14, 665. [Google Scholar] [CrossRef]
  2. Khosrowshahi Asl, S.; Cushing, K.; O’Malley, R.; Dahl, A.; Rouhani, A.; Bryan, S.; Burks, J. A Field Assessment of Residential Laundry to Landscape Greywater Quality in the San Francisco Bay Area. Water Policy 2023, 25, 759–779. [Google Scholar] [CrossRef]
  3. Madhuranthakam, C.M.R.; AbuZaid, M.; Chaalal, O.; Ghannam, T. Sustainable Water Management with Design and Economic Evaluation of Recycling Greywater at Abu Dhabi University—A Case Study on Decentralization. Sustainability 2023, 15, 16208. [Google Scholar] [CrossRef]
  4. Mundial, B. Perú: Acciones Estratégicas Para La Seguridad Hídrica. In Diagnóstico de Seguridad Hídrica; Banco Mundial: Washington, DC, USA, 2023. [Google Scholar]
  5. UNICEF. Available online: https://data.unicef.org/topic/water-and-sanitation/wash-in-schools/ (accessed on 4 January 2024).
  6. Chucuya, S.; Vera, A.; Pino-Vargas, E.; Steenken, A.; Mahlknecht, J.; Montalván, I. Hydrogeochemical Characterization and Identification of Factors Influencing Groundwater Quality in Coastal Aquifers, Case: La Yarada, Tacna, Peru. Int. J. Environ. Res. Public Health 2022, 19, 2815. [Google Scholar] [CrossRef] [PubMed]
  7. Pocco, V.; Chucuya, S.; Huayna, G.; Ingol-Blanco, E.; Pino-Vargas, E. A Multi-Criteria Decision-Making Technique Using Remote Sensors to Evaluate the Potential of Groundwater in the Arid Zone Basin of the Atacama Desert. Water 2023, 15, 1344. [Google Scholar] [CrossRef]
  8. Pino-Vargas, E.; Chávarri-Velarde, E. Evidencias de Cambio Climático En La Región Hiperárida de La Costa Sur de Perú, Cabecera Del Desierto de Atacama. Tecnol. Cienc. Agua 2022, 13, 333–376. [Google Scholar] [CrossRef]
  9. Pino-Vargas, E.; Espinoza-Molina, J.; Chávarri-Velarde, E.; Quille-Mamani, J.; Ingol-Blanco, E. Impacts of Groundwater Management Policies in the Caplina Aquifer, Atacama Desert. Water 2023, 15, 2610. [Google Scholar] [CrossRef]
  10. ANA. Plan de Gestión de Los Recursos Hídricos de La Cuenca Caplina Locumba 2023; ANA: Tacna, Peru, 2023. [Google Scholar]
  11. Tapsuwan, S.; Peña-Arancibia, J.L.; Lazarow, N.; Albisetti, M.; Zheng, H.; Rojas, R.; Torres-Alferez, V.; Chiew, F.H.S.; Hopkins, R.; Penton, D.J. A Benefit Cost Analysis of Strategic and Operational Management Options for Water Management in Hyper-Arid Southern Peru. Agric. Water Manag. 2022, 265, 107518. [Google Scholar] [CrossRef]
  12. Pino, V.E. Conflictos Por El Uso Del Agua En Una Región Árida: Caso Tacna, Peru. Diálogo Andin. 2021, 65, 405–415. [Google Scholar] [CrossRef]
  13. Chrispim, M.C.; Nolasco, M.A. Greywater Treatment Using a Moving Bed Biofilm Reactor at a University Campus in Brazil. J. Clean. Prod. 2017, 142, 290–296. [Google Scholar] [CrossRef]
  14. Gyapong-Korsah, B.; Duku, G.A.; Appiah-Effah, E.; Boakye, K.; Dwumfour-Asare, B.; Essandoh, H.M.K.; Nyarko, K.B. Greywater Generation and Reuse among Residents of Low-Income Urban Settlements in the Oforikrom Municipal Assembly, Ghana. J. Water Sanit. Hyg. Dev. 2023, 13, 551–565. [Google Scholar] [CrossRef]
  15. Leiva, E.; Rodríguez, C.; Sánchez, R.; Serrano, J. Light or Dark Greywater for Water Reuse? Economic Assessment of On-Site Greywater Treatment Systems in Rural Areas. Water 2021, 13, 3637. [Google Scholar] [CrossRef]
  16. Pradhan, S.; Al-Ghamdi, S.G.; Mackey, H.R. Greywater Recycling in Buildings Using Living Walls and Green Roofs: A Review of the Applicability and Challenges. Sci. Total Environ. 2019, 652, 330–344. [Google Scholar] [CrossRef]
  17. Albalawneh, A.; Chang, T.-K. Review of the Greywater and Proposed Greywater Recycling Scheme for Agricultural Irrigation Reuses. Int. J. Res. Granthaalayah 2015, 3, 16–35. [Google Scholar] [CrossRef]
  18. Anangadan, S.M.; Pradhan, S.; Saththasivam, J.; McKay, G.; Mackey, H.R. Evaluation of Greywater as a Sustainable Source of Irrigation for Ornamental Crops in Green Walls—A Study of Plant and Soil Using Ruellia Tuberosa. Sustainability 2024, 16, 1183. [Google Scholar] [CrossRef]
  19. Christova-Boal, D.; Eden, R.E.; McFarlane, S. An Investigation into Greywater Reuse for Urban Residential Properties. Desalination 1996, 106, 391–397. [Google Scholar] [CrossRef]
  20. Oteng-Peprah, M.; Acheampong, M.A.; deVries, N.K. Greywater Characteristics, Treatment Systems, Reuse Strategies and User Perception—A Review. Water Air Soil Pollut. 2018, 229, 255. [Google Scholar] [CrossRef] [PubMed]
  21. Rosa, G.; Ghisi, E. Water Quality and Financial Analysis of a System Combining Rainwater and Greywater in a House. Water 2021, 13, 930. [Google Scholar] [CrossRef]
  22. Suárez López, J.; Jácome Burgos, A.; Del Río Cambeses, H.; Torres Sánchez, D.; Ures Rodríguez, P. El Reciclaje de Aguas Grises Como Complemento a Las Estrategias de Gestión Sostenible Del Agua En El Medio Rural. In Río Mandeo, Cuenca Fluvial y Desarrollo Sostenible; 2012; pp. 265–284. ISBN 978-84-9812-174-2. Available online: www.geama.org/sanitaria/index (accessed on 4 January 2024).
  23. Al-Hamaiedeh, H.; Bino, M. Effect of Treated Grey Water Reuse in Irrigation on Soil and Plants. Desalination 2010, 256, 115–119. [Google Scholar] [CrossRef]
  24. Al-Jayyousi, O.R. Greywater Reuse: Towards Sustainable Water Management. Desalination 2003, 156, 181–192. [Google Scholar] [CrossRef]
  25. Assayed, A.K.; Dalahmeh, S.S.; Suleiman, W.T. Onsite Greywater Treatment Using Septic Tank Followed by Intermittent Sand Filter-A Case Study of Abu Al Farth Village in Jordan. Int. J. Chem. Environ. Eng. 2010, 1, 1–5. [Google Scholar]
  26. Halalsheh, M.; Dalahmeh, S.; Sayed, M.; Suleiman, W.; Shareef, M.; Mansour, M.; Safi, M. Grey Water Characteristics and Treatment Options for Rural Areas in Jordan. Bioresour. Technol. 2008, 99, 6635–6641. [Google Scholar] [CrossRef] [PubMed]
  27. Oh, K.S.; Leong, J.Y.C.; Poh, P.E.; Chong, M.N.; Lau, E. Von A Review of Greywater Recycling Related Issues: Challenges and Future Prospects in Malaysia. J. Clean. Prod. 2018, 171, 17–29. [Google Scholar] [CrossRef]
  28. Lambert, L.A.; Lee, J. Nudging Greywater Acceptability in a Muslim Country: Comparisons of Different Greywater Reuse Framings in Qatar. Environ. Sci. Policy 2018, 89, 93–99. [Google Scholar] [CrossRef]
  29. Khajvand, M.; Mostafazadeh, A.K.; Drogui, P.; Tyagi, R.D. Management of Greywater: Environmental Impact, Treatment, Resource Recovery, Water Recycling, and Decentralization. Water Sci. Technol. 2022, 86, 909–937. [Google Scholar] [CrossRef] [PubMed]
  30. Lazarova, V.; Hills, S.; Birks, R. Using Recycled Water for Non-Potable, Urban Uses: A Review with Particular Reference to Toilet Flushing. Water Sci. Technol. Water Supply 2003, 3, 69–77. [Google Scholar] [CrossRef]
  31. Mourad, K.A.; Berndtsson, J.C.; Berndtsson, R. Potential Fresh Water Saving Using Greywater in Toilet Flushing in Syria. J. Environ. Manag. 2011, 92, 2447–2453. [Google Scholar] [CrossRef] [PubMed]
  32. Niwagaba, C.B.; Dinno, P.; Wamala, I.; Dalahmeh, S.S.; Lalander, C.; Jönsson, H. Experiences on the Implementation of a Pilot Grey Water Treatment and Reuse Based System at a Household in the Slum of Kyebando-Kisalosalo, Kampala. J. Water Reuse Desalination 2014, 4, 294–307. [Google Scholar] [CrossRef]
  33. Shaikh, I.N.; Ahammed, M.M. Quantity and Quality Characteristics of Greywater: A Review. J. Environ. Manag. 2020, 261, 110266. [Google Scholar] [CrossRef]
  34. Vuppaladadiyam, A.K.; Merayo, N.; Prinsen, P.; Luque, R.; Blanco, A.; Zhao, M. A Review on Greywater Reuse: Quality, Risks, Barriers and Global Scenarios. Rev. Environ. Sci. Biotechnol. 2019, 18, 77–99. [Google Scholar] [CrossRef]
  35. Patil, P.D.; Bhange, V.P.; Shende, S.S.; Ghorpade, P.S. Greywater Characterization of an Indian Household and Potential Treatment for Reuse. Water Energy Nexus 2022, 5, 1–7. [Google Scholar] [CrossRef]
  36. Vakil, K.A.; Sharma, M.K.; Bhatia, A.; Kazmi, A.A.; Sarkar, S. Characterization of Greywater in an Indian Middle-Class Household and Investigation of Physicochemical Treatment Using Electrocoagulation. Sep. Purif. Technol. 2014, 130, 160–166. [Google Scholar] [CrossRef]
  37. Alsulaili, A.D.; Hamoda, M.F. Quantification and Characterization of Greywater from Schools. Water Sci. Technol. 2015, 72, 1973–1980. [Google Scholar] [CrossRef] [PubMed]
  38. Talpur, B.D.; Ullah, A.; Ahmed, S. Water Consumption Pattern and Conservation Measures in Academic Building: A Case Study of Jamshoro Pakistan. SN Appl. Sci. 2020, 2, 1781. [Google Scholar] [CrossRef]
  39. da Silva, L.C.C.; Filho, D.O.; Silva, I.R.; Pinto, A.C.V.E.; Vaz, P.N. Water Sustainability Potential in a University Building—Case Study. Sustain. Cities Soc. 2019, 47, 101489. [Google Scholar] [CrossRef]
  40. Rodríguez, C.; Sánchez, R.; Lozano-Parra, J.; Rebolledo, N.; Schneider, N.; Serrano, J.; Leiva, E. Water Balance Assessment in Schools and Households of Rural Areas of Coquimbo Region, North-Central Chile: Potential for Greywater Reuse. Water 2020, 12, 2915. [Google Scholar] [CrossRef]
  41. Ilemobade, A.; Olanrewaju, O.; Griffioen, M. Greywater Reuse for Toilet Flushing at a University Academic and Residential Building. Water SA 2013, 39, 351–360. [Google Scholar] [CrossRef]
  42. Yoshikawa, N.; Shimizu, T.; Amano, K.; Nakajima, J. Evaluation of Greywater Reclamation and Reuse System in a Japanese University Building. J. Asia Jpn. Res. Inst. Ritsumeikan Univ. 2019, 1, 44–55. [Google Scholar] [CrossRef]
  43. Taemthong, W.; Phenphon, P. Grey Water Recycle System for a University Building: A Case Study in Thailand. Int. J. Environ. Sci. Dev. 2017, 8, 421–424. [Google Scholar] [CrossRef]
  44. National Environmental Engineering Research Institute. Greywater Reuse in Rural Schools Wise Water Management; National Environmental Engineering Research Institute: Nagpur, India, 2007. [Google Scholar]
  45. Nandana, A.B.; Rahmatika, I.; Pratama, M.A. Quality of Greywater Based on Economic Class and Generation Time (A Case Study of Ciliwung Watershed, Indonesia). E3S Web Conf. 2023, 422, 04001. [Google Scholar] [CrossRef]
  46. Al-Khatib, I.A.; Shami, A.A.H.U.A.; Garcia, G.R.; Celik, I. Social Acceptance of Greywater Reuse in Rural Areas. J. Environ. Public Health 2022, 2022, 11. [Google Scholar] [CrossRef]
  47. Tayara, A.; Shanableh, A.; Atieh, M.A.; Abdallah, M.; Battacharjee, S.; Mustafa, A.; Bardan, M. Al Feasibility and Impact of Greywater Recycling in Four Types of Buildings in Sharjah, United Arab Emirates. IOP Conf. Ser. Earth Environ. Sci. 2021, 725, 012009. [Google Scholar] [CrossRef]
  48. Hyde, K.; Smith, M.J.; Adeyeye, K. Developments in the Quality of Treated Greywater Supplies for Buildings, and Associated User Perception and Acceptance. Int. J. Low Carbon Technol. 2016, 12, 136–140. [Google Scholar] [CrossRef]
  49. Maraqa, M.A.; Ghoudi, K. Public Perception of Water Conservation, Reclamation and Greywater Use in the United Arab Emirates. Int. Proc. Chem. Biol. Environ. Eng. 2015, 91, 24–30. [Google Scholar]
  50. INACAL Water Meters for Cold Potable Water and Hot Water. Norma Metrológica Peruana NMP 005-1:2018 2018, 1. Available online: https://members.wto.org/crnattachments/2019/TBT/PER/19_7177_01_s.pdf (accessed on 4 January 2024).
  51. WHO. Overview of Greywater Management Health Considerations Discussed and Approved at the Regional Consultation on National Priorities and Plans of Action on Management and Reuse of Wastewater; WHO: Amman, Jordan, 2006. [Google Scholar]
  52. WHO. A Compendium of Standards for Wastewater Reuse in the Eastern Mediterranean Region; WHO: Geneva, Switzerland, 2006. [Google Scholar]
  53. EPA. 2012 Guidelines for Water Reuse; EPA: Washington, DC, USA, 2012. [Google Scholar]
  54. ASTM. American Society for Testing and Materials 2022 Annual Book of ASTM Standards; ASTM: West Conshohocken, PA, USA, 2022; Volume 4, p. 12. [Google Scholar]
  55. Lipps, W.C.; Burton, E.; Baxter, T. Standard Methods for the Examination of Water and Wastewater, 24th ed.; American Waterworks Association: Washington, DC, USA, 2023. [Google Scholar]
  56. US EPA Method 300.0 Determination of Inorganic Anions by Ion Chromatography 1993. Available online: https://www.epa.gov/sites/default/files/2015-08/documents/method_300-0_rev_2-1_1993.pdf (accessed on 4 January 2024).
  57. US EPA Method 200.8: Determination of Trace Elements in Waters and Wastes by Inductively Coupled Plasma-Mass Spectrometry 1994. Available online: https://scholar.google.co.uk/scholar?hl=zh-TW&as_sdt=0%2C5&q=US+EPA+Method+200.8%3A+Determination+of+Trace+Elements+in+Waters+and+Wastes+by+Inductively+Coupled+Plasma-Mass+Spec-trometry+1994&btnG= (accessed on 4 January 2024).
  58. Mihalakakou, G.; Souliotis, M.; Papadaki, M.; Menounou, P.; Dimopoulos, P.; Kolokotsa, D.; Paravantis, J.A.; Tsangrassoulis, A.; Panaras, G.; Giannakopoulos, E.; et al. Green Roofs as a Nature-Based Solution for Improving Urban Sustainability: Progress and Perspectives. Renew. Sustain. Energy Rev. 2023, 180, 113306. [Google Scholar] [CrossRef]
  59. Pirouz, B.; Palermo, S.A.; Turco, M. Improving the Efficiency of Green Roofs Using Atmospheric Water Harvesting Systems (An Innovative Design). Water 2021, 13, 546. [Google Scholar] [CrossRef]
  60. Ministerio de Vivienda, Construcción y Saneamiento. Sanitation Chapter; Ministerio de Vivienda, Construcción y Saneamiento: Lima, Peru, 2006. [Google Scholar]
  61. Subramanian, P.S.G.; Raj, A.V.; Jamwal, P.; Connelly, S.; Yeluripati, J.; Richards, S.; Ellis, R.; Rao, L. Decentralized Treatment and Recycling of Greywater from a School in Rural India. J. Water Process Eng. 2020, 38, 101695. [Google Scholar] [CrossRef]
  62. Eriksson, E.; Auffarth, K.; Henze, M.; Ledin, A. Characteristics of Grey Wastewater. Urban Water 2002, 4, 85–104. [Google Scholar] [CrossRef]
  63. Dwumfour-Asare, B.; Nyarko, K.B.; Essandoh, H.M.K.; Awuah, E. Domestic Greywater Flows and Pollutant Loads: A Neighbourhood Study within a University Campus in Ghana. Sci. Afr. 2020, 9, e00489. [Google Scholar] [CrossRef]
  64. Anaya Meléndez, F.; Espinosa Descalzo, E.N.; Loayza Pérez, J.E.; Zamudio Castillo, R.A.; Yáñez López, M.A. Diseño de Un Sistema de Tratamiento de Aguas Grises Claras Para Reuso Como Agua de Regadio. Rev. Soc. Química Perú 2022, 88, 52–62. [Google Scholar] [CrossRef]
  65. Oyebode, O.J.; Waterway, O. Characterization of Wastewater and Evaluation of Recycling Technologies Using Analytical Hierarchical Process for a University Community. Nat. Environ. Pollut. Technol. 2023, 22, 355–368. [Google Scholar] [CrossRef]
  66. Leong, J.Y.C.; Chong, M.N.; Poh, P.E. Assessment of Greywater Quality and Performance of a Pilot-Scale Decentralised Hybrid Rainwater-Greywater System. J. Clean. Prod. 2018, 172, 81–91. [Google Scholar] [CrossRef]
  67. Metcalf, L.; Eddy, H.P.; Tchobanoglous, G. Wastewater Engineering: Treatment, Disposal, and Reuse; McGraw-Hill, Ed.: New York, NY, USA, 1991; Volume 4. [Google Scholar]
  68. Ardila Arias, A.N.; Reyes Calle, J.; Arriola Villaseñor, E.; Alfredo Hernández, J. Remoción fotocatalítica de DQO, DBO 5 Y COT de efluentes de la industria farmacéutica. Rev. Politécnica 2012, 8, 9–17. [Google Scholar]
  69. FAO. Water Quality for Agriculture; FAO: Rome, Italy, 1985. [Google Scholar]
  70. Ghaitidak, D.M.; Yadav, K.D. Effect of Coagulant in Greywater Treatment for Reuse: Selection of Optimal Coagulation Condition Using Analytic Hierarchy Process. Desalination Water Treat 2015, 55, 913–925. [Google Scholar] [CrossRef]
  71. Al-Husseini, T.H.; Al-Anbari, R.H.; Al-Obaidy, A.H.M.J. Greywater Environmental Management: A Review. In Proceedings of the IOP Conference Series: Earth and Environmental Science, Baghdad, Iraq & Istanbul, Turkey, 1–2 June 2016; IOP Publishing Ltd.: Bristol, UK, 2021; Volume 779. [Google Scholar]
  72. Henze, M.; Ledin, A. Types, Characteristics and Quantities of Classic, Combined Domestic Wastewaters. In Decentralized Sanitation and Reuse: Concepts, Systems and Implementation; Lens, P., Zeeman, G., Lettinga, G., Eds.; IWA Publishing: London, UK, 2001; Volume 4, pp. 59–72. [Google Scholar]
  73. Atiku, H.; Mohamed, R.; Al-Gheethi, A.; Wurochekke, A.; Kassim, A.H.M. Harvesting of Microalgae Biomass from the Phycoremediation Process of Greywater. Environ. Sci. Pollut. Res. 2016, 23, 24624–24641. [Google Scholar] [CrossRef] [PubMed]
  74. Siggins, A.; Burton, V.; Ross, C.; Lowe, H.; Horswell, J. Effects of Long-Term Greywater Disposal on Soil: A Case Study. Sci. Total Environ. 2016, 557–558, 627–635. [Google Scholar] [CrossRef] [PubMed]
  75. Smith, E.; Bani-Melhem, K. Grey Water Characterization and Treatment for Reuse in an Arid Environment. Water Sci. Technol. 2012, 66, 72–78. [Google Scholar] [CrossRef] [PubMed]
  76. Birks, R.; Hills, S. Characterisation of Indicator Organisms and Pathogens in Domestic Greywater for Recycling. Environ. Monit. Assess. 2007, 129, 61–69. [Google Scholar] [CrossRef] [PubMed]
  77. Blanky, M.; Rodríguez-Martínez, S.; Halpern, M.; Friedler, E. Legionella Pneumophila: From Potable Water to Treated Greywater; Quantification and Removal during Treatment. Sci. Total Environ. 2015, 533, 557–565. [Google Scholar] [CrossRef]
  78. Bar-Or, I.; Weil, M.; Indenbaum, V.; Bucris, E.; Bar-Ilan, D.; Elul, M.; Levi, N.; Aguvaev, I.; Cohen, Z.; Shirazi, R.; et al. Detection of SARS-CoV-2 Variants by Genomic Analysis of Wastewater Samples in Israel. Sci. Total Environ. 2021, 789, 148002. [Google Scholar] [CrossRef]
  79. Dostálková, A.; Zdeňková, K.; Bartáčková, J.; Čermáková, E.; Kapisheva, M.; Lopez Marin, M.A.; Kouba, V.; Sýkora, P.; Chmel, M.; Bartoš, O.; et al. Prevalence of SARS-CoV-2 Variants in Prague Wastewater Determined by Nanopore-Based Sequencing. Chemosphere 2024, 351, 141162. [Google Scholar] [CrossRef] [PubMed]
  80. Medema, G.; Heijnen, L.; Elsinga, G.; Italiaander, R.; Brouwer, A. Presence of SARS-Coronavirus-2 RNA in Sewage and Correlation with Reported COVID-19 Prevalence in the Early Stage of the Epidemic in The Netherlands. Environ. Sci. Technol. Lett. 2020, 7, 511–516. [Google Scholar] [CrossRef] [PubMed]
  81. Wu, F.; Zhang, J.; Xiao, A.; Gu, X.; Lee, W.L.; Armas, F.; Kauffman, K.; Hanage, W.; Matus, M.; Ghaeli, N.; et al. SARS-CoV-2 Titers in Wastewater Are Higher than Expected from Clinically Confirmed Cases. mSystems 2020, 5, 10–1128. [Google Scholar] [CrossRef]
  82. Krogsgaard, L.W.; Benedetti, G.; Gudde, A.; Richter, S.R.; Rasmussen, L.D.; Midgley, S.E.; Qvesel, A.G.; Nauta, M.; Bahrenscheer, N.S.; von Kappelgaard, L.; et al. Results from the SARS-CoV-2 Wastewater-Based Surveillance System in Denmark, July 2021 to June 2022. Water Res. 2024, 252, 121223. [Google Scholar] [CrossRef] [PubMed]
  83. Vala, B.; Malazaa, N. Examining the Efficacy of the Legal Framework Governing the Management of Greywater in South Africa’s Informal Settlements. J. Water Health 2024, jwh2024312. [Google Scholar] [CrossRef]
  84. Noman, E.A.; Radin Mohamed, R.M.S.; Al-Gheethi, A.A.; Al-shaibani, M.M.; Al-Wrafy, F.A.; Al-Maqtari, Q.A.; Vo, D.-V.N. Antibiotics and Antibiotic-Resistant Bacteria in Greywater: Challenges of the Current Treatment Situation and Predictions of Future Scenario. Environ. Res. 2022, 212, 113380. [Google Scholar] [CrossRef]
  85. Associação Brasileira de Normas Técnicas (ABNT) Tanques Sépticos: Unidades de Tratamento Complementar e Disposição Final Dos Efluentes Líquidos. Projeto, Construção e Operação. NBR 13.969/97 1997. Available online: https://www.academia.edu/43346242/NBR_13969_Tanques_septicos_Unidades_de_tratamento_comple (accessed on 4 January 2024).
  86. Moura, P.G.; Salles, M.J.; Carvajal, E.; Jardim, R.; Sotero-Martins, A. Concepts and Classification for Water Reuse in Brazil by Different Destinations. Am. J. Eng. Res. (AJER) 2019, 8, 156–159. [Google Scholar]
  87. EPA. 3.2 Urinals. In WaterSense at Work Sanitary Fixtures and Equipment Best Management Practices for Commercial and Institutional Facilities; EPA: Washington, DC, USA, 2023; Volume 2. [Google Scholar]
  88. EPA. 3.1 Toilets (Water Closets). In WaterSense at Work Sanitary Fixtures and Equipment Best Management Practices for Commercial and Institutional Facilities; EPA: Washington, DC, USA, 2023; Volume 2. [Google Scholar]
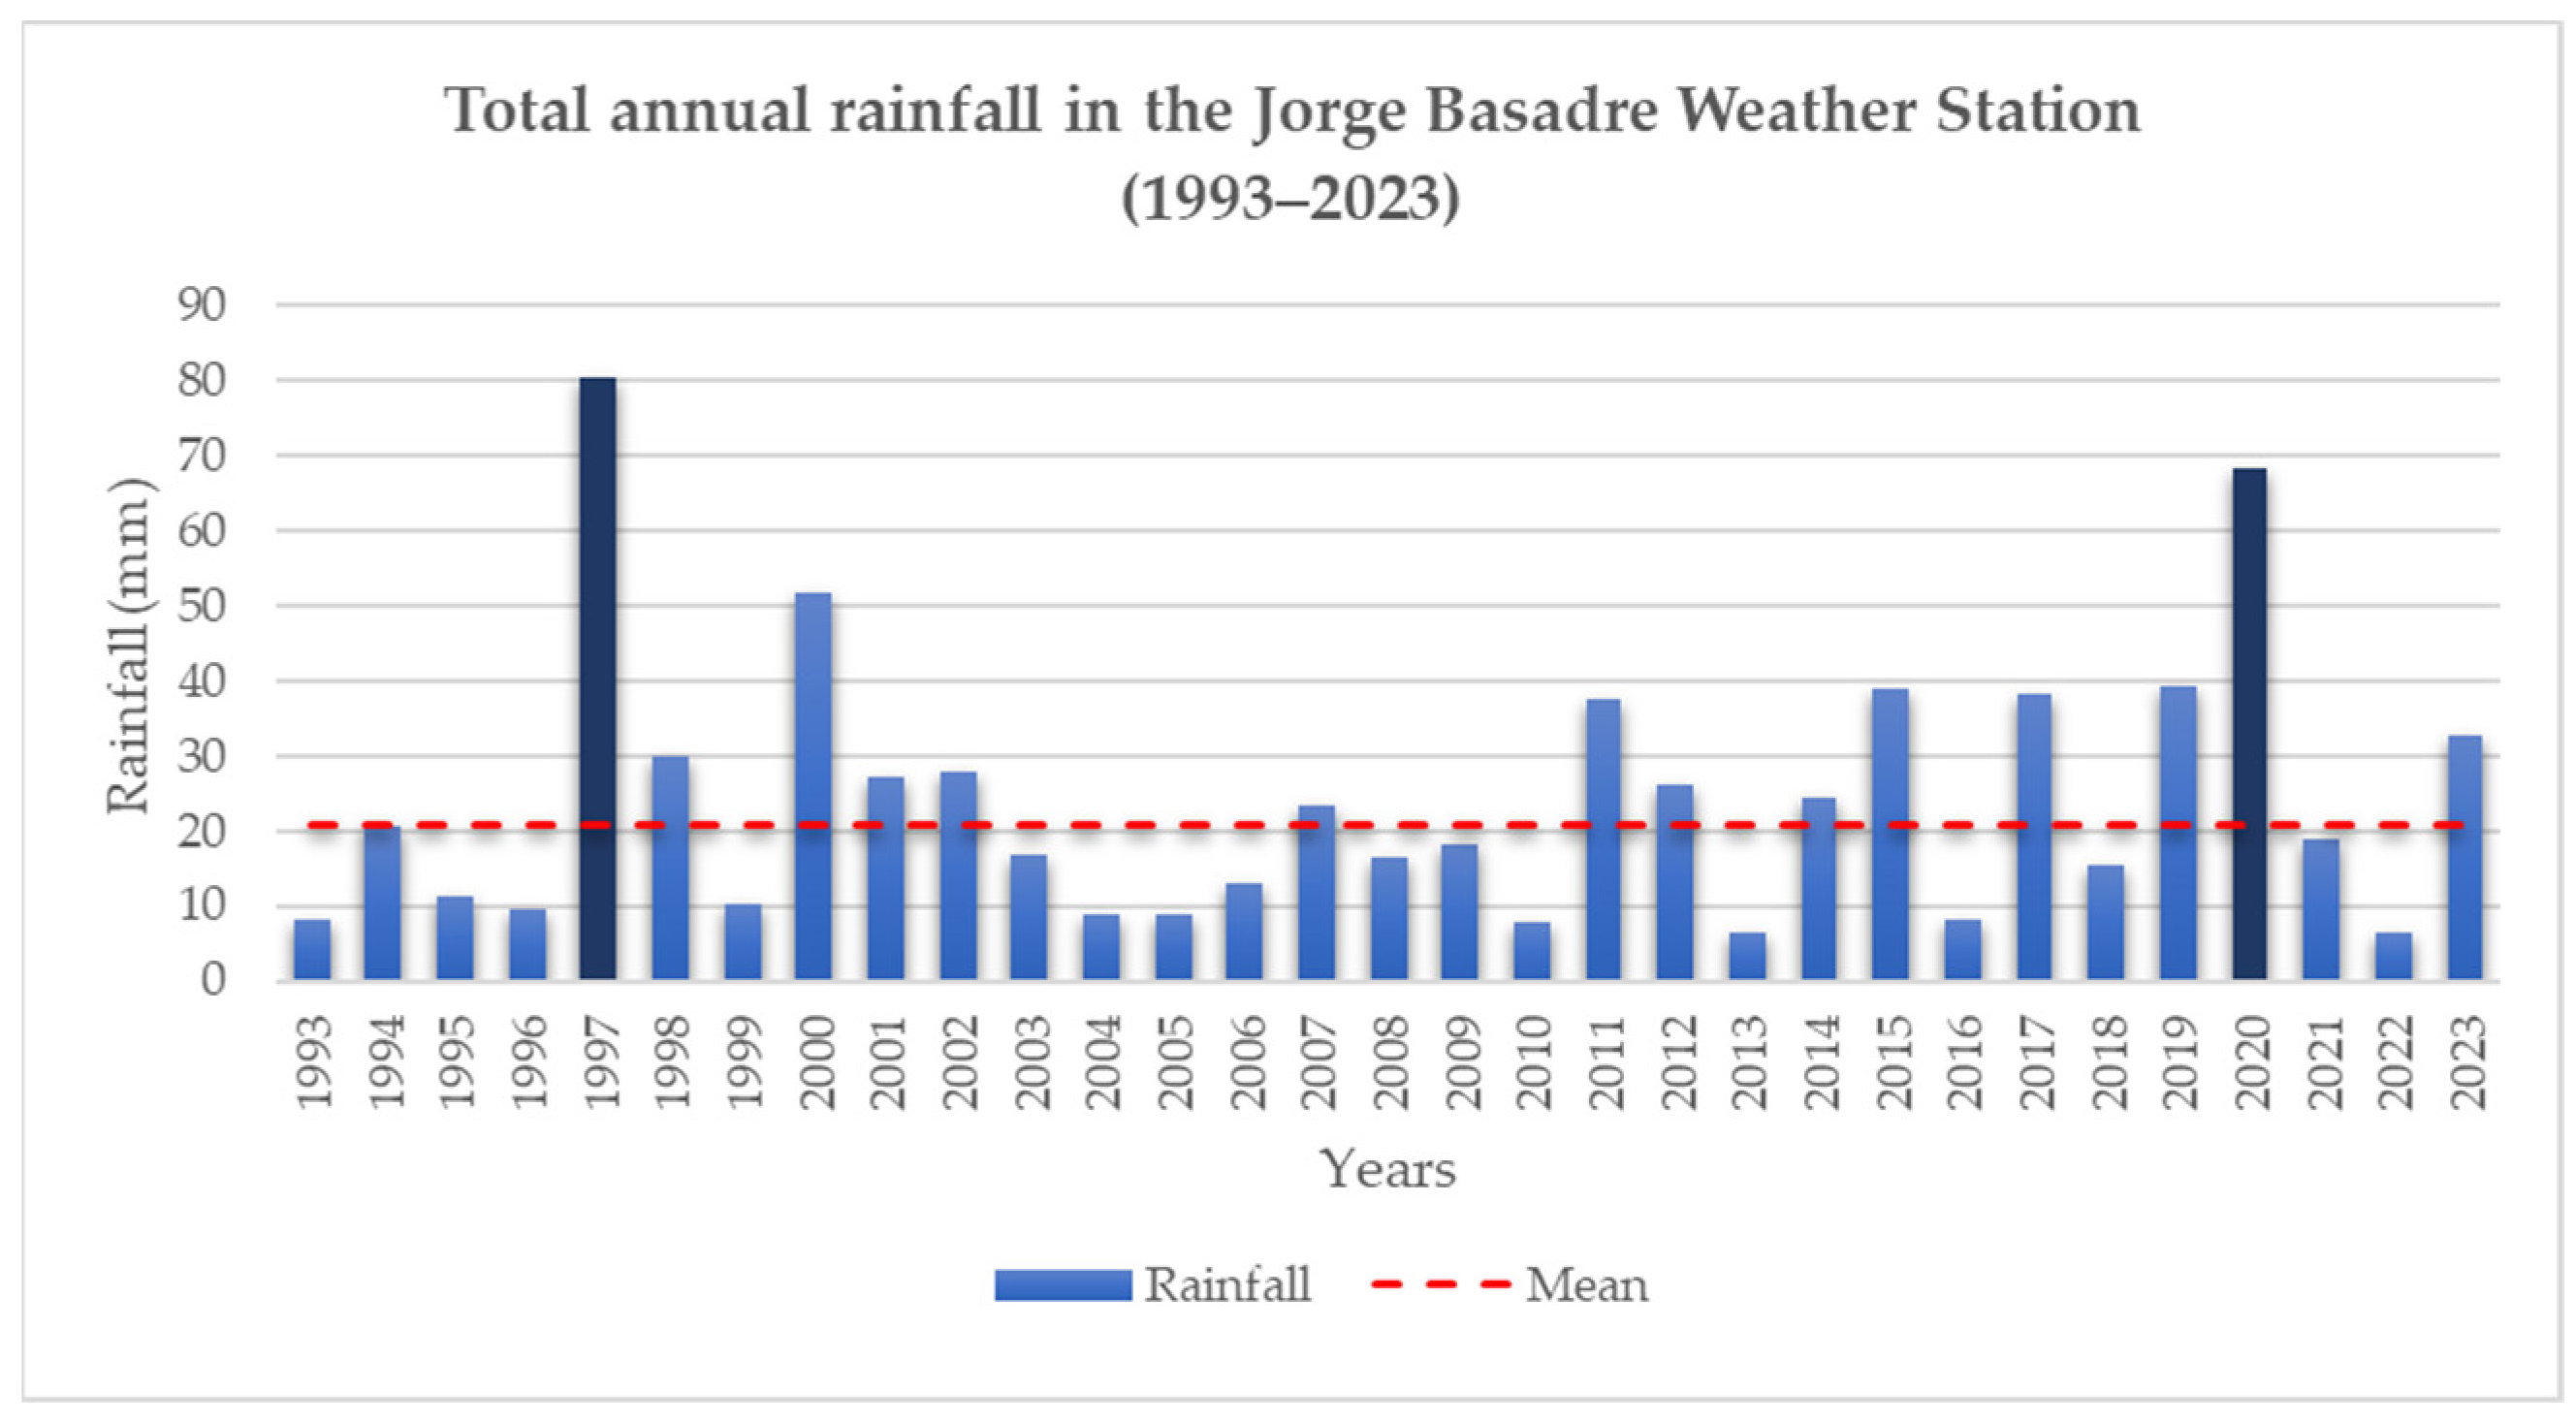
Figure 1. Location of the case study building and the Jorge Basadre Weather Station.
Sustainability 16 03088 g001
Figure 2. Historical data at Jorge Basadre Weather Station shows a mean of 31 years, excluding 1997 and 2020 due to extreme events (dark blue bars).
Sustainability 16 03088 g002
Figure 3. Sanitary fixtures of the four-story case study building. (a) Female restrooms showing toilets and hand basins. (b) Male restrooms showing toilets, urinals, and hand basins.
Sustainability 16 03088 g003
Figure 4. Flowchart of the method.
Sustainability 16 03088 g004
Figure 5. A water meter was installed in the flexible supply tube of the handbasins.
Sustainability 16 03088 g005
Figure 6. Boxplot of three-month daily handbasin water consumption in the building.
Sustainability 16 03088 g006
Figure 7. Student sample divided by age and gender.
Sustainability 16 03088 g007
Figure 8. Frequency that students save water at university.
Sustainability 16 03088 g008
Figure 9. Handwashing practices. (a) Student opinions about the need to wash their hands after using the restroom. (b) Student perception of how frequently they use soap for handwashing.
Sustainability 16 03088 g009
Figure 10. Frequency of students’ willingness to use green areas watered with untreated greywater.
Sustainability 16 03088 g010
Figure 11. Frequency of students’ willingness to use green areas watered with treated greywater.
Sustainability 16 03088 g011
Figure 12. Times a day that students use the restrooms at the university according to gender. Data were collected from questionnaires.
Sustainability 16 03088 g012
Figure 13. Green roof and garden areas at the civil engineering school.
Sustainability 16 03088 g013
Table 1. Features of the sanitary fixture installed in the study building.
Sanitary FixtureNumberWater ConsumptionFurther Description
Tap/Faucet330.35 L/cycleSelf-closing, push-tap faucet
Urinal133.8 L/flushTop siphon jet urinal
Toilet324.8 L/flushSingle flushing system
Table 2. Analyzed parameters and their testing methods.
ParameterUnitTesting Methods
Oil and greasemg/LASTM D3921-96 (Reapproved 2011) 2022. Standard Test Method for Oil and Grease and Petroleum Hydrocarbons in Water [54].
Electrical conductivity (EC)μS/cmSMEWW-APHA-AWWA-WEF Part 2510 B, 24th Ed. 2023 Conductivity. Laboratory Method [55].
Biochemical oxygen demand (BOD5)mg/LSMEWW-APHA-AWWA-WEF Part 5210 B, 24th Ed. 2023 Biochemical Oxygen Demand (BOD). 5-Day BOD test [55].
Chemical oxygen demand (COD)mg/LSMEWW-APHA-AWWA-WEF Part 5220 D, 24th Ed. 2023 Chemical Oxygen Demand, Closed Reflux, Colorimetric Method [55].
Phosphate (as phosphorus)mg/LEPA 300.0, Rev. 2.1. 1993. Determination of Inorganic Anions by Ion Chromatography [56].
Nitrate (as N)mg/LEPA 300.0, Rev. 2.1. 1993. Determination of Inorganic Anions by Ion Chromatography [56].
Nitrite (as N)mg/LEPA 300.0, Rev. 2.1. 1993. Determination of Inorganic Anions by Ion Chromatography [56].
Dissolved oxygen (DO)mg/LSMEWW-APHA-AWWA-WEF Part 4500-O-C; 24th Ed: 2023. Oxygen (Dissolved): Azide Modification [55].
Total suspended solids (TSS)mg/LSMEWW-APHA-AWWA-WEF Part 2540 D, 24th Ed. 2023 Solids. Total Suspended Solids. Dried from 103 to 105 °C [55].
TurbidityNTUSMEWW-APHA-AWWA-WEF Part 2130 B, 24th Ed. 2023 Turbidity. Nephelometric Method [55].
pH SMEWW-APHA-AWWA-WEF Part 4500-H + B, 24th Ed. 2023 pH. Electromedic Method [55].
Total Kjeldahl nitrogenmg/LSMEWW-APHA-AWWA-WEF Part 4500-Norg-B, 23rd Ed: 2017. Nitrogen (organic). Macro-Kjeldahl Method [55].
Total metalsmg/LEPA-Method 200.8 Rev. 5.4, 1994 (Validated–Modified). 2016. Determination of trace elements in water and wastes by Inductively Coupled Plasma-Mass spectrometry [57].
Heterotrophic plate countCFU/mLSMEWW-APHA-AWWA-WEF Part 9215 A, B, 24th Ed. 2023 Heterotrophic Plate Count. Pour Plate Procedure [55].
Total coliformsMNP/100 mLSMEWW-APHA-AWWA-WEF Part 9221 B, 24th Ed. 2023 Multiple-Tube
Fermentation Technique for Members of the Coliform Group. Standard Total Coliform Fermentation Technique. [55].
Fecal coliforms or thermotolerant coliformsMNP/100 mLSMEWW-APHA-AWWA-WEF Part 9221 E.1, 24th Ed. 2023 Multiple-TubeFermentation Technique for Members of the Coliform Group. Thermotolerant (Fecal) Coliform Procedure. Thermotolerant Coliform Test (EC Medium) [55].
Table 3. Greywater quantity calculation.
GenderAverage Consumption
(L/d)
Coefficient of ReturnGreywater Quantity
(L/d)
Male326.630.97316.83
Female113.430.97110.03
Total426.85
Table 4. Comparison of greywater quantity with similar research.
CountryStudy BuildingSourceOccupantsMean
Generated
Greywater
(L/d)
Methodology
Brazil [39]University buildingWater taps with aerators445427.05Literature review and equations
India [61]Primary schoolHand wash and kitchen wash sinks197667Not stated
Chile [40]Secondary schoolWashbasins136324,261Surveys regarding water usage
Kuwait [37]Secondary schoolManually open handwash3971151.3Flow meters were installed on the wash sink drains
This studyUniversity buildingSelf-closing hand basins732426.85Water meters were installed in the flexible supply tube
Table 5. Untreated greywater quality of the study building.
ParameterUnitSamplesAverage
Sample 1Sample 2Sample 3
Physical and chemical analysis
pH 6.64 ± 0.156.65 ± 0.156.73 ± 0.156.67
TurbidityNTU12.2 ± 1.015.4 ± 1.2012.6 ± 1.013.40
Electrical conductivity (EC)μS/cm817.00 ± 220.59818.00 ± 220.86820.00 ± 221.40818.33
Total suspended solids (TSS)mg/L13 ± 417 ± 521 ± 617.00
Total Kjeldahl nitrogenmg/L5565.33
Dissolved oxygen (DO)mg/L5.7 ± 1.507.5 ± 2.07.0 ± 1.806.73
Chemical oxygen demand (COD)mg/L95.0 ± 3.4097.9 ± 3.4098.8 ± 3.5097.23
Biochemical oxygen demand (BOD5)mg/L33.9 ± 2.6037.4 ± 2.6039.7 ± 2.6037.00
Oil and greasemg/L9.5 ± 0.407.4 ± 0.3013.2 ± 0.4010.03
Anions
Phosphate (as phosphorus)mg/L<0.033<0.033<0.033<0.033
Nitrate (as nitrogen)mg/L<0.014<0.014<0.014<0.014
Nitrite (as nitrogen)mg/L0.126 ± 0.00600.038 ± 0.00200.045 ± 0.00200.07
Cations
Total aluminummg/L<0.003<0.003<0.003<0.003
Total calciummg/L<0.009<0.009<0.009<0.009
Total magnesiummg/L<0.003<0.003<0.003<0.003
Microbiological analysis
Heterotrophic plate countCFU/mL28,000 ± 7840370,000 ± 103,60032,000 ± 8960143,000
Total coliformsMPN/100 mL11,000540,00092,000214,000
Fecal coliforms or thermotolerant coliformsMPN/100 mL4900110,00011,00041,900
Table 6. Comparison of greywater quality with similar research.
Location Tacna,
Perú
Kuwait [37]Japan [42]India [61] Kumasi,
Ghana [63]
Lima,
Perú [64,65]
Ado-Ekiti,
Nigeria [61]
Study Building University building
(this study)
SchoolsUniversity research buildingSchools in rural areasResidential neighborhood (university campus)University campus (faculty)University campus
Source Hand basinsHand basinsMixedHandwashBathrooms, kitchen, laundry, and sinkHand basinsMixed
ParametersUnits
pH 6.64–6.735.95–8.695.9 ± 0.58 6.1–6.737.67.3–10.94
TurbidityNTU12.2–15.40.07–36.4 196 ± 11227061.588.7–854
Electrical conductivity (EC)μS/cm817–820177–1446394 ± 133 280–616.297512.46–25.4
Total suspended solids (TSS)mg/L13–212–14674 ± 37351 ± 223180–1901
Total dissolved solids (TDS)mg/L 90–300 172–382 9.63–1424
Total solids (mg/L)mg/L 110–466
Total Kjeldahl nitrogenmg/L5–6 13 ± 5.3
Dissolved oxygen (DO)mg/L5.7–7.55.8–7.8 0.1–6.69 4.22–5.88
Chemical oxygen demand (COD)mg/L95–98.86.4–170 643 ± 387 b690–74016396–164
Biochemical oxygen demand (BOD5)mg/L33.9–39.70–65227 ± 128 320–350 22–48
Biological oxygen demand (BOD)mg/L 344 ± 272 b 8
Total organic carbon (TOC)mg/L 100 ± 57
Oil and greasemg/L7.4–13.2
Phosphate (as phosphorus)mg/L<0.033<0.05–2.60.37 ± 0.421.03 ± 0.681.3–6
Nitrate (as N)mg/L<0.014<0.03–31.10.10 ± 0.1334 ± 6 b0.5–12.9
Nitrite (as N)mg/L0.038–0.126<0.02–2.6 0.00–0.06
Heterotrophic plate countCFU/mL28,000–370,000
Total coliformsMPN/100 mL11,000–540,00089–3521.4 × 106 ± 3.5 × 10⁶
Fecal or thermotolerant coliformsMPN/100 mL4900–110,0000 2.35 × 10⁸ a
a: CFU/100 mL; b: ppm.
Table 7. International guidelines and standards for wastewater reuse.
Country/
Organization
Parameters
pHTurbidity
(mg/L)
TSS
(mg/L)
BOD5
(mg/L)
COD
(mg/mL)
DOTotal
Nitrogen
(mg/L)
Nitrate
(NO3)
Total
Chlorine
Residual
(mg/L)
Fecal or
Thermotolerant
Coliforms
(CFU/100 mL)
Total
Coliforms
(CFU/100 mL)
E. coli
(CFU/100 mL)
Applications
USA
[53]
6–9≤2 (avg) ≤10 ≥1undetectable<2.2 (avg)<100Unrestricted urban reuse/toilet flushing
<5 (max) <23 (max)
USA
[53]
6–921010 2.2 bMulti-family and commercial (restricted indoor and unrestricted outdoor use)
WHO [52] ≤10≤10 ≤10 Toilet flushing
≤140≤240 ≤1000 Irrigation of ornamentals, fruit trees, and fodder crops
Jordanian
[51]
6–910 a5030100>2.04530 100 bCooked vegetables, parking areas, and playgrounds
6–9 150200500 7045 1000Agricultural irrigation tree crops and green areas
a: NTU; b: MNP/100 mL.
Table 8. Calculation of average times students use the restrooms at the university according to gender.
Restroom Usage at the University (Times/Day)MaleFemale
QuestionariesAverage
(1)
%
(2)
Weighted Times
(3) = (1) × (2)
%
(4)
Weighted Times
(5) = (1) × (4)
0−10.514.177.085.452.72
2−32.544.41111.0414.1735.42
4−54.514.1763.766.2728.20
6−76.50.271.770.825.31
8−more8.50.000.000.272.32
Total73.02183.6526.9873.98
Weighted times (times/day) 2.51 2.74
Table 9. Total water demand for toilet/urinal flushing.
RestroomStudentsUsage (Times/Day)Sanitary FixtureWater Demand for Toilet/Urinal Flushing (L/d)
TypeWater Consumption (L/Flush)
Male2342.51316.833.82236.27
Female862.74110.034.81132.07
Total water demand for toilet/urinal flushing (l/d)3368.34
Table 10. Total water demand for green roof and garden watering.
ActivityArea (m2)Water Consumption
(L/m2/d)
Water Demand
Green roof watering125.002.7337.50
Garden watering359.832.0719.66
Table 11. Water saving by using greywater.
Water DemandGreywater OfferWater Saving per Activity
(%)
ActivityVolume
(L/d)
ActivityVolume
(L/d)
Toilet flushing3368.34Greywater from hand basins426.8512.67
Green roof watering337.50853.70 1100.00
Garden watering719.66853.70 1100.00
1 The amount of greywater provided for watering the green roof and garden areas is doubled because they are irrigated three days a week, not every day.
Disclaimer/Publisher’s Note: The statements, opinions and data contained in all publications are solely those of the individual author(s) and contributor(s) and not of MDPI and/or the editor(s). MDPI and/or the editor(s) disclaim responsibility for any injury to people or property resulting from any ideas, methods, instructions or products referred to in the content.