Abstract
Although there are many methods that can be used to obtain customer preferences for new energy vehicles, most studies generally overlook the fact that customer preferences are private information. The purpose of this study is to investigate the transmission mechanism of customer preferences by taking into account situations in which customers lie. Through a signaling game model, this study analyzed the transmission mechanism of customer preference information for the center control touch screen of new energy vehicles based on separation equilibrium. The results show that when inequality (1) remains, such an equilibrium forms: the customers send the real preference signal, the manufacturer then adopts a new sample consistent with the received signal and prices the product accordingly, and, finally, the customers pay for the new NEV. When inequality (2) remains, the following equilibrium forms: customers signal the opposite of their private preference, the manufacturer then adopts a new sample opposite to the received signal, and, finally, customers pay for the new NEV.
1. Introduction
With the rapidly growing number of automobiles, new energy vehicles are becoming an approach to mitigate the dependence of the auto industry on petroleum and, thus, reduce pollutant emissions. In response, the global automotive industry has proposed corresponding plans. In August 2021, the White House announced an order by President Biden that by 2030, sales of new energy vehicles will account for half of national car sales. On 28 March 2023, an agreement among EU member states to ban the sale of new fossil fuel vehicles by 2035 was officially approved. In 2022, the State Council of China issued the Twelfth Five-Year National Strategic Emerging Industries Development Plan, which listed the new energy automobile industry as one of the seven strategic emerging industries in China. According to data from the China Association of Automobile Manufacturers, from January to July 2023, the production and sales of new energy vehicles reached CNY 4.591 million and CNY 4.526 million, respectively, with a year-over-year increase of 40% and 41.7%.
New energy vehicles (NEVs) can be classified as pure electric vehicles (EVs) and hybrid electric vehicles, including plug-in hybrid electric vehicles (PHEVs), fuel-cell electric vehicles (FCEVs), hybrid electric vehicles (HEVs), and extended-range electric vehicles (EREVs) [1]. With the development of renewable hydrogen supply chains (HSCs), hydrogen will play an important role in future energy systems. Hydrogen strategies and roadmaps have been proposed and updated to facilitate the adoption of HSCs in, among others, Japan, Korea, the USA, the UK, Canada, Norway, and the EU, and hydrogen fuel cell electric vehicles (HFCEVs) are the focus of further research [2,3]. The competition in materials, equipment, technology, and other aspects has already opened up in the field of new energy vehicles. At the same time, an increasing number of brands are joining this competition. In 2008, Tesla released its first electric vehicle, the Roadster, which changed the automotive industry ecosystem. In 2012, the first electric sports car belonging to the new electric vehicle series ‘Model S’, produced by the Tesla factory in Fremont, California, USA, was officially delivered. Since 2009, BMW has successively released new products such as the ActiveHybrid X6 and Active E. After more than a decade of accumulation, Toyota released its first generation of HFCEV, named Mirai, in 2014 in Japan. At present, new energy vehicle products and brands continue to emerge. According to statistics, there are 73 such brands in the Chinese market. The competition in the new energy vehicles market is expected to intensify [4].
To increase their competitiveness, firms need to develop products that customers prefer over alternative options, and the customer preference factors for conventional and new energy vehicles are not the same. The target customers of new energy vehicles can be basically divided into those with low-carbon preferences and those without obvious environmentally friendly preferences. Cirillo et al. [5] found that young people are more likely to buy vehicles with new technologies, especially battery-based electric vehicles.
The existing research on customer preferences for new energy vehicles focuses on four aspects: customer preferences and pricing decisions, demand with different preferences, customer preferences among different customer groups, and customer preferences for certain specific components. The factors involved in these studies include (1) product attributes, such as the cost of use, extra fees, and battery capacity; (2) incentive policies, such as subsidies; and (3) the individual characteristics of the public, such as gender and education [6,7,8,9,10].
What methods have been used to understand customer preferences for new energy vehicles? To the best of our knowledge, four methods have been adopted by researchers: (1) using a questionnaire, which is a commonly used method; (2) mining customer data on various websites or apps, supported by big data technology and machine learning technology; (3) mathematical modeling analysis, which is also often used by scholars; and (4) conducting preference analysis experiments using devices, which is a less commonly used but meaningful research method [9,10,11,12,13,14,15,16].
Although research on public preferences for new energy vehicles has been conducted from different perspectives over the past two decades, there remains a gap between the promotion of new energy vehicles and the public’s preferences. In addition to understanding the factors and impacts of customer preferences, it is also necessary to understand how customer preference information is transmitted.
Customer preferences are private information. Customers can choose to lie or express their private preferences truthfully and also choose to actively or passively participate in the manufacturer’s preference survey activities. How these different choices affect the decisions of both parties is a question worth studying.
Through a signaling game model, this study analyzes the transmission mechanism of customer preference information for the center control touch screens of new energy vehicles based on separation equilibrium. The results show that when inequality remains (1), such an equilibrium will be formed. Then, the customers will send the real private preference signal, and the manufacturer will adopt a new sample consistent with the received signal and price the product accordingly. Finally, the customers will pay for the new NEV.
The remainder of this paper is organized as follows. Section 2 reviews the literature on customer preferences for new energy vehicles, as well as the applied methods for understanding customer preferences. Section 3 describes the research problem and constructs a signaling game model based on the privateness of customer preferences. Section 4 solves and analyzes the proposed model, and Section 5 presents the findings. Section 6 concludes with implications for management and directions for future research.
2. Literature Review
This section reviews research on customer preferences for new energy vehicles and the applied methods for understanding customer preferences.
There are some distinctions between NEVs and ordinary vehicles, which can use merit better than a defect. The design of NEVs can be approached more flexibly than ordinary vehicles according to the structural adaptation of new energy power. Customer preferences are a key factor in the design phase. Research has found that there is currently insufficient understanding of customer preferences for new energy vehicles. Jiang et al. [17] extracted 1498 papers related to the public’s purchase preferences and the popularization of new energy vehicles published during the past two decades; the results indicated that there remains a gap between the promotion of new energy vehicles and the public’s purchase preferences and that understanding and respecting the public’s purchase preferences can help promote the popularity of new energy vehicles.
The existing research on customer preferences for new energy vehicles focuses on the following aspects.
Firstly, the target customers of new energy vehicles can generally be divided into those with low-carbon preferences and those without obvious environmentally friendly preferences. The impact of different preferences on pricing has received attention. Ma et al. [6] studied the impact of customers’ low-carbon preference on the pricing decisions and profits of manufacturers.
Secondly, some scholars focused on the impacts of different preferences on the diffusion of new energy vehicles. Kim et al. [7] investigated asymmetric consumer preferences for the major attributes of EVs in the marketing stage, in which the customers’ charge accessibility preferences and attitudes were considered. Cordera et al. [8] observed that although the need for more environmentally friendly vehicles was recognized several decades ago, this new market had not yet established itself at the time of publication. By proposing a new model, the authors found that the highest demand for new energy vehicles could be achieved in two ways: (1) by penalizing conventional vehicles in terms of costs/km and (2) by providing incentives directed at lowering the purchasing prices of hybrid and electric vehicles. This research also noted that as demand becomes more elastic, the preferred strategy should initially focus on hybrid vehicles.
Thirdly, the differences in preferences among different customer groups have been explored. Li et al. [9] found that there were significant gender differences in icon perception on a four-dimensional basis, with males more likely to be disturbed by icon constituent elements (semantic dimension), while females are more likely to be disturbed by icon metaphors (semantic dimension), the usage environment, and the interface context (contextual dimension), as the new energy vehicle market ushered in the “her era” with the advent of the “her economy” era.
Fourthly, research on preferences for certain specific components of new energy vehicles has also attracted attention. For example, the center control touch screens (CCTSs) of NEVs are an important part of the user’s interactions with the vehicle, which are quite different from the interactions involved in using a conventional fuel vehicle. Lin et al. [10] investigated the visual imagery and user preferences for CCTSs in NEVs, finding that a horizontal design with small, rounded angles and no border was the optimal design solution for the visual imagery dimension and that the design without a border could increase users’ preferences and purchase intentions to a certain extent.
The applied methods for understanding customer preferences are of great importance. To the best of our knowledge, there are four ways to understand the preferences of new energy-electric vehicle customers.
Firstly, a questionnaire is a commonly used method and plays an important role in understanding preferences. Jung et al. [11] presented a stated preference study of electric vehicles (EVs) in the Korean automobile market based on data from a questionnaire conducted in February 2018 in Korea. Papantoniou et al. [12] developed a questionnaire for a sample of 150 users to investigate users’ preferences for the selection and use of electric passenger vehicles. Swain et al. [13] evaluated the psychometric properties of a questionnaire on dashboard design among a population-based sample of 1000 elderly drivers, as elderly drivers are a rapidly growing demographic worldwide. A web-based survey was performed in 2014 in the state of Maryland by Cirillo et al. [5] to analyze the vehicle purchasing preferences of 456 respondents during 2014–2022.
Secondly, mining customer data on various websites or apps can be supported by big data technology and machine learning technology. Cai et al. [14] analyzed 2198 online reviews with 148,527 subsentences pertaining to new energy vehicles and proposed a product-and-user-oriented approach for requirement analysis. This approach can automatically elicit, classify, and rank product requirements from online reviews and identify requirement differences among customers using machine learning. Wang et al. [15] extracted the demand preference topic words of new energy vehicle customers using the LDA model, by collecting review data from online automotive forums, finding that new energy vehicles customers pay more attention to services and service quality during the purchasing and using process.
Thirdly, mathematical modeling analysis is also often used by scholars. Kim et al. [7] used a discrete choice model with a reference point to capture customers’ different preference directions of EVs in the South Korean car market. Lin et al. [10] employed the TOPSIS method for weight determination to investigate the visual imagery and user preferences for CCTSs in NEVs, finding that a horizontal design with small, rounded angles without a border was the optimal design solution for the visual imagery dimension and that the design without a border could increase users’ preferences and purchase intentions to a certain extent.
Fourthly, conducting preference analysis experiments using devices is a less commonly used but meaningful research method. Li et al. [9] conducted behavioral response experiments and facial electromyography experiments on 20 male and female participants to analyze their cognitive preferences for icons by taking the human–machine interface icons in new energy automobiles as a case study.
Although these studies collected customer preference information through various channels, they generally overlooked the fact that customer preferences are private information. Thus, the information conveyed by customers may not always match their real preferences. Gary et al. [16] provided experimental evidence that when participants are asked to reveal a piece of private information, they are more likely to lie when they disclose non-personal information compared with personal information, creating a moral cost to lying and thus affecting lying behavior.
In this study, we consider customer preferences to be private information and that the customers will send signals that conflict with their real preferences. In the following section, through a signaling game model, the transmission mechanism of customer preference information is analyzed based on separation equilibrium.
3. Problem Description and Model Construction
This study draws inspiration from research by Lin et al. [10] on the center control touch screens of new energy vehicles. In the present study, we drew on the research subjects of Lin et al. to further analyze the transmission mechanisms of customer preferences.
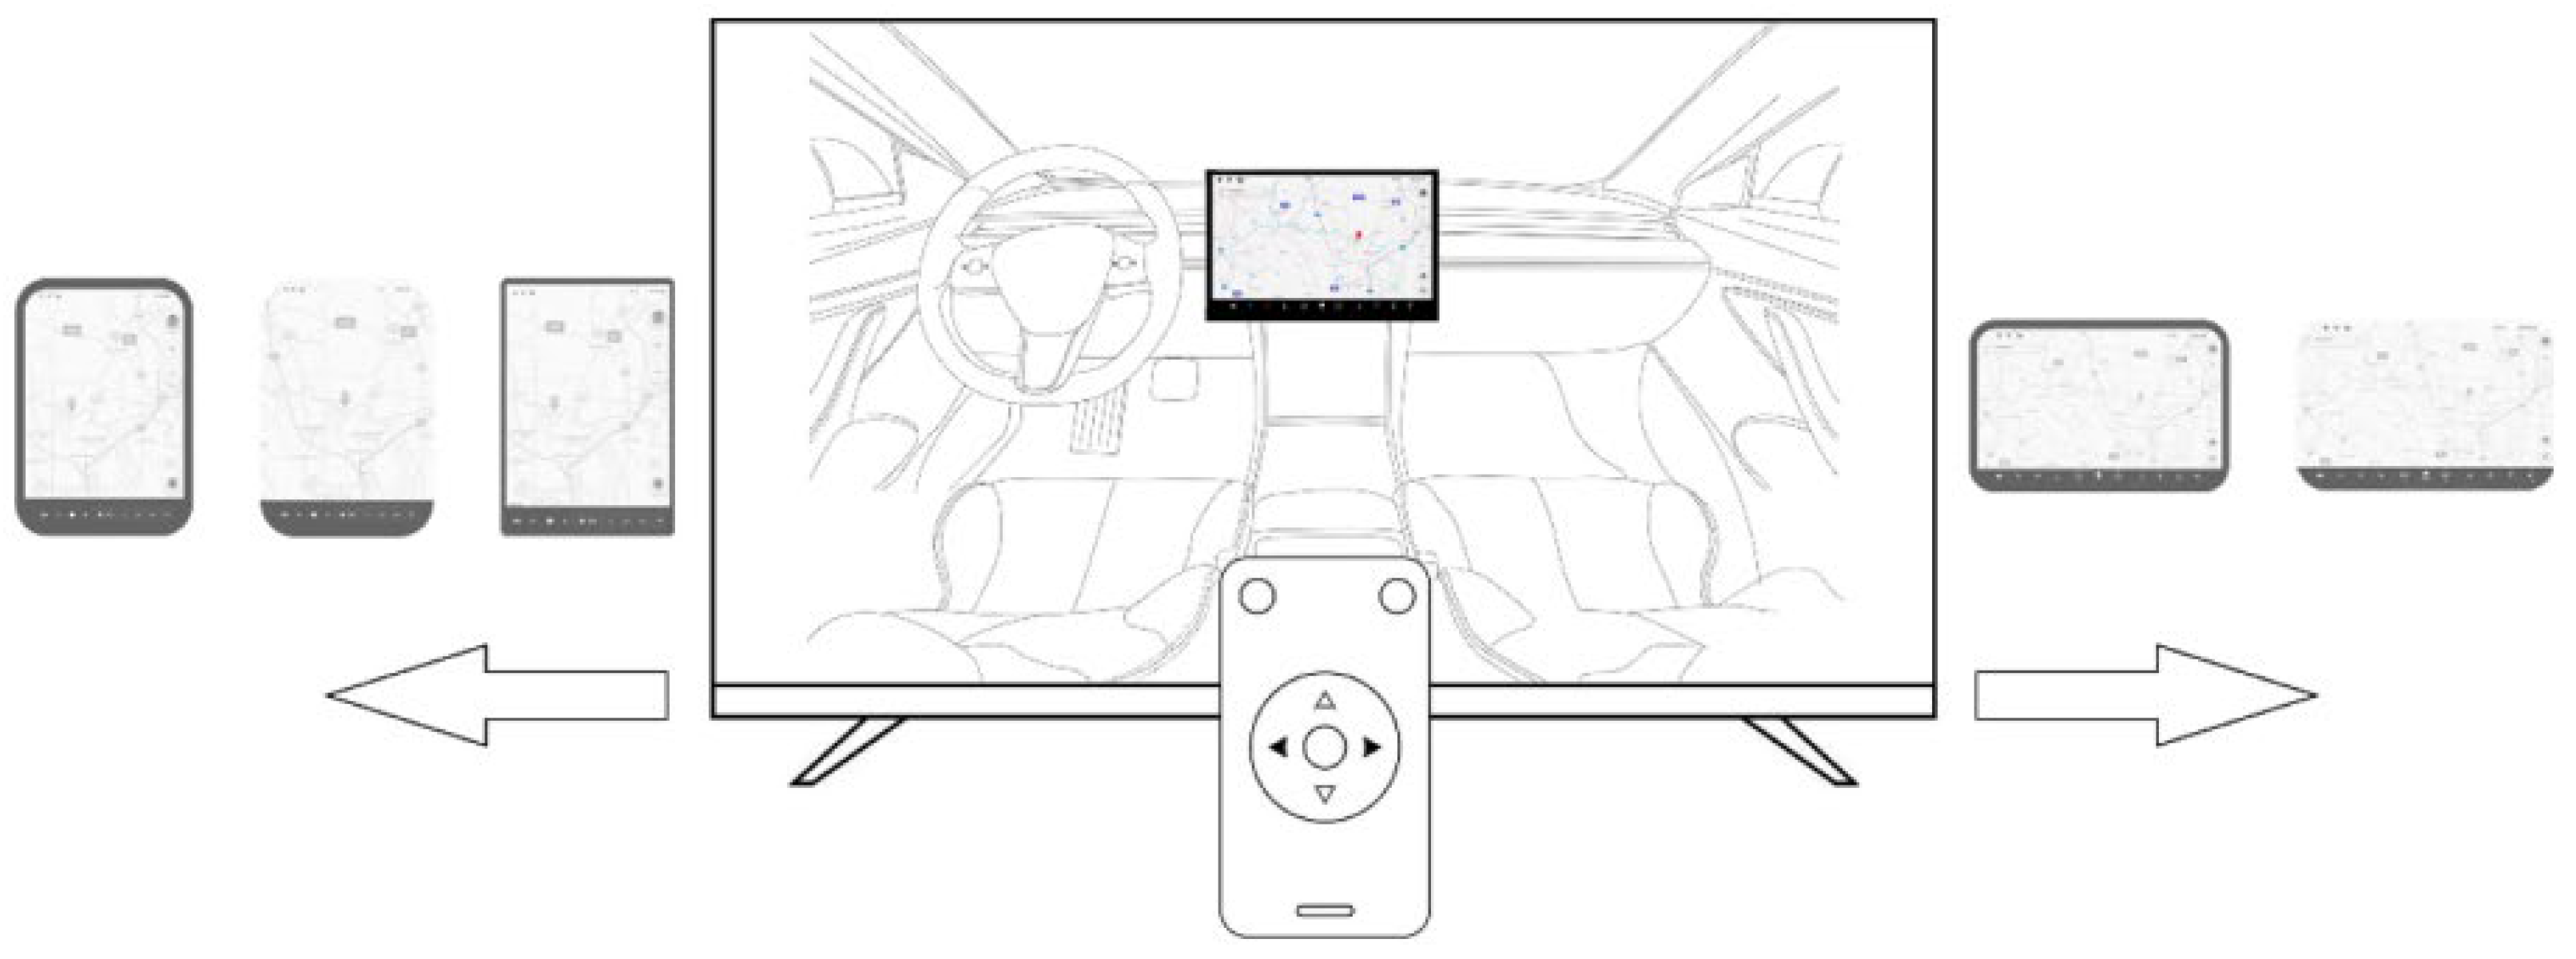
We assume that the manufacturer has decided to develop a new center control touch screen to improve the new energy vehicle’s competitiveness. The background image of the sample is shown in Figure 1.

Figure 1.
Background image of the sample.
In this model, some customers who participate in co-creation would be invited to express their preferences. The customers can switch between different samples and select the sample that he or she prefers the most. The selection process is shown in Figure 2.
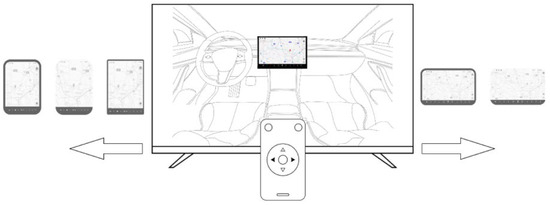
Figure 2.
Schematic diagram of switching between samples.
Furthermore, we assume that customers will choose between the following two options. Sample A is a vertical version featuring small, rounded angles with a border, while sample B is a horizontal version featuring small, rounded angles with a border. The samples are shown in Table 1.

Table 1.
Samples to be selected.
The dynamic game process is as follows:
Firstly, the customers may prefer a certain style of sample due to natural circumstances. Suppose that the probability of the preference for sample ‘A’ is ω. Then, the probability of preference for sample ‘B’ is (1 − ω).
In the first step, the customers are invited to select the preferred sample, thus sending a preference signal (‘a’ or ‘b’) to the NEV manufacturer. Here, note that the signal may be inconsistent with the customer’s real private preferences.
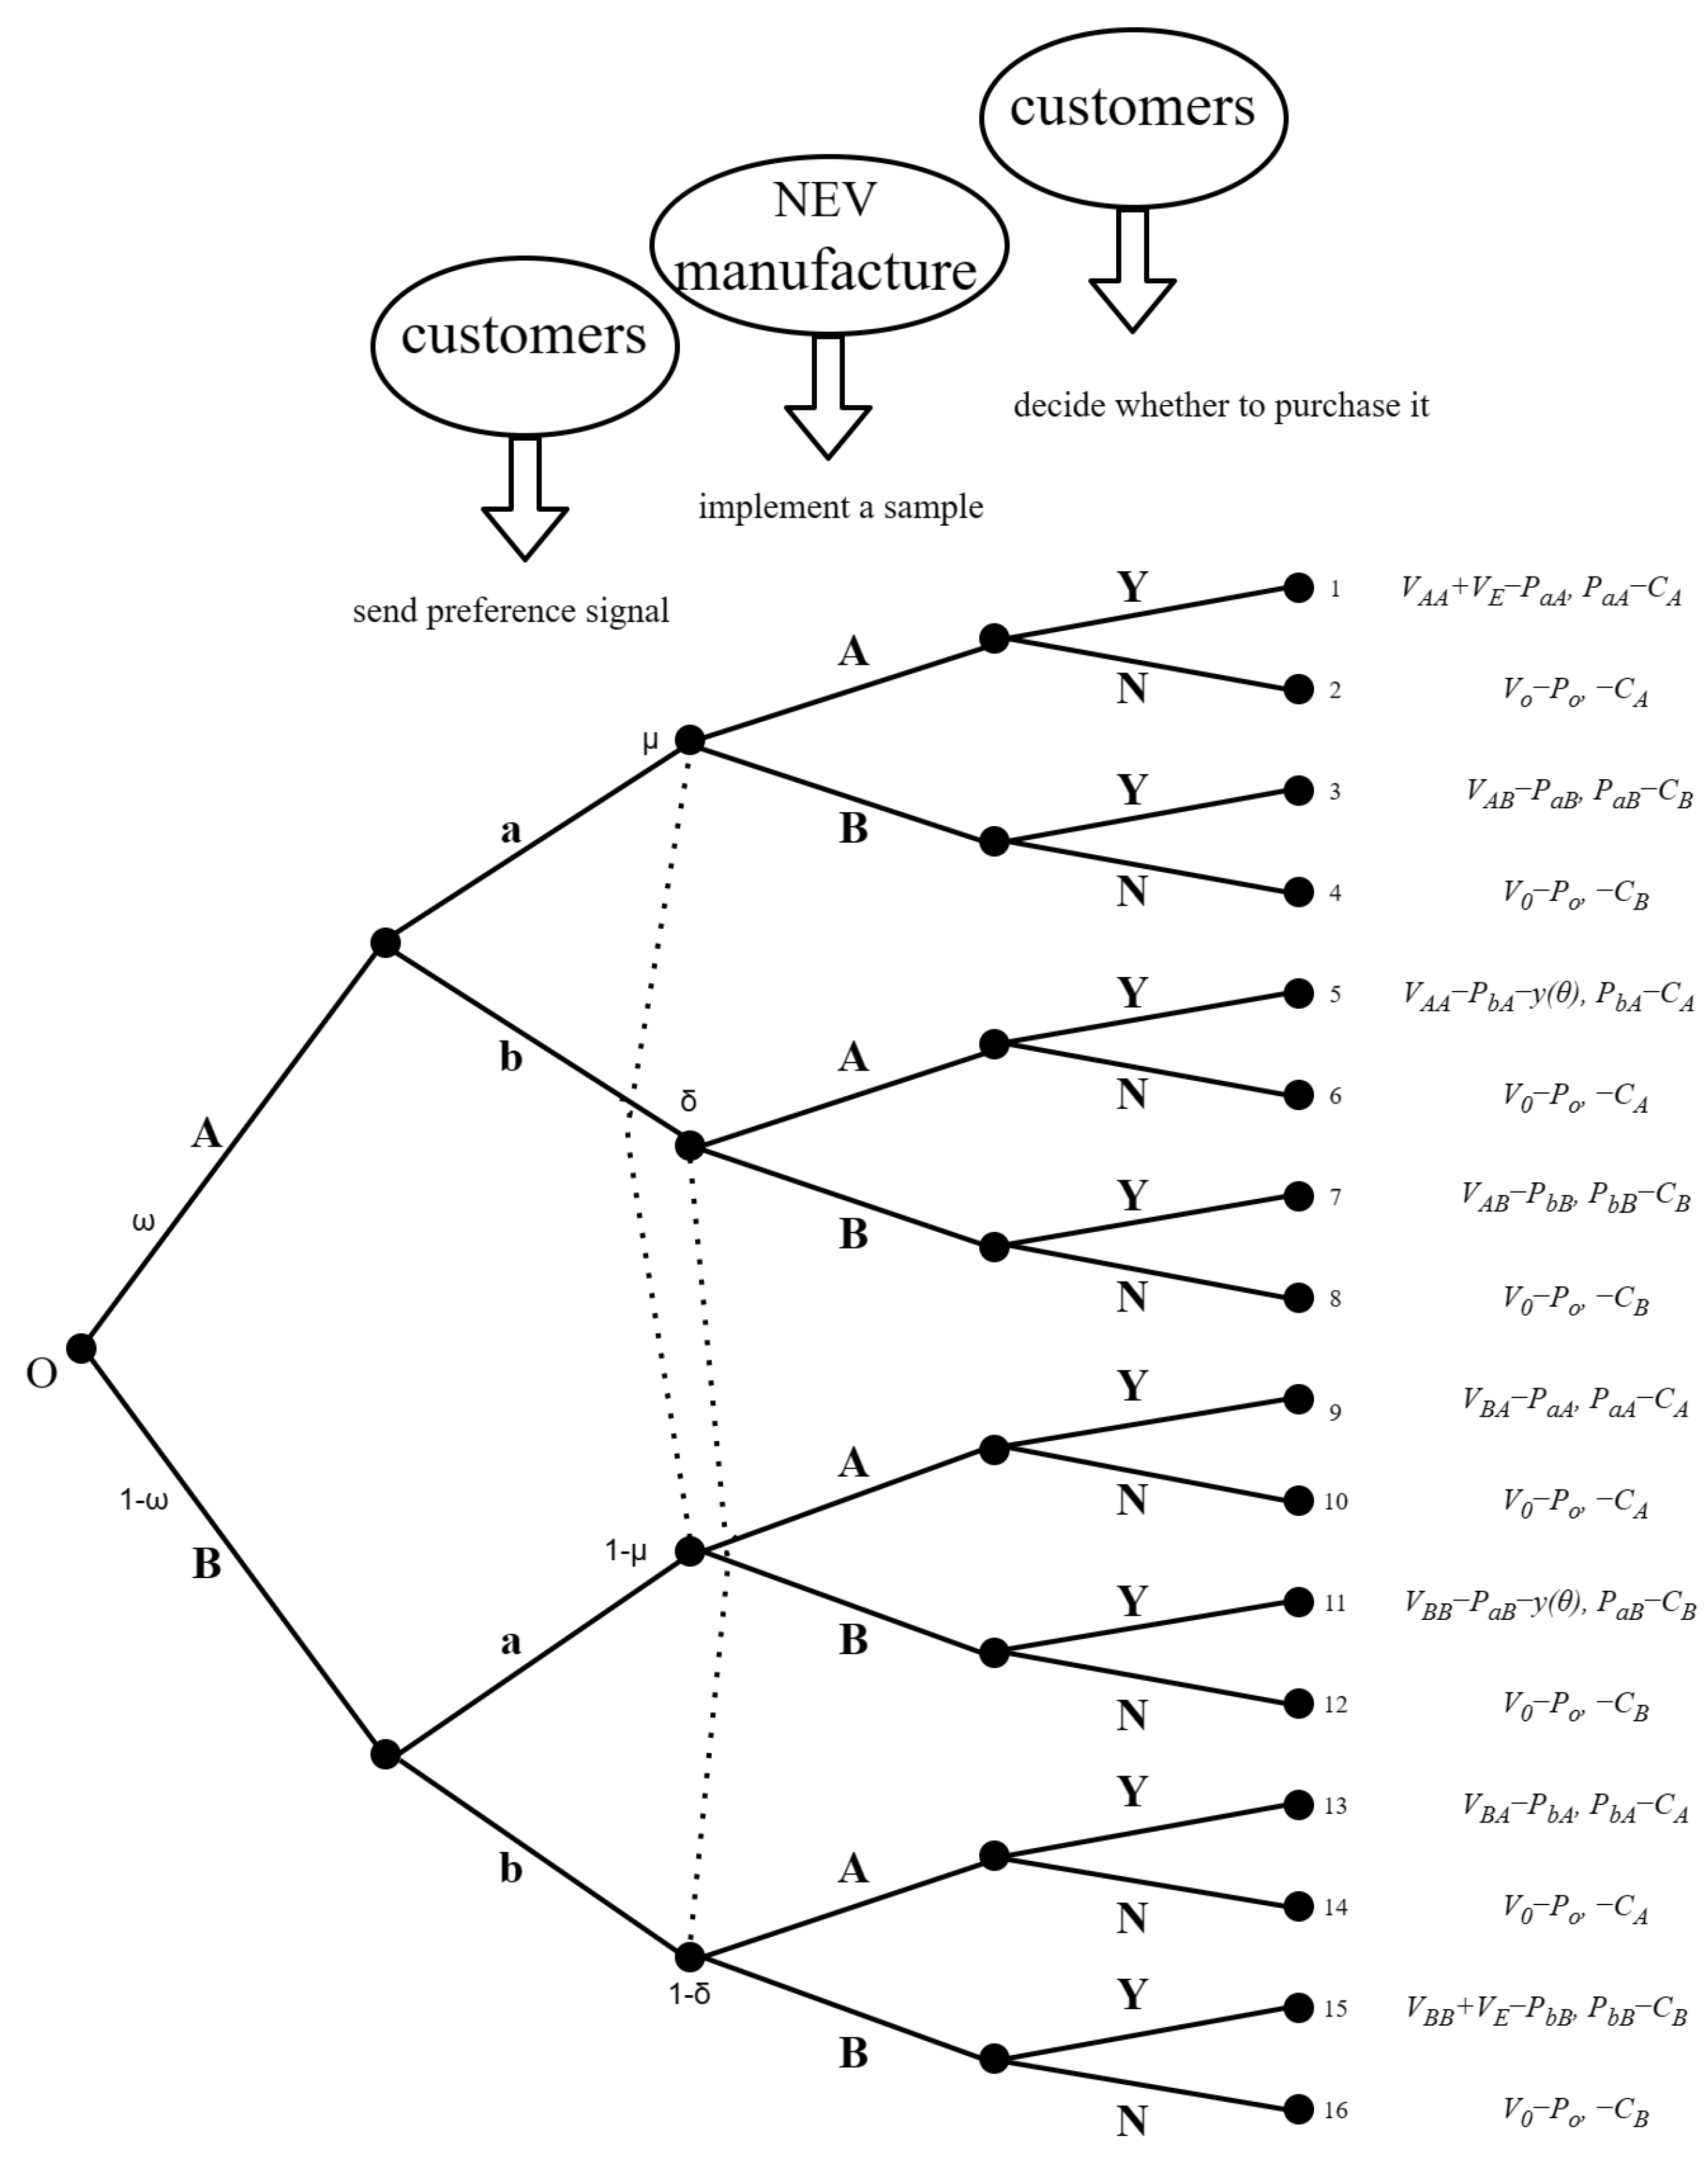
In the second step, the NEV manufacturer implements samples ‘A’ or ‘B’ after receiving the signal previously sent by the customers. At this time, the NEV manufacturer cannot be sure that the received signal is the real preference type. In other words, there are two information sets, each with two indistinguishable points. Suppose the probabilities of the first information set points are μ and (1 − μ), respectively, and the probabilities of the two points in the second information set are δ and (1 − δ), respectively, as shown in Figure 1.
The third step is for the customers to decide whether to purchase the new NEV after it is launched.
This dynamic game process is shown in Figure 3.

Figure 3.
The dynamic game process model.
This is a signaling game model where the customers send private preference information ‘a’ or ‘b’, and the manufacturer receives the signal to decide which sample should be adopted. Finally, the customer chooses to purchase the new NEV or leave the market. The signaling game is a dynamic game with incomplete information, as proposed by Spence in 1973 [18]. A typical signaling game involves two participants: a sender and a receiver. The signal sender takes action first, sending a signal about his or her own type to the signal receiver. After receiving the signal, the signal receiver selects an action based on the content of the signal. The relevant parameters involved in this paper are shown in Table 2.
Table 2.
Summary of relevant symbols.
Here, lowercase letters represent the signals sent by customers, while uppercase letters represent the samples adopted by the manufacturer. The dynamic process of this game involves customers sending their preference signals first, which is followed by the manufacturer making decisions. The subscripts of the parameters are thus set in this order. Different subscripts represent different decisions from customers and the manufacturer. The payoffs in the game under different situations are shown from Table 3, Table 4, Table 5 and Table 6.
Table 3.
Payoffs in the game when the customer prefers sample ‘A’ and sends signal ‘a’.
Table 4.
Payoffs in the game when the customer prefers sample ‘A’ and sends signal ‘b’.
Table 5.
Payoffs in the game when the customer prefers sample ‘B’ and sends signal ‘a’.
Table 6.
Payoffs in the game when the customer prefers sample ‘B’ and sends signal ‘b’.
4. Related Assumptions
(1) Many studies have shown that lead customers are an important source of innovation. Lead customers are individuals with high lead users who “face needs that will be general in a market place—but face them months or years before the bulk of that marketplace encounters them and are positioned to benefit significantly by obtaining a solution to those needs” [19]. Lead customers have stronger motivation to participate in new product development (NPD) [20]. In other words, lead customers are more willing to cooperate with the NPD activities of manufacturers. This paper sets the customers’ lead degree as θ (the proportion of lead customers) and the psychological cost of sending false signals as y(θ), which means that the cost of lying is related to the customer’s characteristics. The cost of lying for lead customers may be higher than that for other customers, but this issue is beyond the scope of the present study;
(2) Many studies have focused on the psychological antecedents of successful contributions to idea co-creation. These studies have found that intrinsic motivators such as self-efficacy, individual initiative, and psychological ownership of production processes are more important for participation in idea co-creation than extrinsic rewards [21,22]. When the customers send real preference signals and finally purchase the corresponding NEV, the customers obtain psychological value through the realization of their expectations of the product, represented by ;
(3) The customers will obtain the utility of the new NEV itself. indicates the utility of the new NEV when the customers prefer sample ‘A’ and eventually purchase the new NEV with sample ‘A’ being adopted. indicates the utility of the new NEV when the customers prefer sample ‘A’ and eventually purchase the new NEV with sample ‘B’ being adopted. By analogy, we adopt parameters and .
We further assume that if customers buy a new product that matches their private preferences, the new product’s utility will be greater, as follows:
(4) The customers will purchase the original NEV already available on the market when not purchasing the new NEV. This paper assumes that the original NEV’s value is , and the original NEV’s price is . When the net utility of the two NEV products is the same, customers will choose the product that matches their preferences.
5. Model Solving Process
In the following section, we offer two proposals under certain conditions and prove them.
Proposition 1:
The signaling game reaches separation sequential equilibrium, and the customers will only send real preference signals when inequality (1) is satisfied:
Proposition 2:
The signaling game reaches separation sequential equilibrium, and the customers will only send a signal opposite to that of their private preferences when inequality (2) is satisfied.
Proof:
Definition 1.
Let represent the 16 endpoints of the game tree, as shown in Figure 3. Then, let . Thus, the new NEV’s utility for the customers , and the new NEV’s utility for the manufacturer .
Step 1. The customers decide whether or not to purchase:
Before customers make a purchase decision, the manufacturer’s pricing needs to consider four possible scenarios. The pricing for different scenarios is represented by , , , and , assuming that in the current scenario, the NEV manufacturer receives a preference signal ‘a’ from customers and produces the new NEV with sample ‘A’.
According to Assumption 4, when the manufacturer’s pricing strategy is greater than , the customers will purchase the original NEV because it has greater utility than the new NEV, and the manufacturer will pay the manufacturing costs. Obviously, the customers have the motivation to experience the new NEV, and the manufacturer has the motivation to make profits. Both players in this model will deviate from this state, i.e., the game can reach equilibrium only when the manufacturer’s pricing is less than :
If a customer’s private preference is sample ‘A’, the net utility of purchasing this NEV is , and the net utility of purchasing the original NEV on the market is ; then,
According to Assumption 4, when the net utility is the same, customers with a preference of ‘A’ will purchase the new NEV.
If a customer’s private preference is sample ‘B’, the net utility of purchasing the new NEV is , and the net utility of purchasing the original NEV on the market is ; then,
According to Assumption 4, customers with a preference of ‘B’ will purchase the original NEV on the market.
Thus,
A similar analysis also applies to other scenarios. Finally, rational customers will purchase the new NEV that matches their preferences. However, if the new NEV does not match their preferences, they will purchase the original NEV on the market.
The decision to purchase an NEV that matches their preferences is the customers’ sequential rationality.
Step 2. The manufacturer produces the NEV and prices it:
According to Step 1, the customers will purchase the NEV that matches their preferences.
The following sequence is then introduced:
When the manufacturer receives signal ‘a’, the pricing can be regarded as the following sequence:
If at endpoint 1,
If at endpoint 9,
If at endpoint 3,
If at endpoint 11,
Since
Thus,
According to Assumption 3, . Thus,
A rational NEV manufacturer is thus motivated to deviate from lower pricing and choose higher pricing, as follows:
Therefore, the profit of the manufacturer when sample ‘A’ is adopted, , can be regarded as the following sequence:
The profit of the manufacturer when sample ‘B’ is adopted, , can be regarded as the following sequence:
Therefore,
Since
According to the Local Sign Preserving Property of the limit, ∃ ,
if , then .
Thus, the manufacturer will adopt sample ‘A’. Under this condition,
When the manufacturer receives signal ‘b’, the pricing can be regarded as the following sequence:
If at endpoint 5,
If at endpoint 13,
If at endpoint 7,
If at endpoint 15,
Since
According to Assumption 3,
Thus,
A rational manufacturer is then motivated to deviate from lower pricing and choose higher pricing, as follows:
Thus, the profit of the manufacturer when sample ‘A’ is adopted, , can be regarded as the following sequence:
The profit of the manufacturer when sample ‘B’ is adopted, , can be regarded as the following sequence:
Therefore,
Since
According to the Local Sign Preserving Property of the limit, ∃ ,
if , then, .
Thus, the manufacturer will adopt sample ‘B’. Under this condition,
The manufacturer’s decision to adopt a sample consistent with the received signal when inequality (1) holds is the manufacturer’s sequential rationality.
Step 3. The customers send the preference signal:
When the customers’ private preference is sample ‘A’,
if the customers send signal ‘a’,
then, according to the previous step, the manufacturer will adopt sample ‘A’:
and the customers’ utility ,
If the customers send signal ‘b’,
then, according to the previous step, the manufacturer will adopt sample ‘B’:
and the customers’ utility ,
Therefore,
According to Assumption 3, . Thus,
According to the Local Sign Preserving Property of the limit, ∃ ,
if , then, .
Thus, the customers will send signal ‘a’. Under this condition,
Similarly, it can be proven that it is rational for customers to send signal ’b’ when the private preference is ‘B’, as follows:
The customers’ sequential rationality is when the customers decide to send a signal the same as that of their private preferences when inequality (1) holds, i.e.,
In conclusion, when inequality (1) holds, the customers will send only a signal that matches their private preferences. Then, the manufacturer will only adopt the sample that matches the received signal. Finally, the customers will purchase the new NEV that matches their own preferences. Similarly, it can be proven that when inequality (2) holds, the customers will only send a signal contrary to their private preferences. Then, the manufacturer will only adopt the sample that is contrary to the received signal. Finally, the customers will purchase the new NEV that matches their own preferences. □
6. Comparative Analysis
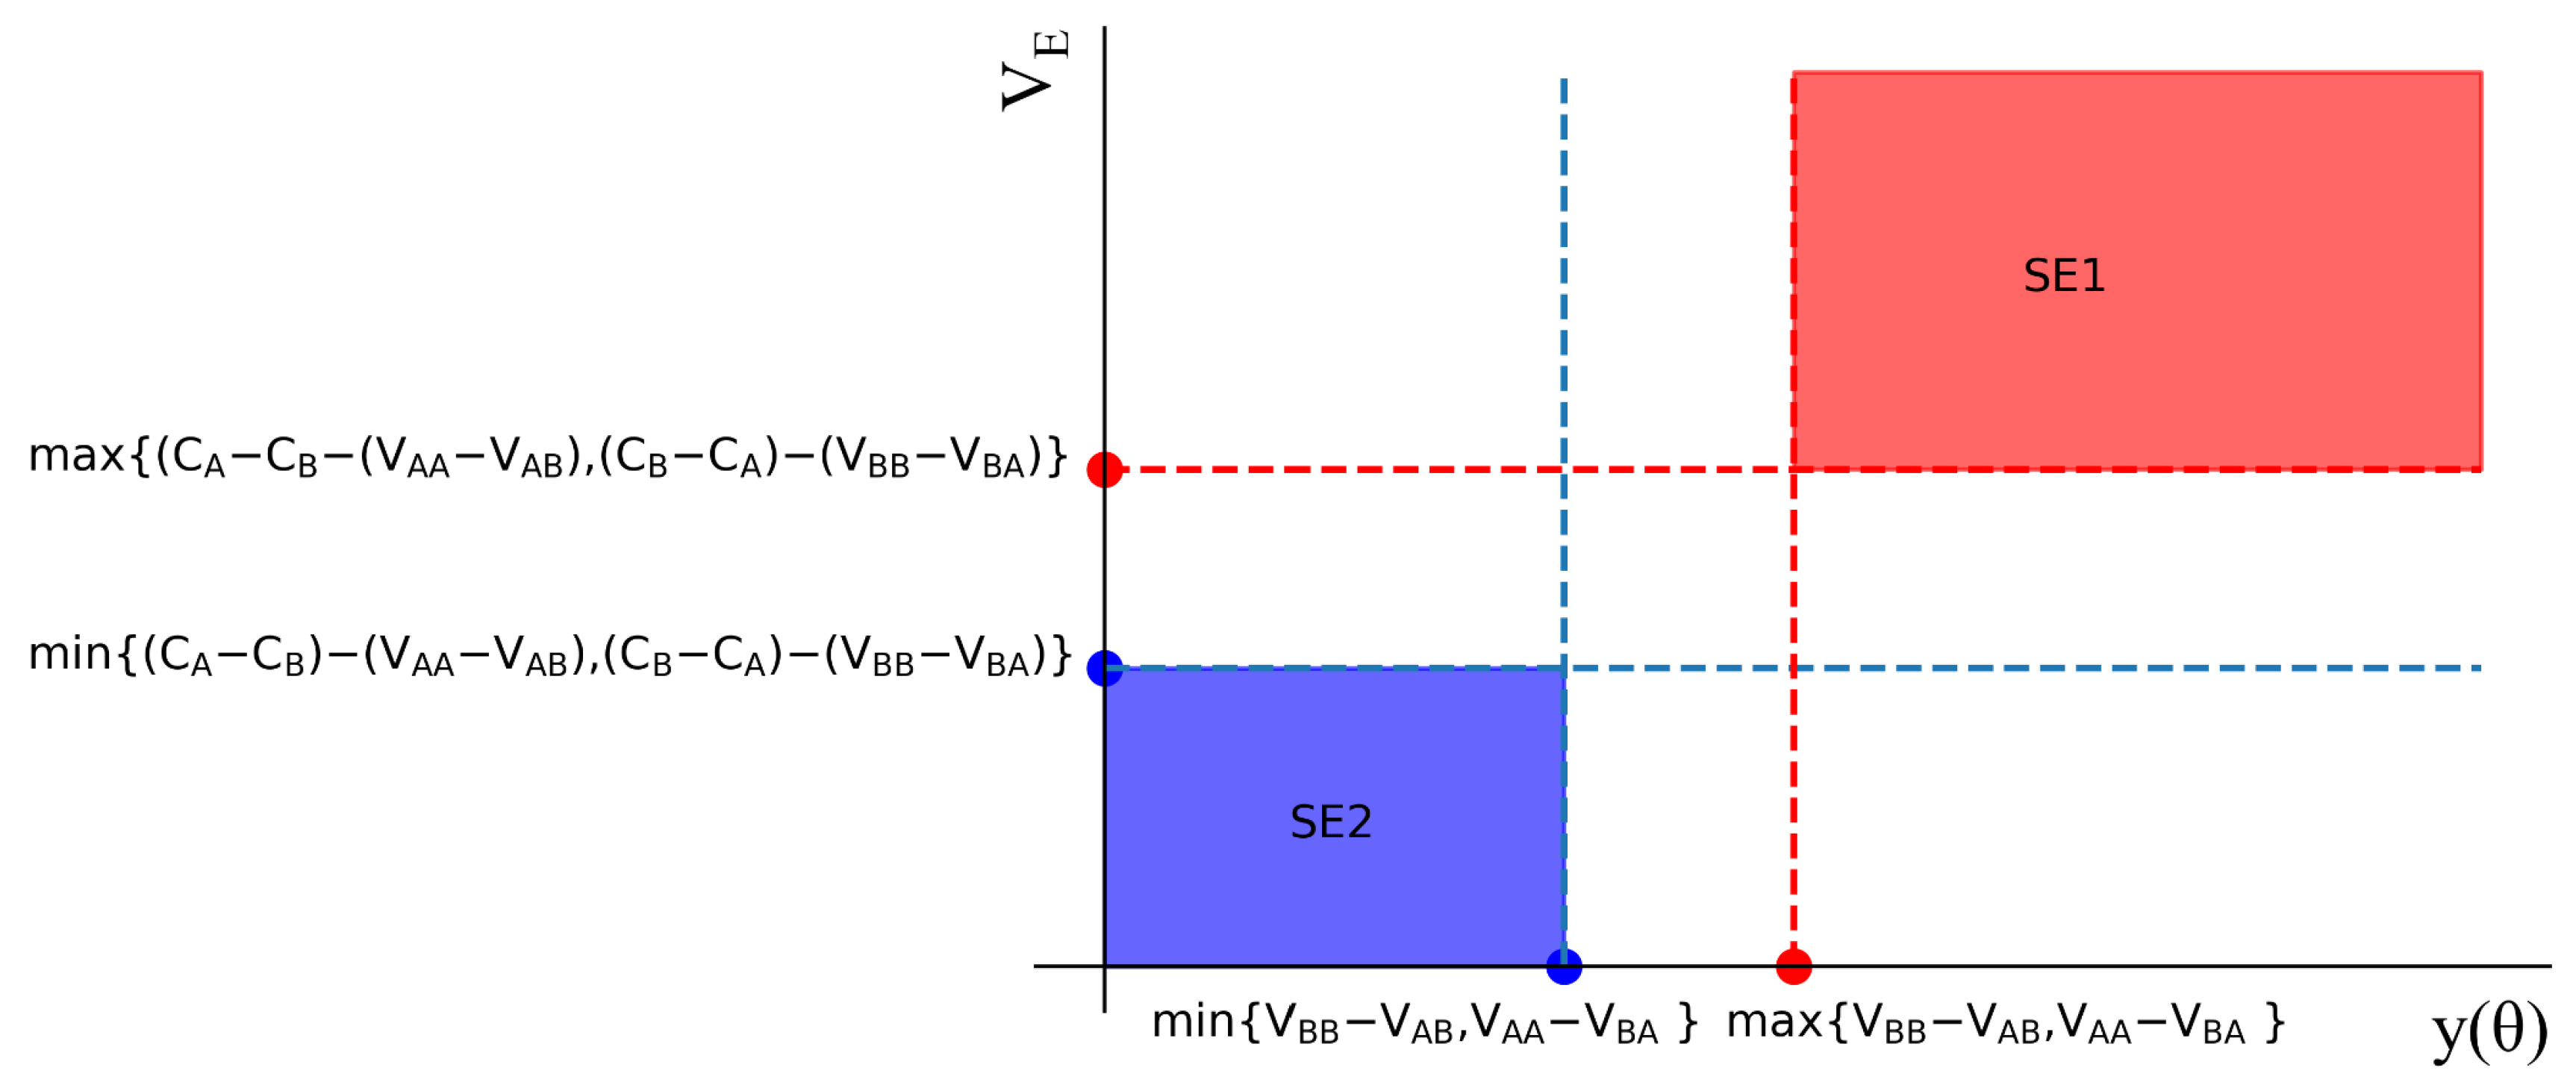
The customers’ preference transmission in the selection of new samples is a dynamic game with incomplete information in which two parameters matter. The psychological cost of sending false signals will weaken customer utility, while the psychological value obtained through the realization of customer expectations will enhance customer utility. Different states of parameters lead to different game results, as shown in Figure 4.

Figure 4.
Comparative analysis results.
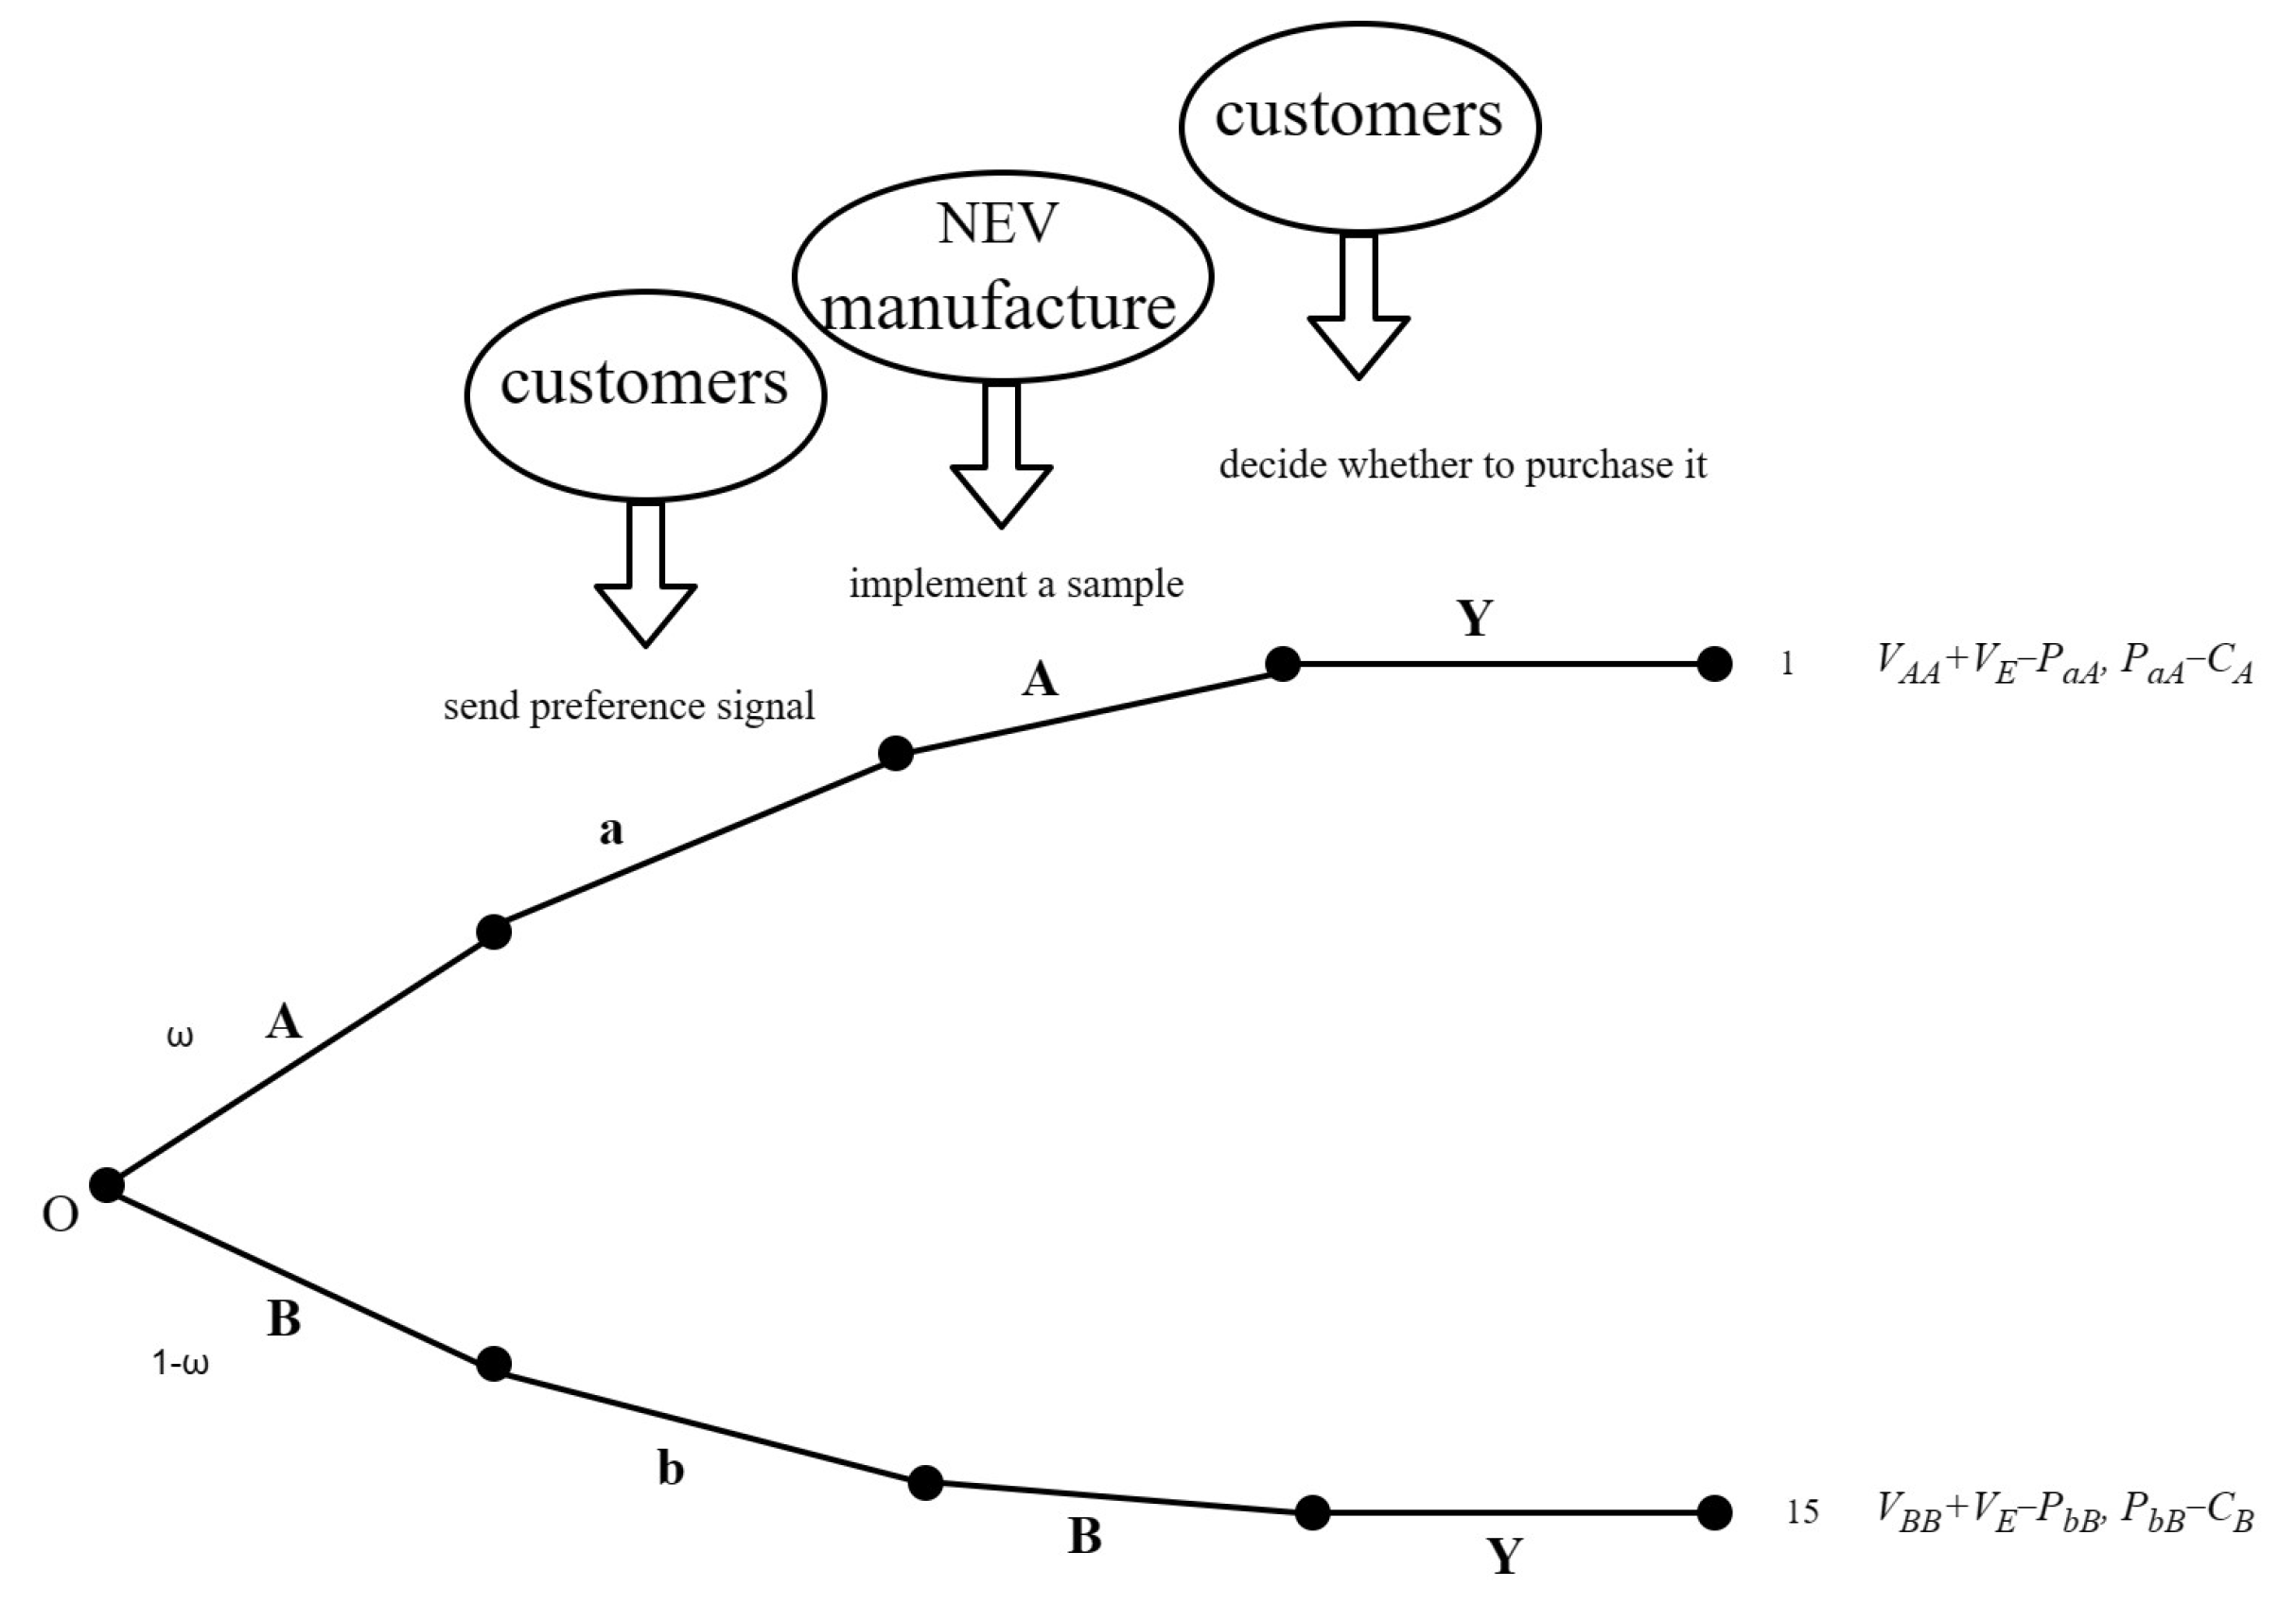
In the red area, the psychological cost of sending false signals and psychological value through the realization of customer expectations are relatively high. The customers will send only a signal that reflects their real private preferences, and the NEV manufacturer will adopt only the new sample consistent with the received signal. The customers will then buy this new product if the price is reasonable. The signal transmission path is shown in Figure 5.

Figure 5.
Signal transmission path when inequality (1) holds.
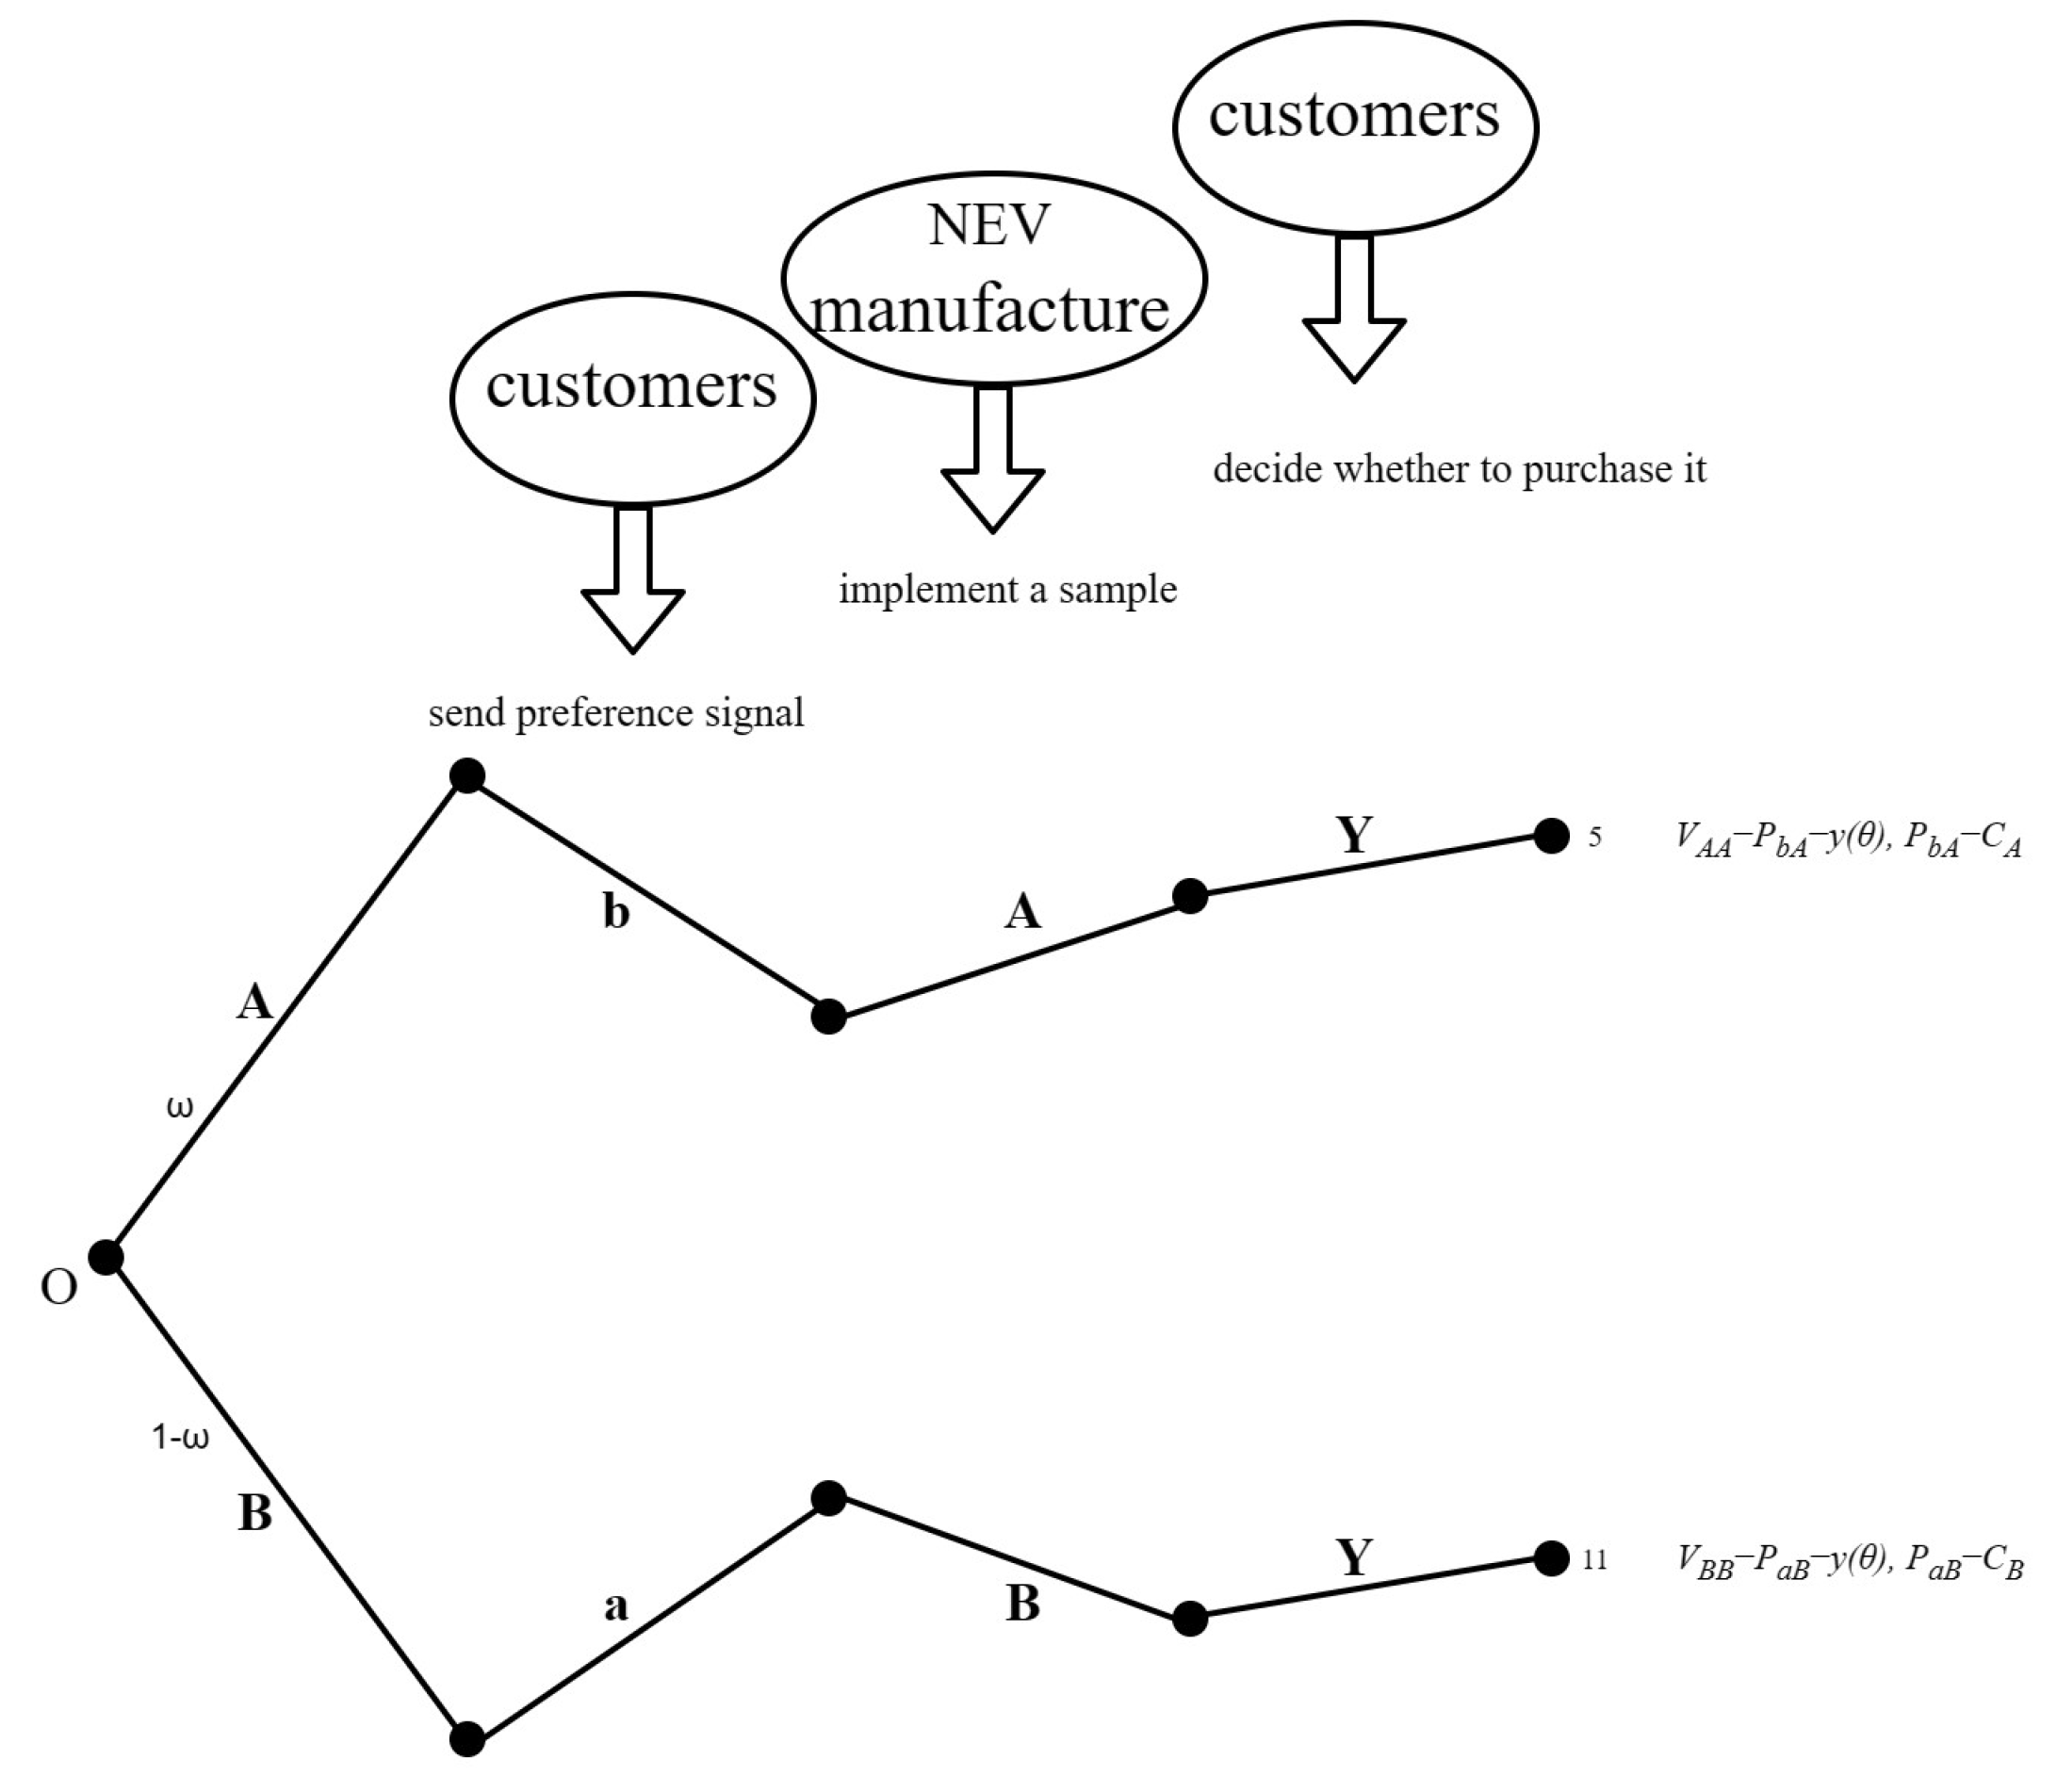
In the blue area, the psychological cost of sending false signals and psychological value through the realization of customer expectations are relatively low, which will lead to a corresponding equilibrium: The customers will send a signal opposite to their private preferences. Then, the NEV manufacturer will adopt a new sample opposite to the received signal. Finally, the customers will buy the new NEV if the price is reasonable. The signal transmission path is shown in Figure 6.
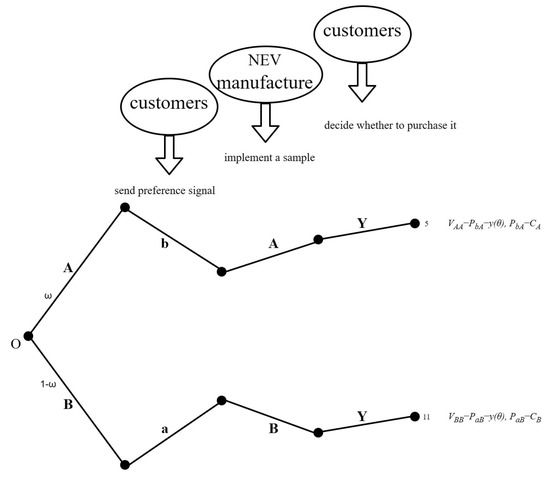
Figure 6.
Signal transmission path when inequality (2) holds.
Next, we continue to analyze the utility differences under two different equilibrium states. Table 7 and Table 8 show payoffs under two different equilibrium states when customer’s private preference is A or B, respectively.
Table 7.
Payoffs under two different equilibrium states when the customer’s private preference is sample ‘A’.
Table 8.
Payoffs under two different equilibrium states when the customer’s private preference is sample ‘B’.
When a customer’s private preference is sample ‘A’, the difference in utility between the two equilibria for customers is , and the difference in utility between the two equilibria for the manufacturer is . Then,
Similarly, when the customer’s private preference is sample ‘B’, the difference in utility between the two equilibria for customers is , and the difference in utility between the two equilibria for the manufacturer is . Then,
The utility differences between two different equilibrium states are shown in Table 9 below.
Table 9.
Utility difference between two different equilibrium states.
When the customer’s private preference is sample ‘A’, under the condition that inequality 1 holds, the manufacturer receives signal ‘a’ and produces product ‘A’. Then, the customer purchases the NEV that matches their private preference, where the pricing is ; Under the condition that inequality 2 holds, the manufacturer will receive signal ‘b’, but surprisingly, the manufacturer will produce product ‘A’, and the customer will still purchase the NEV that is the same as their private preference, where the pricing is . The former situation is more ideal than the latter, as communication between the manufacturer and customers is sincere and effective, leading to more satisfactory results for both.
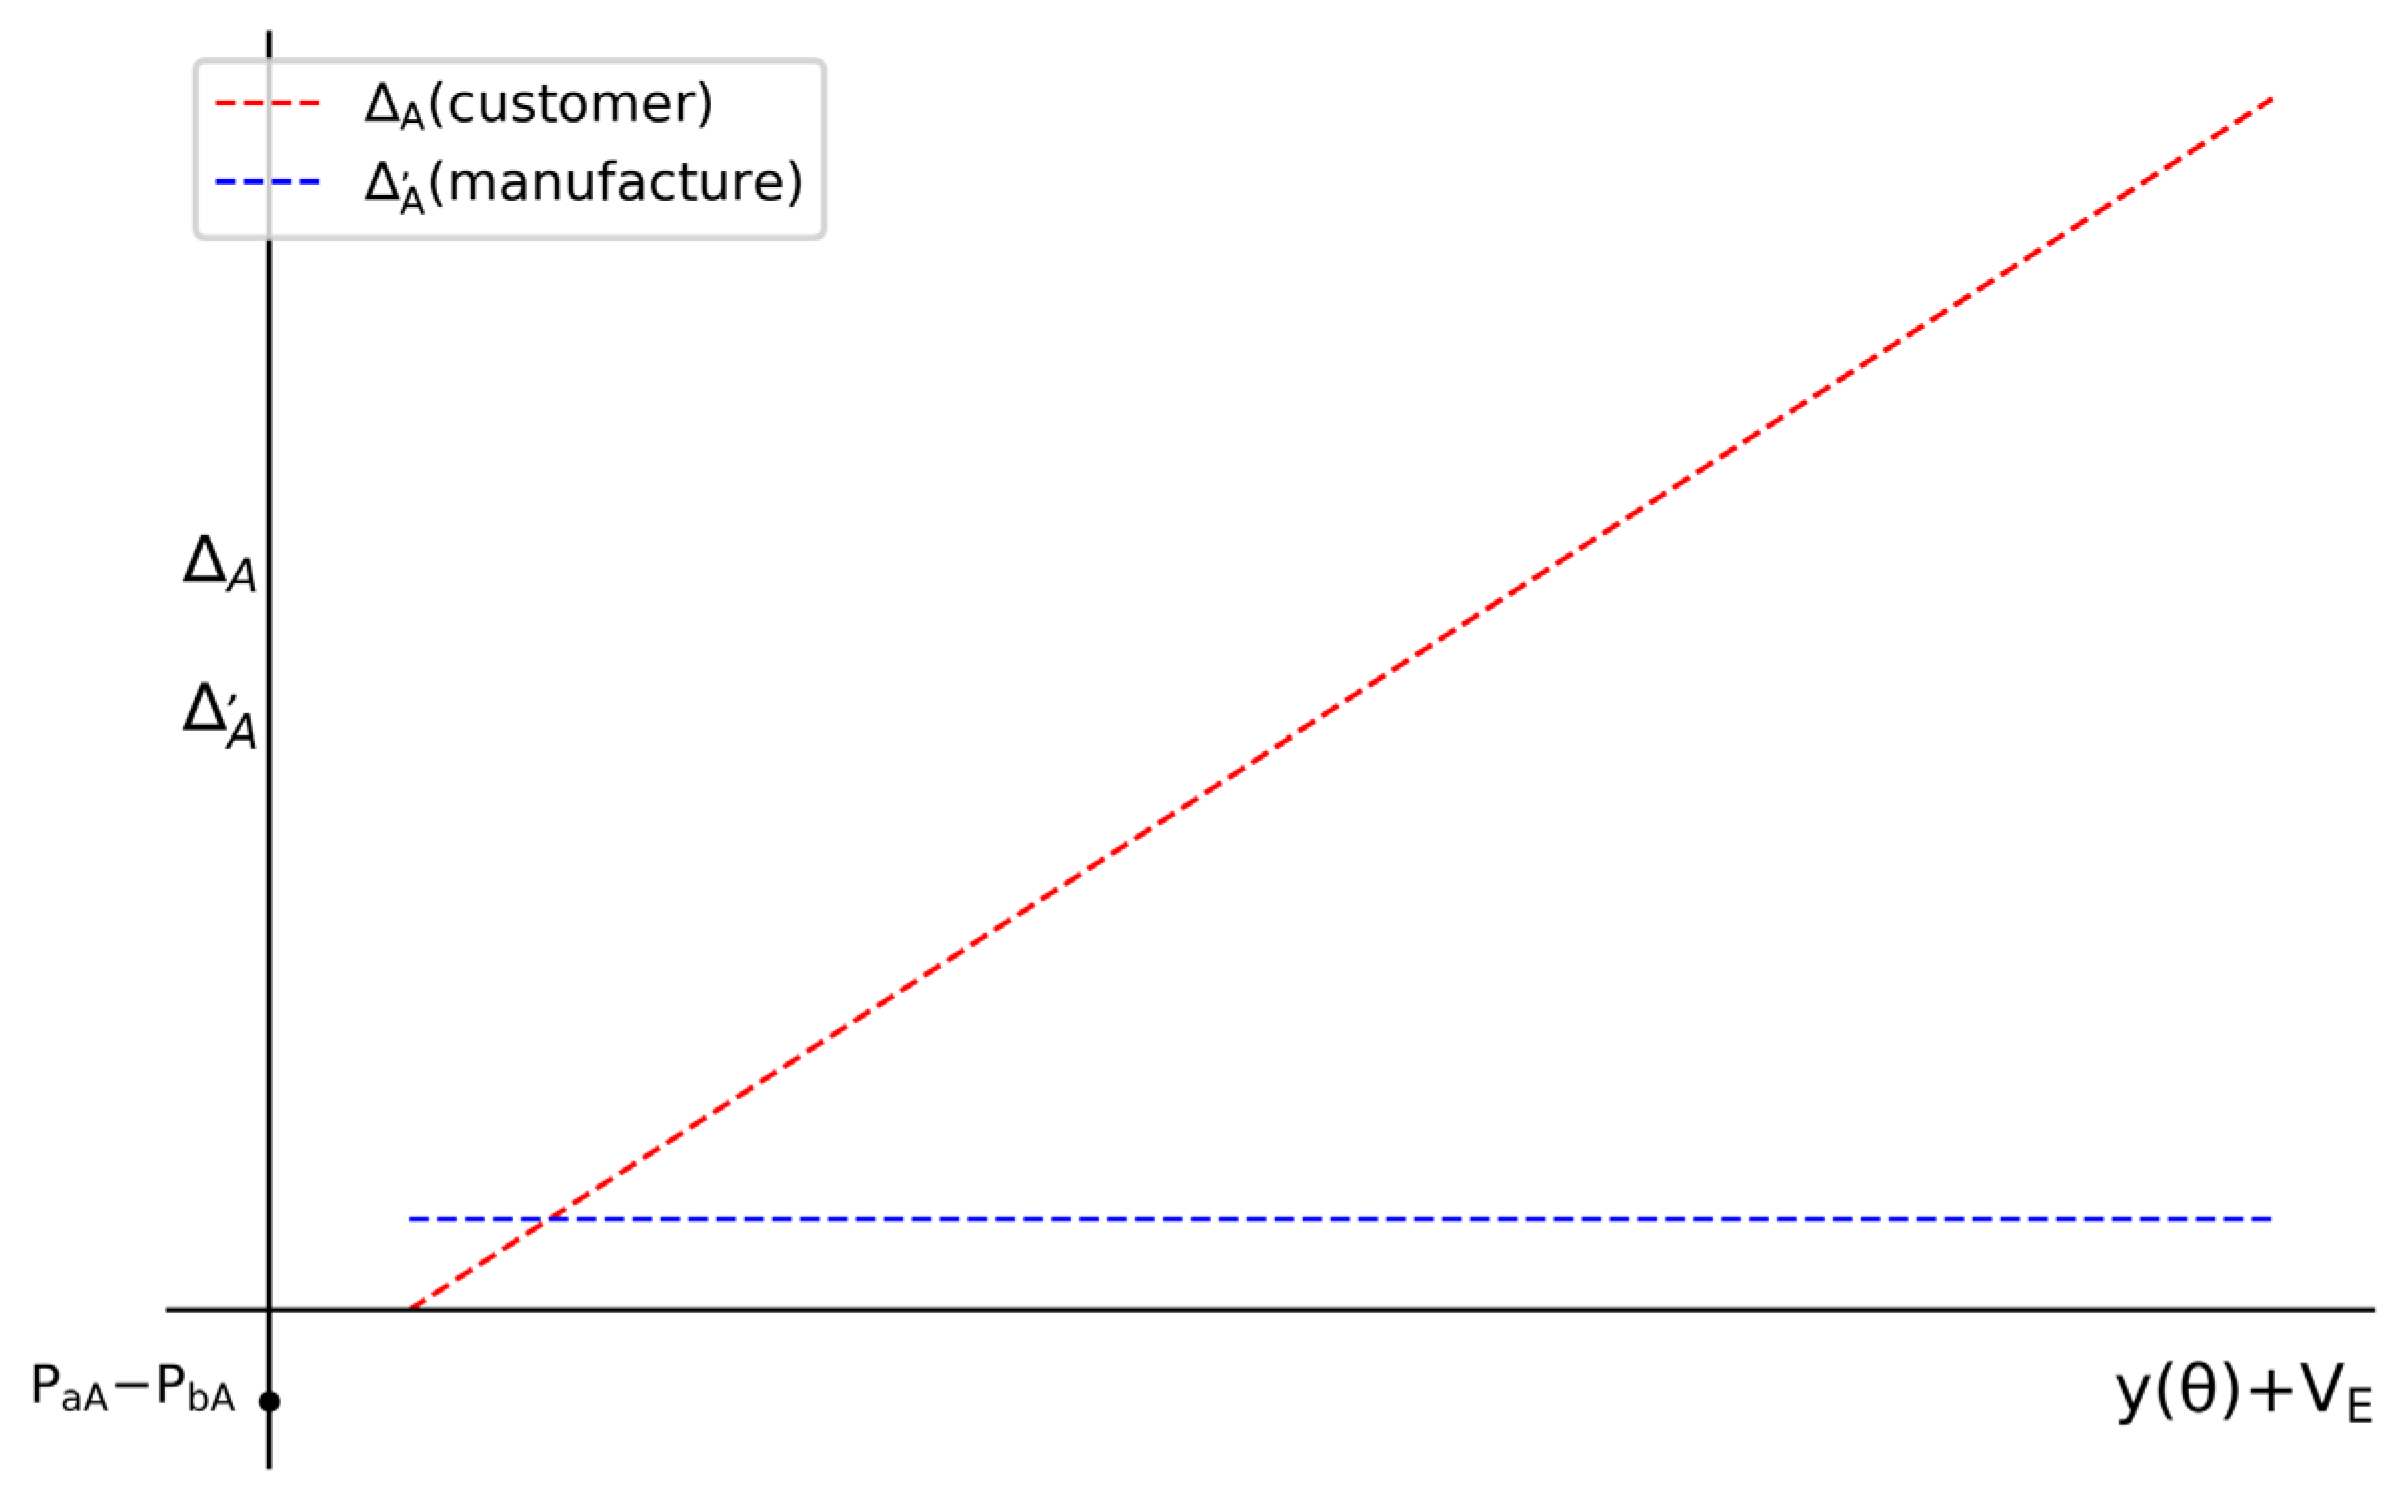
Figure 7 shows that the utility in SE1 is more advantageous for both customers and the manufacturer, and the degree of difference in customer utility increases with .
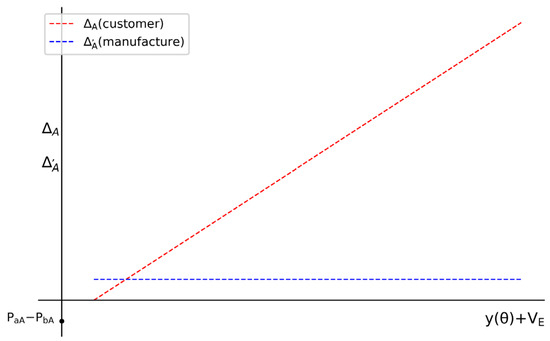
Figure 7.
The difference in utility between two equilibrium states when the customer’s private preference is sample ‘A’.
The equilibrium under condition 1 agrees with academic research on the user screening mechanism preceding co-creation [23] and the motivation of user participation [24]. These research findings promote high and , which will also contribute to the formation of the first equilibrium state. In practice, Tesla’s official website announced the Tesla Car Enthusiast Club. Members of this club are entitled to participate in market research and the testing of new software. In order to motivate these customers, Tesla has provided them with more thoughtful service and various discounts and benefits, thus creating a more sincere and effective communication environment.
Under the condition that inequality 2 holds, the manufacturer will receive signal ‘b’. However, the manufacturer will, surprisingly, produce product ‘A’. Consequently, in the process of forming this equilibrium, there may be a lack of trust in communication between the manufacturer and customers, resulting in insincere and inefficient communication methods. Through trial and error, the manufacturer may find that the customer did not actually tell the truth. Simaei et al. noted the quality issue with customer-generated information [25]. Indeed, customers may actively or passively participate in the provision of information. For example, Horng et al. [26] studied the factors related to customers’ active and passive participation. Passive participation corresponded to low . If the manufacturer uses online reviews to understand customer preferences, the manufacturer also faces the problem of fake reviews. At this point, some customers may have a very low because they are motivated by other factors to lie [27]. In addition, customers may not disclose their true preferences due to concerns about information leakage. If both and are low, a second equilibrium may be formed, which may include trial and error costs in the process of forming the equilibrium, leading to inefficient communication between the manufacturer and customers.
In short, regardless of the classification of new energy vehicles, including EVs, PHEVs, HEVs, EREVs, FCEVs, and HFCEVs, understanding customer preferences is crucial in today’s increasingly competitive environment. The transmission path of customer preferences from sending to receiving and then to subsequent decisions is influenced by their constraint conditions. The equilibrium of condition 1 is better than that of condition 2, with higher utility for both manufacturer and customer. The key to achieving this equilibrium is to enhance the positive motivation while increasing the cost of lying , thus creating sincere and effective communication scenarios.
7. Conclusions
7.1. Main Findings
The customers’ preference transmission in new sample selection is a dynamic game with incomplete information; in this game, two parameters matter. Under certain conditions, this game will form two separate equilibrium states.
When the cost of lying is high, and the psychological expectation value is high, such an equilibrium will be formed: The customers will send a real preference signal, and then the manufacturer will adopt a new sample consistent with the received signal and price it. Finally, the customers will pay for the new NEV. Conversely, when and are low, the customers will send only the signal opposite to their real preferences. Then, the manufacturer will, surprisingly, adopt a new sample opposite to the received signal and price it. Finally, the customers will pay for the new NEV.
On one hand, in the former equilibrium state, the manufacturer and customers will obtain greater utility. The former equilibrium state represents an ideal equilibrium in which customers actively participate, obtain high , and are less willing to lie. This situation means that is high, thus enabling positive, sincere, and effective communication. This result agrees with academic research on the use of a screening mechanism before co-creation and the motivation of user participation, which helps generate high and . In practice, some manufacturers, such as Tesla, are already producing this superior equilibrium state.
On the other hand, customers may passively participate in co-creation, which corresponds to low . Customers may also, for various reasons, send information that does not match their private preferences, corresponding to a low . If both and are low, a second equilibrium state may be formed, which may include trial and error costs in the process of forming the equilibrium, leading to inefficient communication between the manufacturer and customers.
7.2. Limitations and Implications
This study used to represent the cost of lying. However, we do not know the numerical relationship between the cost of lying and the lead degree of the customers. Based on existing research findings, which suggest that lead customers are more willing to cooperate, we assumed that would increase with an increase in . Further research is needed to identify the factors that may affect the cost of lying for customers in order to optimize the definition of the cost-of-lying function.
This study contributes to the current scholarly literature on understanding customer preferences. First, in the past two decades, research on customer preferences for new energy vehicles has been conducted from different perspectives, with various methods used to obtain customer preference information. However, there is still a gap between the promotion of new energy vehicles and the public’s purchase preferences [17]. This study analyzed the different equilibrium results and factors related to customer preferences from the perspective of a preference signal transmission mechanism. Thus, our results contribute to filling the aforementioned gap. Second, research on the user screening mechanisms before co-creation and the motivation of user participation [20,21] is consistent with the formation of the first equilibrium state reported in this paper, which makes this study a bridge between research in this area and current customer preference research.
Given that the equilibrium of condition 1 was better than that of condition 2, with higher utility for both manufacturer and customers, we will provide some suggestions from different perspectives. For new energy vehicle manufacturers in the stage of learning customer preferences, it is recommended that positive motivation is enhanced while increasing the cost of lying , thus creating a sincere and effective communication environment. The manufacturer can improve by screening lead customers. For customers, expressing one’s real private preferences is more advantageous. Therefore, it is recommended that customers actively and truthfully express their own thoughts.
Author Contributions
Conceptualization, S.Z. and Y.D.; methodology, S.Z. and Y.D.; software, S.Z.; formal analysis, S.Z. and Y.D.; investigation, S.Z.; resources, Y.D.; writing—original draft preparation, S.Z.; writing—review and editing, S.Z.; visualization, S.Z.; supervision, Y.D.; project administration, Y.D.; All authors have read and agreed to the published version of the manuscript.
Funding
This research received no external funding.
Institutional Review Board Statement
Not applicable.
Informed Consent Statement
Not applicable.
Data Availability Statement
No new data were created or analyzed in this study. Data sharing is not applicable to this article.
Conflicts of Interest
The authors declare no conflicts of interest.
References
- Wang, N.; Tang, G. A review on environmental efficiency evaluation of new energy vehicles using life cycle analysis. Sustainability 2022, 14, 3371. [Google Scholar] [CrossRef]
- Sgarbossa, F.; Arena, S.; Tang, O.; Peron, M. Renewable hydrogen supply chains: A planning matrix and an agenda for future research. Int. J. Prod. Econ. 2023, 255, 108674. [Google Scholar] [CrossRef]
- Gurz, M.; Baltacioglu, E.; Hames, Y.; Kaya, K. The meeting of hydrogen and automotive: A review. Int. J. Hydrogen Energy 2017, 42, 23334–23346. [Google Scholar] [CrossRef]
- He, W.; Hao, X. Competition and welfare effects of introducing new products into the new energy vehicle market: Empirical evidence from Tesla’s entry into the Chinese market. Transp. Res. Part A Policy Pract. 2023, 174, 103730. [Google Scholar] [CrossRef]
- Cirillo, C.; Liu, Y.; Maness, M.A. Time-dependent stated preference approach to measuring vehicle type preferences and market elasticity of conventional and green vehicles. Transp. Res. Part A Policy Pract. 2017, 100, 294–310. [Google Scholar] [CrossRef]
- Ma, J.; Bao, B.S.; Liu, L.; Wang, X. Dynamic game evolution complexity of new energy and fuel vehicle manufacturers under carbon cap-and-trade policy. Manag. Decis. Econ. 2024. [CrossRef]
- Kim, J.; Seung, H.; Lee, J.; Ahn, J. Asymmetric preference and loss aversion for electric vehicles: The reference-dependent choice model capturing different preference directions. Energy Econ. 2020, 86, 104666. [Google Scholar] [CrossRef]
- Cordera, R.; dell’Olio, L.; Ibeas, A.; Ortúzar, J.D.D. Demand for environmentally friendly vehicles: A review and new evidence. Int. J. Sustain. Transp. 2019, 13, 210–223. [Google Scholar] [CrossRef]
- Li, Y.Y.; Song, F.H.; Liu, Y.; Wang, Y. Cognitive preference performance of in-vehicle human–Machine interface icons under female new energy vehicles. Sustainability 2022, 14, 14759. [Google Scholar] [CrossRef]
- Lin, Z.Z.; Zhai, W.M.; Li, S.S.; Li, X. Evaluating the impact of the center control touch screen of new energy vehicles on user visual imagery and preferences. Displays 2023, 78, 102435. [Google Scholar] [CrossRef]
- Jung, J.; Yeo, S.; Lee, Y.; Moon, S.; Lee, D.J. Factors affecting consumers’ preferences for electric vehicle: A Korean case. Res. Transp. Bus. Manag. 2021, 41, 100666. [Google Scholar] [CrossRef]
- Papantoniou, P.; Mylonas, C.; Spanou, P.; Pavlou, D. Investigation of User’s Preferences on Electric Passenger Cars. In Proceedings of the 6th Conference on Sustainable Urban Mobility (CSUM)—Smart Energy for Smart Transport, Karditsa, Greece, 31 August–2 September 2022; pp. 104–114. [Google Scholar]
- Swain, T.A.; Snyder, S.W.; McGwin, G.; Huisingh, C.E.; Seder, T.; Owsley, C. Older drivers’ attitudes and preferences about instrument cluster designs in vehicles revealed by the dashboard questionnaire. Cogn. Technol. Work. 2023, 25, 65–74. [Google Scholar] [CrossRef] [PubMed]
- Cai, M.S.; Ge, B.F.; Dou, Y.J.; Huang, G.; Du, Y.H. PURA: A product-and-user oriented approach for requirement analysis from online reviews. IEEE Syst. J. 2022, 16, 566–577. [Google Scholar] [CrossRef]
- Wang, X.G.; Cheng, Y.; Lv, T.; Cai, R.J. Fuel vehicles or new energy vehicles? A study on the differentiation of vehicle consumer demand based on online reviews. Mark. Intell. Plan. 2023, 42, 1236–1251. [Google Scholar] [CrossRef]
- Gary, C.; Ismael, R.L. Personal lies. Econ. Lett. 2024, 235, 111496. [Google Scholar]
- Jiang, Y.; Wu, Q.; Li, M.; Gu, Y.; Yang, J. What is affecting the popularity of new energy vehicles? A systematic review based on the public perspective. Sustainability 2023, 15, 13471. [Google Scholar] [CrossRef]
- Spence, M. Job market signaling. Q. J. Econ. 1973, 87, 355–374. [Google Scholar] [CrossRef]
- von Hippel, E. Lead users: A source of novel product concepts. Manag. Sci. 1986, 32, 791–805. [Google Scholar] [CrossRef]
- Globocnik, D.; Faullant, R. Do lead users cooperate with manufacturers in innovation? Investigating the missing link between lead userness and cooperation initiation with manufacturers. Technovation 2021, 100, 102187. [Google Scholar] [CrossRef]
- Axtell, C.M.; Holman, D.J.; Unsworth, K.L.; Wall, T.D.; Waterson, P.E.; Harrington, E. Shopfloor innovation: Facilitating the suggestion and implementation of ideas. J. Occup. Organ. 2000, 73, 265–285. [Google Scholar] [CrossRef]
- Frese, M.; Teng, E.; Wijnen, C.J. Helping to improve suggestion systems: Predictors of making suggestions in companies. J. Organ. Behav. 1999, 20, 1139–1155. [Google Scholar] [CrossRef]
- Xiong, J.; Chen, X.; Tian, Y.; Ma, R.; Chen, L.; Yao, Z. MAIM: A novel incentive mechanism based on multi-attribute user selection in mobile crowdsensing. IEEE Access 2018, 6, 65384–65396. [Google Scholar]
- Zeynep, D.N.; Basil, G.E.; Aard, J.G.; Efthymios, C. Innovating with the customer: Co-creation motives in online communities. Int. J. Electron. Commer. 2023, 27, 523–557. [Google Scholar]
- Simaei, A.; Hirschheim, R.; Schneider, H. Idea crowdsourcing platforms for new product development: A study of idea quality and the number of submitted ideas. Decis. Support Syst. 2023, 175, 114041. [Google Scholar] [CrossRef]
- Horng, S.M. A study of active and passive user participation in virtual communities. J. Electron. Commer. Res. 2016, 17, 289–311. [Google Scholar]
- Plotkina, D.; Munzel, A.; Pallud, J. Illusions of truth-Experimental insights into human and algorithmic detections of fake online reviews. J. Bus. Res. 2020, 109, 511–523. [Google Scholar] [CrossRef]


Disclaimer/Publisher’s Note: The statements, opinions and data contained in all publications are solely those of the individual author(s) and contributor(s) and not of MDPI and/or the editor(s). MDPI and/or the editor(s) disclaim responsibility for any injury to people or property resulting from any ideas, methods, instructions or products referred to in the content. |
© 2024 by the authors. Licensee MDPI, Basel, Switzerland. This article is an open access article distributed under the terms and conditions of the Creative Commons Attribution (CC BY) license (https://creativecommons.org/licenses/by/4.0/).