


Spatiotemporal Patterns in the Urban Heat Island Effect of Several Contemporary and Historical Chinese “Stove Cities”
1
Faculty of Resources and Environmental Science, Hubei University, Wuhan 430062, China
2
Institute of Urban Systems Engineering, Beijing Academy of Science and Technology, Beijing 100035, China
*
Author to whom correspondence should be addressed.
Sustainability 2024, 16(7), 3091; https://doi.org/10.3390/su16073091
Submission received: 7 February 2024
/
Revised: 10 March 2024
/
Accepted: 29 March 2024
/
Published: 8 April 2024
(This article belongs to the Topic Climate Change and Environmental Sustainability, 3rd Volume)
Abstract
:Various cities in China have been identified as “stove cities” either in contemporary or historical times, exposing residents to extremely high temperatures. Existing studies on the heat island effect in stove cities are not representative nationwide. The outdated nature of these studies also significantly diminishes the relevance of their findings. Thus, reassessing the urban heat island (UHI) effect of stove cities is necessary in the context of global climate change and urbanization. This study focuses on seven symbolic and geographically distributed stove cities in China, including Nanjing, Chongqing, Wuhan, Fuzhou, Beijing, Xi’an, and Turpan. Using land surface temperature (LST) data, this study investigates the summer heat island effect from 2013 to 2023 and analyzes changes in the spatial distribution of the heat island effect. This paper utilizes impervious surface data and urban clustering algorithms to define urban and suburban areas. It then examines the evolution and spatial distribution of surface urban heat island intensity (SUHII) over time. Incorporating urbanization variables like population density and urban area, the study analyzes the main factors affecting the heat island effect from 2013 to 2018. We find that all cities continuously expand, with the annual average heat island effect intensifying over the years. With the exception of Beijing, the summer heat island or cool island effects in the remaining six cities show an overall intensification trend. From 2013 to 2018, SUHII has been primarily related to urban expansion and planning layout, with minimal impact from factors such as population density.
1. Introduction
The urban heat island phenomenon predominantly stems from urban development and human activities. It denotes a scenario where the temperature within a city notably surpasses that of its surrounding countryside or suburban areas despite experiencing identical climate conditions. Specifically, the dense configuration of urban buildings, coupled with asphalt and cement roads, possesses higher heat absorption rates and lower heat capacities than the soil and vegetation found in suburban areas. This discrepancy causes urban zones to rapidly accumulate heat, emitting substantial thermal radiation into their surroundings and the atmosphere. Moreover, artificial heat sources within cities (such as air conditioners, motor vehicles, and other urban activities) contribute to the elevation of urban temperatures. Additionally, the absence of vegetation and an irrational urban spatial layout exacerbates this trend, significantly contributing to the rise in temperatures within urban locales. The combination of these elements jointly changes the microclimate characteristics of the city, causing the temperature in the urban area to be generally higher than the temperature in surrounding suburbs. The high-temperature urban area is surrounded by low-temperature suburbs [1].
The urban heat island effect carries substantial repercussions, profoundly impacting not just the ecological environment within cities but also the quality of life and safety of urban residents [2,3,4]. Studies demonstrate that heat stress induced by high temperatures can impact the body’s physiological functions and mental well-being. In severe instances, it can escalate to life-threatening conditions like heat stroke. The elevated nighttime temperatures resulting from the heat island effect pose a challenge as they impede effective rest and recuperation, disrupting people’s lives and productivity. Moreover, this effect triggers a chain of repercussions, including intensified air pollution and heightened electricity and water consumption [5]. These issues collectively hinder the sustainable development of cities, emphasizing the multifaceted impacts of the UHI effect.
Certain cities, shaped by distinctive factors like geographical positioning, urban planning, and industrial growth, have notably amplified high temperatures, earning the moniker of “stove cities”. The term originated during the Republic of China era where cities such as Chongqing, Wuhan, and Nanjing were colloquially referred to as “stove cities” by the media, owing to their scorching summer temperatures and their prominence as major urban centers along the Yangtze River. This designation captures the public’s visceral perception of the sweltering climate in these urban areas, albeit lacking clear definitions and standardized criteria. In the 21st century, considerations have expanded to include factors such as the heat index, frequency of high temperature days, and duration of heatwaves as determinants. Stove cities are typically characterized by a daily maximum temperature of ≥35 °C and are predominantly clustered in the Yangtze River Basin of southern China and the Huanghuai region in the north. The genesis of the urban heat island effect isn’t an isolated occurrence. It intricately intertwines with elements such as concentrated population, escalating energy consumption, burgeoning traffic, and dwindling green spaces in the urbanization process. Recent years have witnessed shifts in China’s urban heat islands due to rapid urbanization and global climate shifts [6]. The confluence of climate warming and accelerated urban growth portends a continued intensification of the heat island effect in Chinese cities.
In the field of UHI research, there is an international emphasis on investigating the factors influencing urban heat islands. This involves analyzing and quantifying the impacts of various factors such as vegetation, water bodies, buildings, land use, and spatial patterns on urban temperatures or microclimates. For example, studies like that of Lin et al. have explored the relationship between the morphology of built-up areas and the UHI effect, suggesting that appropriate spatial layouts of built-up areas can actually mitigate the heat island phenomenon [7]. Furthermore, there is a focus on simulating urban thermal environments. For instance, Mansourmoghaddam et al. employed six machine learning algorithms to model and estimate LST [8].
Current research on stove cities has been explored from various perspectives. Lin et al. conducted an extensive study examining the evolution of the thermal environment in Nanjing, Hangzhou, Fuzhou, and Guangzhou from 1990 to 2010 [9]. Simultaneously, Shen et al. delved into the intricate spatiotemporal dynamics of urban surface heat island intensity and surface temperature patterns in Wuhan and Nanchang between 1984 and 2018, unveiling a remarkable contrast in the spatiotemporal patterns between the two cities [10]. Moreover, Li et al. focused on investigating the impact of urban redevelopment on the SUHI phenomenon within Guangzhou City. Their research highlighted the profound potential of strategic urban planning and redevelopment initiatives in notably mitigating the local SUHI intensity growth rate [11], however, the present research still has several limitations. Firstly, current research on stove cities largely consists of studies analyzing individual cities or similar urban areas such as Nanjing and Wuhan [12,13,14,15]. These studies have a narrow research focus, primarily concentrating on variations in the thermal environment and the influencing factors of specific cities. Secondly, there is a dearth of recent research analysis. Thirdly, scholarly attention is predominantly directed towards densely populated or large-scale cities, with limited studies on the heat island effect in inland northwest cities (such as Turpan, the conventional stove city).
This paper focuses on the rapid urbanization of China since the year 2000, analyzing from the perspectives of spatial and temporal patterns to gain new insights into the spatiotemporal evolution of UHI. It primarily explores the SUHI dynamics within the contemporary and historical stove cities from 2013 to 2023. Through comparative analysis, it delves further into the trends and causes of UHI changes, aiming to enhance understanding of the UHI phenomenon in stove cities [16,17]. Compared to existing studies, this paper covers a wide range, and its selection of study areas is evenly distributed. It includes densely populated cities like Beijing, less intense cities like Wuhan, and even areas with lower population density such as Turpan in the northwest, making the results broader. Additionally, this study is highly novel, analyzing surface UHI changes from 2013 to 2023 and filling a gap in the latest findings of stove cities within domestic research. However, we can only analyze the correlation from 2013 to 2018 due to data limitations.
To achieve this objective, we proposed multipronged statistical methodologies integrating moderate-resolution imaging spectroradiometer (MODIS) data, impervious surface data, and related datasets. Initially, urban and suburban areas were delineated using a city clustering method. Subsequently, summer and annual mean LST data for each study area were obtained through overlay analysis techniques. Finally, we used Spearman analysis to conduct correlation analysis between SUHII changes and surface temperature, urban expansion, population density, and other aspects. This analysis aimed to uncover the spatiotemporal evolution characteristics of the urban heat island phenomenon in these cities and its correlation with natural and anthropogenic factors. The urban clustering method selected for this study is primarily based on the approach developed by Imhoff et al. [18]. This method has been referenced by many researchers such as [19,20], indicating its significant impact and widespread adoption in the field. The insights gained provide a scientific foundation for various critical aspects including urban planning, climate change adaptation, resource management, and ecological conservation.
2. Materials and Methods
2.1. Study Area
This study meticulously considers the selection of target cities in China. Factoring in climate distribution, urban geography, and social environment, we screened seven cities across China to facilitate a comprehensive analysis of the heat island phenomenon. These cities were chosen to ensure a broad representation across geographical regions throughout the country. The selected cities are as follows: Nanjing, Chongqing, Wuhan, Fuzhou, Beijing, Xi’an, and Turpan. Notably, four cities are within the southern regions, while the remaining three are in northern regions.
It is noteworthy that while the urban heat island effect in Turpan exhibited a gradual upward trend over the 40 years from 1974 to 2013 [21], recent years have witnessed considerable fluctuations in Turpan’s heat island dynamics. Hence, we have included Turpan in our analysis due to this intriguing instability in its heat island changes. The geographical location is shown in Figure 1.
As per the “Statistical Charts of Economic and Social Development” published by the National Bureau of Statistics in 2021, Beijing and Chongqing belong to megacities, defined by having a population of permanent residents surpassing 10 million. Nanjing, Wuhan, and Xi’an fall into the category of large cities, with populations ranging between 5 million to 10 million.
Chongqing resides within the subtropical humid climate zone, while Nanjing, Fuzhou, and Wuhan share the subtropical monsoon climate akin to Chongqing’s climatic profile. Beijing and Xi’an fall under the temperate monsoon climate, whereas Turpan experiences the continental warm mild desert climate. Beyond climate, these southern cities share resemblances in terrain and landforms, predominantly marked by mountainous and hilly landscapes interwoven with intricate water systems comprising numerous urban rivers. Beijing and Xi’an have similar climate conditions, situated on northern plains, encircled by hills and mountains. These nuances and distinctions in climate, geography, and topography amplify the study’s comparative scope and depth.
2.2. Materials
2.2.1. Impervious Surface Data
We delineated urban and suburban areas’ boundaries using the impervious surface data product developed by Tsinghua University’s Department of Earth Sciences. This extensive impervious surface dataset is a culmination of remote sensing images and Google Earth Engine (GEE), synergized with Tsinghua University’s proprietary impervious surface identification algorithm. This fusion enabled the creation of comprehensive global 30 m resolution data showcasing annual urban impervious surfaces from 1985 to 2018 [22]. This study primarily utilized impervious surface data from 2013 and 2018, however, there was a lack of impervious surface data for 2023, leading us to reference land cover data spanning from 1985 to 2022 (https://doi.org/10.5281/zenodo.8176941) [23]. This data indicates a significant reduction in urban expansion post-2018. Consequently, we assert that the impervious surface data from 2018 is suitable for analyzing the urban heat island phenomenon in 2023. Table 1 illustrates the changes in impervious surface coverage from 2013 to 2022 based on the land cover dataset.
2.2.2. Vector Data
This study primarily relies on two types of vector data: (1) administrative division data delineating the study area and (2) comprehensive water system data. The water system data was sourced from the 1:1 million national basic geographic database available via the National Geographic Information Resources Directory Service System (https://www.webmap.cn, accessed on 2 August 2023). This database, a public version updated in 2021, encompasses a spectrum of nine datasets: water, residential areas and facilities, transportation, pipelines, boundaries and political districts, landforms and soil quality, vegetation, place names, and notes. Each data layer is identified by a specific four-character nomenclature. The initial character signifies the data classification, followed by a content abbreviation in the second and third characters, concluding with a character indicating the geometry type. Specifically, “H” denotes the water system, and for this study, we utilized the water system (area) data identified as “HYDA” within the water system dataset. Due to the lack of updated water system data annually, the study opted to maintain overall data consistency by utilizing the data from 2021 for the entire analysis.
2.2.3. LST Data
Since one-kilometer resolution can meet our analysis needs, higher resolution data greatly increases the workload and complexity of data acquisition, processing, and analysis. Therefore, this study utilized MOD11A1 data products as primary remote sensing sources.
The MOD11A1 product data captures daytime and nighttime land surface temperatures globally, offering daily coverage and a spatial resolution of one kilometer. We employed the GEE platform to process daytime surface temperature data spanning from January to December for the study area in 2013, 2018, and 2023. Monthly value data were directly downloaded, facilitating the computation of both the summer average LST for the period from June to August and the average annual LST.
The data processing primarily involves the following steps: initial data selection, defining the date range (e.g., from 1 January 2023 to 1 January 2024), extracting by mask, and calculating the mean values. This process includes filtering the MOD11A1 dataset from the MODIS database to select surface LST data. Masking is employed to extract data within specified dates and geographical areas, discarding irrelevant information. Subsequently, the daily values for each month are averaged to obtain monthly mean data, mitigating the variability introduced by daily value fluctuations.
2.3. Methods
2.3.1. Identification and Extraction of Urban Scope
We effectively delineated urban and suburban areas by leveraging an urban clustering algorithm. This algorithm clusters city regions with similar characteristics and attributes together to identify core areas. It accounts for critical factors such as the spatial distribution, shape, and size of urban impervious surface data to define urban regions’ boundaries accurately.
This clustering algorithm primarily relies on impervious surface pixel proportions. Areas where the proportion of impervious surface pixels surpass half are identified as urban areas, while the remaining areas are classified as non-urban areas.
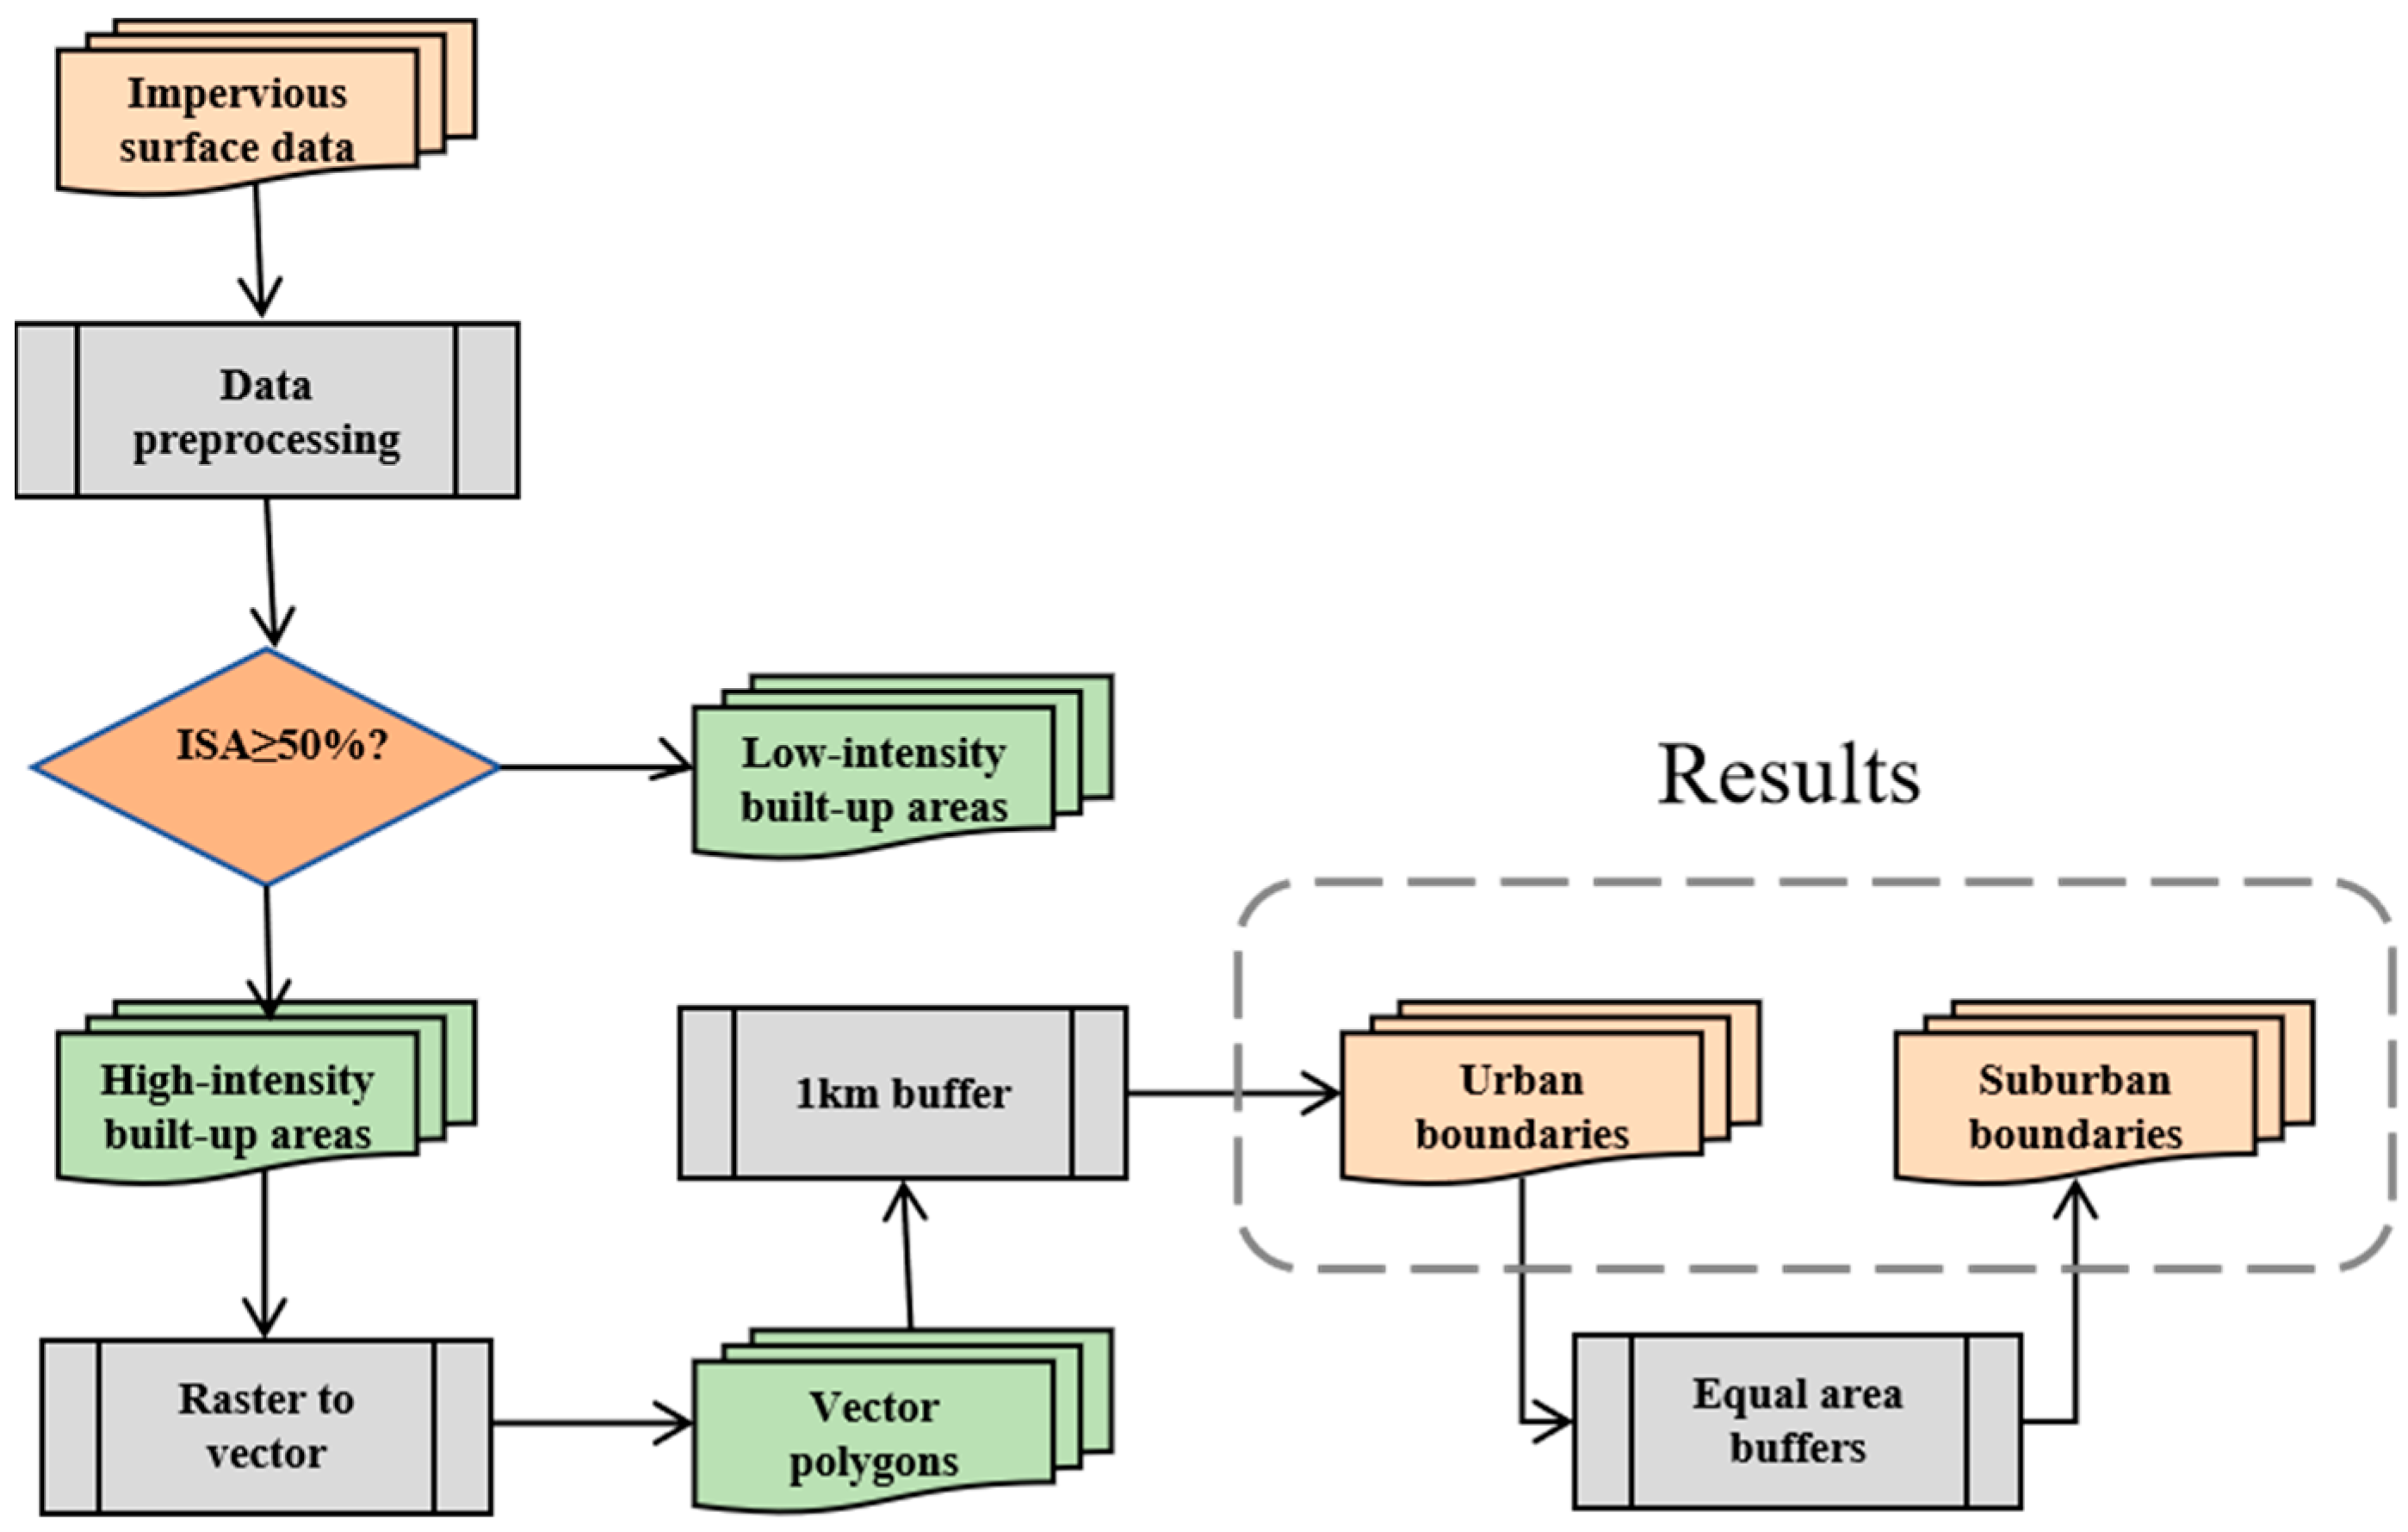
The urban clustering algorithm follows these key steps: Initially, the impervious surface data is aggregated to a size of 900 m × 900 m to align with the MODIS LST data pixel dimensions. Subsequently, a building intensity threshold of 50% is applied to distinguish between high- and low-intensity built-up areas [18]. The urban boundary is then demarcated within a one-kilometer radius surrounding the high-intensity region, with careful attention to exclude water bodies and high-altitude pixels. Finally, a buffer zone equivalent in size to the city is established around it, designating it as a suburban area. It is crucial to ensure that both urban centers and suburbs fall within the city’s administrative boundaries. The detailed process is shown in Figure 2.
2.3.2. Calculation of SUHII
The magnitude of UHI effect is commonly quantified through the urban heat island intensity (UHII), denoting the temperature differences between urban and suburb areas [24,25]. When SUHII < 0, it indicates the cold island effect, while SUHII > 0 signifies the presence of the heat island effect [21]. The SUHII for a specific day, denoted as t, can be expressed as Equation (1):
where Ut denotes the urban surface temperature, Rt denotes the suburb surface temperature, and t denotes a specific day.
In academic research, the evolving traits of the urban heat island effect are frequently investigated through its spatiotemporal dynamics, encompassing diurnal, monthly variations, and other influencing factors. This study calculates the evolving characteristics of the urban heat island effect using monthly and quarterly time scales. Specifically, the average SUHII on a given timescale denoted as “d” can be expressed by Equation (2):
the monthly average SUHII and the quarterly average SUHII represent the mean value derived from all days within a month and a quarter, respectively.
2.3.3. Spearman’s Rank Correlation Analysis
Spearman’s rank correlation is a statistical measure utilizing monotonic functions to assess the relationship between two statistical variables. It involves sorting the distributions of two time series statistical variables and computing the correlation based on their order. Spearman’s rank correlation coefficient ranges between −1 and 1, with a larger absolute value indicating a stronger correlation. A coefficient of −1 or 1 indicates a complete monotonic relationship between two variables.
In practical applications, considering a sample size of n and two statistical variables as x and y, they are arranged and transformed into ordered datasets {xn} and {yn} correspondingly. The Spearman rank correlation coefficient is calculated using Equation (3):
In general, when dealing with datasets comprising relatively few sample points, the Spearman rank correlation coefficient offers a more robust description of correlation compared to other coefficients [26]. This distinctive trait has led to its extensive utilization in economics. In this study, owing to the limited quantity and insufficient refinement of data series, the Spearman rank correlation coefficient was employed.
3. Results
3.1. Urban Expansion (2013–2018)
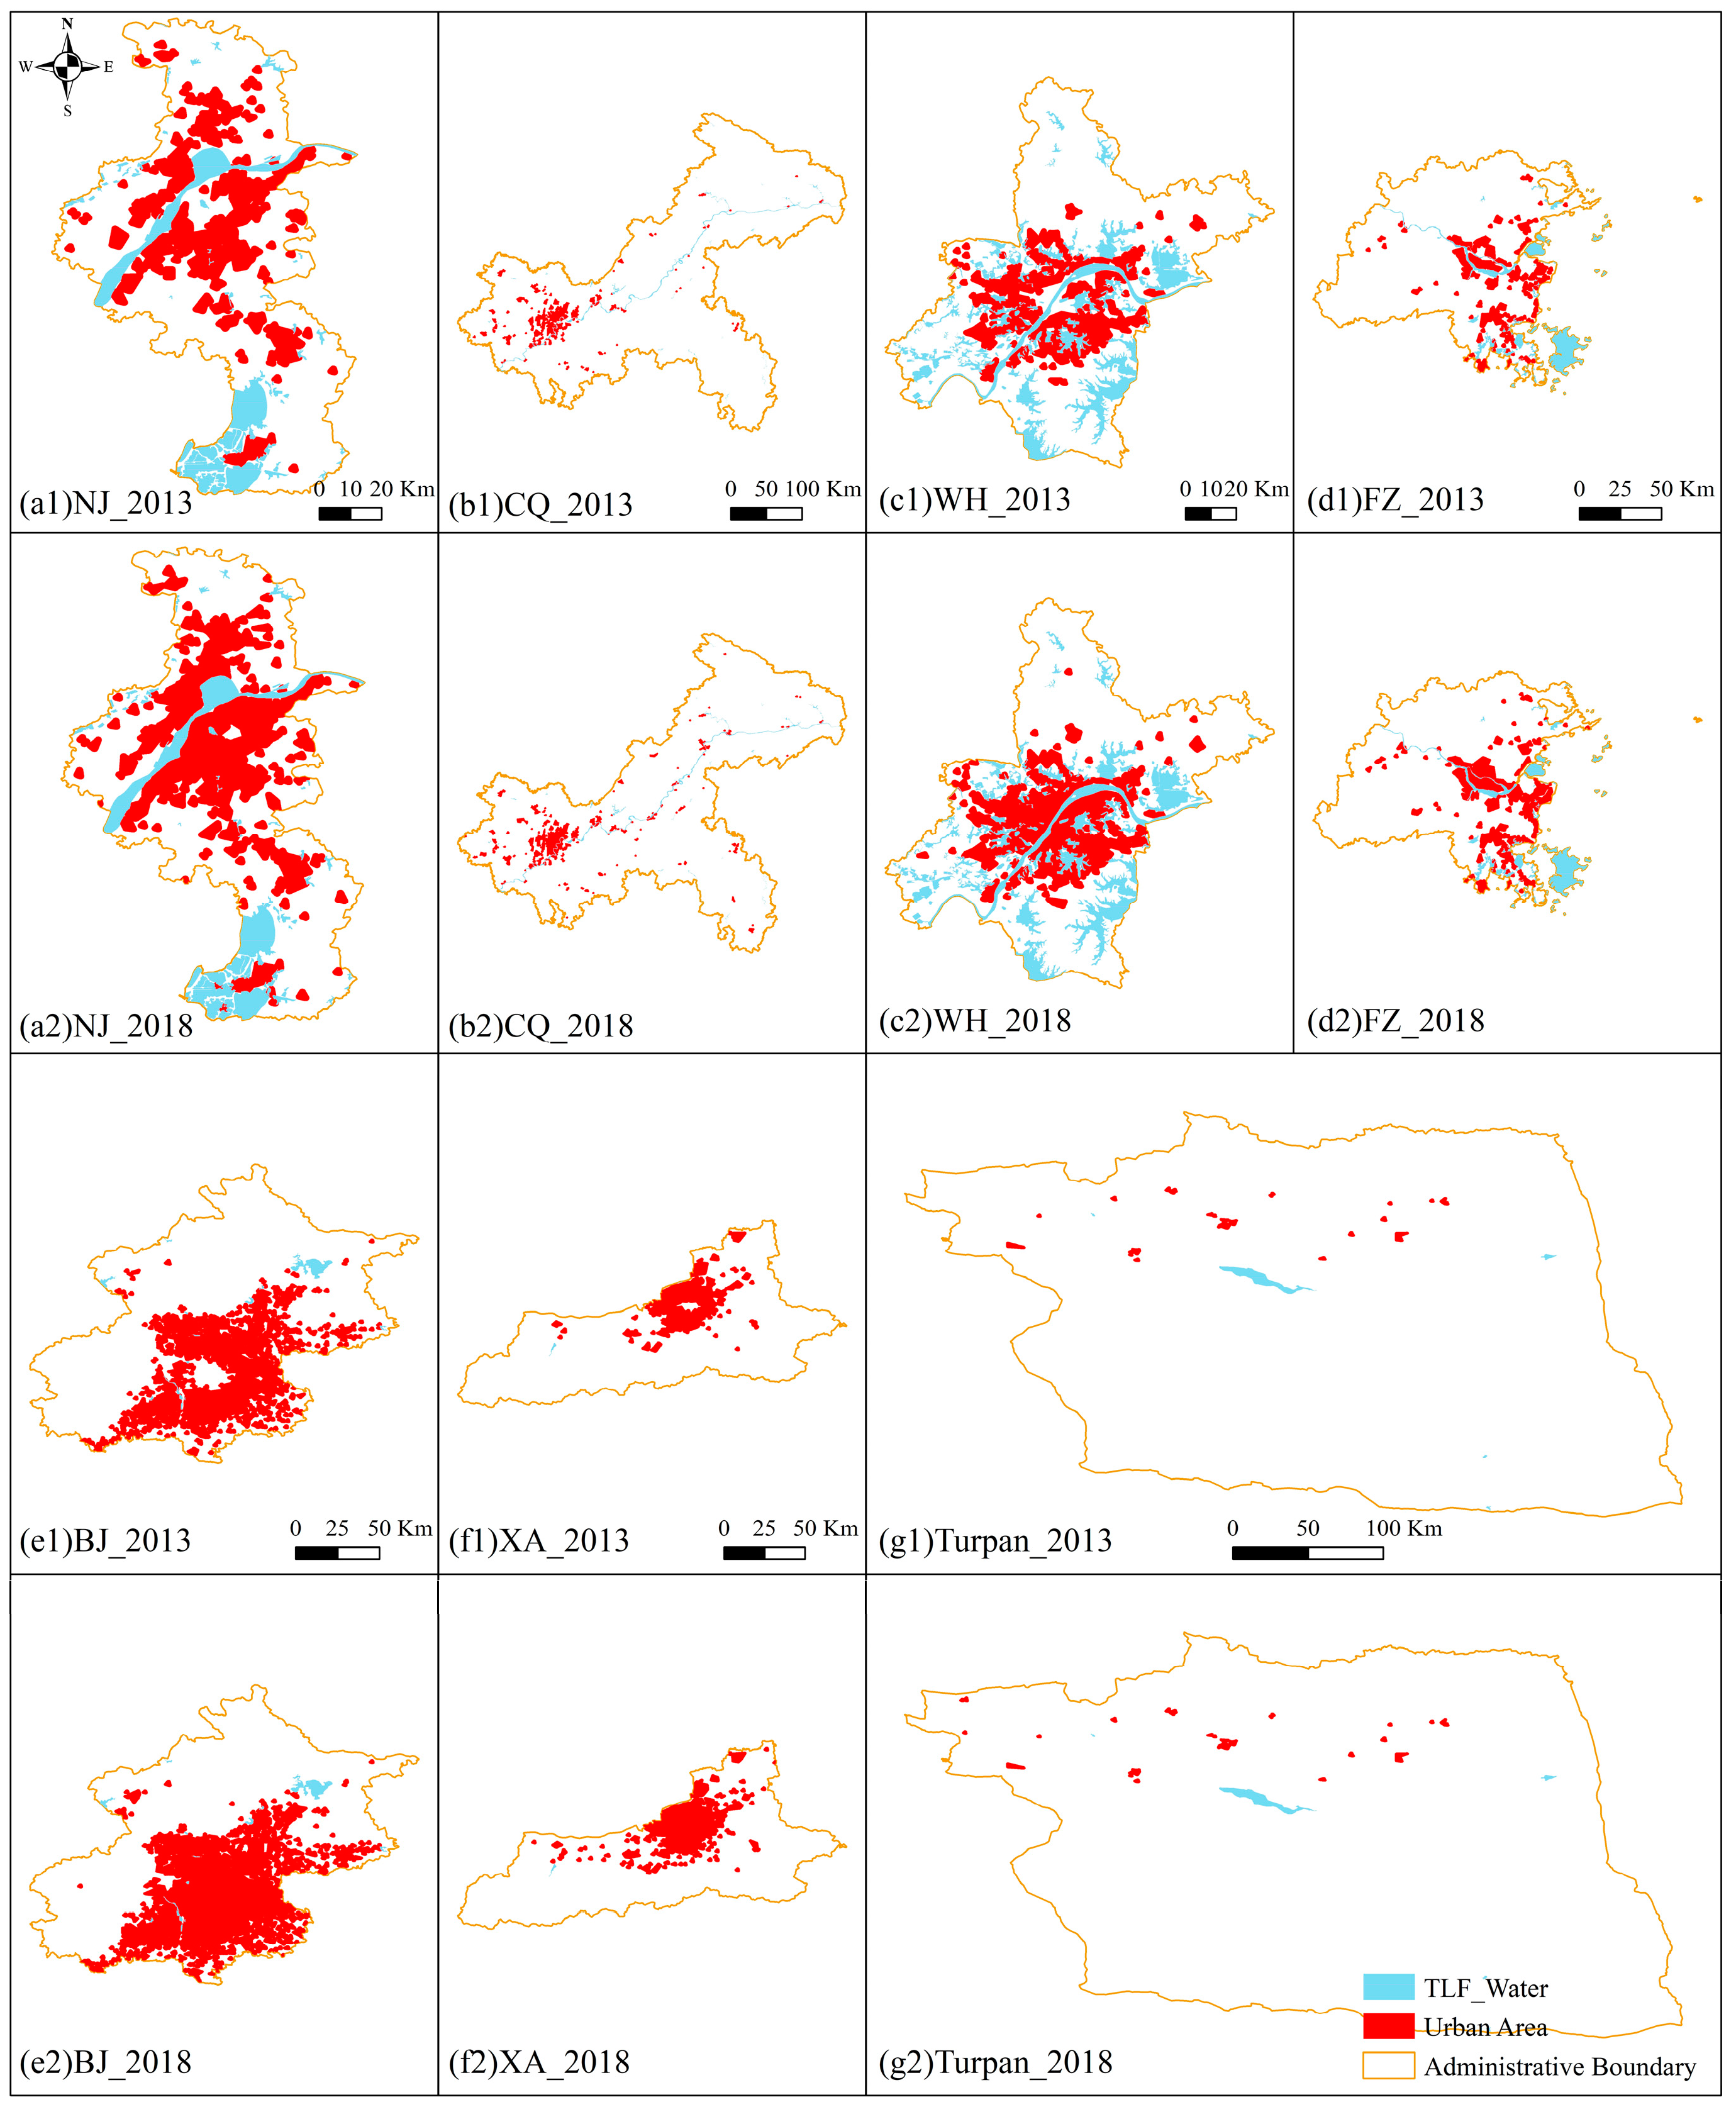
The urban clustering algorithm was utilized to define the boundaries of urban and suburban areas within each study location. Following this, we conducted a comparative analysis focusing on the urban area extents for 2013 and 2018. The spatial distribution characteristics observed within each urban area are visible in Figure 3.
When considering spatial distribution, notable characteristics emerge distinctly, including:
- The urban areas in Nanjing, Wuhan, and Fuzhou predominantly cluster on both banks of the river. This distribution emphasizes their reliance on river and marine resources as pivotal elements for their development.
- The urban areas of Beijing and Xi’an exhibit a distinct agglomeration trend. Both cities are highly conducive to urbanization and situated on flat terrains within plain regions.
- The layout of urban areas in Chongqing are significantly influenced by its distinctive topographical and landform characteristics marked by mountainous and hilly terrain. This leads to a relatively scattered distribution of urban spaces.
- Turpan, situated within the Tarim Basin, boasts relatively flat terrain. However, owing to its encompassment by expansive desert regions, Turpan’s urban expanse is limited and extensively dispersed.
The urban area expansion from 2013 to 2018 is shown in Table 2. The net rate of urban expansion and the expansion area are closely related to the UHI phenomenon. The net urban expansion rate measures the growth of a metropolitan land area over a specific period. The increase in expansion area and net expansion rate usually implies the replacement of natural surfaces with buildings, roads, and other artificial surfaces. These changes directly affect the urban thermal balance and microclimate, thus promoting the formation and intensification of UHI. It is shown that, from 2013 to 2018, Xi’an and Nanjing recorded the highest net expansion rates, 33.59% and 30.38%, respectively. Beijing experienced the most extensive expansion area, reaching 1062.3 km2, followed by Chongqing and Nanjing. Conversely, Turpan and Wuhan had the lowest expansion rates and areas.
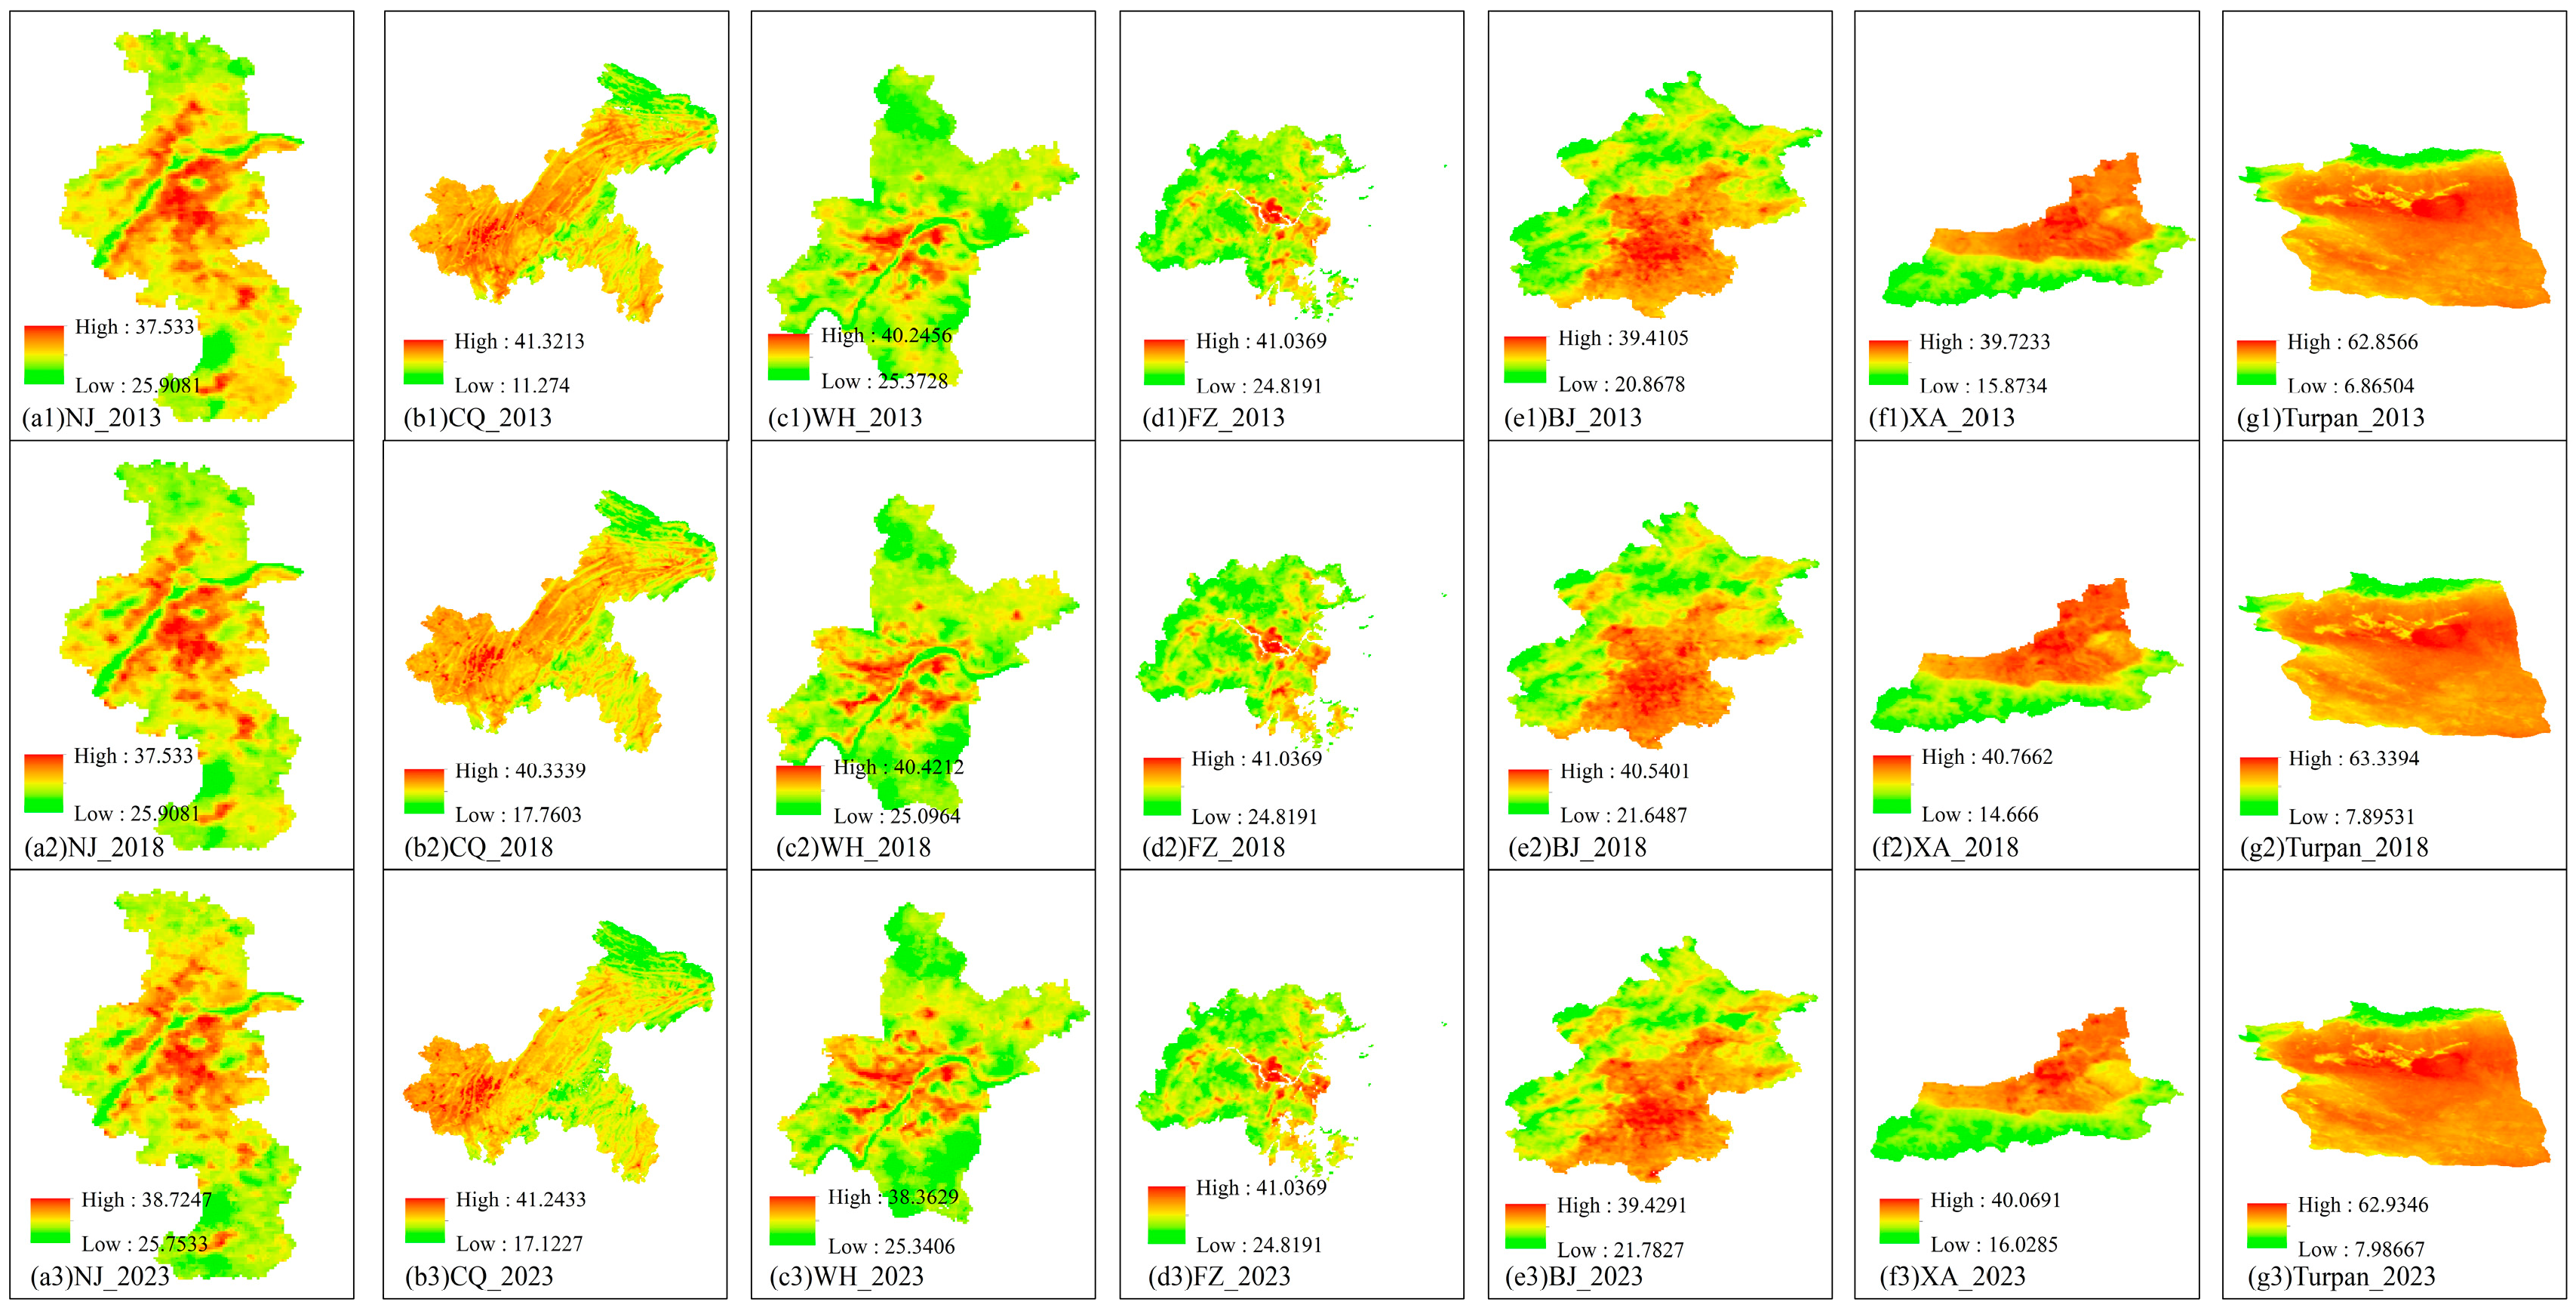
3.2. Changes in Spatiotemporal Patterns
To visually portray disparities in heat island effects across various stove cities, we conducted mapping and analysis of the spatial and temporal trends of urban heat islands in seven cities, spanning from 2013 to 2023.
3.3. Correlation Analysis
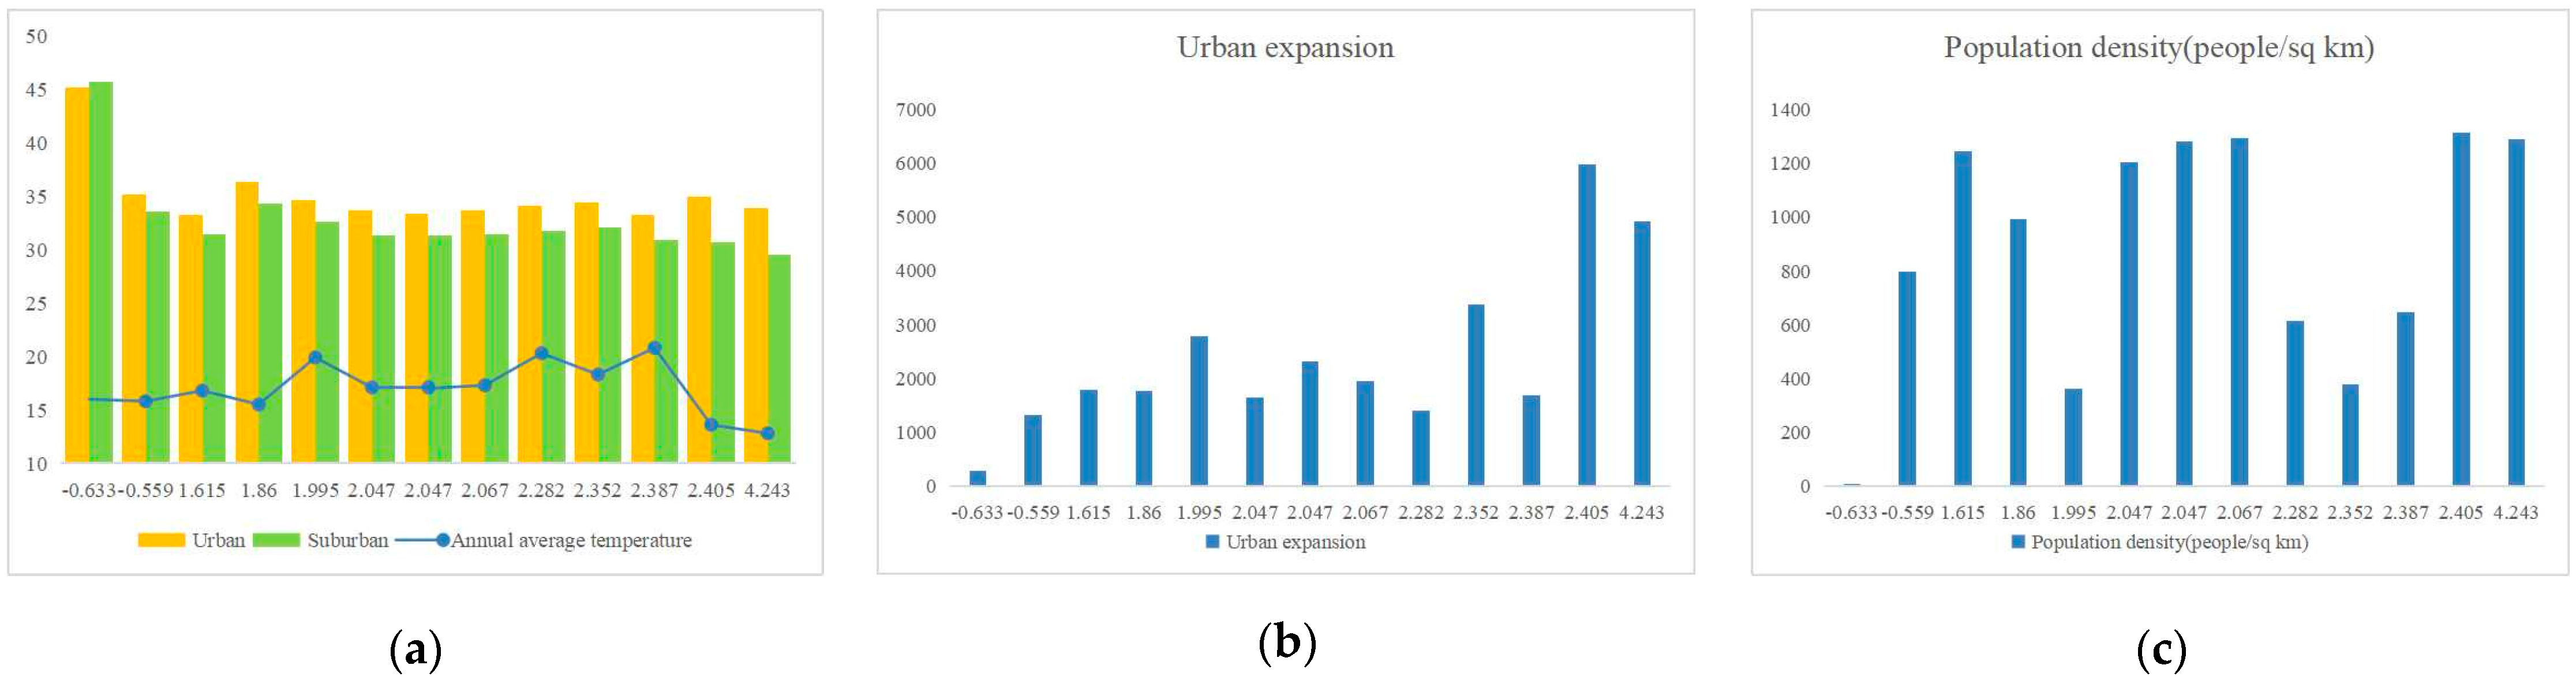
The changes in summer SUHII and average temperatures between 2013 and 2018 for the seven cities are examined, specifically calculating five correlations involving temperature (urban and suburban areas), urban expansion, population density, and annual average temperature.
Population density is derived from resident population and designated zoning area. However, the yearbook data for Turpan City lacks permanent population details, thus the year-end total population data is utilized instead. The Spearman correlation coefficient resulting from calculations is presented in Figure 5 and Table 5.
Based on the Spearman correlation coefficients in Table 5, the analysis reveals the following associations: SUHII shows no correlation with three factors: urban surface temperature, population density, and annual average temperature. However, SUHII and suburban surface temperature have a notable negative correlation. Additionally, SUHII exhibits a significant positive correlation with urban expansion.
4. Discussion
4.1. SUHII Trends
According to our findings, China’s UHI effect will likely grow more robust due to rapid urbanization and climate change—especially in the south.
Annual average SUHII from 2013 to 2023 reveals a rising trend in urban heat island effects across all cities. This includes Turpan, where the difference in LST between urban and suburban regions is narrowing, showing a reduced cool island effect. The ongoing increase in annual average SUHII is consistent with the findings of Geng et al. [27] For summer SUHII, all cities, except Beijing and Turpan, saw more substantial heat island effects from 2013 to 2018. However, from 2018 to 2023, Nanjing and Wuhan experienced declining heat island effects. This aligns with changes between the old and new furnace cities. Since the Republic of China era, there have been three major stove cities: Wuhan, Chongqing, and Nanjing. However, Fuzhou replaced Wuhan and Nanjing in 2010. This indicates that our analysis results are highly consistent with public perception.
Notably, based on SUHII changes, Beijing shows a trend of continuous weakening in the heat island effect during summer. However, the annual mean SUHII initially strengthens and then weakens, indicating an overall intensification of the heat island effect. According to Lin et al., the observed patterns are due to the seasonal nature of heat islands [14]. Beijing experiences a weaker heat island effect in summer and a stronger one in winter. Chongqing shows the reverse seasonal trend. Along with seasonal variations, changes are also linked to Beijing’s ecological corridors. According to the “Beijing Urban Master Plan (2016–2035)” released in 2017, the plan is to establish five primary ventilation corridors and multiple secondary ones in the city area by 2035. This long-term strategy aims to create a network of ventilation corridors to enhance heat dissipation in urban areas.
Regarding spatial distribution, the main changes include the expansion of medium- to high-temperature zones and the concentration of high-temperature areas in some cities (such as Chongqing). These changes are direct outcomes of urban expansion. As cities grow outward, surrounding areas gradually urbanize, shifting from lower to medium and high-temperature zones. This process slightly relieves pressure in central urban areas, reducing high-temperature zones or their transition to medium–high-temperature zones. This situation is also related to the effective implementation of urban greening initiatives, enhanced land use efficiency, and urban planning policies. The concentration of high LST regions in Chongqing and the minimal changes in Turpan are likely attributed to geographic and environmental factors limiting urban expansion. Chongqing, known as the “mountain city,” is surrounded by mountains—Daba in the north, Wushan in the east, Wuling in the southeast, and Dalou in the south. This unique topography restricts the outward expansion of Chongqing, preventing relief from urban pressure. The result is increasingly dense construction and difficulty dissipating heat from the city center, leading to increased LST areas. Similarly, the geographical environment of Turpan also restricts the regions available for urban development.
4.2. Correlation Analysis and Measures
Correlation analysis reveals that summer SUHII is significantly negatively correlated with suburban surface temperature and positively associated with urban expansion. Changes in suburban surface temperature are mainly due to urban expansion and planning. This indicates that the urban development process primarily influences summer SUHII in the study area.
The SUHI effect primarily occurs during daytime and is influenced by internal urban factors such as building density, population density, and land use types, making it a key indicator of urban development [21,28]. The research underscores the correlation between the UHI and factors such as urbanization, industrialization, urban population density, nighttime lighting intensity, and climate change [29]. Notably, urbanization is a significant driver of the UHI effect. Studies excluding urbanization’s effects revealed minimal temperature increases—Hansen and Lebedeff noted a mere 0.1 °C rise in global average temperatures [30]. Balling and Idso also found a very 0.02 °C warming in the United States over 64 years from 1920 to 1984 [31]. These findings underscore the profound impact of urbanization on the UHI effect.
This study highlights the correlation between the urban heat island effect and urbanization, specifically urban expansion. Our correlation analysis decisively indicates that population density has ceased to be a significant determinant in the dynamics of the summer surface urban heat island effect within these stove cities. From 2013 to 2018, the population density across the study areas remained relatively stable, underscoring the need to explore other urban factors that contribute to heat island intensity as part of sustainable urban planning efforts.
The heat island effect stands as a critical environmental challenge in the context of socioeconomic growth and urbanization. According to our research, measures can be taken to alleviate the heat island effect, primarily focusing on urban expansion, urban planning, layout adjustments, and green initiatives. These measures can be categorized into the following three key aspects:
- Safeguarding and expanding urban green spaces.
Expanding vegetated areas within urban landscapes is widely recognized as a viable strategy to counteract the UHI effect [32,33]. Vegetation combats heat island effects through evapotranspiration and carbon dioxide absorption, which is particularly beneficial in densely populated urban centers with substantial human activity. Moreover, Theeuwes et al. revealed that a 10% increase in vegetation can generally lead to a temperature reduction of around 0.6 K [34]. However, this mitigation strategy can obstruct airflow within cities.
- 2.
- Planning urban area distribution properly.
Urban planning and layout play a crucial role in urbanization, influencing the characteristics of the UHI effect. The impact of surface urban heat islands must be integrated into urban planning and design to ensure sustainability and human well-being and enhance the city’s self-regulation capacity. Taking the ecological corridors planned in Wuhan and Beijing as examples, these greenways channel “fresh breezes” from the suburbs into the city centers, facilitating what can be described as the city’s “self-breathing” capability. The airflow disruption caused by vegetation should also be strategically addressed in urban landscape planning to mitigate heat accumulation while effectively minimizing airflow disruption. Wuhan and Nanjing share strong similarities in geographical location and the spatiotemporal variations of summer SUHII, making them valuable references for each other in urban planning.
- 3.
- Implement Targeted Policies.
Government policies play a crucial role in addressing heat emissions. Within industrial sectors, the substantial heat emitted by factories highlights the need for regulations to reduce heat emissions effectively. However, beyond corporate efforts, citizen participation is essential. Enhancing public engagement is vital for developing sustainable and health-conscious mitigation strategies. As urban residents, raising awareness about reducing heat emissions and advocating for low-carbon and eco-friendly travel is essential.
Aside from the urban heat island effect discussed earlier, Turpan is one of the few cities experiencing a cool island effect. Unlike the urban heat island effect, the cool island effect has positive impacts, including urban temperature regulation, ecosystem protection, energy saving, and environmental conservation. This effect helps maintain lower temperatures within the city, providing residents a more comfortable environment during hot seasons. Turpan’s current development trajectory is positive and beneficial, but efforts to maintain and enhance the city’s cool island effect are still needed. Insights from strategies to mitigate heat island effects, such as increasing urban greenery and refining urban planning, can further enhance the cool island effect. This approach can improve the quality of life for city residents, enhance the ecological landscape, and promote sustainable development in Turpan.
5. Conclusions
This study delves into the urban heat island phenomenon within old and new stove cities in China from 2013 to 2023. It aims to scrutinize the spatial and temporal evolution patterns, subsequently analyzing potential causes and future trends in heat island changes. The primary objective is to comprehensively understand these urban heat island occurrences, providing substantial insights to mitigate their adverse effects. This study unveils the spatiotemporal characteristics of these urban heat island phenomena by employing diverse data sets and methodologies.
Research shows the following.
- From the perspective of the annual average surface urban heat island effect, the heat island effect intensifies in the study area (except Turpan), and the cool island effect of Turpan is diminishing.
- Focusing solely on the summer surface urban heat island effect, Chongqing, Fuzhou, and Xi’an continuously increase. Nanjing and Wuhan experience slight fluctuations, while Beijing and Turpan (with an increasing cool island effect) consistently weaken.
- Based on the spatial distribution of SUHII and correlation analysis, population density and average annual air temperature are no longer significant factors affecting the summer urban heat island effect in stove cities. Instead, urban expansion and planning play a more substantial role. Thus, we offer targeted recommendations based on the findings.
This study offers valuable insights for urban managers to understand the latest trends in urban LST changes and the heat island effect, enabling them to devise appropriate strategies to mitigate related thermal stress and support effective urban planning. Moreover, the novelty of the data and multipronged analytical methods and the comprehensive selection of study areas fill gaps in previous research, providing a reliable reference for decision-making and planning in cities with similar climatic characteristics.
However, our study has limitations. Firstly, the study focused solely on urbanization variables, lacking an in-depth examination of factors such as extreme weather events and urban spatial patterns, which are crucial for developing effective mitigation strategies. Secondly, the methods used in this study are traditional and hope to be improved and perfected. Exploring these areas will be our next step in the work.
Author Contributions
Conceptualization, M.H. and S.Z.; data curation, M.H.; formal analysis, S.Z.; funding acquisition, X.M. and J.H.; methodology, M.H. and S.Z.; project administration, X.M.; supervision, X.M.; validation, J.H.; visualization, M.H. and J.H.; writing—original draft, M.H.; writing—review and editing, S.Z. All authors have read and agreed to the published version of the manuscript.
Funding
This research received no external funding.
Institutional Review Board Statement
Not applicable.
Informed Consent Statement
Not applicable.
Data Availability Statement
The raw data supporting the conclusions of this article will be made available by the authors on request.
Conflicts of Interest
The authors declare no conflict of interest.
References
- Chen, D.; Xu, X.; Sun, Z.; Liu, L.; Qiao, Z.; Huang, T. Assessment of Urban Heat Risk in Mountain Environments: A Case Study of Chongqing Metropolitan Area, China. Sustainability 2019, 12, 309. [Google Scholar] [CrossRef]
- Wang, Q.; Wang, X.; Zhou, Y.; Liu, D.; Wang, H. The Dominant Factors and Influence of Urban Characteristics on Land Surface Temperature Using Random Forest Algorithm. Sustain. Cities Soc. 2022, 79, 103722. [Google Scholar] [CrossRef]
- Degefu, M.A.; Argaw, M.; Feyisa, G.L.; Degefa, S. Regional and Urban Heat Island Studies in Megacities: A Systematic Analysis of Research Methodology. Indoor Built Environ. 2022, 31, 1775–1786. [Google Scholar] [CrossRef]
- Wardeh, Y.; Kinab, E.; Escadeillas, G.; Rahme, P.; Ginestet, S. Review of the Optimization Techniques for Cool Pavements Solutions to Mitigate Urban Heat Islands. Build. Environ. 2022, 223, 109482. [Google Scholar] [CrossRef]
- Niyogi, D.; Lei, M.; Kishtawal, C.; Schmid, P.; Shepherd, M. Urbanization Impacts on the Summer Heavy Rainfall Climatology over the Eastern United States. Earth Interact. 2017, 21, 1–17. [Google Scholar] [CrossRef]
- Wang, S.; Wang, Z.; Zhang, Y.; Fan, Y. Characteristics of Urban Heat Island in China and Its Influences on Building Energy Consumption. Appl. Sci. 2022, 12, 7678. [Google Scholar] [CrossRef]
- Lin, J.; Wei, K.; Guan, Z. Exploring the Connection between Morphological Characteristic of Built-up Areas and Surface Heat Islands Based on MSPA. Urban Clim. 2024, 53, 101764. [Google Scholar] [CrossRef]
- Mansourmoghaddam, M.; Rousta, I.; Ghafarian Malamiri, H.; Sadeghnejad, M.; Krzyszczak, J.; Ferreira, C.S.S. Modeling and Estimating the Land Surface Temperature (LST) Using Remote Sensing and Machine Learning (Case Study: Yazd, Iran). Remote Sens. 2024, 16, 454. [Google Scholar] [CrossRef]
- Lin, Z.; Xu, H. Comparative Study on the Urban Heat Island Effect in “Stove Cities” during the Last 20 Years. Remote Sens. Technol. Appl. 2019, 34, 521–530. [Google Scholar]
- Shen, Y.; Zeng, C.; Cheng, Q.; Shen, H. Opposite Spatiotemporal Patterns for Surface Urban Heat Island of Two “Stove Cities” in China: Wuhan and Nanchang. Remote Sens. 2021, 13, 4447. [Google Scholar] [CrossRef]
- Li, D.; Yan, S.; Chen, G. Effects of Urban Redevelopment on Surface Urban Heat Island. IEEE J. Sel. Top. Appl. Earth Obs. Remote Sens. 2023, 16, 2366–2373. [Google Scholar] [CrossRef]
- Gui, X.; Wang, L.; Yao, R.; Yu, D.; Li, C. Investigating the Urbanization Process and Its Impact on Vegetation Change and Urban Heat Island in Wuhan, China. Environ. Sci. Pollut. Res. 2019, 26, 30808–30825. [Google Scholar] [CrossRef] [PubMed]
- Huang, X.; Wang, Y. Investigating the Effects of 3D Urban Morphology on the Surface Urban Heat Island Effect in Urban Functional Zones by Using High-Resolution Remote Sensing Data: A Case Study of Wuhan, Central China. ISPRS J. Photogramm. Remote Sens. 2019, 152, 119–131. [Google Scholar] [CrossRef]
- Li, L.; Zhan, W.; Du, H.; Lai, J.; Wang, C.; Fu, H.; Huang, F.; Liu, Z.; Wang, C.; Li, J.; et al. Long-Term and Fine-Scale Surface Urban Heat Island Dynamics Revealed by Landsat Data Since the 1980s: A Comparison of Four Megacities in China. JGR Atmos. 2022, 127, e2021JD035598. [Google Scholar] [CrossRef]
- Zhang, Y.; Yiyun, C.; Qing, D.; Jiang, P. Study on Urban Heat Island Effect Based on Normalized Difference Vegetated Index:A Case Study of Wuhan City. Procedia Environ. Sci. 2012, 13, 574–581. [Google Scholar] [CrossRef]
- Streutker, D. Satellite-Measured Growth of the Urban Heat Island of Houston, Texas. Remote Sens. Environ. 2003, 85, 282–289. [Google Scholar] [CrossRef]
- Lazzarini, M.; Marpu, P.R.; Ghedira, H. Temperature-Land Cover Interactions: The Inversion of Urban Heat Island Phenomenon in Desert City Areas. Remote Sens. Environ. 2013, 130, 136–152. [Google Scholar] [CrossRef]
- Imhoff, M.L.; Zhang, P.; Wolfe, R.E.; Bounoua, L. Remote Sensing of the Urban Heat Island Effect across Biomes in the Continental USA. Remote Sens. Environ. 2010, 114, 504–513. [Google Scholar] [CrossRef]
- Zhou, D.; Xiao, J.; Bonafoni, S.; Berger, C.; Deilami, K.; Zhou, Y.; Frolking, S.; Yao, R.; Qiao, Z.; Sobrino, J.A. Satellite Remote Sensing of Surface Urban Heat Islands: Progress, Challenges, and Perspectives. Remote Sens. 2018, 11, 48. [Google Scholar] [CrossRef]
- Manoli, G.; Fatichi, S.; Schläpfer, M.; Yu, K.; Crowther, T.W.; Meili, N.; Burlando, P.; Katul, G.G.; Bou-Zeid, E. Magnitude of Urban Heat Islands Largely Explained by Climate and Population. Nature 2019, 573, 55–60. [Google Scholar] [CrossRef]
- Song, L. Analysis of the Urbanization on Heat-Island Effect in Turpan City. CCRL 2016, 05, 86–92. [Google Scholar] [CrossRef]
- Gong, P.; Li, X.; Wang, J.; Bai, Y.; Chen, B.; Hu, T.; Liu, X.; Xu, B.; Yang, J.; Zhang, W.; et al. Annual Maps of Global Artificial Impervious Area (GAIA) between 1985 and 2018. Remote Sens. Environ. 2020, 236, 111510. [Google Scholar] [CrossRef]
- Yang, J.; Huang, X. The 30 m Annual Land Cover Datasets and Its Dynamics in China from 1985 to 2022. 2023. Available online: https://commons.datacite.org/doi.org/10.5281/zenodo.8176941 (accessed on 28 March 2024).
- Chuan, T.; Wu, J.; Zhao, D.; Yang, Q.; Fan, W.; Zhao, J. Fine Structure Analysis of Urban Heat Island of a Central City in Low-Latitude Plateau of China. Urban Clim. 2022, 44, 101186. [Google Scholar] [CrossRef]
- Arnfield, A.J. Two Decades of Urban Climate Research: A Review of Turbulence, Exchanges of Energy and Water, and the Urban Heat Island. Int. J. Climatol. 2003, 23, 1–26. [Google Scholar] [CrossRef]
- Wang, X.L.; Chen, H.; Wu, Y.; Feng, Y.; Pu, Q. New Techniques for the Detection and Adjustment of Shifts in Daily Precipitation Data Series. J. Appl. Meteorol. Climatol. 2010, 49, 2416–2436. [Google Scholar] [CrossRef]
- Geng, X.; Zhang, D.; Li, C.; Yuan, Y.; Yu, Z.; Wang, X. Impacts of Climatic Zones on Urban Heat Island: Spatiotemporal Variations, Trends, and Drivers in China from 2001–2020. Sustain. Cities Soc. 2023, 89, 104303. [Google Scholar] [CrossRef]
- Hu, Y.; Hou, M.; Jia, G.; Zhao, C.; Zhen, X.; Xu, Y. Comparison of Surface and Canopy Urban Heat Islands within Megacities of Eastern China. ISPRS J. Photogramm. Remote Sens. 2019, 156, 160–168. [Google Scholar] [CrossRef]
- Yang, Q.; Huang, X.; Tang, Q. The Footprint of Urban Heat Island Effect in 302 Chinese Cities: Temporal Trends and Associated Factors. Sci. Total Environ. 2019, 655, 652–662. [Google Scholar] [CrossRef]
- Hansen, J.; Lebedeff, S. Global Trends of Measured Surface Air Temperature. J. Geophys. Res. 1987, 92, 13345–13372. [Google Scholar] [CrossRef]
- Balling, R.C.; Idso, S.B. Historical Temperature Trends in the United States and the Effect of Urban Population Growth. J. Geophys. Res. 1989, 94, 3359–3363. [Google Scholar] [CrossRef]
- Wilmers, F. Green for Melioration of Urban Climate. Energy Build. 1988, 11, 289–299. [Google Scholar] [CrossRef]
- Takebayashi, H.; Moriyama, M. Study on the Urban Heat Island Mitigation Effect Achieved by Converting to Grass-Covered Parking. Sol. Energy 2009, 83, 1211–1223. [Google Scholar] [CrossRef]
- Theeuwes, N.E.; Steeneveld, G.J.; Ronda, R.J.; Heusinkveld, B.G.; Holtslag, A.A.M. Mitigation of the Urban Heat Island Effect Using Vegetation and Water Bodies. In Proceedings of the ICUC8—8th International Conference on Urban Climates, UCD, Dublin, Ireland, 6–10 August 2012; pp. 1–3. [Google Scholar]
Figure 1.
Study areas. (a) Location of Shaanxi Province, Jiangsu Province, Fujian Province, Hubei Province, Xinjiang Uygur Autonomous Region, Chongqing City, and Beijing City in China; (b) location of Xi’an City in Shaanxi province; (c) location of Nanjing City in Jiangsu province; (d) location of Fuzhou City in Fujian province; (e) location of Wuhan City in Hubei province; (f) location of Turpan in Xinjiang Uygur Autonomous Region.
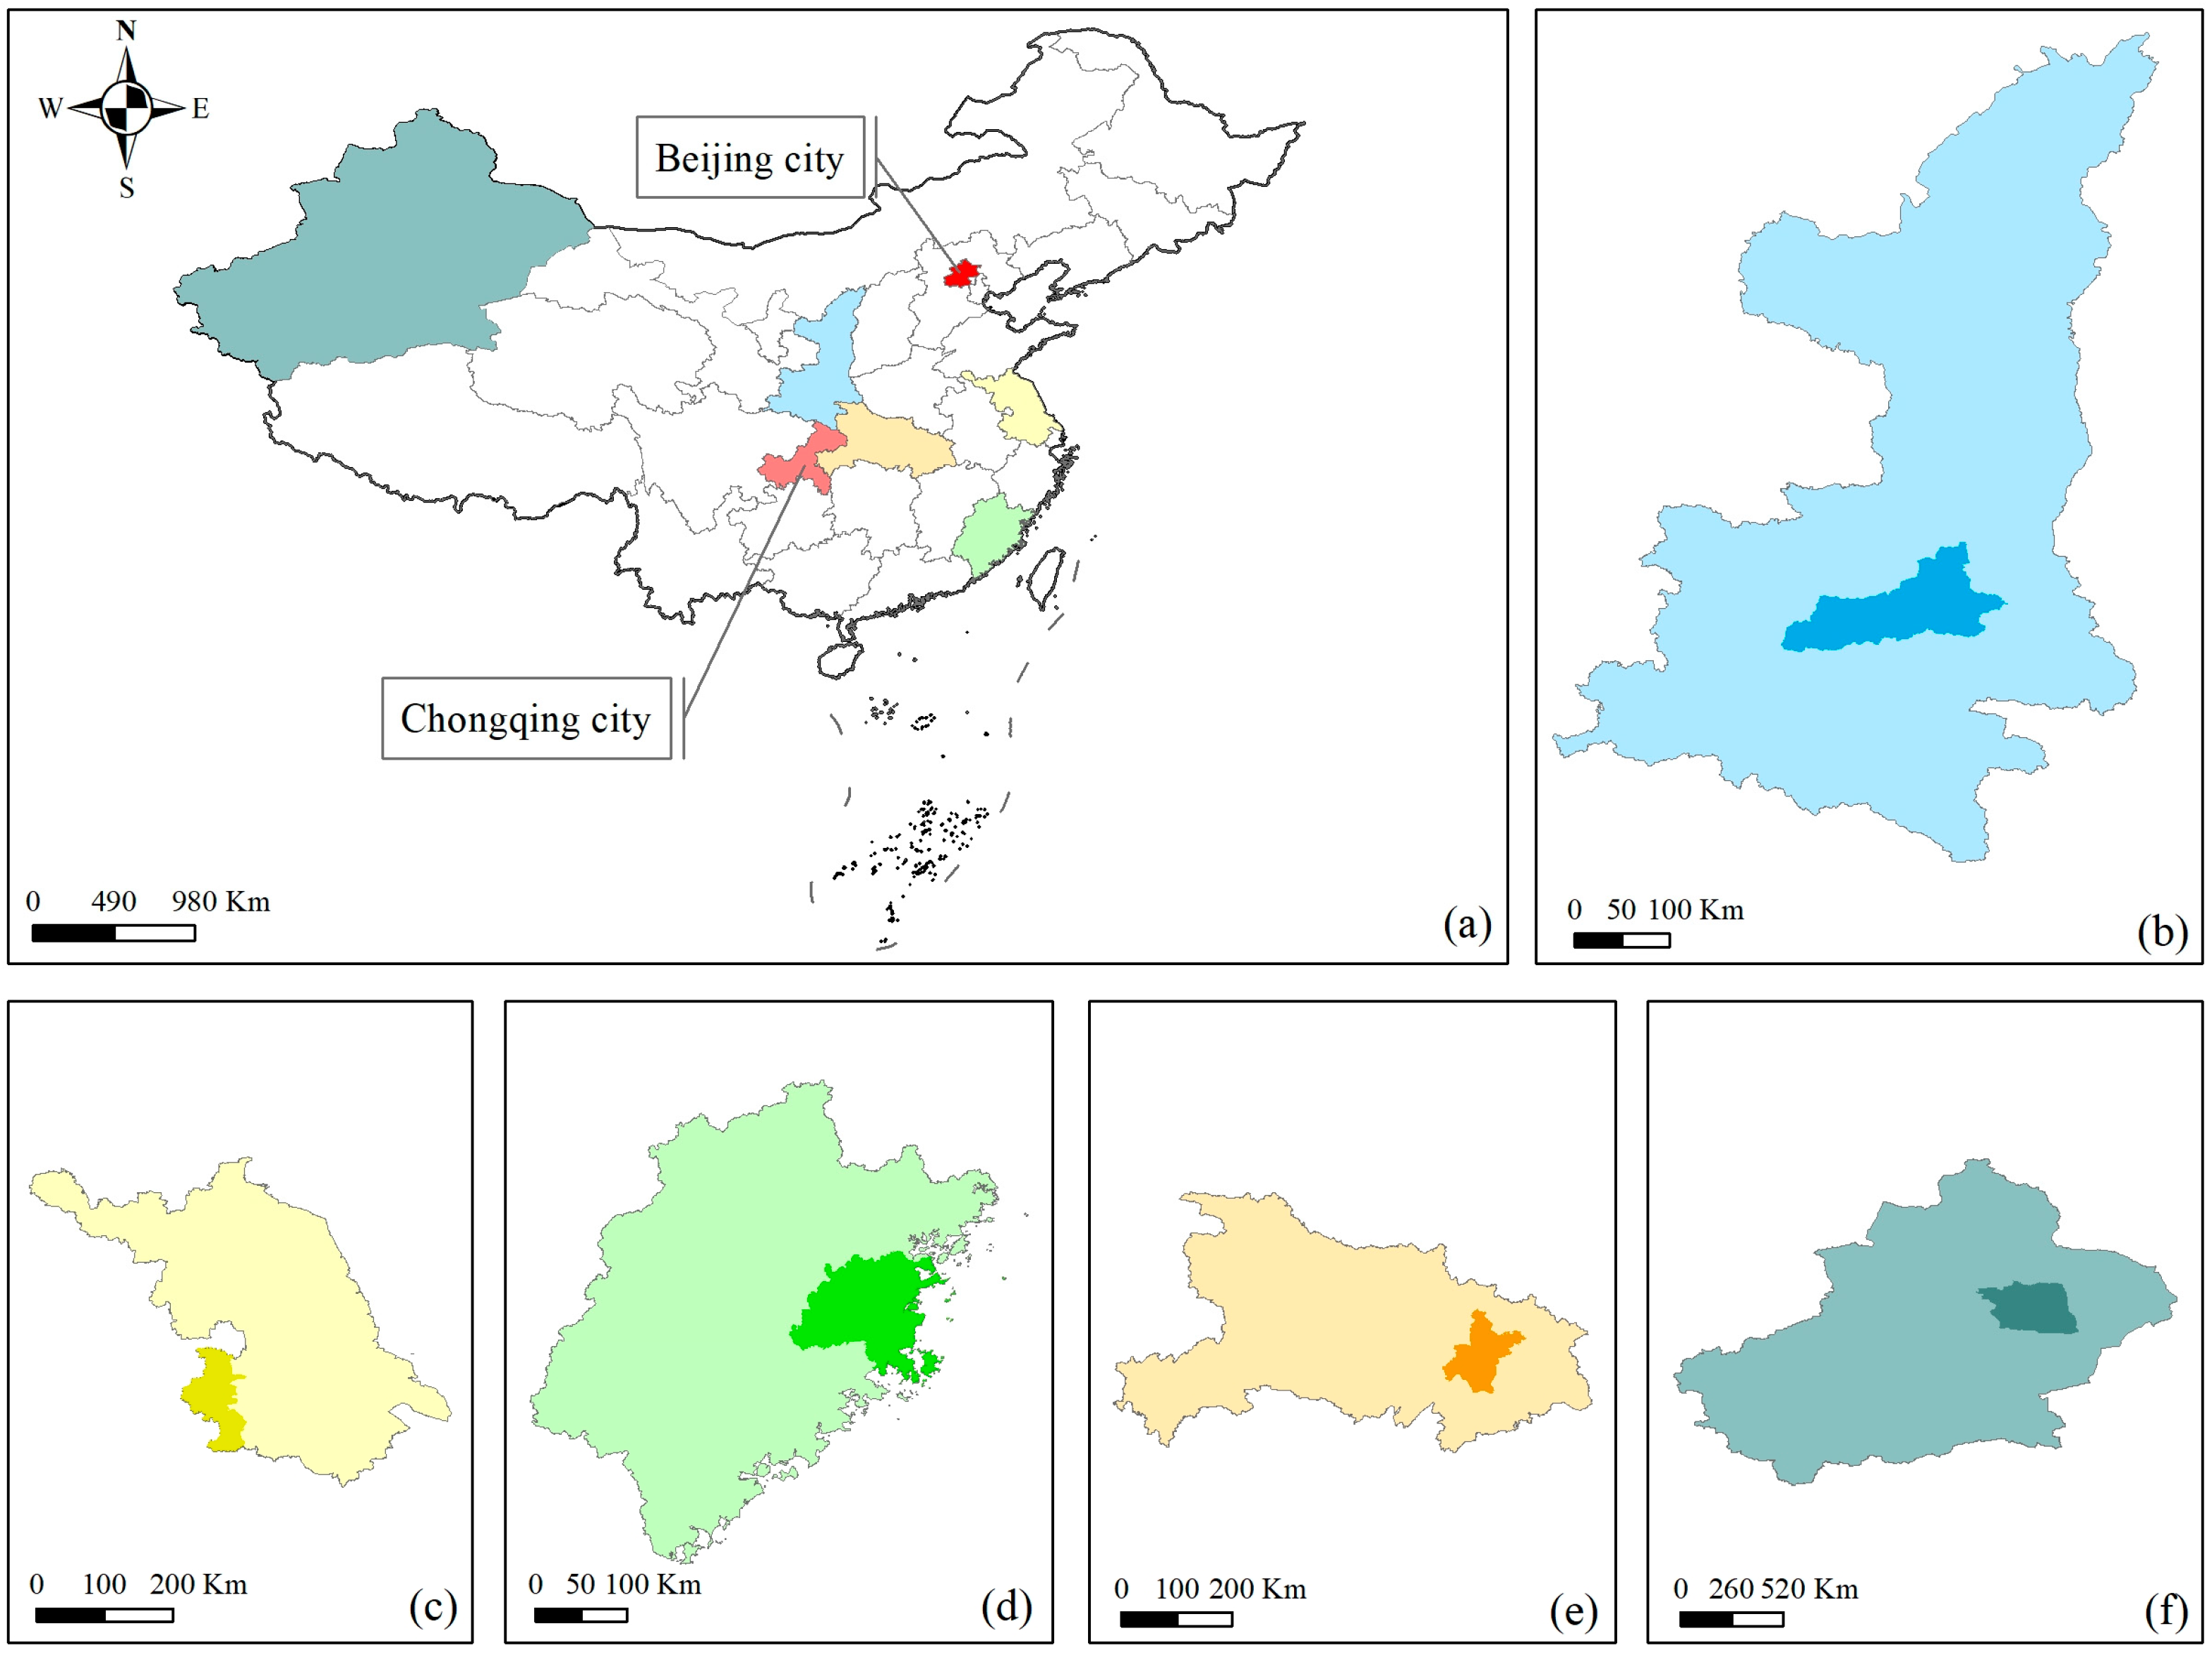
Figure 2.
Urban clustering algorithm.

Figure 3.
Changes in urban area expansion (2013–2018).

Figure 4.
Changes in spatiotemporal patterns of UHI in area of study.

Figure 5.
Variation in annual mean temperature and other factors with changes in SUHII. (a) Changes in annual mean temperature and urban–suburban surface temperature, (b) urban expansion trends, and (c) changes in population density.
Figure 5.
Variation in annual mean temperature and other factors with changes in SUHII. (a) Changes in annual mean temperature and urban–suburban surface temperature, (b) urban expansion trends, and (c) changes in population density.

Table 1.
Changes in impervious surface area (unit: km2).
| City | 2013 | Net Expansion Rate (2013–2018) (%) | 2018 | Net Expansion Rate (2018–2022) (%) | 2022 |
|---|---|---|---|---|---|
| Nanjing | 1174.28 | 11.25 | 1306.43 | 6.12 | 1386.41 |
| Chongqing | 1178.09 | 28.89 | 1518.42 | 12.99 | 1715.60 |
| Wuhan | 968.19 | 15.42 | 1117.44 | 8.79 | 1215.64 |
| Fuzhou | 710.19 | 14.21 | 811.11 | 5.82 | 858.34 |
| Beijing | 3357.66 | 5.59 | 3545.40 | 1.43 | 3596.06 |
| Xi’an | 1174.88 | 11.35 | 1308.20 | 5.36 | 1378.29 |
| Turpan | 209.88 | 20.40 | 252.71 | 7.14 | 270.75 |
Table 2.
Changes in urban area (unit: km2).
| City | Urban Area_2013 | Urban Area_2018 | Expansion Area (2013–2018) | Net Expansion Rate (2013–2018) (%) |
|---|---|---|---|---|
| Nanjing | 1782.7 | 2324.2 | 541.5 | 30.38 |
| Chongqing | 2777.6 | 3375.3 | 597.7 | 21.52 |
| Wuhan | 1651.1 | 1946.3 | 295.2 | 17.88 |
| Fuzhou | 1392.3 | 1694.8 | 302.5 | 21.73 |
| Beijing | 4921.7 | 5984.0 | 1062.3 | 21.58 |
| Xi’an | 1316.5 | 1758.7 | 442.2 | 33.59 |
| Turpan | 279.2 | 299.6 | 20.4 | 7.31 |
Table 3.
Changes in surface temperature in urban and suburban areas (2013~2023).
| City | Year | Month | Urban LST | Suburban LST | Summer Average | SUHII (Summer) | Year Average | SUHII (Annual) | ||
|---|---|---|---|---|---|---|---|---|---|---|
| Urban LST | Suburban LST | Urban LST | Suburban LST | |||||||
| Nanjing | 2013 | 6 | 30.624 | 29.281 | 33.276 | 31.416 | 1.860 | 31.191 | 30.318 | 0.873 |
| 7 | 34.148 | 31.972 | ||||||||
| 8 | 35.055 | 32.995 | ||||||||
| 2018 | 6 | 32.829 | 30.995 | 33.398 | 31.330 | 2.067 | 20.505 | 19.790 | 0.715 | |
| 7 | 34.323 | 32.301 | ||||||||
| 8 | 33.041 | 30.695 | ||||||||
| 2023 | 6 | 33.207 | 31.656 | 32.989 | 31.057 | 1.932 | 30.920 | 29.988 | 0.932 | |
| 7 | 33.263 | 30.953 | ||||||||
| 8 | 32.496 | 30.561 | ||||||||
| Chongqing | 2013 | 6 | 32.535 | 30.557 | 34.653 | 32.607 | 2.047 | 32.055 | 31.231 | 0.824 |
| 7 | 35.433 | 33.196 | ||||||||
| 8 | 35.992 | 34.067 | ||||||||
| 2018 | 6 | 32.406 | 30.023 | 34.442 | 32.056 | 2.387 | 34.062 | 32.687 | 1.375 | |
| 7 | 36.691 | 34.007 | ||||||||
| 8 | 34.23 | 32.137 | ||||||||
| 2023 | 6 | 33.674 | 30.87 | 33.879 | 31.442 | 2.437 | 32.829 | 31.696 | 1.133 | |
| 7 | 33.194 | 31.075 | ||||||||
| 8 | 34.768 | 32.380 | ||||||||
| Wuhan | 2013 | 6 | 31.909 | 29.951 | 33.639 | 31.362 | 2.047 | 31.348 | 30.526 | 0.822 |
| 7 | 33.359 | 30.905 | ||||||||
| 8 | 35.649 | 33.230 | ||||||||
| 2018 | 6 | 32.75 | 30.512 | 33.673 | 31.391 | 2.282 | 31.832 | 30.750 | 1.082 | |
| 7 | 35.209 | 32.293 | ||||||||
| 8 | 33.06 | 31.368 | ||||||||
| 2023 | 6 | 32.672 | 30.744 | 33.474 | 31.295 | 2.179 | 32.035 | 30.967 | 1.068 | |
| 7 | 34.051 | 31.434 | ||||||||
| 8 | 33.700 | 31.707 | ||||||||
| Fuzhou | 2013 | 6 | 33.627 | 31.211 | 34.067 | 31.714 | 2.352 | 31.610 | 30.713 | 0.897 |
| 7 | 34.083 | 31.815 | ||||||||
| 8 | 34.490 | 32.117 | ||||||||
| 2018 | 6 | 32.604 | 30.453 | 33.277 | 30.872 | 2.405 | 31.970 | 30.952 | 1.018 | |
| 7 | 33.003 | 30.8 | ||||||||
| 8 | 34.223 | 31.363 | ||||||||
| 2023 | 6 | 34.610 | 31.194 | 33.909 | 31.169 | 2.740 | 31.728 | 30.701 | 1.027 | |
| 7 | 34.606 | 32.313 | ||||||||
| 8 | 32.512 | 30.000 | ||||||||
| Beijing | 2013 | 6 | 34.010 | 29.624 | 33.869 | 29.477 | 4.391 | 29.445 | 28.244 | 1.201 |
| 7 | 34.569 | 29.976 | ||||||||
| 8 | 33.027 | 28.832 | ||||||||
| 2018 | 6 | 37.245 | 33.096 | 34.943 | 30.701 | 4.243 | 30.074 | 28.270 | 1.804 | |
| 7 | 34.148 | 29.952 | ||||||||
| 8 | 33.437 | 29.054 | ||||||||
| 2023 | 6 | 37.344 | 34.050 | 35.031 | 31.555 | 3.476 | 29.635 | 28.192 | 1.443 | |
| 7 | 36.142 | 32.577 | ||||||||
| 8 | 31.608 | 28.037 | ||||||||
| Xi’an | 2013 | 6 | 36.915 | 36.241 | 35.176 | 33.561 | 1.615 | 32.716 | 32.213 | 0.503 |
| 7 | 34.274 | 32.219 | ||||||||
| 8 | 34.338 | 32.222 | ||||||||
| 2018 | 6 | 36.247 | 34.992 | 36.296 | 34.301 | 1.995 | 31.499 | 30.675 | 0.824 | |
| 7 | 37.228 | 34.645 | ||||||||
| 8 | 35.413 | 33.266 | ||||||||
| 2023 | 6 | 34.455 | 32.924 | 34.553 | 32.413 | 2.140 | 31.436 | 30.522 | 0.914 | |
| 7 | 35.488 | 33.265 | ||||||||
| 8 | 33.717 | 31.051 | ||||||||
| Turpan | 2013 | 6 | 44.846 | 45.217 | 45.142 | 45.701 | −0.559 | 40.383 | 40.879 | −0.496 |
| 7 | 45.956 | 46.568 | ||||||||
| 8 | 44.624 | 45.317 | ||||||||
| 2018 | 6 | 44.957 | 45.422 | 45.808 | 46.441 | −0.633 | 39.149 | 39.484 | −0.335 | |
| 7 | 47.730 | 48.417 | ||||||||
| 8 | 44.738 | 45.483 | ||||||||
| 2023 | 6 | 45.838 | 46.446 | 46.256 | 46.978 | −0.722 | 39.212 | 39.552 | −0.34 | |
| 7 | 47.836 | 48.585 | ||||||||
| 8 | 45.095 | 45.904 | ||||||||
Table 4.
Changes of LST and spatiotemporal distribution in stove cities (2013~2023).
| City | LST | Spatiotemporal Distribution |
|---|---|---|
| Nanjing | Summer: The SUHII exhibited a pattern of initial increase followed by a decrease, yet the SUHII value in 2023 remained higher than that observed in 2013. Annual: Contrary to the changes observed in the SUHII of summer, it initially decreases and then increases, with the value in 2023 being higher than that in 2013. | There has been a decrease in high-temperature coverage and concurrently, the urban heat island effect in the city center has shown signs of gradual weakening. |
| Chongqing | Summer: The temperature decline persists in both urban and suburban zones, yet the suburban areas experience a swifter decrease, exacerbating the intensity of the urban surface heat island even amidst declining temperatures, thus perpetuating the intensification of the heat island effect. Annual: The changes are similar to those in Nanjing. | The coverage of medium- to high-temperature zones has significantly reduced, whereas high-temperature zones are expanding and becoming more concentrated. |
| Wuhan | Summer: Both the overall temperature and surface heat island intensity follow a pattern of initial increase followed by decrease, observed across urban and suburban areas. Despite the summer temperatures in 2023 being lower than those in 2013, there is an increase in heat island intensity compared to 2013. Annual: Overall, the trend is towards growth, but growth is getting weaker in 2023. | The coverage of medium- to high-temperature zones has significantly expanded, while some medium–low and low-temperature zones, mainly in the suburbs, have decreased, transitioning towards cooler regions. |
| Fuzhou | Summer: The surface temperature initially decreased before rising, while the intensity of urban heat islands continued to escalate. Annual: The SUHII continues to increase, reaching its peak in 2023. | The distribution of high and medium-high temperature zones remains unchanged, however, the area on the right has shifted from a medium-high temperature zone in 2013 to a high-temperature zone by 2023 (based on the review of remote sensing images from the corresponding period. This is due to the area being converted into building land.). |
| Beijing | Summer: Urban and suburban LST are steadily rising, yet the LST difference between urban and rural areas is narrowing, indicating a mitigation of the urban heat island effect. Annual: The changes are similar to those in Nanjing. | The coverage of medium-high temperature zones has expanded. Meanwhile, the area of high-temperature zones has slightly decreased, yet their distribution has become more concentrated. |
| Xi’an | The annual SUHII and summer SUHII both continues to increase, reaching its peak in 2023. | The coverage of high-temperature zones first expands and then contracts with the central urban high-temperature zone gradually diminishing. |
| Turpan | Summer: The urban heat island effect in Turpan across these three time points remains consistently negative, indicating that the suburban temperatures are higher than those within the city, displaying a noticeable ‘cold island effect.’ Furthermore, as per the data in Table 3, the cold island effect in Turpan continued to amplify throughout this period. Annual: Unlike the summer SUHII, the annual average SUHII exhibits a slight increase, with a minor reduction in the cold island effect. | In the Turpan region, high-temperature zones and mid-temperature areas are prevalent, with the LST distribution remaining stable throughout the observation period. |
Table 5.
Spearman correlation coefficient.
| SUHII | |
|---|---|
| Urban LST | −0.444 |
| Suburban LST | −0.827 ** |
| Urban expansion | 0.728 ** |
| Population density (people/sq km) | 0.515 |
| annual average temperature | 0.145 |
** p < 0.01.
Disclaimer/Publisher’s Note: The statements, opinions and data contained in all publications are solely those of the individual author(s) and contributor(s) and not of MDPI and/or the editor(s). MDPI and/or the editor(s) disclaim responsibility for any injury to people or property resulting from any ideas, methods, instructions or products referred to in the content. |
© 2024 by the authors. Licensee MDPI, Basel, Switzerland. This article is an open access article distributed under the terms and conditions of the Creative Commons Attribution (CC BY) license (https://creativecommons.org/licenses/by/4.0/).
Share and Cite
MDPI and ACS Style
Huang, M.; Zhong, S.; Mei, X.; He, J. Spatiotemporal Patterns in the Urban Heat Island Effect of Several Contemporary and Historical Chinese “Stove Cities”. Sustainability 2024, 16, 3091. https://doi.org/10.3390/su16073091
AMA Style
Huang M, Zhong S, Mei X, He J. Spatiotemporal Patterns in the Urban Heat Island Effect of Several Contemporary and Historical Chinese “Stove Cities”. Sustainability. 2024; 16(7):3091. https://doi.org/10.3390/su16073091
Chicago/Turabian StyleHuang, Mengyu, Shaobo Zhong, Xin Mei, and Jin He. 2024. "Spatiotemporal Patterns in the Urban Heat Island Effect of Several Contemporary and Historical Chinese “Stove Cities”" Sustainability 16, no. 7: 3091. https://doi.org/10.3390/su16073091
Note that from the first issue of 2016, this journal uses article numbers instead of page numbers. See further details here.