Article

Environmental Impact Assessment of Organic Wheat Cracker Value Chains with and without Nettle Powder as a Natural Additive: A Case of Sweden

Department of Energy and Technology, Swedish University of Agricultural Sciences, 75007 Uppsala, Sweden
Sustainability 2024, 16(7), 3092; https://doi.org/10.3390/su16073092
Submission received: 1 March 2024 / Revised: 3 April 2024 / Accepted: 6 April 2024 / Published: 8 April 2024

Abstract

:
Due to the growing global population and consequent increased demand for food, the global production of cereal crops has increased. Wheat is one of the most important food crops in the world, as its products, e.g., bread and crackers, have served as important sources of nutrition for many years. However, the environmental impacts of wheat-derived food products are not frequently explored. This study presents an environmental impact assessment of organic wheat crackers within the context of Swedish winter wheat production using both primary and literature-based data. A cradle-to-consumer gate life cycle analysis (LCA) approach using the functional unit (FU) of 1 kg of crackers was applied while considering two cracker value chains: (i) without additives and (ii) using nettle powder as a natural additive. Four environmental impact categories—cumulative energy demand (CED), climate change impact (GWP), acidification, and eutrophication—were explored, with a particular focus on CED and GWP. The analysis results indicated that the total CED values were about 13 MJ/FU and 14 MJ/FU for crackers without and with the additive, respectively. Similarly, the total GWP values were 379 g CO2 eq/FU and 464 g CO2 eq/FU, respectively. The post-harvest processing and handling stage was an environmental hot spot in both cases. The introduction of the nettle additive has increased the quantified values of all four of the investigated impact categories. These insights will enable food processors and policy makers to communicate the environmental impacts and make informed decisions to improve the sustainability of wheat crackers. This paper contributes to a database of the environmental impacts of wheat products, specifically LCA data of organic wheat crackers and the LCA method for further LCA studies of snacks and other wheat products with plant-based functional additives.

1. Introduction

Due to the growing population and consequent increased demand for food, the global production of cereal crops increased by about 57% from 1995 to 2019 [1]. Wheat is one of the most important food crops in the world. According to FAOSTAT data [2], the global harvested area of wheat was about 219.15 million hectares in 2022 with an average yield of about 3.69 t/ha. In 2022, the total wheat production of the European Union (27) was about 134.33 million tons with an average yield of 5.55 t/ha. In 2023/24, the global wheat production is estimated to be about 784.9 million tons [3].
Wheat and wheat products, e.g., bread and crackers, have served as important sources of nutrition for many years [4]. Crackers are one category of biscuit [5]; the annual consumption volume of cookies, wafers, and dry biscuits in Sweden increased from about 41,200 tons in 2015 to 72,200 in 2020 [6]. The estimated revenue of the confectionery and snack market in Sweden is USD 5.07 bn with an annual growth of 4.21% [7], of which snack foods represent about 26%.

1.1. Organic Wheat Production in Sweden

In Sweden, the average yield of conventional and organic winter wheat are about 6900 kg/ha and 3950 kg/ha, respectively [8]. Wheat is the most widely produced cereal in Sweden; it is mainly produced in the southern and central parts of the country, and the majority is milled into flour while the remainder is exported to other countries. The current study has focused on winter wheat, because the spring wheat in Sweden accounts only for 10% of the total wheat area [8].
One of the challenges of organic wheat production is its lower yield compared to conventional wheat. In Sweden, on average, the organic winter wheat yield varied from 3.17 t/ha to 4.91 t/ha while that of conventional wheat varied from 4.9 t/ha to 8000 t/ha during 2012–2019 (see Table 1). The yield of organic wheat in Sweden is less than the yield in countries such as Italy and Switzerland [9]

1.2. Life Cycle Analysis of Wheat Food Products

The increasing demand for wheat and wheat-derived food products indicates the need for data on the environmental impacts caused by their production and supply. Bux et al. [10] conducted an LCA and investigated the environmental impacts of conventional and organic wheat production in Italy. It was found that, when compared per hectare, organic production methods reduced the use of synthetic chemicals by up to 100% and diesel fuels by up to 15%. Di Cristofaro et al. [11] assessed the environmental footprints of organic and conventional wheat production systems in Italy and reported that organic production systems produced fewer emissions than conventional production systems. A study in Belgium by van Stappen et al. [12] indicated that organic winter wheat had almost the same impact as conventional winter wheat in terms of emission and cumulative energy demand. Studies have also been conducted regarding sustainability of the baking industry mainly in terms of bread production [1,13,14,15,16,17]. LCA studies on bread production have indicated that the carbon footprint varies depending on the system boundary LCA methodology and type of bread. For instance, Rayichuk et al. [1] reported 675 g CO2 eq per kg of bread using a cradle-to-retail gate approach compared to about 1425 g CO2 eq per kg of bread using a cradle-to-grave LCA approach. Ismayana et al. [13] conducted an LCA of wafer biscuit production and reported a carbon footprint of 1.516 kg CO2 eq per kg of biscuit. Noya et al. [18] conducted a cradle-to-grave LCA study of gluten-free biscuit products from oat flour and reported a carbon footprint of about 3.3 kg CO2 eq per kg of biscuit, with ingredient production and transport being the main environmental hot spots. However, there are limited data on the environmental impacts of biscuit products, especially crackers. Therefore, the current study contributes to address this research gap. Especially in Sweden, there are limited LCA studies of wheat and wheat food products. Sundberg H. [19] investigated the water footprint of winter wheat in Sweden and the wheat flour derived from it. Röös et al. [20] investigated the carbon footprint of refined wheat products such as pasta.
Even though Sweden is a significant producer of organic wheat, there are limited data and analyses of the environmental footprints of wheat cultivation and the production of wheat food products. To the author’s knowledge, no LCA studies have been conducted on organic wheat crackers produced in Sweden. This study contributes to knowledge of the environmental impacts of wheat food products, and specifically provides LCA data for organic wheat crackers; provides information for consumers regarding the environmental impacts of the crackers they consume; and showcases a LCA method for similar future studies of snacks and other wheat products with natural additives.
The objective of this study was to conduct LCA studies of organic wheat crackers value chains both with and without nettle powder as a natural additive. More detail on the objectives and scope is provided in the next section.

2. Materials and Methods

Two organic wheat cracker value chains were investigated within the context of production and supply in Sweden. In the first value chain, organic crackers without additives were considered. In the second, organic crackers with the natural additive of nettle powder were introduced. A LCA study was conducted following the standardized procedure ISO 14040:2006 [21] and 14044:2006 [22]. The product value chains were modeled using SimaPro LCA software, v8.5.2. The cumulative energy demand (CED) V1.10 method was used to assess the primary energy consumption while ReCiPe 2016 Midpoint (H) V1.02 was used to analyze different environmental impact categories.

2.1. Goal and Scope

2.1.1. Goal

The purpose of this LCA study was to evaluate the potential environmental impacts of organic wheat cracker value chains both without and with additives. The primary aims were to identify the environmental hot spots in organic cracker value chains and to investigate how the use of nettle powder as a natural additive could influence the value chains’ environmental impacts.

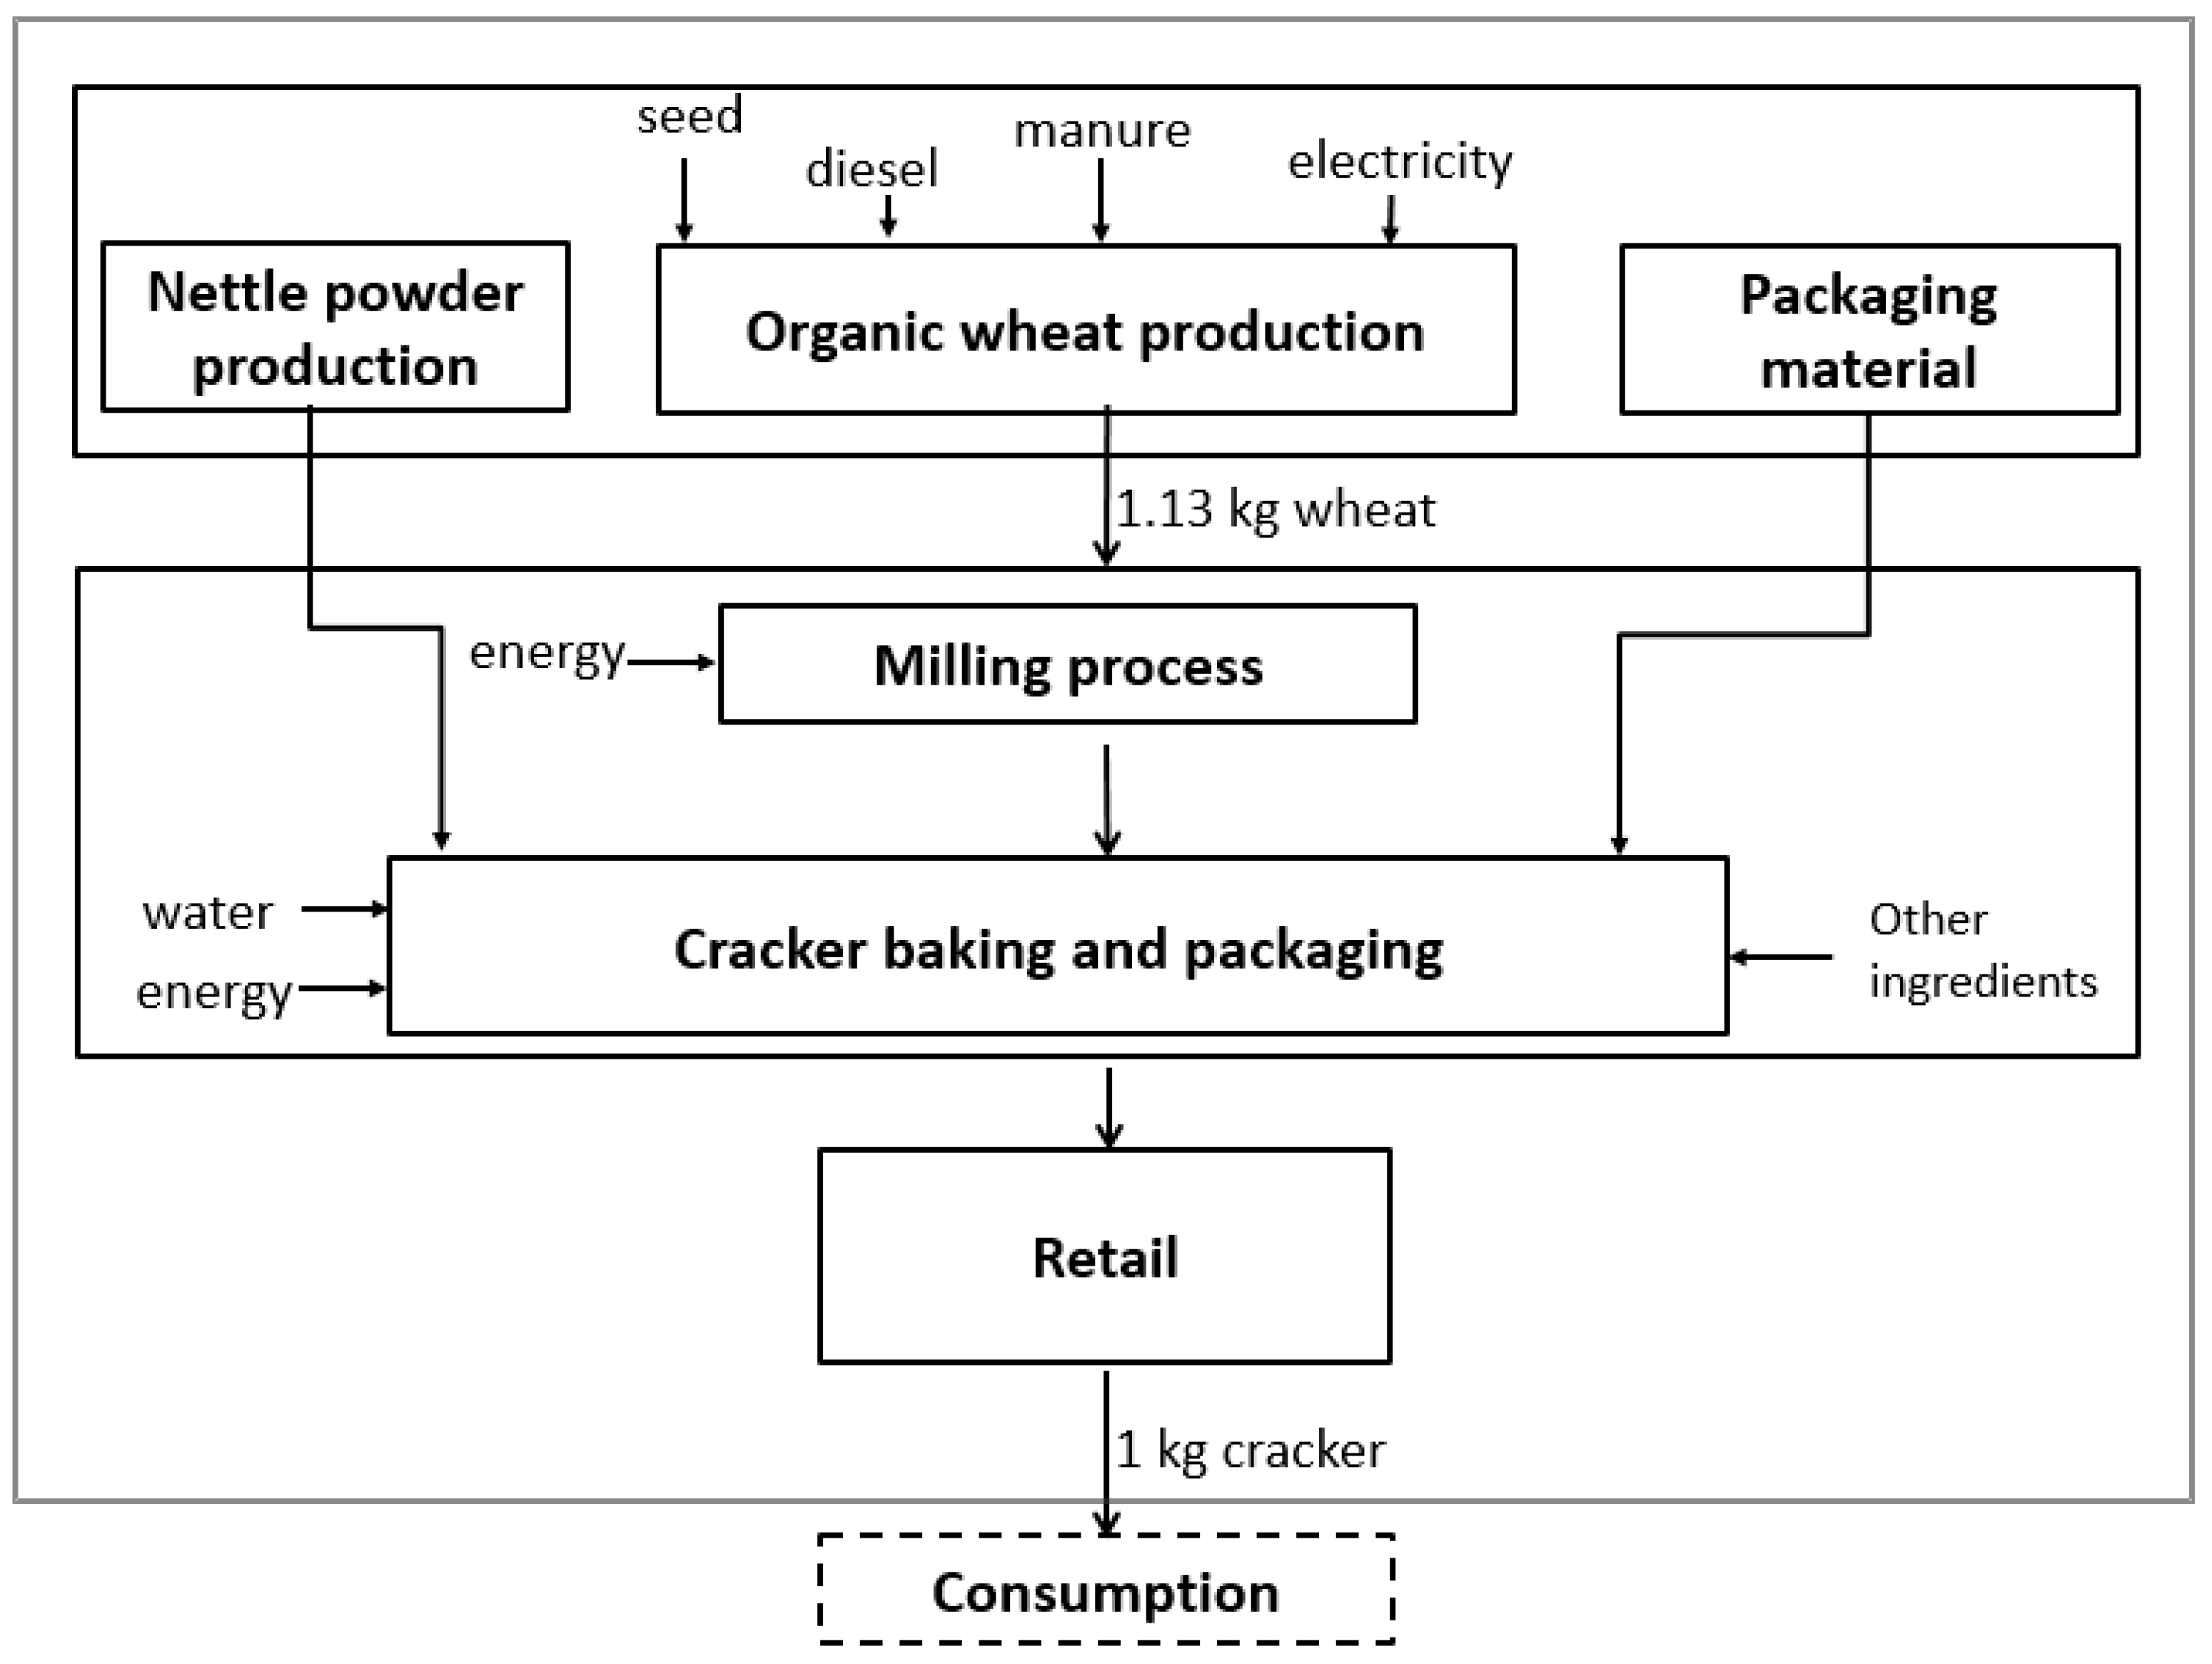
2.1.2. System Boundary and Product Value Chain Description

In this LCA study, a cradle-to-consumer gate approach was used. The major processes from the farm stage to delivery to the consumer gate were included (see Figure 1). The functional unit of 1 kg of crackers (excluding packaging weight) at the consumer gate was used. Organic wheat production and supply were considered to take place in Sweden. The production and supply of the crackers were considered to be in Sweden. The natural additive considered in this case was stinging nettle powder. Figure 1 presents the simplified flow chart of the cracker production system.

2.1.3. Agricultural Production Stage of Organic Crackers

The organic wheat yield used in this study was 3950 kg/ha. The diesel fuel consumed by tillage operations in wheat fields was estimated to be 0.76 MJ and 0.71 MJ per kg of crackers without and with the additive, respectively. In addition, the electrical energy values of about 7.4 wh and 7 wh per FU were considered, respectively. For the harvesting process, the values of 7.3 wh and 6.8 wh per FU were used, respectively. Similarly, the values of 17 g and 16 g per FU of manure were considered for the use of organic fertilizer, respectively. The collection of naturally field-grown stinging nettle and its processing into nettle powder were also considered.

2.1.4. Post-Harvest Processing Activities in the Organic Cracker Value Chain

The ingredients considered were organic wheat flour (hard wheat), nettle powder, table salt, yeast, rapeseed oil, and sugar (see Table 2 and Table 3). Fresh nettle with an MC of 88% was collected and processed into nettle powder with a MC of ≤7% (see Figure 2). About 120–150 g of nettle powder could be produced from 1 kg of fresh nettle. In this case, about 333 g of fresh nettle was considered to be processed into 50 g of nettle powder per kg of crackers. The energy consumed by drying and grinding the nettle was estimated to be about 4.5 wh per FU.
About 900 g and 850 g wheat flour was used per FU of crackers without and with the additive, respectively. The estimation was performed with the values of 76% flour and 24% by-product. Other ingredients (other than flour and powder) constituted about 100 g per FU. For the baking process, about 550 g of water was used per FU. Energy for wheat drying was estimated based on the data from Cederberg et al. [23]. Accordingly, for crackers without and with the additive, the electrical energy of 48.2 KJ and 45.4 KJ per FU was considered, respectively. Similarly, energy use in the milling and baking processes was estimated and used in the modeling. For cracker packaging, both plastic and cardboard materials were used. More detailed information is provided also in Table 2.
Figure 2. Nettle flour and nettle-enriched organic wheat crackers. (a) Stinging nettle; (b) nettle flour; (c) nettle-enriched crackers [24].
Sustainability 16 03092 g002
For organic crackers without and with additives, the types and amounts of ingredients considered are presented in Table 2 and Table 3. In the case of crackers without the additive, wheat flour comprises about 900 g per 1 kg crackers while about 850 g wheat flour and 50 g nettle flour are required in the case of crackers with the additive (see Table 2 and Table 3). The final product (crackers) has a MC of about 5.5–9.8%. In the processing of nettle powder, the fresh nettle could be commercial (organically produced) or wild (collected from field). The MC of fresh nettle leaves is about 88%, which should be dehydrated to a MC of 7%. From 1 kg of fresh nettle leaves, about 150 g nettle powder can be produced.
Cracker packaging should be water-resistant and possess low vapor permeability. Oriented polypropylene (OPP) and metalized OPP are the preferred packaging materials. Metalized OPP is preferable due to its effective protection against gases, moisture, and water vapor. The recommended maximum shelf-life of crackers is 9 months (if unopened), while the recommended conditions for preservation include dry ambient conditions with a temperature of 25 °C and a relative humidity of less than 35%.

2.1.5. Transport Segments

The transport distance of wheat from farm to mill was assumed to be 50 km. The transport distance of flour to the cracker production plant was assumed to be 100 km. At the distribution phase, the crackers were assumed to be transported about 300 km to the distribution center. Then, the product was assumed to be distributed to retailers within a 50 km radius. From retailers to the consumer gate, a distance of about 3 km was applied. About 1200 g/FU and 1130 g/FU of wheat was estimated to be transported from farm to mill for cases without and with the additive, respectively. Similarly, about 900 g/FU and 850 g/FU of wheat flour was considered to be transported from mill to bakery. The transport activities related to nettle powder were considered, but were included in the additive processing and supply stage (under the post-harvest stage) of the value chain of crackers with the additive.

2.1.6. Life Cycle Inventory

In the current study, the life cycle inventory (LCI) data (see Table 2 and Table 3) were created for cracker value chains both without and with the natural additive. Primary data and secondary data were obtained from appropriate data sources such as the Ecoinvent database, peer-reviewed papers, and existing data sets in SimaPro software. The data related to the agricultural production of organic wheat were mainly related to Swedish cases. Regional (Europe) or global data were considered only in cases with a lack of localized data. Data related to post-harvest activities and packaging were collected by taking into consideration the specific process under inventory (e.g., wheat milling and cracker packaging, which might not necessarily be affected by geographical location).
Table 2. Summary of LCI data along the organic cracker value chain. Values are provided per FU.
DescriptionUnit *QuantityReference
Without AdditiveWith Additive
(1) Agricultural stage
Organic wheat yield (assumed moisture content 16.1%)kg/ha39503950[8]
Amount of seed kg/ha180–240180–240Estimated based on [20,25].
Fuel tillage operations (note: liter diesel = 36.9 MJ)MJ0.7580.713[20]
Electricity (natural gas) wh7.447.1[26]
Organic fertilizer (manure)kg0.0170.016[23]
Energy for harvestingwh7.36.84
2. Post-farm activities
2.1. Wheat handling and processing
Energy used for wheat drying (drying oil)kJ oil146138
Electricity for dryingkJ48.19245.38
Grain packaging (large polypropylene bag) g6.726.33
Energy for milling wheatMJ0.930.874[27]
2.2. Cracker-processing stage
White flour (bran separated)kg0.90.85[24]
Nettle powderkgna0.05
Yeastkg0.0170.017
Saltg6.46.4[5]
Rapeseed oilkg0.0770.077[5]
Rapeseed oil to rapeseed ratio in mass%0.360.36[28]
Rapeseed (organic) needed to produce 0.077 kg rapeseed oilkg0.2140.214[28]
Electricity for rapeseed oil productionkwh0.0097020.009702
Transport to supply rapeseed to oil-production facilityt-km0.01070.0107for 50 km
Transport to supply rapeseed oil to cracker-production facilityt-km0.00770.0077for 100 km
Moisture content of cracker%77[24]
Water for baking processg550550
Energy for bakingkwh99
Energy for bakingMJ1.21.2[5]
Energy for cleaning activitiesMJ0.1230.123
2.3. Packaging of Crackers
Polypropylene (for primary packaging)g10.410.4[5]
Cardboard (for secondary packaging)g38.238.2
LDPE (for tertiary packaging)g0.470.47
LDPE (shopping bag)g4.74.7
Energy for packagingMJ0.360.36
2.4. Distribution/retailing phase
Water consumption at DC (cooling, cleaning, storing for a month)ml6.936.93
Electricity at DCj2.52.5
Water consumption (assuming 3 weeks storage at retailer)l3.1353.135
Energy consumption (lighting, heating, etc.)kj1.2361.236
(3) Transport phase
Transport of grain from farm milling facilitykm-t0.060.0565Estimated based on 50 km
Transport of flour to baking place (assumed 40 t truck with 90% load rate)km-t0.090.085Estimated based on 100 km
Transport from production facility to distribution centerkm-t0.30.3Estimated based on 300 km
Distribution center to retailerkm-t0.050.05Estimated based on 50 km
Retailer to consumerkm33Single trip
*—All values are provided per FU unless indicated specifically.
Table 3. LCI data of nettle powder preparation. Values are provided per FU.
DescriptionUnit * Quantity Reference
Raw material (fresh nettle) moisture content%88[24]
Final nettle powder moisture content%7
Raw material (fresh nettle) neededkg0.333
Transport to collect wild nettlekm0.25Based on 15 km
Energy for convective dryerwh3.996[29]
Energy for grinding nettlewh0.5[24]
Packaging powder: low water vapor transmission rate, e.g., polypropylene, polyethyleneg1.25
*—All values are provided per FU unless indicated specifically.

2.2. Life Cycle Impact Assessment

2.2.1. Impact Categories

The cumulative energy demand (CED) and global warming potential (GWP) were the focus of this study. In addition, the acidification potential (AP) and eutrophication potential (EP) were quantified in both cases, i.e., cracker value chains without and with the additive.

2.2.2. Allocation Principle

Allocation problems in the current study were related to the by-products and wastes of fresh food products. This enabled unnecessary environmental burden results to be avoided. In wheat processing, the mass-based allocation criteria were assumed to be 76% (flour) and 24% (by-product). During purchasing food stuff, allocation problems may also exist, because different types of food are often purchased together. The specific food under consideration (e.g., crackers) may constitute only a portion of total purchase and the environmental burden was assigned accordingly using mass allocation.

3. Results and Discussions

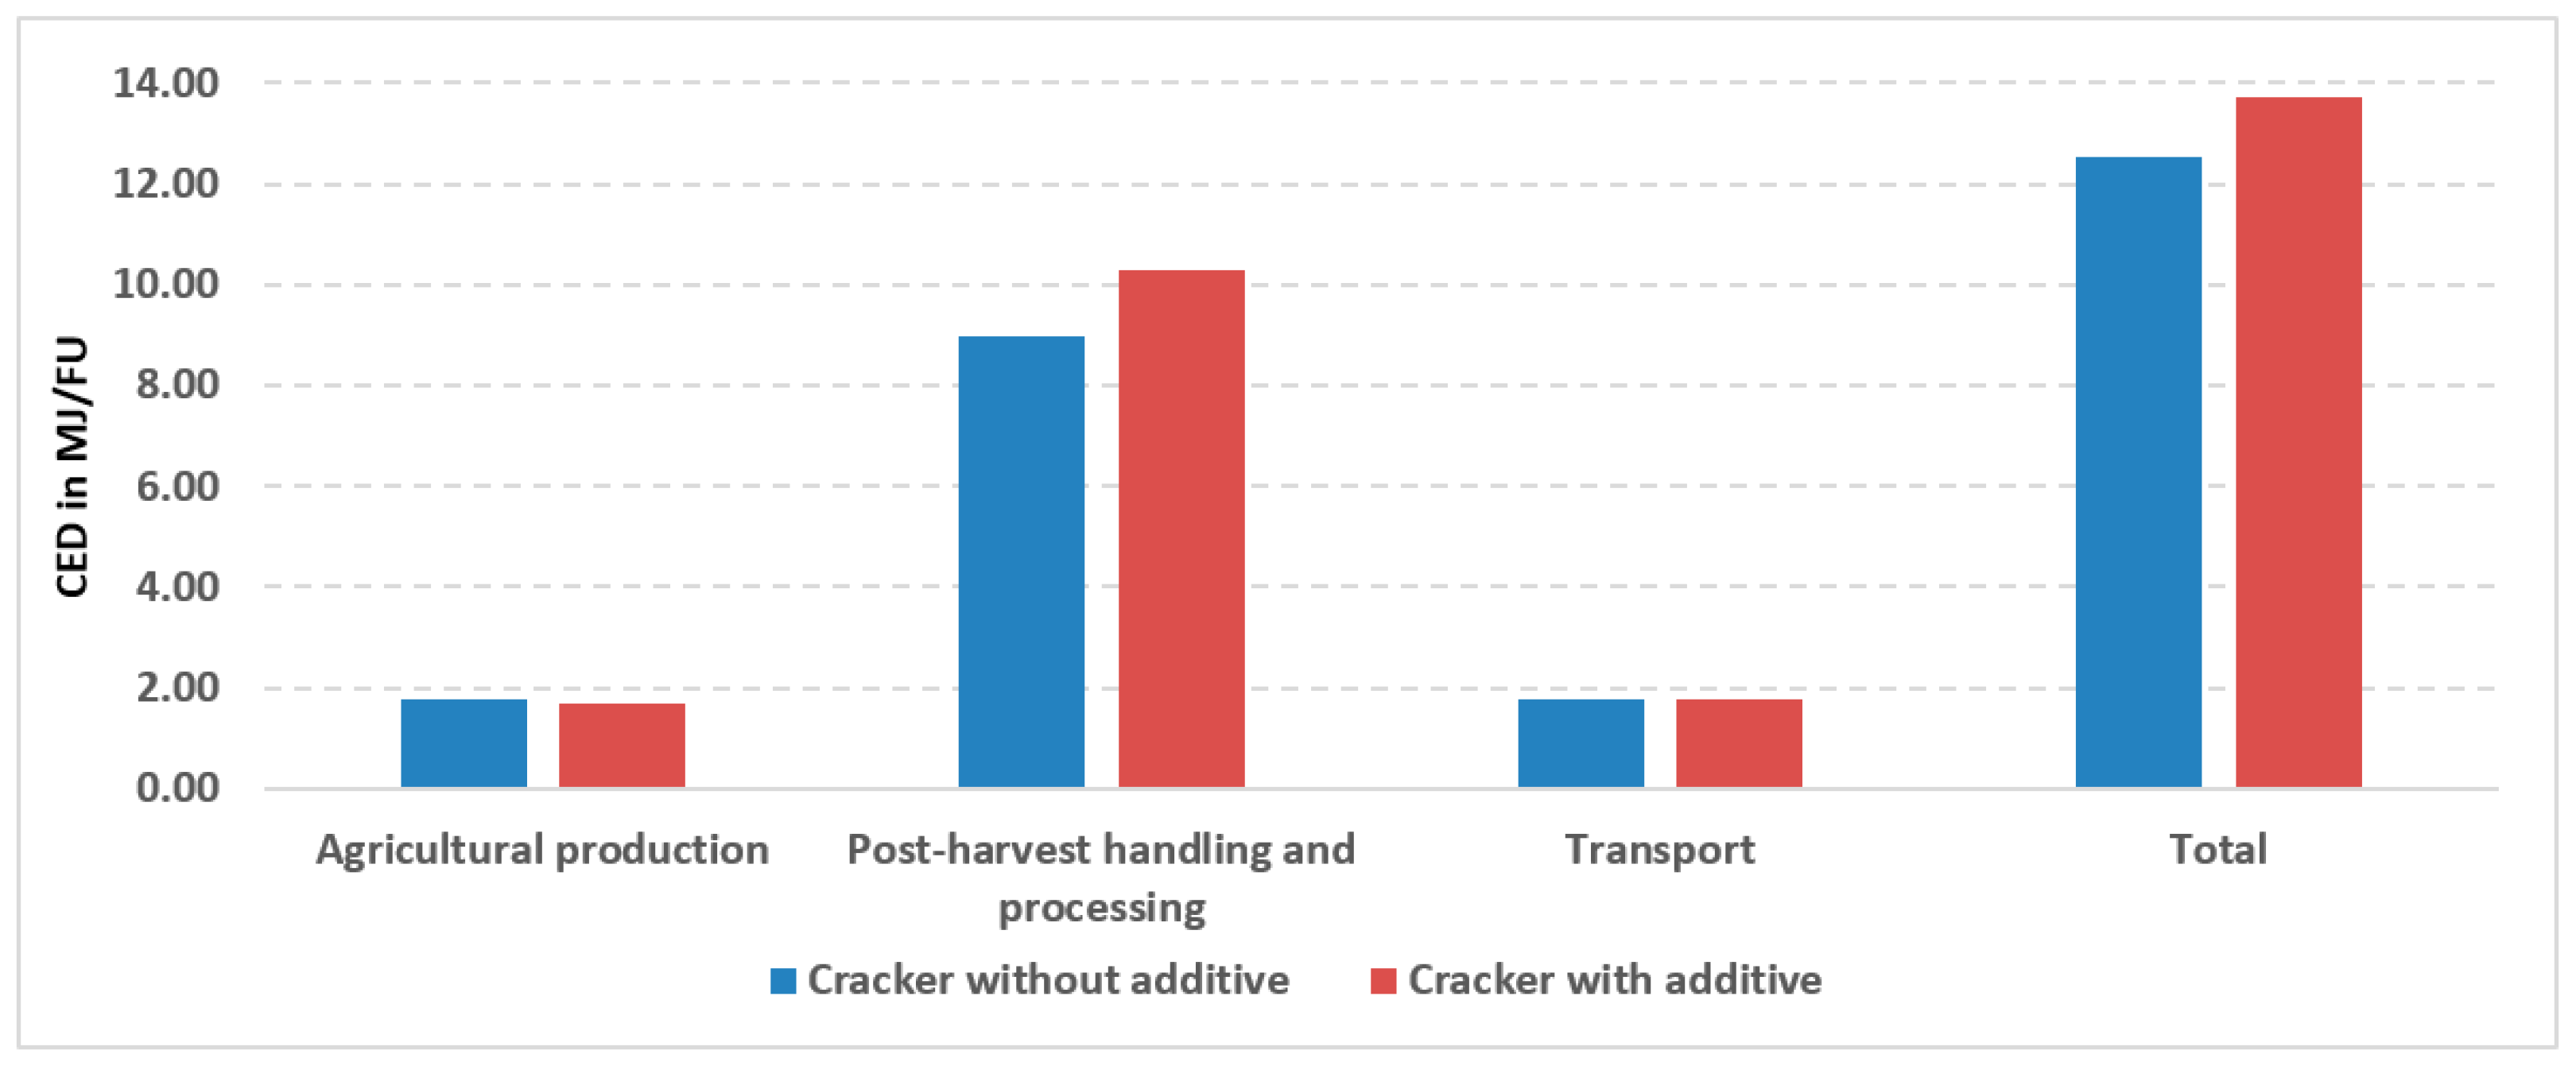
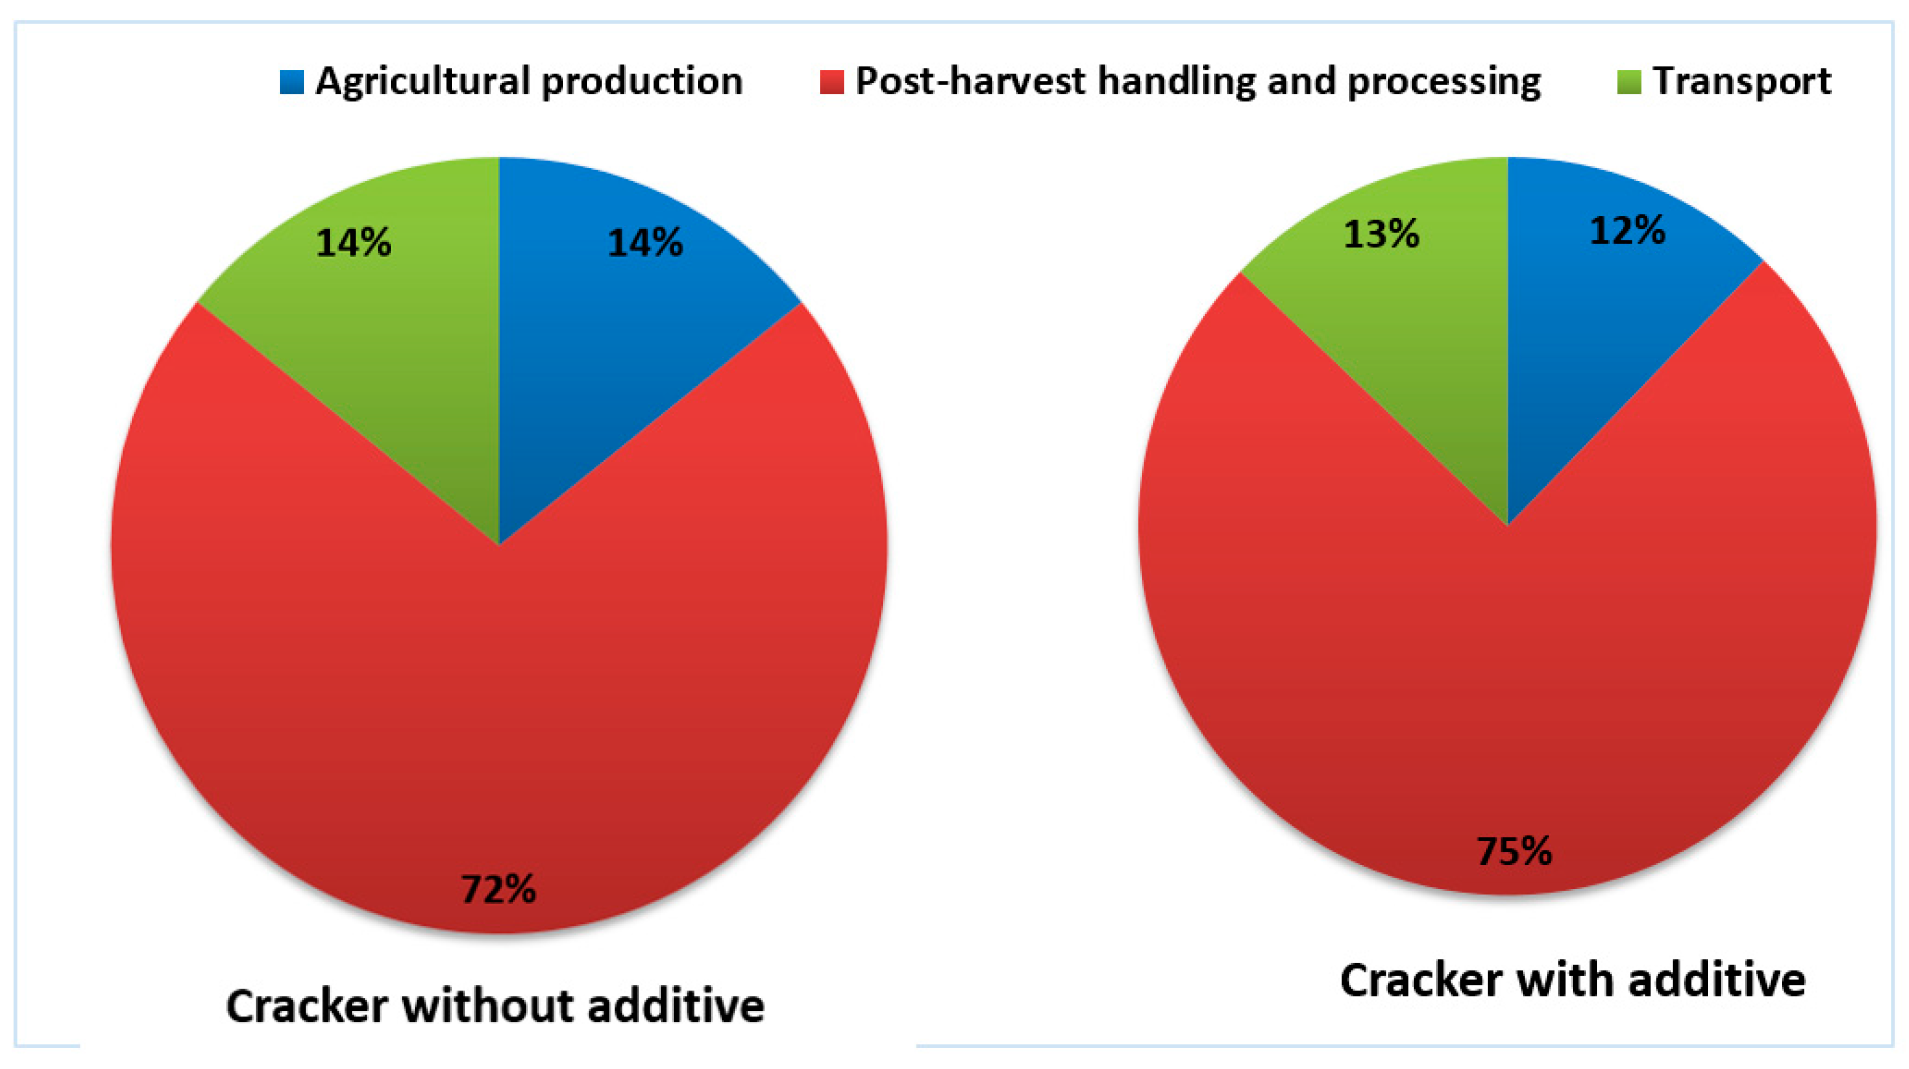
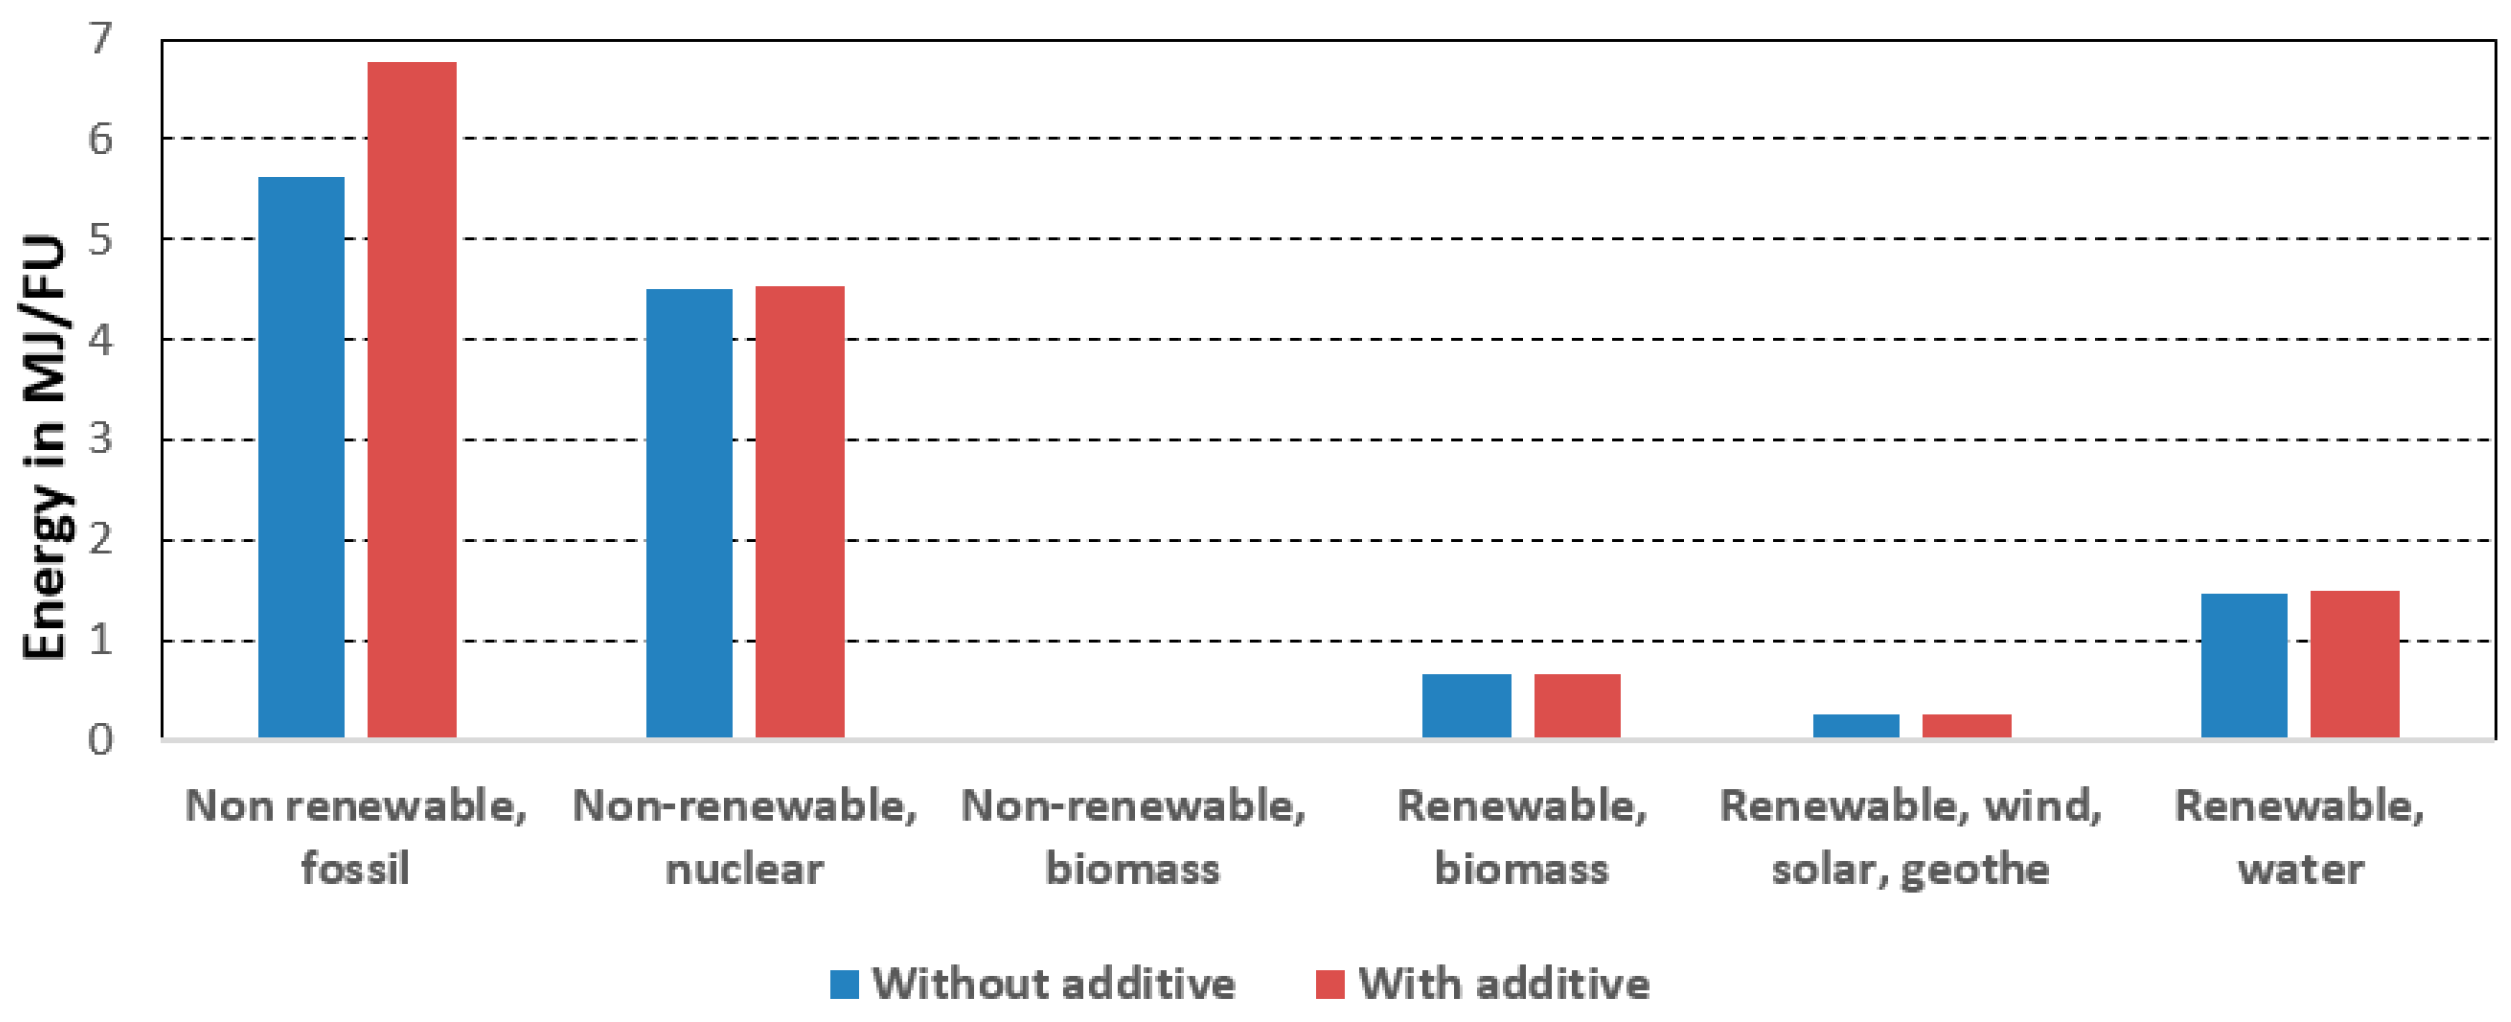
3.1. Cumulative Energy Demand of Organic Crackers

The life cycle impact assessment results show that the total CED values have been about 13 MJ/FU and 14 MJ/FU for crackers without and with the additive, respectively (see Figure 3). The CED value increased due to the introduction of the additive.
The post-harvest stage was found to be a hot spot in both options, i.e., crackers with and without nettle powder (see Figure 3 and Figure 4). The main contributors to energy consumption at the post-harvest stage were processing the additive and baking the crackers. The nettle was considered to be dehydrated from a moisture content of about 88% to 7%. As illustrated in Figure 5, non-renewable energy sources, such as fossil fuels and nuclear power, had a greater contribution to the total CED, followed by renewable hydropower energy. This indicates that shifting energy use (for food processing) to renewable sources could enable an increase in the sustainability of the (organic) food sector.
The findings of the current study indicate that the post-harvest processing and handling stage was an environmental hot spot in both cases, i.e., crackers without and with the nettle additive. Konstantas et al. [5] investigated the environmental sustainability of crackers and biscuits and found that reducing the energy consumption in the manufacturing of these food products could reduce CED by 8–12%. The authors also reported that the primary energy demand of the cracker value chain was about 17.5 MJ per kg crackers (including the consumption and waste management phases). In the current study, the CED value was about 12.5 MJ/kg of crackers (excluding the consumption and waste management stages). For organic crackers, baking, packaging, and nettle powder were the main contributors to the energy demand of the post-harvest stage. Therefore, efforts to improve the efficiency of these activities could increase the performance of the organic cracker value chain.

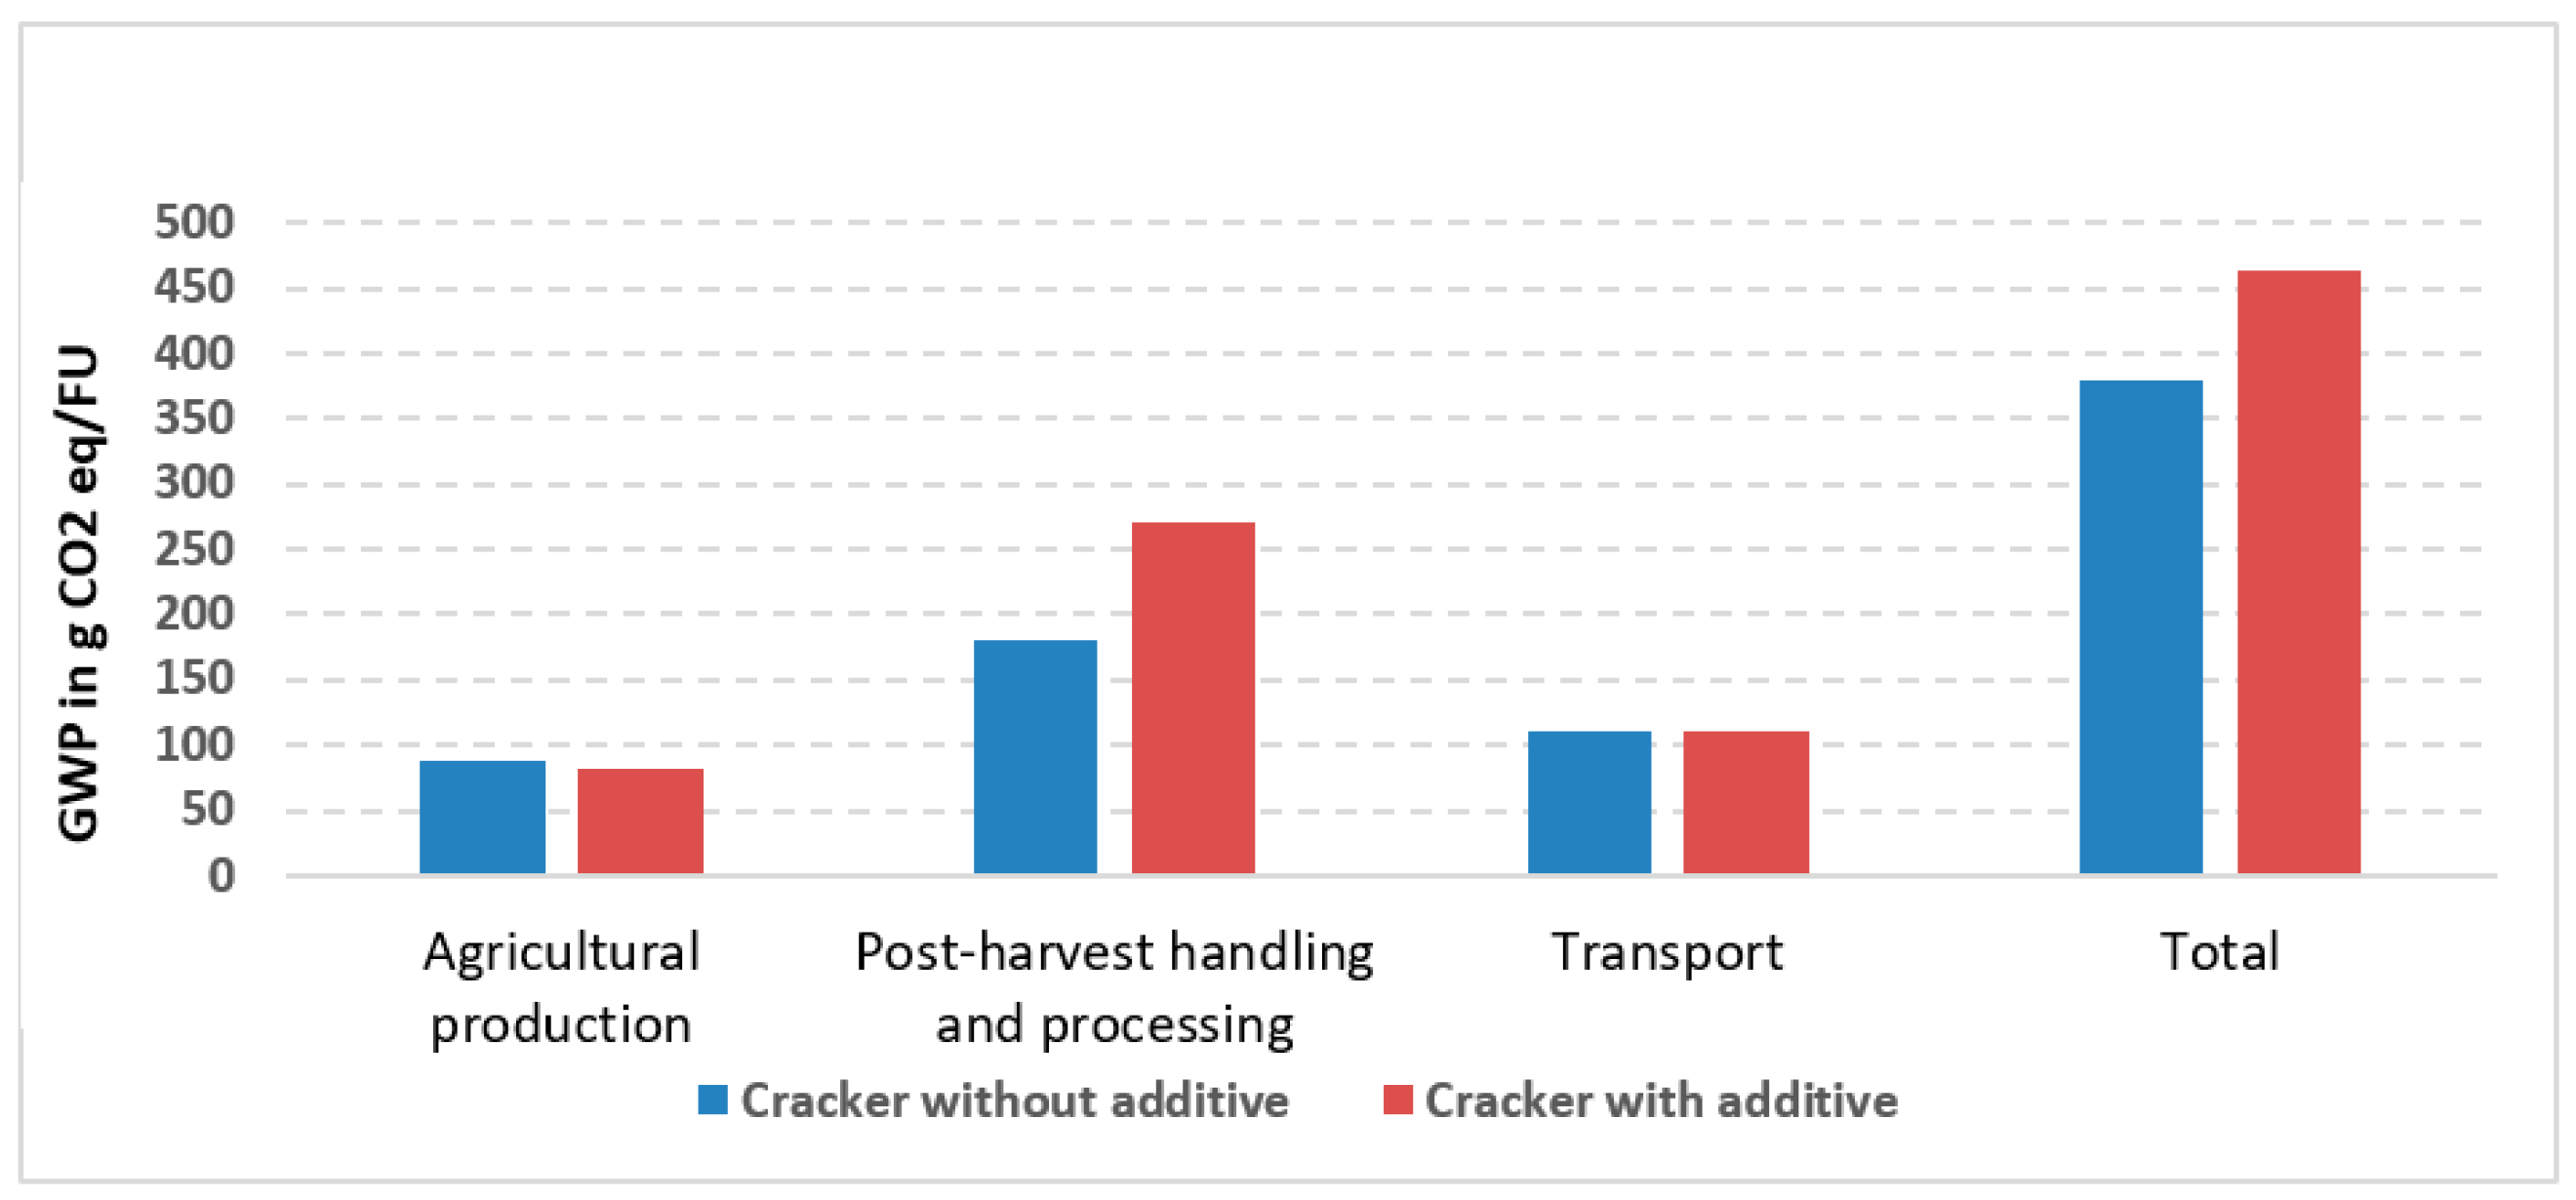
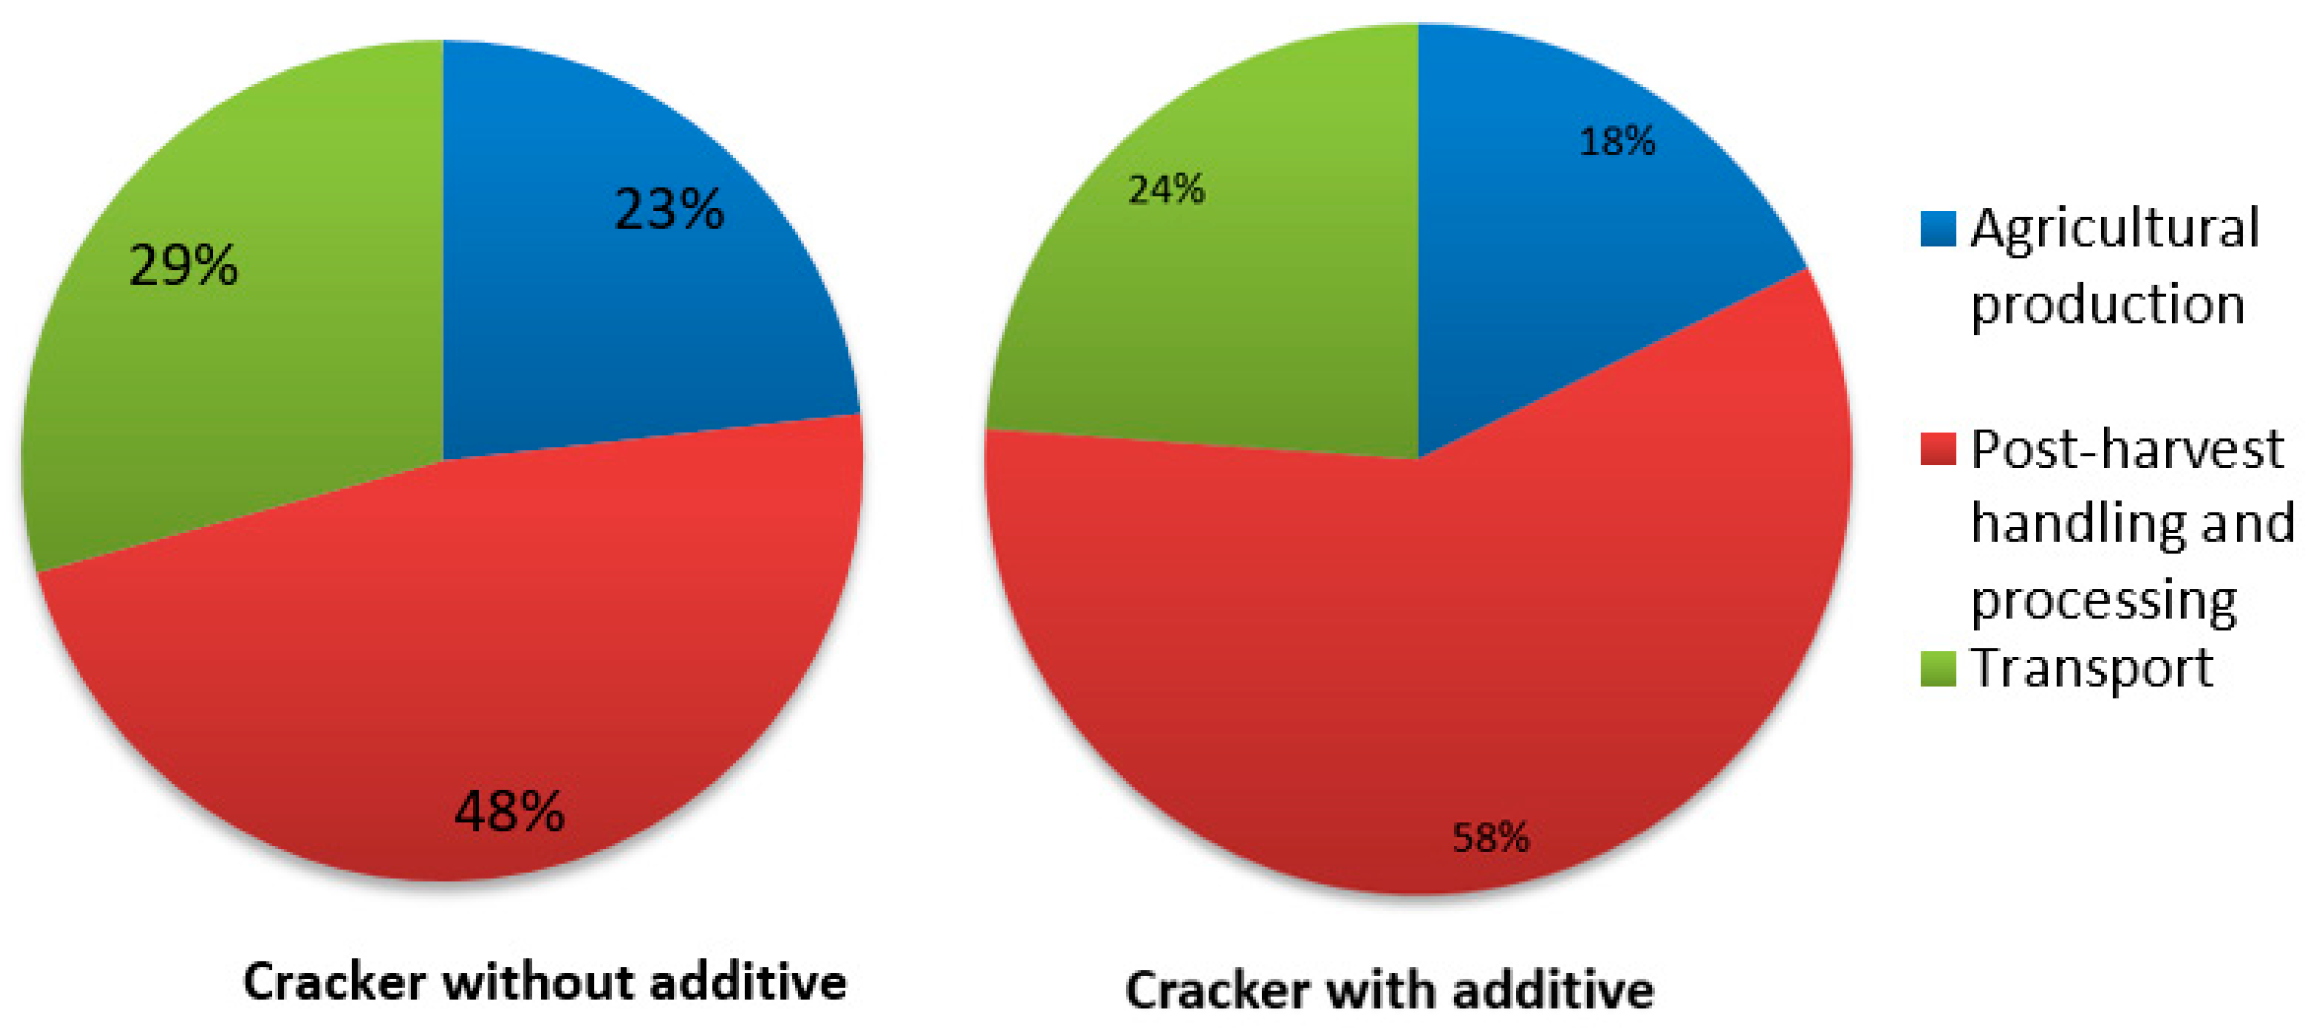
3.2. Climate Change Impact of Organic Crackers

Figure 6 presents the emission values of different stages of the process. Due to the introduction of nettle powder as an additive, the total GWP was increased by about 22.4%, i.e., from 379 to 464 g CO2 eq per FU. Similar to the case of CED, the post-harvest stage was a hot spot for emissions (see Figure 6 and Figure 7). For the non-additive case, the total GWP was about 379 g CO2 eq per FU, of which 48% was from the post-harvest stage and about 29% from transport activities. This supports the findings of Noya et al. [18].
When compared to the non-additive case, the use of the nettle additive increased the emission of the post-harvest stage by about 51% while the emissions of the agricultural stage were reduced by about 7% (see Figure 7). This reduction is due to the fact that less wheat flour is required per FU than in cases of crackers without additive. Considering conventional wheat from southern Sweden, Röös et al. [20] estimated the emission values to be 0.31 kg CO2 eq per kg of wheat before milling. In the current study, the emission values of the agricultural production stage were 0.82 and 0.88 kg CO2 eq per FU, respectively, for crackers produced without and with nettle powder. In both options (without and with the additive) the post-harvest processing and handling stage was found to be the hot spot. At the cracker-processing stage, ingredients such as rapeseed oil and salt contributed about 0.073 kg CO2 eq/FU and 0.032 kg CO2 eq/FU, respectively.

3.3. Acidification and Eutrophication of Organic Crackers

Similar to the CED and GWP values, the acidification and eutrophication impacts increased in the cases of crackers with the additive when compared to the product without the additive (see Table 4). For instance, the total values of acidification, freshwater eutrophication, and marine eutrophication impacts increased by 14%, 41%, and 0.6%, respectively.
The collection, processing, and supply of nettle additives, as well as the baking process, contributed more to acidification and eutrophication than agricultural wheat production. The long fossil fuel-based transport stages in cracker value chains led to a greater contribution of acidification and eutrophication impacts.
In this study, the focus was to assess how the introduction of a natural additive influences the environmental performance of wheat products. Nettle is one of plants that can be used as natural additives in food processing, e.g., in bakery. It has nutritional and bioactive components with potential health benefits [30]. It can be used as a nutritional ingredient in bakery, e.g., in baking wheat crackers. However, the environmental performance of food products with such a natural additive is less known. In this regard, this study fills a gap that exists in LCA research. In general, the introduction of the nettle additive increased the quantified values of all impact categories, CED, GWP, AP, and EP, in cracker value chains. The insights will enable food processors and policy makers to communicate the environmental impacts and make informed decisions to improve the sustainability of wheat crackers. The findings lay the basis for further impact assessments of food products processed with alternate plant-based additives.
However, there were limitations in this study. Only the nettle powder was considered, without addressing other potential plant-based additives. In addition, the nettle was assumed to be collected from the field and its cultivation stage was excluded in the LCI, but should be explored in future studies. In addition, the use of additives should also be investigated in terms of other food values [30] such as economic benefit, consumers’ satisfaction, and nutritional benefits. A comparison of the LCA can also be conducted for crackers made from organic wheat with wheat produced by integrated and conventional methods.

4. Conclusions

The main objective of this study was to assess the environmental impacts of organic cracker value chains using a cradle-to-consumer gate life cycle analysis (LCA) approach. Two options were investigated: organic crackers both without and with an additive (nettle powder). The main focus was investigating how the introduction of additives could influence the environmental impacts of wheat cracker value chains. This study was based on organic wheat produced and supplied in Sweden. The LCA was based on the functional unit of 1 kg crackers. The main environmental impact categories investigated in this study were cumulative energy demand (CED), climate change impact (GWP), acidification, and eutrophication, although the focus was on CED and GWP. Agricultural production, post-harvest activities (such as storing, packaging, and processing), and transport activities were the main life cycle stages used to present the results. The findings indicate that the post-harvest processing and handling stage was an environmental hot spot. The main contributors to environmental impacts include the production and supply of additives, processing (baking crackers), packaging, and transport activities. Due to the introduction of nettle powder as an additive, the total CED value increased from 12.5 MJ (without additive) to 13.72 MJ (with additive) per FU (i.e., 1 kg cracker). Similarly, the GWP value increased from 379 g CO2 eq to 464 g CO2 eq per FU, respectively.
The results of the current study can be used to create a new database of the LCA of organic cracker value chains, and indicate the importance of improving the energy and process efficiency at the post-harvest stage (including efficient production and processing of additives) to increase the sustainability of organic wheat cracker value chains. Based on the findings of the current study, the following future research is recommended: the identification of organic additives with reduced environmental impacts is vital for improving the sustainability of the investigated (and other) organic food value chains with additives. This could be achieved by improving the production and processing of the additives in addition to improving the processing of the main food item (e.g., crackers). Future studies could be carried out to compare organic and conventional wheat products including cracker value chains. The introduction of the nettle additive increased the environmental impacts of the cracker value chains. Therefore, the use of nettle powder as an additive should be further investigated in terms of other aspects of added food values, such as economic benefit, consumer satisfaction, and nutritional benefits.

Funding

This study is part of the SusOrgPlus project, funded via the ERA-NET CORE Organic Cofund from the European Commission’s Horizon 2020 Framework Programme for Research and Innovation Contract No. 727495.

Institutional Review Board Statement

Not applicable.

Informed Consent Statement

Not applicable.

Data Availability Statement

Data are contained within the article.

Conflicts of Interest

The author declares no conflicts of interest.

References

  1. Rayichuk, L.; Draga, M.; Boroday, V. Product Environmental Footprint and Bread Industry. In Baking Business Sustainability through Life Cycle Management; Ferreira da Rocha, J.M., Figurek, A., Goncharuk, A.G., Sirbu, A., Eds.; Springer: Cham, Switzerland, 2023. [Google Scholar] [CrossRef]
  2. FAOSTAT. Crops and Livestock Products. 2024. Available online: https://www.fao.org/faostat/en/#data/QCL/visualize (accessed on 27 March 2024).
  3. Sowell, A.; Williams, A. Wheat Outlook: January 2024 (Report No. WHS-24a). U.S. Department of Agriculture, Economic Research Service. 2024. Available online: https://www.ers.usda.gov/webdocs/outlooks/108279/whs-24a.pdf?v=8774.5#:~:text=U.S%20winter%20wheat%20area%20for,over%20year%20(figure%202) (accessed on 29 March 2024).
  4. Zingale, S.; Guarnaccia, P.; Matarazzo, A.; Lagioia, G.; Ingrao, C. A systematic literature review of life cycle assessments in the durum wheat sector. Sci. Total Environ. 2022, 844, 15723. [Google Scholar] [CrossRef] [PubMed]
  5. Konstantas, A.; Stamford, L.; Azapagic, A. Evaluation of environmental sustainability of biscuits at the product and sectoral levels. J. Clean. Prod. 2019, 230, 1217–1228. [Google Scholar] [CrossRef]
  6. Statista. Annual Consumption Volume of Cookies, Wafers and Dry Biscuits in Sweden from 2010 to 2021. 2024a. Available online: https://www.statista.com/statistics/645167/consumption-volume-of-cookies-wafers-and-dry-biscuits-in-sweden/ (accessed on 15 February 2024).
  7. Statista. Confectionery and Snacks—Sweden. 2024b. Available online: https://www.statista.com/outlook/cmo/food/confectionery-snacks/sweden (accessed on 3 February 2024).
  8. SCB. Production of Organic and Non-Organic Farming 2018. Cereals, Dried Pulses, Oilseeds, Table Potatoes and Temporary Grasses. 2019. Available online: https://www.scb.se/contentassets/c37559bf147944b5822681df7d09c97b/jo0608_2018a01_sm_jo14sm1901.pdf (accessed on 24 January 2024).
  9. David, C.; Abecassis, J.; Carcea, M.; Celette, F.; Friedel, J.K.; Hellou, G.; Hiltbrunner, J.; Messmer, M.; Narducci, V.; Peigné, J.; et al. Organic Bread Wheat Production and Market in Europe. Sustain. Agric. Rev. 2012, 11, 43–62. [Google Scholar] [CrossRef]
  10. Bux, C.; Lombardi, M.; Varese, E.; Amicarelli, V. Economic and Environmental Assessment of Conventional versus Organic Durum Wheat Production in Southern Italy. Sustainability 2022, 14, 9143. [Google Scholar] [CrossRef]
  11. di Cristofaro, M.; Marino, S.; Lima, G.; Mastronardi, L. Evaluating the impacts of different wheat farming systems through Life Cycle Assessment. J. Clean. Prod. 2024, 436, 140696. [Google Scholar] [CrossRef]
  12. Van Stappen, F.; Loriers, A.; Mathot, M.; Planchon, V.; Stilmant, D.; Debode, F. Organic Versus Conventional Farming: The Case of wheat Production in Wallonia (Belgium). Agric. Agric. Sci. Procedia 2015, 7, 272–279. [Google Scholar] [CrossRef]
  13. Ismayana, A.; Ibrahim, O.A.; Yani, M. Life cycle assessment of wafer biscuit production. IOP Conf. Ser. Earth Environ. Sci. 2020, 472, 012065. [Google Scholar] [CrossRef]
  14. Kulshreshtha, S.K.; Kumar, A. Asian Overview on Sustainability Approach in Baking Industry. In Baking Business Sustainability through Life Cycle Management; Ferreira da Rocha, J.M., Figurek, A., Goncharuk, A.G., Sirbu, A., Eds.; Springer: Cham, Switzerland, 2023. [Google Scholar] [CrossRef]
  15. Vargas-Hernández, J.G.; Ali, M.M. Across American Overview on Sustainability Approach throughout Baking Industry: An Analytical-Descriptive Approach. In Baking Business Sustainability through Life Cycle Management; Ferreira da Rocha, J.M., Figurek, A., Goncharuk, A.G., Sirbu, A., Eds.; Springer: Cham, Switzerland, 2023. [Google Scholar] [CrossRef]
  16. Sîrbu, A. Sustainability Approach of the Baking Industry Along the Food Supply Chain. In Baking Business Sustainability through Life Cycle Management; Ferreira da Rocha, J.M., Figurek, A., Goncharuk, A.G., Sirbu, A., Eds.; Springer: Cham, Switzerland, 2023. [Google Scholar] [CrossRef]
  17. Temkov, M.; Velickova, E.; Tomovska, E. Ensuring Sustainability of Baking Industry in North Macedonia. In Baking Business Sustainability through Life Cycle Management; Ferreira da Rocha, J.M., Figurek, A., Goncharuk, A.G., Sirbu, A., Eds.; Springer: Cham, Switzerland, 2023. [Google Scholar] [CrossRef]
  18. Noya, L.I.; Vasilaki, V.; Stojceska, V.; González-García, S.; Kleynhans, C.; Tassou, S.; Moreira, M.T.; Katsou, E. An environmental evaluation of food supply chain using life cycle assessment: A case study on gluten free biscuit products. J. Clean. Prod. 2018, 170, 451–461. [Google Scholar] [CrossRef]
  19. Sundberg, H. The Water Footprint of Winter Wheat in Sweden. 2012. Available online: https://lup.lub.lu.se/luur/download?func=downloadFile&recordOId=3127244&fileOId=3127252 (accessed on 3 April 2024).
  20. Röös, E.; Sundberg, C.; Hansson, P.A. Uncertainties in the carbon footprint of refined wheat products: A case study on Swedish pasta. Int. J. Life Cycle Assess. 2011, 16, 338. [Google Scholar] [CrossRef]
  21. ISO 14040:2006; Environmental Management, Life Cycle Assessment Principles and Framework. Available online: https://www.iso.org/standard/37456.html (accessed on 3 April 2024).
  22. ISO 14044:2006; Environmental Management, Life Cycle Assessment Requirements and Guidelines. Available online: https://www.iso.org/standard/38498.html (accessed on 3 April 2024).
  23. Cederberg, C.; Flysjö, A. Life Cycle Inventory of 23 Dairy Farms in South-Western Sweden; SIK-Rapport, Report Number 728; SIK Institutet för livsmedel och bioteknik: Gothenburg, Sweden, 2004; ISBN 91-7290-237-X. [Google Scholar]
  24. UniTus. Expermental Data from Department for Innovation in Biological, Agro-Food and Forest Systems, University of Tuscia, 01100 Viterbo, Italy. Data as Part of SusOrgPlus Project. 2020. Available online: https://www.susorgplus.eu/about (accessed on 2 April 2024).
  25. Recchia, L.; Cappelli, A.; Cini, E.; Garbati Pegna, F.; Boncinelli, P. Environmental Sustainability of Pasta Production Chains: An Integrated Approach for Comparing Local and Global Chains. Resources 2019, 8, 56. [Google Scholar] [CrossRef]
  26. LCAfood. LCA Food Database, Retrieved from SimaPro Software. 2007. Available online: http://gefionau.dk/lcafood/ (accessed on 20 October 2017).
  27. Sarduy Gómez, J.R.; Felipe Viego, P.R.; Torres Díaz, Y.; Plascencia Álvarez Guerra, M.A.; Sousa, V.; Haeseldonckx, D. A New Energy Performance Indicator for Energy Management System of a Wheat Mill Plant. Int. J. Energy Econ. Policy 2018, 8, 324–330. Available online: https://www.econjournals.com/index.php/ijeep/article/view/6753/3867 (accessed on 3 April 2024).
  28. Fridrihsone, A.; Romagnoli, F.; Cabulis, U. Environmental Life Cycle Assessment of Rapeseed and Rapeseed Oil Produced in Northern Europe: A Latvian Case Study. Sustainability 2020, 12, 5699. [Google Scholar] [CrossRef]
  29. Alibas, I. Energy Consumption and Colour Characteristics of Nettle Leaves during Microwave, Vacuum and Convective Drying. Biosyst. Eng. 2007, 96, 495–502. [Google Scholar] [CrossRef]
  30. Nallan Chakravartula, S.S.; Moscetti, R.; Farinon, B.; Vinciguerra, V.; Merendino, N.; Bedini, G.; Neri, L.; Pittia, P.; Massantini, R. Stinging Nettles as Potential Food Additive: Effect of Drying Processes on Quality Characteristics of Leaf Powders. Foods 2021, 10, 1152. [Google Scholar] [CrossRef] [PubMed]
Figure 1. Simplified flow chart of the organic cracker value chain. For the non-additive case, about 1.2 kg of wheat is required because the nettle powder is excluded from the system. The consumption stage is not included in the system boundary.
Sustainability 16 03092 g001
Figure 3. CED values at different stages of the organic cracker value chain in MJ per FU.
Sustainability 16 03092 g003
Figure 4. Contribution of different life cycle stages represented as percentage of total CED values, i.e., 13 MJ/FU and 14 MJ/FU without and with the additive, respectively.
Sustainability 16 03092 g004
Figure 5. Illustration of components of different energy sources and their contribution to total CED, i.e., 13 MJ/FU and 14 MJ/FU without and with the additive, respectively.
Sustainability 16 03092 g005
Figure 6. GWP values at different stages of the organic cracker value chain.
Sustainability 16 03092 g006
Figure 7. Contribution of different life cycle stages of cracker production as % of total GWP values.
Sustainability 16 03092 g007
Table 1. Average organic and conventional winter wheat yields (kg/ha) in Sweden [8].
YearOrganic Winter Wheat (kg/ha)Conventional Winter Wheat (kg/ha)
201235906970
201331706490
201438707420
201541407780
201639606860
201746807540
201832804900
201949108000
Table 4. Quantified acidification and eutrophication values of cracker value chains per FU.
Impact CategoryUnitAgricultural ProductionPost-Harvest ProcessingTransportTotal
Crackers without additive
Terrestrial acidificationg SO2 eq/FU0.29491.11960.57481.9892
Freshwater eutrophicationg P eq/FU0.00230.05640.00570.0643
Marine eutrophicationg N eq/FU0.00040.31570.00070.3167
Crackers with additive *
Terrestrial acidificationg SO2 eq/FU0.27741.42090.57282.2710
Freshwater eutrophicationg P eq/FU0.00210.08280.00570.0905
Marine eutrophicationg N eq/FU0.00040.31760.00070.3186
*—Organic nettle powder considered as the additive.
Disclaimer/Publisher’s Note: The statements, opinions and data contained in all publications are solely those of the individual author(s) and contributor(s) and not of MDPI and/or the editor(s). MDPI and/or the editor(s) disclaim responsibility for any injury to people or property resulting from any ideas, methods, instructions or products referred to in the content.

