Article

Cotton–Cork Blended Fabric: An Innovative and Sustainable Apparel Textile for the Fashion Industry

Textile Development and Marketing, Fashion Institute of Technology, New York, NY 10001, USA
*
Author to whom correspondence should be addressed.
Sustainability 2024, 16(8), 3098; https://doi.org/10.3390/su16083098
Submission received: 5 February 2024 / Revised: 7 March 2024 / Accepted: 1 April 2024 / Published: 9 April 2024

Abstract

:
Cotton is a preferred textile fiber for apparel textiles and is used primarily for summer wear. However, cotton has drawbacks, such as poor wrinkle resistance, and therefore, blends of cotton with other fibers have gained acceptance in the industry. In this study, a novel 90:10 cotton–cork blended fabric was studied for its physical and performance properties and benchmarked against a 100% cotton fabric. Fabric samples were analyzed to determine the wrinkle recovery angle, tenacity, abrasion resistance, shrinkage, CLO value, moisture absorption, and dyeability. The samples were further analyzed using SEM, DSC, and FTIR. The results showed significant differences between the two fabrics. Cotton–cork blended textile fabric had higher performance properties with the potential to be a viable, sustainable apparel textile.

1. Introduction

Cotton is a favorite natural fiber and enjoys great popularity with a high percentage of the population worldwide [1]. However, polyester is the most-used textile fiber, as it can be used year-round as a single or a blended fiber for all clothing categories, and it does not wrinkle as much as cotton [2,3]. Cotton is also very absorbent, breathable, and comfortable; hence, it is best suited for summer clothing [4,5]. Cotton is a unicellular seed fiber composed of approximately 85–90% cellulose, and the remaining percentage consists of lignin, hemicellulose, pectin, and wax [6,7]. Although the high cellulose content in cotton makes it very absorbent and comfortable, it also causes the cotton fabric to wrinkle significantly, and it cannot be worn in the winter without a brushed finish [6]. The popularity and consumption of cotton can be increased further if it can be worn in all seasons. Even though several chemical finishes have been innovated and adopted to treat cotton for better performance towards wrinkle recovery, it is fair to say that none of them are 100% sustainable and environmentally friendly [1]. To overcome cotton’s drawbacks, it has been blended with several fibers, of which cotton and polyester blends have been very successful for apparel textiles [2]. However, with the textile industry being constantly under attack for polluting the planet and polyester being a byproduct of the petroleum industry and a non-biodegradable polymer, recent innovations must trend towards biobased and biodegradable textiles, finishes, and coatings, which can continue to enhance the performance of cotton without taking a toll on the environment, being expensive, and causing any detriment to the fabric. The recent development of 90:10 cotton–cork blended woven textile material is an innovative example.
Cork is a natural, heterogeneous, anisotropic, cellular material obtained from the bark of the Quercus Suber L. cork oak tree, which makes it biobased and biodegradable [7,8]. Moreover, cork is considered a sustainable material, as it is obtained from a renewable resource, and no harm is caused to the tree or the environment while harvesting the cork [9,10]. On average, cork is chemically comprised of five layers of 38.6% suberin, 21.7% lignin, 18.2% polysaccharides, 15.3% extractives (tannins and waxes), and 0.7% ash, making it a heterogeneous material [11]. Cork serves as a protective layer for the tree it grows on; thus, it has an outstanding set of properties, namely low density, little permeability to liquids and gasses, chemical and biological inertia, medical elasticity, high friction, good insulation, high damping capacity, and better mechanical efficiency, attributing to its cellular structure and chemical composition, thus putting it on the list of sustainable biomaterials [12,13]. Cork consists of suberin, which is responsible for the insulation and hydrophobic properties of the stem [14]. Suberin is considered a complex polyester built with long-chain fatty acids and glycerol; basically, it is a large biopolymer of lipid nature in the shape of tiny pentagonal or hexagonal honeycombs and filled with an air-like gas, which makes up 90% of its volume, which also attributes to its porosity and buoyancy [7,12,15,16]. Lignin is the second most important structural component of cork. The third layer of structural polysaccharides of the cell walls is composed of cellulose and hemicellulose that make up to 19% of cork and renders it minimally absorbent, due to the low percentage of cellulose content present, especially compared to 100% scoured cotton [7,16]. Cork has an overall three-dimensional microstructure (Figure 1), which is different in all three axial, radial, and tangential directions (Figure 2), resulting in different properties in different directions; hence, it is categorized as an anisotropic material [13,17]. The suberin cells are connected via capillaries, which confer specific characteristics, such as partial impermeability to water and gasses and resistance to acids, and contribute to its compressibility, thus justifying the property of chemical inertia [16,18]. Cork is said to have very good bio-inertia, as it has the natural ability to preclude the invasion from several animal species and not become degraded by the natural elements while growing or after harvesting and product development [19,20]. Cork is particularly known for its use in sealing wine bottles and floating devices, offering properties such as elasticity, compressibility, buoyancy, thermal insulation, low thermal conductivity, low density, and impermeability [8,9].
Cork obtained from the bark of the cork oak tree has been used for centuries for the development and use of various products, including textiles [19,22]. At present, cork sheets are bonded with polyester, cotton textiles, or leather or coated with polyurethane to be further developed into bags, wallpapers, shoes, upholsteries, and other products [10,22]. The development of 90:10 cotton–cork blended, plain-weave, medium-weight textile fabric is new to the textile industry. Coating textile fabrics with animal fat to impart water repellency was prevalent in ancient times. In contemporary textiles, yarns are coated with nano-materials, such as carbon nanotubes and silver nano-particles, with the aid of synthetic polymers to enhance the performance of the treated textiles. Coating with cork on a cotton woven textile is a recent development and has the potential to diversify the use of the natural, versatile, and biodegradable cork to enhance the performance of the cotton woven material.
There is a dearth of research on the properties of 90:10 cotton–cork blended fabric, thereby preventing its adoption by the fashion industry. Therefore, the purpose of this research was to study the physical and performance properties of 90:10 cotton–cork blended fabric in comparison to a 100% cotton fabric sample. The 90:10 cotton–cork sample is referred to as the 90:10 cotton–cork blended sample in this paper. The 90:10 cotton–cork blended textile fabric was analyzed to be a mixture of cotton warp and cork-coated cotton weft in a plain-woven construction of medium weight. Additionally, the fabric samples were analyzed using a scanning electron microscope to confirm the cork coating on the cotton weft yarns. FTIR was used to study the chemical spectra, and the thermal behavior was studied using DSC.

2. Materials and Methods

Commercial samples of 100% cotton fabric and 90:10 cotton–cork blended fabric were procured from online website Dharma Traders, Petaluma, CA, USA, and Texteis Penedo, SA, Portugal, respectively.
A woven fabric has two sets of yarns called warp, or ends, and weft, or picks. Ends per inch (EPI) are the number of warp yarns in a square inch. Picks per inch (PPI) are the number of weft yarns in a square inch. The finer the yarns, the greater the numbers of ends and picks in one square inch. The EPI and PPI of the 100% cotton fabric was 80 × 80, indicating it to be a balanced plain weave. The warp yarn count was 41.53 Ne, and the weft yarn count was 27 Ne for the cotton fabric, indicating finer yarns in the warp and weft directions, as compared to the plain-weave cotton–cork blend, which had a yarn size of 52/2 Ne in the warp and 108/2 Ne in the weft direction. The EPI and PPI of the cotton–cork blend was 65 × 50. The 100% cotton fabric weighed 103.07 grams per square meter (GSM), and the cotton–cork blended fabric weighed 179.70 GSM. Both fabrics are categorized as medium-weight apparel fabrics.
The fabric samples were thoroughly scoured before conducting the tests. Robust sampling was performed to obtain discreet swatches to conduct the various tests. The objective of the research was to compare the physical and performance properties of 100% cotton and the 90:10 cotton–cork blend by performing tenacity, abrasion resistance, shrinkage, CLO value, wrinkle recovery, moisture absorption, and dyeability tests. Further characterizations of the samples were obtained using SEM imaging, DSC, and FTIR spectroscopy.

3. Results

3.1. Tensile Strength

Tensile strength is a good indicator of the durability of textile materials for apparel use. The higher the tensile strength for a particular weight category, the greater the durability of the textile material. The tensile strengths of the two fabric samples were measured by averaging the data obtained using four samples from the warp direction and four samples from the weft direction in each fabric type. An Instron tensile tester was used following the test method ASTM D4632 [23]. The cotton–cork blended fabric required an average force of 61.37 lbs. in the warp direction and 51.75 lbs. in the weft direction to break, which was higher compared to the 100% cotton fabric, which required an average force of 48.59 lbs. in the warp direction and 33.86 lbs. in the weft direction. The individual data for both fabric samples are reported in Table 1.

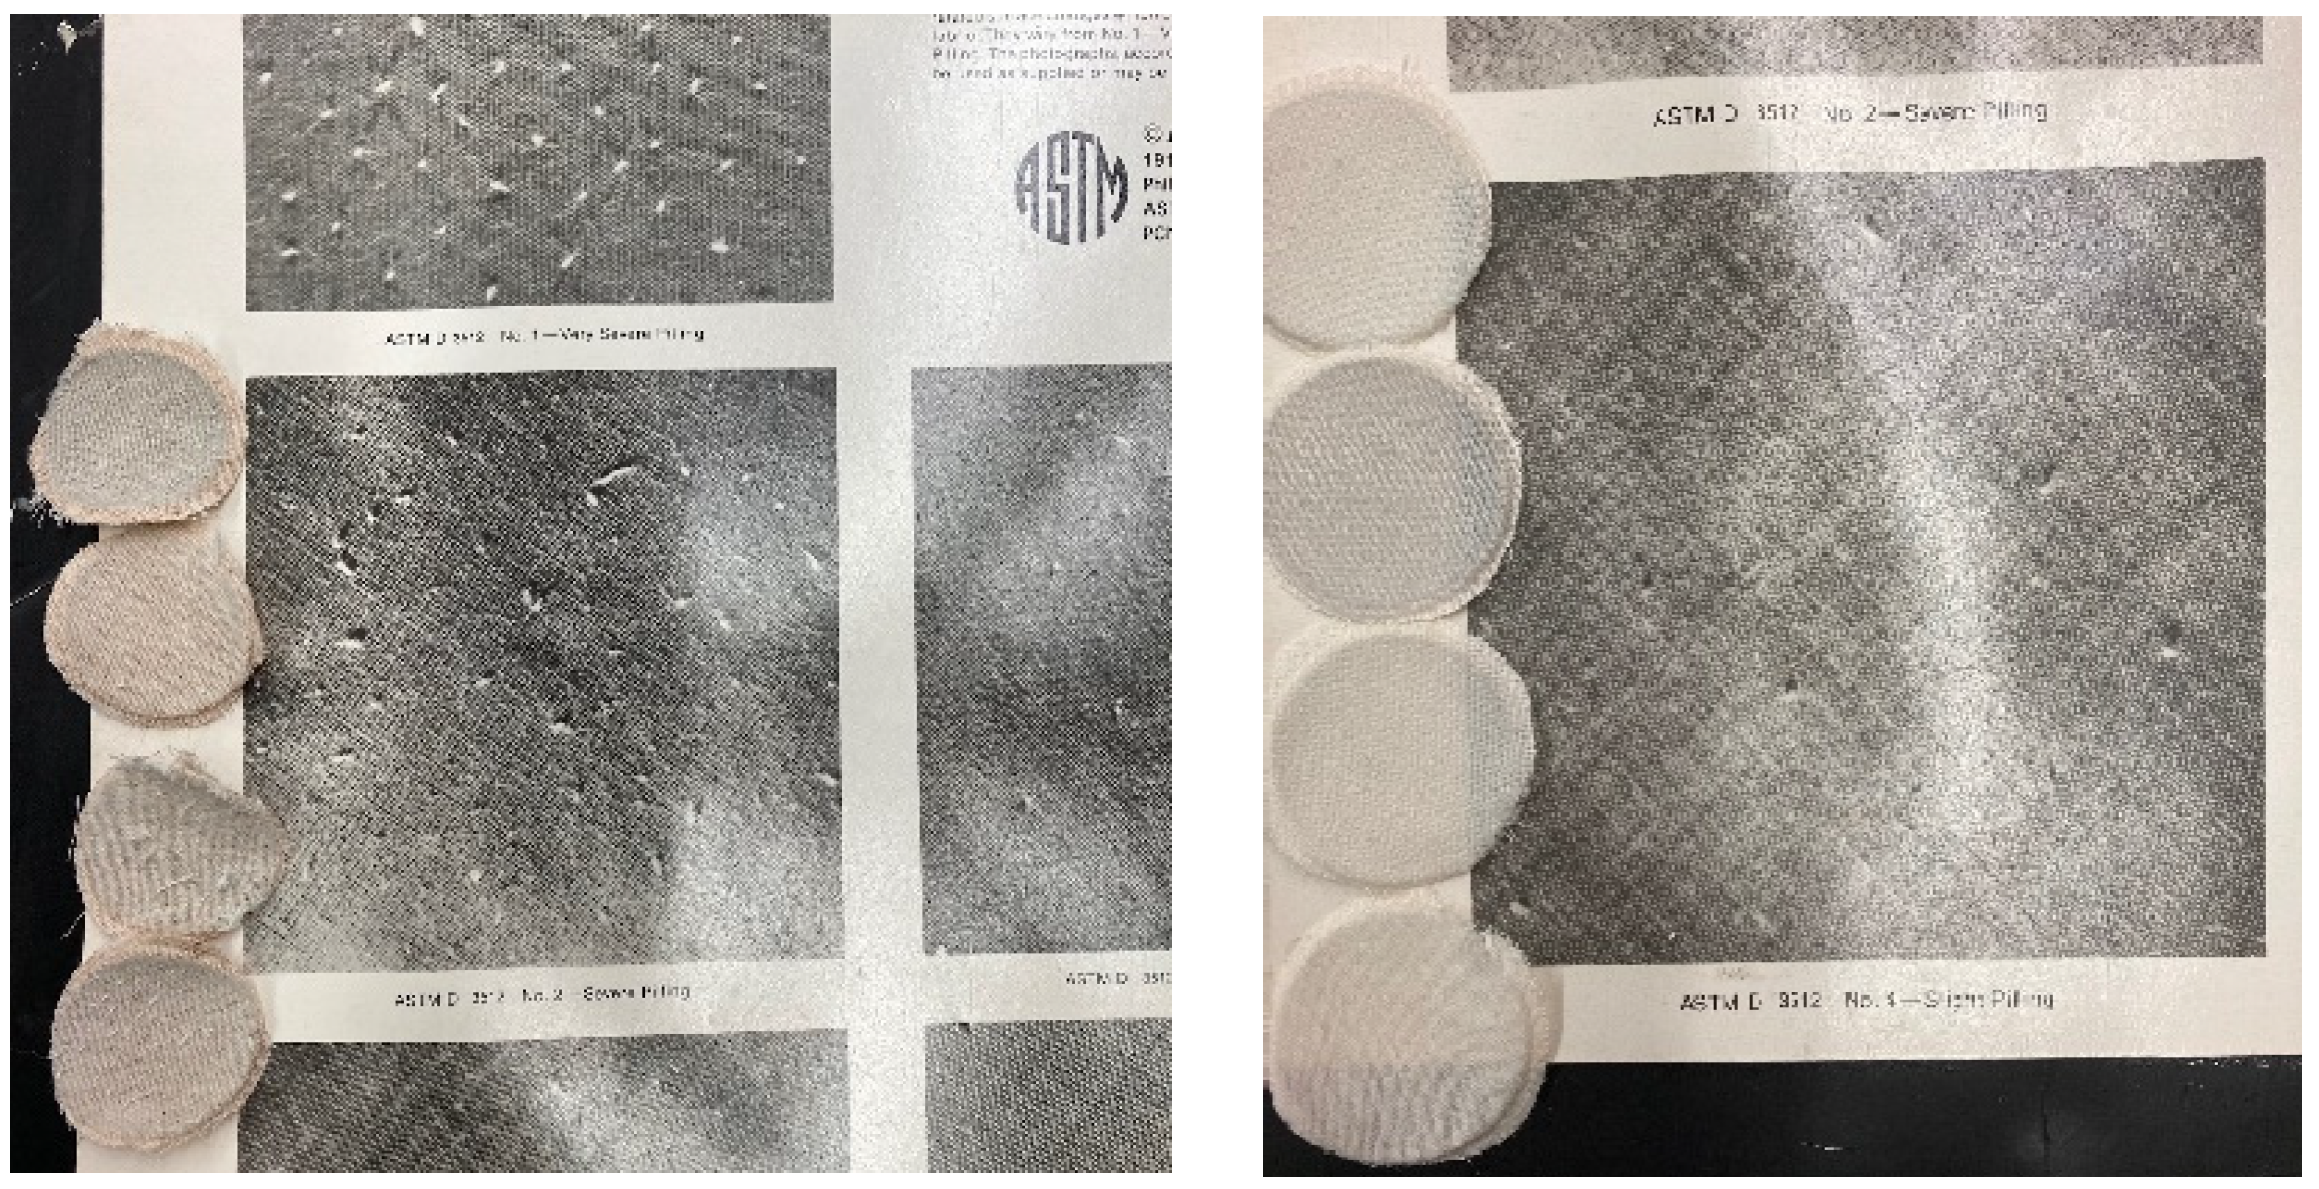
3.2. Abrasion Resistance

An abrasion resistance test using the SDL Martindale M235 abrasion test was performed following the ASTM D3512 [24] test procedure on the samples. The cotton–cork blended sample had a slub yarn appearance in the weft direction, due to the cork coated on cotton yarns at different uneven intervals. There was a significant change in the abrasion resistance of cotton–cork blended samples after 5000 cycles, as seen in Figure 3 left, as the rating for the blended samples was an average of 2.5, compared to that of the 100% cotton samples, as seen in Figure 3 right, which had an average rating of 4.5.

3.3. Wrinkle Recovery Angle Test (WRA)
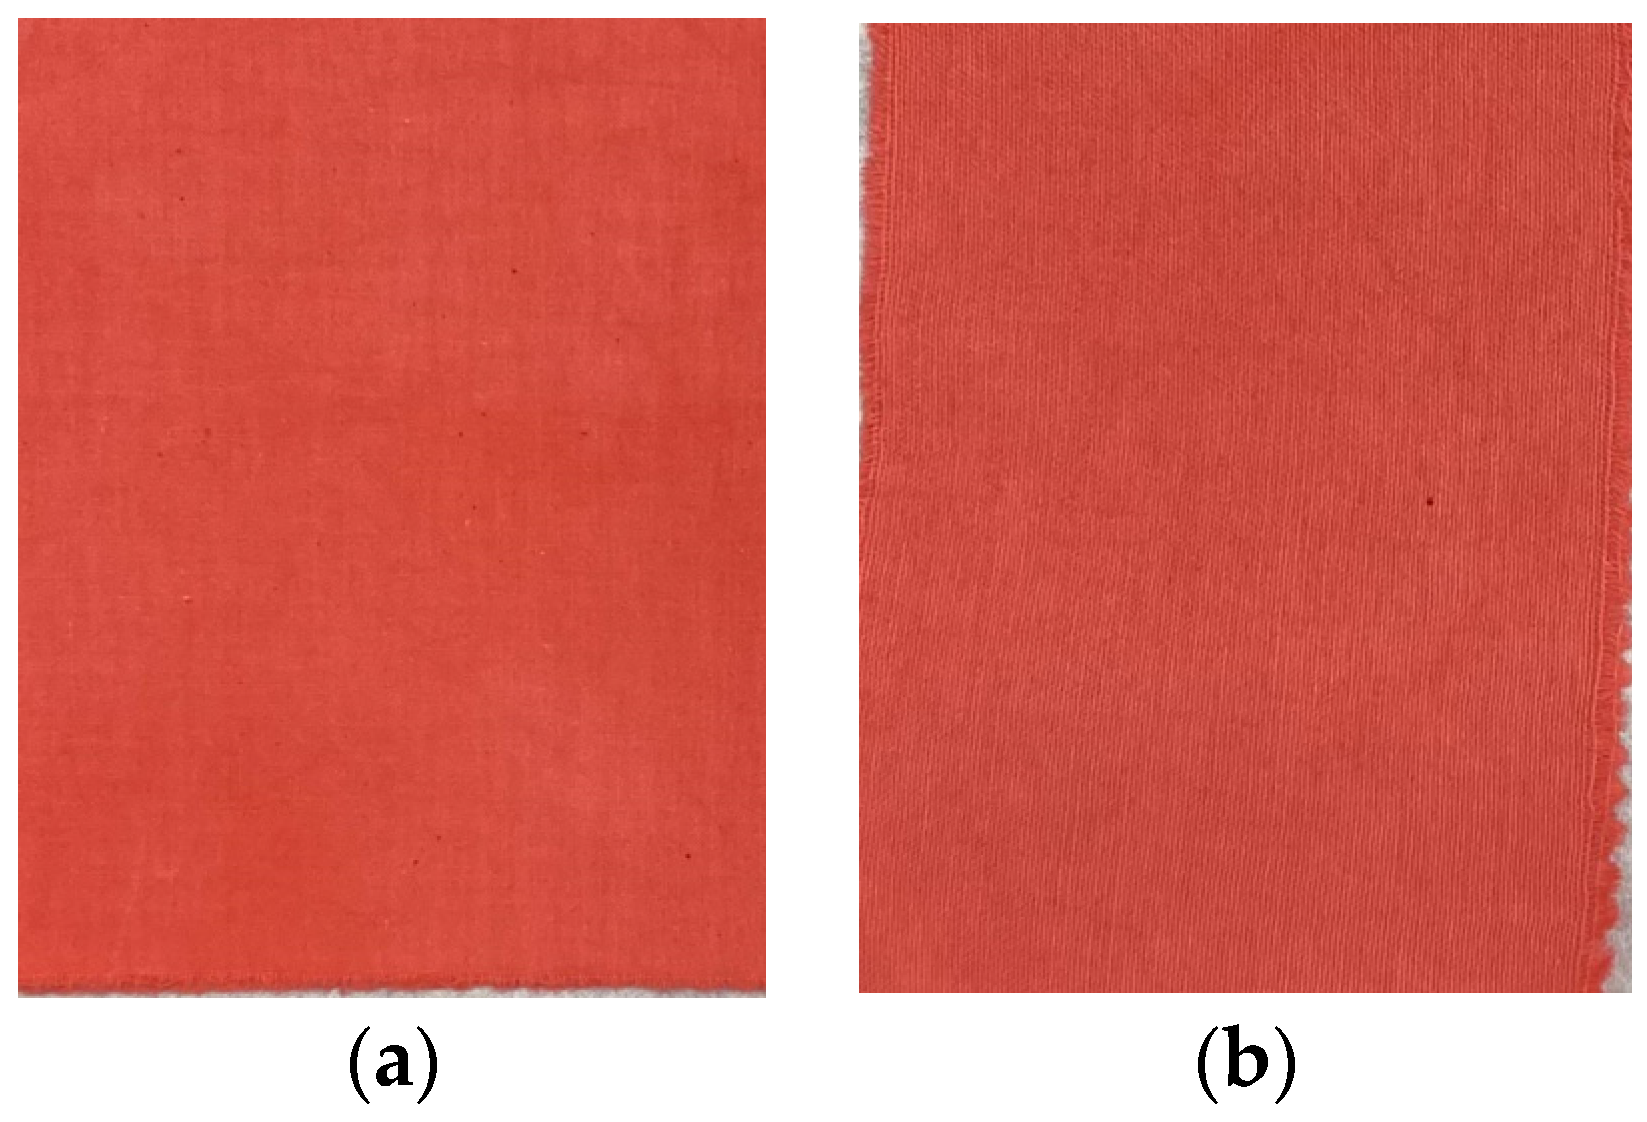
The wrinkle recovery angle (WRA) test was performed using the test method AATCC TM-66. The average WRA in the warp direction for six random 100% cotton samples was 99.5 degrees, and for the weft direction, it was 100 degrees. The average WRA angle for the six cotton–cork blended samples in the warp direction was 133.8 degrees, and it was 132.2 degrees in the weft direction, respectively, as seen in Table 2.

3.4. Dyeability

The two textile samples of 100% cotton and 90:10 cotton–cork blend were dyed using Reactive Yellow HF2GL (Archroma, Charlotte, NC, USA) in the same dye bath to determine the dyeability of the 90:10 blended textile. The fabrics were weighed, and the dye was calculated based on the weight (1:10 material to liquor ratio) of the fabric; the auxiliaries used were soda ash and sodium chloride. The samples were soaped thoroughly. Both samples showed a similar dye uptake, as can be seen in Figure 4a for the cotton–cork blend and Figure 4b for 100% cotton fabric.

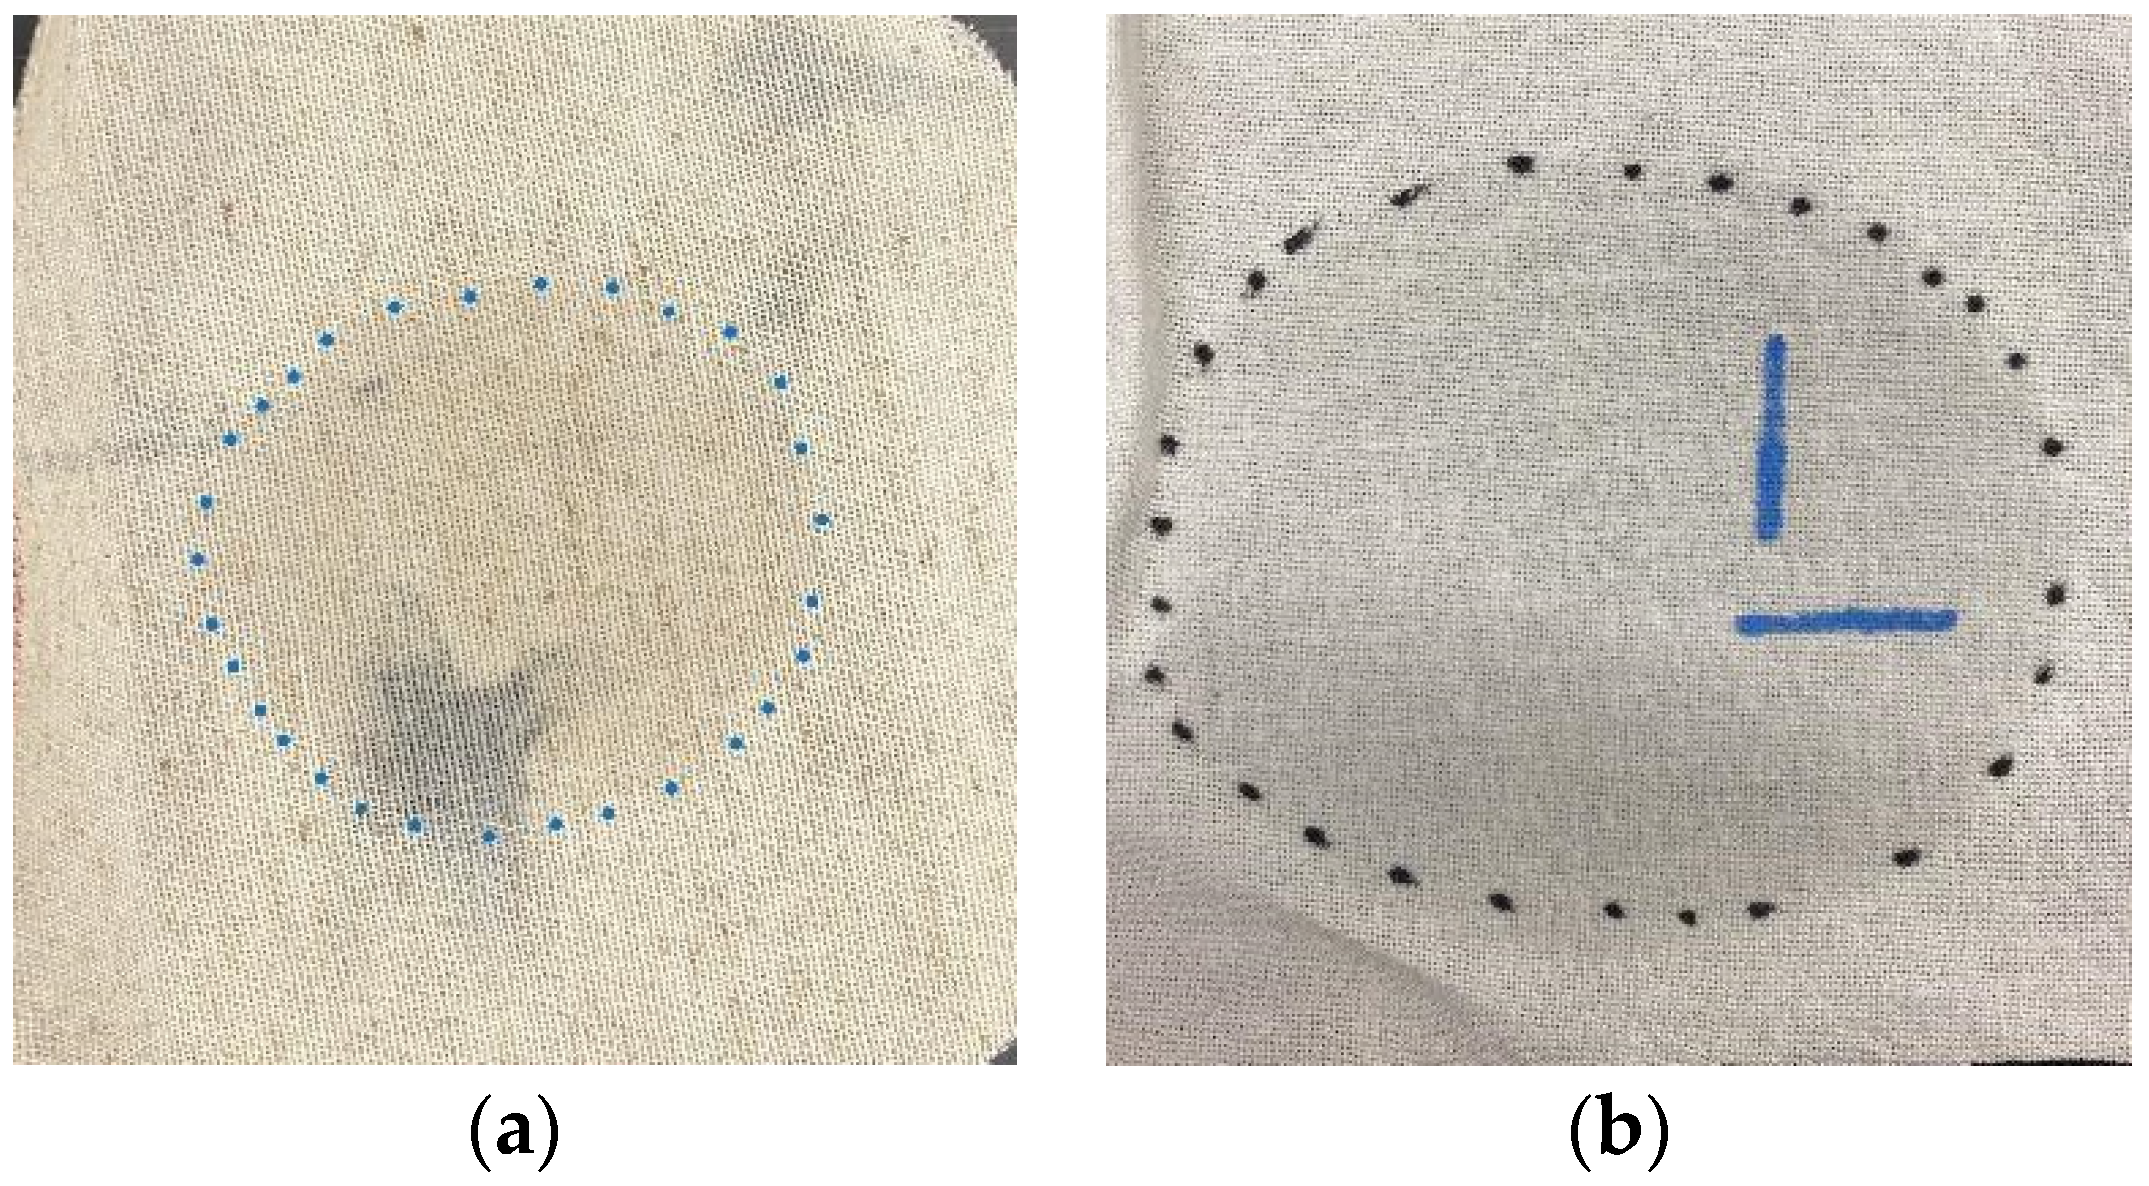
3.5. Thermal Insulation

The CLO value, also known as the insulation value of clothing, is a unit indicating the amount of insulation or heat resistance a clothing material offers to keep a human being comfortable at a room temperature of 21 °C [25]. To determine the CLO value of the two samples, a guarded hot plate by TPS Tenny, model number VAR-0499, was used following the ASTM F1868 [26] procedure. The CLO value for 100% cotton was calculated to be 0.17, and for the cotton–cork blended fabric, it was 0.23.

3.6. Moisture Management Test

The moisture management test was performed using an SDL ATLAS M290 instrument, (SDL Atlas, Rockhill, SC, USA). Although the cotton–cork blend had a lower absorption rate than 100% cotton muslin, it was still very absorbent. Figure 5a indicates the maximum wetted radius for 90:10 cotton–cork blended fabric, and Figure 5b indicates the maximum wetted radius of 100% cotton muslin fabric. The test indicated that the cotton–cork blended fabric had good absorbency, as the top and bottom max wetted radius was 20 mm, compared to the top and bottom wetted radius for 100% cotton, which was 30 mm. Fabric breathability and humidity were also indicated by the moisture management data, since good absorbency signals the amorphous content of the fiber and the ability of the textile material to allow the movement of moisture within the polymer structure of the fiber.

3.7. Shrinkage Test

A 5 × 5 inch sample square was cut for both fabric types, and the edges were overlocked. The samples were laundered six times and tested for shrinkage. The 100% cotton samples were dimensionally stable after the second laundering, and no more shrinkage was indicated. The cotton–cork blended fabric shrank the same percent as compared to 100% cotton, except for the fact that the cotton–cork blended fabric samples ceased shrinking after the third laundering cycle. The shrinkage in both samples was under 2%, which will not be a factor during garment production, since prewashing is the normal practice in the industry. The data are shown in Table 3. Each sample was measured in the warp and weft directions, and the measurements were noted to calculate the % shrinkage.

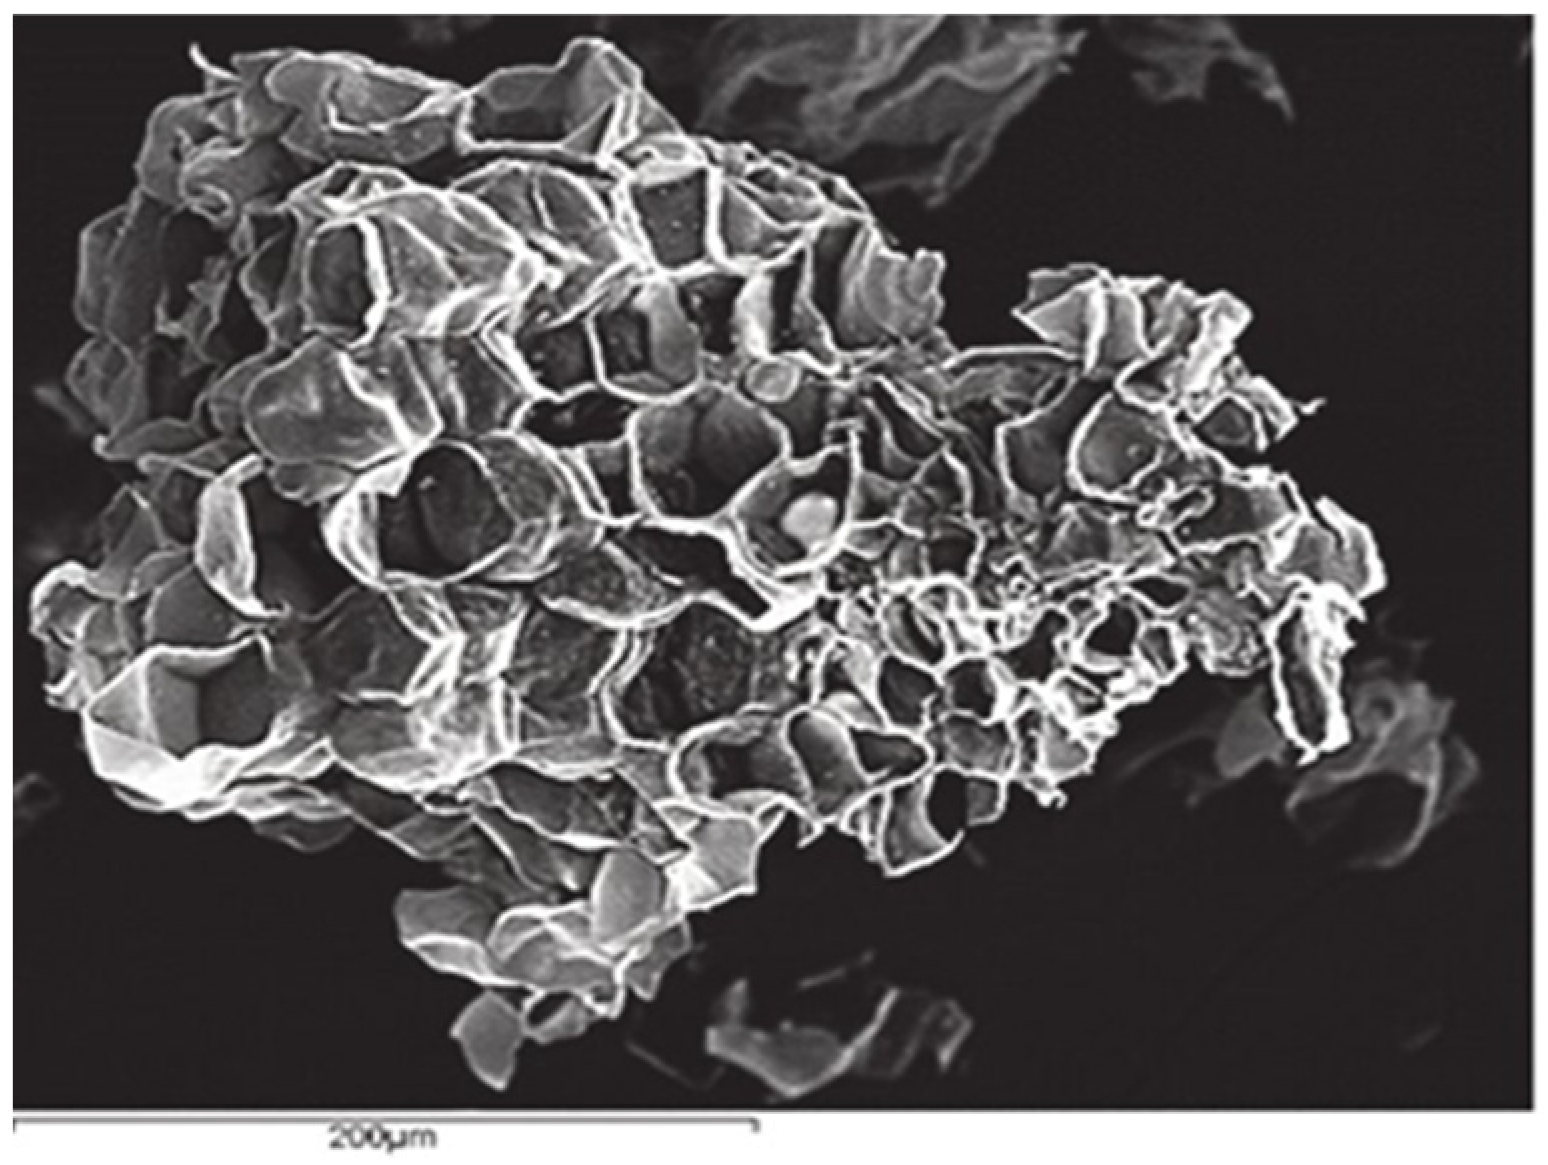
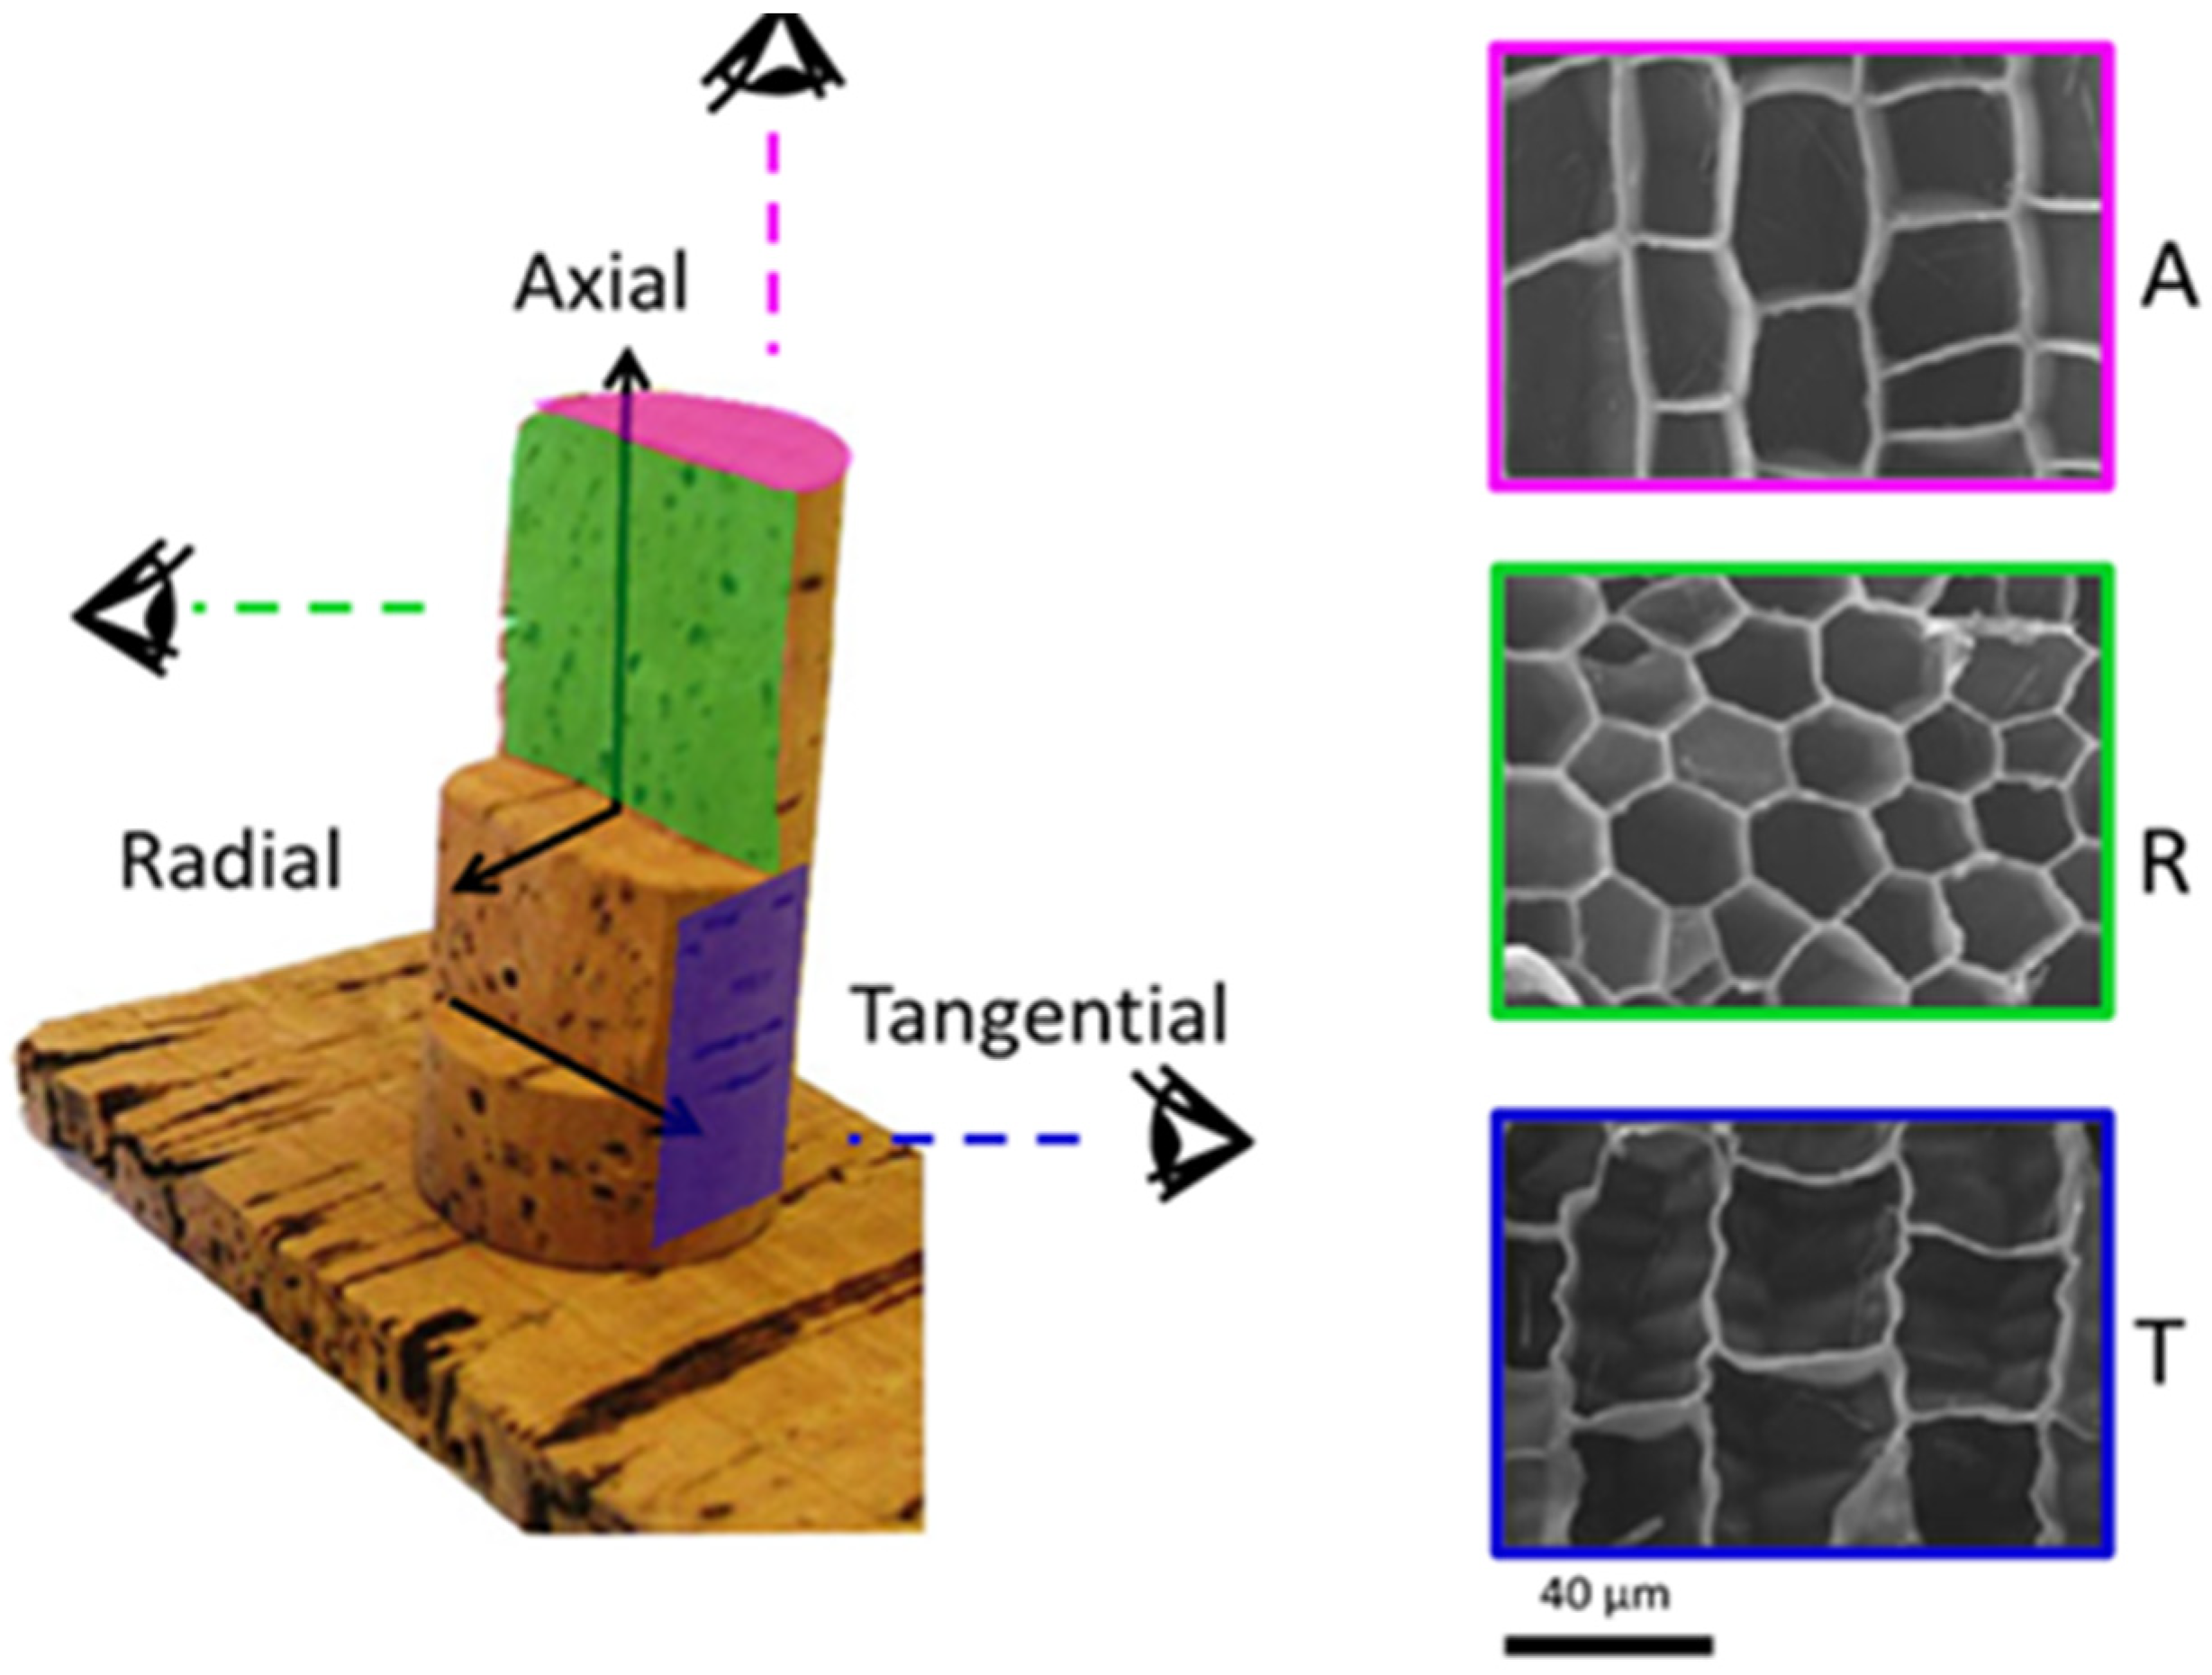
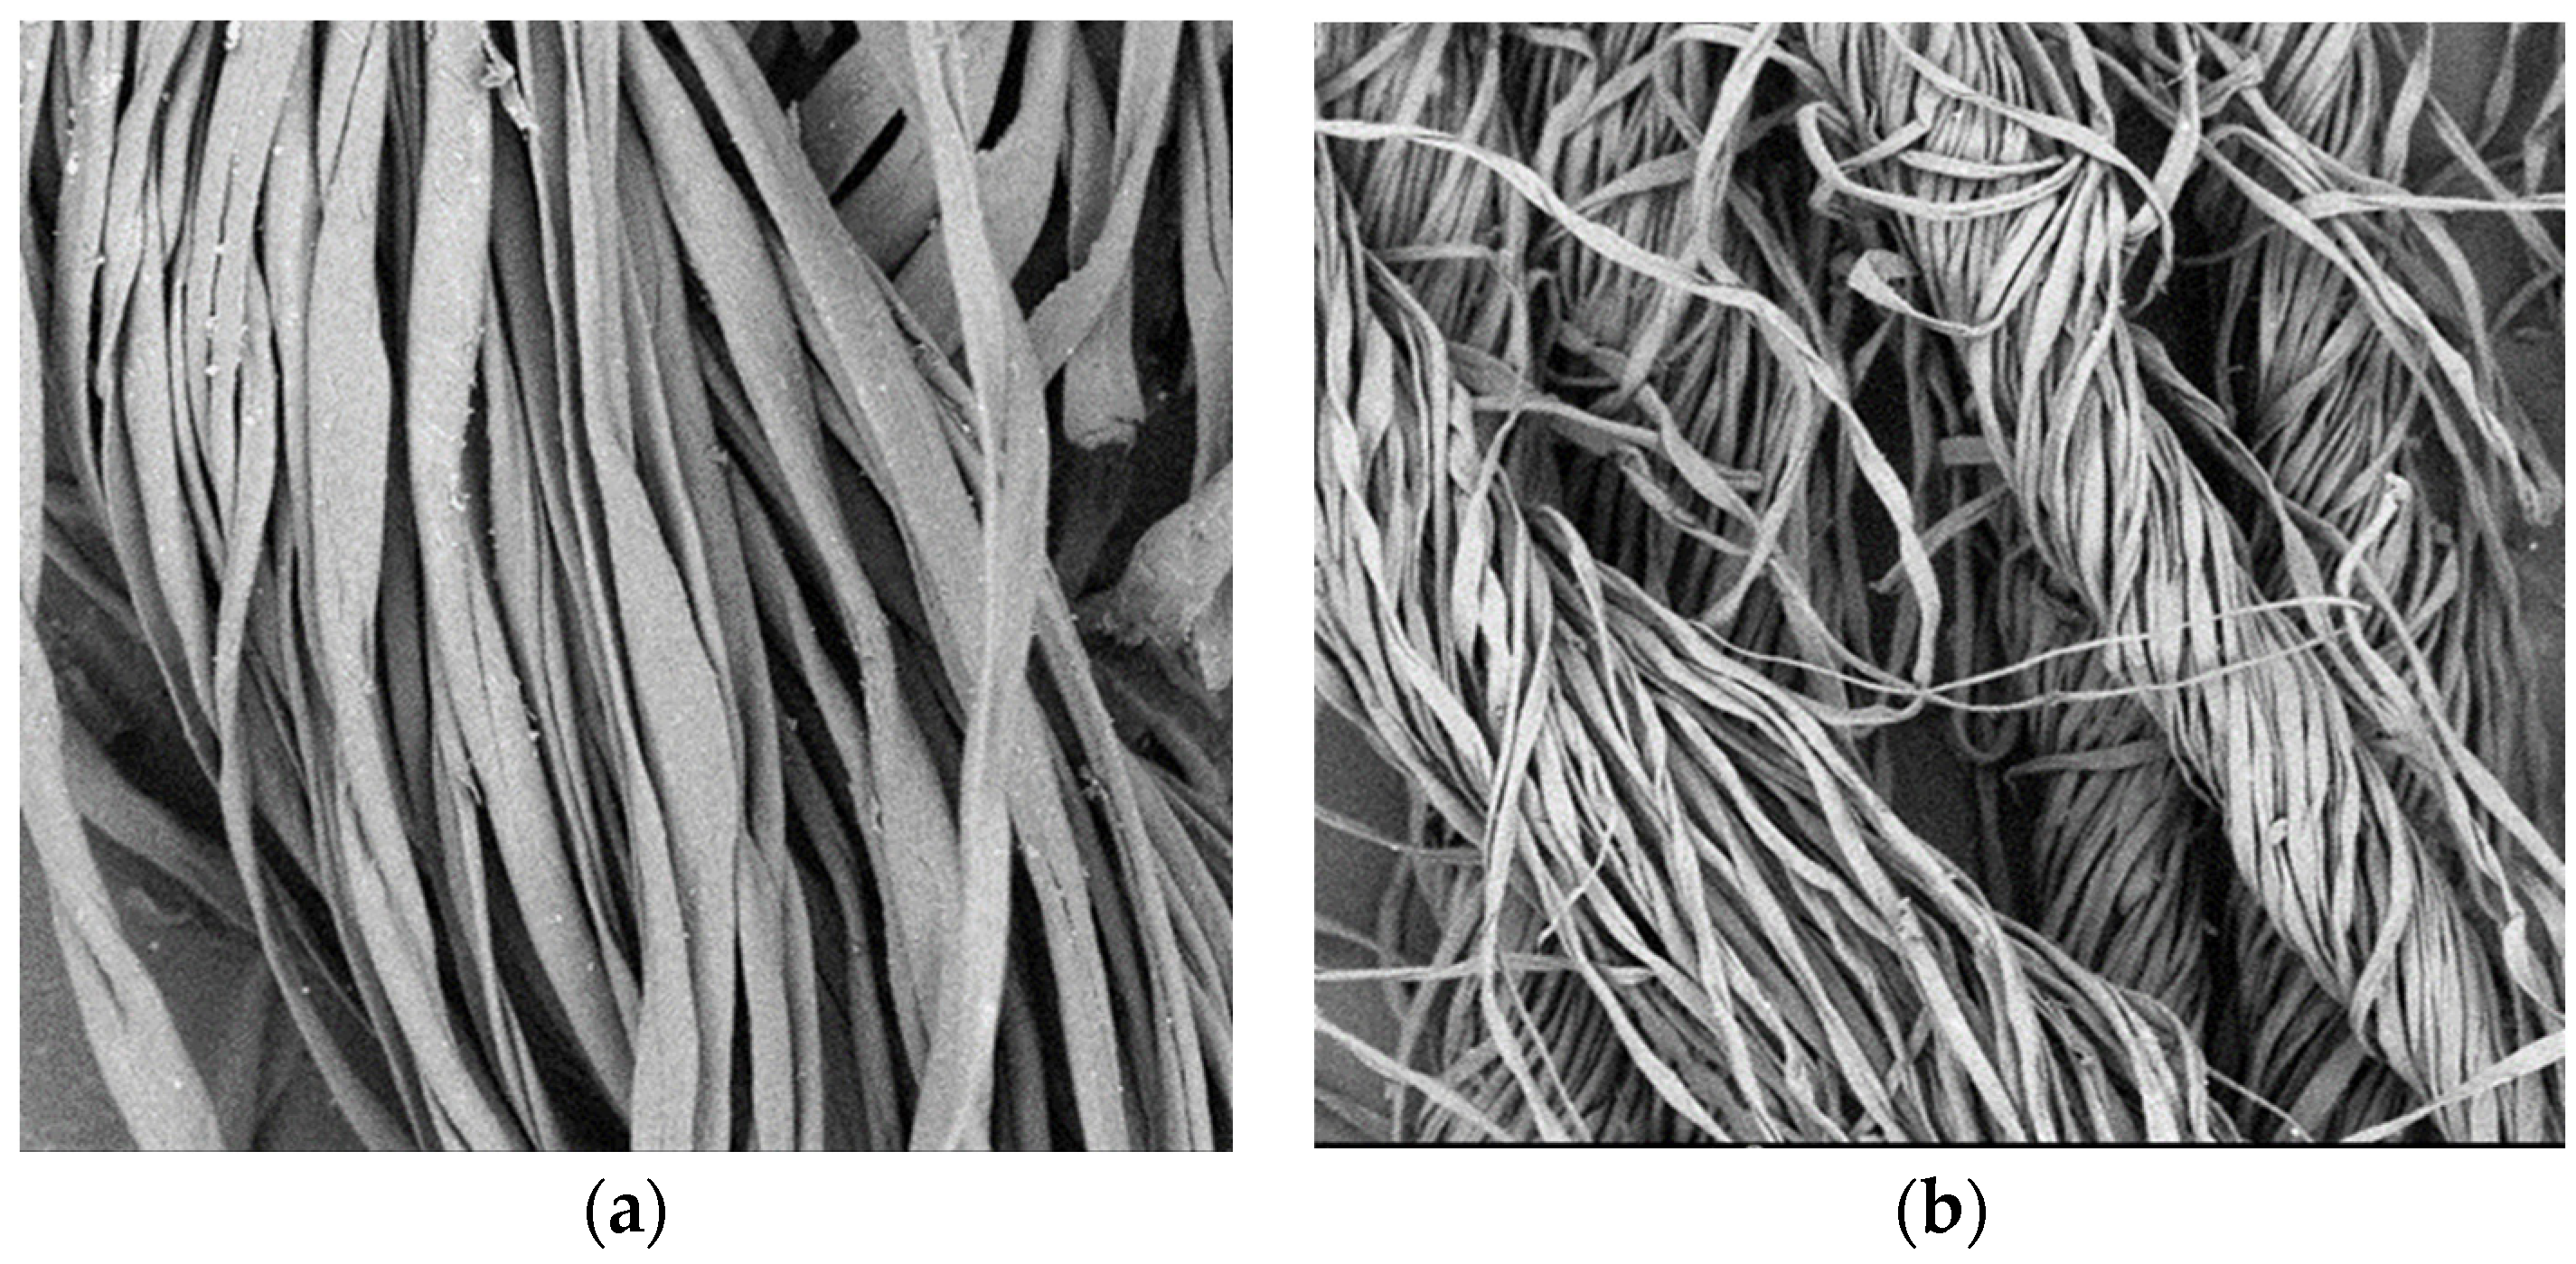
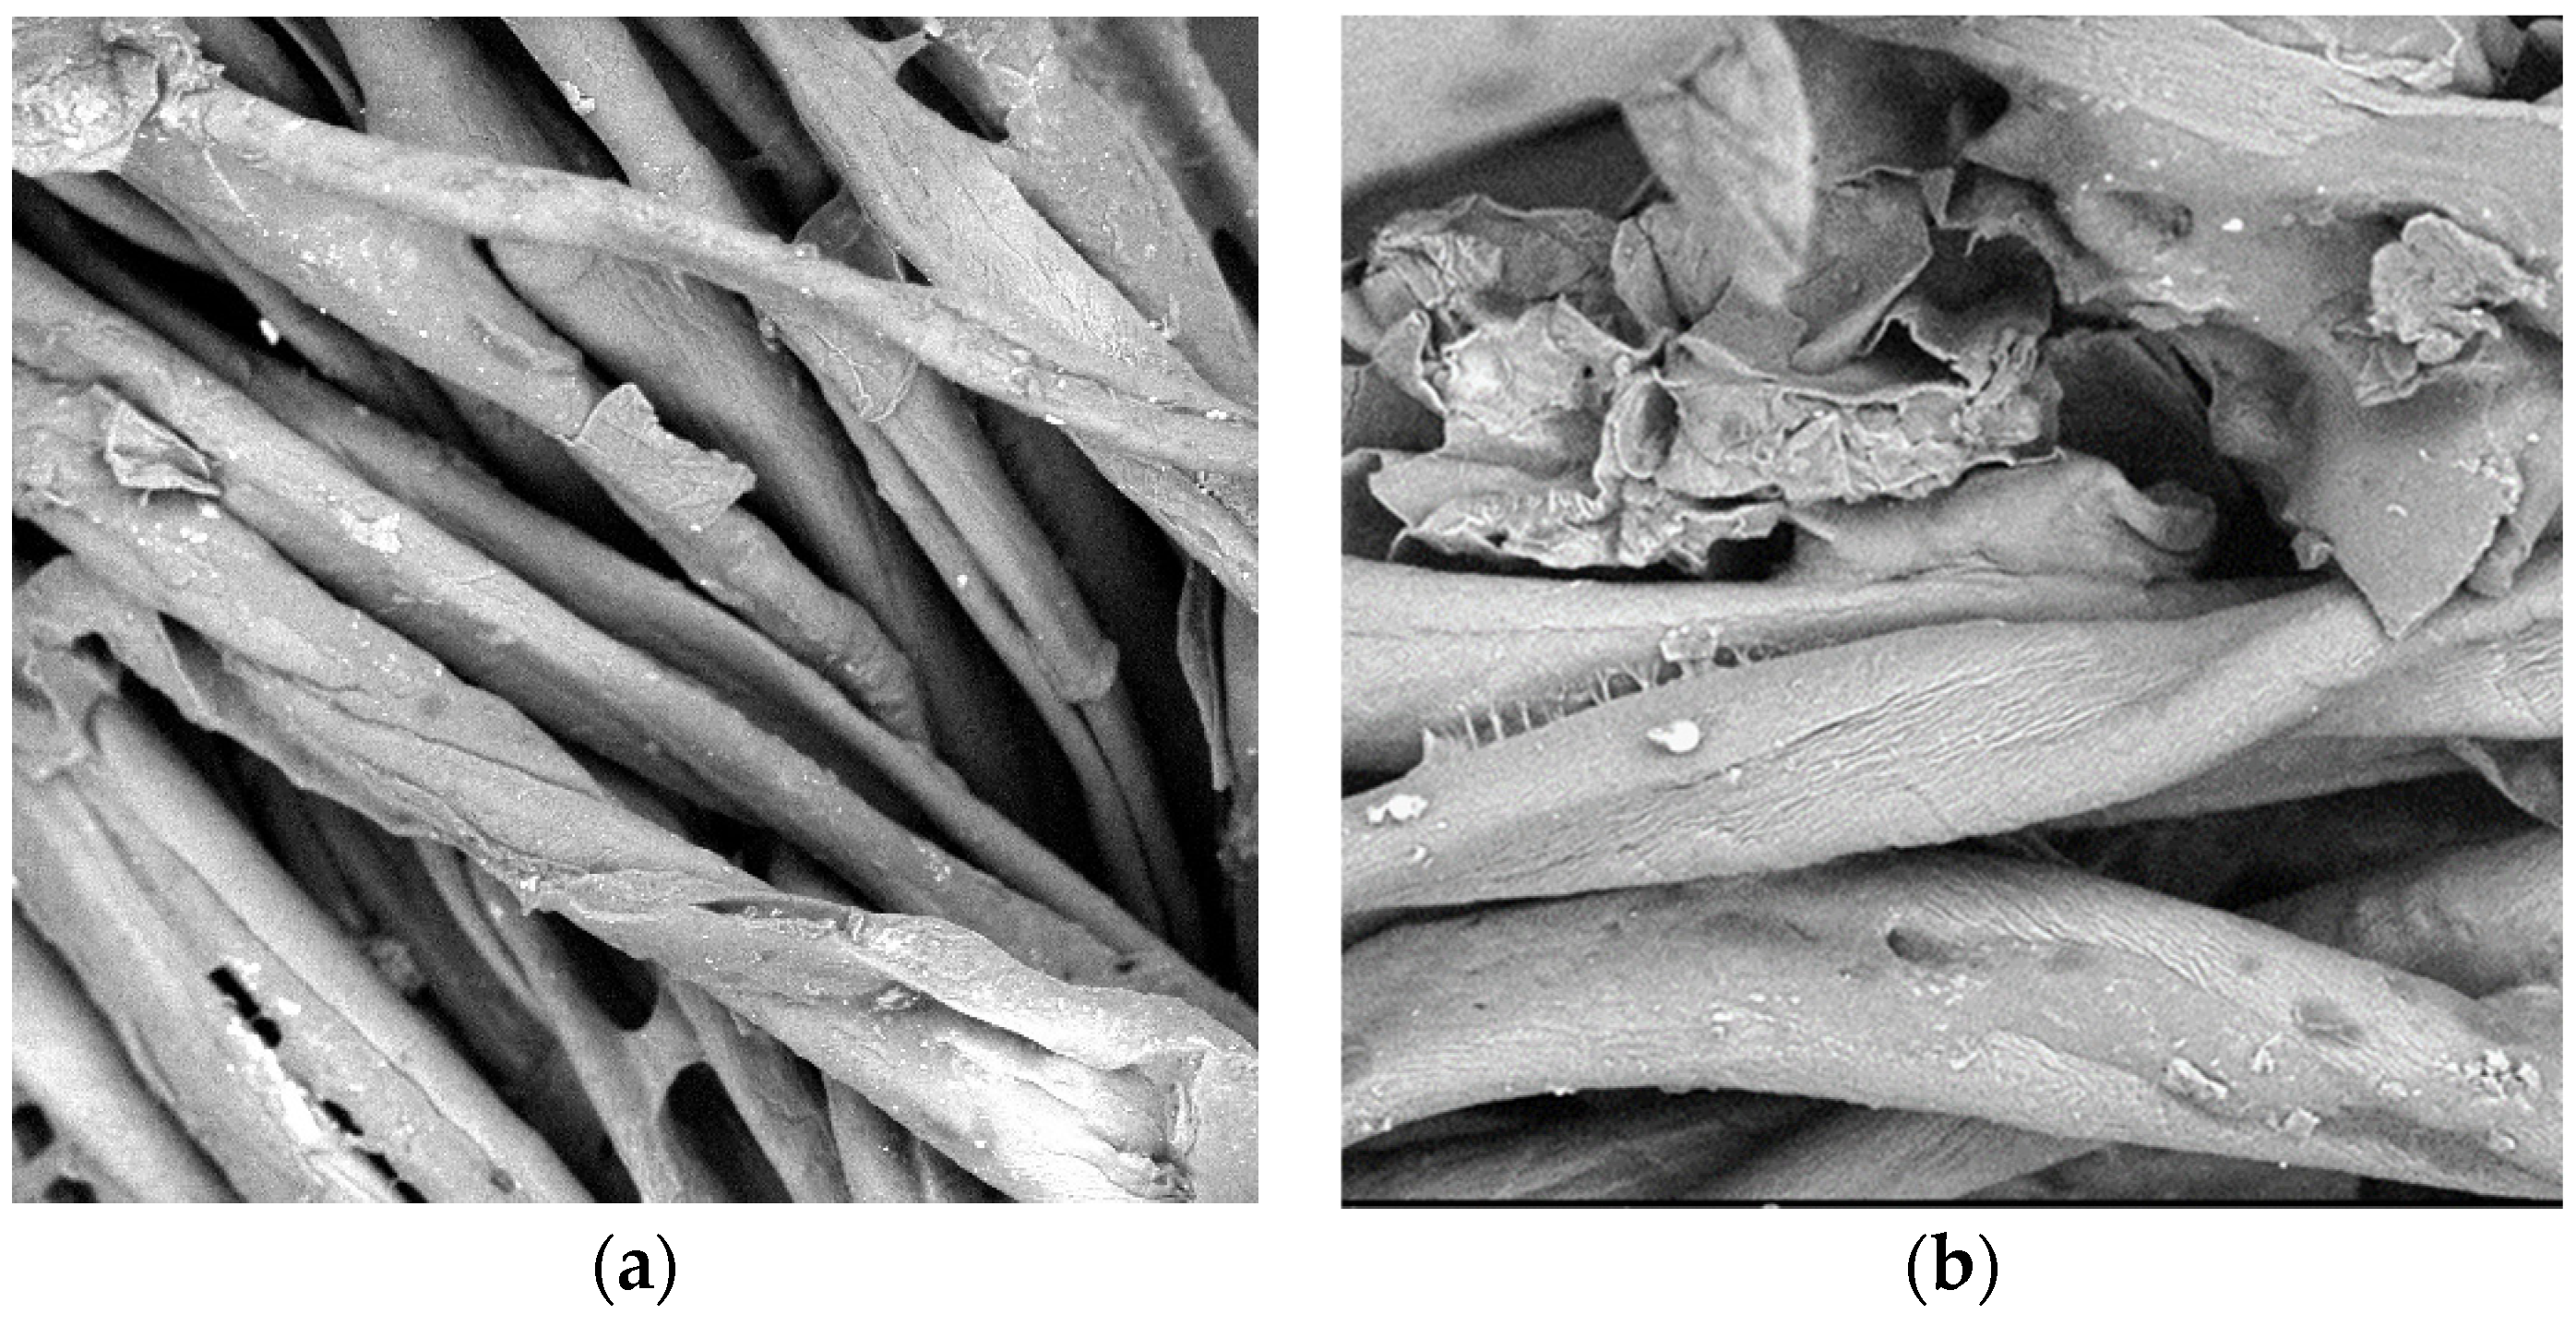
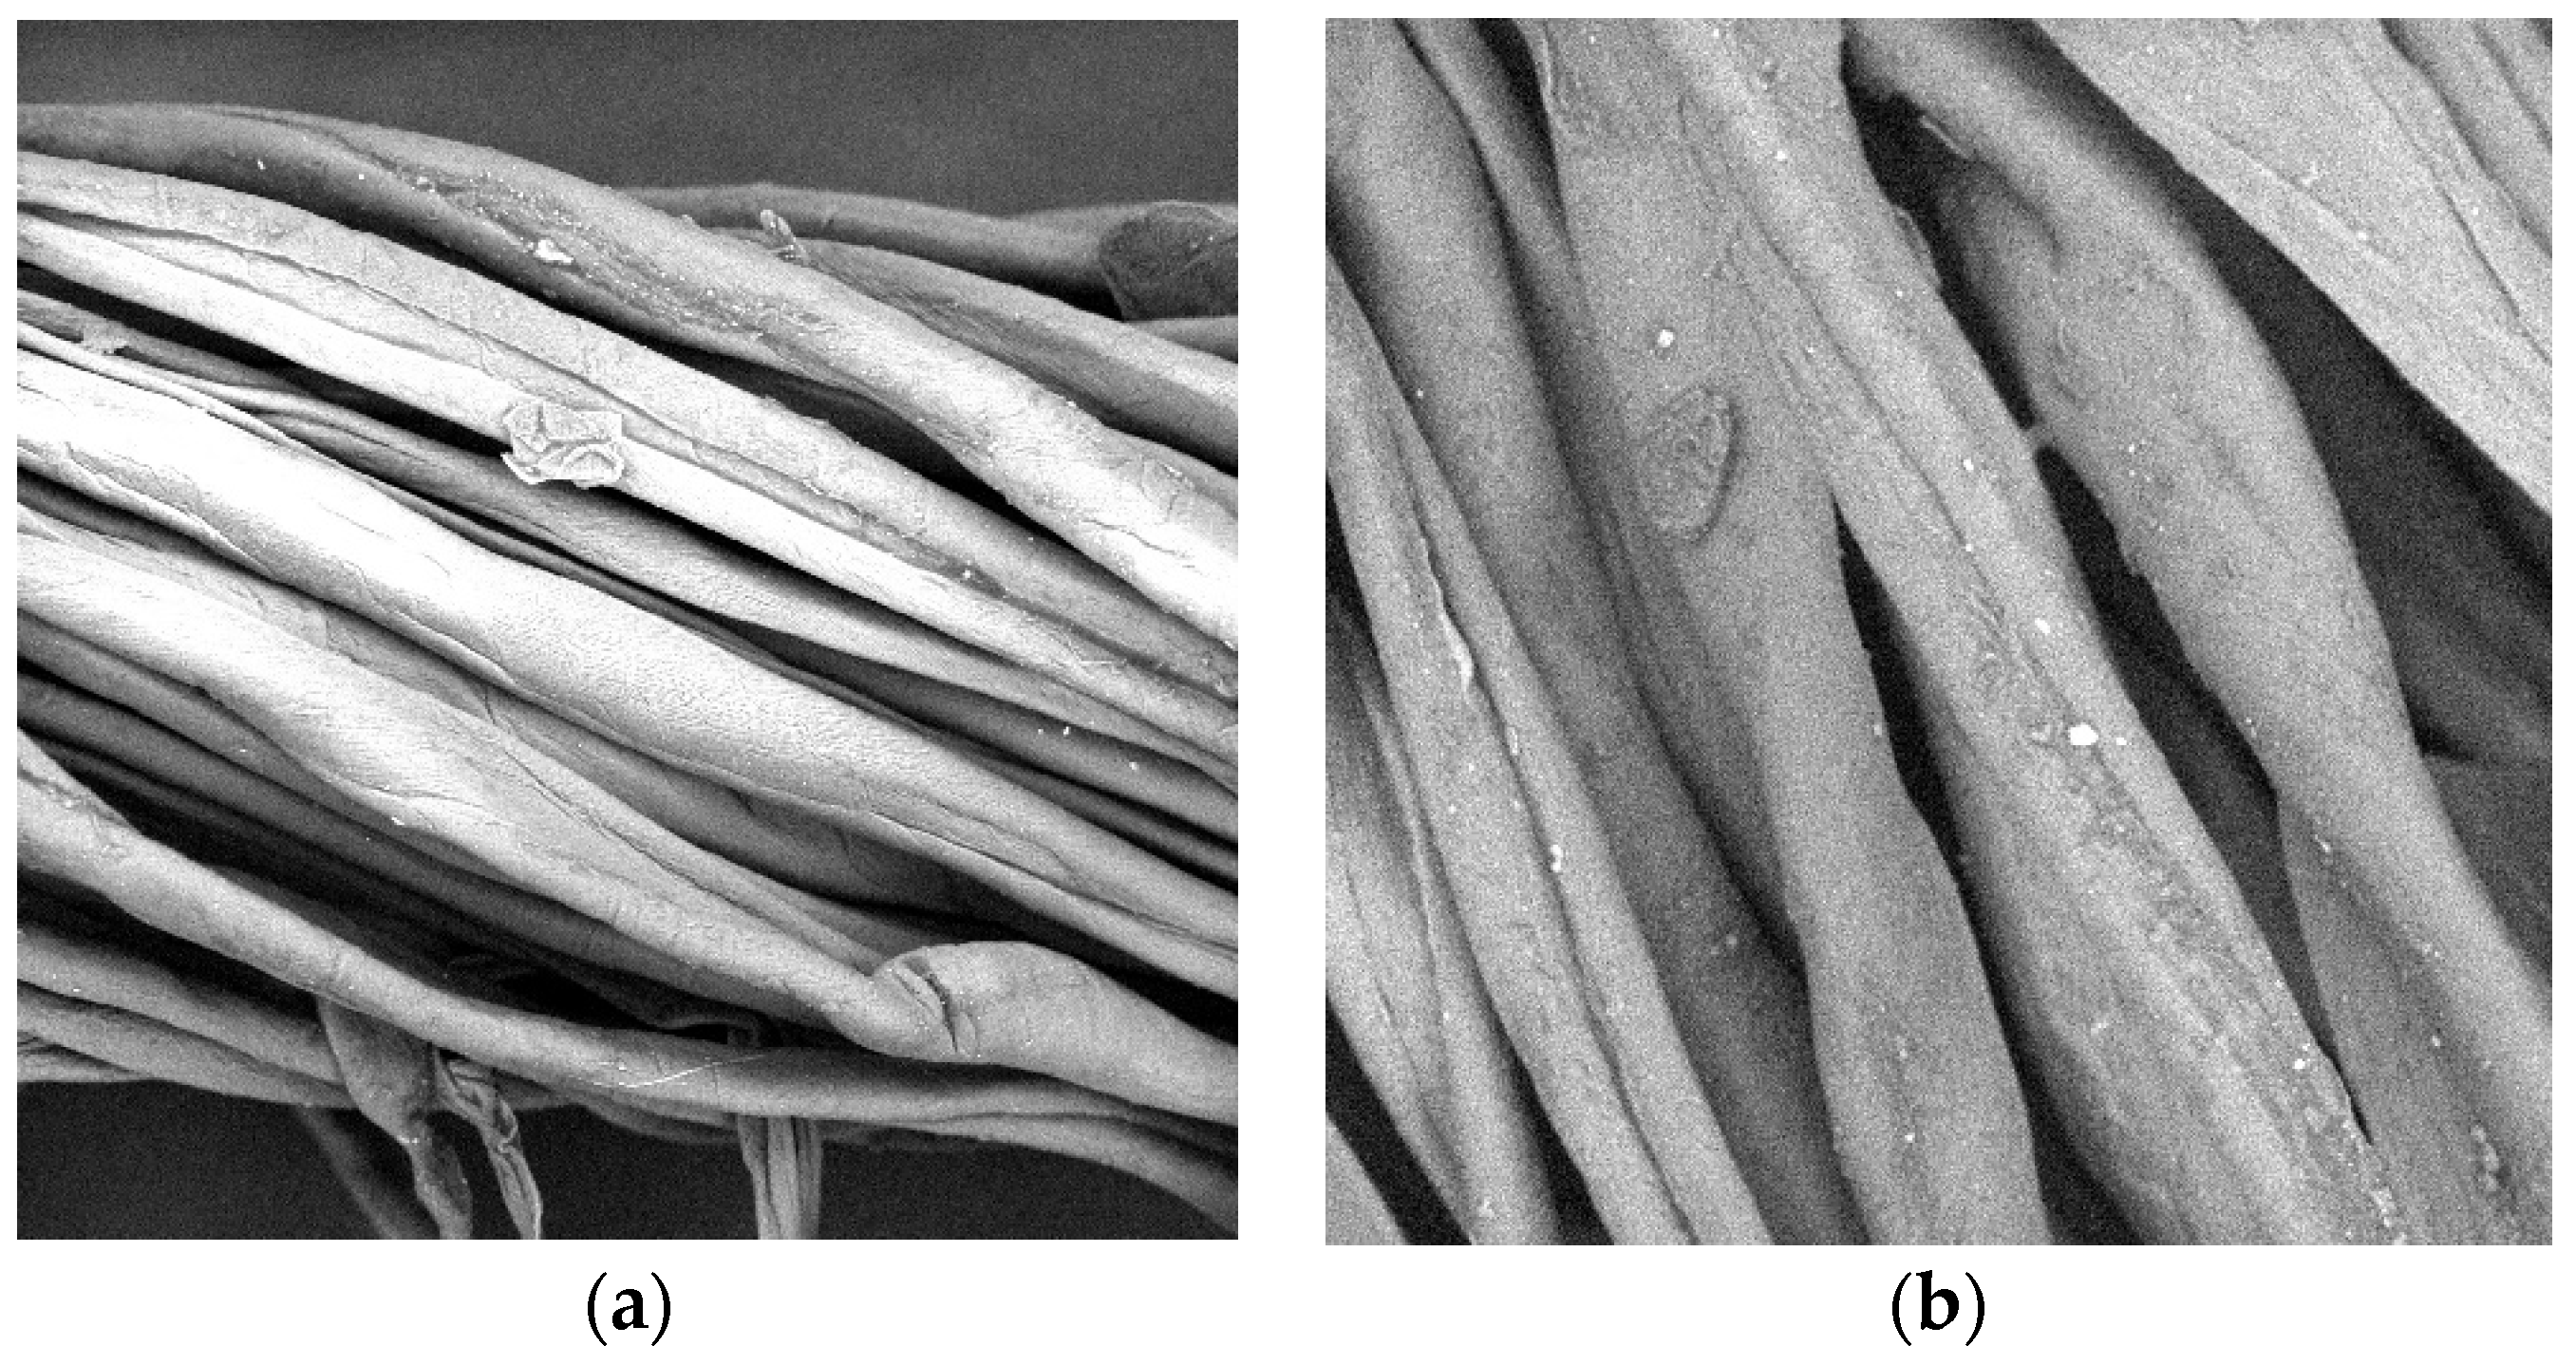
3.8. Scanning Electron Micrograph (SEM)

The SEM pictures were taken using Phenom XL Desktop SEM. SEM pictures help in understanding the morphology of a textile fabric or fiber surface. Figure 6a,b illustrates the SEM pictures of 100% cotton fabric captured at two different magnifications, indicating flat, ribbon-like fibers twisted together to form a yarn and woven into a fabric. The surface of 100% cotton was mostly clear, and no conspicuous anomaly was observed.
In contrast, the SEM images at two different magnifications of the 90:10 cotton–cork blend showed no cork deposition on the warp yarns and a coating of granular cork of uneven size on the weft yarns, applied with the help of a binding polymer (Figure 7 and Figure 8).

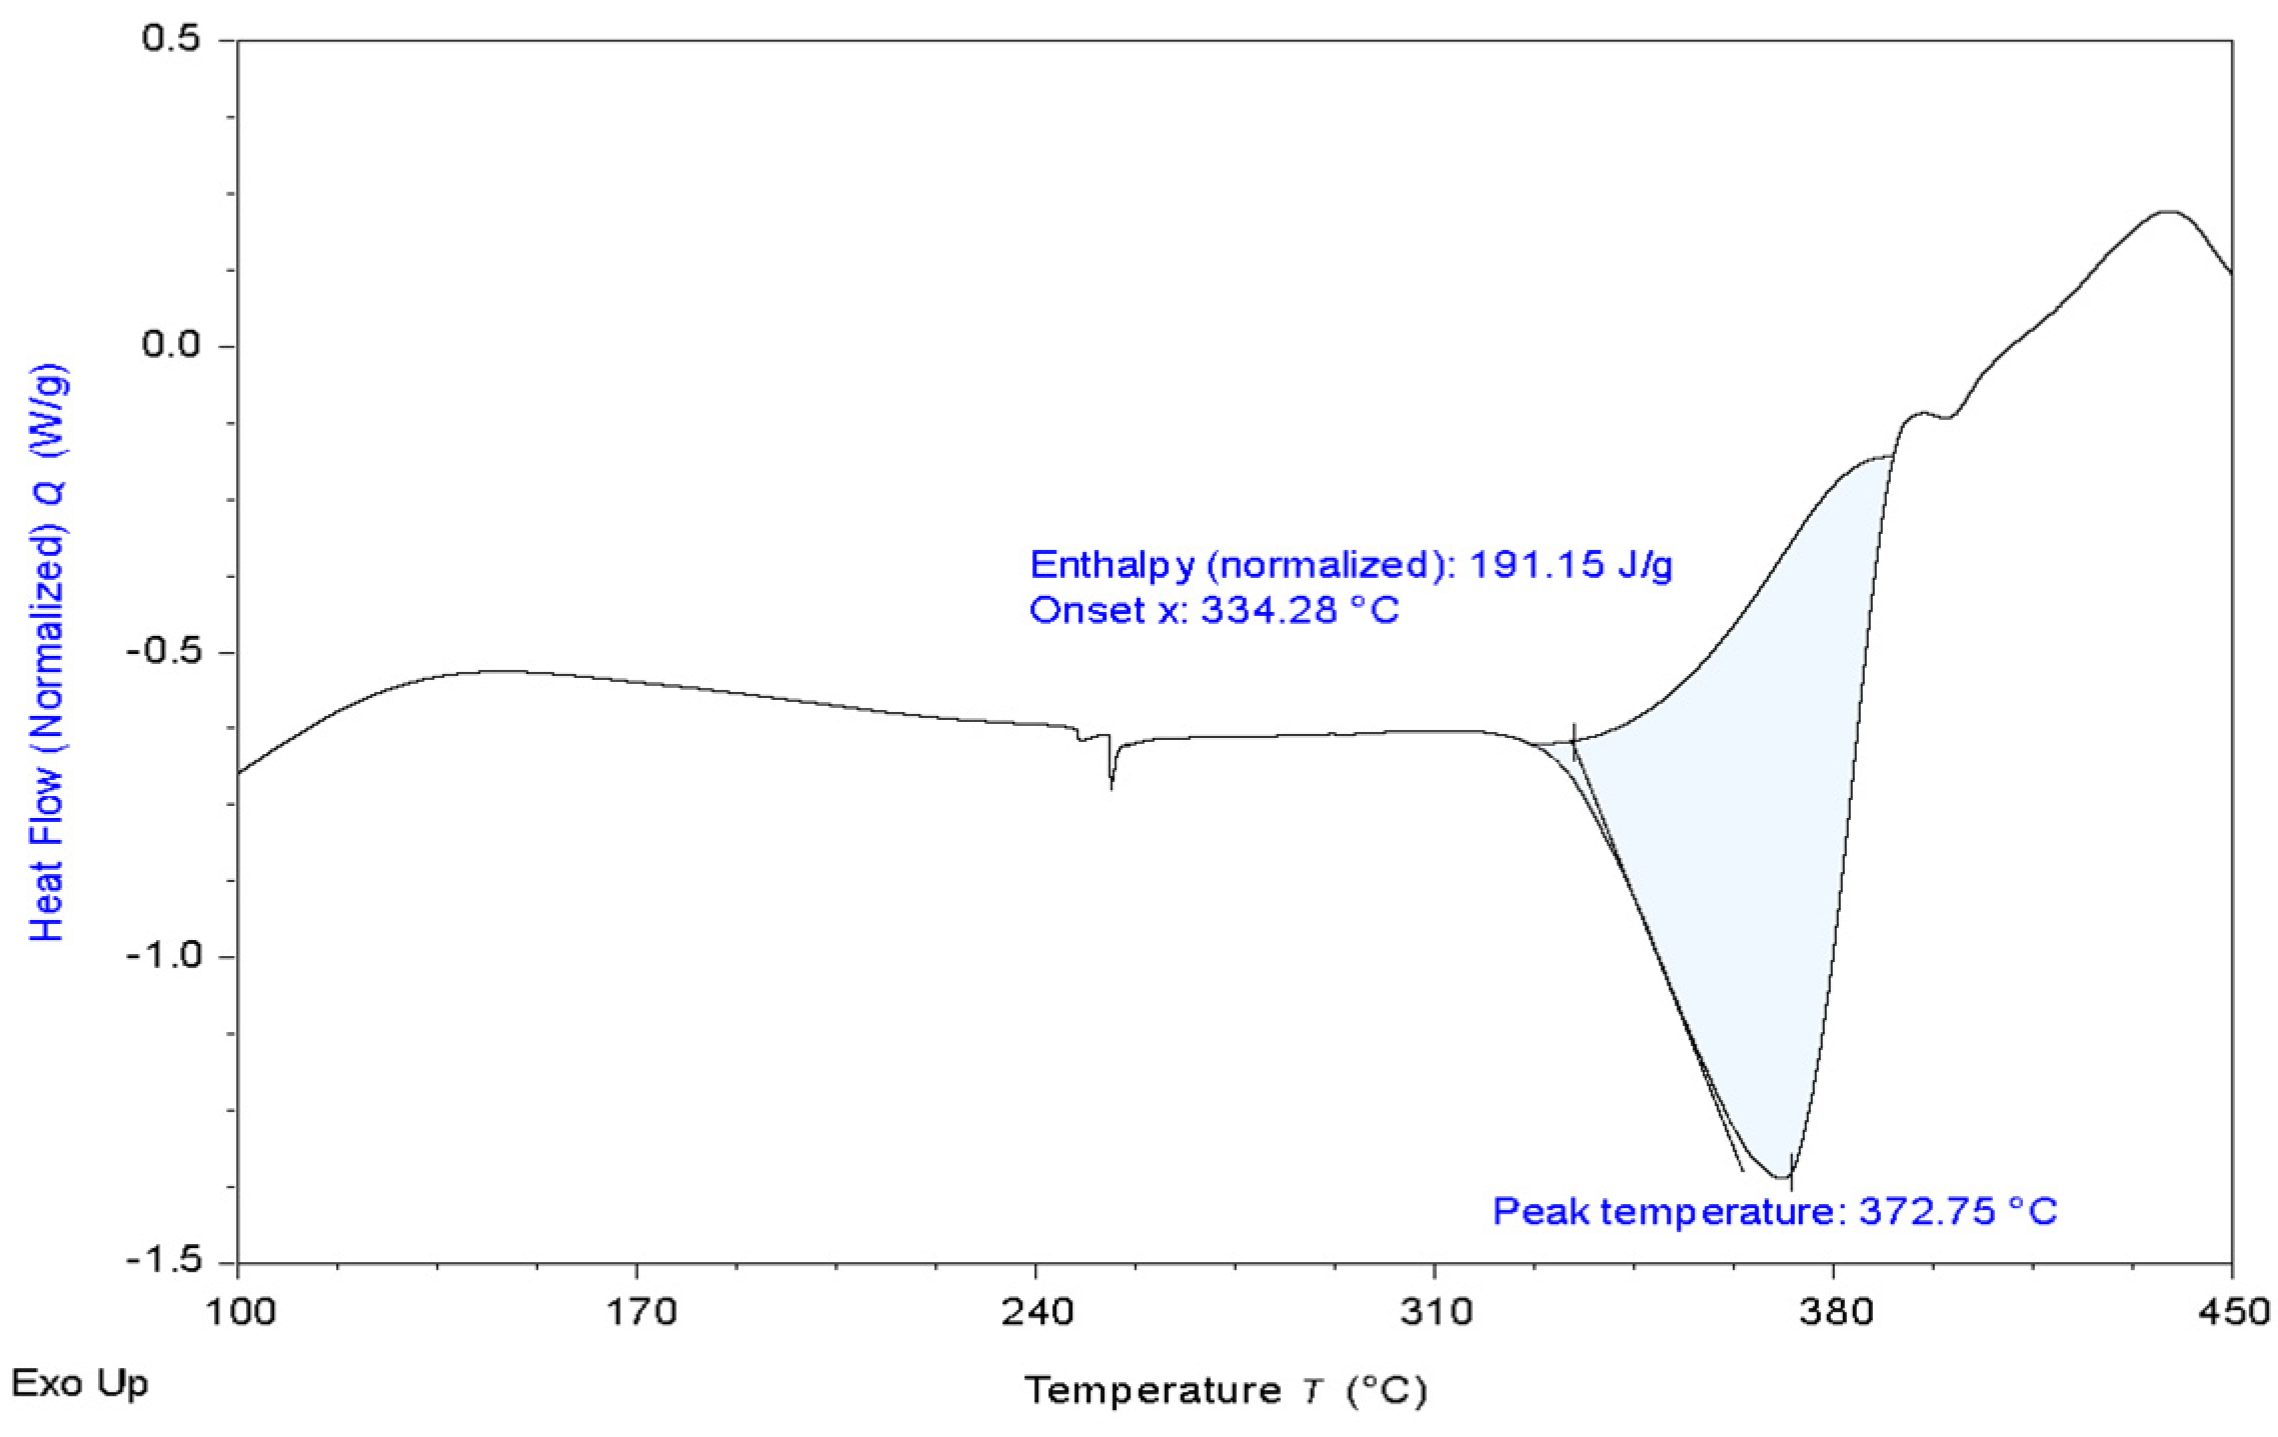
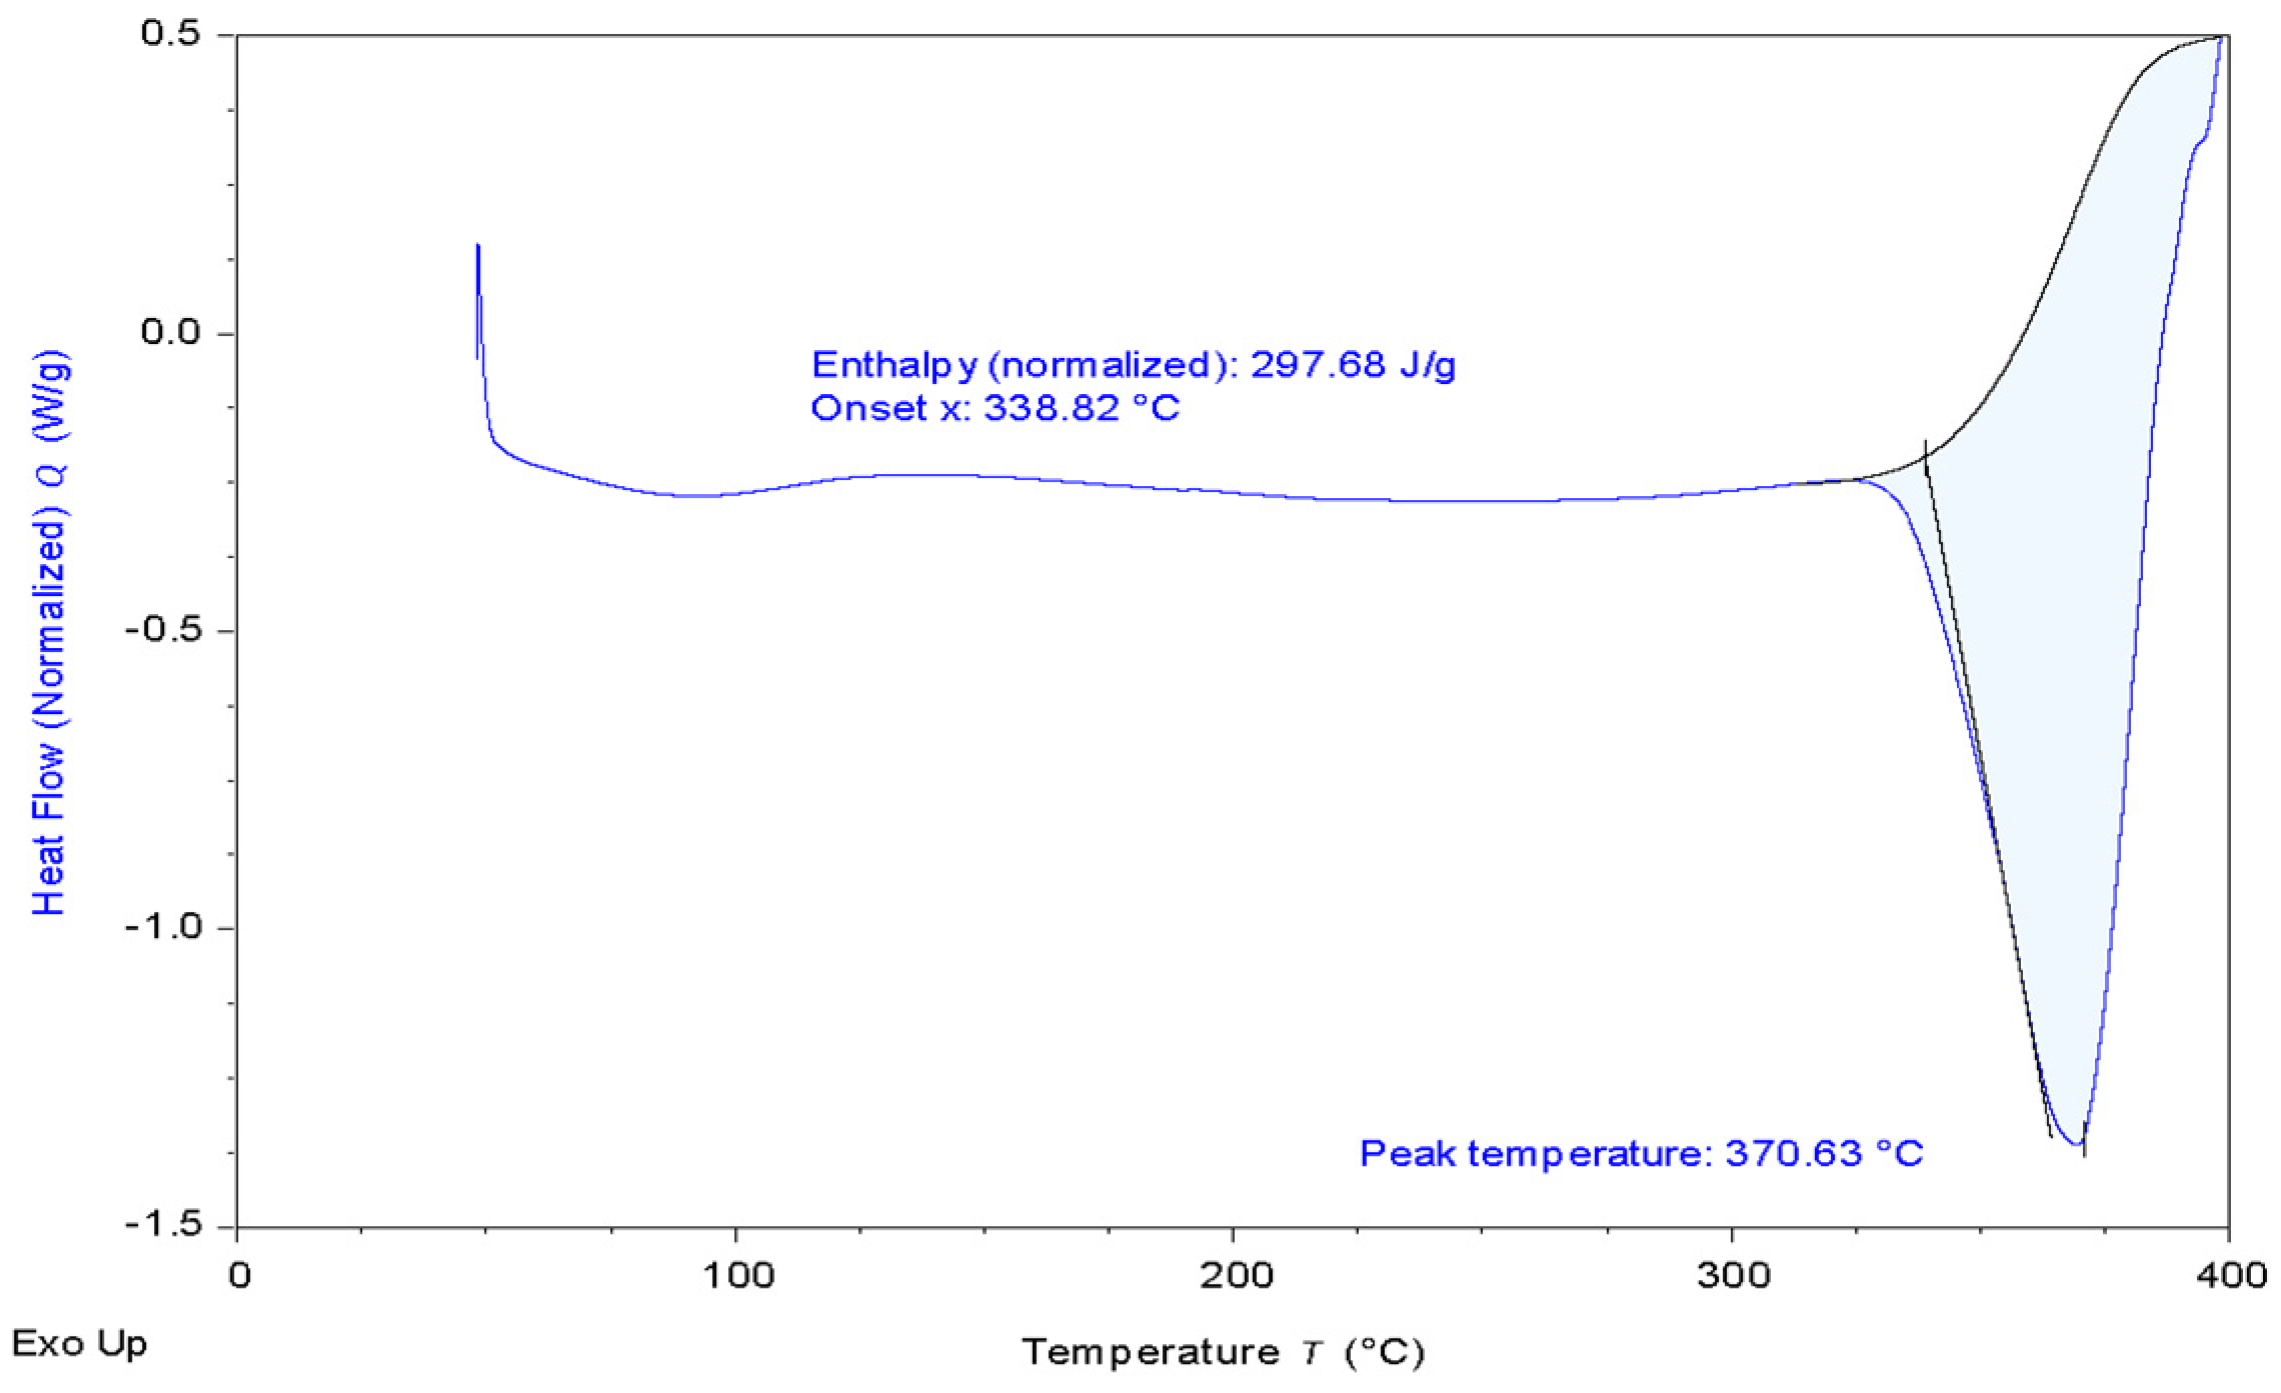
3.9. Differential Scanning Calorimetry DSC

Differential scanning calorimetry is a thermo-analytical technique used in studying the properties of materials with temperature changes. A DSC instrument, TA DSC2-01167 (TA Instruments, New Castle, DE, USA), was used to obtain the thermograph of cotton yarns coated with synthetic polymers. The x-axis of the graph represents the temperature, and the y-axis represents heat flow divided by the sample weight. The temperature range used was 40–450 °C, with a nitrogen atmosphere. The sample was heated and cooled at 10 °C.min−1. Endothermic transition energy was noted as 191.15 J/g for the polymer in the weft yarn and 297.68 J/g for the polymer in the warp yarn, which was higher compared to regular low-melting synthetic polymers, indicating the polymer present in both the yarns to be a high-performing polymer with a high degree of polymerization, requiring higher heat to melt. The melting point Tm of the binder polymer was observed to be 372.75 °C in the weft yarn, as seen in Figure 9, and 370.63 °C in the warp yarn, as seen in Figure 10, which indicated the presence of a high-performance, high-melting synthetic polymer in both sets of yarns in the cotton–cork blended sample. As per the DSC thermograph seen in Figure 9 and Figure 10, it was observed that the onset of glass transition temperature Tg for the polymer binders started in the region of 150 °C and continued to rise with the temperature [20]. The high-performance thermoplastic polymer category with a Tm of approximately 370–373 °C was shortlisted to be a category of high-melting aromatic thermoplastics called polyarylene ether, whose melting temperatures can range between 345–390 °C [27,28,29,30]. Some commercial examples of polyarylene ether are UDEL® (polysulfone), Kadel® (polyketone), Radel® (polyarylsulfone), PEEK® (polyetheretherketone), and Victrex® PES (polyethersulfone) [30]. Polyarylene ether polymers have excellent heat tolerance, dimensional stability, excellent chemical and hydrolysis resistance, and excellent mechanical properties [31]. They are employed in a variety of applications, such as adhesives, coatings, composite matrices, moldings, toughening agents, and ultrafiltration membranes [30].
Based on the data, it was concluded that the binder in the weft and warp yarns is polyether ketone or PEK [32]. The molecular structure of PEK is shown in Figure 11.

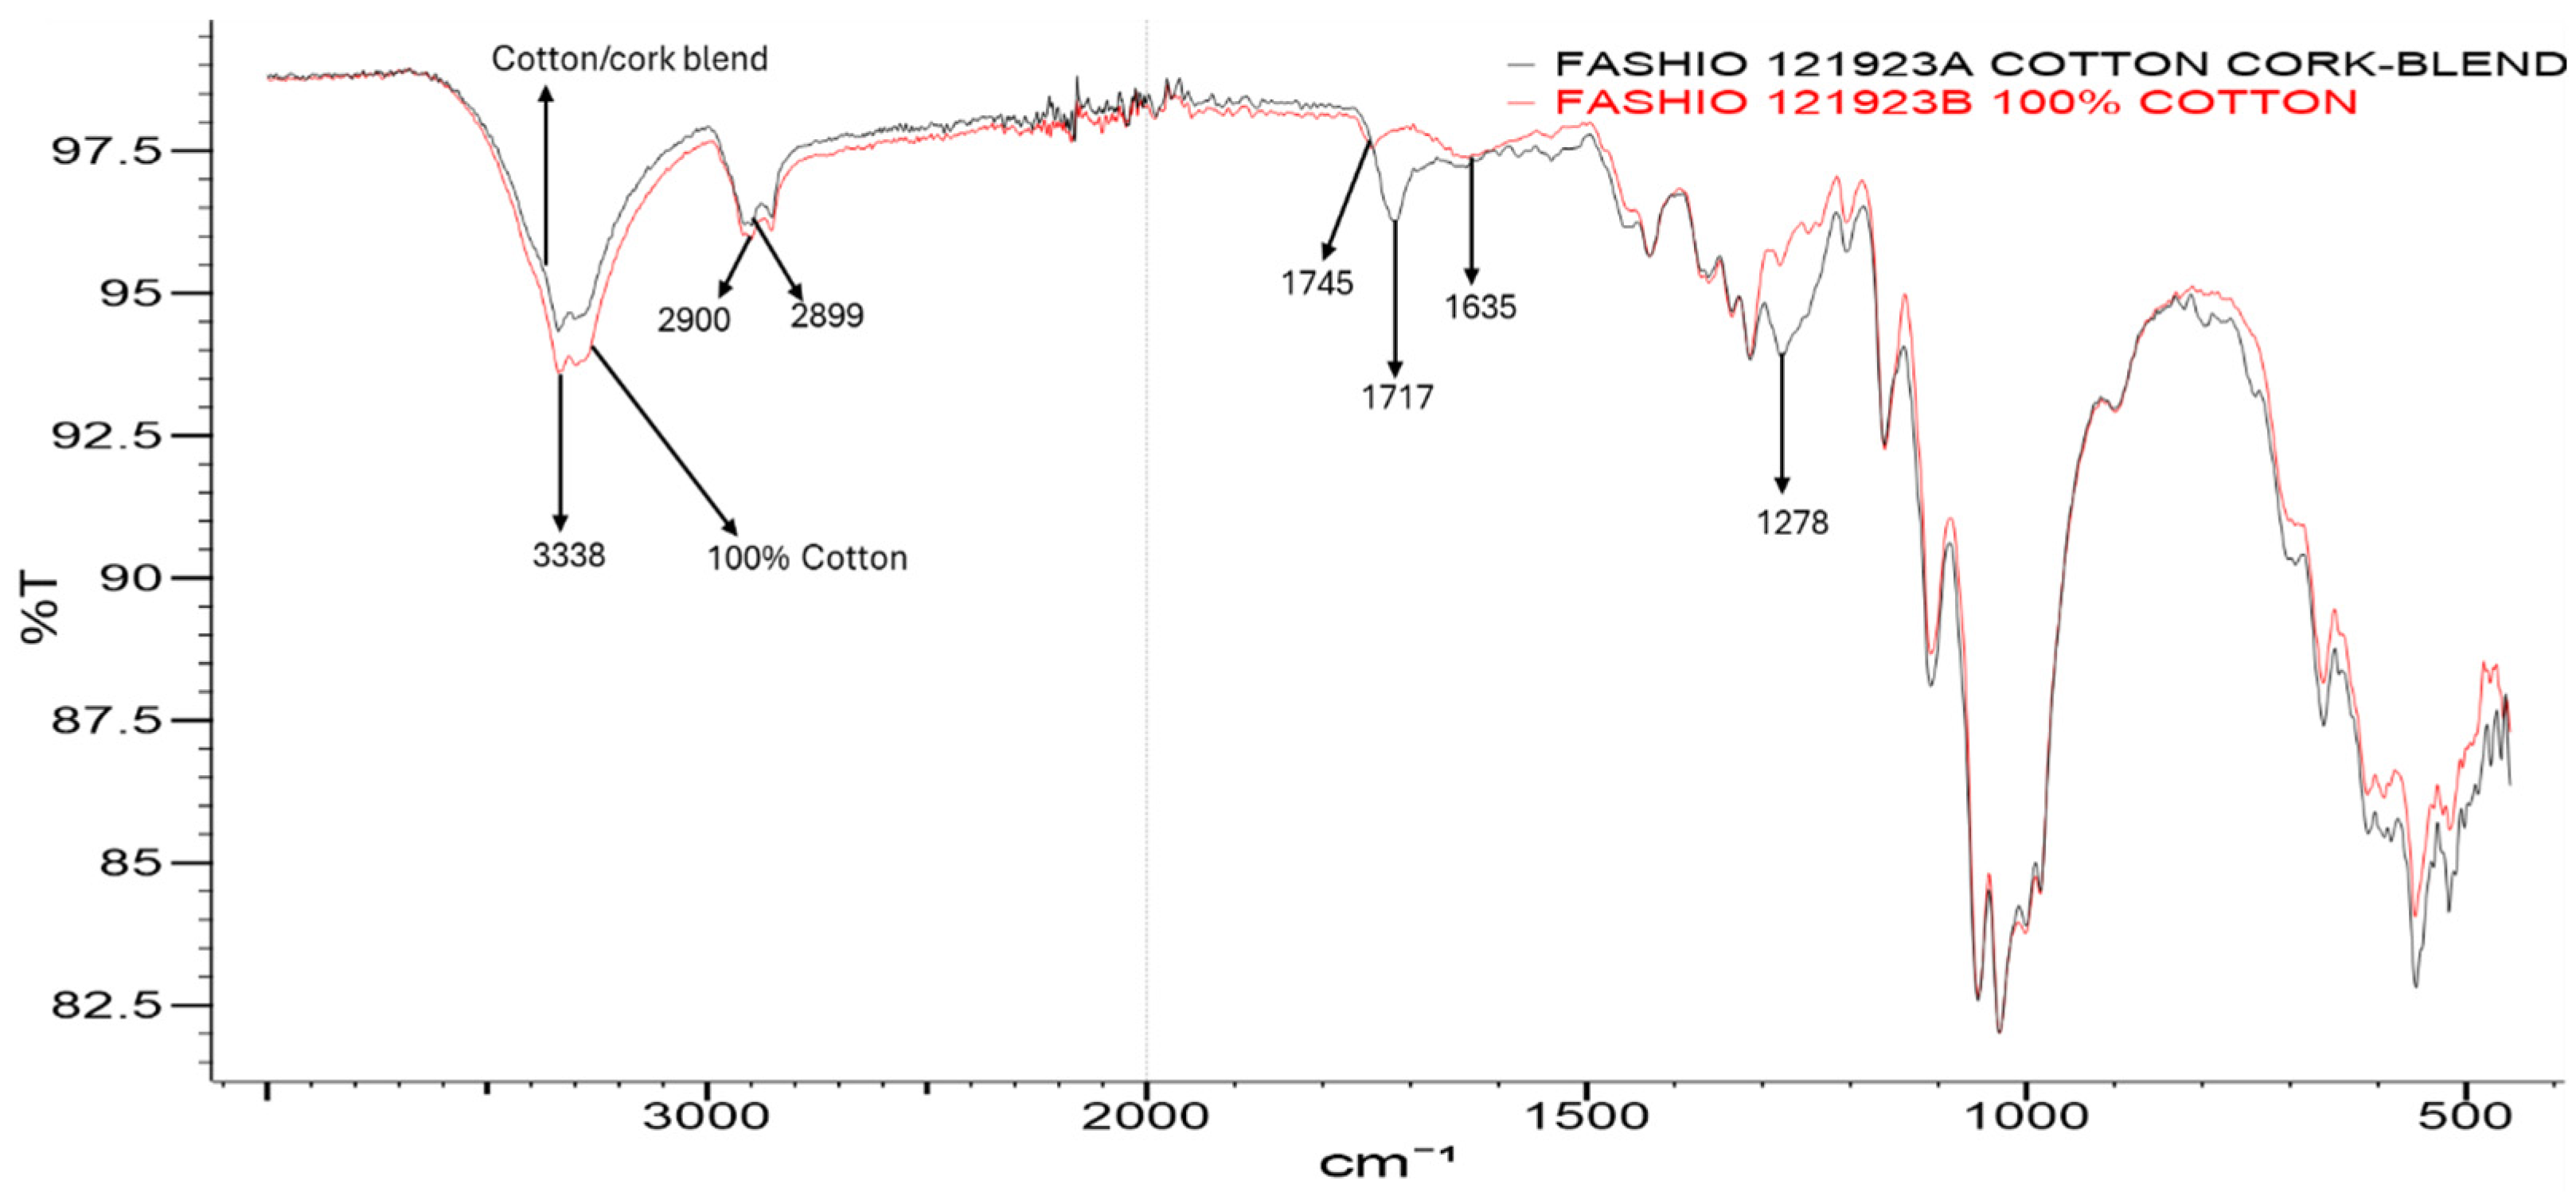
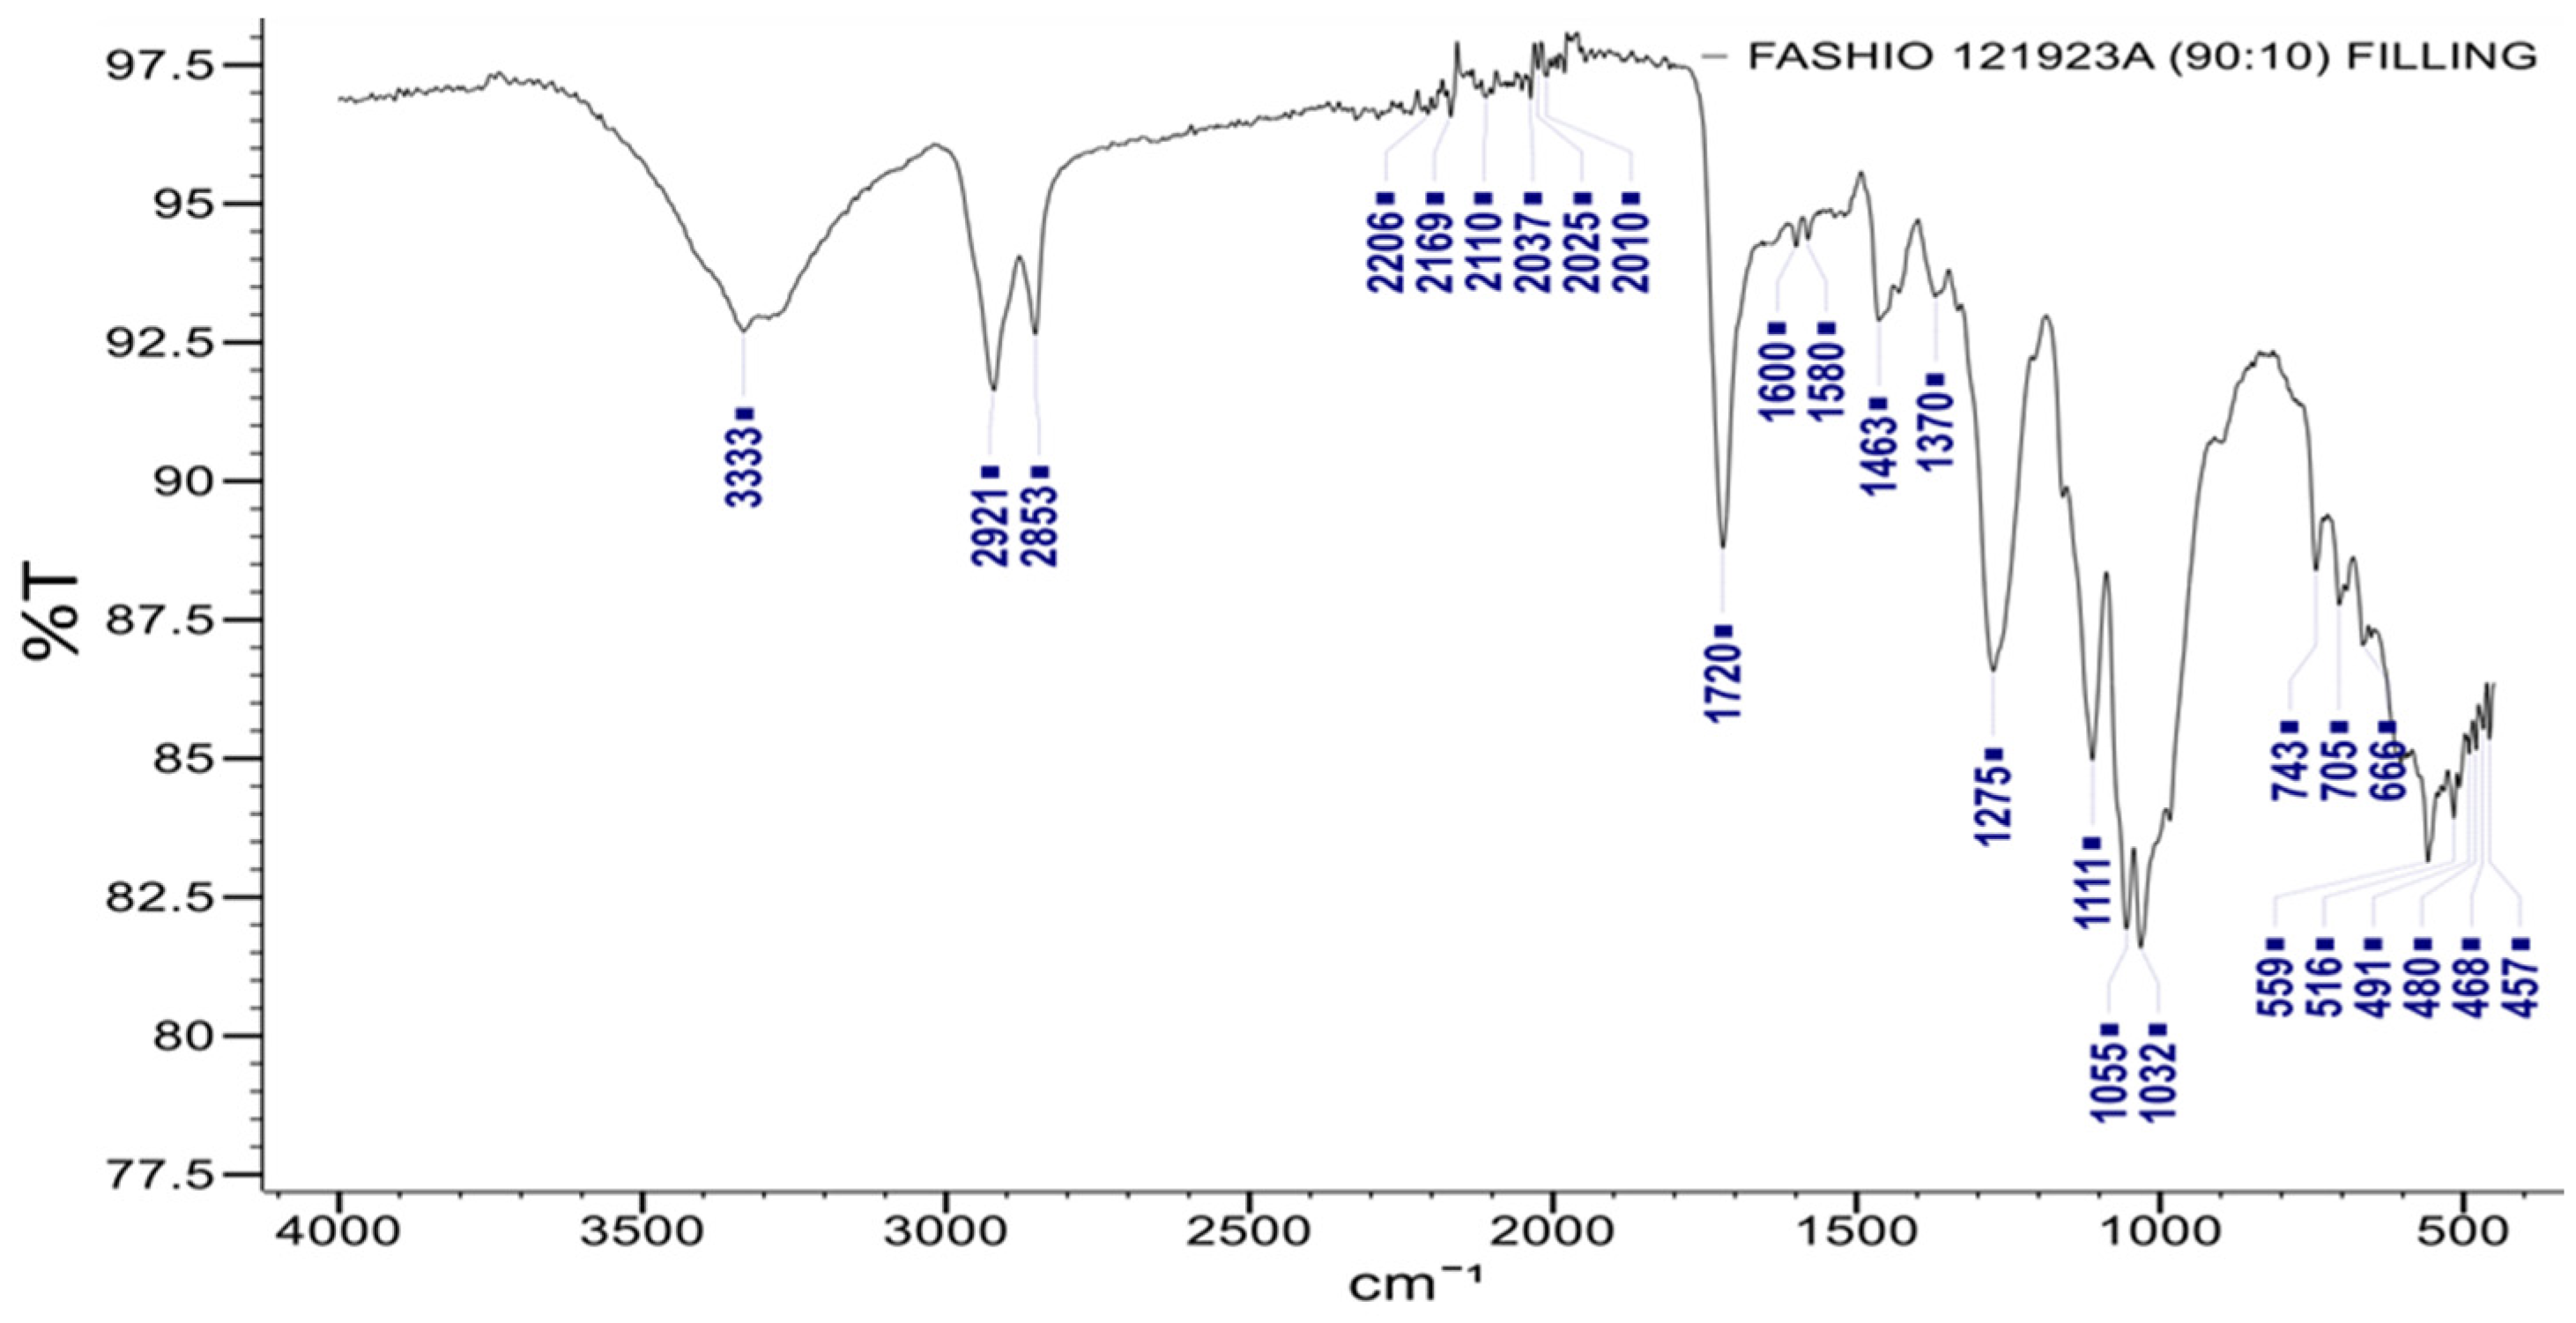
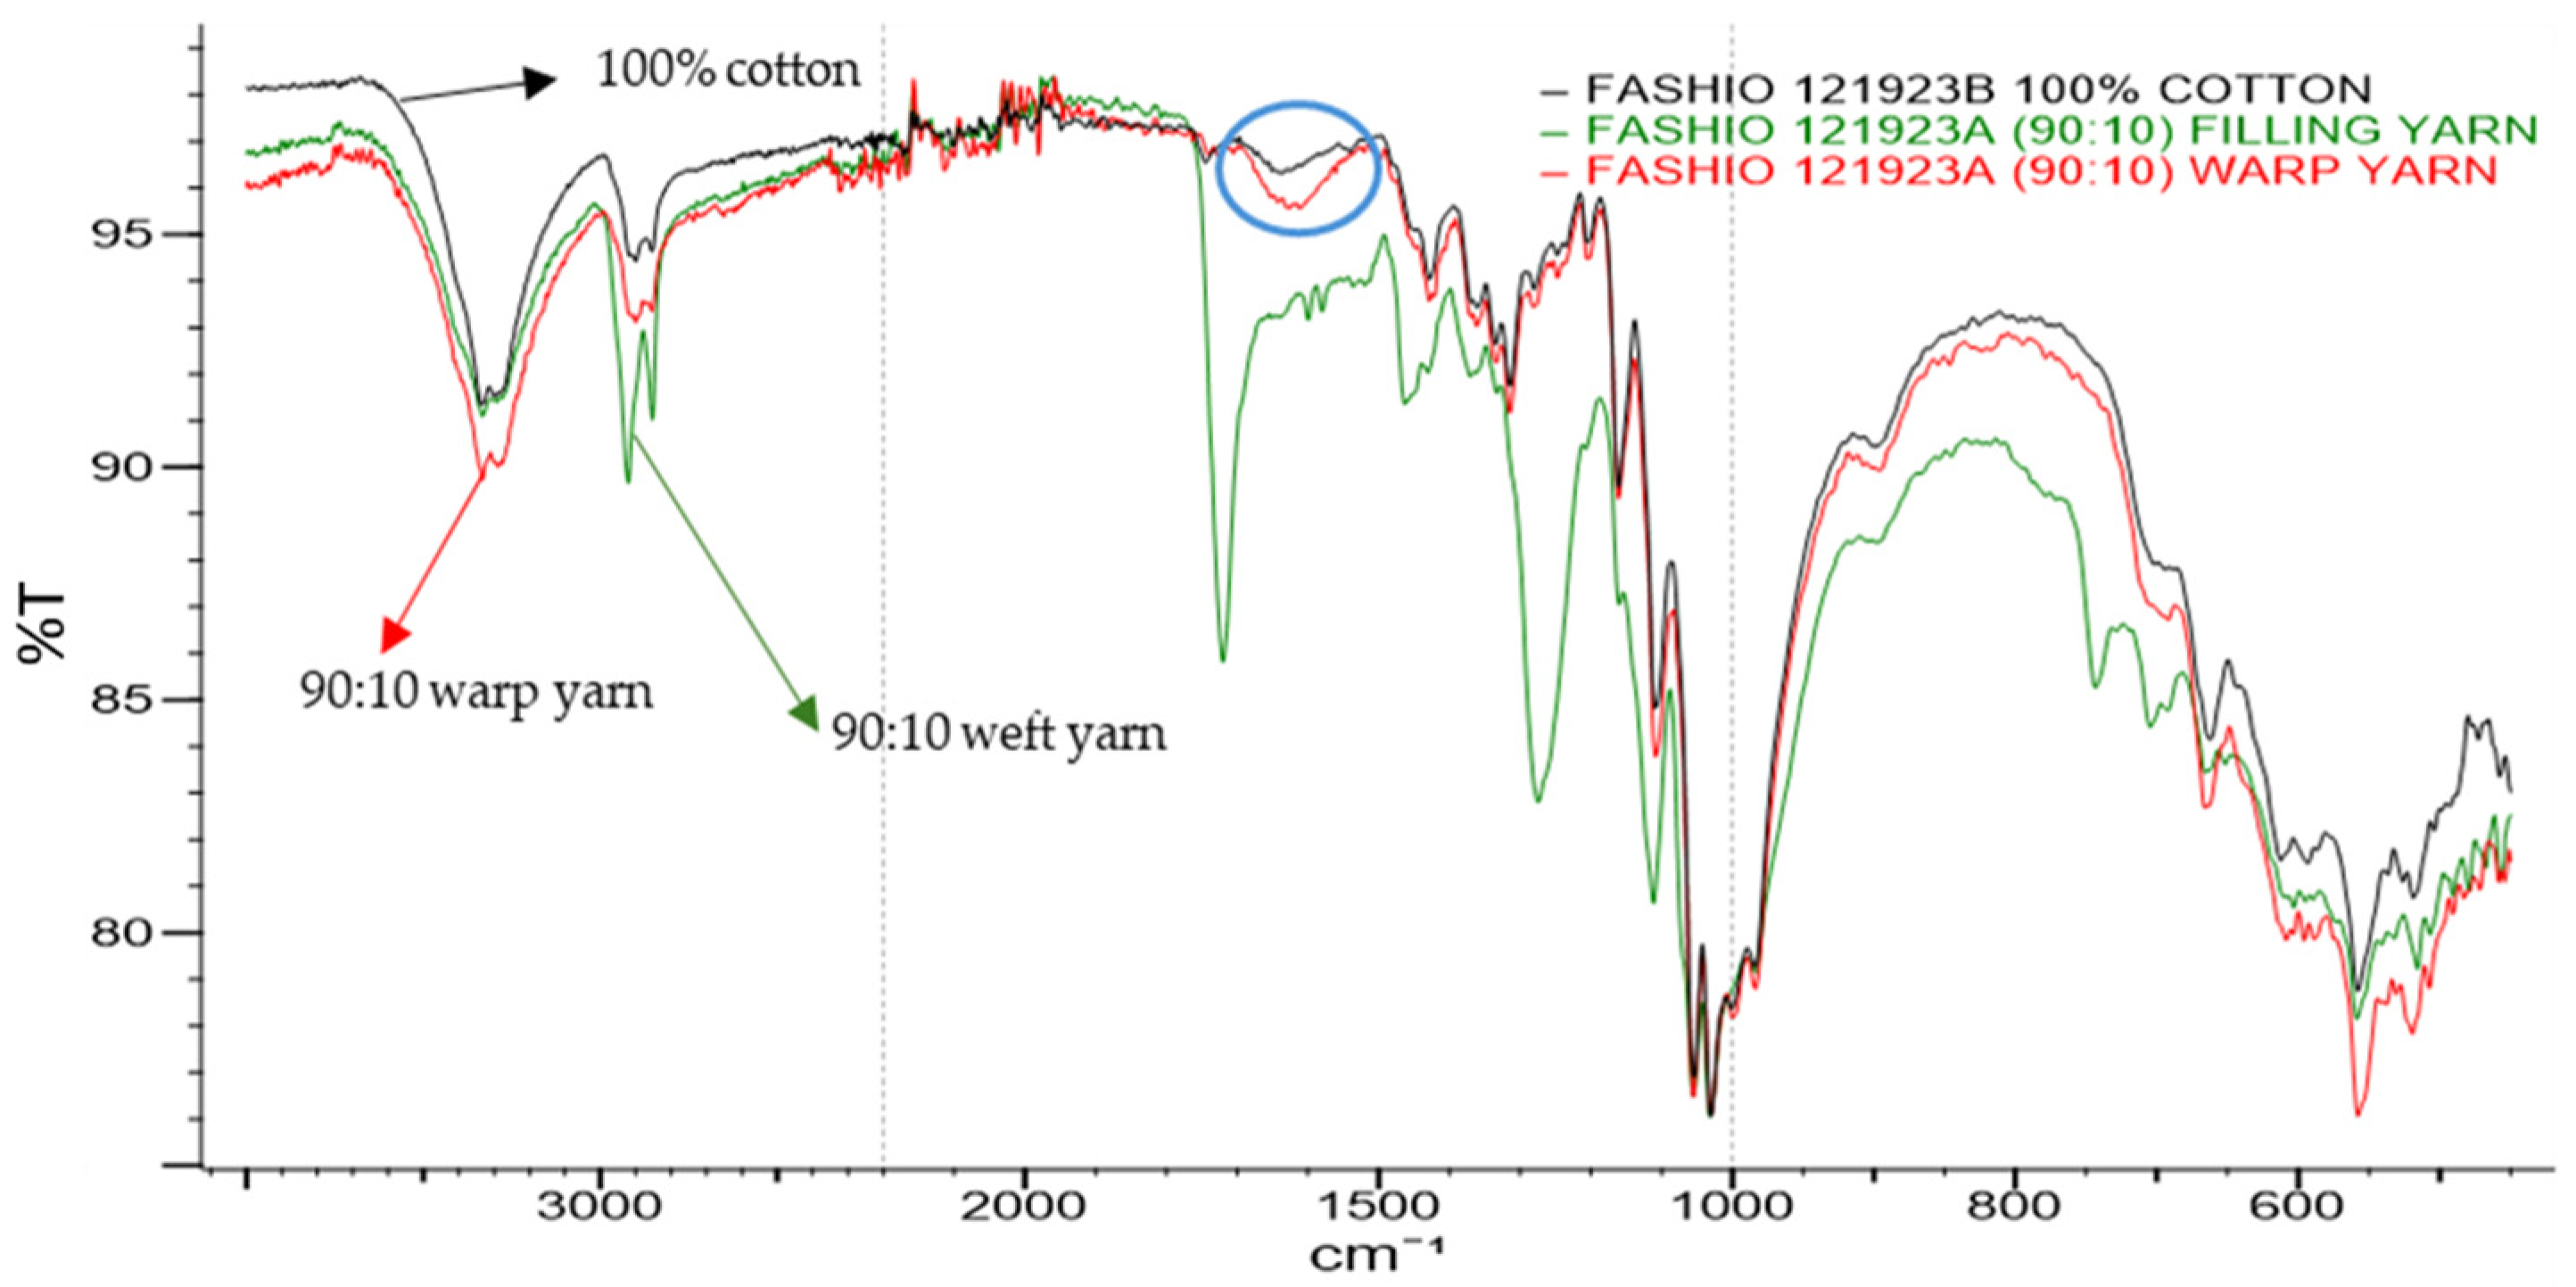
3.10. Fourier Transform Near-Infrared Spectroscopy (FTIR)

FTIR spectra were acquired in transmittance mode in the wave number range of 4000 to 300 cm−1. FTIR spectroscopy is a testing methodology to observe chemical changes in textile materials. The FTIR spectrum is illustrated in Figure 12 for both 100% cotton muslin and 90:10 cotton–cork blended fabric samples. The FTIR spectrum of untreated cotton (in red) shows bands of cellulose, lignin, and hemicellulose, which is similar to the FTIR spectra of the cotton–cork blended fabric (in black). The x-axis represents the infrared IR spectrum indicated as wave numbers (in cm−1), and the y-axis represents the amount of IR light transmitted.
The FTIR spectrum of cotton–cork blended textiles illustrates the bands of cotton content, cork, and the binding polymer. The FTIR spectrum of 100% cotton and the cotton–cork blend shows a prominent band at 3338 cm−1 arising from the -OH stretching characteristic of the hydroxyl group of cellulose, lignin, and water present in both samples [33]. However, there is a reduction in the -OH band intensity at 3338 cm−1 in the cotton–cork blended sample, which can be attributed to the coating of the cork with the resin polymer onto the yarns, causing a reduction due to the masking of -OH groups in the cotton–cork blended sample. The spectra at 2900 cm−1 and 2899 cm−1 are characteristic of the stretching vibration of -CH present in cellulose and hemicellulose [34,35]. However, the peak intensity of -OH bonds slightly went down in the blended fabric, due to the masking of cellulose and hemicellulose by the resin binder and the presence of cork particles.
The spectra at 2900 cm−1 and 2899 cm−1 are also indicators of asymmetric and symmetric stretching of methylene (-CH2-) in long alkyl chains, proving the presence of traces of wax in 100% cotton and the abundance in the cork of the cotton–cork blend sample [33]. A short peak at 1635 cm−1 can be related to the presence of adsorbed moisture in 100% cotton fabric samples [33]. This band gains a mild momentum in the blended sample, developing a very prominent peak at approximately 1717 cm−1 in the cotton–cork blend and possibly arising from C=O stretching vibrations in the -COOH carbonyl groups of the amino acids, which is a prominent component present in the polymer structure of cork.
Although the band at 1745 cm−1 on the shoulder in 100% cotton is a possible characteristic of the carboxyl group of hemicellulose, it is not significant enough, indicating a small percentage of hemicellulose in cotton [35]. The bands between the range of 1717 cm−1 to 1640 cm−1 can be associated with –C=O stretching vibrations, as in the case of –COOR or –COOH groups of ester or aliphatic ketone. Suberin, consisting of aliphatic esters, is present in a high percentage of the cork polymer [36]. Suberin is an ester made of suberin acid and glycerol, with spectral activity reported between the bands of 1740 and 1735 cm−1 [15,37,38]. The change in spectra in the region of 1717 cm−1 to 1640 cm−1 can also be associated with the presence of the thermoplastic binder used in the coating of the yarn, which has been identified as polyether ketone or PEK in this study.
In the range of 1500 to 800 cm−1, bands appear due to the presence of C-H, O-H, C-O, and C-O-C vibrations attributed to the higher presence of cellulose in cotton, but the groups are also common just to cork [39,40]. The peaks of the spectra between 1320 and 1360 cm−1 indicate the bending vibrations of C-H and C-O groups of the aromatic rings in polysaccharides, which are present and common to both 100% cotton and cotton–cork blended samples [34,41].
The band at 1278 cm−1 in Figure 12 is further seen as a prominent strong peak (spectra of just the weft yarn of the cotton–cork blended fabric), indicating a strong C-O stretching vibration, possibly due to the presence of ketone in the aromatic ether, as in the case of the binding polymer. The band at 1275 cm−1 could also possibly indicate the presence of the CO group in cork [37]. The band at 1109 cm−1 indicates a strong C-O stretching aliphatic ether [42]. In the case of the blended sample, there was a change in spectra between the band range of 1500 to 800 cm−1, attributed to the presence of cork and the masking of cellulose by the polymer binder [34]. The bands at 1111 cm−1 and 1055 cm−1, as seen prominently in Figure 12, indicate the C-O stretching of aliphatic ether and C-O stretching of secondary alcohol [42]. Additionally, in Figure 13, distinct peaks at 2921 cm−1 and 2853 cm−1 are characteristics of CH2 stretch absorption from aliphatic and olefinic C-H bonds from suberin-containing materials [17,34,37]. The combined FTIR of the cotton–cork blended fabric, as seen in Figure 12, was overshadowed by the presence of warp yarns, which were primarily cellulosic in nature and coated with a synthetic polymer.

4. Discussion

4.1. Tensile Strength

The difference in tenacity between the two fabrics can be attributed to the low fabric weight, lower fabric count, and single-ply finer yarns of the 100% cotton textile, as compared to cotton–cork blended textiles coated with synthetic polymer. Since the warp and weft of the cotton–cork blend were two-ply yarns coated with a high-performing synthetic polymer, it contributed to the higher tenacity and pliability of the cotton–cork blended textile fabric.

4.2. Abrasion Resistance

The abrasion resistance test for the cotton–cork blended textile showed significant pilling, primarily because of the presence of cork in the weft direction. Due to the blended sample’s heterogeneous nature and its cork-coated weft yarn construction, pill formation was facilitated, and hence, abrasion resistance was poor.

4.3. Wrinkle Recovery Angle Test (WRA)

The increase in the wrinkle recovery angle of the cotton–cork blended fabric can be attributed to the presence of fine cork particles in the weft yarns that enhanced the performance of the fabric. Furthermore, since cork is porous and buoyant in nature, as well as collapsible, along with the enhanced wrinkle recovery of the blended fabric, the presence of cork in the blended textile also provided a lofty, pleasing hand to the fabric.

4.4. Dyeability

The purpose of dyeing was to determine the dyeability of the cotton–cork blend, as compared to the dyeability of the cotton fabric. The dyeability of the cotton–cork blend was positively comparable, and the presence of the polymer coating and the weft yarn cork particles did not adversely affect dyeing properties.

4.5. Thermal Insulation

The higher CLO value of the cotton–cork blend is a clear indicator of good body heat retention, due to the high insulating properties of the blended sample. The use of the cotton–cork blended textile in the apparel industry will enhance the performance and season diversification, as such a textile fabric can be worn throughout the year without any layering or mechanical finishing, such as brushing or napping, to increase its cover factor.

4.6. Moisture Management Test

The ability to absorb moisture makes a textile material desirable, as it will be comfortable to wear. The 20 mm wetting radius of the cotton–cork blended fabric can be attributed to the presence of a high percentage of cellulose, whose absorbency was not obscured by the coated thermoplastic polymer. Cork, although porous with low density, also has a high damping capacity due to the presence of suberin, suggesting that although the blended fabric will absorb moisture, it is unlikely to display an evident embarrassing spot on the fabric or garment surface and will conceal a wet spot discreetly [43].

4.7. Shrinkage Test

The shrinkage test results were in favor of the new cotton–cork blended textile. The shrinkage stabilized in the third round of laundering, proving that it is a viable choice for a designer looking to design a sustainable collection.

4.8. Scanning Electron Micrograph SEM

The SEM images confirmed the presence of cork in the weft yarn, held in place by a synthetic binder. The SEM images of the warp yarns indicated the presence of a synthetic binder in trace quantities.

4.9. Differential Scanning Calorimetry DSC

The DSC testing helped in identifying the binding polymer for the cork in the weft yarn and the warp yarn of the blended textile.

4.10. Fourier Transform Near-Infrared Spectroscopy FTIR

As previously explained (Figure 12 and Figure 13), the FTIR spectra of the 100% cotton and cotton–cork blended fabrics are different, and particularly, the FTIR spectra of the weft of the cotton–cork blend show significantly different peaks, due to the presence of the synthetic polymer and cork. This is further illustrated in Figure 14. In Figure 14, the spectra in black are 100% cotton fabric, the spectra in red are of the warp yarn of the 90:10 cotton–cork blended fabric, and the spectra in green are of the weft yarn of the 90:10 cotton–cork blended fabric. Because the warp yarns of the cotton–cork blend have been coated with the synthetic polymer, it indicates a change in the peak between the 1700 cm−1 to 1500 cm−1 peak region (indicated by the circle in Figure 14). The SEM micrographs, DSC graphs, and FTIR spectra all corroborate the presence of the polymer.

5. Conclusions

Fabric samples of 100% cotton and the 90:10 cotton–cork blend were compared using physical and performance tests to evaluate the suitability of cotton–cork fabric as a sustainable innovative textile for the fashion industry. The results demonstrated that cotton/cork blended in a 90:10 ratio can be introduced as a bio-based and biodegradable textile for the fashion industry. The blended fabric can be laundered and dyed using traditional methods. The fabric has a higher insulating capacity than 100% cotton fabric and possesses sufficient strength. Aesthetically, the fabric has a linen look and a lofty, desirable hand, as determined by WRA tests. Shrinkage tests were within acceptable industry standards for a medium-weight textile fabric. Absorbency was excellent. Potential applications for this novel textile are in shirts, jackets, blouses, and pants. Currently, the cost of cotton–cork blended fabric varies between $24 to $40 per meter, depending on the width of the fabric, which is competitive with other apparel textiles. Coating cotton with the natural, biodegradable cork to make a sustainable fabric is a novel development with the added benefit of enhanced performance properties of the resultant apparel textile.

Author Contributions

Conceptualization, P.A.; Methodology, P.A.; Formal analysis, A.K.S.; Writing—review & editing, A.K.S. All authors have read and agreed to the published version of the manuscript.

Funding

This research received no external funding.

Institutional Review Board Statement

Not applicable.

Informed Consent Statement

Not applicable.

Data Availability Statement

Data is contained within the article.

Acknowledgments

Preeti Arya conducted the experiments and testing with the help of student assistants Marley Ashem Hibbert, Fiona McBride, and Joshua Brown. Scanning electron microscopy was performed by Bryant Avila (FIT lab technician/CCNY PhD candidate). FTIR spectroscopy was performed at Vartest Laboratories. The chemical structure of PEK (Figure 11) was created by Ghulam Mustafa Kalyar.

Conflicts of Interest

The authors declare no conflicts of interest.

References

  1. Arya, P.; Ghosh, S.; Das, D. Development of non-formaldehyde wrinkle resistant finish for cotton using carboxylic acids. Indian J. Fibre Text. Res. 2020, 45, 123–145. [Google Scholar]
  2. Mateo, C.P.; Van der Meer, Y.; Seide, G. Analysis of the polyester clothing value chain to identify key intervention points for sustainability. Environ. Sci. Eur. 2021, 33, 2. [Google Scholar] [CrossRef] [PubMed]
  3. Smelik, A. Polyester: A Cultural History. Fash. Pract. 2023, 15, 279–299. [Google Scholar] [CrossRef]
  4. Hsieh, Y.L. Chemical structure and properties of cotton. In Cotton: Science and Technology; Woodhead Publishing: Cambridge, UK, 2007; pp. 1–34. [Google Scholar]
  5. Kumar, P.; Ram, C.S.; Srivastava, J.P.; Behura, A.K.; Kumar, A. Synthesis of Cotton Fiber, and Its Structure. In Natural and Synthetic Fiber Reinforced Composites: Synthesis, Properties, and Applications, 1st ed.; Wiley Online Library: Hoboken, NJ, USA, 2022; pp. 17–36. [Google Scholar]
  6. Ansell, M.P.; Mwaikambo, L.Y. The structure of cotton and other plant fibres. In Handbook of Textile Fibre Structure Natural Regenerated, Inorganic and Specialist Fibres; Eichhorn, J.H.S.J., Ed.; Woodhead Publishing: Cambridge, UK, 2009; pp. 62–94. [Google Scholar]
  7. Lagorce-Tachon, A.; Mairesse, F.; Karbowiak, T.; Gougeon, R.D.; Bellat, J.-P.; Sliwa, T.; Simon, J.-M. Contribution of image processing for analyzing the cellular structure of cork. J. Chemom. 2018, 32, e2988. [Google Scholar] [CrossRef]
  8. Gil, L. Cork: A strategic material. Front. Chem. 2015, 1, 1–3. [Google Scholar] [CrossRef] [PubMed]
  9. Gil, L. New Cork-Based Materials and Applications. Materials 2015, 8, 625–637. [Google Scholar] [CrossRef] [PubMed]
  10. Uzun, M. Mechanical, sound absorption and thermal properties of cork fabric. Indian J. Fibre Text. Res. 2023, 48, 157–166. [Google Scholar]
  11. Pereira, H. Chemical composition and variability of cork from Quercus suber L. Wood Sci. Technol. 1988, 22, 211–218. [Google Scholar] [CrossRef]
  12. Gibson, L.J.; Ashby, M.F.; Haley, B.A. Cellular Materials in Nature and Medicine; Cambridge University Press: Cambridge, UK, 2010; Available online: https://www.google.com/books/edition/Cellular_Materials_in_Nature_and_Medicin/AKxiS4AKpyEC?hl=en&gbpv=1&dq=Gibson,+L.J.%3B+Ashby,+M.F.%3B+Haley,+B.+Cellular+Materials+in+Nature+and+Medicine+.+2010.&pg=PR9&printsec=frontcover (accessed on 30 March 2024).
  13. Pereira, H. The Rationale behind Cork Properties: A Review of Structure and Chemistry. BioResources 2015, 10, 6207–6229. [Google Scholar] [CrossRef]
  14. Graca, J.; Pereira, H. Feruloyl Esters of a-Hydroxyacids in Cork Suberin. J. Wood Chem. Technol. 1998, 18, 207–217. [Google Scholar] [CrossRef]
  15. Graca, J. Suberin: The Biopolyester at the Frontier of Plants. Front. Chem. 2015, 3, 62. [Google Scholar] [CrossRef] [PubMed]
  16. Silva, S.P.; Sabino, M.A.; Fernandes, E.M.; Corello, V.M.; Boesel, L.F.; Reis, R.L. Cork: Properties, capabilities, and applications. Int. Mater. Rev. 2005, 50, 345–365. [Google Scholar] [CrossRef]
  17. Miranda, I.; Gominho, J.; Pereira, H. Cellular structure, and chemical composition of cork from the Chinese cork oak (Quercusvariabilis). J. Wood Sci. 2013, 59, 1–9. [Google Scholar] [CrossRef]
  18. Cordeiro, N.; Belgacem, N.M.; Gandini, A.; Pascoal Neto, C. Cork Suberin as a New Source of Chemicals: 2. Crystallinity, Thermal and Rheological Properties. Bioresour. Technol. 1998, 63, 153–158. [Google Scholar] [CrossRef]
  19. Leite, C.; Pereira, H. Cork-Containing Barks—A Review. Front. Mater. 2017, 3, 63. [Google Scholar] [CrossRef]
  20. Von Holle, B.; Delcourt, H.R.; Simberloff, D. The importance of biological inertia in plant community resistance to invasion. J. Veg. Sci. 2003, 14, 425–432. [Google Scholar] [CrossRef]
  21. Akhavan-Safar, A.; Barbosa, A.Q.; Silva, L.F.; Ayatollahi, M.R. Micro failure analysis of adhesively bonded joints enhanced with natural cork particles: Impact of overlap length and particles volume fraction. Frat. Ed Integrità Strutt. 2018, 46, 266–274. [Google Scholar] [CrossRef]
  22. Mestre, A.; Gil, L. Cork for Sustainable Product Design. Ciência Tecnol. Dos Mater. 2011, 23, 52–63. [Google Scholar]
  23. ASTM D4632; Standard Test Method for Grab Breaking Load and Elongation of Geotextiles. ASTM International: West Conshohocken, PN, USA, 2003.
  24. ASTM D3512; Standard Test Method for Pilling Resistance and Other Related Surface Changes of Textile Fabrics: Random Tumble Pilling Tester. ASTM International: West Conshohocken, PN, USA, 2022.
  25. Yamato, Y.; Kurazumi, Y.; Fukagawa, K.; Tobita, K.; Kondo, E. Assessment of method for measuring clo value using human body—Assessment of method for measuring clo value that assumes human body temperature adjustment. In E3S Web of Conferences; EDP Sciences: Les Ulis, France, 2019; Volume 111, p. 06050. [Google Scholar]
  26. ASTM F1868; Standard Test Method for Thermal and Evaporative Resistance of Clothing Materials Using a Sweating Hot Plate. ASTM International: West Conshohocken, PN, USA, 2023.
  27. Alvaredo-Atienza, Á.; Chen, L.; San-Miguel, V.; Ridruejo, Á.; Fernández-Blázquez, J.P. Fabrication and Characterization of PEEK/PEI Multilayer Composites. Ploymers 2020, 12, 2765. [Google Scholar] [CrossRef]
  28. Chen, J.; Guo, Q.; Zhao, Z.; Wang, X.; Duan, C. Structures and Mechanical Properties of PEEK/PEI/PES Plastics Alloys Blent by Extrusion Molding Used for Cable Insulating Jacketing. Procedia Eng. 2012, 96, 96–104. [Google Scholar] [CrossRef]
  29. Doumeng, M.; Makhlouf, L.; Berthet, F.; Marsan, O.; Delbe, K.; Denape, J.; Chabert, F. A comparative study of the crystallinity of polyetheretherketone by using density, DSC, XRD, and Raman spectroscopy techniques. Polym. Test. 2021, 93, 106878. [Google Scholar] [CrossRef]
  30. Hergenrother, P.M. Recent Advances in High Temperature Polymers. Polym. J. 1987, 19, 73–83. [Google Scholar] [CrossRef]
  31. Ling, X.; Jing, X.; Zhang, C.; Chen, S. Polyether Ether Ketone (PEEK) Properties and Its Application Status. IOP Conf. Ser. Earth Environ. Sci. 2020, 453, e012080. [Google Scholar] [CrossRef]
  32. Wang, Y.; Cakmak, M. Ketone-Based Thermoplastics. In Handbook of Thermoplastics; CRC Press: Boca Raton, FL, USA, 2016; pp. 461–490. [Google Scholar]
  33. Chung, C.; Lee, M.; Choe, E.K. Characterization of cotton fabric scouring by FT-IR ATR spectroscopy. Carbohydr. Polym. 2004, 58, 417–420. [Google Scholar] [CrossRef]
  34. Costa, R.; Lourenço, A.; Oliveira, V.; Pereira, H. Chemical characterization of cork, phloem and wood from different Quercus suber provenances and trees. Heliyon 2019, 5, e02910. [Google Scholar] [CrossRef] [PubMed]
  35. Portella, E.H.; Romanzini, D.; Angrizani, C.C.; Amico, S.C.; Zattera, A.J. Influence of Stacking Sequence on the Mechanical and Dynamic Mechanical Properties of Cotton/Glass Fiber Reinforced Polyester Composites. Mater. Res. 2016, 19, 542–547. [Google Scholar] [CrossRef]
  36. Marques, A.V.; Pereira, H.; Rodrigues, J.; Meier, D.; Faix, O. Isolation and comparative characterization of a Björkman lignin from the saponified cork of Douglas-fir bark. J. Anal. Appl. Pyrolysis 2006, 77, 169–176. [Google Scholar] [CrossRef]
  37. Marques, A.V.; Pereira, H.; Meier, D.; Faix, O. Quantitative Analysis of Cork (Quercus suber L.) and Milled Cork Lignin by FTIR Spectroscopy, Analytical Pyroiysis, and Total Hydrolysis. Holzforschung 1994, 48, 43–50. [Google Scholar] [CrossRef]
  38. Prades, C.; Garc’ıa-Olmo, J.; Romero-Prieto, T.; GarcIa de Ceca, J.L.; Lopez-Luque, R. Methodology for cork plank characterization (Quercus suber L.) by near-infrared spectroscopy and image analysis. Meas. Sci. Technol. 2010, 21, 065602. [Google Scholar] [CrossRef]
  39. Abd El-Hady, M.M.; Farouk, A.; Sharaf, S. Multiwalled-Carbon-Nanotubes (MWCNTs)–GPTMS/Tannic-Acid-Nanocomposite-Coated Cotton Fabric for Sustainable Antibacterial Properties and Electrical Conductivity. Coatings 2022, 12, 178. [Google Scholar] [CrossRef]
  40. Abd El-Hady, M.M.; Sharaf, S.; Farouk, A. Highly hydrophobic and UV protective properties of cotton fabric using layer by layer self-assembly technique. Cellulose 2019, 27, 1099–1110. [Google Scholar] [CrossRef]
  41. Romanzini, D.; Junior, H.O.; Amico, S.C.; Zattera, A.J. Preparation and Characterization of Ramie-Glass Fiber Reinforced Polymer Matrix Hybrid Composites. Mater. Res. 2012, 15, 415–420. [Google Scholar] [CrossRef]
  42. IR Spectrum Table and Chart. From Photometry and Reflectrometry by Milipore Sigma. 2023. Available online: https://www.sigmaaldrich.com/US/en/technical-documents/technical-article/analytical-chemistry/photometry-and-reflectometry/ir-spectrum-table (accessed on 30 March 2024).
  43. Rosa, E.M.; Fortes, M.A. Water Absorption by Cork. Wood Fiber Sci. 1993, 24, 339–348. [Google Scholar]
Figure 1. Microstructure of a cork particle of 125–250 µm size [21].
Sustainability 16 03098 g001
Figure 2. Cork with different microstructures in all three axial, radial, and tangential directions. Reprinted with permission from ref. [7]. Copyright 2017 John Wiley & Sons, Ltd. (Hoboken, NJ, USA).
Sustainability 16 03098 g002
Figure 3. Illustrative visuals of 90:10 cotton–cork blended samples (left) and 100% cotton fabric samples after 5000 cycles (right).
Sustainability 16 03098 g003
Figure 4. Dyed samples of the (a) cotton–cork blend and the (b) 100% cotton muslin with reactive dye.
Sustainability 16 03098 g004
Figure 5. Moisture management test of the (a) cotton–cork blend and (b) 100% cotton muslin.
Sustainability 16 03098 g005
Figure 6. SEM micrograph of 100% cotton muslin with magnifications of (a) 1750 and (b) 275.
Sustainability 16 03098 g006
Figure 7. SEM micrograph of the 90:10 cotton–cork blended weft yarn, with magnifications of (a) 1700 and (b) 3000.
Sustainability 16 03098 g007
Figure 8. SEM micrograph of the 90:10 cotton–cork blended warp yarn, with magnifications of (a) 1700 and (b) 2300.
Sustainability 16 03098 g008
Figure 9. DSC micrograph of the weft yarn of the cotton-cork blended fabric.
Sustainability 16 03098 g009
Figure 10. DSC micrograph of the warp yarn of the cotton-cork blended fabric.
Sustainability 16 03098 g010
Figure 11. Molecular structure of polyether ketone. Source: Reprinted with permission from Ghulam Mustafa Kalyar.
Sustainability 16 03098 g011
Figure 12. FTIR spectra of the 90:10 cotton–cork blended fabric (in black) and 100% cotton muslin (in red).
Sustainability 16 03098 g012
Figure 13. FTIR spectra of the weft yarn of the 90:10 cotton–cork blended fabric.
Sustainability 16 03098 g013
Figure 14. FTIR spectra of the 100% cotton fabric and the warp, and weft yarns of the 90:10 cotton–cork blended fabric.
Sustainability 16 03098 g014
Table 1. Tensile strengths for 100% cotton and 90:10 cotton–cork blended fabrics.
No. of Samples100% Cotton Muslin90:10 Cotton–Cork Blend
Warp
(lbs.)
Weft
(lbs.)
Warp
(lbs.)
Weft
(lbs.)
148.5633.9661.8751.87
249.1534.6759.8650.57
349.1234.8563.3454.68
447.5331.9760.4249.89
Average48.5933.8661.3751.75
Table 2. Wrinkle recovery angles for 100% cotton and 90:10 cotton–cork blended fabrics.
No. of Samples90:10 Cotton–Cork Blend 100% Cotton
Warp
(degree)
Weft
(degree)
Warp
(degree)
Weft
(degree)
1150132115115
2145136105135
31351309775
41051308280
51251358885
6143130110110
Average133.8132.299.5100
Table 3. Laundering shrinkage.
Wash
Cycles
100% Cotton Muslin 90:10 Cotton–Cork Blend
Warp
(inches)
Weft
(inches)
% Shrinkage Warp% Shrinkage WeftWarp
(inches)
Weft
(inches)
% Shrinkage Warp% Shrinkage Weft
055NANA55NANA
14.954.80.2514.94.950.50.25
24.854.950.750.254.94.80.51
34.854.95004.854.750.751.25
44.854.95004.854.7500
54.854.95004.854.7500
64.854.95004.854.7500
Disclaimer/Publisher’s Note: The statements, opinions and data contained in all publications are solely those of the individual author(s) and contributor(s) and not of MDPI and/or the editor(s). MDPI and/or the editor(s) disclaim responsibility for any injury to people or property resulting from any ideas, methods, instructions or products referred to in the content.

