Abstract
Authorities and governmental bodies strongly emphasize the importance of residents preparing for natural disasters, particularly underscoring the significance of readiness for geophysical hazards like earthquakes. In this study, which represents comparative quantitative research, the levels and predictors of the impact on preparedness for earthquake-induced disasters in South-Eastern European countries such as Montenegro, North Macedonia, and Serbia are examined. Using the snowball sampling technique (online questionnaire), a survey of 1245 respondents (Montenegro (n = 400), North Macedonia (n = 345), and Serbia (n = 500) was conducted from February 2023 to February 2024. The paper is based on the central hypothesis that the most significant predictor of earthquake preparedness in Montenegro, North Macedonia, and Serbia is age, followed by education and gender. Multivariate regression analysis was used to determine the extent to which five scores of the subscales (household preparedness, community preparedness, disaster preparation, earthquake risk awareness, and reinforced house) were associated with seventh demographic and socio-economic variables. In addition to the mentioned analysis, other statistical analyses such as t-test, one-way ANOVA analysis, and Pearson correlation were also utilized. The results indicate that age emerges as a predictor in various aspects of earthquake-induced disaster preparedness and awareness in most models, followed by education and gender. These findings confirm the significance of respondents’ age in determining levels of preparedness and earthquake awareness. Overall, in North Macedonia, respondents recorded the highest ratings (M = 3.52) for household preparedness for earthquakes, compared to Serbia (M = 3.26) and Montenegro (M = 2.98), where the lower ratings were recorded. Research findings, taking into account cultural characteristics, can serve as a basis for the development of targeted interventions, strategies, policies, and programs aimed at improving the level of societal preparedness for earthquake-induced disasters.
1. Introduction
The preparedness of residents for geophysical hazards has been analysed from diverse perspectives worldwide. As pointed out by Pereira Morgado et al. [1], civil protection authorities and governments emphasize the necessity for residents to prepare themselves for natural hazards, thus offering guidance on the preparation process. Respective authors outline that the level of preparedness may differ based on local factors such as culture, social dynamics, the specific hazard environment, and available adaptation resources. From the perspective of earthquake preparedness and appropriate response recommendations from authorities, the work of Sutton and Tierney [2] provided instruments and preparedness recommendations in the United States of America (USA). Halkia and Ludwig [3] examined earthquake preparedness among households in Oklahoma (USA) and found that 22 out of 77 counties in the study area are impacted, with magnitudes ranging from low to moderate. The study revealed that the population was completely unprepared for earthquakes. The authors highlight that induced earthquakes can lead to property damage, decreased property values, and adverse effects on personal well-being.
The recent research by Kiani et al. [4] uncovered that risk perception in Pakistan is notably shaped by concerns about future earthquakes, potential disruptions in supplies, and anticipated damage to residential structures. Using an index-based method, respective authors measured risk perception and preparedness indices, quantifying overall risk perception and its key dimensions through relevant indicators. Linear regression models were employed to identify significant correlations between risk perception and preparedness. Findings of the study indicate that fear of future earthquakes, anticipated supply shortages, and expected structural damage strongly influence risk perception. The study highlights the significant impact of risk perception and its dimensions on earthquake preparedness. Kwazu and Chang-Richards [5] pinpoint the key factors that influenced the preparedness of individuals affected by the 2016 Kaikōura earthquake in New Zealand. The authors highlight that these critical factors include access to resources, diversity of livelihoods, the efficacy of disaster risk reduction measures, and individual adaptive capacity.
These kinds of investigations have been relatively scarce for the territories of Montenegro, North Macedonia, and Serbia, respectively. Only the study by [6] delves into the examination of household earthquake preparedness and community-level preparedness in Serbia, exploring its correlation with various demographic factors. This research involved a series of 1018 face-to-face interviews conducted at the start of 2017 across eight Serbian municipalities. The findings reveal that the population is generally unprepared. Reference [7] mentioned natural events for almost half a century. There have always been organized efforts to help human societies resist the negative impacts of various disasters [8,9,10,11,12,13,14]. The hazards that lead to disasters could also be interpreted through the interactions between specific human communities with clearly identified levels of vulnerability and extreme natural (lithospheric, atmospheric, hydrospheric, biospheric, and technical-technological) events, which cause significant consequences for people and their property [15]. Their occurrences can transition into hazards for communities and local populations when there are a lack of individual or societal capabilities to prevent or mitigate their impact. Therefore, it can be emphasized that hazards exist within social, political, historical, and environmental systems, and as such, people perceive them as threats. One of the most renowned representatives and researchers from the original disaster studies period, Enrico Quarantelli [16,17], emphasizes that disasters occur suddenly, seriously disrupt the routines of social units, prompt the adoption of unplanned courses of action to adapt to the disruption of order, lead to unexpected life stories marked in social space and time, and pose a danger to significant social objects.
Considering the impossibility of attaining complete safety from disasters, it is essential to recognize that every individual may face the repercussions of such events. The level of individual vulnerability depends on a large number of demographic, socio-economic, and psychological factors. Therefore, integrated disaster management represents an important strategy, and there is a large body of work on its evolution, structure, functioning, and characteristics [18,19,20,21]. It is a comprehensive and integrated approach that encompasses all types of disasters and phases (mitigation, preparedness, response, and recovery) of management, with a particular focus on hazards and vulnerabilities, i.e., the underlying conditions of disasters. It represents an iterative process of decision-making regarding prevention, response, and recovery from naturally induced disasters [22].
Considering that the areas of Montenegro, North Macedonia, and Serbia have been repeatedly affected by earthquakes in the past, it is significant to emphasize that they represent sudden movements of large rock plates along fractures within the earth [23]. They are commonly viewed as various ground oscillations caused by the action of internal and external factors. The seriousness of earthquakes as a security threat to the citizens of Serbia is evidenced by the fact that just one stronger tremor can kill hundreds of thousands of people, cause billions of dollars in property damage in less than a minute, disrupt tens of thousands of business operations, and leave hundreds of thousands of people homeless, jobless, and without other essential conditions for life [24]. Guided by this, decision-makers in the community often seek guidance from scientists and engineers when assessing the risk of earthquakes and ask: Where can they occur, and how strong will the earthquake be? How often will they occur, and in what way, and how much will it cost to adopt and implement preventive mitigation and preparedness measures [25]?
Taking into account the significance of preparedness for earthquake-induced disasters, the research starts from the theory of readiness, which represents a theoretical standpoint that serves as a framework for explaining how the community changes and how it is possible to change the community regarding its readiness for prevention [26]. In that context, and considering the importance of citizens’ readiness to respond to disasters, national surveys are conducted in certain countries such as the United States. The research focus usually relates to residents’ knowledge and attitudes about disasters, as well as behaviours related to raising citizens’ readiness levels. In such research, the Citizen Corps Personal Behavior Change Model for Disaster Preparedness is used, which describes various factors that may influence the implementation of preparatory activities by citizens [27].
The study starts from the research question of whether there are differences in the level of perceived preparedness (hereafter referred to as preparedness) among citizens of Montenegro, North Macedonia, and Serbia for earthquake-induced disasters, and what demographic and socio-economic predictors are associated with such preparedness levels. Following this, the paper is based on the central hypothesis that the most significant predictor of earthquake preparedness in Montenegro, North Macedonia, and Serbia is age, followed by education and gender. The paper is based on the following hypothetical framework: there is a statistically significant influence of gender (H1), age (H2), education (H3), marital status (H4), employment (H5), income (H6), and disability (H7) on the level of preparedness of citizens of Montenegro, North Macedonia, and Serbia for earthquakes-induced disasters.
1.1. Literature Review on Earthquake Preparedness
Studying disasters from a management perspective, researchers have directly/indirectly addressed the question of preparedness as both a theoretical concept and a practical discipline. Historically, starting from 1950 when researchers began to intensely explore various aspects of disasters, all theoretical definitions of preparedness can be categorized into specific periods. Accordingly, theoretical definitions of preparedness can be viewed through the perspectives of three periods: from 1979 to 1993; from 1993 to 2008; and from 2008 to 2014 [28]. In the first mentioned period, Godschalk [29] indicates that preparedness involves activities aimed at developing operational capabilities and facilitating the adoption of effective measures in disasters. Furthermore, Mileti [8] defines preparedness as activities undertaken to formulate, test, and exercise disaster protection and rescue plans; providing training for emergency response services and the general public; establishing communication with the public about disaster risks and ways to mitigate them. On the other hand, Faupel et al. [30] define preparedness as planning and engagement in activities based on general knowledge and information that enable individual households to take appropriate response measures to disasters.
In the second-mentioned period, Gillespie et al. [31] define preparedness as activities undertaken before a disaster to improve response and recovery from the resulting consequences. Therefore, the authors integrate planning activities, practising procedures, and stockpiling. The International Red Cross and Red Crescent Movement define preparedness as any measure taken to anticipate and possibly prevent, or mitigate the impact of disasters on vulnerable populations, and effectively respond to or cope with the resulting consequences [32]. Tierney and colleagues [33] advocate the view that preparedness encompasses activities undertaken to strengthen the capacity and capabilities of social groups to respond to disaster-induced situations.
In the period from 2008 to 2014, Smith and Petley [34] emphasize that preparedness for disasters forms the basis for ensuring an effective response. According to them, it involves planning and testing measures to reduce hazards at all time scales, ranging from seconds (response to earthquake or tsunami warnings) to decades (response to better land planning or climate change mitigation). Said et al. [35] conceptualize preparedness through activities such as planning, comprehensive resource identification and procurement, warning systems, training, risk assessment, raising awareness and education about disasters, and conducting drills aimed at improving safety during disasters. Also, Kohn et al. [36] unequivocally state that there is no concise definition of preparedness in the literature, but that its two constitutive elements are often emphasized: stocking supplies such as food and water, medications, and certain equipment; and orally or in writing devising household protection and rescue plans for its members. Besides that, Hémond and Robert [37] define preparedness as part of continuous processes aimed at improving interventions and ensuring recovery when such events affect public safety. Finally, Reininger and colleagues [38] emphasize that individual preparedness is reciprocally determined through available material and intellectual resources (supplies; and the timeliness and availability of knowledge and routes), social support networks (families, churches, and local organizations), community preparedness level (connectivity between public services, non-governmental organizations, and local administrations), and the community’s ability to provide adequate resources.
1.1.1. Influence of Gender and Age on Preparedness for Earthquakes-Induced Disasters
In the field of disaster studies, the exploration of the correlation between gender and preparedness for natural disasters is a highly pertinent subject [39,40,41,42,43,44,45,46,47,48]. Some researchers affirm a higher readiness among females in terms of their disaster response preparedness [42,49]. Studies indicate that women perceive disaster threats more seriously than men [50,51] and often acquire information through social networks rather than official sources available online. Moreover, there is a noticeable underrepresentation of women in formal state emergency management organizations dealing with natural disaster emergencies, possibly linked to gender segregation and discrimination [52,53]. Conversely, men tend to take greater responsibility for possessing necessary supplies for surviving natural disasters [54] and are more proactive in implementing preventive measures to safeguard households [55].
Numerous research findings have indicated that elderly individuals exhibit higher levels of preparedness when it comes to responding to natural disasters [56,57,58]. Additionally, they tend to possess more knowledge about such events. However, they also tend to suffer more severe consequences due to their physical vulnerability [59,60]. Sattler et al. [61] found evidence suggesting a positive relationship between age and individuals’ preparedness levels in responding to natural disasters.
1.1.2. Influence of Education and Marital Status on Preparedness for Earthquakes-Induced Disasters
According to the findings of their research, Tomio, Sato, Matsuda, Koga, and Mizumura [49] suggest that individuals with higher educational attainment exhibit greater readiness to react to disasters at the household level, while at the community level, such preparedness correlates with factors like length of residency, marital status, and the presence of elderly family members. Finnis and his colleagues [62], through their investigation into the association between participation in educational programs focused on natural disasters and households’ readiness to respond, noted a positive link between program involvement and increased household preparedness for natural disaster response. Kohn, Eaton, Feroz, Bainbridge, Hoolachan, and Barnett [36] highlight significant variations in research outcomes concerning the influence of education on citizens’ readiness levels for disaster response.
Some studies suggest that individuals with a high level of specific knowledge are more likely to be prepared for such events [63,64]. Edwards [65] indicates that households with higher levels of education are more likely to adapt to implementing necessary preparedness measures. Faupel and his colleagues Faupel, Kelley, and Petee [30] confirm the correlation between participation in educational programs on natural disasters and citizens’ readiness levels for response based on their research findings. Johnston et al. [66] point out that traditional educational programs on natural disasters, focused on passive information, often result in very low levels of awareness and motivation among citizens to enhance their readiness levels for response.
The readiness of citizens living alone or In marital or extramarital relationships to respond has prompted researchers to explore such connections [67,68]. Tomio, Sato, Matsuda, Koga, and Mizumura [49] discovered that readiness to respond is linked to the length of residence, marital status, and the presence of older family members in the household.
1.1.3. Influence of Employment Status and Income Level on Preparedness for Earthquakes-Induced Disasters
Findings from a nationwide survey conducted in the United States [69] suggest that a higher proportion of unemployed individuals (47%) tend to depend more on the assistance provided by emergency services compared to those who are employed (31%). Employed individuals (69%) are inclined to believe that taking preparatory actions, planning, and stocking up on supplies will be beneficial in natural disasters. Additionally, they are more likely to perceive that enhancing preparedness levels will aid them in managing the aftermath of natural calamities. Increasing income heightens the risk of disasters such as floods, landslides, and windstorms, but this risk diminishes as income continues to rise [70].
1.1.4. Influence of Disability on Preparedness for Earthquakes-Induced Disasters
A physical disability serves as a contributing factor to the likelihood of injuries and fatalities resulting from earthquakes [71]. Also, Smith and Notaro [72], in examining the correlation between preparedness for disasters and mobility impairments, arrived at the following findings: citizens with certain mobility impairments (20.7%) were more likely than citizens without such impairments (16.1%) to report inadequate preparedness for responding adequately in the event of natural disasters; and citizens with mobility impairments were less likely to possess three-day supplies of water and long-lasting food, a battery-powered transistor, and a functional battery-operated lamp. Households containing disabled members exhibit lower tendencies to prepare emergency kits and strategize evacuation plans [73].
2. Methods
In this study, which represents a comparative quantitative research, the levels and predictors of the impact on preparedness for earthquake-induced disasters in Montenegro, North Macedonia, and Serbia are examined. Using the snowball sampling technique with an online questionnaire [74], a survey of 1245 respondents (Montenegro (n = 400), North Macedonia (n = 345), and Serbia (n = 500) was conducted from February 2023 to February 2024. Using the mentioned technique, the participants were asked to interact with the online questionnaire in their mother tongue. This method entails initial participants seeking assistance from their social circles, initiating a chain reaction that expands the number of responders involved.
The paper is based on the central hypothesis that the most significant predictor of earthquake preparedness in Montenegro, North Macedonia, and Serbia is age, followed by education, and gender. In line with this, the following hypothetical framework has been defined: there is a statistically significant influence of gender (H1), age (H2), education (H3), marital status (H4), employment (H5), income (H6), and disability (H7) on the level of preparedness of citizens of Montenegro, North Macedonia, and Serbia for earthquake-induced disasters (Figure 1).

Figure 1.
Research design of comparative analysis and prediction of earthquake preparedness: including hypotheses.
2.1. Study Area
The study focused on earthquake-induced disasters in South-Eastern European countries due to their geographical locations and historical seismic activity. Montenegro, North Macedonia, and Serbia are prone to earthquakes, with each country experiencing significant seismic events in the past. Therefore, focusing on earthquake-induced disasters in these countries allows for a comprehensive analysis of seismic risk and disaster preparedness in the region. The Republic of Montenegro, with an area of 13,812 km2, ranks among the smaller European countries in terms of size, specifically at 39th place. Its inland sea area amounts to 347 km2, territorial sea to 2047 km2, and the continental shelf sea to 4917 km2 [75]. Situated on the coast of the Adriatic Sea, which stretches for 293.5 km, it shares maritime borders with Italy and borders Serbia to the northeast and east (border length 203 km), Albania to the south (border length 172 km), Croatia to the southwest (border length 22.6 km), and Bosnia and Herzegovina to the west (border length 245 km). The distance between the northernmost and southernmost points of the mainland is 192 km in a straight line, while the distance between the westernmost and easternmost points is 163 km [76].
The area of Montenegro is largely seismic active, especially the coastal region, but also parts of central Montenegro. This activity is conditioned by the contact of the Eurasian and African plates, resulting in frequent earthquakes in the Adriatic region, to which Montenegro belongs. From a seismic perspective, the territory of Montenegro is divided into the following regions: (a) coastal area characterized by the strongest recorded tremors, and seismic forces up to 10 degrees on the MSC scale. This area also includes a larger number of faults: Dobre Vode-Stari Bar-Virpazar; Bar-Cetinje; the area of Buljarica; Budva-Kotor-Orahovac-part of Grachko Polje-Njegos; Przno-Verige-Risan-Grahovo; (b) central Montenegro (Duga, Goliya, Nikshichko Polje, Donja Zeta, Podgorica-Shkadar Valley, and the deep karst plateau), where earthquakes with a magnitude of 7 to 9 on the MSC scale are possible; (c) area of deep canyons and high mountains, covering the space of the Komarnica-Shavnik-Kolasin valley, where seismic activity can cause tremors of up to 7 degrees on the MSC scale; (d) northeastern Montenegro: Pljevlja-Bijelo Polje-Berane-Plav, where the seismic activity is most active in the Berane basin, with the strongest recorded tremor of 8 degrees on the MSC scale [76,77].
There have been many strong earthquakes along the Montenegrin coast, but a significant number of them have remained unrecorded. Pliny in the 1st century wrote about an earthquake that devastated Epidaurum, present-day Cavtat. Duklja suffered from an earthquake in 518 AD. Kotor was destroyed on a couple of occasions, in 1520, and then again in 1559, also as a result of earthquakes. According to estimates, the earthquake that occurred on June 13, 1563, destroyed all settlements in Boka, with a magnitude of X on the Mercalli scale [76,77]. A similarly strong earthquake was recorded in Boka in 1608. The earthquake of 1667 is also well known for its severe consequences when Kotor, Perast, Risan, Herceg Novi, Budva, Bar, and Ulcinj were destroyed. Earthquakes above IX on the Mercalli scale were recorded on the Montenegrin coast in 1780 and 1830, then in 1905, 1926, and 1927, which besides the coast also affected the Podgorica-Shkadar Valley and the Berane Basin, as well as the earthquake of 1979 [76,77].
The Republic of North Macedonia covers an area of 25,713 km2 and is located in the central part of the Balkan Peninsula. Important road routes (corridors 8 and 10) pass through the territory of the state, with which the wider international community is connected. Since the Paleogene era, North Macedonia has been situated within the South Balkan extensional region, experiencing ongoing Neogene extension up to the present day. Its geological past is intricately connected with the North Anatolian fault and the southern Hellenic trench [78]. The intensity of earthquakes in Macedonia diminishes as the distance from the epicentre increases, influenced by the local geological characteristics. Soft geological conditions can lead to a maximum attenuation of 0.5 m, while hard geological conditions result in a minimum attenuation of 0.5 m [79].
In Macedonia, minor earthquakes occur frequently, while moderate earthquakes are relatively uncommon, and strong earthquakes are rare. These seismic events typically originate within the Earth’s crust at predominant hypocentral depths [80]. Seismic risk evaluations conducted for Macedonia’s airports, airfields, and flying fields indicate a 64% likelihood of surpassing peak ground acceleration thresholds, presenting a considerable hazard to aviation safety [81]. The primary seismic activity in North Macedonia is tectonic in nature, characterized by infrequent occurrences of moderate to significant earthquakes. This activity is predominantly attributed to North Macedonia’s geographical position within the Mediterranean region of the Alpine-Himalayan orogenic belt [82].
Seismic activity on the territory of North Macedonia is concentrated in several seismogenic areas which, in terms of the strength of the earthquakes that have occurred and are expected, are classified into categories of first, second, and third degree. The seismogenic sources of the first order are the regions where earthquakes with M = 6.1–7.8 have occurred, that is, where earthquakes with maximum magnitudes of M = 6.5–8.0 are expected. This category includes the regions of Berovo-Pehčevo, Valandovo, Skopje, and the Dream Zone. Seismogenic sources of the second order are the areas where earthquakes with a magnitude (M = 4.5–5.7) have occurred, that is, earthquakes with a maximum magnitude of M = 5.5–6.0 are expected. This category includes the regions of Pološka, Kičevska, Kočanska kotlina, and Kumanovska kotlina, as well as the Dojran-Gevgeli and Tikvesh-Mariovo regions. The seismogenic sources of the third order include the areas in which weak seismic activity has been registered, that is, areas where the occurrence of earthquakes has not been registered so far, but based on the tectonic parameters, they represent potential hotspots.
The catastrophic earthquake of 26 July 1963 in Skopje is a particularly rigorous example of extreme seismic danger. The number of victims of 1070 dead and 3300 injured persons and the damage to material goods on the National Income exceeded all previously known catastrophic earthquakes in the world. The strongest recorded earthquake in the history of Europe occurred in 1904 in today’s North Macedonia, Pehcevo—Kresna region on 4 April, with a magnitude of 7.8 M. In Skopje, on 26 July 1963, the strongest earthquake occurred with a magnitude of 6.1, where 1070 people lost their lives and tens of thousands were left homeless. On 11 September 2016, Skopje, now the capital and home of over 600,000 people, was hit with an earthquake (M = 5.3) with no casualties (Figure 2).

Figure 2.
Study area. Locations of Montenegro, North Macedonia, and Serbia.
The Republic of Serbia spans across 88,499 square kilometres, situated at the crossroads of central and southeastern Europe, encompassing the southern Pannonian Plain and the central Balkans. It shares boundaries with Hungary to the north, Romania to the northeast, Bulgaria to the southeast, North Macedonia to the south, Montenegro to the southwest, and Croatia and Bosnia and Herzegovina to the west. In a region characterized by moderate seismic activity, Serbia faces challenges in identifying active faults due to the irregular distribution of earthquakes in terms of frequency and magnitude [83,84,85]. Marović et al. [83] noted stronger intensity earthquakes (classified as I = VIII–IX) occurred between 1900 and 1970 in locations such as Rudnik mountain, Lazarevac municipality (part of the city of Belgrade), Juhor mountain, Krupanj town and municipality (in the Mačva district of western Serbia), Jagodina city (administrative centre of the Pomoravlje district in central Serbia), Vranje city (administrative centre of the Pčinja district in southern Serbia), and Vitina town and municipality (in eastern Kosovo). Since 1970, only three moderate-intensity earthquakes have occurred in Kopaonik mountain, Mionica town and municipality (in the Kolubara District of western Serbia), and Trstenik town and municipality (in the Rasina District of central Serbia) [6].
Lazarevac faces the highest seismic risk, having experienced an extreme earthquake (M = 6.1) in 1922. In the vicinity of Kraljevo, Serbia, home to over 100,000 people, an earthquake of M = 5.4 struck on 3 November 2010. Following this event, 258 earthquakes were recorded over the subsequent six days, ranging in magnitude from 1.0 to 4.4. Despite the moderate magnitude, the incident resulted in two fatalities, numerous injuries, and assessed damages to the city exceeding 100 million EUR [86]. Additionally, by the end of March 2011, the earthquake was succeeded by a sequence of over 650 aftershocks with magnitudes greater than 1.0 [6,87].
2.2. Socio-Economic and Demographic Characteristics
Using the snowball sampling technique (online questionnaire), a survey of 1245 respondents (Montenegro (n = 400), North Macedonia (n = 345), and Serbia (n = 500) was conducted from February 2023 to February 2024. The analysis of the sample by gender indicates that the sample of respondents from Montenegro has a relatively even distribution between males (49.3%) and females (50.7%). In contrast, the sample of respondents from North Macedonia had more females (57.1%) compared to males (42.9%). Similarly, like in North Macedonia, the sample from Serbia also has more females (57.6%) compared to males (42.2%). There is a diversity observed in the distribution of age groups among the samples from these countries. Concerning the age of the respondents, the analysis reveals a higher percentage of individuals aged 20 to 30 in North Macedonia (39.4%), surpassing the corresponding percentages in Montenegro (35.3%) and Serbia (36%) (Table 1).

Table 1.
Basic socio-economic and demographic information of Montenegro (n = 400), North Macedonia (n = 345), and Serbia (n = 500) respondents.
Analysis of the sample by respondents’ education level shows that there is the highest percentage of individuals with completed secondary education from Montenegro (39.8%), North Macedonia (51.01%), and Serbia (45%). In the sample from Montenegro, a higher percentage of individuals with a bachelor’s degree (36.5%) is covered compared to North Macedonia (28.9) and Serbia (30), which may reflect specificities in the education system or workforce. The sample from Serbia stands out with a significant percentage of individuals with a master’s degrees (11%), while the sample from North Macedonia indicates a higher percentage with higher education (8.7%) compared to bachelor’s degrees (Table 1).
The sample of respondents from Montenegro includes the highest percentage of singles (34.5%), while the sample from Serbia is comprised of the highest percentage of married individuals (43.2%). Additionally, the sample from North Macedonia shows a relatively high percentage of individuals in a relationship (29.5%). The sample from Montenegro (74.6%) includes a higher percentage of employed respondents compared to the sample from North Macedonia (46.7%) and Serbia (59.2%). About household income, the sample from Montenegro includes the highest percentage of respondents with household incomes exceeding 1000 EUR (46.8%), compared to samples from North Macedonia (33.9%) and Serbia (41.2%), where respondents with incomes between 700 and 1000 EUR are predominantly included (Table 1).
In the sample from North Macedonia, the highest percentage of respondents who are not parents is included (68.4%), compared to samples of respondents from Serbia (64%) and Montenegro (57.1%). According to the achieved success in high school, the sample from North Macedonia includes the highest percentage of respondents who achieved excellent performance (73.3%), compared to the sample of respondents from Serbia (55.4%). Additionally, in the sample from Montenegro, the highest percentage of respondents achieved good academic performance (17.5%). Concerning disability, the samples show a slight variation in terms of including respondents with some form of disability, for example, the sample from Montenegro (6.3%), the sample from North Macedonia (4.3%), and Serbia (6.2%) (Table 1).
2.3. Questionnaire Design
A structured survey instrument was devised (Appendix A), incorporating a blend of qualitative (closed-ended) multiple-choice queries and five-point Likert scales, as outlined by Joshi et al. [88] and Cvetković et al. [6,89]. The initial segment of the survey pertained to the demographic and socioeconomic profiles of the respondents, encompassing factors such as gender, age, and educational attainment. Subsequent sections addressed respondents’ perceptions regarding the safety of the household, supplies, shelter, special needs, local connectivity, and fire. Before the research implementation, a preliminary questionnaire test was conducted in different languages in Serbia (40 participants), Macedonia (25 participants), and Montenegro (35 participants). The preliminary testing was conducted using an online snowball sampling approach. It is crucial to emphasize that our research adhered to the principles outlined in the Helsinki Declaration, which provides guidelines for socio-medical research involving human subjects. Additionally, all participants provided informed consent before participating in the study, accepting the terms to participate in its implementation. The research protocol was approved by the Scientific-Professional Society for Disaster Risk Management, Scientific Research Group Review, ID—01022024.
2.4. Analyses
To conduct a comparative analysis and prediction of earthquake preparedness in Montenegro, North Macedonia, and Serbia, various statistical analyses such as t-tests, one-way ANOVA, Pearson’s correlation, and multivariate linear regression were utilized. Given that the initial test for variance homogeneity showed a violation of the assumption of variance homogeneity, the results of two tests—Welsh and Brown–Forsythe—were considered, as they are robust to such violations. Additionally, it is important to note that all tests were two-tailed, with a significance level set at p < 0.05. The statistical analysis was conducted using SPSS software (IBM SPSS Statistics, Version 26, New York, NY, USA).
3. Results
The findings of the research are illustrated in three aspects: the predictors of earthquake preparedness in Montenegro, North Macedonia, and Serbia; comparative analysis of perceptions and preparedness levels for earthquake disasters across Montenegro, North Macedonia, and Serbia; and influences of demographic and socioeconomic factors on perceptions and preparedness levels for earthquake disasters across Montenegro, North Macedonia, and Serbia.
3.1. The Predictors of Earthquake Preparedness in Montenegro, North Macedonia, and Serbia
The paper is based on the central hypothesis that the most significant predictor of earthquake preparedness in Montenegro, North Macedonia, and Serbia is age, followed by gender, education, marital status, employment, income, and disability. Multivariate regression analysis was used to determine the extent to which five scores of the subscales (household preparedness, community preparedness, disaster preparation, earthquake risk awareness, reinforced house) were associated with seventh demographic and socio-economic variables: gender, age, education, marital status, employment, income, and disability. The conducted analysis indicated that the assumptions regarding normal distribution, linearity, multicollinearity, and variance homogeneity were upheld and not breached, which is an important assumption in this type of analysis (Table 2).
Table 2.
Results of a multivariate regression analysis concerning earthquake preparedness in Montenegro, North Macedonia, and Serbia (n = 1245).
The outcomes of the multivariate regressions concerning the household preparedness subscale reveal that the primary predictor of significance is age (β = 0.35), explaining 6.81% of the variance in household preparedness. This is followed by education level (β = −0.13, 1.48%). The remaining predictors (e.g., gender, marital status, employment, income, and disability) were not significantly affected by household preparedness. This model (R2 = 0.14, Adj. R2 = 0.13, F = 14.02, t = 19.51, p < 0.01) with all mentioned independent variables explains the 13% variance of household preparedness (Table 2).
In further analyses, regarding community preparedness, analyses revealed that the most significant predictor was age (β = 0.21), explaining 2.5% of the variance in community preparedness. This is followed by education (β = −0.12, 1.5%), and gender (β = 0.10, 1.3%). The remaining predictors (e.g., marital status, employment, income, and disability) were not significantly affected by community preparedness. This model (R2 = 0.09, Adj. R2 = 0.08, F = 8.87, t = 16.83, p < 0.01), incorporating all specified independent variables, elucidates 8% of the variance in household preparedness (Table 2).
Moreover, regarding disaster preparation, analyses revealed that the most significant predictor was education (β = 0.069), explaining 0.9% of the variance in disaster preparation. This is followed by gender (β = −0.049, 0.6%), and employment (β = −0.040, 0.5%). The remaining predictors (e.g., age, marital status, income, and disability) were not significantly affected by disaster preparation. This model (R2 = 0.03, Adj. R2 = 0.02, F = 8.87, t = 3.08, p < 0.01), incorporating all specified independent variables, elucidates 2% of the variance in disaster preparation (Table 2).
Regarding earthquake risk awareness, analyses revealed that the most significant predictor was age (β = −0.21), explaining 2.89% of the variance in earthquake risk awareness. This is followed by education (β = −0.19, 2.5%) and income (β = −0.04, 2.4%). The remaining predictors (e.g., gender, marital status, employment, and disability) were not significantly affected by earthquake risk awareness. This model (R2 = 0.09, Adj. R2 = 0.08, F = 8.87, t = 16.83, p < 0.01), incorporating all specified independent variables, elucidates 8% of the variance in earthquake risk awareness (Table 2).
Furthermore, analyses regarding reinforced houses revealed that the most significant predictor was gender (β = 0.13), explaining 2.5% of the variance in reinforced houses. This is followed by education (β = −0.12, 2.2%) and employment (β = 0.07, 0.04%). The remaining predictors (e.g., marital status, age, income, and disability) were not significantly affected by earthquake risk awareness. This model (R2 = 0.08, Adj. R2 = 0.07, F = 7.66, t = 20.84, p < 0.01), incorporating all specified independent variables, elucidates 7% of the variance in earthquake risk awareness (Table 2).
Analysing the obtained results, it is noticeable that age appears as a predictor in various aspects of earthquake-induced disaster preparedness and awareness in most models. Such results confirm the importance of the respondents’ age in determining the levels of preparedness and awareness of earthquakes. The second most significant predictor, quantitatively observed across the models, is education level. The third most significant predictor, quantitatively observed across the models, varies depending on the aspect of disaster preparedness (gender; preparation employment) and awareness (income) being examined.
3.2. Comparative Analysis of Perceptions and Preparedness Levels for Earthquake Disasters across Montenegro, North Macedonia, and Serbia
Examining respondents’ perceptions of household preparedness for earthquake-related disasters yielded interesting and diverse results. Overall, in North Macedonia, respondents recorded the highest ratings (M = 3.52) for household preparedness for earthquakes, compared to Montenegro (M = 2.98) and Serbia (M = 3.26), where the lowest ratings were recorded. In contrast, regarding the perception of the community’s preparedness level for earthquakes, Serbian respondents recorded slightly higher scores (M = 2.95) compared to respondents from Macedonia (M = 2.74) and Montenegro (M = 2.49), where the lower values were noted (Table 3).
Table 3.
Perceptions regarding household preparedness inquiries for disasters caused by earthquakes in Montenegro, Macedonia, and Serbia (n = 1245).
The perception of potential damage to buildings (houses, apartments, etc.) due to earthquakes shows similar levels of concern in all countries (Serbia M = 3.13; Montenegro M = 2.92), with a slight tendency for slightly higher concern in North Macedonia (M = 3.15). Also, the levels of knowledge about geological layers in areas where respondents’ homes are located are relatively similar (Montenegro M = 2.35; North Macedonia M = 2.30; Serbia M = 2.28). When comparing the results of examining the resilience of buildings, it is generally concluded that the ratings are lower, with the lowest recorded among respondents from Montenegro (7.5%), followed by Serbia (13.2%), while the highest scores were recorded among respondents from North Macedonia (18.6%).
Considering the importance of strengthening buildings to make them more resistant to earthquake shaking, the results show that such measures are most implemented in North Macedonia (M = 3.18), followed by Montenegro (M = 2.97), and was least in Serbia (M = 1.88). In terms of the importance of securing furniture to prevent injuries, it was found that such measures are most undertaken in North Macedonia (5.5%), followed by Montenegro (16%), while the least are undertaken in Serbia (13.2%) (Table 3).
Further analysis of the obtained results shows that respondents from Montenegro rate the preparedness of their households with lower scores compared to North Macedonia. On the other hand, their ratings regarding the preparedness of the local community and concerns about possible earthquake-related damage are within the mid-range of the observed values. In contrast, respondents from North Macedonia recognize the importance and necessity of preparing households for earthquakes the most, as evidenced by the highest recorded score. Additionally, they have the highest level of concern about potential damage and the highest tendency to take measures to strengthen buildings to prevent earthquake-related damage. Respondents from Serbia show an average level of household preparedness for earthquakes, with slightly higher concerns about possible damage. Also, it is observed that, according to respondents’ ratings, the most furniture is secured in this country. However, the fact remains that lower scores for strengthening buildings are recorded (Table 3).
Overall, respondents from North Macedonia stand out for their high ratings of household preparedness level, while respondents from Serbia express higher concern about damage and lower scores for strengthening buildings. Moreover, respondents from Montenegro fall somewhere between these two countries in the analysed different aspects.
The data on participants’ perceptions about essential survival supplies in earthquake-induced disasters in the regions of Montenegro, Macedonia, and Serbia are presented in Table 4. The following variables are covered: prepared emergency kit; examined emergency kit contents; easily accessed emergency kit; other emergency supplies; emergency supplies rating; and community emergency supplies. Regarding the possession of an emergency kit, the results indicate that respondents from North Macedonia rate the highest ownership (64.1%), followed closely by respondents from Serbia (48.8%), and the lowest percentage comes from Montenegro (40%). In contrast, when it comes to examining the contents of the emergency kit, the obtained results show that respondents from Serbia are most likely to have done so (62%), followed by respondents from North Macedonia (44.1%), while respondents from Montenegro do this to the least extent (33.5%). Furthermore, examining the ease of access to the emergency kit, it was found that respondents from Serbia rate the ease of access the highest (64%), followed by respondents from North Macedonia (62.9%), and finally, respondents from Montenegro (35.3%) (Table 4).
Table 4.
Perceptions about essential supplies for earthquake disasters in Montenegro, Macedonia, and Serbia (n = 1245).
In the context of other supplies that may be crucial for survival, the achieved results illustrate that respondents from North Macedonia most frequently possess such supplies (54.5%), followed by respondents from Serbia (48%), and the least possession is observed among respondents from Montenegro (27.3%). Providing the opportunity for respondents to rate their emergency supplies, it was found that respondents from Montenegro do this most frequently (57.3%), followed by respondents from Serbia (49%), and North Macedonia (57.3%). Recognizing the importance of possessing communal supplies for emergencies, it was established that respondents from Serbia most frequently rate the possession of such supplies (52%), followed by respondents from Montenegro (10%), and finally, respondents from North Macedonia (8.1%) (Table 4).
The conducted analysis of comparative data on preparedness for potential earthquake-induced disasters unequivocally points to differences in the perceptions of respondents from Montenegro, North Macedonia, and Serbia. Based on these findings, distinct priorities and attitudes can be observed among respondents in the different observed countries, highlighting the need for targeted interventions. Respondents from Montenegro stand out with a high percentage of positive ratings for emergency supplies, while respondents from North Macedonia are recognized for high ratings in the possession of other emergency supplies. On the other hand, respondents from Serbia led in the evaluation of communal emergency supplies at the local level.
Through further analyses, the perception regarding the adequacy of shelter during earthquake disasters was examined in Montenegro, Macedonia, and Serbia. On this occasion, it was established that respondents from Serbia, to the greatest extent (25.2%), assess that they have a designated shelter, followed by respondents from North Macedonia (18.9%), and finally from Montenegro (16%). It is crucial to highlight that overall, the assessments of having a designated shelter are very low, which could have serious safety implications. Additionally, it was found that respondents from North Macedonia predominantly perceive having a clearly defined route to the shelter (37.1%), followed by respondents from Serbia (25.6%), and lastly, respondents from Montenegro (15.8%). Regarding obstacles on the way to the shelter, respondents from Montenegro highlight their existence the most (66.9%), followed by respondents from North Macedonia (15%), and finally, from Serbia (14.5%). Interestingly, in terms of alerting neighbours before evacuation, the highest percentage of positive responses was recorded among respondents from Serbia (94%), followed by respondents from Montenegro (76.8%) and from North Macedonia (75.7%). Examining the conditions and state in designated shelters, the results indicate generally low ratings, while respondents from Serbia give the most positive ratings (23.6%). Subsequently, respondents from North Macedonia (18.6%) and Montenegro (9.5%) followed. Lastly, regarding the assessment of shelter management, the highest ratings were identified in Serbia (17.4%), while the lowest was recorded in Montenegro (6.8%) (Table 5).
Table 5.
Perceptions regarding the adequacy of shelter during earthquake disasters in Montenegro, Macedonia, and Serbia (n = 1245).
Analysis of perceptions regarding special needs during earthquake disasters in Montenegro, North Macedonia, and Serbia shows that the highest percentage of respondents (62.6%) from North Macedonia indicate awareness of which individuals require special care in disaster conditions. Following them are respondents from Serbia (56%) and finally from Montenegro (32.8%). Subsequently, it was found that respondents from Serbia (43.6%) are most aware that the majority of casualties and injuries occur among the older population. Respondents from Montenegro and North Macedonia show lower levels of awareness of these issues (29.7% and 27%, respectively). Furthermore, respondents from Serbia (31.2%) emphasize the most that there is someone in their family who could not evacuate alone in the event of an earthquake, while respondents from Montenegro and North Macedonia highlight this less (24.3% and 27%, respectively) (Table 6).
Table 6.
Perceptions regarding special needs during earthquake disasters in Montenegro, Macedonia, and Serbia (n = 1245).
When investigating knowledge about where elderly individuals, people with disabilities, and infants live in their community, the ratings are relatively low in the observed countries. The lowest awareness of such circumstances is recorded among respondents from Montenegro (M = 2.88), while respondents from North Macedonia and Serbia expressed slightly higher ratings (M = 3.20 and M = 3.18, respectively). Regarding knowledge of how to communicate with deaf or hearing-impaired individuals, similar results to previous surveys were identified, where the lowest ratings were recorded in Montenegro (M = 2.49), while slightly higher values were noted in North Macedonia and Serbia (M = 2.82 and M = 3.28, respectively). In contrast, respondents from Serbia, to the greatest extent (M = 4.15), emphasize that they know what assistance older individuals, people with disabilities, and infants require, unlike respondents from Montenegro (M = 2.89) and North Macedonia (M = 3.28) (Table 6).
Starting from the importance of preparatory activities, respondents were asked whether they had participated in preparing the local community for disasters. On this occasion, similar lower ratings were found among the observed countries. Among respondents from Serbia, the highest preparedness rating was recorded (M = 2.14), followed by respondents from North Macedonia (M = 2.08), and finally, respondents from Montenegro (M = 1.95). Additionally, the survey results show that respondents from Serbia demonstrated the highest level of earthquake risk awareness (M = 2.93), while it was the lowest among respondents from Montenegro (M = 2.57), with respondents from North Macedonia falling in between (M = 2.85) (Table 7).
Table 7.
Perceptions regarding local connectivity in communities during earthquake disasters in Montenegro, Macedonia, and Serbia (n = 1245).
Furthermore, the level of perception regarding whether neighbours can self-rescue in earthquakes was examined. The lowest rating was recorded among respondents from Montenegro (M = 2.95), followed by respondents from North Macedonia (M = 3.20), and the highest rating was recorded among respondents from Serbia (M = 3.26). Regarding a designated person for implementing disaster preparedness activities at the local level, the results show that the majority of respondents from Serbia (38.4%) believe that such a person exists, followed by respondents from Montenegro (20.3%) and North Macedonia (15.1%). As for communication about disasters at the local level, the highest number of respondents (M = 2.31) from North Macedonia indicated the existence of such communication, while in other countries, Montenegro and Serbia, respondents gave lower ratings for such communication (M = 2.28 and M = 2.13, respectively) (Table 7).
In Serbia, the majority of respondents (46%), compared to respondents from Montenegro (36.8%) and North Macedonia (23.2%), believe that there is a disaster preparedness advisor in their local community. Furthermore, it was found that the level of communication among people is highest among respondents from Serbia (M = 4.23), followed by respondents from North Macedonia (M = 3.85) and Montenegro (M = 3.31). Additionally, respondents from Serbia demonstrated the highest values (M = 3.22) in rating the likelihood of businesses assisting in disasters, followed by respondents from North Macedonia (M = 2.86) and Montenegro (M = 2.80) (Table 7).
In the analysis of perceptions regarding local connectivity in the community during earthquake disasters, Table 8 provides insights into various variables in Montenegro, Macedonia, and Serbia. According to the obtained results, respondents from Serbia, to the highest extent (69.6%), emphasised that they know how to use a fire extinguisher, followed by respondents from North Macedonia (66.1%) and Montenegro (41.8%). Similar results are observed when it comes to owning a home fire extinguisher. Namely, respondents from Serbia, to the highest extent (34.4%), highlight that they have such a device in their households, followed by respondents from North Macedonia (30.1%) and Montenegro (18.5%).
Table 8.
Perceptions regarding local connectivity in communities during earthquake disasters in Montenegro, Macedonia, and Serbia (n = 1245).
Conversely, respondents from North Macedonia, to the highest extent (M = 2.35), emphasised that they knew the location of the hydrant network in their surroundings, followed by respondents from Montenegro (M = 2.33) and Serbia (M = 2.14). For the term “initial fire suppression,” respondents from Serbia had heard it the most (M = 2.88), followed by respondents from North Macedonia (M = 2.70) and Montenegro (M = 2.29). Also, the proximity of the house is highest in Serbia, according to respondent ratings (M = 3.60), followed by respondents from Montenegro (M = 3.06) and North Macedonia (M = 2.98). Access to fire trucks is most highly rated by respondents from North Macedonia (82.6%), followed by respondents from Serbia (80%) and Montenegro (69.5%). The frequency of improper parking is most highly rated by respondents from North Macedonia (M = 4.28), with similar lower results recorded among respondents from Montenegro (M = 4.16) and Serbia (M = 4.16) (Table 8).
Overall, respondents from Serbia scored higher in terms of awareness and preparedness regarding fire safety measures, fire truck access, and home fire extinguisher ownership. However, on the other hand, respondents from Montenegro show lower scores in various categories, while respondents from North Macedonia often fall between these two extremes.
The results indicate significant variations in the perception and preparedness for fire safety measures among respondents from Serbia, Montenegro, and North Macedonia. Accordingly, respondents from Serbia stood out as the most aware and best prepared regarding fire safety measures, including owning household fire extinguishers, access to fire trucks, and overall awareness of fire safety. Such results may stem from more developed infrastructure systems and a greater emphasis on fire safety education in Serbia [90].
In contrast, respondents from Montenegro showed lower scores in various categories. This could be attributed to a lack of resources, less developed infrastructure, or lesser awareness of the importance of fire safety in that country [91]. Respondents from North Macedonia often fell in between these two extremes. This could be a result of sociocultural differences, levels of economic development, and the availability of resources for implementing fire safety measures [92].
3.3. Influences of Demographic and Socioeconomic Factors on Perceptions and Preparedness Levels for Earthquake Disasters across Montenegro, North Macedonia, and Serbia
One-way ANOVA findings demonstrated the relationship between education status and the following variables: household preparedness level (p = 0.001); community preparedness level (p = 0.001); the damaged house (p = 0.002); geological knowledge level (p = 0.006); reinforced house (p = 0.001); places for vulnerable groups (p = 0.030); guide for impairments (p = 0.001); support for vulnerable (p = 0.001); disaster preparation (p = 0.001); earthquake risk awareness (p = 0.001); businesses helpfulness (p = 0.036); and hydrant usage (p = 0.009). No statistically significant correlation was found with other variables (Table 9).
Table 9.
One-way ANOVA results between education, marital status, employment, income level, ownership of property, and dependent variables of perceptions and preparedness levels for earthquake disasters across Montenegro, North Macedonia, and Serbia (n = 1245).
Extended analysis indicated that respondents with postgraduate studies provided higher scores for household preparedness (M = 4.18; SD = 1.01) compared to those with respondents who completed secondary school (M = 2.83; SD = 1.21). Moreover, respondents with postgraduate studies provided higher scores for community preparedness (M = 3.82; SD = 1.44) compared to those with respondents who completed secondary school (M = 2.48; SD = 1.30). Also, respondents with this level of education more extensively assess their participation in preparatory activities for earthquakes-induced disasters (M = 2.47; SD = 1.48) compared to respondents who have completed secondary school (M = 1.91; SD = 1.41). The extended analysis revealed that respondents with postgraduate studies gave higher scores for household preparedness (M = 4.18; SD = 1.01) compared to those who completed secondary school (M = 2.83; SD = 1.21).
Respondents who completed higher education give higher scores for potential future damages due to earthquakes (M = 3.84; SD = 1.22) compared to respondents who have completed secondary school (M = 3.17; SD = 1.29). Also, respondents who completed higher education more strongly believe that buildings are constructed with reinforced concrete (M = 3.50; SD = 1.20) compared to respondents who completed secondary school (M = 3.13; SD = 1.38). Furthermore, the results indicate that respondents who completed higher education more significantly (M = 3.83; SD = 1.29) highlight that they know where older and disabled individuals live in the local community compared to respondents who have completed secondary school (M = 3.07; SD = 1.59). Similarly, they more significantly (M = 3.44; SD = 1.55) assess their knowledge of dealing with the deaf and mute compared to respondents who completed secondary education (M = 2.50; SD = 1.86). Regarding awareness of earthquake-induced disaster risks, the results show that respondents who completed higher education (M = 3.67; SD = 1.32) more significantly evaluate their level of awareness compared to respondents who completed secondary school (M = 2.67; SD = 1.35). Additionally, these respondents more significantly (M = 3.58; SD = 1.12) assess the role and importance of businesses in such situations, compared to respondents who completed postgraduate studies (M = 2.71; SD = 1.05).
On the contrary, respondents who completed secondary school give higher scores for knowledge of geological layers in the area where their house/apartment is located (M = 2.50; SD = 1.69) compared to respondents who completed higher education (M = 2.33; SD = 1.32) and those who completed university degrees (M = 1.88; SD = 1.17). Additionally, respondents who completed secondary education more significantly assessed their knowledge of dealing with the deaf and mute (M = 4.51; SD = 1.01) compared to respondents who completed university degrees (M = 4.09; SD = 1.05).
Through further analyses, it has been determined that there is a correlation between employment status and the following variables: household preparedness level (p = 0.001); community preparedness level (p = 0.004); the damaged house (p = 0.001); geological knowledge level (p = 0.001); the reinforced house (p = 0.001); places for vulnerable groups (p = 0.034); a guide for impairments (p = 0.023); communication about disasters (p = 0.028); businesses helpfulness (p = 0.007); and improper parking frequency (p = 0.001). Contrary to that, no statistically significant correlation was identified with any other variables (Table 9). Unemployed participants to a greater extent (M = 3.03; SD = 1.32) compared to employed participants rate the preparedness of their household (M = 3.44; SD = 1.13). Additionally, unemployed participants to a greater extent (M = 2.96; SD = 1.20) compared to employed participants (M = 2.64; SD = 1.19) evaluate the preparedness of their municipality to respond to earthquakes-induced disasters.
In contrast, employed participants to a greater extent (M = 3.57; SD = 1.11) compared to the unemployed (M = 2.81; SD = 1.15) believe that their house/apartment will be damaged in a future earthquake. Also, employed participants (M = 2.55; SD = 1.53) more so than unemployed participants (M = 2.11; SD = 1.32) are familiar with the geological layers in the area where their home is located. Furthermore, employed participants (M = 3.34; SD = 1.62) more than the unemployed (M = 3.05; SD = 1.39) are familiar with the locations of elderly and disabled individuals in the local community. Moreover, they were more often (M = 4.28; SD = 1.02) compared to the unemployed participants (M = 4.05; SD = 1.12) indicating knowing how to interact with the deaf and mute. Additionally, they are more likely (M = 3.49; SD = 1.24) compared to the unemployed participants (M = 3.09; SD = 2.81) to believe that businesses can assist in such situations. They also note (M = 4.43; SD = 1.02), more frequently than the unemployed (M = 3.97; SD = 1.44), seeing improperly parked vehicles.
Then, it was determined that there is a connection between income level and the following variables: household preparedness level (p = 0.029); community preparedness level (p = 0.007); the damaged house (p = 0.034); geological knowledge level (p = 0.001); a guide for impairments (p = 0.003); support for the vulnerable (p = 0.001); earthquake risk awareness (p = 0.001); neighbours self-rescue ability (p = 0.001); businesses helpfulness (p = 0.001); hydrant usage (p = 0.001); and improper parking frequency (p = 0.001). In contrast, no statistically significant correlation was observed with any other variables (Table 9).
Through further analyses, it has been determined that participants with incomes ranging from 700 to 1000 EUR rated household preparedness for earthquakes the least (M = 3.13; SD = 1.20) compared to those with incomes up to 450 EUR (M = 3.20; SD = 1.14) and participants with incomes ranging from 450 to 700 EUR (M = 3.30; SD = 1.25). Furthermore, it was found that participants with incomes over 1000 EUR rated community preparedness the least (M = 2.57; SD = 1.26) compared to those with incomes ranging from 700 to 1000 EUR (M = 3.10; SD = 1.19). On the other hand, participants with incomes from 700 to 1000 EUR mostly believed that their houses would be damaged due to earthquakes (M = 3.27; SD = 1.10) compared to those with incomes up to 450 EUR (M = 3.00; SD = 1.15). Regarding geological layers beneath their houses, participants with incomes over 1000 EUR were mostly familiar with them (M = 3.20; SD = 1.41) compared to those with incomes up to 450 EUR (M = 2.04; SD = 1.47). Additionally, participants with incomes over 1000 EUR mostly knew how to communicate with the deaf and mute (M = 4.50; SD = 1.00) compared to those with incomes from 450 to 700 EUR (M = 4.02; SD = 1.10). The same category of participants with incomes over 1000 EUR mostly provided support to such individuals (M = 3.50; SD = 1.15) compared to those with incomes up to 450 EUR (M = 3.10; SD = 1.08). Conversely, participants with incomes over 1000 EUR least believed that residents were aware that an earthquake could occur (M = 2.77; SD = 1.06) compared to those with incomes ranging from 700 to 1000 EUR (M = 3.18; SD = 1.14). Participants with incomes up to 450 EUR mostly believed that neighbours could self-rescue during earthquakes (M = 3.56; SD = 1.21) compared to those with incomes over 1000 EUR (M = 3.13; SD = 1.12). Additionally, participants with incomes up to 450 EUR mostly believed that businesses were of great help during such disasters (M = 3.60; SD = 1.06) compared to those with incomes over 1000 EUR (M = 2.67; SD = 1.17). Finally, it was found that participants with incomes over 1000 EUR mostly reported seeing improperly parked vehicles (M = 4.43; SD = 1.12) and knew the locations of fire extinguishers (M = 3.90; SD = 1.15) compared to other participants.
By analysing further results, we have determined that there is a correlation between ownership of the property and the following variables: reinforced house (p = 0.002); places for vulnerable groups (p = 0.030); guide for impairments (p = 0.001); support for the vulnerable (p = 0.012); and earthquake risk awareness (p = 0.005). In contrast, no statistically significant correlation was observed with any other variables (Table 9).
Further data analysis revealed that respondents living in a house/apartment owned by a family member (M = 3.38; SD = 1.17) are more likely compared to those living in rented accommodations to point out that buildings are constructed of reinforced concrete (M = 3.00; SD = 1.32). On the other hand, respondents living in personally owned houses/apartments (M = 3.28; SD = 1.26) are more likely compared to those living in rented accommodations (M = 2.52; SD = 1.36) to know where elderly and disabled individuals reside in the community. In contrast, respondents living in rented houses/apartments (M = 3.34; SD = 1.34) are more aware of earthquake risks compared to those living in houses/apartments owned by family members (M = 2.52; SD = 1.36). Furthermore, respondents living in rented houses/apartments (M = 4.47; SD = 1.07) are more knowledgeable about how to interact with the deaf and mute compared to those living in houses/apartments owned by family members (M = 4.08; SD = 1.15).
Examining the correlation between marital status and the observed variables, a connection has been identified with the following: household preparedness level (p = 0.001); community preparedness level (p = 0.001); the damaged house (p = 0.001); geological knowledge level (p = 0.001); a guide for impairments (p = 0.001); support for the vulnerable (p = 0.001); disaster preparation (p = 0.001); communication about disasters (p = 0.001); and improper parking frequency (p = 0.001). In contrast, no statistically significant correlation was observed with any other variables (Table 9).
Respondents who are in a relationship (M = 3.82; SD = 1.03) are more likely compared to those who are engaged (M = 2.00; SD = 1.00) to assess the level of household preparedness for earthquakes. Participants who are in a relationship (M = 3.21; SD = 1.18) are more likely compared to those who are married (M = 2.49; SD = 1.23) to assess the level of preparedness of the local community for disasters. In contrast, participants who are not in a relationship (M = 2.37; SD = 1.13) are more likely compared to engaged participants (M = 1.00; SD = 1.01) to indicate familiarity with the geological layers of the area where their house/apartment is located. Participants who are in a relationship (M = 3.56; SD = 1.24) are more likely compared to engaged participants (M = 2.00; SD = 1.02) to indicate knowing how to interact with the deaf and mute. Married participants (M = 3.55; SD = 1.23) are more likely compared to those in a relationship (M = 2.90; SD = 1.00) to believe that their house/apartment will be damaged due to earthquakes, whereas engaged participants (M = 4.50; SD = 1.00) are more likely compared to those in a relationship (M = 2.02; SD = 1.32) (Table 5).
The results of Pearson’s correlation indicate that there is a significant relationship between age and various factors related to household preparedness level (r = −0.242); community preparedness level (r = −0.283); the damaged house (r = 0.278); the reinforced house (r = 0.126); support for the vulnerable (r = 0.221); participation—disaster preparation (r = −0.101); businesses helpfulness in disasters (r = 0.183); and initial fire suppression (r = 0.149). No significant correlation was found between age and the following variables: geological knowledge level; places for vulnerable groups; a guide for impairments; earthquake risk awareness; neighbours’ self-rescue ability; communication about disasters; communication with neighbours; hydrant usage; and improper parking frequency (Table 10).
Table 10.
Pearson’s correlation results for the dependent variables of perceptions and preparedness levels for earthquake disasters across Montenegro, North Macedonia, and Serbia (n = 1245), and the age of the respondents.
Through further analysis, it has been determined that as the age of the respondents increases, the rating of household and community preparedness for earthquakes decreases. Additionally, it has been found that with the increase in the age of the respondents, there is a decrease in the rating of awareness regarding the locations where elderly, disabled individuals, and infants live in their community, as well as participation in local disaster preparedness activities for earthquakes. Contrary to this, the analysis shows that with the increase in the age of the respondents, there is an increase in the rating of potential house damage due to earthquakes, the rating of house reinforcement, awareness of the assistance needed by older individuals, disabled individuals, and infants, emphasis on business assistance in disaster conditions, as well as the rating of knowledge of initial fire suppression measures.
The chi-square test results obtained indicate a statistically significant association of disaster fear with the following variables: household preparedness level; community preparedness level; damaged house; geological knowledge level; reinforced house; other emergency supplies; emergency supplies rating; community emergency supplies; designated shelter nearby; route to shelter; obstacle on route to shelter; neighbour alert before evacuation; special care needed; elderly killed injured; places for vulnerable groups; a guide for impairments; support for the vulnerable; participation—disaster preparation; earthquake risk awareness; neighbours self-rescue ability; fire extinguisher usage; and home fire extinguisher (Table 11).
Table 11.
Chi-square test results between fear of disasters and disability, and dependent variables of perceptions and preparedness levels for earthquake disasters across Montenegro, North Macedonia, and Serbia (n = 1245).
Extended analysis of the acquired results reveals that respondents who experience a higher level of fear of disasters (68.4%) tend to assess household preparedness for responding to earthquakes more favourably. Additionally, they more frequently evaluate their knowledge of geological layers in their living area (34%) and emphasize that buildings in their surroundings are constructed with reinforced concrete, providing extra resilience to earthquakes (49.4%). They also report having additional supplies significant for surviving such events (44.3%), believe their supplies are sufficient (11.4%), are aware of the locations in their community where vulnerable populations reside (45.6%), recognize the earthquake risks (48.1%), believe their neighbours can independently secure themselves before the arrival of first responders (51.9%), are knowledgeable about operating a fire extinguisher (81%), and possess a fire extinguisher (45.6%).
Contrastingly, respondents who do not experience fear of disasters more extensively assess the readiness of the local community (15.2%) to respond to earthquakes. Furthermore, they more frequently emphasize the likelihood of their house/apartment being damaged due to earthquakes (49.2%). They evaluate that their local community possesses supplies for such disasters (66.7%), highlight knowing their designated shelter (26.3%), emphasize knowing the route to their shelter (19.3%), stress uncertainty about the existence of obstacles to their shelter (91.2%), know the condition of shelters (28.1%), are aware of who manages the shelters (10.5%), assess that they know which people require special care in such disaster conditions (61.4%), and evaluate that they know that the majority of casualties belong to the elderly population (61.4%). They know how to interact with the deaf and mute (45.6%), participate in disaster preparedness (19.3%), and believe that businesses play a significant role in such situations (59.9%).
Also, the chi-square test results obtained indicate a statistically significant association of disability with the following variables: reinforced house; obstacle on route to shelter; special care needed; places for vulnerable groups; guide for impairments; earthquake risk awareness; communication about disasters; hydrant usage; initial fire suppression; and house proximity (Table 11).
Further examination of the obtained results indicates that respondents without disabilities more frequently emphasize that their house/apartment is constructed with reinforced concrete (72.7%), believe that buildings in their surroundings are built with reinforced concrete (43.2%), know which individuals require special care (56.3%), know where older and disabled individuals reside in the community (43.3%), know how to interact with the deaf and mute (45.8%), have heard of the term “initial fire suppression” (37.6%), believe that houses are too close to each other (50.6%), and observe improperly parked cars (75.6%).
On the other hand, individuals with disabilities more often believe that there are no obstacles on the way to shelters (89%), are more aware of earthquake risks (66.7%), engage in conversations with people about disasters (33.3%), know the location of fire extinguishers (91%), and are proficient in using a fire extinguisher (95%).
The provided Table 12 presents the results of independent samples t-tests conducted to analyse the statistical significance between gender and various variables related to perceptions and preparedness levels for earthquake disasters across Montenegro, North Macedonia, and Serbia. The outcomes of the t-test imply a statistically significant difference between males and females in terms of community preparedness level (p = 0.001); reinforced house (p = 0.024); and communication with neighbours (p = 0.030). There was no statistically significant association of gender with other variables (Table 7).
Table 12.
Independent samples t-test results between gender and variables of perceptions and preparedness levels for earthquake disasters across Montenegro, North Macedonia, and Serbia (n = 1245).
Further analyses revealed that female participants (M = 2.67) generally perceive lower community preparedness for earthquake-induced disasters compared to male participants (M = 3.07). In contrast, male participants (M = 3.45) perceive a higher level of earthquake-resistant house reinforcement compared to female participants (M = 3.19). Regarding communication about disasters with neighbours, female participants (M = 2.22) communicate more extensively with neighbours about earthquake-induced disasters compared to male participants (M = 1.97) (Table 12).
4. Discussion
Earthquake-induced disasters, which cannot be predicted, pose a significant threat to human lives, the environment, and built infrastructure. To analyse citizens’ preparedness for earthquakes in Montenegro, North Macedonia, and Serbia, a comparative quantitative research study was conducted to identify the levels and predictors of preparedness for such events. Overall, in North Macedonia, respondents recorded the highest ratings for household preparedness for earthquakes, compared to Montenegro and Serbia, where the lowest ratings were recorded.
The obtained results illuminate significant differences in disaster preparedness perceptions among respondents from North Macedonia, Serbia, and Montenegro. Specifically, respondents from North Macedonia stand out for their high ratings of household preparedness level. It can be assumed that traditional values of solidarity and collective action during disasters may be more prevalent in North Macedonia, which could contribute to greater engagement of the population in disaster preparedness [93,94,95]. The fresh memories of the consequences of the catastrophic earthquake in Skopje from 1963 must also be emphasized, as well as the overall seismic activity in north Macedonia, which is highlighted. Furthermore, it is significant to emphasize that all three states, from the Second World War until the 1990s, were part of one Socialist Federal Republic of Yugoslavia [96]. Additionally, the high level of preparedness in North Macedonia may result from greater social cohesion [97], traditional knowledge transmission practices [98], and heightened awareness of risks [99]. On the other hand, lower readiness scores in Serbia and Montenegro may be a result of economic instability [100], lack of resources for preventive measures [101], and insufficient awareness among the population of how to adequately prepare for disasters [102].
On the other hand, respondents from Serbia express higher concern about the potential damage caused by earthquakes and give lower ratings for the degree of building reinforcement. It can be assumed that in Serbia, there is a deeply ingrained awareness of the historical significance of earthquakes and their potentially devastating impact on communities [103,104,105]. This awareness may stem from cultural narratives and historical stories passed down through generations [106]. Lower ratings for the degree of building reinforcement can be explained by socio-economic aspects reflected in the lack of funds for construction and additional strengthening of various infrastructures [107]. Moreover, economic instability can greatly hinder the implementation of long-term plans to improve building resilience [108].
Contrary to this, respondents from Montenegro fall somewhere between these two countries in the analysed aspects. It is crucial to note that political and institutional factors can also influence the perception of readiness for disasters [109]. Certainly, it can be emphasized that the effectiveness of institutions responsible for disaster risk management may vary between these countries [110], which can impact the population’s perception of their ability to adequately cope with disasters.
Further results indicate that respondents from Montenegro largely evaluate the possession of disaster supplies, which may indicate an awareness of the importance of preparedness for potential disasters in that country. Additionally, high values may suggest that households are adequately equipped with the necessary materials and resources to respond in case of disasters [111]. On the other hand, respondents from North Macedonia have indicated possession of other emergency supplies. This may include additional resources such as medical equipment, tools, or other necessary materials useful in disasters. Such results can be explained by careful planning and preparation of households for various disaster scenarios [112]. In contrast, respondents from Serbia led in evaluating general emergency supplies at the local level. This may indicate the effectiveness of local institutions and organizations in providing resources and support to communities in disaster conditions. Such values may indicate an awareness of the importance of the local community in providing support and protection in case of disasters [113].
Results of the comprehensive research indicate that respondents’ age emerges as the most significant predictor of various aspects of earthquake-induced disaster preparedness in Montenegro, North Macedonia, and Serbia. This finding unequivocally confirms the importance of considering age demographics in shaping levels of preparedness and awareness regarding earthquakes. Additional analyses have shown that education appears as the second most significant predictor across various examined models. Additionally, as emphasized, predictors such as gender, employment status, and income level emerge as the third most significant predictors.
Such results directly and indirectly suggest that there is a set of factors influencing the increase or decrease in levels of preparedness for earthquake-induced disasters. It can be assumed that age, as a key predictor, arises because individuals have richer life and professional experiences, as well as potential awareness of the potential consequences of earthquakes. Furthermore, additional explanations can be highlighted: older individuals have more experience in dealing with various life situations and disasters [114,115]; they have a greater responsibility towards family and community, motivating them to be more engaged in preparatory activities [116]; and they may be more aware of their vulnerabilities [117,118], making them more inclined to take concrete steps towards earthquake preparedness, such as creating evacuation plans, preparing supplies [119], and discussing hazards [120].
In further analyses, a complex interaction between the age of respondents and their perception and awareness of earthquake preparedness was observed. Specifically, as the age of respondents increases, the ratings of their household and community preparedness for earthquakes decrease. These results can be explained by the reduced physical abilities or decreased interest in actively participating in disaster preparedness activities [121]. On the other hand, it can also be understood by the fact that they may have a better understanding of system deficiencies, so they may not want to give higher ratings for preparedness [122]. In contrast, the analysis indicates that with increasing age, respondents show increased awareness of potential house damage due to earthquakes, as well as ratings of house reinforcement. This may be attributed to the greater attention older individuals pay to their homes as places of safety, as well as the higher likelihood of having experience with previous earthquakes or their consequences [123,124]. Additionally, with increasing age, respondents demonstrate greater awareness of the needs of elderly individuals [125], individuals with disabilities, and infants in the event of an earthquake. An explanation could be found in their greater empathy or personal experience with caring for vulnerable members of the community [126,127,128,129].
In addition to age, it has been established that education emerges as a significant predictor, implying that education is crucial in enhancing preparedness, raising awareness, and providing all necessary information about earthquakes. This is particularly evident in communities with lower levels of education where there may be a lack of access to information about potential hazards and protective measures. Additionally, it can be assumed that individuals with higher levels of education often have a better understanding of the potential risks and consequences of earthquake disasters [130,131]. Furthermore, it can be emphasized that educated citizens are better able to recognize warning signs, understand the importance of adequate preparatory measures, and better assess how to deal with potential risks [131,132,133,134]. Additionally, they may have easier access to information about disasters through various sources, such as scientific studies [135]. Of course, it cannot be overlooked that more educated individuals often have higher incomes and better access to resources, enabling them to more easily prepare their homes and families for potential disasters [136,137,138].
The obtained results reveal a concerning trend of low ratings regarding the existence of designated shelters in all three mentioned countries. Specifically, respondents from Serbia show the highest percentage of designated shelter existence at 25.2%, followed by respondents from North Macedonia (18.9%), and finally respondents from Montenegro (16%). Such results unequivocally point to potential shortcomings in shelter infrastructure and underscore the urgent need for improvement to ensure the safety and protection of residents during disasters [139,140]. Similar outcomes may also be attributed to shared historical and cultural values within the region they belong [96].
Research on perceptions of special needs during earthquake-induced disasters reveals variations in the level of awareness and knowledge among respondents. Specifically, respondents from North Macedonia stand out as the most aware of the need for special care during disasters, while respondents from Serbia exhibit greater awareness of the vulnerability of the elderly population. The identified differences in the level of awareness and knowledge among respondents may be a result of various factors such as education, experience with disasters, availability of information, cultural norms, and social structures in each of the surveyed countries [141,142,143]. For instance, the high level of awareness among respondents from North Macedonia regarding special needs may stem from a higher level of awareness among the population about the importance of solidarity and care for vulnerable groups [144,145].
On the other hand, the greater awareness of the vulnerability of the elderly population in Serbia during disasters may reflect years of experience with earthquakes and generational knowledge transfer about the needs of older people [146]. However, all three countries show low levels of knowledge about the location of vulnerable individuals in communities and communication with individuals with hearing impairments. Nevertheless, the lack of knowledge about the location of vulnerable individuals and communication with individuals with hearing impairments in all three countries highlights the need to strengthen educational campaigns and disaster preparedness systems [147].
Limitations of the study include: (a) sample size—it is possible that the sample used in the study is not large enough to obtain fully representative and generalized insights into the state of earthquake preparedness in each of the analysed countries; (b) there is a possibility that some aspects of the research (online surveying), such as the methodology of sample selection or the instruments used for data collection, could have influenced the validity of the results or the interpretation of the obtained information; (c) limitations in the availability of relevant research and data on earthquake preparedness in the context of the analysed countries could have affected the comprehensiveness of the analysis and interpretation of the results; (d) absence of longitudinal analysis—the lack of long-term data or longitudinal analysis may limit the understanding of long-term trends in earthquake preparedness over time; (e) the influence of unforeseen external factors such as political, economic, or social changes that could affect preparedness for disasters in the analysed countries; (f) the study is that it only focused on specific subscales to gauge earthquake preparedness in the multivariate regression analysis, potentially overlooking other relevant dimensions that could impact overall preparedness.
5. Conclusions
The conducted research in the three countries (Montenegro, North Macedonia, and Serbia) has provided valuable insights into the levels and influencing factors of preparedness for earthquake-induced disasters. The obtained results indicated various variations regarding the implemented safety preventive measures, possession of supplies, shelters, connectivity, and fire safety. Respondents from North Macedonia stood out with high ratings of household readiness for earthquakes, while respondents from Serbia exhibited greater concern and better preparedness regarding fire safety measures. In contrast, respondents from Montenegro showed lower scores in various categories, suggesting the need for enhancing awareness and preparedness for disasters in that country.
The research has found that the age of the respondents is the most significant predictor of citizens’ preparedness for earthquake-induced disasters in Montenegro, North Macedonia, and Serbia. It has been determined that as the age of the respondents increases, the rating of household and community preparedness for earthquakes decreases.
Additionally, education emerges as the second most significant predictor, highlighting the importance of education in enhancing preparedness, raising awareness, and providing necessary information about earthquakes. The complex interaction between age and perception of earthquake preparedness reveals that as respondents age, the perception of preparedness of their households and communities for earthquakes decreases. However, with increasing age, respondents demonstrate increased awareness of potential house damage due to earthquakes, as well as increased awareness of the needs of vulnerable groups such as the elderly, people with disabilities, and infants. Additionally, the research indicates concerning trends regarding the existence of designated shelters in the surveyed countries, suggesting potential shortcomings in shelter infrastructure and an urgent need for improvement to ensure residents’ safety during disasters.
The analysis of reinforced houses revealed that gender was the most significant predictor, followed by education and employment. These findings emphasize the importance of gender in influencing the likelihood of having reinforced houses, with education and employment status also playing notable roles. Further analyses revealed that female participants tend to perceive lower community preparedness for earthquake-induced disasters compared to males, while males perceive higher levels of earthquake-resistant house reinforcement compared to females. Additionally, females communicate more extensively with neighbours about earthquake-induced disasters compared to males.
Identification of factors influencing disaster preparedness, such as age, education, and gender, provides a basis for the development of more effective strategies for disaster prevention and response. Identification of deficiencies in existing disaster preparedness systems enables decision-makers to allocate resources and develop programs to improve disaster response and reduce the risk to the population. This research can also serve as a basis for educating the public about the importance of disaster preparedness and encourage collective efforts to build more resilient communities.
The study provides a deeper understanding of the factors influencing disaster preparedness in Montenegro, North Macedonia, and Serbia, particularly focusing on earthquake-induced disasters. This understanding can inform future research aimed at exploring the nuances of preparedness in different socio-economic and demographic contexts. In general, the wealth of data on citizen preparedness in different countries, such as Montenegro, North Macedonia and Serbia, provides valuable insights for decision-makers, first responders, and local communities in the process of developing targeted interventions, strategies, and programs aimed at enhancing societal safety in such circumstances. By highlighting clear predictors and factors and offering specific explanations of their correlation with preparedness, decision-makers and other stakeholders can improve the resilience of local communities and reduce the direct and indirect impacts of such events on people and their infrastructure.
The identified differences in household preparedness ratings among the countries covered by the study have significant implications for disaster management authorities and policymakers. Firstly, there is a need for tailored disaster preparedness initiatives that take into account specific socio-economic and demographic factors influencing preparedness levels in each country. Additionally, such differences in preparedness ratings underscore potential areas of vulnerability to such disasters within each country’s population. Identifying regions or demographic groups with lower levels of preparedness enables authorities to prioritize resource allocation and intervention efforts to address these gaps and mitigate the impact of future disasters. Furthermore, comparing household preparedness ratings between countries can facilitate the exchange of knowledge and best practices among disaster management authorities.
In essence, the differences in household preparedness ratings emphasize the importance of targeted, evidence-based policies and interventions in improving overall disaster preparedness and response capabilities in the countries covered by the study. Research findings, taking into account cultural characteristics, can serve as a basis for the development of targeted interventions, strategies, policies, and programs aimed at improving the level of societal preparedness for earthquake-induced disasters.
Author Contributions
V.M.C. conceived the original idea for this study and developed the study design and questionnaire in collaboration with G.G. Also, G.G. and V.M.C. and A.I. contributed to the dissemination of the questionnaire, while V.M.C. analysed and interpreted the data with G.G. and T.L. made a significant contribution by drafting the introduction; G.G., V.M.C. and A.I. drafted the discussion, and V.M.C. composed the conclusions. G.G., T.L., V.M.C. and A.I. critically reviewed the data analysis and contributed to revising and finalizing the manuscript. All authors have read and agreed to the published version of the manuscript.
Funding
This research was funded by the Scientific–Professional Society for Disaster Risk Management, Belgrade (https://upravljanje-rizicima.com/, accessed on 11 March 2024) and the International Institute for Disaster Research (https://idr.edu.rs/, accessed on 10 March 2024), Belgrade, Serbia.
Institutional Review Board Statement
The study was conducted according to the guidelines of the Declaration of Helsinki and approved by the Institutional Review Board of the Scientific–Professional Society for Disaster Risk Management and the International Institute for Disaster Research (protocol code 001/2024, 15 February 2024).
Informed Consent Statement
Informed consent was obtained from all subjects involved in the study.
Data Availability Statement
Data are contained within the article.
Conflicts of Interest
The authors declare no conflicts of interest.
Appendix A
Questionnaire about earthquake household preparedness.
| Category | Questions | Responses (Circle the Answer You Believe Best Corresponds to Reality) |
| Safety of the household | How do you assess the readiness of your household to respond to an earthquake on a scale of 1 to 5? (1—insufficient; 5—excellent). | 1 2 3 4 5 |
| How do you assess the readiness of your municipality/city to respond to an earthquake on a scale of 1 to 5? (1—insufficient; 5—excellent). | 1 2 3 4 5 | |
| Do you think your house (apartment) will be damaged in the event of an earthquake (intensity 6 on the MCS scale or stronger)? (1—not at all; 5—quite likely). | 1 2 3 4 5 | |
| Do you know the geological layers (soil composition) beneath your house? (1—do not know at all; 5—know very well). | 1 2 3 4 5 | |
| Have you checked the earthquake resistance of your house? | Yes No | |
| Is your house constructed with reinforced concrete? | Yes No | |
| Have you secured your furniture to the wall? | Yes No | |
| Do you think that buildings in your local municipality are constructed with reinforced concrete? (1—none of them; 5—all of them are constructed with reinforced concrete). | 1 2 3 4 5 | |
| Supplies | Do you have a first aid kit in your household? | Yes No |
| Have you checked the contents of the first aid kit, if you have one? | Yes No | |
| Do you keep the first aid kit in an easily accessible place? | Yes No | |
| Do you have any other emergency supplies? | Yes No | |
| Do you think your emergency supplies are sufficient in case of an emergency? (1—not sufficient; 5—very sufficient). | 1 2 3 4 5 | |
| Does your local government have emergency supplies? | Yes No | |
| Shelter | Do you know your designated shelter nearby? | Yes No |
| Do you know the route to the shelter? | Yes No | |
| Are there obstacles on the route to the shelter? | Yes No | |
| Will you call your neighbours when evacuating? | Yes No | |
| Do you know the condition of the designated shelter? | Yes No | |
| Do you know who manages the shelters? | Yes No | |
| Special Needs | Do you know which people require special care in emergencies, specifically in the case of earthquakes? | Yes No |
| Are you aware that the majority of casualties and injuries occur among the older population? (1—do not know at all; 5—know very well). | 1 2 3 4 5 | |
| Is there someone in your family who couldn’t evacuate alone in the event of an earthquake? | Yes No | |
| Do you know where elderly, disabled individuals and infants live in your community? (1—do not know at all; 5—know very well). | 1 2 3 4 5 | |
| Do you know how to communicate with deaf or hearing-impaired individuals? (1—do not know at all; 5—know very well). | 1 2 3 4 5 | |
| Do you know what assistance older individuals, people with disabilities, and infants require? (1—do not know at all; 5—know very well). | 1 2 3 4 5 | |
| Local connectivity | Have you participated in any way in preparing the local government for disasters? (1—not at all; 5—completely). | 1 2 3 4 5 |
| Do you think residents of your municipality/city are aware that an earthquake could occur in your local government? (1—not aware at all; 5—fully aware). | 1 2 3 4 5 | |
| Do you believe your neighbours can independently rescue themselves in the event of an earthquake (and to what extent)? (1—not at all; 5—definitely can). | 1 2 3 4 5 | |
| Does your local government have a reliable person working on disaster preparedness measures? | Yes No | |
| Do you talk to people in your municipality/city about natural disasters? (1—I do not talk; 5—I talk daily). | 1 2 3 4 5 | |
| Do you know someone who can advise you on disaster preparedness? | Yes No | |
| Do you communicate with your neighbours? (1—I do not communicate with anyone, 5—I communicate with everyone). | 1 2 3 4 5 | |
| Do you think businesses in your municipality/city are helpful in emergencies? (1—not helpful at all; 5—extremely helpful). | 1 2 3 4 5 | |
| Fire | Do you know how to use a fire extinguisher? | Yes No |
| Do you have a fire extinguisher for initial fires in your home/apartment? | Yes No | |
| Do you know where fire extinguishers and hydrants are in your neighbourhood? (1—do not know at all; 5—know very well). | 1 2 3 4 5 | |
| Have you used a hydrant or fire hose? | Yes No | |
| Have you heard of the phrase “Initial Fire Suppression”? (1—never heard; 5—heard many times). | 1 2 3 4 5 | |
| Are houses in your neighbourhood close to each other (distance less than 1 m)? (1—none are close; 5—all are very close). | 1 2 3 4 5 | |
| Can fire trucks access any street in your neighbourhood? | Yes No | |
| Do you often see improperly parked cars? (1—do not see them at all; 5—see them every day). | 1 2 3 4 5 |
References
- Pereira, S.M.; Rego, I.E.; Mónico, L.S.M. Earthquake recommendations in Europe: A qualitative coding methodology for the analysis of preparedness and response recommendations from authorities. Int. J. Disaster Risk Reduct. 2023, 96, 103966. [Google Scholar] [CrossRef]
- Sutton, J.; Tierney, K. Disaster Preparedness: Concepts, Guidance, and Research; University of Colorado: Denver, CO, USA, 2006; p. 3. [Google Scholar]
- Halkia, G.; Ludwig, L.G. Household earthquake preparedness in Oklahoma: A mixed methods study of selected municipalities. Int. J. Disaster Risk Reduct. 2022, 73, 102872. [Google Scholar] [CrossRef]
- Kiani, U.B.N.; Najam, F.A.; Rana, I.A. The impact of risk perception on earthquake preparedness: An empirical study from Rawalakot, Pakistan. Int. J. Disaster Risk Reduct. 2022, 76, 102989. [Google Scholar] [CrossRef]
- Kwazu, G.C.; Chang-Richards, A. A framework of livelihood preparedness for disasters: A study of the Kaikōura earthquake in New Zealand. Int. J. Disaster Risk Reduct. 2021, 61, 102353. [Google Scholar] [CrossRef]
- Cvetković, V.; Kevin, R.; Shaw, R.; Filipović, M.; Mano, R.; Gačić, J.; Jakovljević, V. Household earthquake preparedness in Serbia—A study from selected municipalities. Acta Geogr. 2019, 59, 27–42. [Google Scholar]
- National Research Council; Division on Earth and Life Studies; Committee on Disaster Research in the Social Sciences: Future Challenges and Opportunities. Facing Hazards and Disasters: Understanding Human Dimensions; National Academies Press: Washington, DC, USA, 2006. [Google Scholar]
- Mileti, D. Disasters by Design: A Reassessment of Natural Hazards in the United States; Joseph Henry Press: Washington, DC, USA, 1999. [Google Scholar]
- Alexander, D. Confronting Catastrophe; New Perspectives on Natural Disasters; Oxford University Press: New York, NY, USA, 2000. [Google Scholar]
- Lindell, M.K.; Tierney, K.J.; Perry, R.W. Facing the Unexpected: Disaster Preparedness and Response in the United States; Joseph Henry Press: Washington, DC, USA, 2001. [Google Scholar]
- Edward, B. Natural Hazards; Cambridge University Press: New York, NY, USA, 2005. [Google Scholar]
- Coppola, D.P. Introduction to International Disaster Management; Elsevier: New York, NY, USA, 2006. [Google Scholar]
- Perry, R.W. What Is a Disaster? In Handbook of Disaster Research; Springer: Berlin/Heidelberg, Germany, 2007. [Google Scholar]
- Paul, B.K. Environmental Hazards and Disasters: Contexts, Perspectives and Management; John Wiley & Sons: Hoboken, NJ, USA, 2011. [Google Scholar]
- Tobin, G.A.; Montz, B.E. Natural hazards and technology: Vulnerability, risk, and community response in hazardous environments. In Geography and Technology; Springer: Berlin/Heidelberg, Germany, 2004; pp. 547–570. [Google Scholar]
- Quarantelli, E.L. Catastrophes are different from disasters: Some implications for crisis planning and managing drawn from Katrina. In Understanding Katrina: Perspectives from the Social Sciences; Social Science Research Council: New York, NY, USA, 2005. [Google Scholar]
- Quarantelli, E.L.; Perry, R. A social science research agenda for the disasters of the 21st century: Theoretical, methodological and empirical issues and their professional implementation. What Is Disaster 2005, 39, 325–396. [Google Scholar]
- Meissner, A.; Luckenbach, T.; Risse, T.; Kirste, T.; Kirchner, H. Design challenges for an integrated disaster management communication and information system. In Proceedings of the First IEEE Workshop on Disaster Recovery Networks (DIREN 2002), New York, NY, USA, 24 June 2002. [Google Scholar]
- Flint, C.; Brennan, M. Community emergency response teams: From disaster responders to community builders. Rural Realities 2006, 1, 1–9. [Google Scholar]
- Moe, T.L.; Gehbauer, F.; Senitz, S.; Mueller, M. Balanced scorecard for natural disaster management projects. Disaster Prev. Manag. 2007, 16, 785–806. [Google Scholar] [CrossRef]
- McLoughlin, D. A framework for integrated emergency management. Public Adm. Rev. 1985, 45, 165–172. [Google Scholar] [CrossRef]
- Lettieri, E.; Masella, C.; Radaelli, G. Disaster management: Findings from a systematic review. Disaster Prev. Manag. 2009, 18, 117–136. [Google Scholar] [CrossRef]
- Bradford, M.; Carmichael, R.S. Notable Natural Disasters; Salem Press: Pasadena, CA, USA, 2007. [Google Scholar]
- Thouret, J.-C. Urban hazards and risks; consequences of earthquakes and volcanic eruptions: An introduction. GeoJournal 1999, 49, 131–135. [Google Scholar] [CrossRef]
- Stoltman, J.P.; Lidstone, J.; Dechano, L.M. International Perspectives on Natural Disasters: Occurrence, Mitigation, and Consequences; Springer Science & Business Media: Berlin/Heidelberg, Germany, 2004; Volume 21. [Google Scholar]
- Cvetković, V. Upravljanje Rizicima u Vanrednim Situacijama-Disaster Risk Management; Naučno-stručno društvo za upravljanje rizicima u vanrednim situacijama: Belgrade, Serbia, 2020. [Google Scholar]
- FEMA. Personal Preparedness in America: Findings from the Citizen Corps National Survey; FEMA: Washington, DC, USA, 2009. [Google Scholar]
- Cvetković, V. Spremnost za reagovanje na prirodnu katastrofu-pregled literature. Bezbjednost Policija I Gradjani 2015, 11, 165–183. [Google Scholar]
- Godschalk, D.R. Disaster mitigation and hazard management. In Emergency Management: Principles and Practice for Local Government; Drabek, T.A.H.G., Ed.; International City Management Association: Washington, DC, USA, 1991; pp. 131–160. [Google Scholar]
- Faupel, C.E.; Kelley, S.P.; Petee, T. The impact of disaster education on household preparedness for Hurricane Hugo. Int. J. Mass Emergencies Disasters 1992, 10, 5–24. [Google Scholar] [CrossRef]
- Gillespie, D.F.; Colignon, R.A.; Banerjee, M.M.; Murty, S.A.; Rogge, M. Partnerships for Community Preparedness; Institute of Behavioral Science, US University of Colorado: Boulder, CO, USA, 1993. [Google Scholar]
- Societies, International Federation of Red Cross and Red Crescent. Introduction to Disaster Preparedness. Available online: http://www.ifrc.org/Docs/pubs/disasters/resources/corner/dpmanual/all.pdf (accessed on 15 March 2024).
- Tierney, K.J.; Lindell, M.K.; Perry, R.W. Facing the unexpected: Disaster preparedness and response in the United States. Disaster Prev. Manag. Int. J. 2002, 11, 222. [Google Scholar] [CrossRef]
- Smith, K.; Petley, D.N. Environmental Hazards. Assessing Risk and Reducing Disaster; Routledge: Londona, UK, 2009. [Google Scholar]
- Said, A.M.; Ahmadun, F.l.-R.; Mahmud, A.R.; Abas, F. Community preparedness for tsunami disaster: A case study. Disaster Prev. Manag. 2011, 20, 266–280. [Google Scholar] [CrossRef]
- Kohn, S.; Eaton, J.L.; Feroz, S.; Bainbridge, A.A.; Hoolachan, J.; Barnett, D.J. Personal disaster preparedness: An integrative review of the literature. Disaster Med. Public Health Prep. 2012, 6, 217–231. [Google Scholar] [CrossRef] [PubMed]
- Hémond, Y.; Robert, B. Preparedness: The state of the art and future prospects. Disaster Prev. Manag. 2012, 21, 404–417. [Google Scholar] [CrossRef]
- Reininger, B.M.; Rahbar, M.H.; Lee, M.; Chen, Z.; Alam, S.R.; Pope, J.; Adams, B. Social capital and disaster preparedness among low income Mexican Americans in a disaster prone area. Soc. Sci. Med. 2013, 83, 50–60. [Google Scholar] [CrossRef] [PubMed]
- Combs, J.P.; Slate, J.R.; Moore, G.W.; Bustamante, R.M.; Onwuegbuzie, A.J.; Edmonson, S.L. Gender differences in college preparedness: A statewide study. Urban Rev. 2010, 42, 441–457. [Google Scholar] [CrossRef]
- Drabek, T.E. Social processes in disaster: Family evacuation. Soc. Probl. 1969, 16, 336–349. [Google Scholar] [CrossRef]
- Ikeda, K. Gender differences in human loss and vulnerability in natural disasters: A case study from Bangladesh. Indian J. Gend. Stud. 1995, 2, 171–193. [Google Scholar] [CrossRef]
- Mano-Negrin, R.; Sheaffer, Z. Are women “cooler” than men during crises? Exploring gender differences in perceiving organisational crisis preparedness proneness. Women Manag. Rev. 2004, 19, 109–122. [Google Scholar] [CrossRef]
- Mehta, M. Gender Matters: Lessons for Disaster Risk Reduction in South Asia; The International Centre for Integrated Mountain Development: Patan, Nepal, 2007. [Google Scholar]
- Mulilis, J.-P. Gender and Earthquake Preparedness: A Research Study of Gender Issues in Disaster Management: Differences in Earthquake Preparedness Due to Traditional Stereotyping or Cognitive Appraisal of Threat? Aust. J. Emerg. Manag. 1999, 14, 41–49. [Google Scholar]
- Myers, M. ‘Women and children first’ Introducing a gender strategy into disaster preparedness. Gend. Dev. 1994, 2, 14–16. [Google Scholar] [CrossRef] [PubMed]
- Norris, F.H. Epidemiology of trauma: Frequency and impact of different potentially traumatic events on different demographic groups. J. Consult. Clin. Psychol. 1992, 60, 409. [Google Scholar] [CrossRef]
- Rodríguez, H.; Kennedy, P.; Quarantelli, E.L.; Ressler, E.; Dynes, R. Handbook of Disaster Research; Springer Science & Business Media: Berlin/Heidelberg, Germany, 2009. [Google Scholar]
- Rüstemli, A.; Karanci, A.N. Correlates of earthquake cognitions and preparedness behavior in a victimized population. J. Soc. Psychol. 1999, 139, 91–101. [Google Scholar] [CrossRef]
- Tomio, J.; Sato, H.; Matsuda, Y.; Koga, T.; Mizumura, H. Household and Community Disaster Preparedness in Japanese Provincial City: A Population-Based Household Survey. Adv. Anthropol. 2014, 2014, 68–77. [Google Scholar] [CrossRef]
- Davidson, D.J.; Freidenburg, W.R. Gender and environmental risk concerns: A review and analysis of available research. Environ. Behav. 1996, 28, 302–339. [Google Scholar] [CrossRef]
- Palm, R. Communicating to a diverse population. In National Science and Technology Conference on Risk Assessment and Decision Making for Natural Hazards; Elsevier: Washington, DC, USA, 1995. [Google Scholar]
- Phillips, B.D. Gender as a variable in emergency response. In The Loma Prieta Earthquake: Studies in Short Term Impacts; Institute of Behavioral Science University of Colorado: Boulder CO, USA, 1990. [Google Scholar]
- Noel, G.E. The role of women in health-related aspects of emergency management: A Caribbean perspective. In The Gendered Terrain of Disaster: Through the Eyes of Women; Routledge: Westport, CT, USA, 1990. [Google Scholar]
- Able, E.; Nelson, M. Circles of Care: Work and Identity in Women’s Lives; SUNY Press: Albany, NY, USA, 1990. [Google Scholar]
- Szalay, L.B.; Inn, A.; Vilov, S.K.; Strohl, J.B. Regional and Demographic Variations in Public Perceptions Related to Emergency Preparedness; Institute for Comparative Social and Cultural Studies Inc.: Bethesda, MD, USA, 1996. [Google Scholar]
- Murphy, R. Rationality and Nature: A Sociological Inquiry into a Changing Relationship; Westview Press: Boulder, CO, USA; New York, NY, USA, 1994. [Google Scholar]
- Melick, M.E.; Logue, J.N. The effect of disaster on the health and well-being of older women. Int. J. Aging Hum. Dev. 1985, 21, 27–38. [Google Scholar] [CrossRef]
- Murrell, S.A.; Norris, F.H. Resources, life events, and changes in positive affect and depression in older adults. Am. J. Community Psychol. 1984, 12, 445–464. [Google Scholar] [CrossRef]
- Durkin, M.; Aroni, S.; Coulson, A. Injuries in the Coalinga earthquake. In The Coalinga Earthquake of May 2; US Government Printing Office: Washington, DC, USA, 1983. [Google Scholar]
- Johnson, R.; Johnston, M.; Peters, E. At a Competitive Disadvantage? The Fate of the Elderly in Collective Flight; North Central Sociological Association: Akron, OH, USA, 1989. [Google Scholar]
- Sattler, D.N.; Kaiser, C.F.; Hittner, J.B. Disaster Preparedness: Relationships Among Prior Experience, Personal Characteristics, and Distress. J. Appl. Soc. Psychol. 2000, 30, 1396–1420. [Google Scholar] [CrossRef]
- Finnis, K.K.; Johnston, D.M.; Ronan, K.R.; White, J.D. Hazard perceptions and preparedness of Taranaki youth. Disaster Prev. Manag. 2010, 19, 175–184. [Google Scholar] [CrossRef]
- Mishra, S.; Suar, D. Do lessons people learn determine disaster cognition and preparedness? Psychol. Dev. Soc. 2007, 19, 143–159. [Google Scholar] [CrossRef]
- Hurnen, F.; McClure, J. The effect of increased earthquake knowledge on perceived preventability of earthquake damage. Australas. J. Disaster Trauma Stud. 1997, 3, 1–10. [Google Scholar]
- Edwards, M. Social location and self-protective behavior: Implications for earthquake preparedness. Int. J. Mass Emergencies Disasters 1993, 11, 293–303. [Google Scholar] [CrossRef]
- Johnston, D.; Becker, J.; Paton, D. Multi-agency community engagement during disaster recovery: Lessons from two New Zealand earthquake events. Disaster Prev. Manag. 2012, 21, 252–268. [Google Scholar] [CrossRef]
- Russell, L.A.; Goltz, J.D.; Bourque, L.B. Preparedness and hazard mitigation actions before and after two earthquakes. Environ. Behav. 1995, 27, 744–770. [Google Scholar] [CrossRef]
- Spittal, M.J.; McClure, J.; Siegert, R.J.; Walkey, F.H. Predictors of two types of earthquake preparation: Survival activities and mitigation activities. Environ. Behav. 2008, 40, 798–817. [Google Scholar] [CrossRef]
- Federal Emergency Management Agency. Central States Disaster and Earthquake Preparedness Survey Report; FEMA: Washington, DC, USA, 2011. Available online: http://www.fema.gov/library/viewRecord.do?id=6403 (accessed on 15 March 2024).
- Kellenberg, D.K.; Mobarak, A.M. Does rising income increase or decrease damage risk from natural disasters? J. Urban Econ. 2008, 63, 788–802. [Google Scholar] [CrossRef]
- Shapira, S.; Aharonson-Daniel, L.; Shohet, I.M.; Peek-Asa, C.; Bar-Dayan, Y. Integrating epidemiological and engineering approaches in the assessment of human casualties in earthquakes. Nat. Hazards 2015, 78, 1447–1462. [Google Scholar] [CrossRef]
- Smith, D.L.; Notaro, S.J. Personal emergency preparedness for people with disabilities from the 2006–2007 Behavioral Risk Factor Surveillance System. Disabil. Health J. 2009, 2, 86–94. [Google Scholar] [CrossRef] [PubMed]
- Han, Z.; Wang, H.; Du, Q.; Zeng, Y. Natural hazards preparedness in Taiwan: A comparison between households with and without disabled members. Health Secur. 2017, 15, 575–581. [Google Scholar] [CrossRef] [PubMed]
- Petrović, M. Advantages and limitations of online research method. Marketing 2014, 45, 63–74. [Google Scholar] [CrossRef]
- Burić, M. Geografsko-Istorijski Atlas Crne Gore: Formiranje Crnogorske Teritorije: Prevalis-Duklja-Zeta-Crna Gora; Dukljanska akademija nauka i umjetnosti: Podgorica, Montenegro, 2022. [Google Scholar]
- Radojičić, B. Geografija Crne Gore; Dukljanska akademija nauka i umjetnosti: Podgorica, Montenegro, 2008. [Google Scholar]
- Ivanović, S. Zemljotresi Fenomeni Prirode; Crnogorska akademija nauka i umjetnosti: Podgorica, Montenegro, 1991. [Google Scholar]
- Dumurdzanov, N.; Serafimovski, T.; Burchfiel, B.C. Cenozoic tectonics of Macedonia and its relation to the South Balkan extensional regime. Geosphere 2005, 1, 1–22. [Google Scholar] [CrossRef]
- Timiovska, L.S. A note on attenuation of earthquake intensity in Macedonia. Soil Dyn. Earthq. Eng. 1992, 11, 457–463. [Google Scholar] [CrossRef]
- Černih, D.; Čejkovska, V. Seismic Monitoring and Data Processing in Seismological Observatory in Skopje—Republic of Macedonia—Basis for a Complex Geophysical Monitoring; Springer: Cham, Switzerland, 2015; pp. 133–141. [Google Scholar]
- Pekevski, L. Airport Conditions in Macedonia: Seismic Risks. In Geomagnetics for Aeronautical Safety: A Case Study in and around the Balkans; Springer: Berlin/Heidelberg, Germany, 2006; pp. 271–279. [Google Scholar]
- Drogreshka, K.; Najdovska, J.; Chernih-Anastasovska, D. Seismic zones and seismicity of the territory of the republic of north macedonia. Knowl. Int. J. 2019, 31, 669–674. [Google Scholar] [CrossRef]
- Marovic, M.; Djokovic, I.; Pesic, L.; Radovanovic, S.; Toljic, M.; Gerzina, N. Neotectonics and seismicity of the southern margin of the Pannonian basin in Serbia. EGU Stephan Mueller Spec. Publ. Ser. 2002, 3, 1–19. [Google Scholar] [CrossRef]
- Abolmasov, B.; Jovanovski, M.; Ferić, P.; Mihalić, M. Losses due to historical earthquakes in the Balkan region: Overview of publicly available data. Geofizika 2011, 28, 161. [Google Scholar]
- Dragicevic, S.; Filipovic, D.; Kostadinov, S.; Zivkovic, N.; Andjelkovic, G.; Abolmasov, B. Natural hazard assessment for land-use planning in Serbia. Int. J. Environ. Res. 2011, 5, 371–380. [Google Scholar]
- Panić, M.; Kovačević-Majkić, J.; Miljanović, D.; Miletić, R. Importance of natural disaster education-case study of the earthquake near the city of Kraljevo: First results. J. Geogr. Inst. Jovan Cvijic SASA 2013, 63, 75–88. [Google Scholar] [CrossRef]
- Antonijevic, S.K.; Arroucau, P.; Vlahovic, G. Seismotectonic Model of the Kraljevo 3 November 2010 Mw 5.4 Earthquake Sequence. Seismol. Res. Lett. 2013, 84, 600–610. [Google Scholar] [CrossRef]
- Joshi, A.; Tomer, M.; Lal, S.; Chopra, S.; Singh, S.; Prajapati, S.; Sharma, M.L.; Sandeep, A. Estimation of the source parameters of the Nepal earthquake from strong motion data. Nat. Hazards 2016, 83, 867–883. [Google Scholar] [CrossRef]
- Cvetković, V.; Dragićević, S.; Petrović, M.; Mijaković, S.; Jakovljević, V.; Gačić, J. Knowledge and perception of secondary school students in Belgrade about earthquakes as natural disasters. Pol. J. Environ. Stud. 2015, 24, 1553–1561. [Google Scholar] [CrossRef] [PubMed]
- Cvetković, V.; Dragašević, A.; Protić, D.; Janković, B.; Nikolić, N.; Predrag, M. Fire Safety Behavior Model for Residential Buildings: Implications for Disaster Risk Reduction. SSRN Electron. J. 2021, 76, 102981. [Google Scholar]
- Twigg, J.; Christie, N.; Haworth, J.; Osuteye, E.; Skarlatidou, A. Improved methods for fire risk assessment in low-income and informal settlements. Int. J. Environ. Res. Public Health 2017, 14, 139. [Google Scholar] [CrossRef] [PubMed]
- Ren, H.; Zhou, C.; Li, A. Social and Economic Factors’ Impact on Fire Safety Risks-Panel Data Model Based Analysis. In Proceedings of the 2018 5th International Conference on Industrial Economics System and Industrial Security Engineering (IEIS), Toronto, ON, Canada, 3–6 August 2018; pp. 1–5. [Google Scholar]
- Garcia, D.; Rimé, B. Collective emotions and social resilience in the digital traces after a terrorist attack. Psychol. Sci. 2019, 30, 617–628. [Google Scholar] [CrossRef] [PubMed]
- Drury, J.; Brown, R.; González, R.; Miranda, D. Emergent social identity and observing social support predict social support provided by survivors in a disaster: Solidarity in the 2010 Chile earthquake. Eur. J. Soc. Psychol. 2016, 46, 209–223. [Google Scholar] [CrossRef]
- Mano, R.M.; Kirshcenbaum, A.; Rapaport, C. Earthquake preparedness: A Social Media Fit perspective to accessing and disseminating earthquake information. Int. J. Disaster Risk Manag. 2019, 1, 19–31. [Google Scholar] [CrossRef]
- Szczesio, S.L. International aspects of the disintegration of the Socialist Federal Republic of Yugoslavia. Rocz. Inst. Eur. Srod.-Wschod. 2021, 19, 9–31. [Google Scholar] [CrossRef]
- Hikichi, H.; Aida, J.; Tsuboya, T.; Kondo, K.; Kawachi, I. Can community social cohesion prevent posttraumatic stress disorder in the aftermath of a disaster? A natural experiment from the 2011 Tohoku earthquake and tsunami. Am. J. Epidemiol. 2016, 183, 902–910. [Google Scholar] [CrossRef]
- Reagans, R.; McEvily, B. Network structure and knowledge transfer: The effects of cohesion and range. Adm. Sci. Q. 2003, 48, 240–267. [Google Scholar] [CrossRef]
- Wachinger, G.; Renn, O.; Begg, C.; Kuhlicke, C. The risk perception paradox—Implications for governance and communication of natural hazards. Risk Anal. 2013, 33, 1049–1065. [Google Scholar] [CrossRef]
- Kašťáková, E.; Chlebcová, A. Analysis of the Western Balkans Territories Using the Index of Economic Freedom. Stud. Commer. Bratisl. 2020. [Google Scholar] [CrossRef]
- Gammoh, L.A.; Dawson, I.G.J.; Katsikopoulos, K. How flood preparedness among Jordanian citizens is influenced by self-efficacy, sense of community, experience, communication, trust and training. Int. J. Disaster Risk Reduct. 2023, 87, 103585. [Google Scholar] [CrossRef]
- Levac, J.; Toal-Sullivan, D.; Osullivan, T.L. Household emergency preparedness: A literature review. J. Community Health 2012, 37, 725–733. [Google Scholar] [CrossRef] [PubMed]
- Ao, Y.; Zhang, H.; Yang, L.; Wang, Y.; Martek, I.; Wang, G. Impacts of earthquake knowledge and risk perception on earthquake preparedness of rural residents. Nat. Hazards 2021, 107, 1287–1310. [Google Scholar] [CrossRef]
- Engle, J. Stories of tragedy, trust and transformation? A case study of education-centered community development in post-earthquake Haiti. Prog. Plan. 2018, 124, 1–34. [Google Scholar] [CrossRef]
- Shtob, D.A. Remembering the future: Natural disaster, place, and symbolic survival. Rural Sociol. 2019, 84, 123–147. [Google Scholar] [CrossRef]
- Parsizadeh, F.; Ibrion, M.; Mokhtari, M.; Lein, H.; Nadim, F. Bam 2003 earthquake disaster: On the earthquake risk perception, resilience and earthquake culture–Cultural beliefs and cultural landscape of Qanats, gardens of Khorma trees and Argh-e Bam. Int. J. Disaster Risk Reduct. 2015, 14, 457–469. [Google Scholar] [CrossRef]
- Wekesa, B.W.; Steyn, G.S.; Otieno, F.A.O.F. A review of physical and socio-economic characteristics and intervention approaches of informal settlements. Habitat Int. 2011, 35, 238–245. [Google Scholar] [CrossRef]
- Longstaff, P.H.; Armstrong, N.J.; Perrin, K.; Parker, W.M.; Hidek, M.A. Building resilient communities: A preliminary framework for assessment. Homel. Secur. Aff. 2010, 6, 1–23. [Google Scholar]
- Xiang, T. Understanding emergency preparedness in public agencies: The key role of managerial perceptions. Adm. Soc. 2022, 54, 424–450. [Google Scholar] [CrossRef]
- Cvetković, V.M.; Ivanov, A. Comparative Analysis of National Strategies for Protection and Rescue in Emergencies in Serbia and Montenegro with Emphasis on Croatia. 2014, pp. 58–59. Available online: https://eprints.uklo.edu.mk/id/eprint/8597/ (accessed on 17 March 2024).
- Baker, E.J. Household preparedness for the aftermath of hurricanes in Florida. Appl. Geogr. 2011, 31, 46–52. [Google Scholar] [CrossRef]
- Martins, V.N.; Nigg, J.; Louis-Charles, H.M.; Kendra, J.M. Household preparedness in an imminent disaster threat scenario: The case of superstorm sandy in New York City. Int. J. Disaster Risk Reduct. 2019, 34, 316–325. [Google Scholar] [CrossRef]
- Kafle, S.K. Measuring disaster-resilient communities: A case study of coastal communities in Indonesia. J. Bus. Contin. Emerg. Plan. 2012, 5, 316–326. [Google Scholar]
- Shenk, D.; Ramos, B.; Joyce Kalaw, K.; Tufan, I. History, memory, and disasters among older adults: A life course perspective. Traumatology 2009, 15, 35–43. [Google Scholar] [CrossRef]
- Brockie, L.; Miller, E. Understanding older adults’ resilience during the Brisbane floods: Social capital, life experience, and optimism. Disaster Med. Public Health Prep. 2017, 11, 72–79. [Google Scholar] [CrossRef]
- Henderson, T.L.; Roberto, K.A.; Kamo, Y. Older adults’ responses to Hurricane Katrina: Daily hassles and coping strategies. J. Appl. Gerontol. 2010, 29, 48–69. [Google Scholar] [CrossRef]
- Malak, M.A.; Sajib, A.M.; Quader, M.A.; Anjum, H. “We are feeling older than our age”: Vulnerability and adaptive strategies of aging people to cyclones in coastal Bangladesh. Int. J. Disaster Risk Reduct. 2020, 48, 101595. [Google Scholar] [CrossRef]
- Mao, W.; Agyapong, V.I. The role of social determinants in mental health and resilience after disasters: Implications for public health policy and practice. Front. Public Health 2021, 9, 658528. [Google Scholar] [CrossRef]
- Timalsina, R.; Songwathana, P. Factors enhancing resilience among older adults experiencing disaster: A systematic review. Australas. Emerg. Care 2020, 23, 11–22. [Google Scholar] [CrossRef] [PubMed]
- Yoo, M.; Lee, M.; Tullmann, D. Perceptions of disaster preparedness among older people in South Korea. Int. J. Older People Nurs. 2016, 11, 18–23. [Google Scholar] [CrossRef] [PubMed]
- Fenxia, Z. The community resilience measurement throughout the COVID-19 pandemic and beyond-an empirical study based on data from Shanghai, Wuhan and Chengdu. Int. J. Disaster Risk Reduct. 2022, 67, 102664. [Google Scholar] [CrossRef] [PubMed]
- Carmeli, A.; Schaubroeck, J. Organisational crisis-preparedness: The importance of learning from failures. Long Range Plan. 2008, 41, 177–196. [Google Scholar] [CrossRef]
- Armaş, I. Earthquake risk perception in Bucharest, Romania. Risk Anal. 2006, 26, 1223–1234. [Google Scholar] [CrossRef]
- Gao, M.; Liu, Y.-J.; Shi, Y. Do people feel less at risk? Evidence from disaster experience. J. Financ. Econ. 2020, 138, 866–888. [Google Scholar] [CrossRef]
- Cvetković, V.M.; Nikolić, N.; Ocal, A.; Martinović, J.; Dragašević, A. A Predictive Model of Pandemic Disaster Fear Caused by Coronavirus (COVID-19): Implications for Decision-Makers. Int. J. Environ. Res. Public Health 2022, 19, 652. [Google Scholar] [CrossRef] [PubMed]
- Nordström, K.; Wangmo, T. Caring for elder patients: Mutual vulnerabilities in professional ethics. Nurs. Ethics 2018, 25, 1004–1016. [Google Scholar] [CrossRef] [PubMed]
- Sze, J.A.; Gyurak, A.; Goodkind, M.S.; Levenson, R.W. Greater emotional empathy and prosocial behavior in late life. Emotion 2012, 12, 1129. [Google Scholar] [CrossRef]
- Ocal, A.; Cvetković, V.M.; Baytiyeh, H.; Tedim, F.; Zečević, M. Public reactions to the disaster COVID-19: A comparative study in Italy, Lebanon, Portugal, and Serbia. Geomat. Nat. Hazards Risk 2020, 11, 1864–1885. [Google Scholar] [CrossRef]
- Cvetković, V.M.; Tanasić, J.; Ocal, A.; Kešetović, Ž.; Nikolić, N.; Dragašević, A. Capacity Development of Local Self-Governments for Disaster Risk Management. Int. J. Environ. Res. Public Health 2021, 18, 10406. [Google Scholar] [CrossRef]
- Cerulli, D.; Scott, M.; Aunap, R.; Kull, A.; Pärn, J.; Holbrook, J.; Mander, Ü. The role of education in increasing awareness and reducing impact of natural hazards. Sustainability 2020, 12, 7623. [Google Scholar] [CrossRef]
- Muttarak, R.; Pothisiri, W. The role of education on disaster preparedness: Case study of 2012 Indian Ocean earthquakes on Thailand’s Andaman Coast. Ecol. Soc. 2013, 18, 150451. [Google Scholar] [CrossRef]
- Cvetković, V.; Nikolić, N.; Nenadić, R.U.; Ocal, A.; Zečević, M.J.I.J.o.E.R.; Health, P. Preparedness and Preventive Behaviors for a Pandemic Disaster Caused by COVID-19 in Serbia. Int. J. Environ. Res. Public Health 2020, 17, 4124. [Google Scholar] [CrossRef]
- Rico, G.C.S. School-Community Collaboration: Disaster Preparedness towards Building Resilient Communities. Int. J. Disaster Risk Manag. 2019, 1, 45–61. [Google Scholar] [CrossRef]
- Goyal, N. Disaster Governance and Community Resilience: The Law and the Role of SDMAs. Int. J. Disaster Risk Manag. 2019, 1, 61–75. [Google Scholar] [CrossRef]
- Baytiyeh, H. Can disaster risk education reduce the impacts of recurring disasters on developing societies? Educ. Urban Soc. 2018, 50, 230–245. [Google Scholar] [CrossRef]
- Al-Rousan, T.M.; Rubenstein, L.M.; Wallace, R.B. Preparedness for natural disasters among older US adults: A nationwide survey. Am. J. Public Health 2014, 104, 506–511. [Google Scholar] [CrossRef]
- Nipa, T.J.; Kermanshachi, S.; Patel, R. Impact of Family Income on Public’s Disaster Preparedness and Adoption of DRR Courses. 2020. Available online: https://www.researchgate.net/profile/Sharareh-Kermanshachi/publication/342318755_Impact_of_Family_Income_on_Public's_Disaster_Preparedness_and_Adoption_of_DRR_Courses/links/5f40471f458515b7293cd65b/Impact-of-Family-Income-on-Publics-Disaster-Preparedness-and-Adoption-of-DRR-Courses.pdf (accessed on 17 March 2024).
- Cvetković, V.; Roder, G.O.A.; Tarolli, P.; Dragićević, S. The Role of Gender in Preparedness and Response Behaviors towards Flood Risk in Serbia. Int. J. Environ. Res. Public Health 2018, 15, 2761. [Google Scholar] [CrossRef]
- Gall, M. Where to go? Strategic modelling of access to emergency shelters in Mozambique. Disasters 2004, 28, 82–97. [Google Scholar] [CrossRef]
- Vecere, A.; Monteiro, R.; Ammann, W.J.; Giovinazzi, S.; Santos, R.H.M. Predictive models for post disaster shelter needs assessment. Int. J. Disaster Risk Reduct. 2017, 21, 44–62. [Google Scholar] [CrossRef]
- Teo, M.; Goonetilleke, A.; Ahankoob, A.; Deilami, K.; Lawie, M. Disaster awareness and information seeking behaviour among residents from low socio-economic backgrounds. Int. J. Disaster Risk Reduct. 2018, 31, 1121–1131. [Google Scholar] [CrossRef]
- Webb, G.R.; Tierney, K.J.; Dahlhamer, J.M. Businesses and disasters: Empirical patterns and unanswered questions. Nat. Hazards Rev. 2000, 1, 83–90. [Google Scholar] [CrossRef]
- Sergey, K.; Gennadiy, N. Methodology for the risk monitoring of geological hazards for buildings and structures. Int. J. Disaster Risk Manag. 2022, 4, 41–49. [Google Scholar] [CrossRef]
- Reichlin, M. The role of solidarity in social responsibility for health. Med. Health Care Philos. 2011, 14, 365–370. [Google Scholar] [CrossRef] [PubMed]
- Jennings, B. Solidarity and care as relational practices. Bioethics 2018, 32, 553–561. [Google Scholar] [CrossRef] [PubMed]
- Evans, J. Mapping the vulnerability of older persons to disasters. Int. J. Older People Nurs. 2010, 5, 63–70. [Google Scholar] [CrossRef]
- Engelman, A.; Ivey, S.L.; Tseng, W.; Dahrouge, D.; Brune, J.; Neuhauser, L. Responding to the deaf in disasters: Establishing the need for systematic training for state-level emergency management agencies and community organizations. BMC Health Serv. Res. 2013, 13, 84. [Google Scholar] [CrossRef]
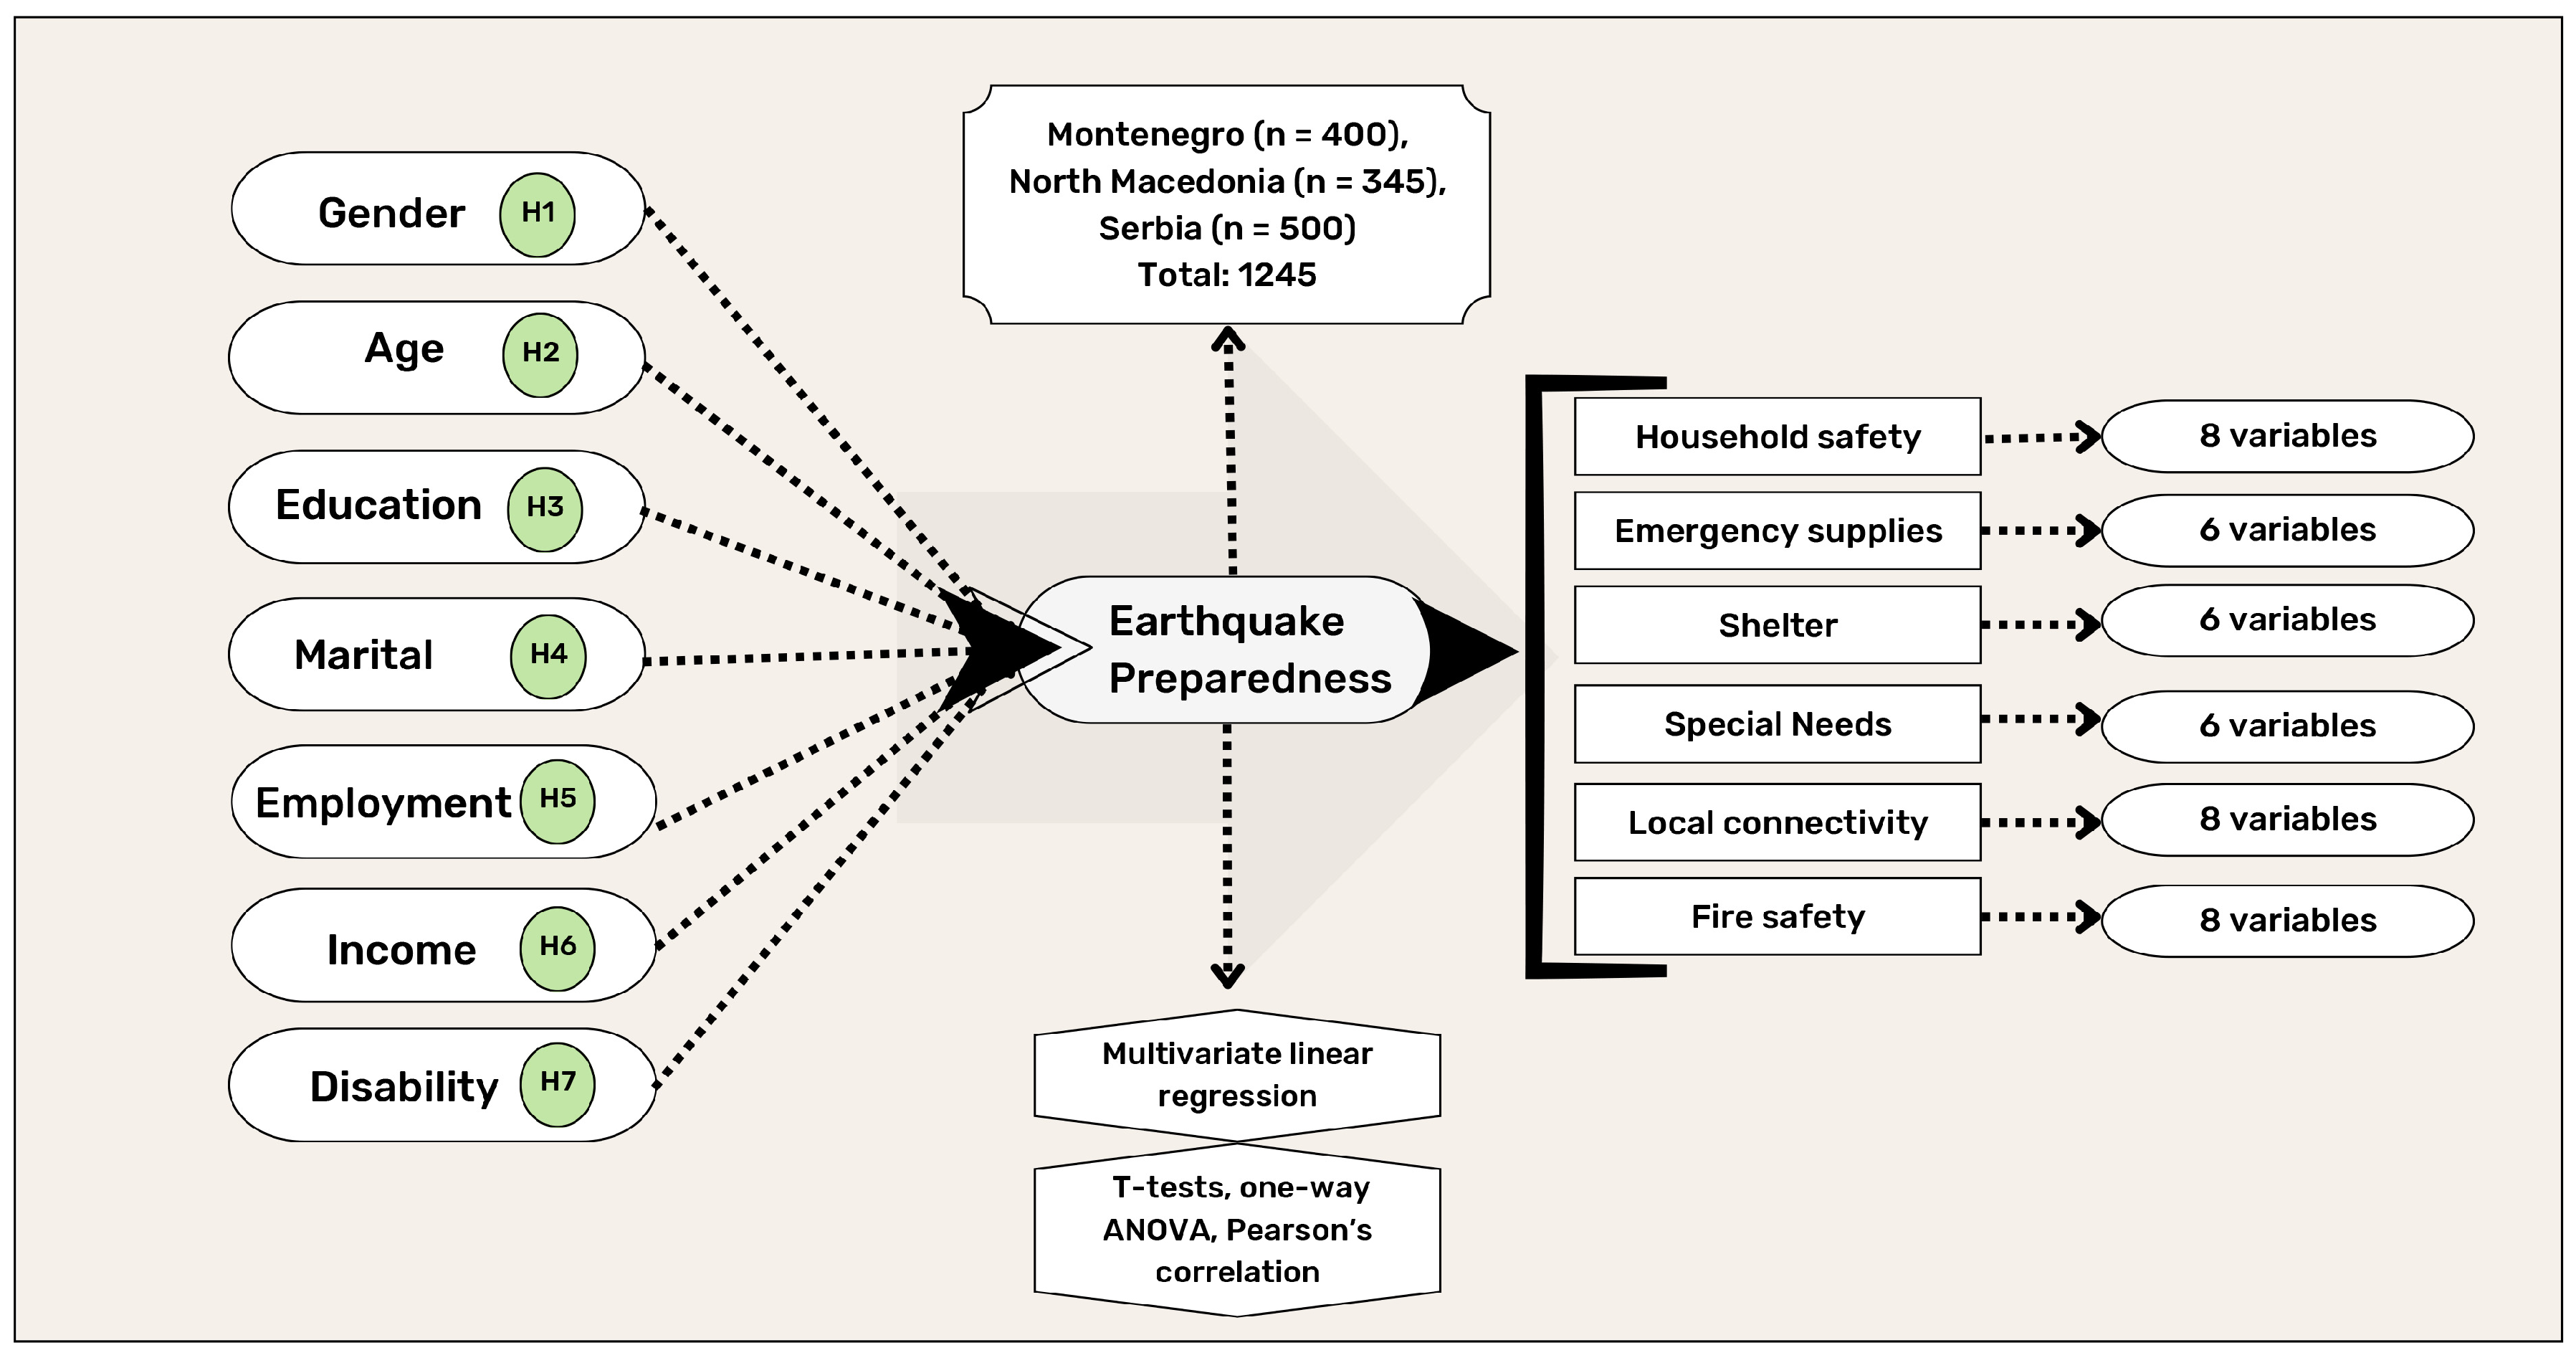
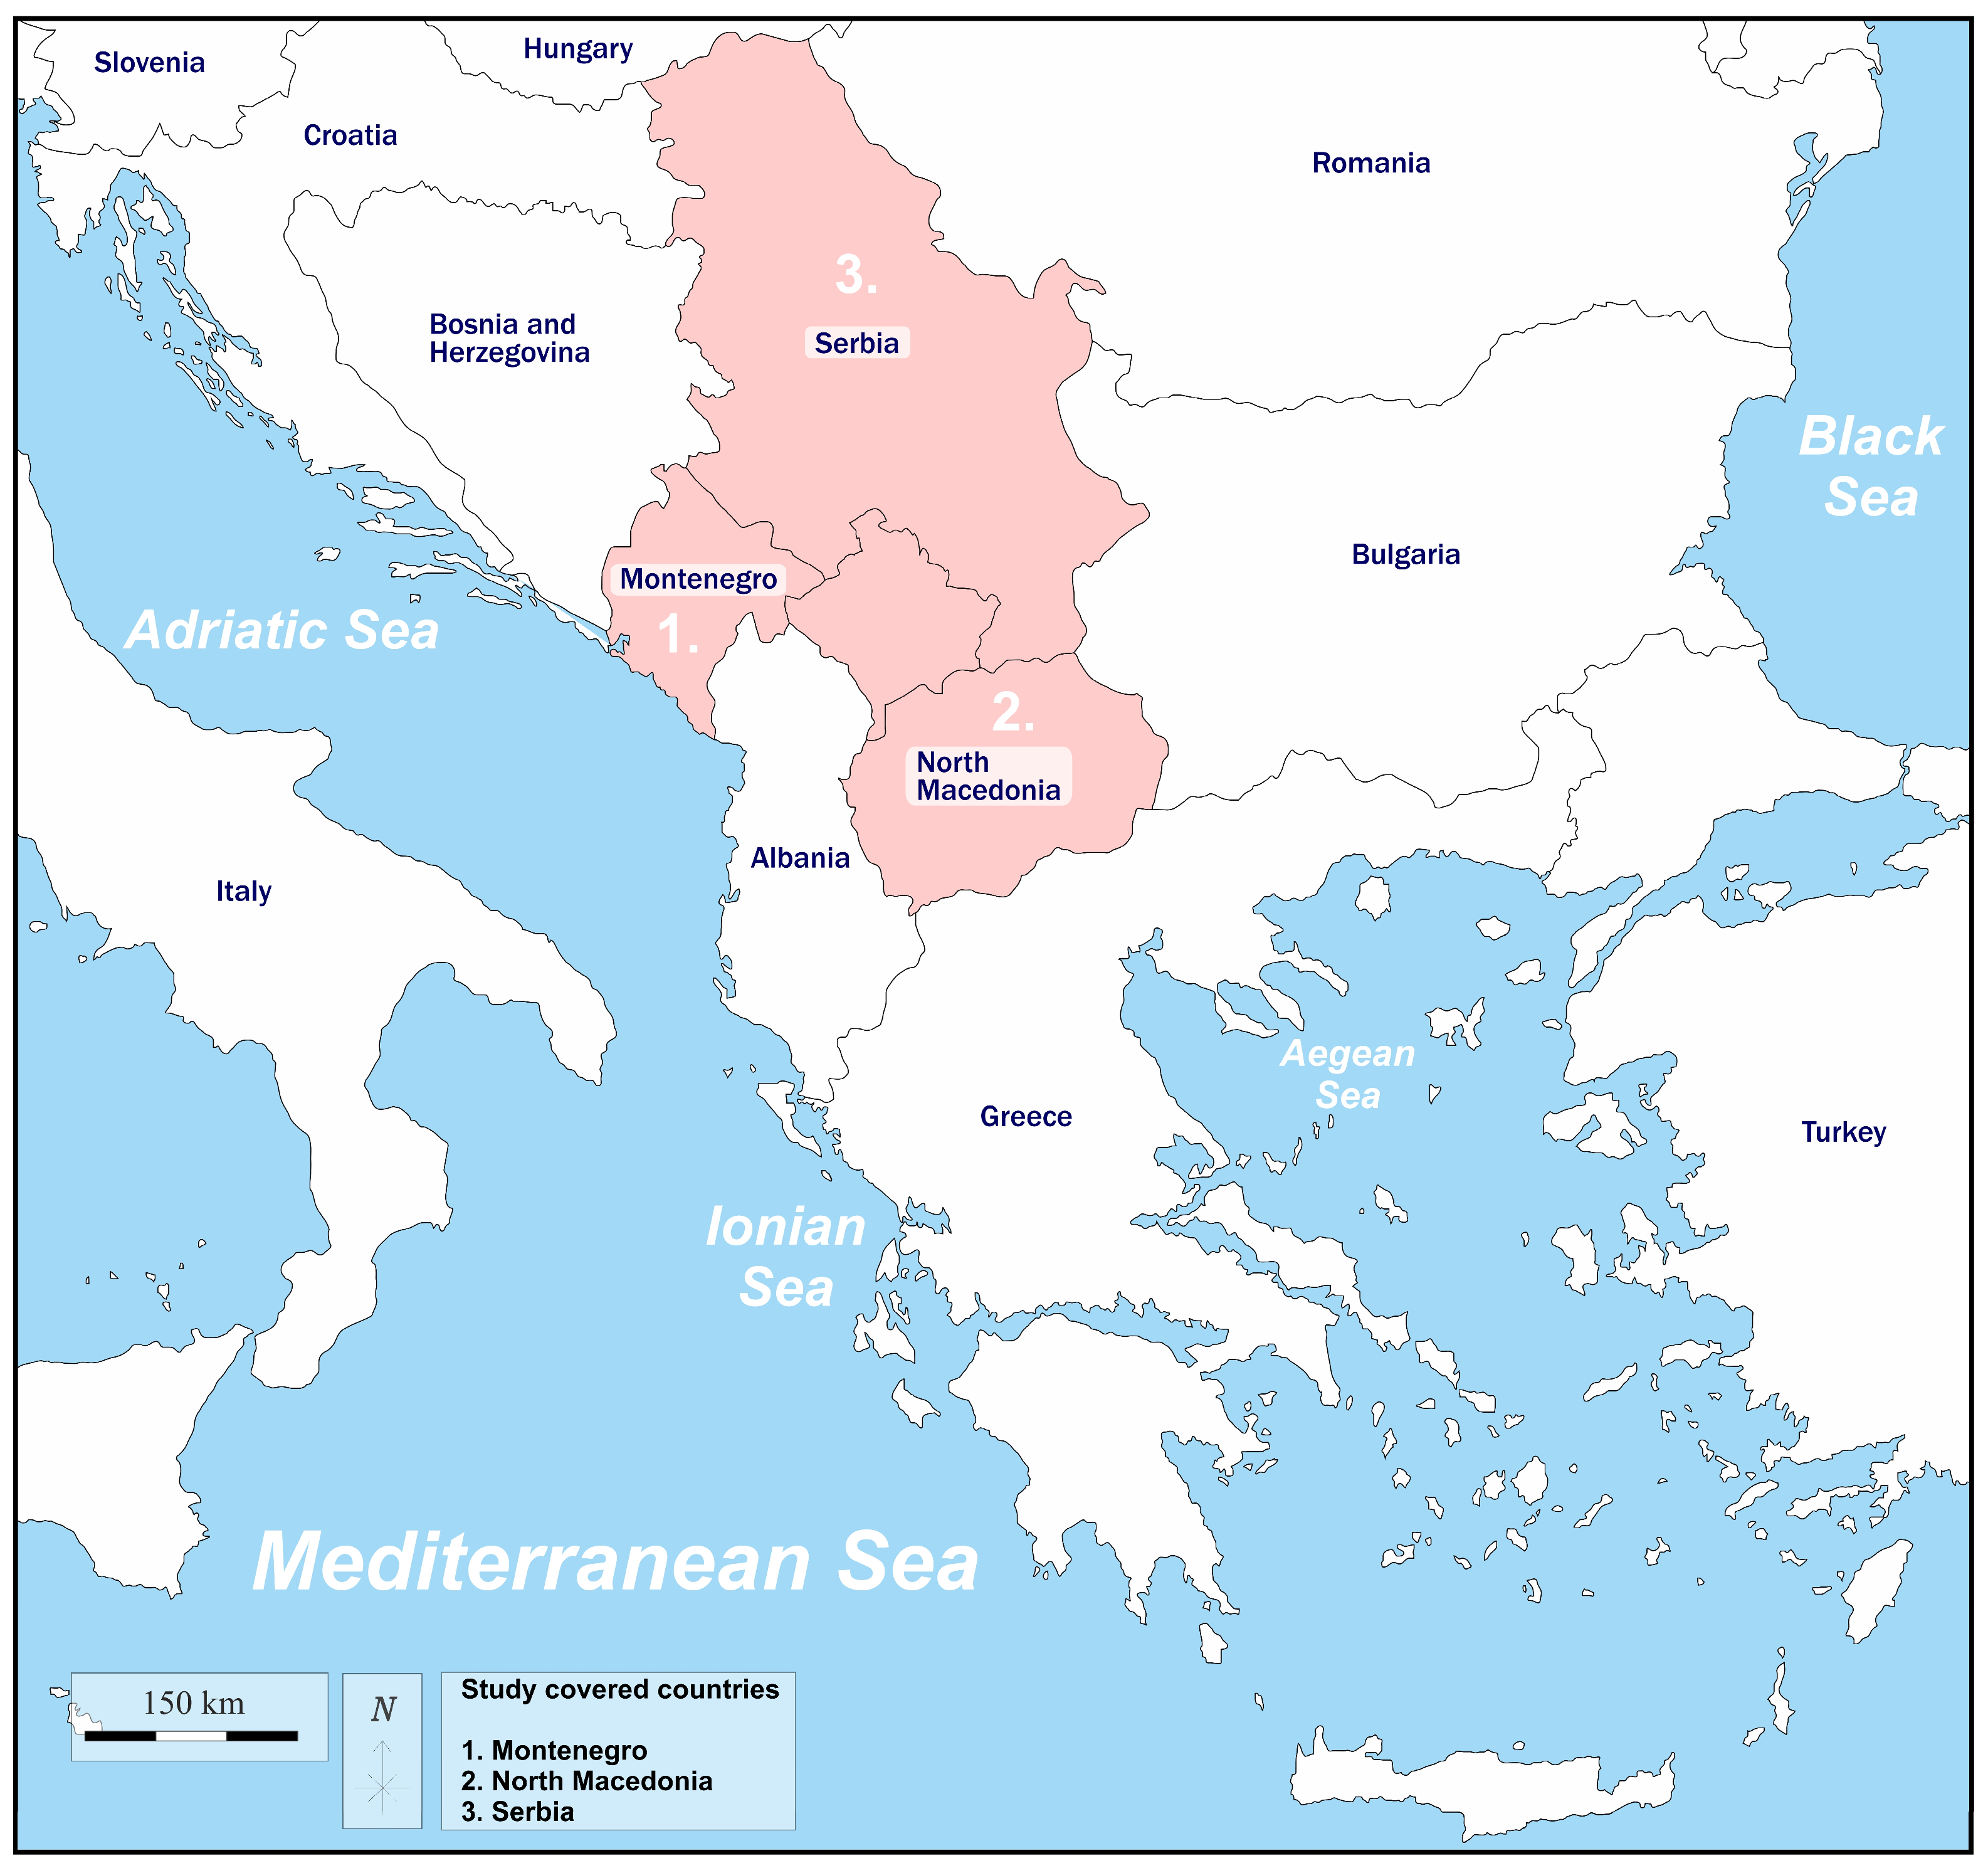
Disclaimer/Publisher’s Note: The statements, opinions and data contained in all publications are solely those of the individual author(s) and contributor(s) and not of MDPI and/or the editor(s). MDPI and/or the editor(s) disclaim responsibility for any injury to people or property resulting from any ideas, methods, instructions or products referred to in the content. |
© 2024 by the authors. Licensee MDPI, Basel, Switzerland. This article is an open access article distributed under the terms and conditions of the Creative Commons Attribution (CC BY) license (https://creativecommons.org/licenses/by/4.0/).