
Environmental Life Cycle Assessment of Two Types of Flexible Plastic Packaging under a Sustainable Circular Economy Approach


Abstract
1. Introduction
2. Materials and Methods
2.1. Goal and Scope Definition
2.2. Inventory Data Collection
2.2.1. Scenario Details of PET/Metallized PET/PE
2.2.2. Scenario Details of PP/Metallized PP/PP
2.3. Life Cycle Impact Assessment
2.4. Interpretation
3. Results
3.1. Environmental Impact Analysis (EIA)
3.1.1. PET/Metallized PET/PE
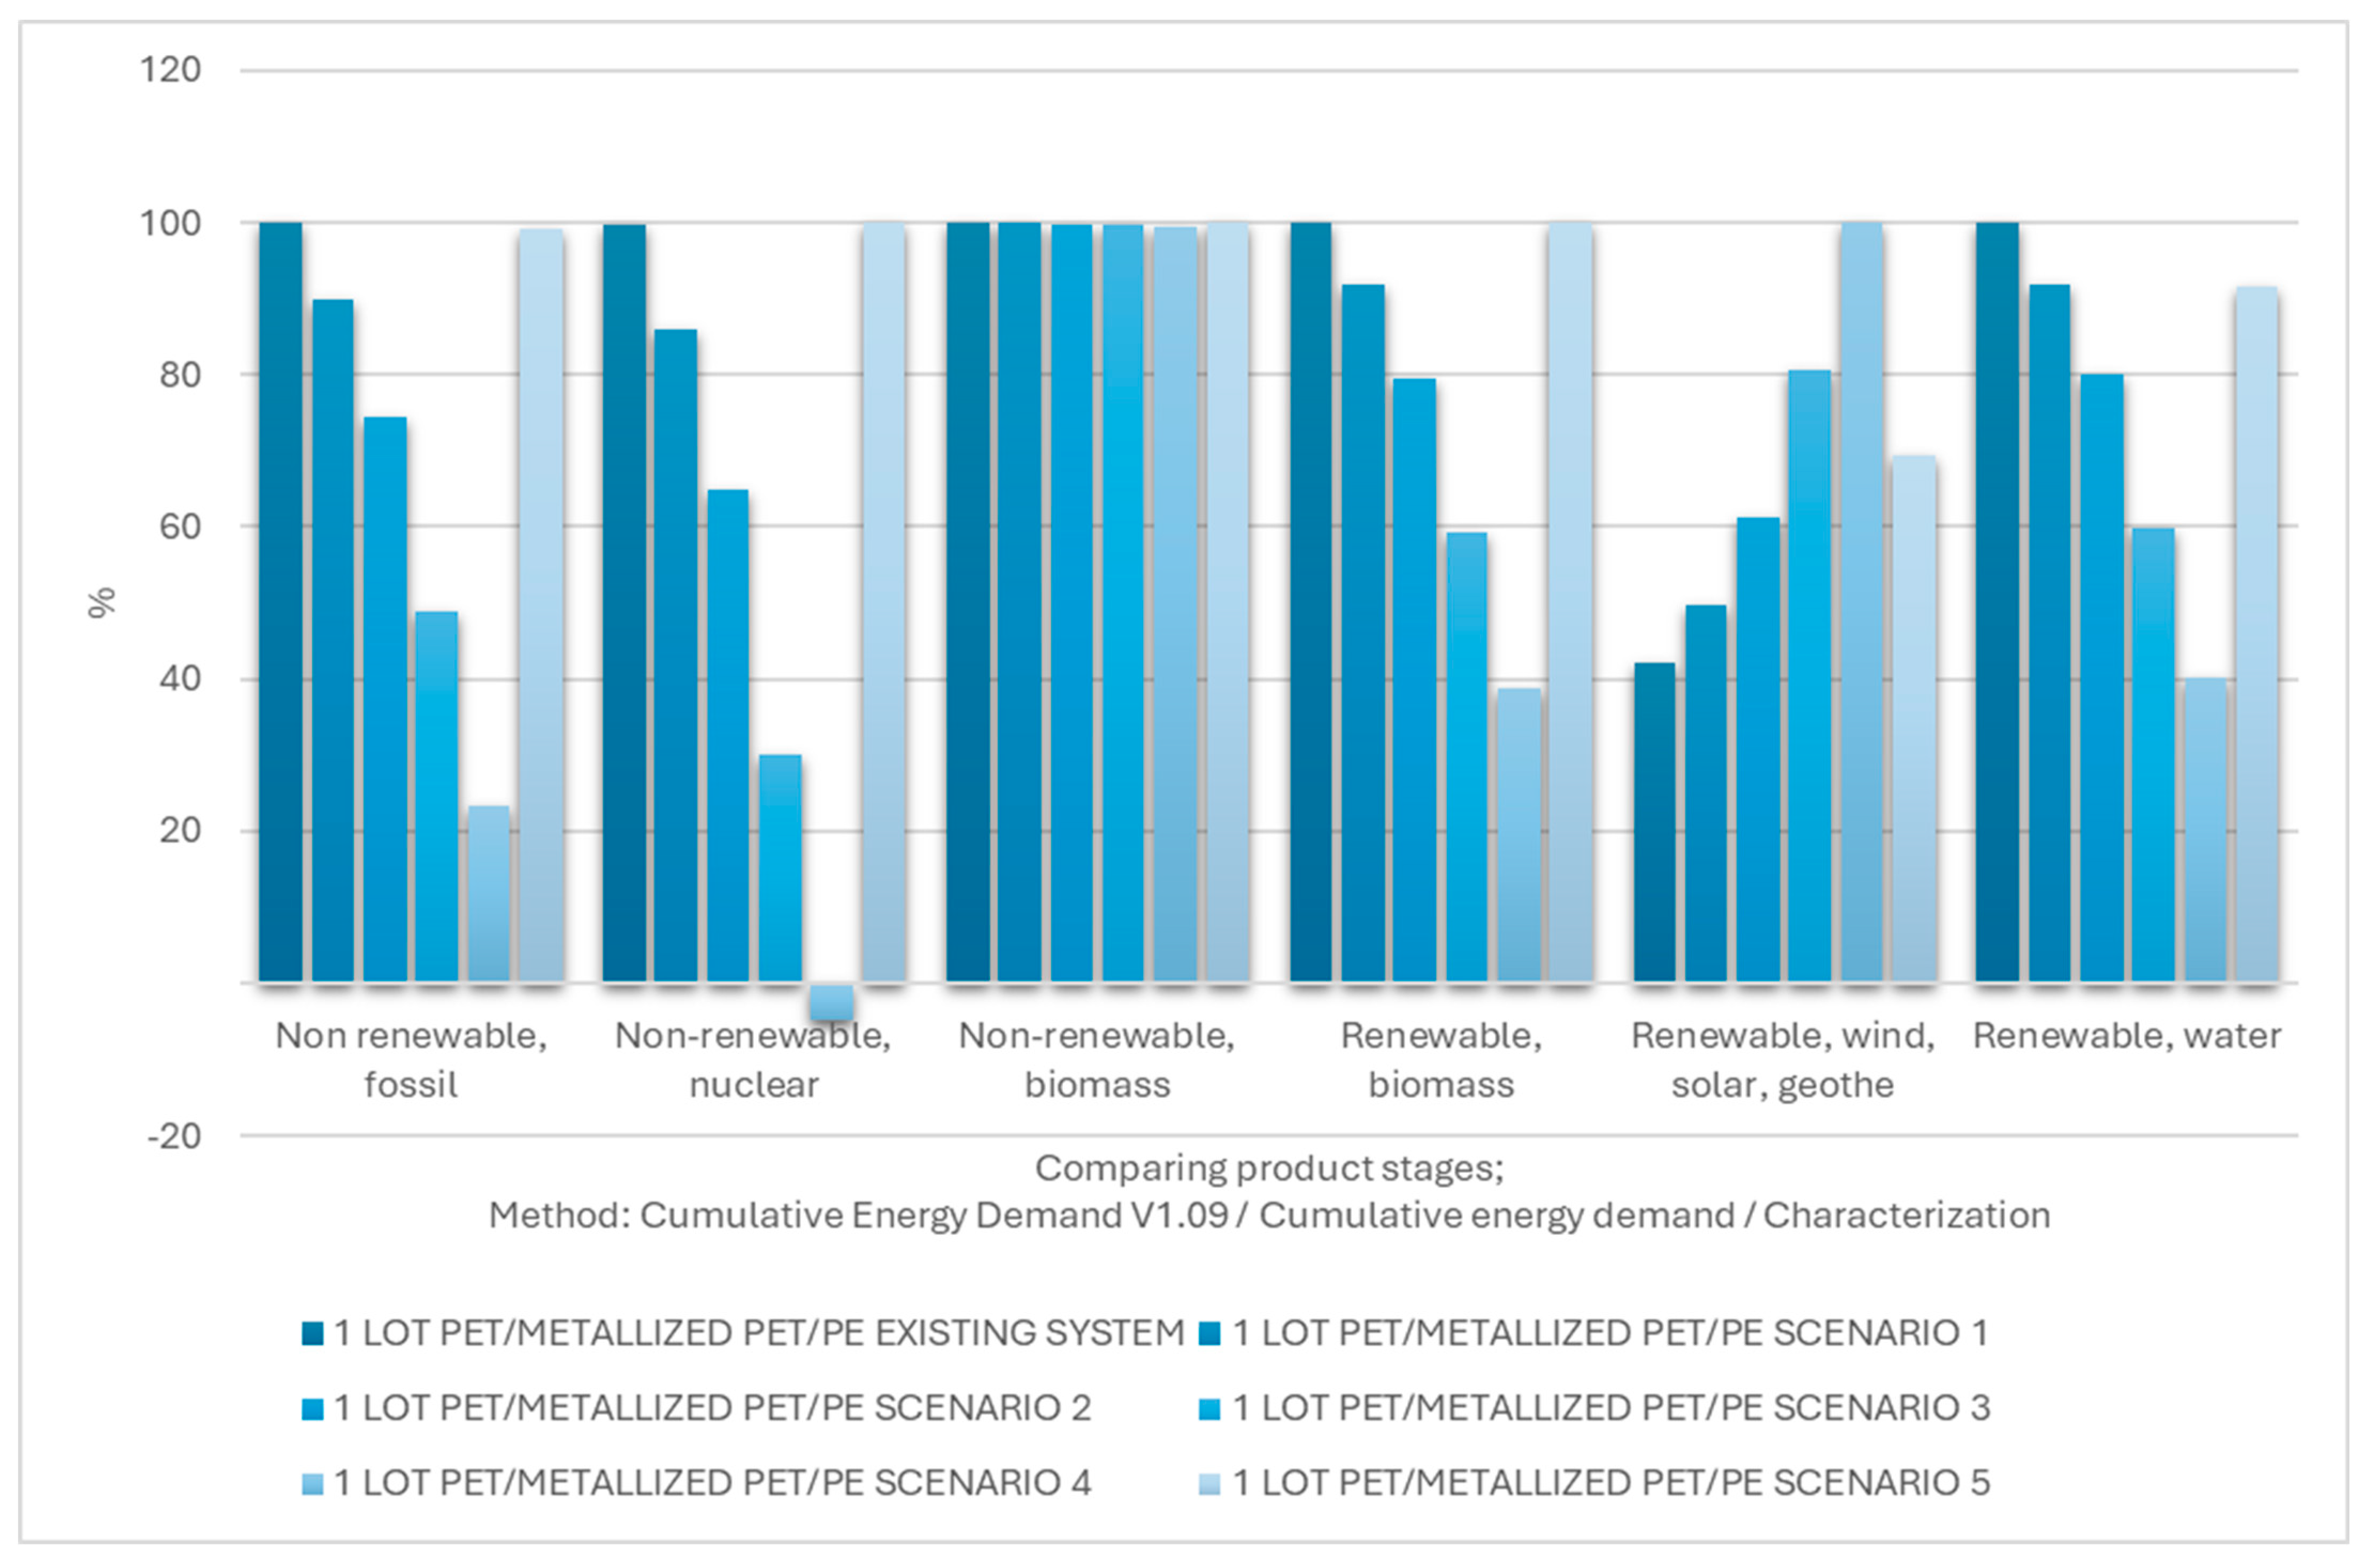
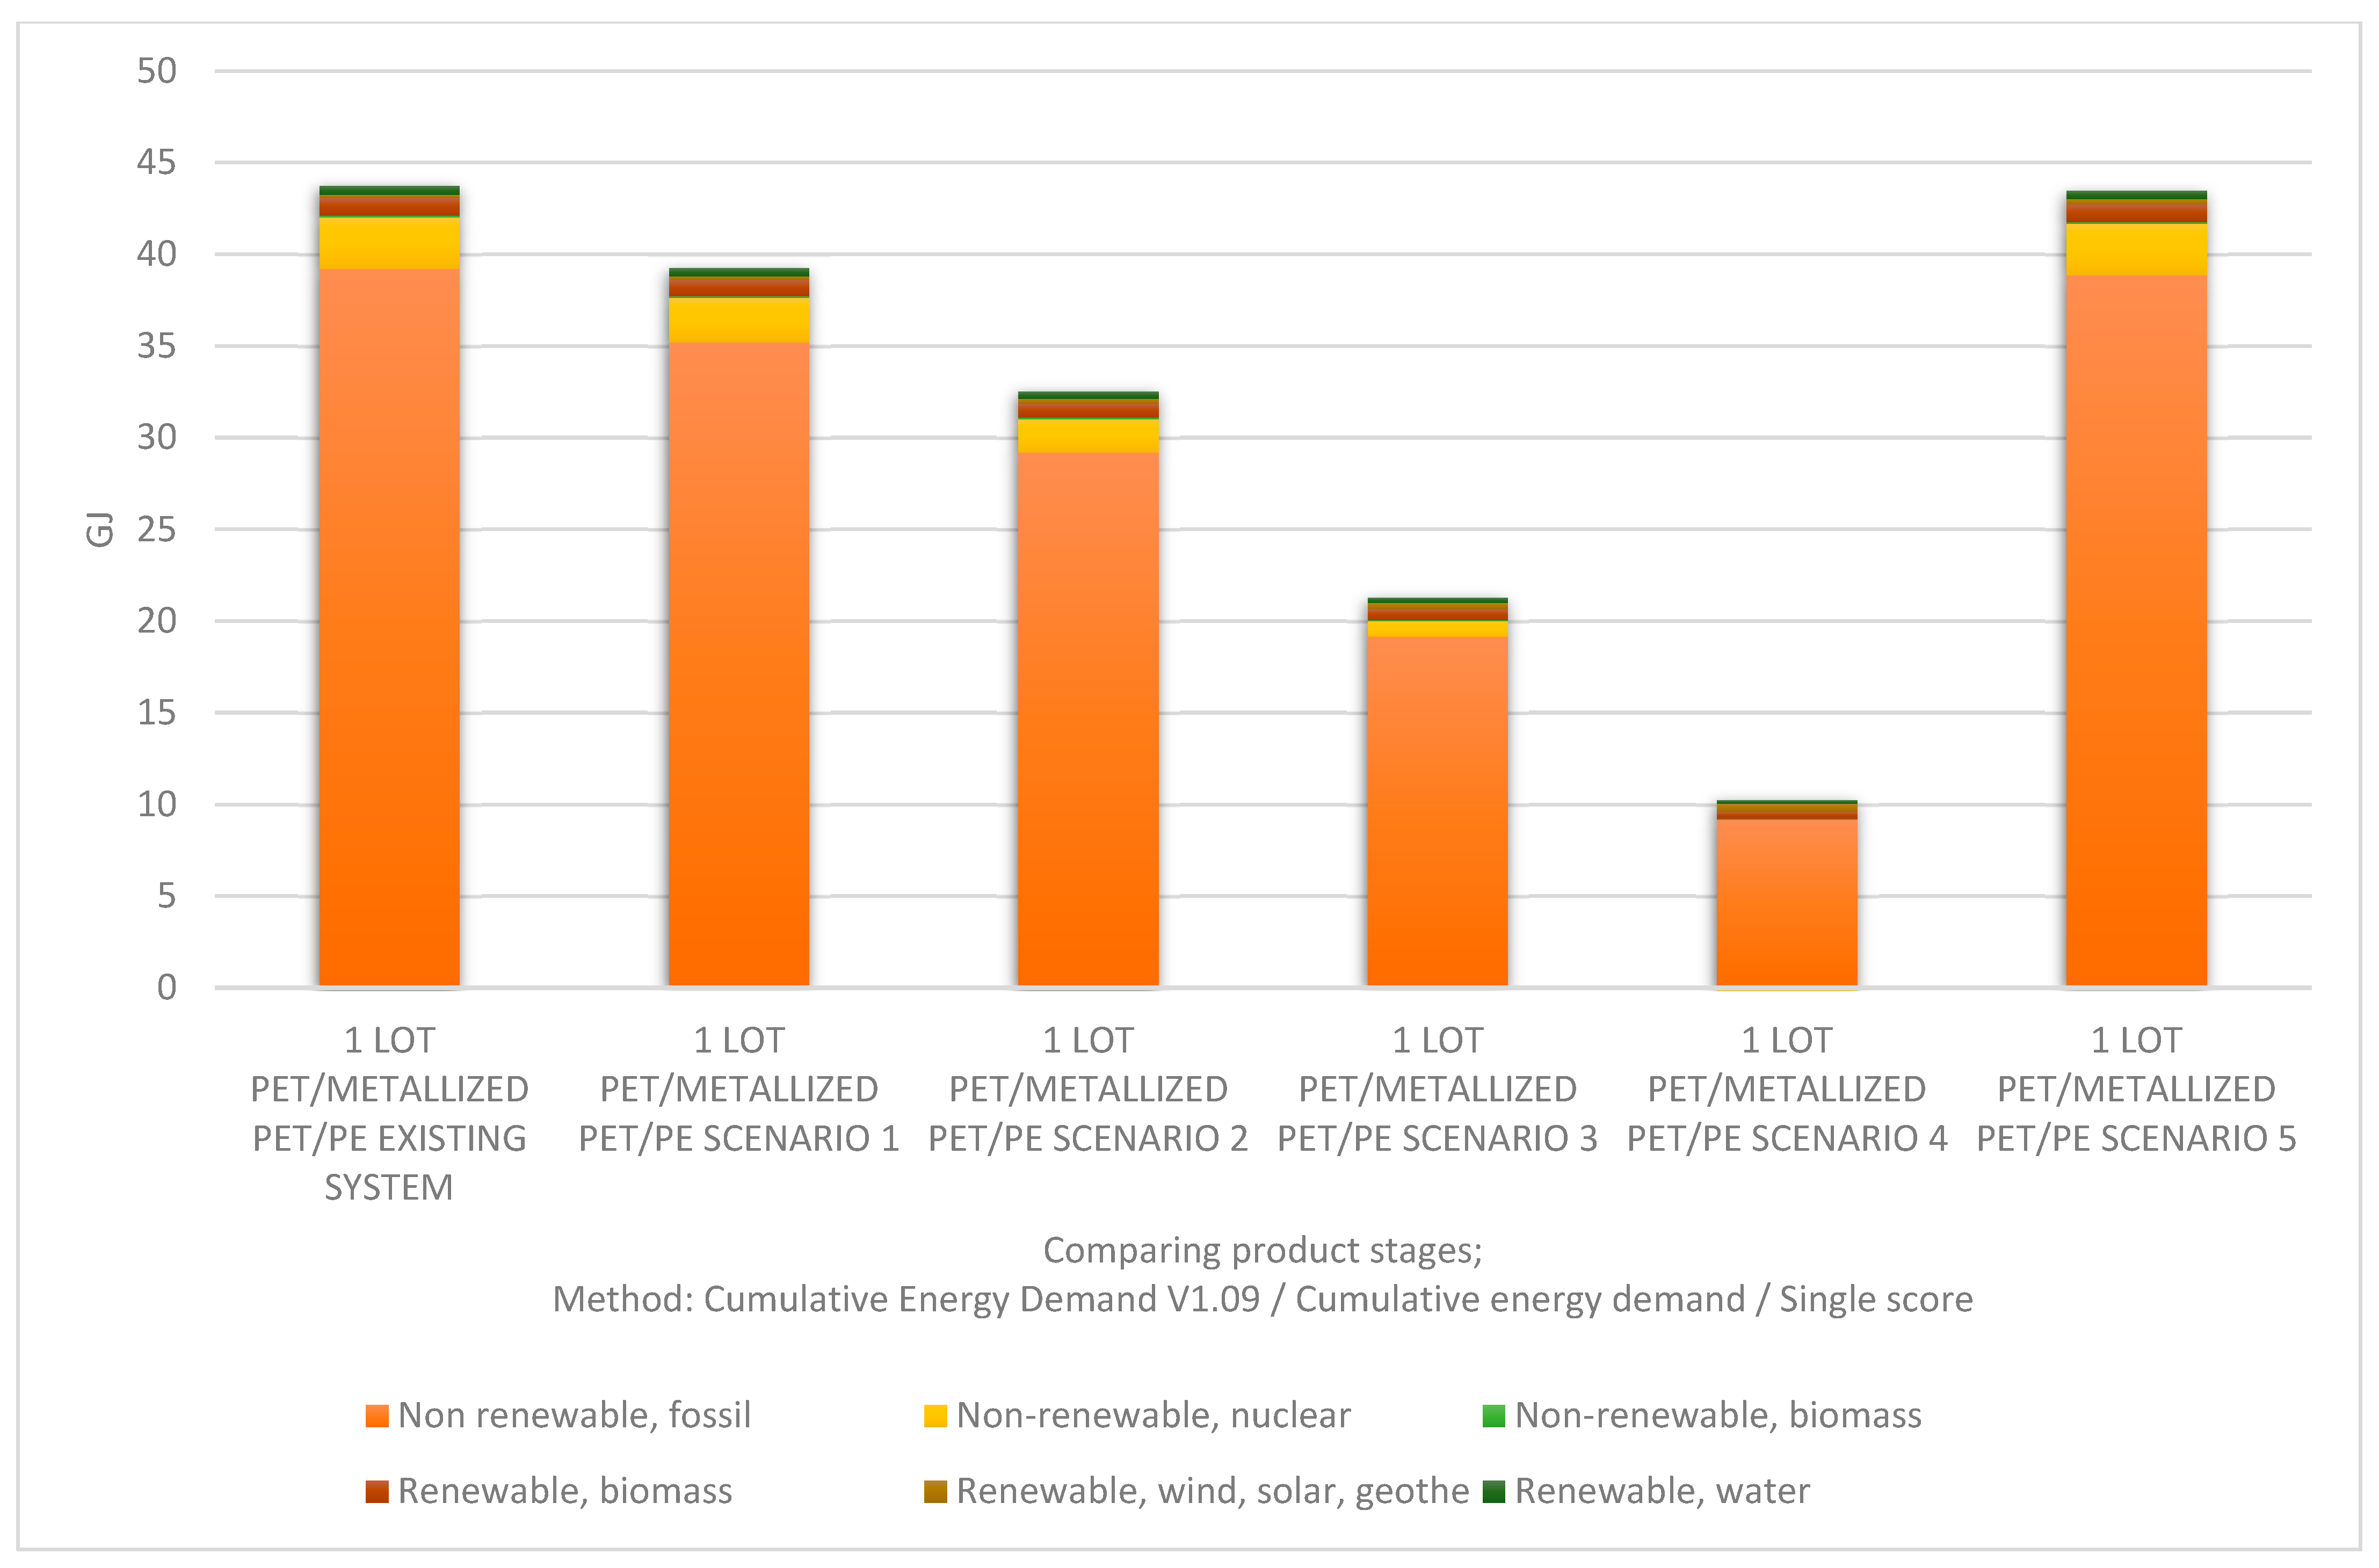
Cumulative Energy Demand (CED)
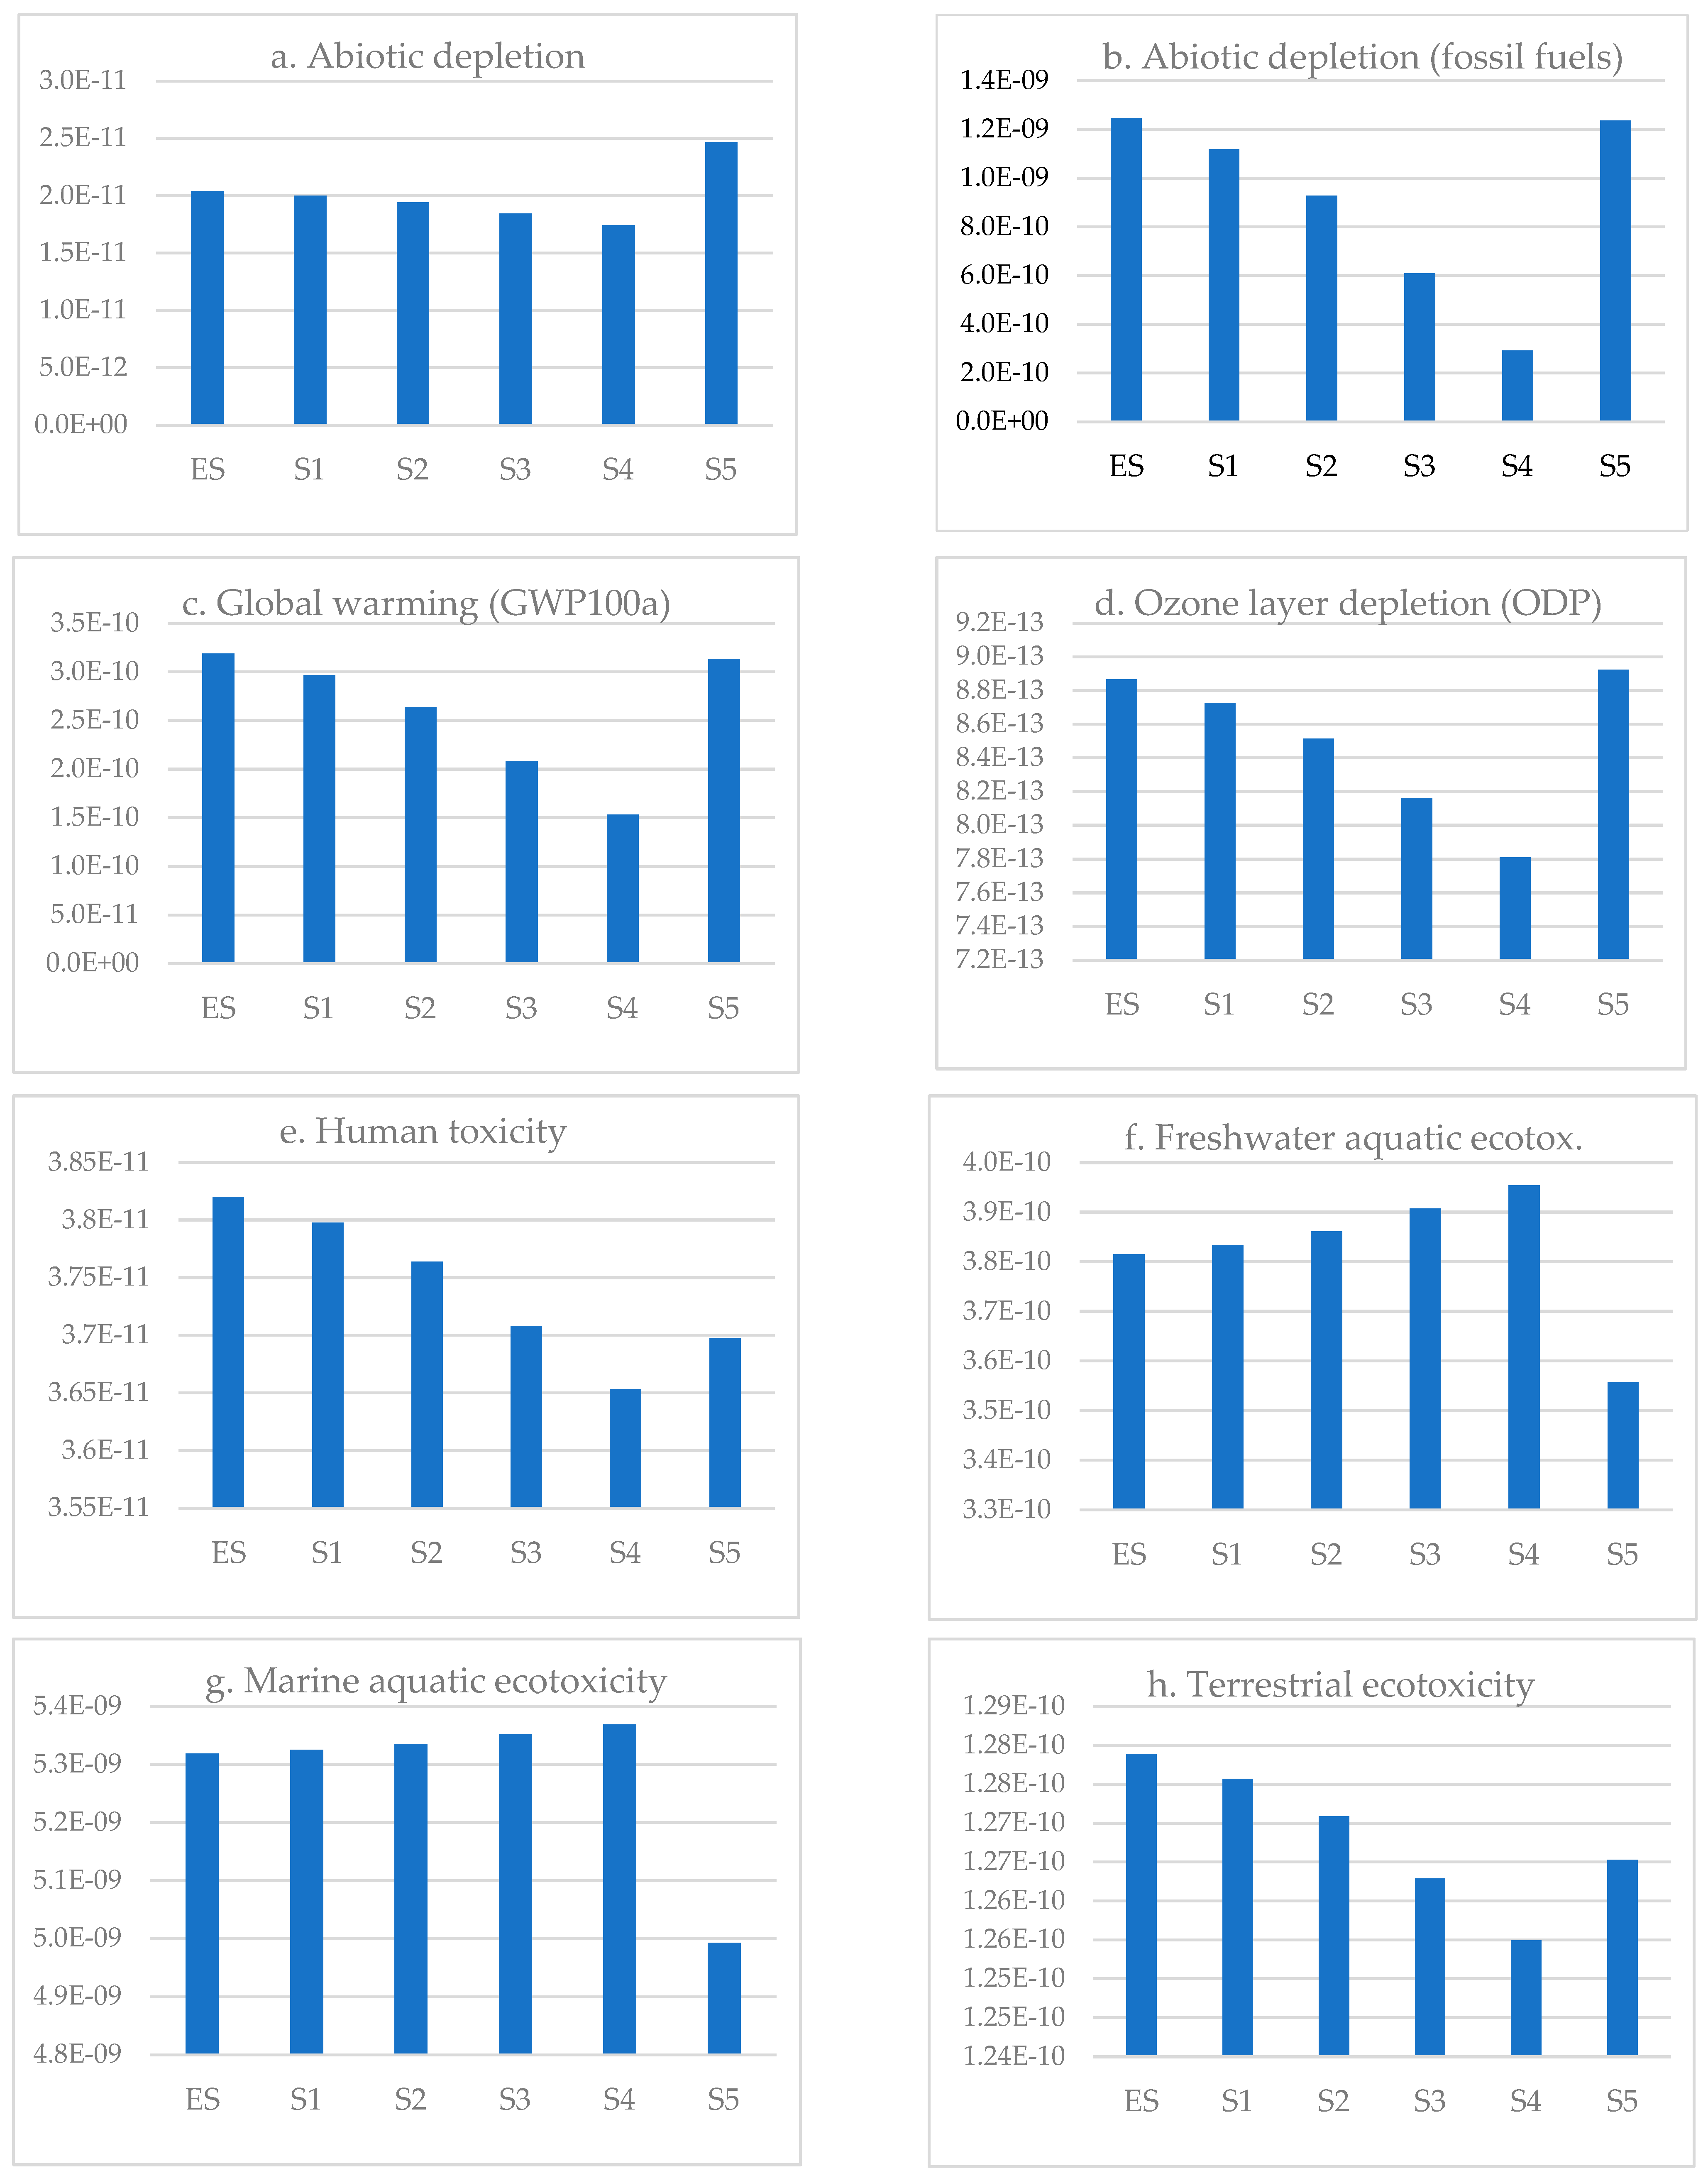
CML-IA
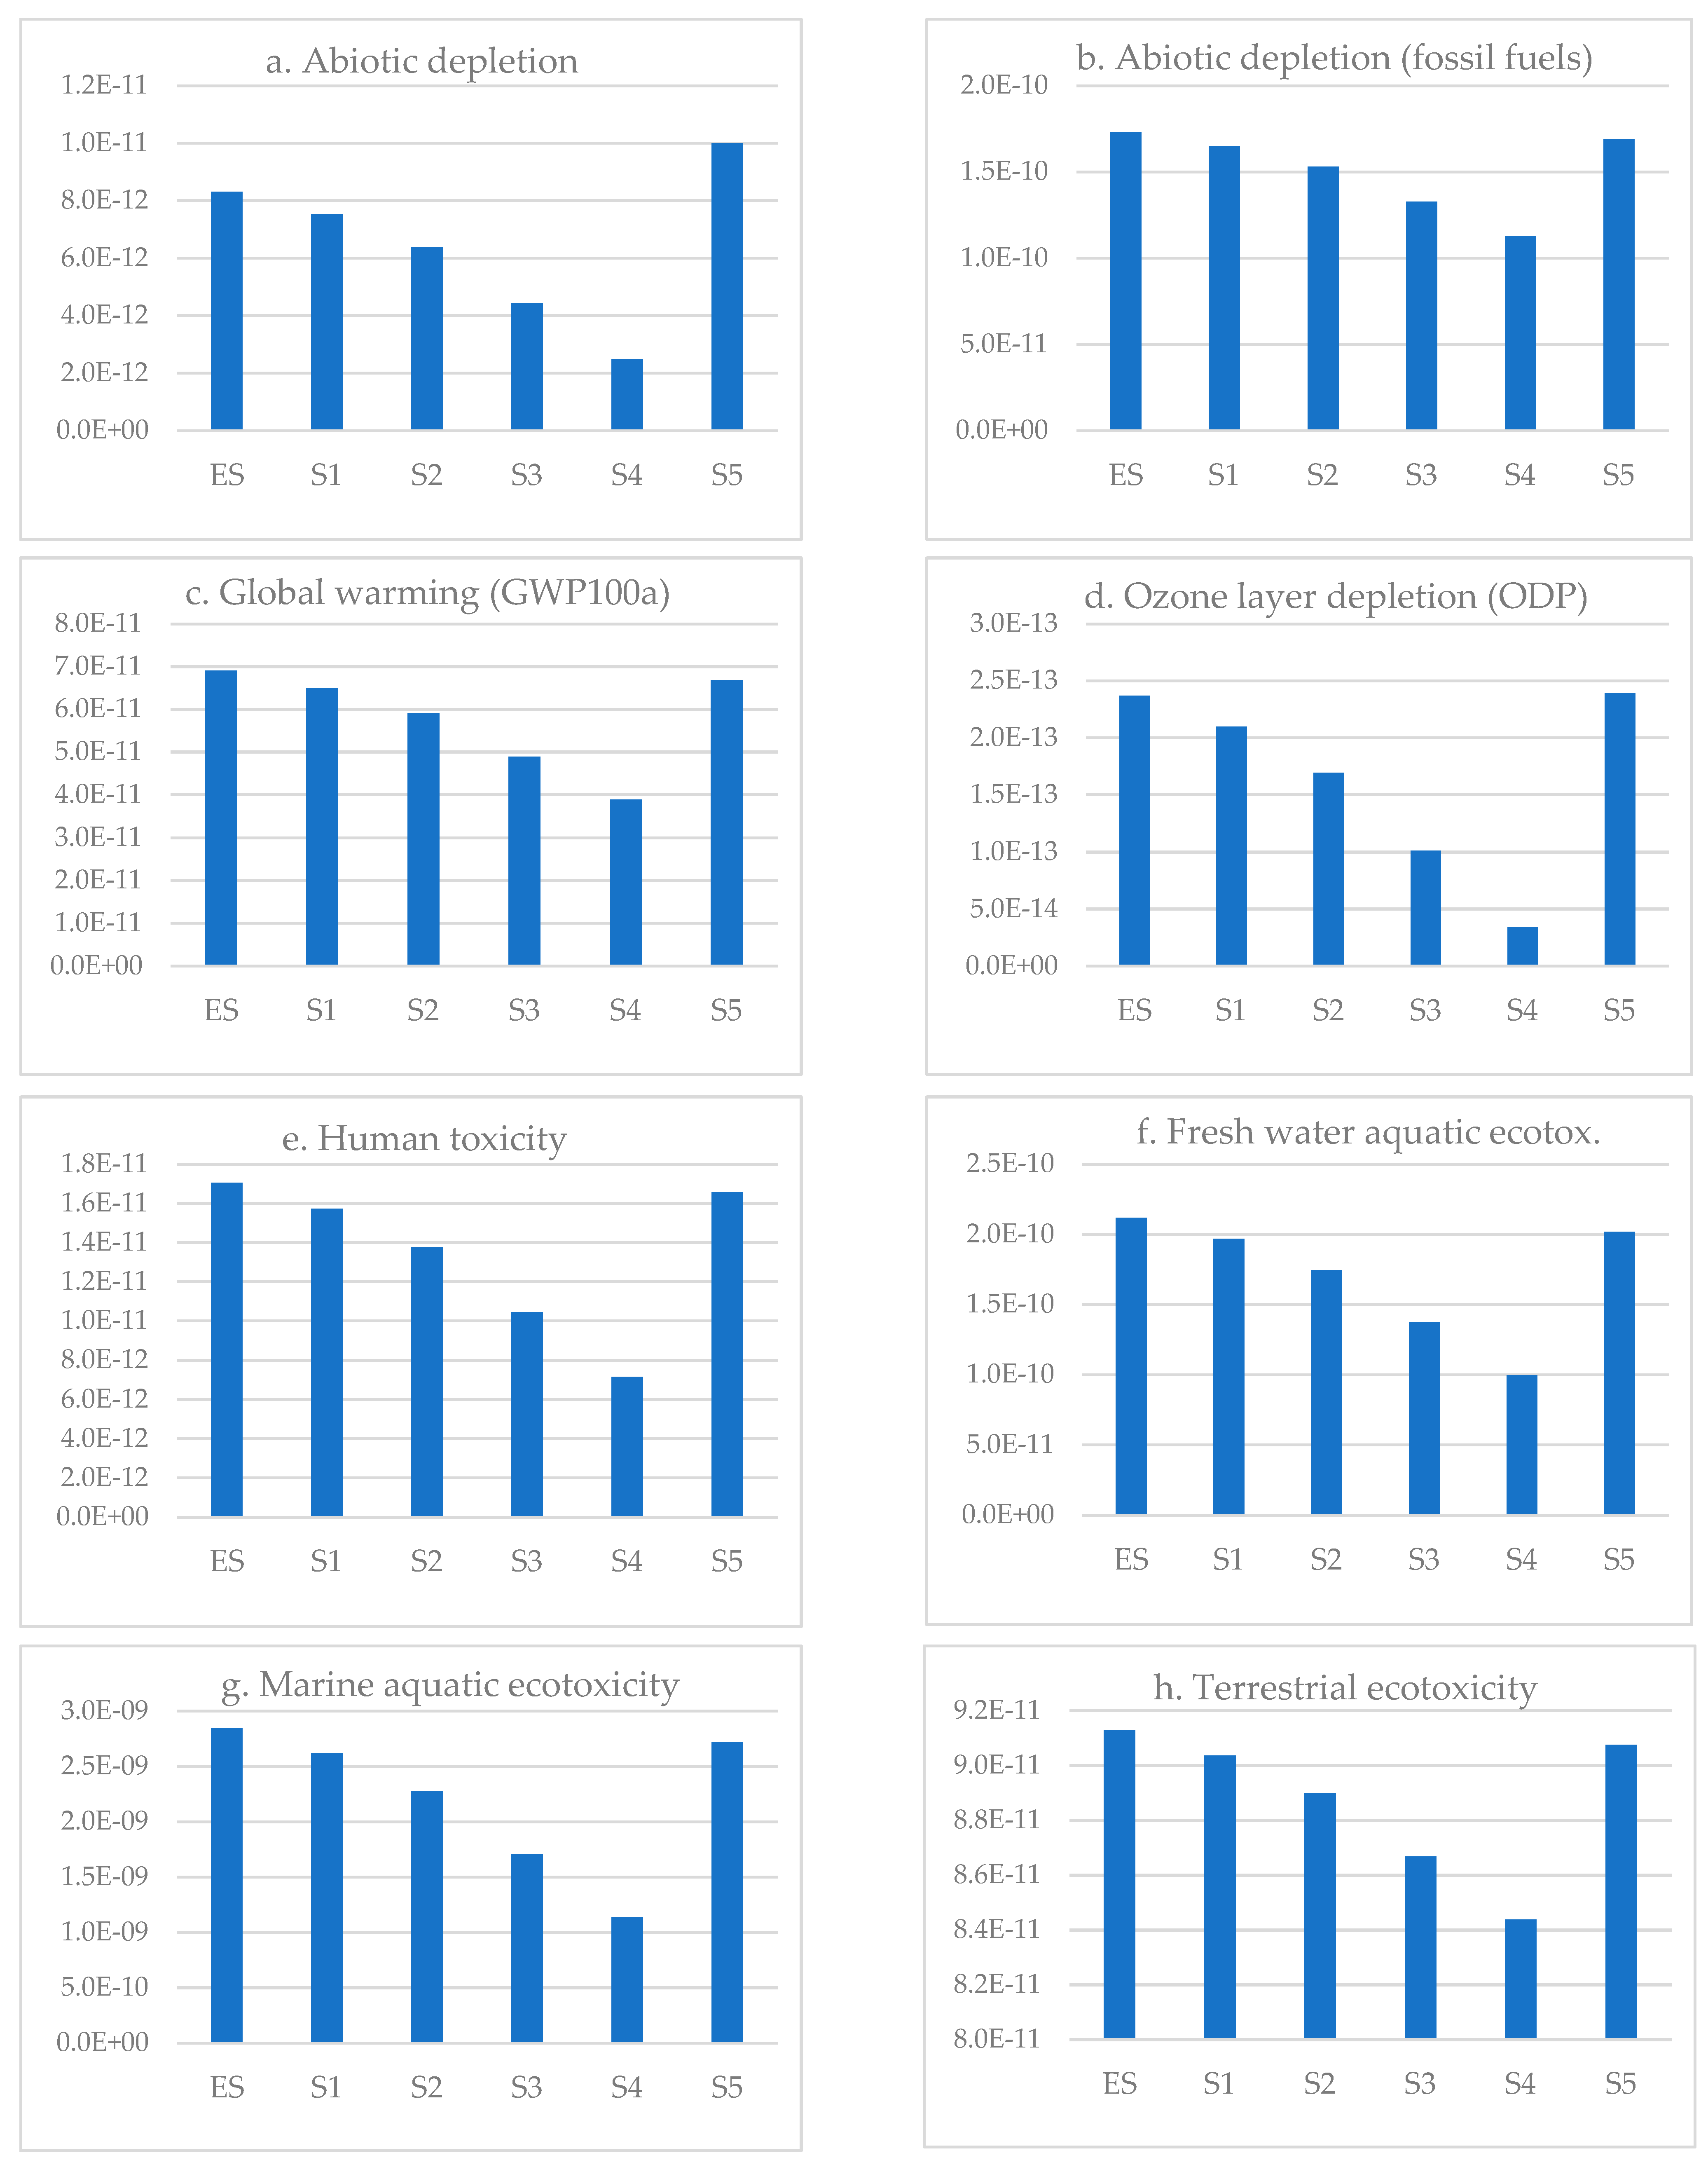
- Abiotic depletion
- Abiotic depletion (fossil)
- Global warming (GWP100a)
- Ozone layer depletion (ODP)
- Human toxicity
- Freshwater aquatic ecotoxicity
- Marine aquatic ecotoxicity
- Terrestrial ecotoxicity
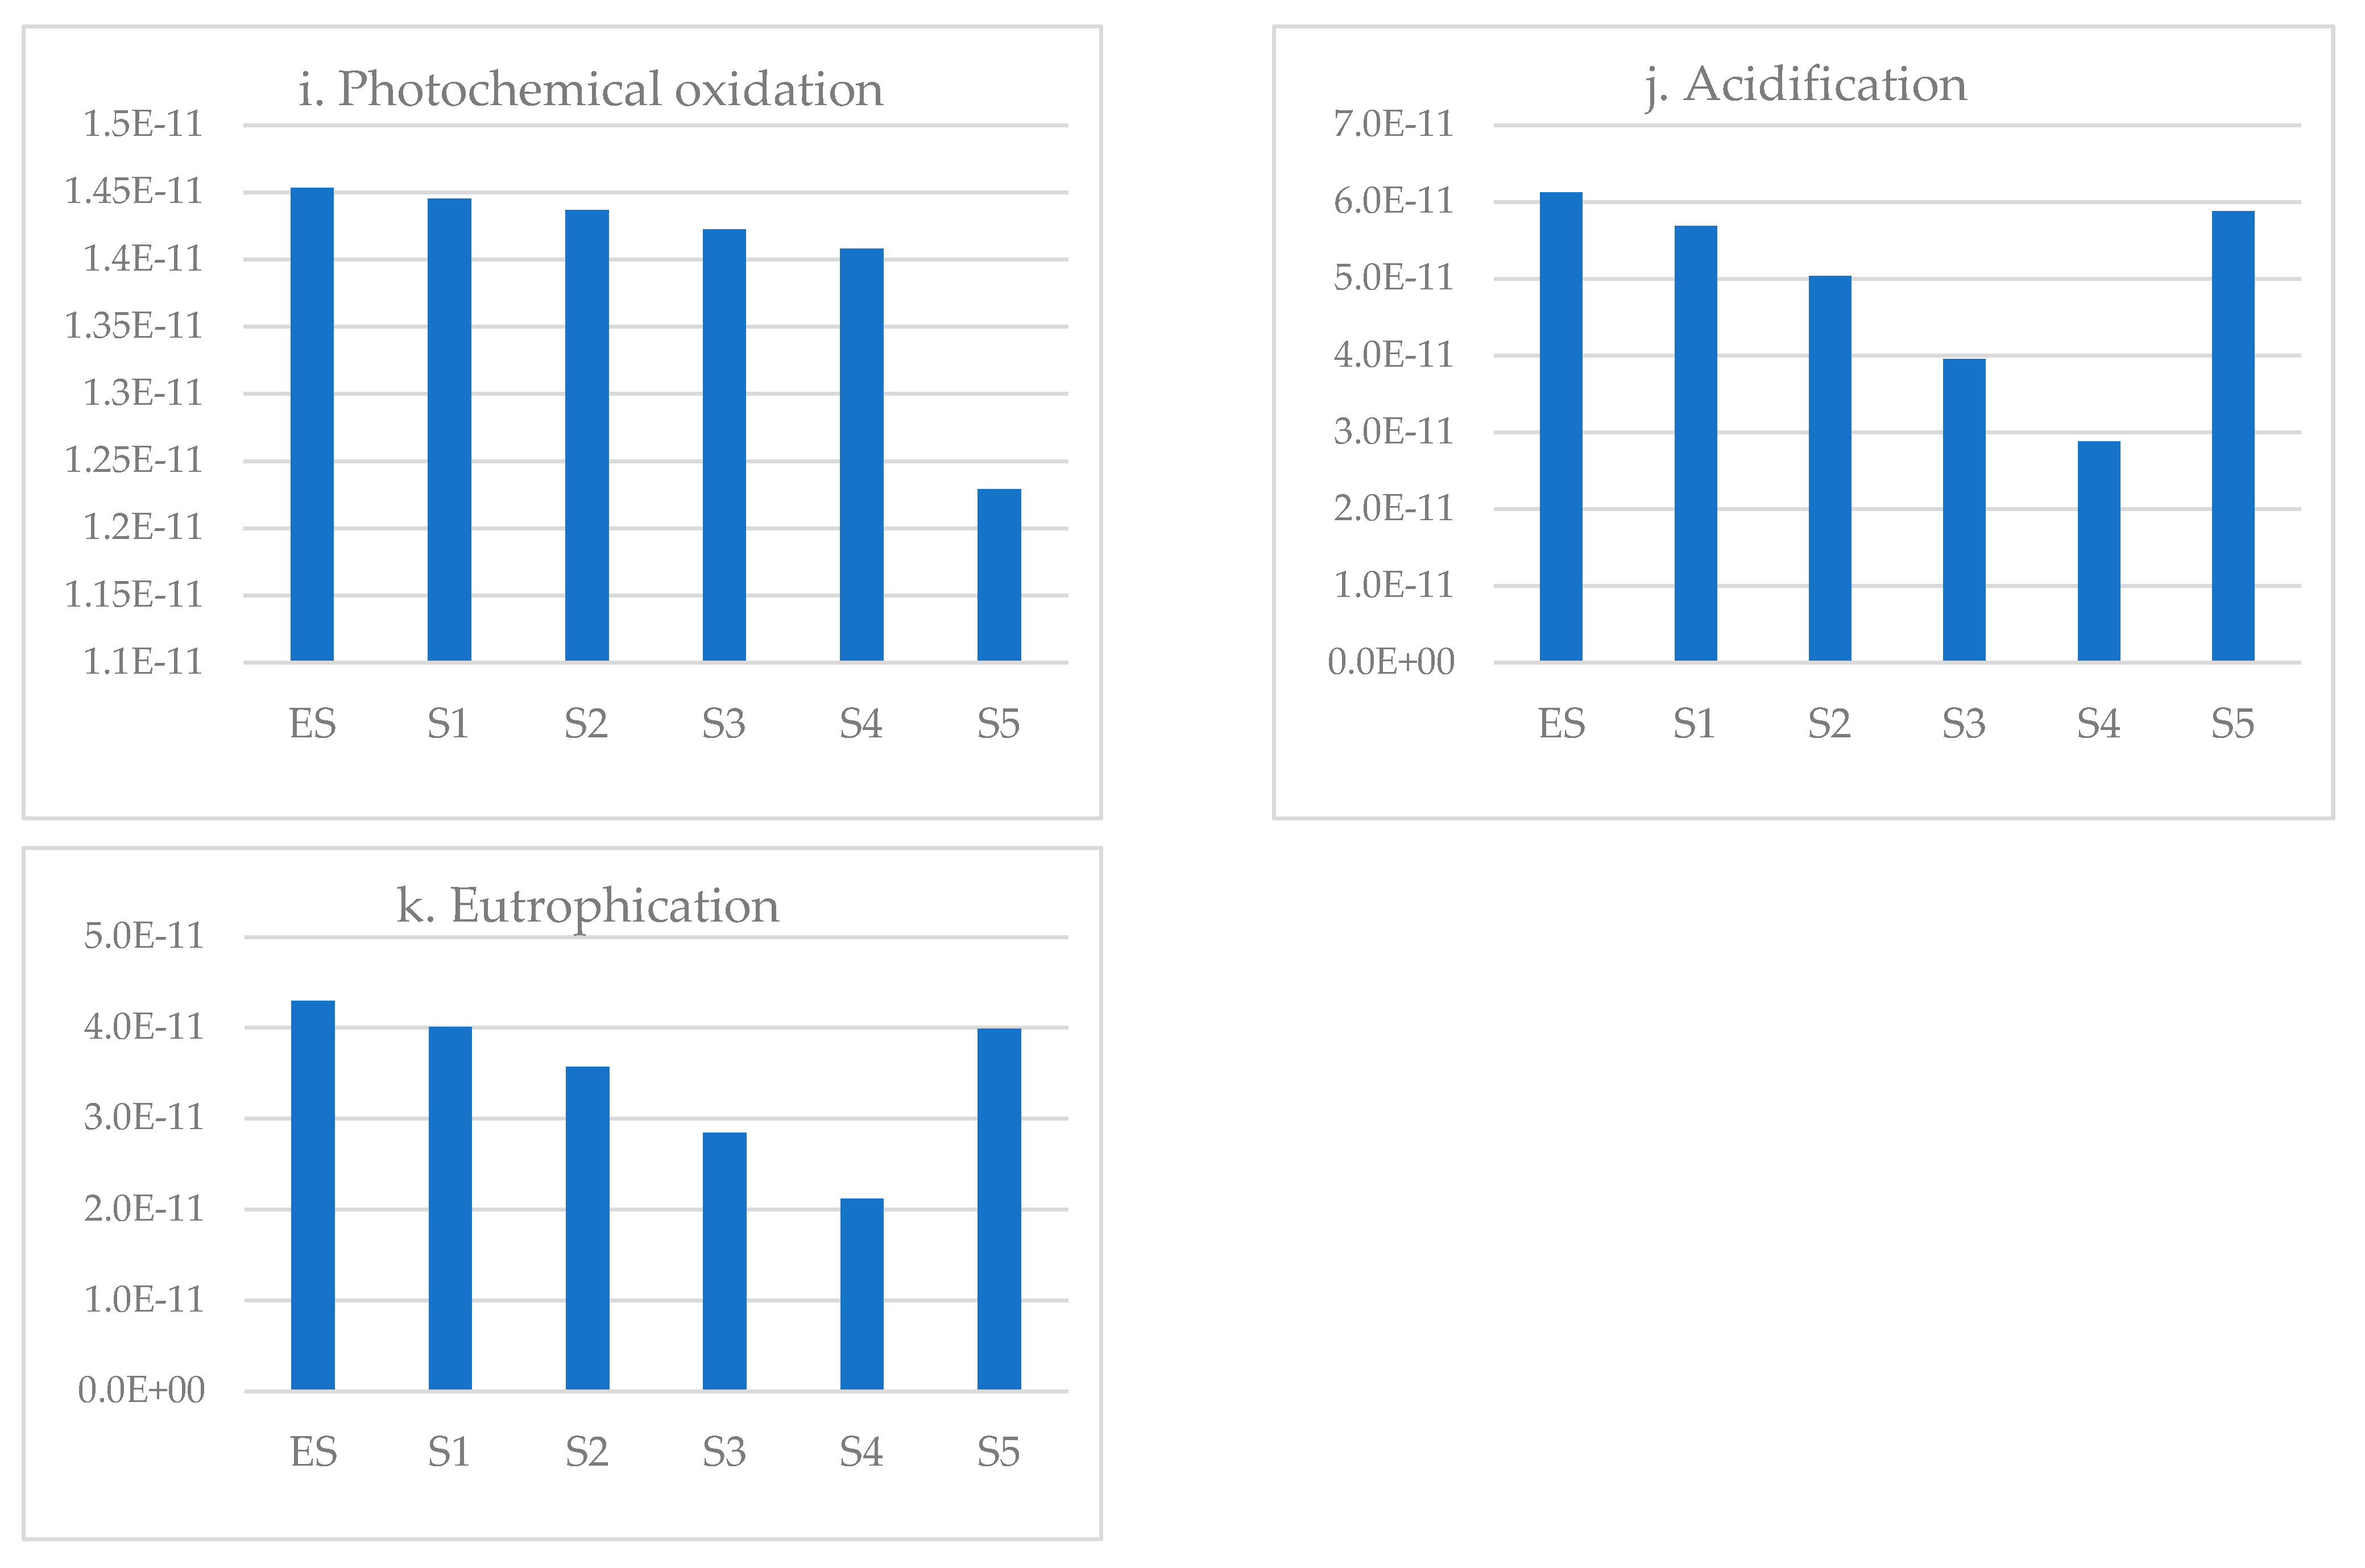
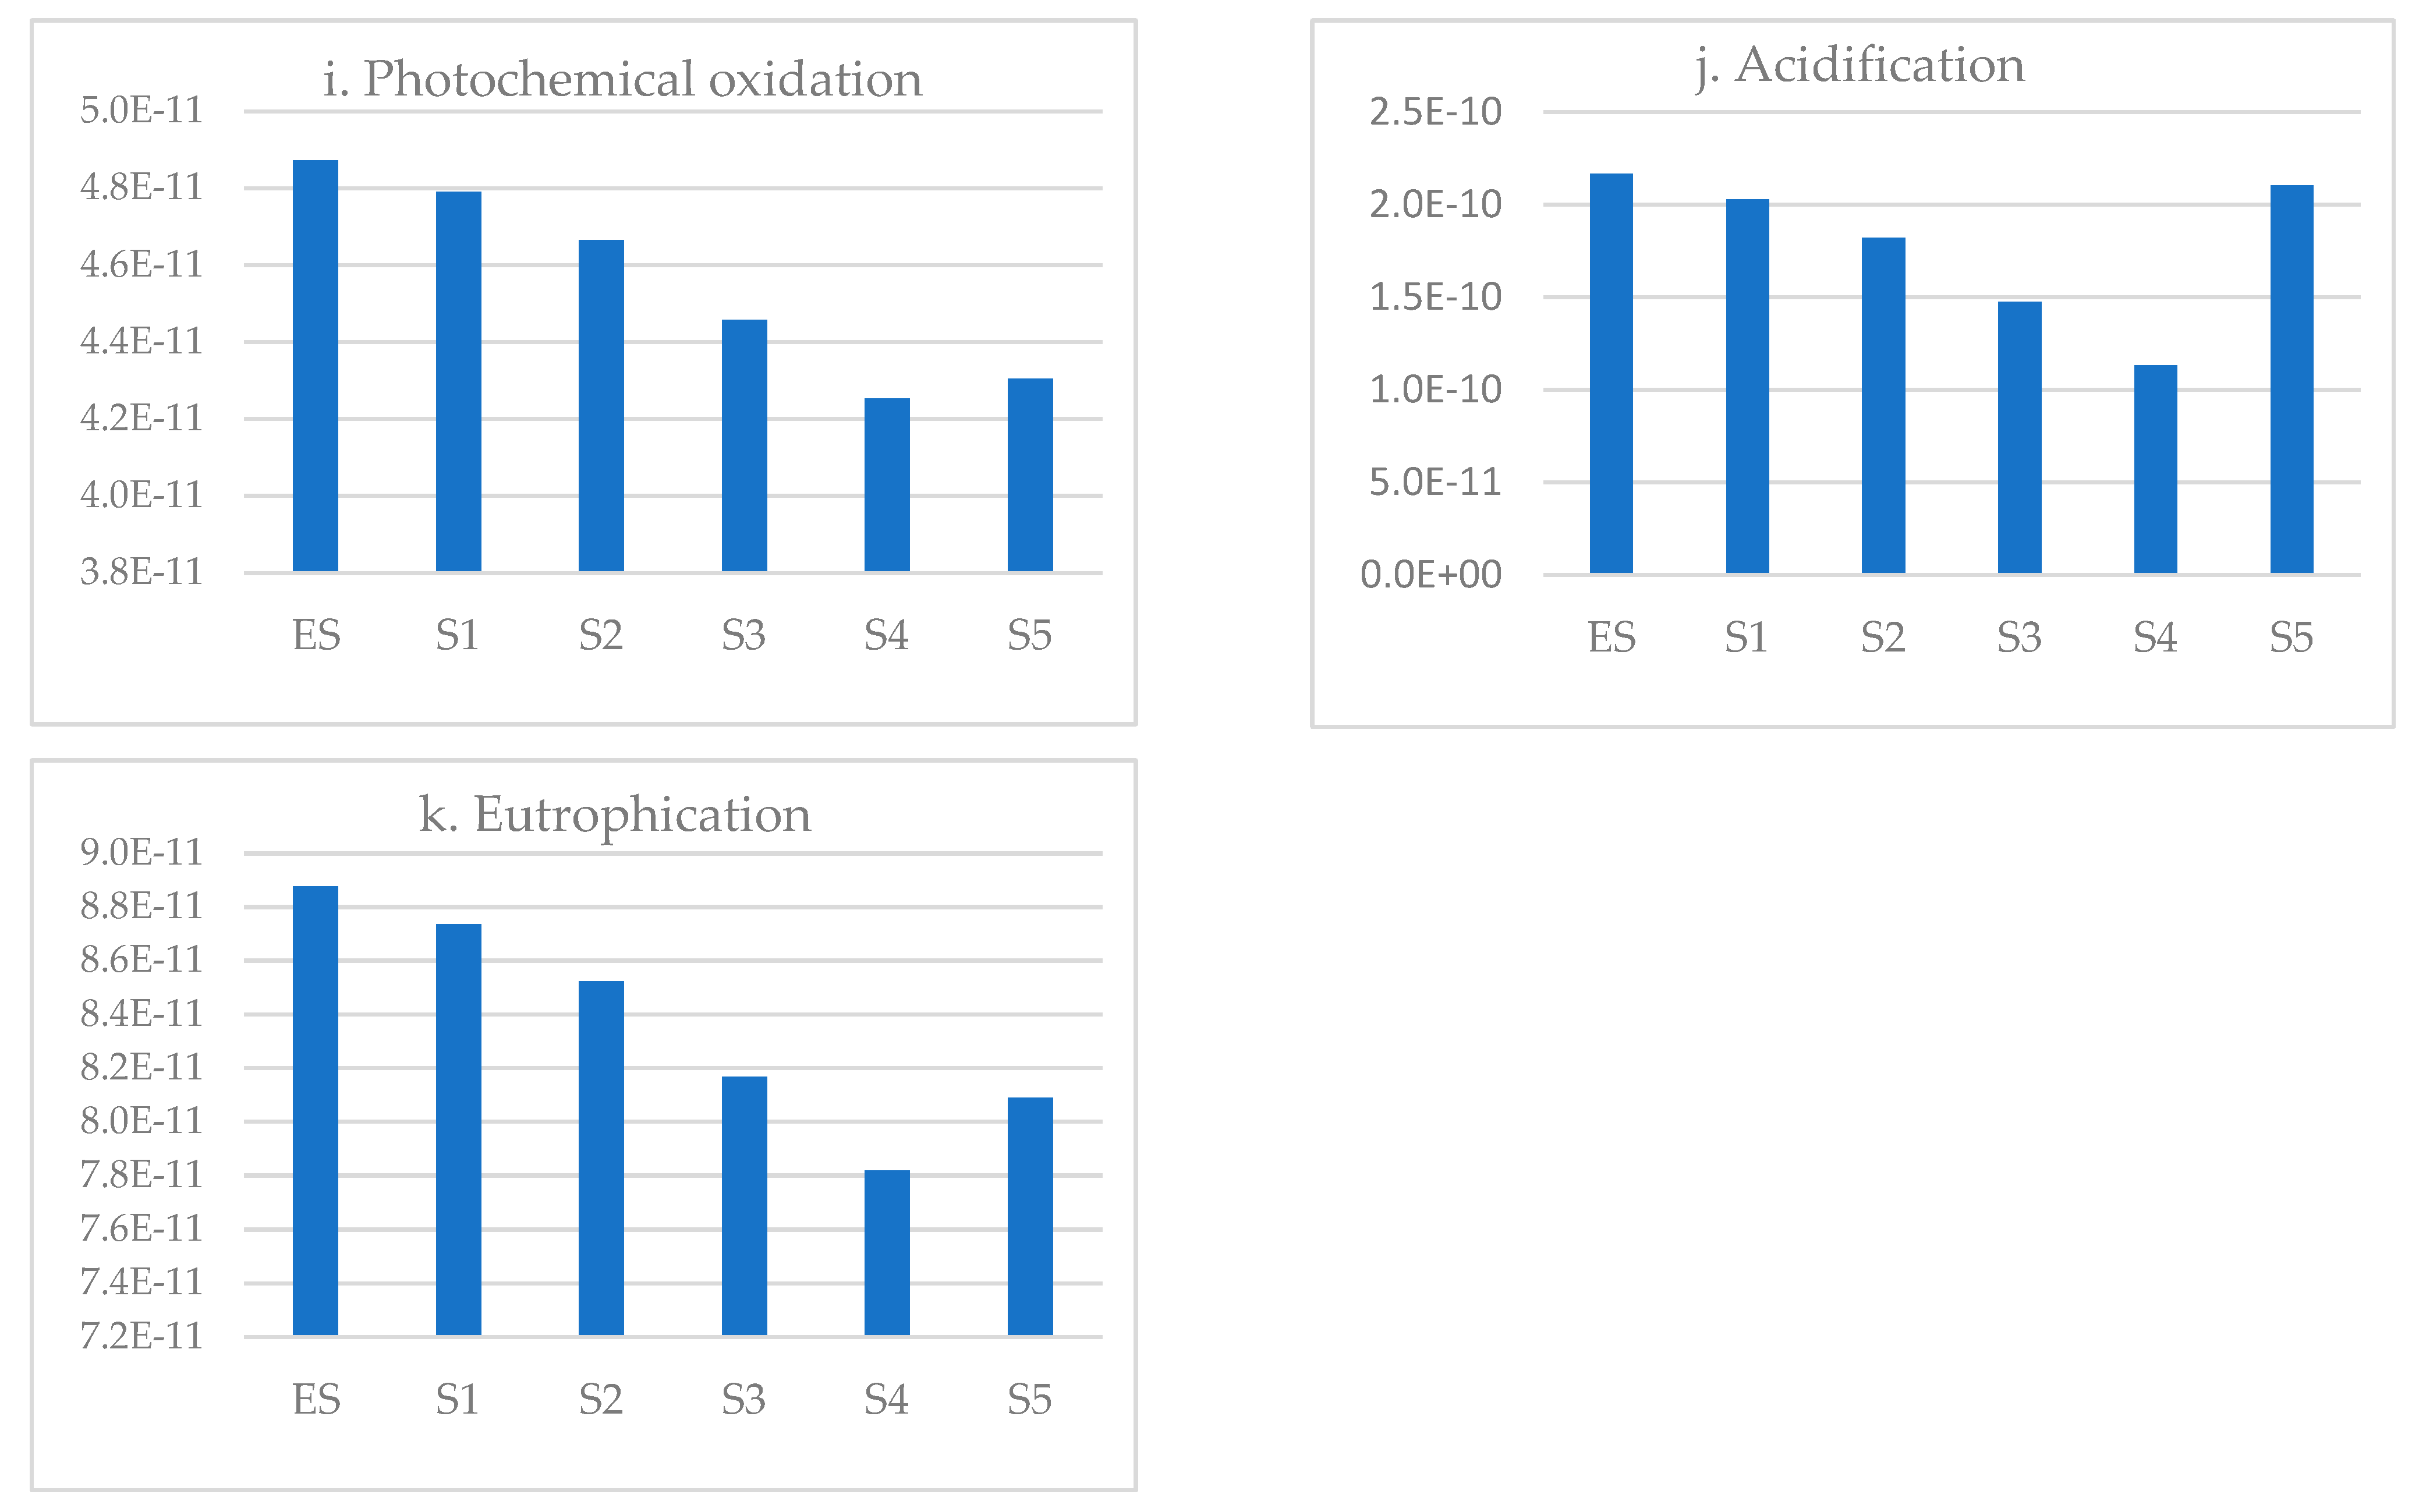
- Photochemical oxidation
- Acidification
- Eutrophication
3.1.2. PP/Metallized PP/PP
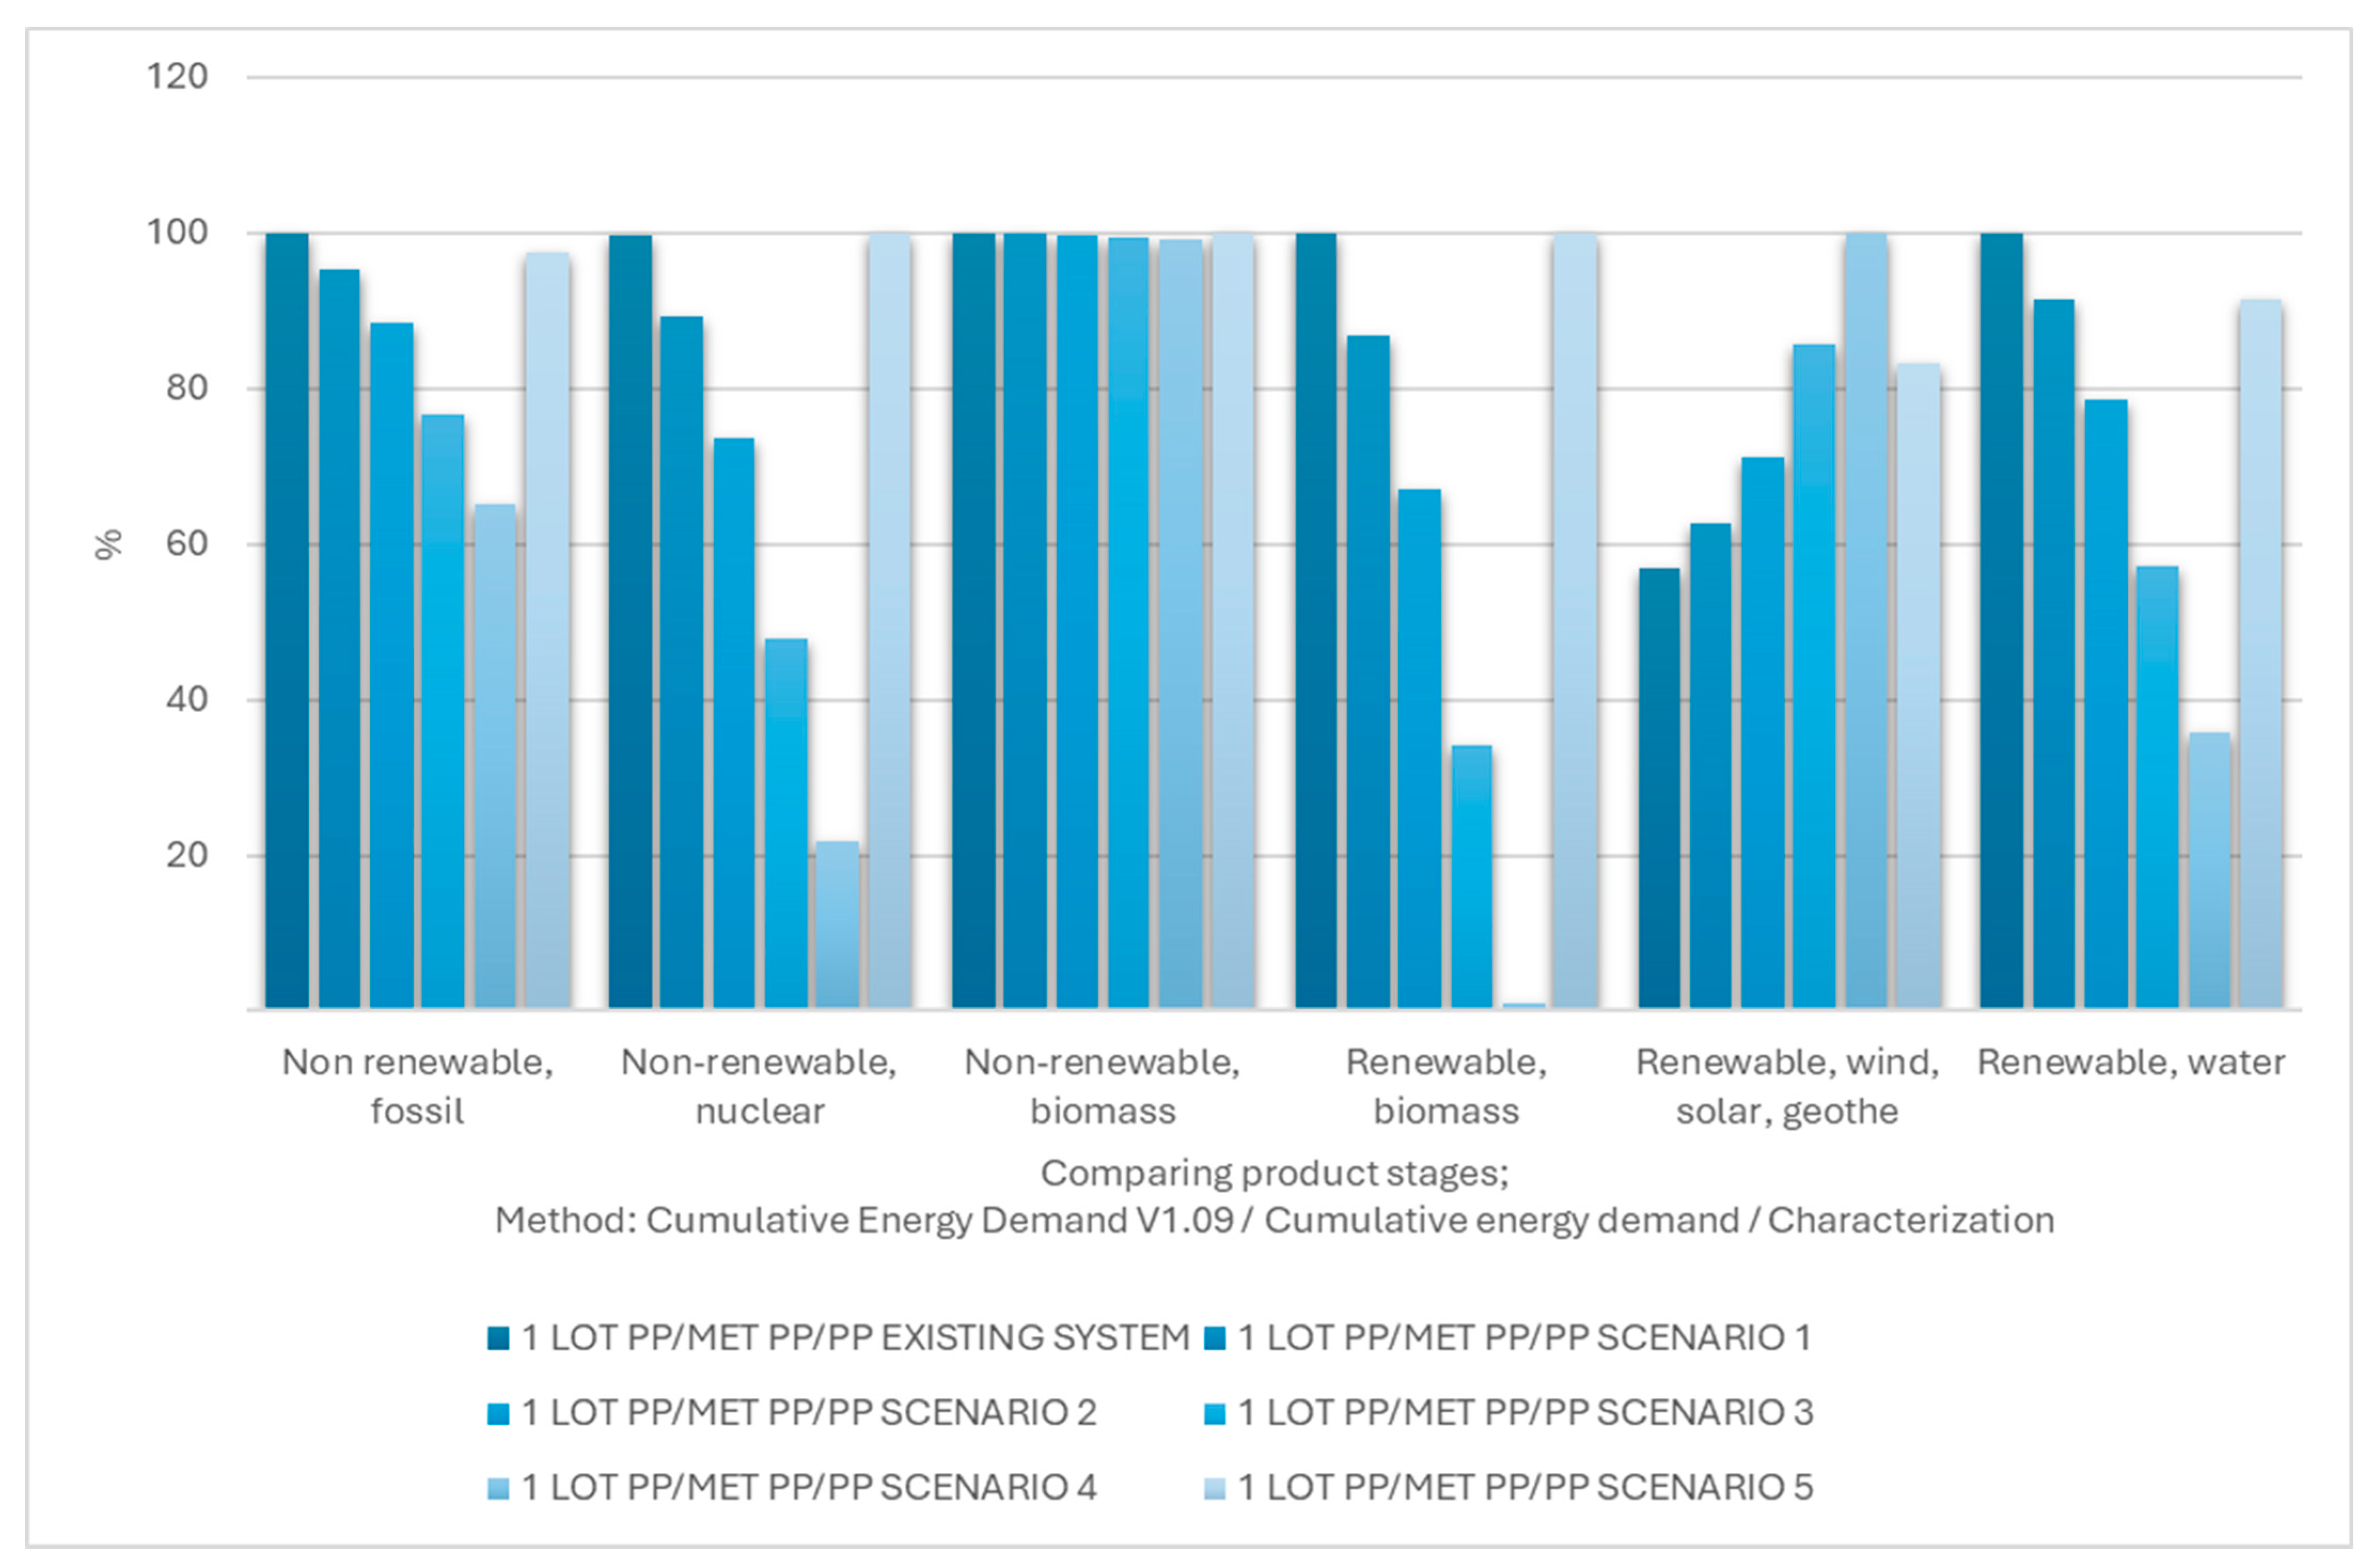
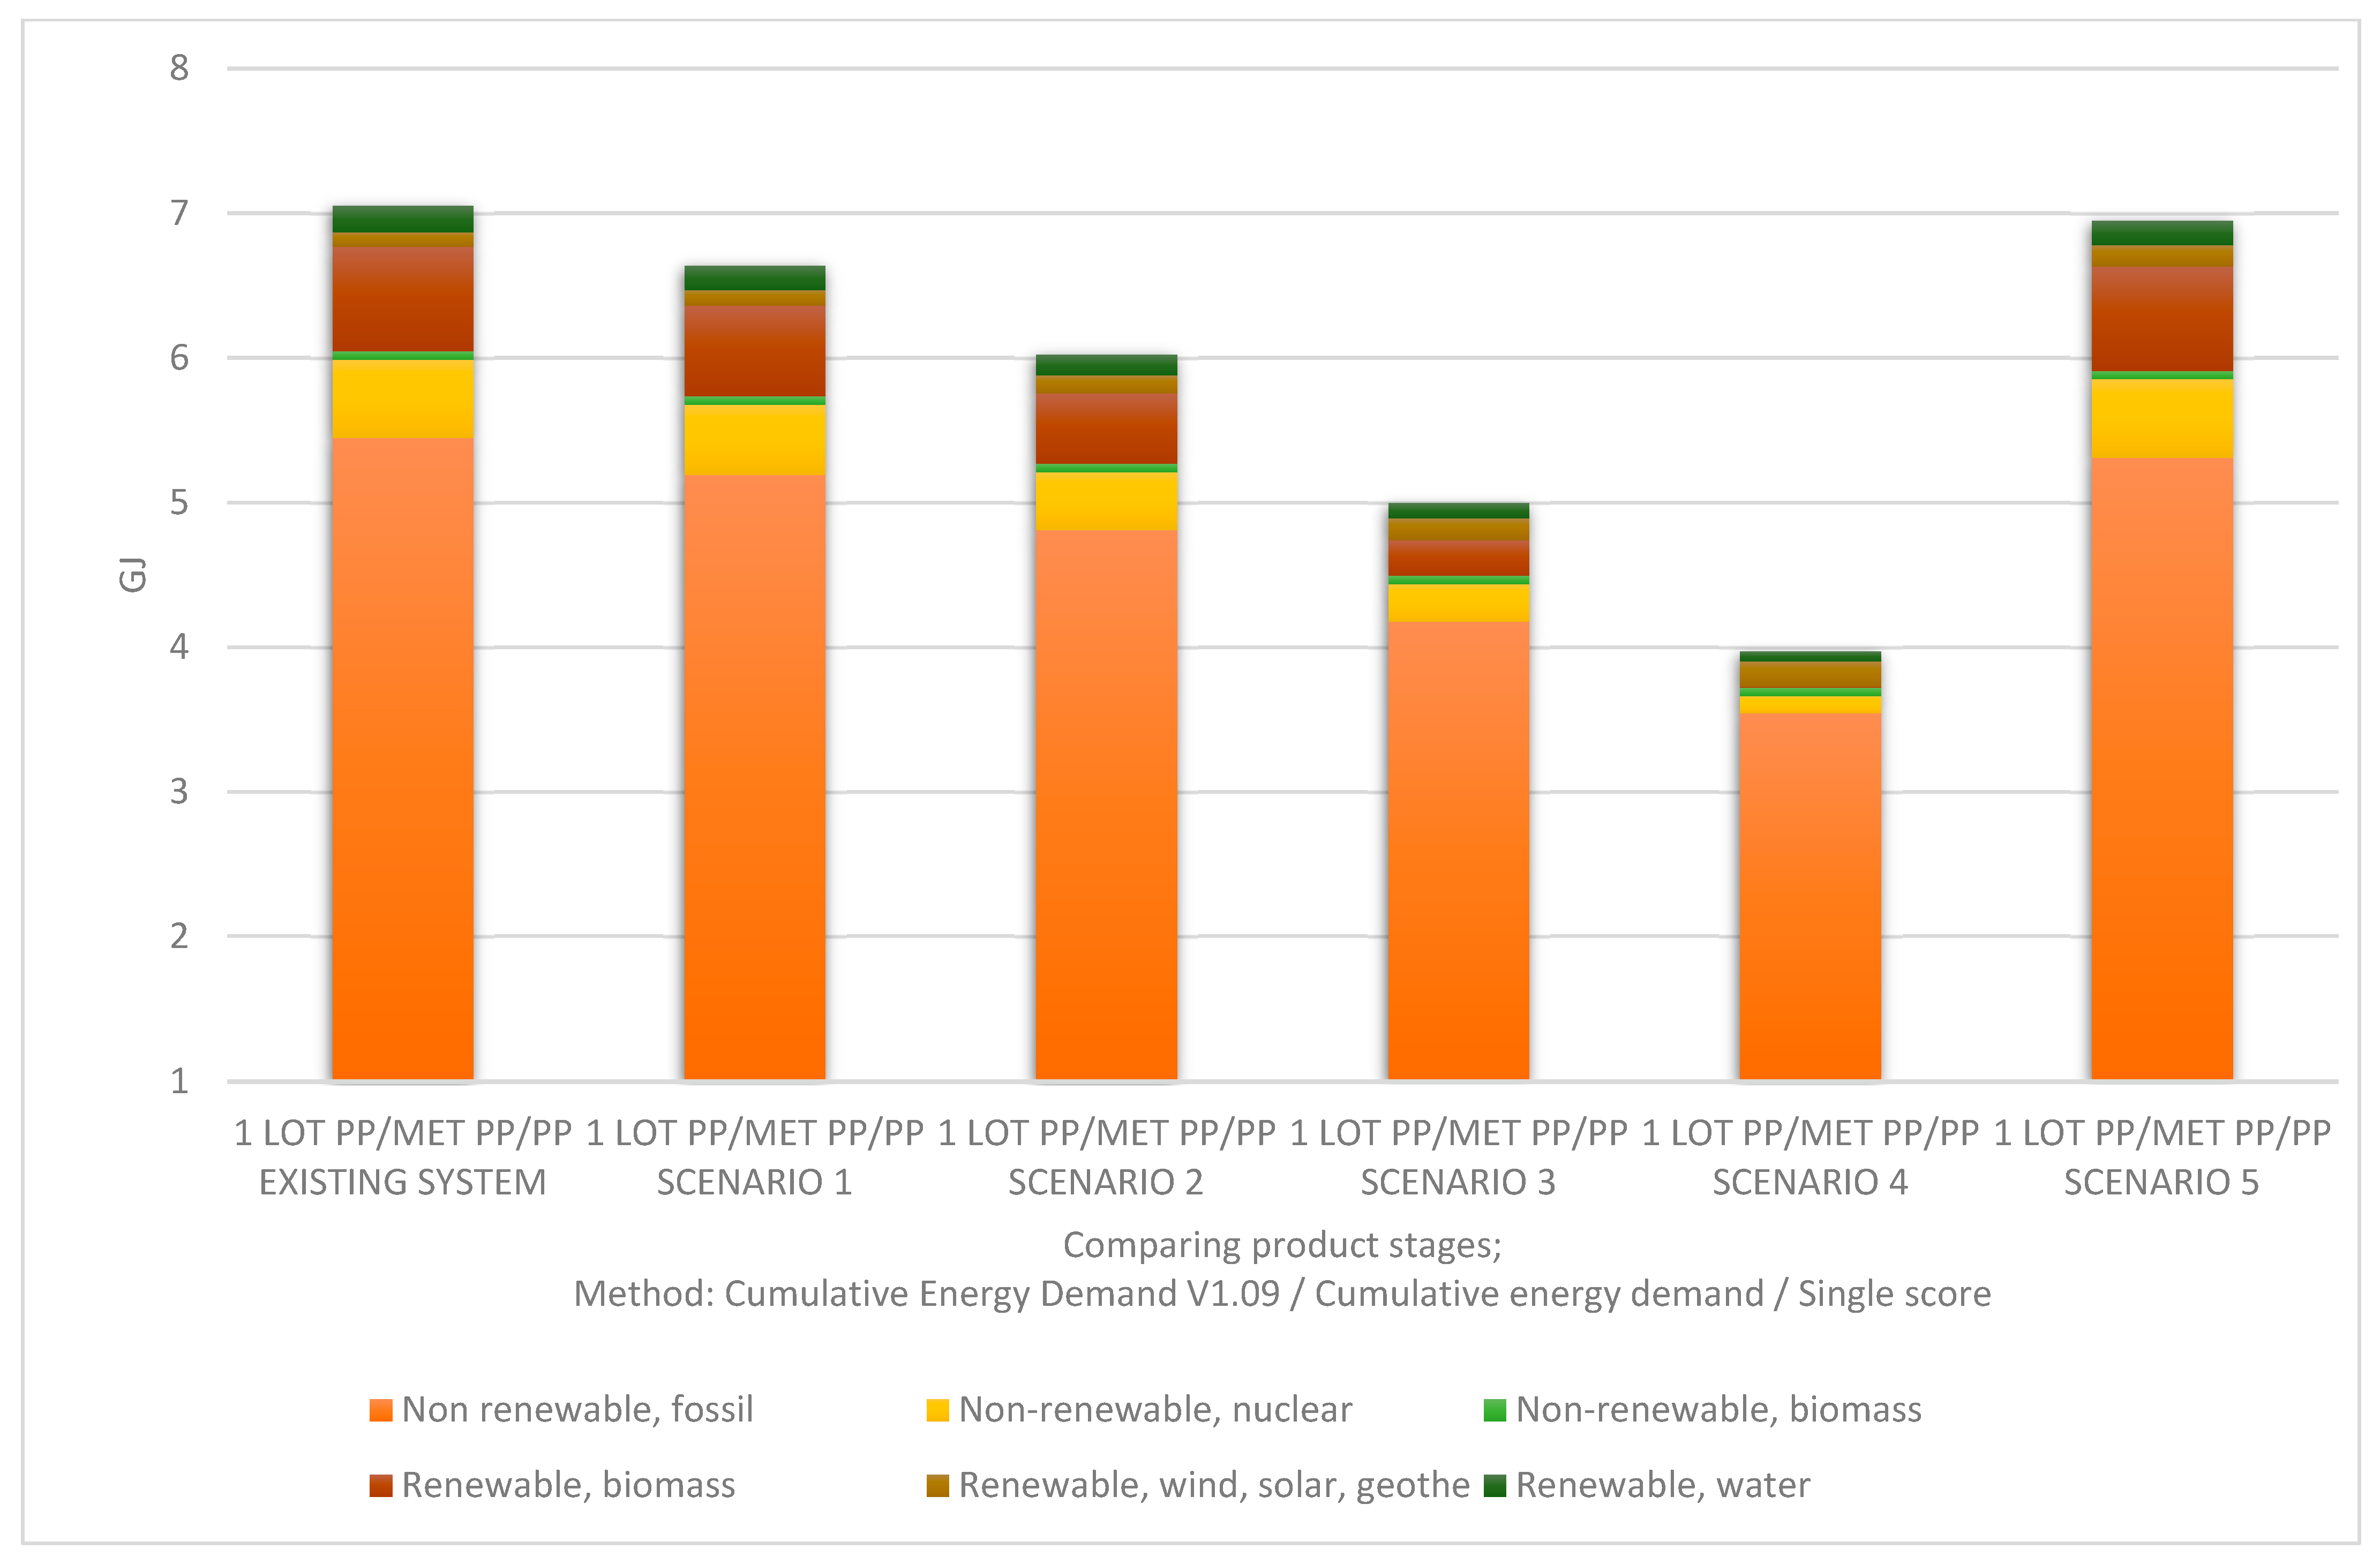
Cumulative Energy Demand (CED)
CML-IA
- Abiotic depletion
- Abiotic depletion (fossil)
- Global warming (GWP100a)
- Ozone layer depletion (ODP)
- Human toxicity
- Freshwater aquatic ecotoxicity
- Marine aquatic ecotoxicity
- Terrestrial ecotoxicity
- Photochemical oxidation
- Acidification
- Eutrophication
4. Discussion
5. Conclusions
Author Contributions
Funding
Institutional Review Board Statement
Informed Consent Statement
Data Availability Statement
Acknowledgments
Conflicts of Interest
Appendix A

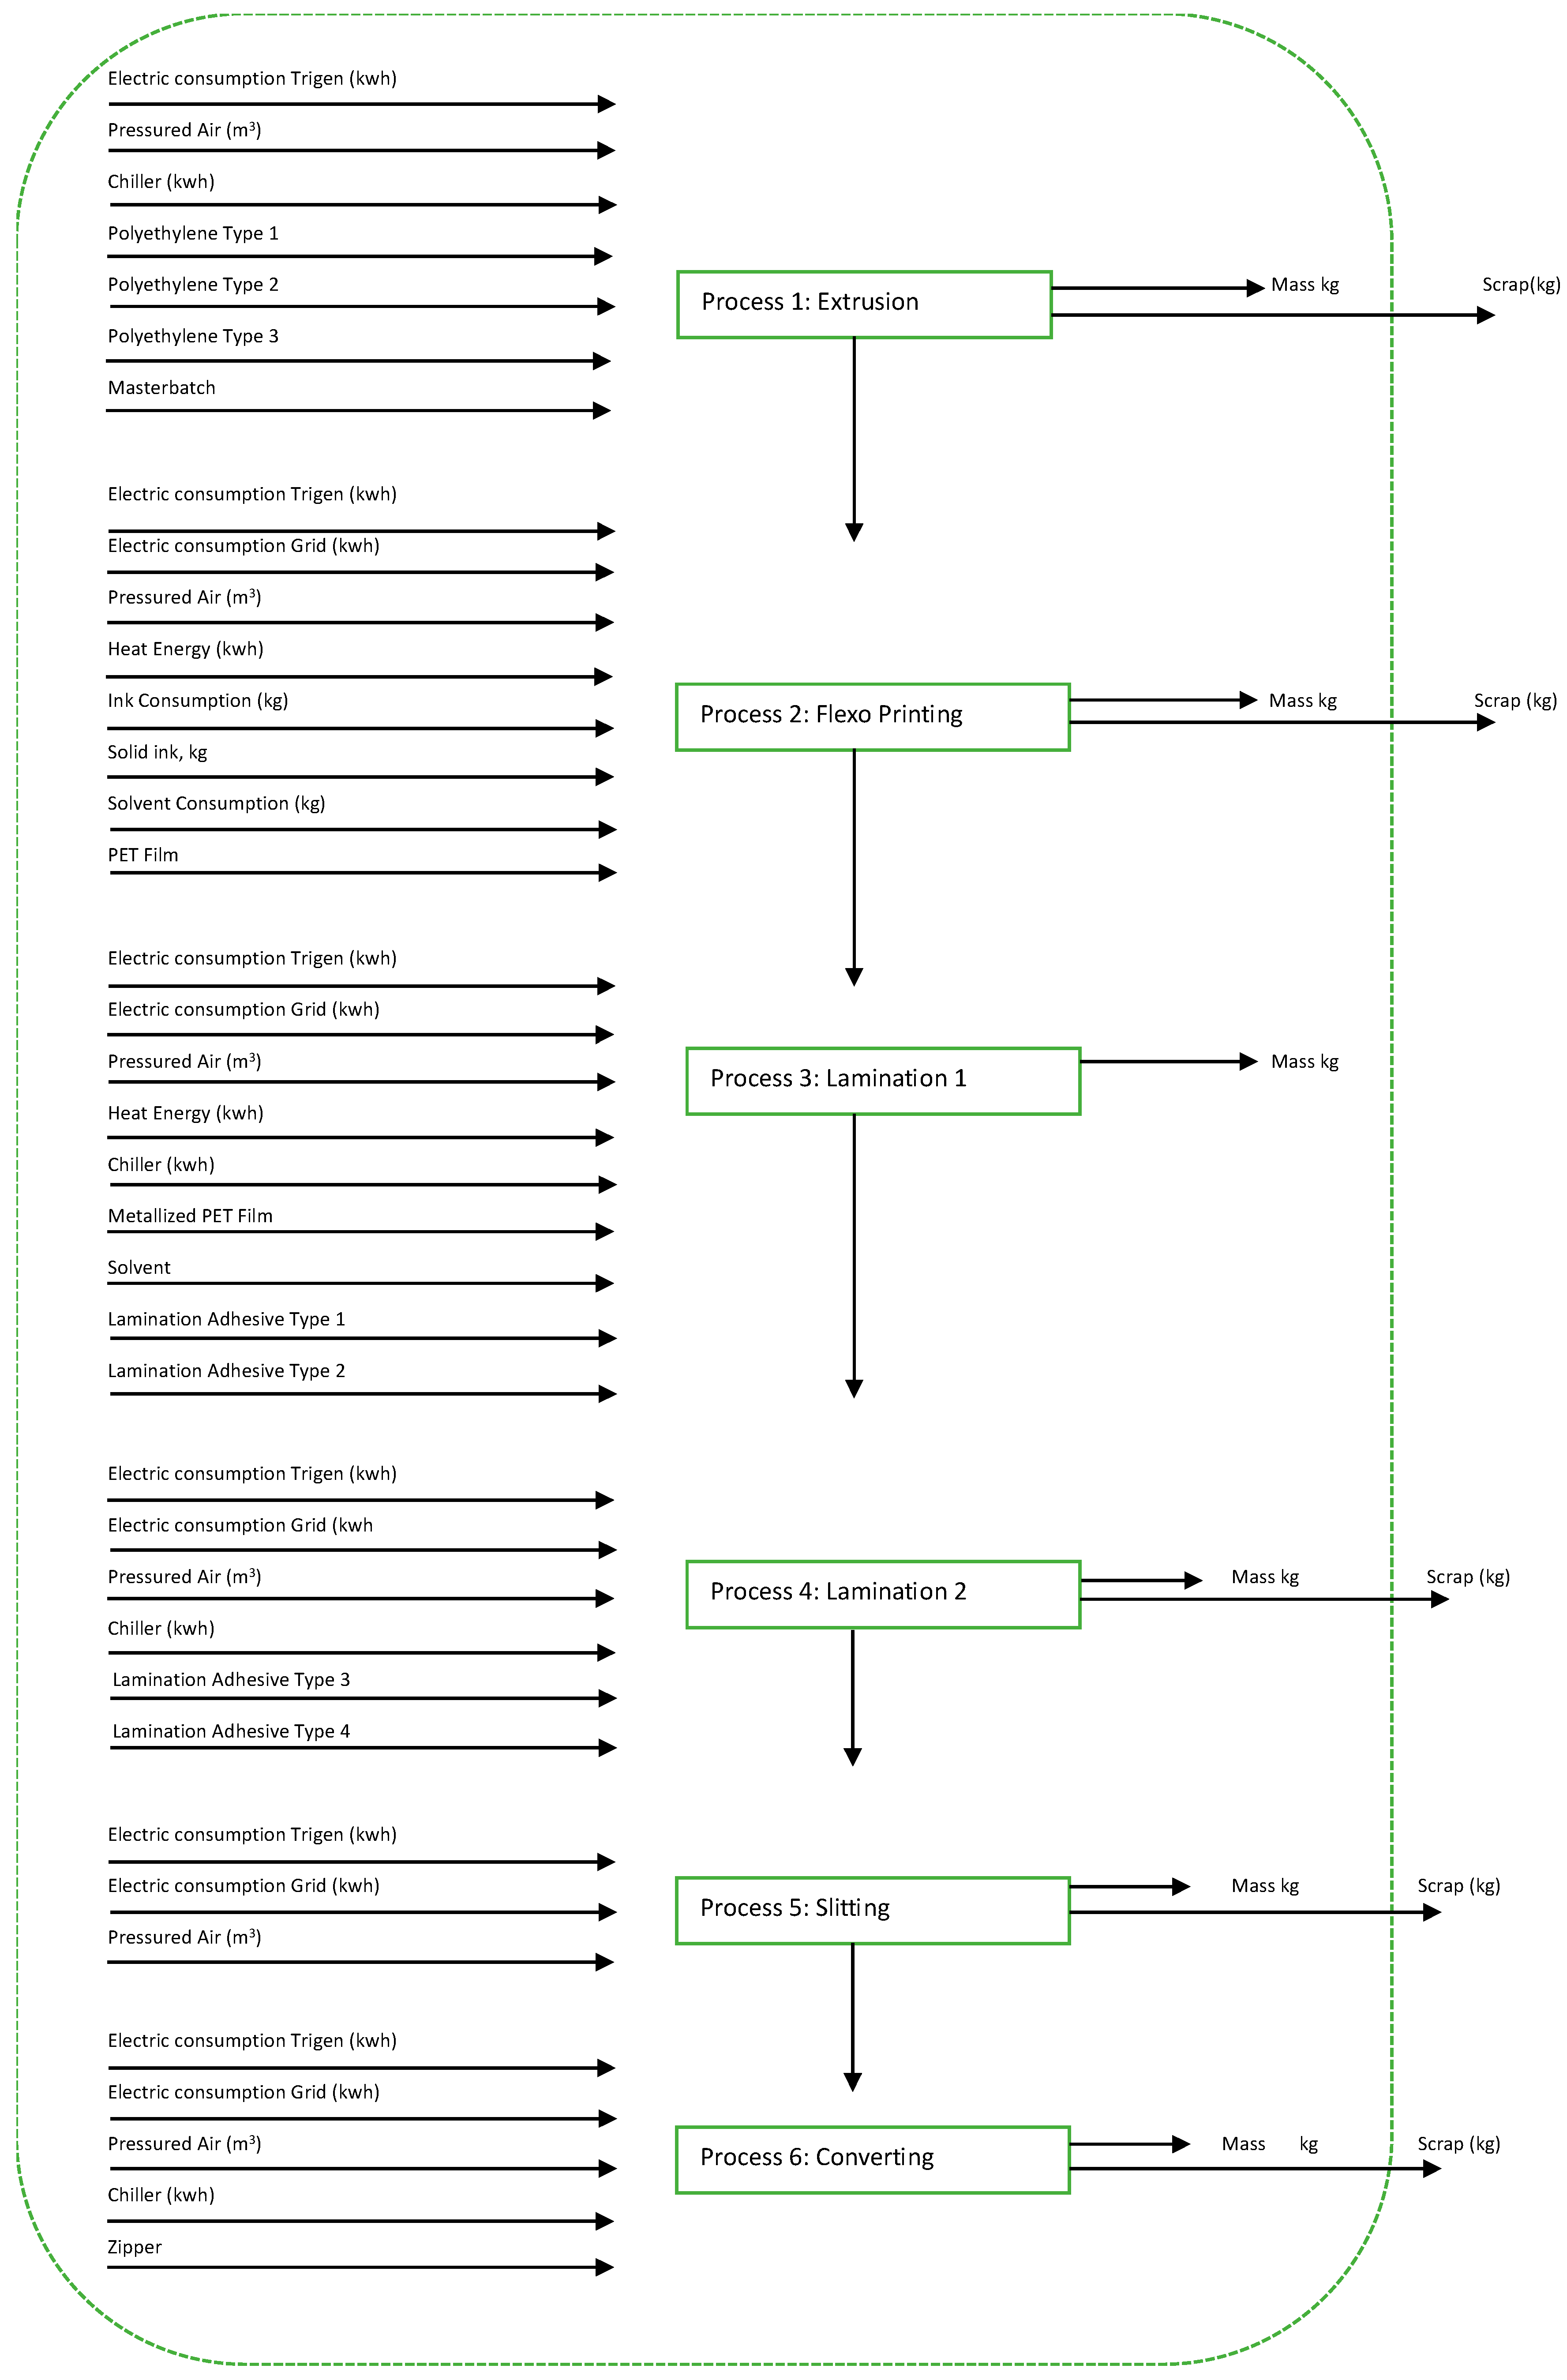
| Process 1: Blown Film Extrusion | |
|---|---|
| Electric Consumption Trigen (kwh) | 757.27 |
| Electric Consumption Grid (kwh) | 0.42 |
| Pressured Air (m3) | 43.20 |
| Chiller (kwh) | 292.57 |
| Scrap (kg) | - |
| Input Raw Material | |
| Grade Name | Consumption (kg) |
| PE Type 1 | 191.15 |
| PE Type 2 | 99.13 |
| PE Type 3 | 34.13 |
| Masterbatch | 3.28 |
| Process 2: Flexo Printing | |
| Electric Consumption Trigen (kwh) | 88.54 |
| Electric Consumption Grid (kwh) | 9.91 |
| Pressured Air (m3) | 11.48 |
| Heat Energy (kwh) | 172.98 |
| Ink Consumption (kg) | 4.97 |
| Solid ink. kg | 2.27 |
| Solvent Consumption (kg) | 2.70 |
| Scrap (kg) | - |
| Input Raw Material | |
| Grade Name | Consumption (kg) |
| PET Film | 122.72 |
| Process 3: Lamination 1 | |
| Electric Consumption Trigen (kwh) | 19.07 |
| Electric Consumption Grid (kwh) | 8.16 |
| Pressured Air (m3) | 5.86 |
| Heat Energy (kwh) | 204.96 |
| Chiller (kwh) | 7.55 |
| Input Raw Material | |
| Grade Name | Consumption (kg) |
| Metallized PET Film | 81.09 |
| Solvent | 9.12 |
| Lamination Adhesive Type 1 | 14.15 |
| Lamination Adhesive Type 2 | 7.07 |
| Process 4: Lamination 2 | |
| Electric Consumption Trigen (kwh) | 16.21 |
| Electric Consumption Grid (kwh) | 6.94 |
| Pressured Air (m3) | 3.60 |
| Chiller (kwh) | 4.64 |
| Scrap (kg) | - |
| Input Adhesive Material | |
| Grade Name | Consumption (kg) |
| Lamination Adhesive Type 3 | 8.83 |
| Lamination Adhesive Type 4 | 3.98 |
| Process 5: Slitting/Dilimleme | |
| Electric Consumption Trigen (kwh) | 7.92 |
| Electric Consumption Grid (kwh) | 3.37 |
| Pressured Air (m3) | 7.43 |
| Scrap (kg) | - |
| Process 6: Converting | |
| Electric Consumption Trigen (kwh) | 83.64 |
| Electric Consumption Grid (kwh) | 31.75 |
| Pressured Air (m3) | 1443.42 |
| Chiller (kwh) | 7.29 |
| Scrap (kg) | - |
| Input Raw Material | |
| Name | Consumption (kg) |
| Zipper | 18.56 |
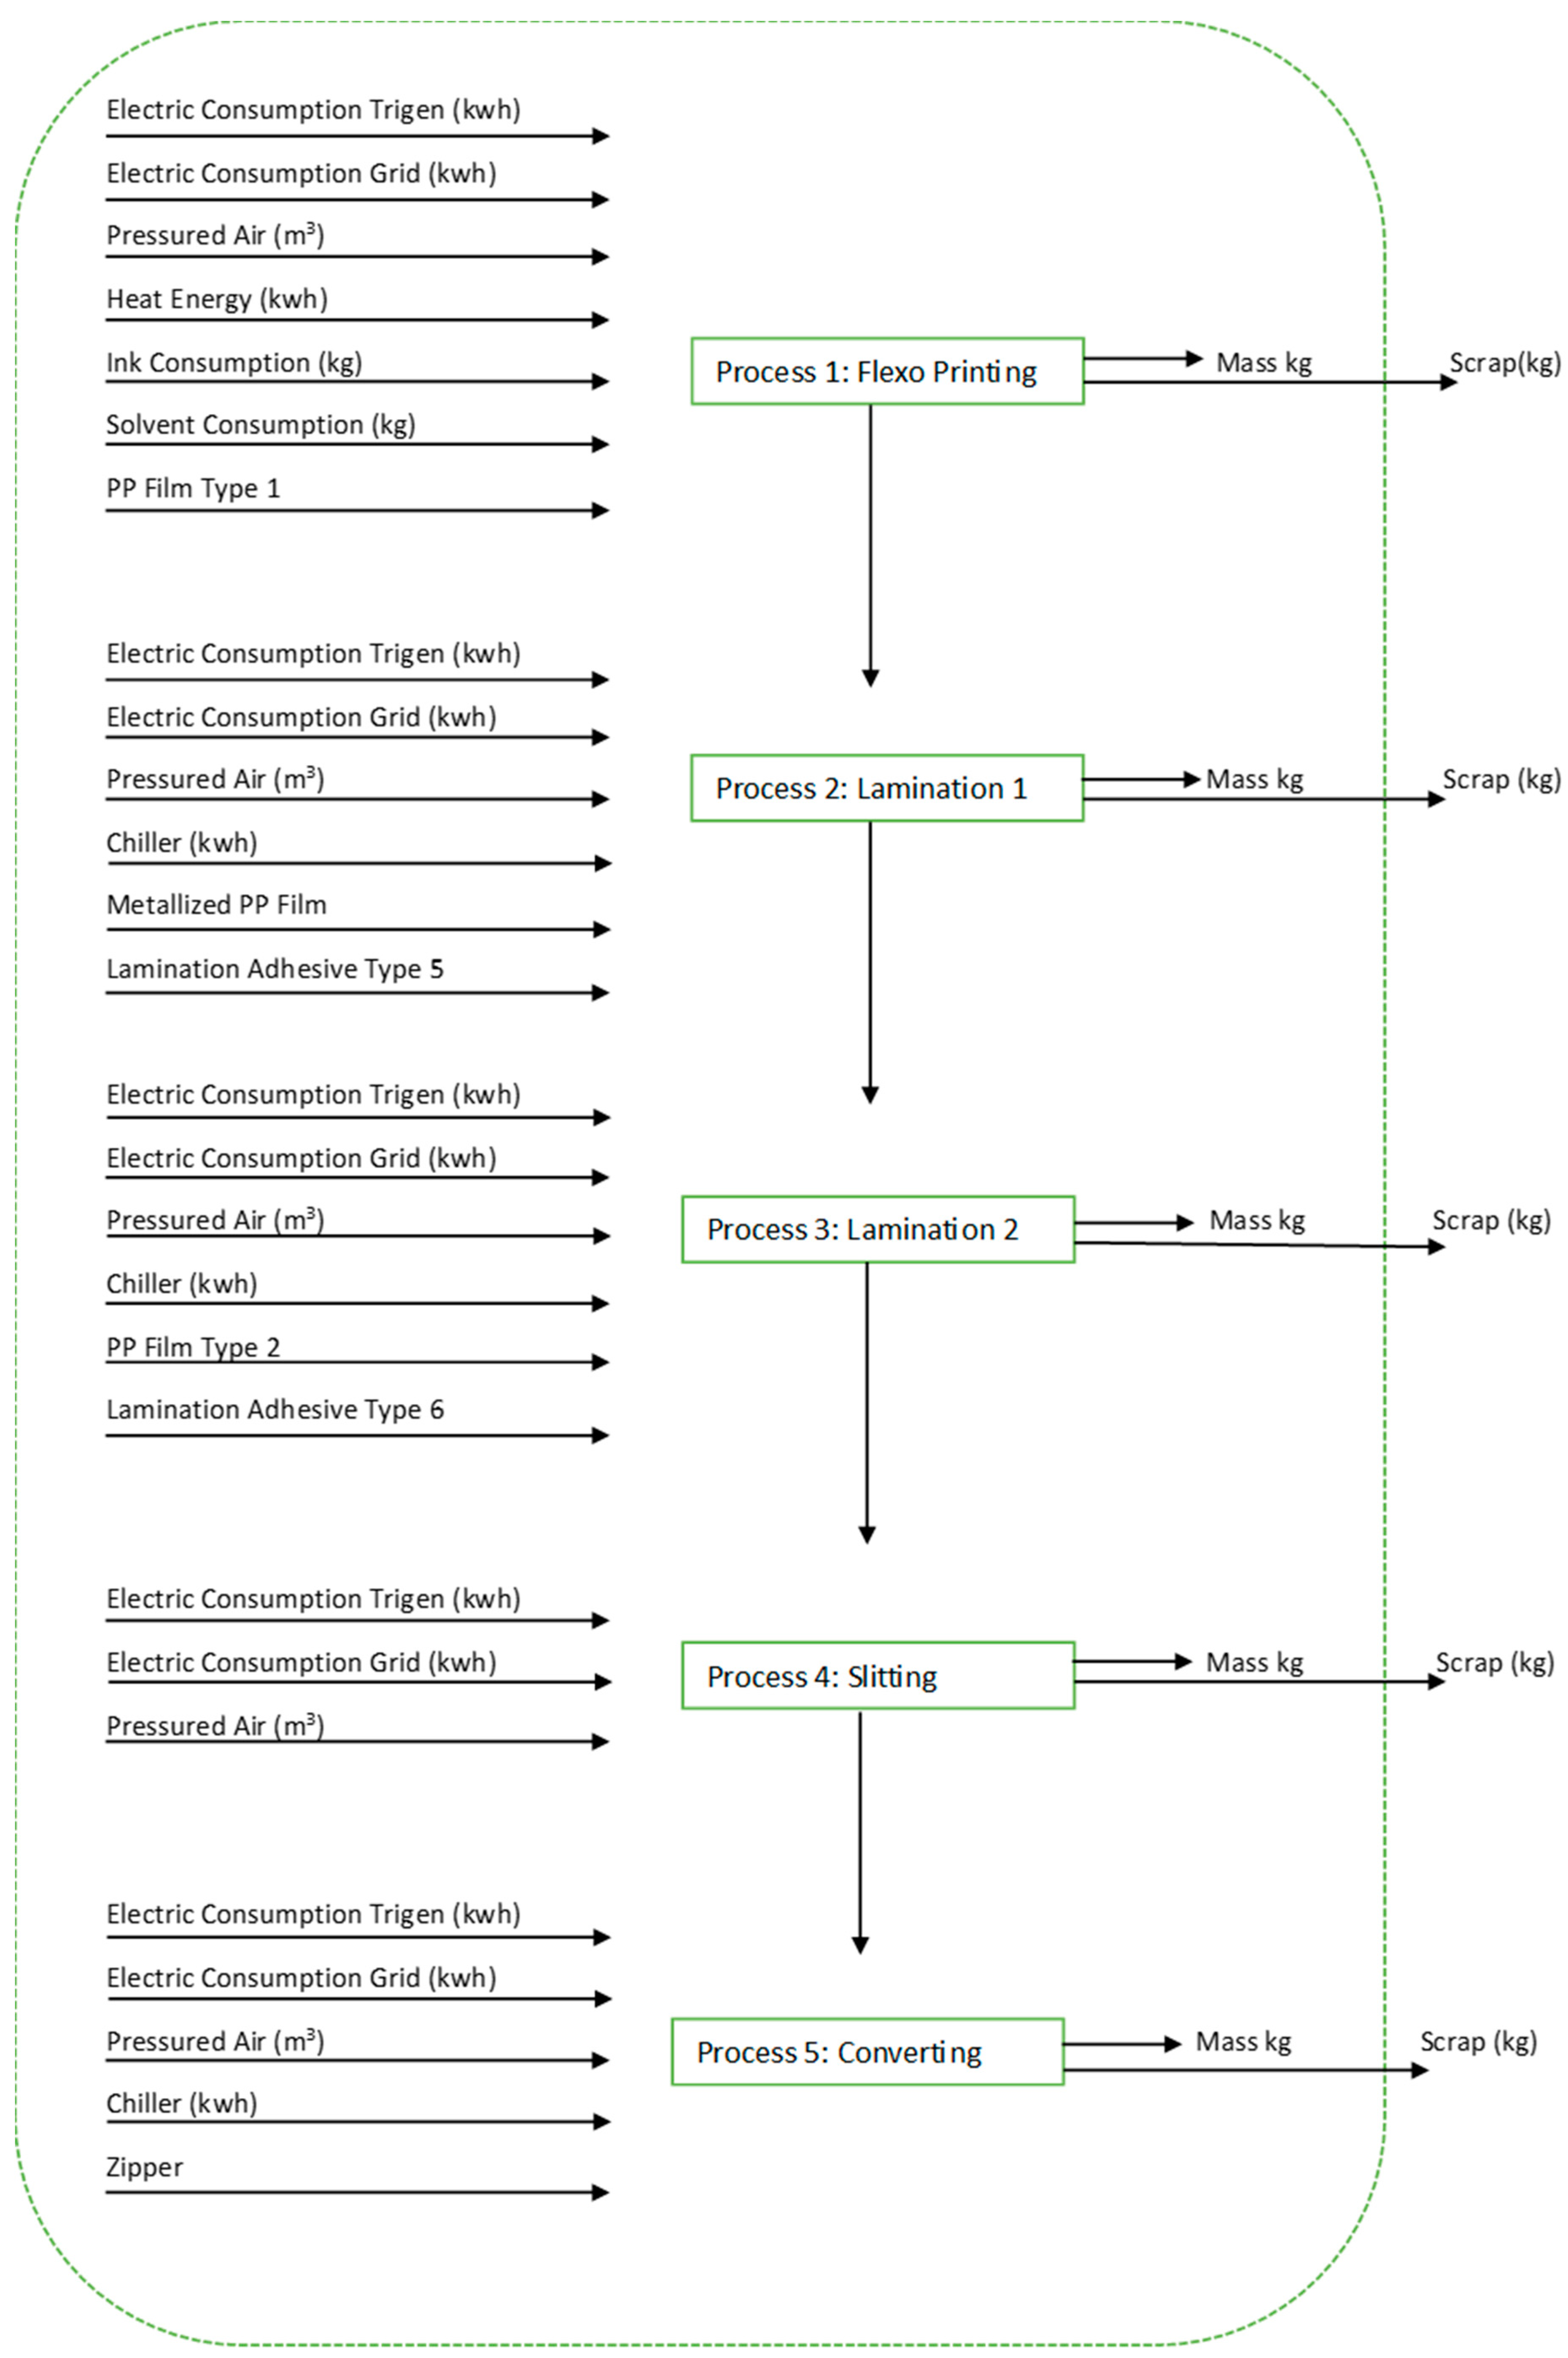
| Process 1: Flexo Printing | |
|---|---|
| Electric Consumption Trigen (kwh) | 12.70 |
| Electric Consumption Grid (kwh) | 1.43 |
| Pressured Air (m3) | 3.27 |
| Heat Energy (kwh) | 48.97 |
| Ink Consumption (kg) | 7.75 |
| Solvent Consumption (kg) | 4.21 |
| Scrap (kg) | - |
| Input Raw Material | |
| Grade Name | Consumption (kg) |
| PP Film Type 1 | 82.47 |
| Process 2: Lamination 1 | |
| Electric Consumption Trigen (kwh) | 8.46 |
| Electric Consumption Grid (kwh) | 3.62 |
| Pressured Air (m3) | 1.92 |
| Chiller (kwh) | 2.48 |
| Scrap (kg) | - |
| Input Raw Material | |
| Grade Name | Consumption (kg) |
| Metallized PP Film | 33.96 |
| Lamination Adhesive Type 5 | 7.1 |
| Process 3: Lamination 2 | |
| Electric Consumption Trigen (kwh) | 8.45 |
| Electric Consumption Grid (kwh) | 3.62 |
| Pressured Air (m3) | 1.84 |
| Chiller (kwh) | 2.37 |
| Scrap (kg) | - |
| Input Raw Material | |
| Grade Name | Consumption (kg) |
| PP Film Type 2 | 114.03 |
| Lamination Adhesive Type 6 | 7.100 |
| Process 4: Slitting | |
| Electric Consumption Trigen (kwh) | 1.50 |
| Electric Consumption Grid (kwh) | 0.63 |
| Pressured Air (m3) | 3.31 |
| Scrap (kg) | - |
| Process 5: Converting | |
| Electric Consumption Trigen (kwh) | 39.66 |
| Electric Consumption Grid (kwh) | 14.61 |
| Pressured Air (m3) | 772.20 |
| Chiller (kwh) | 3.9 |
| Scrap (kg) | - |
| Input Raw Material | |
| Name | Consumption (kg) |
| Zipper | 8.40 |
| PET/Metallized PET/PE | ||||||
|---|---|---|---|---|---|---|
| Process | ES | S1 | S2 | S3 | S4 | S5 |
| Extrusion | 191.15 kg PE Type 1 99.13 kg PE Type 2 | 172 kg PE Type 1 89.2 kg PE Type 2 19.1 kg recycled PE Type 1 9.91 kg recycled PE Type 2 | 143 kg PE Type 1 74.3 kg PE Type 2 47.8 kg recycled PE Type 1 24.8 kg recycled PE Type 2 | 95.6 kg PE Type 1 49.5 kg PE Type 2 95.6 kg recycled PE Type 1 49.6 kg recycled PE Type 2 | 48.2 kg PE Type 1 24.8 kg PE Type 2 74.3 kg recycled PE Type 1 143 kg recycled PE Type 2 | Same as ES |
| Printing | 122.72 kg PET | 110 kg PET 12.3 recycled PET | 92 kg PET 30.7 recycled PET | 61.3 kg PET 61.4 recycled PET | 30.7 kg PET 92 recycled PET | Same as ES |
| Lamination 1 | - | - | - | - | - | - |
| Lamination 2 | - | - | - | - | - | - |
| Slitting | - | - | - | - | - | - |
| Converting | - | - | - | - | - | - |
| PP/Metallized PP/PP | ||||||
|---|---|---|---|---|---|---|
| Process | ES | S1 | S2 | S3 | S4 | S5 |
| Printing | 82.47 kg PP Type 1 | 74.2 kg PP Type 1 8.25 recycled PP Type 1 | 61.9 kg PP Type 1 20.6 recycled PP Type 1 | 41.3 kg PP Type 1 41.2 recycled PP Type 1 | 20.6 kg PP Type 1 61.9 recycled PP Type 1 | Same as ES |
| Lamination 1 | - | - | - | - | - | - |
| Lamination 2 | 114.030 kg PP Type 2 | 103 kg PP Type 2 11.4 kg recycled PP Type 2 | 85.5 kg PP Type 2 28.5 kg recycled PP Type 2 | 57 kg PP Type 2 257 kg recycled PP Type 2 | 28.5 kg PP Type 2 85.5 kg recycled PP Type 2 | Same as ES |
| Slitting | - | - | - | - | - | - |
| Converting | - | - | - | - | - | - |
References
- De Marchi, E.; Pigliafreddo, S.; Banterle, A.; Parolini, M.; Cavaliere, A. Plastic packaging goes sustainable: An analysis of consumer preferences for plastic water bottles. Environ. Sci. Policy 2020, 114, 305–311. [Google Scholar] [CrossRef]
- Plastic the Facts, Plastics Europe Website, Brussels, Belgium. 2023. Available online: https://plasticseurope.org/knowledge-hub/plastics-the-fast-facts-2023/ (accessed on 3 February 2024).
- Turkish Plastics Industry Foundation-PAGEV, Turkish Plastics Industry Follow-Up Report. 2022. Available online: https://pagev.org/turkish-plastics-industry-follow-up-report-2022 (accessed on 12 June 2023).
- Plastic the Facts, Plastics Europe Website, Brussels, Belgium. 2022. Available online: https://plasticseurope.org/knowledge-hub/plastics-the-facts-2022/ (accessed on 3 February 2024).
- Veksha, A.; Yin, K.; Moo, J.G.S.; Oh, W.-D.; Ahamed, A.; Chen, W.Q.; Weerachanchai, P.; Giannis, A.; Lisak, G. Processing of flexible plastic packaging waste into pyrolysis oil and multi-walled carbon nanotubes for electrocatalytic oxygen reduction. J. Hazard. Mater. 2020, 387, 121256. [Google Scholar] [CrossRef] [PubMed]
- Farrukh, A.; Mathrani, S.; Sajjad, A. A Systematic Literature Review on Environmental Sustainability Issues of Flexible Packaging: Potential Pathways for Academic Research and Managerial Practice. Sustainability 2022, 14, 4737. [Google Scholar] [CrossRef]
- CEFLEX (Circular Economy for Flexible Packaging). Our Journey towards a Circular Economy for Flexible Packaging, September. 2020. Available online: https://ceflex.eu/flexible-packaging-in-europe/ (accessed on 3 January 2024).
- The Future of Flexible Packaging to 2026, Smithers Pira. 2024. Available online: https://www.smithers.com/services/market-reports/packaging/flexible-packaging-to-2024 (accessed on 6 January 2024).
- Turkish Plastics Industry Foundation—PAGEV, Flexible Packaging Sector in Türkiye Information Note. 2022. Available online: https://pagev.org/upload/files/FLEXIBLE%20PACKAGING%20INFORMATION%20NOTE.pdf (accessed on 27 December 2023).
- ISO 14040; Environmental Management—Life Cycle Assessment—Principles and Framework. International Organization for Standardization: Geneva, Switzerland, 2006.
- ISO 14044; Environmental Management—Life Cycle Assessment—Requirements and Guidelines. International Organization for Standardization: Geneva, Switzerland, 2006.
- Ögmundarson, Ó.; SophieKalweit, L.; Venkatachalam, V.; Kristjánsdóttir, R.; Endres, H.-J.; Spierling, S. Plastic Packaging Waste Management in Iceland: Challenges and Opportunities from a Life Cycle Assessment Perspective. Sustainability 2022, 14, 16837. [Google Scholar] [CrossRef]
- Kumar Foolmaun, R.; Ramjeeawon, T. Comparative Life Cycle Assessment and Life Cycle Costing of Four Disposal Scenarios for Used Polyethylene Terephthalate Bottles in Mauritius, Environmental Technology, USDA National Agricultural Library. 2012. Available online: https://pubag.nal.usda.gov/catalog/338986 (accessed on 12 January 2023).
- Bassi, S.A.; Tonini, D.; Saveyn, H.; Astruo, T.F. Environmental and Socioeconomic Impacts of Poly(ethylene teraphtalate) (PET) Packaging Management Strategies in the EU. Environ. Sci. Technol. 2022, 56, 501–511. [Google Scholar] [CrossRef] [PubMed]
- Schmidt, S.; Laner, D. The environmental performance of plastic packaging waste management in Germany: Current and future key factors. J. Ind. Ecol. Wiley 2023, 27, 1447–1460. [Google Scholar] [CrossRef]
- Pragati, P.; Yasunobu, M. Life Cycle Environmental Impacts of Consumer Packaging Products in Japan, Risk Analysis; Wiley: Hoboken, NJ, USA, 2022. [Google Scholar] [CrossRef]
- Kan, M.; Miller, S.A. Environmental impacts of plastic packaging of food products. Resour. Conserv. Recycl. 2022, 180, 106156. [Google Scholar] [CrossRef]
- Biona, J.B.M.M.; Gonzaga, J.A.; Ubando, A.T.; Tan, H.C. A comparative life cycle analysis of plastic and paper packaging bags in the Philippines. In Proceedings of the 2015 International Conference on Humanoid, Nanotechnology, Information Technology, Communication and Control, Environment and Management (HNICEM), Cebu, Philippines, 9–12 December 2015. [Google Scholar] [CrossRef]
- Ahamed, A.; Veksha, A.; Giannis, A.; Lisak, G. Flexible Packaging Plastic Waste-Environmental Implications. Manag. Solut. Way Forw. Curr. Opin. Chem. Eng. 2021, 32, 100684. [Google Scholar] [CrossRef]
- Siracusa, V.; Ingrao, C.; Lo Giudice, A.; Mbohwa, C.; Dalla Rosa, M. Environmental assessment of a multilayer polymer bag for food packaging and preservation: An LCA approach. Food Res. Int. 2014, 62, 151–161. [Google Scholar] [CrossRef]
- Horodytska, O.; Valdes, F.J.; Fullana, A. Plastic flexible films waste management—A state of art review. Waste Manag. 2018, 77, 413–425. [Google Scholar] [CrossRef] [PubMed]
- He, H.; Fu, Y.; Zhao, Y.; Liu, S.; Zuo, G.; Guo, P.; Xu, W. Applied properties and life cycle assessment of flexible packaging lamination processes: A comparative study. Int. J. Life Cycle Assess. 2021, 26, 561–574. [Google Scholar] [CrossRef]
- Krueger, M.; Kauertz, B.; Mayer, C. Life Cycle Assessment of Packaging Systems for Enteral Nutrition Products: Multilayer Pouch and High-Density Polyethylene Bottle. J. Appl. Packag. Res. 2021, 13, 2. [Google Scholar]
- Costamagna, M.; Massaccesi, B.M.; Mazzucco, D.; Baricco, M.; Rizzi, P. Environmental assessment of the recycling process for polyamides—Polyethylene multilayer packaging films. Sustain. Mater. Technol. 2022, 35, e00562. [Google Scholar] [CrossRef]
- Yıldız-Geyhan, E.; Yılan-Çiftçi, G.; Altun-Çiftçioğlu, G.A.; Kadırgan, M.A.N. Environmental analysis of different packaging waste collection systems for Istanbul-Turkey case study, Resources. Conserv. Recycl. 2016, 107, 27–37. [Google Scholar] [CrossRef]


| PET/Metallized PET/PE | ||||||
|---|---|---|---|---|---|---|
| Process | ES | S1 | S2 | S3 | S4 | S5 |
| Extrusion | No recycling with usual electric consumption | 10% recycled PE Type 2, PE Type 1 + 90% virgin PE Type 2, PE Type 1 | 25% recycled PE Type 2, PE Type 1 + 75% virgin PE Type 2, PE Type 1 | 50% recycled PE Type 2, PE Type 1 + 50% virgin PE Type 2, PE Type 1 | 75% recycled PE Type 2, PE Type 1 + 25% virgin PE Type 2, PE Type 1 | Electric consumption comes from photovoltaic energy |
| Printing | No recycling with usual electric consumption | 10% recycled PET + 90% virgin PET | 25% recycled PET + 75% virgin PET | 50% recycled PET + 50% virgin PET | 75% recycled PET + 25% virgin PET | Electric consumption comes from photovoltaic energy |
| Lamination 1 | No recycling with usual electric consumption | No recycling with usual electric consumption | No recycling with usual electric consumption | No recycling with usual electric consumption | No recycling with usual electric consumption | Electric consumption comes from photovoltaic energy |
| Lamination 2 | No recycling with usual electric consumption | No recycling with usual electric consumption | No recycling with usual electric consumption | No recycling with usual electric consumption | No recycling with usual electric consumption | Electric consumption comes from photovoltaic energy |
| Slitting | No recycling with usual electric consumption | No recycling with usual electric consumption | No recycling with usual electric consumption | No recycling with usual electric consumption | No recycling with usual electric consumption | Electric consumption comes from photovoltaic energy |
| Converting | No recycling with usual electric consumption | No recycling with usual electric consumption | No recycling with usual electric consumption | No recycling with usual electric consumption | No recycling with usual electric consumption | Electric consumption comes from photovoltaic energy |
| PP/Metallized PP/PP | ||||||
|---|---|---|---|---|---|---|
| Process | ES | S1 | S2 | S3 | S4 | S5 |
| Printing | No recycling with usual electric consumption | 10% recycled PP Type 1 + 90% virgin PP Type 1 | 25% recycled PP Type 1 + 75% virgin PP Type 1 | 50% recycled PP Type 1 + 50% virgin PP Type 1 | 75% recycled PP Type 1 + 25% virgin PP Type 1 | Electric consumption comes from photovoltaic energy |
| Lamination 1 | No recycling with usual electric consumption | No recycling with usual electric consumption | No recycling with usual electric consumption | No recycling with usual electric consumption | No recycling with usual electric consumption | Electric consumption comes from photovoltaic energy |
| Lamination 2 | No recycling with usual electric consumption | 10% recycled PP Type 2 + 90% virgin PP Type 2 | 25% recycled PP Type 2 + 75% virgin PP Type 2 | 50% recycled PP Type 2 + 50% virgin PP Type 2 | 75% recycled PP Type 2 + 25% virgin PP Type 2 | Electric consumption comes from photovoltaic energy |
| Slitting | No recycling with usual electric consumption | No recycling with usual electric consumption | No recycling with usual electric consumption | No recycling with usual electric consumption | No recycling with usual electric consumption | Electric consumption comes from photovoltaic energy |
| Converting | No recycling with usual electric consumption | No recycling with usual electric consumption | No recycling with usual electric consumption | No recycling with usual electric consumption | No recycling with usual electric consumption | Electric consumption comes from photovoltaic energy |
| Abiotic Depletion | Abiotic Depletion (Fossil Fuels) | Global Warming (GWP100a) | Ozone Layer Depletion (ODP) | Human Toxicity | Freshwater Aquatic Ecotoxicity | Marine Aquatic Ecotoxicity | Terrestrial Ecotoxicity | Photochemical Oxidation | Acidification | Eutrophication | |
|---|---|---|---|---|---|---|---|---|---|---|---|
| ES | 2.04 × 10⁻¹¹ | 1.25 × 10⁻⁹ | 3.19 × 10⁻¹⁰ | 8.87 × 10⁻¹³ | 3.82 × 10⁻¹¹ | 3.82 × 10⁻¹⁰ | 5.32 × 10⁻⁹ | 1.28 × 10⁻¹⁰ | 4.87 × 10⁻¹¹ | 2.17 × 10⁻¹⁰ | 8.88 × 10⁻¹¹ |
| S1 | 2.0 × 10⁻¹¹ | 1.12 × 10⁻⁹ | 2.97 × 10⁻¹⁰ | 8.72 × 10⁻¹³ | 3.8 × 10⁻¹¹ | 3.83 × 10⁻¹⁰ | 5.33 × 10⁻⁹ | 1.28 × 10⁻¹⁰ | 4.79 × 10⁻¹¹ | 2.03 × 10⁻¹⁰ | 8.74 × 10⁻¹¹ |
| S2 | 1.94 × 10⁻¹¹ | 9.28 × 10⁻¹⁰ | 2.64 × 10⁻¹⁰ | 8.51 × 10⁻¹³ | 3.76 × 10⁻¹¹ | 3.86 × 10⁻¹⁰ | 5.33 × 10⁻⁹ | 1.27 × 10⁻¹⁰ | 4.67 × 10⁻¹¹ | 1.82 × 10⁻¹⁰ | 8.52 × 10⁻¹¹ |
| S3 | 1.84 × 10⁻¹¹ | 6.09 × 10⁻¹⁰ | 2.08 × 10⁻¹⁰ | 8.16 × 10⁻¹³ | 3.71 × 10⁻¹¹ | 3.91 × 10⁻¹⁰ | 5.35 × 10⁻⁹ | 1.26 × 10⁻¹⁰ | 4.46 × 10⁻¹¹ | 1.47 × 10⁻¹⁰ | 8.17 × 10⁻¹¹ |
| S4 | 1.74 × 10⁻¹¹ | 2.91 × 10⁻¹⁰ | 1.53 × 10⁻¹⁰ | 7.81 × 10⁻¹³ | 3.65 × 10⁻¹¹ | 3.95 × 10⁻¹⁰ | 5.37 × 10⁻⁹ | 1.25 × 10⁻¹⁰ | 4.25 × 10⁻¹¹ | 1.13 × 10⁻¹⁰ | 7.82 × 10⁻¹¹ |
| S5 | 2.47 × 10⁻¹¹ | 1.24 × 10⁻⁹ | 3.13 × 10⁻¹⁰ | 8.92 × 10⁻¹³ | 3.7 × 10⁻¹¹ | 3.56 × 10⁻¹⁰ | 4.99 × 10⁻⁹ | 1.272 × 10⁻¹⁰ | 4.3 × 10⁻¹¹ | 2.1 × 10⁻¹⁰ | 8.09 × 10⁻¹¹ |
| Abiotic Depletion | Abiotic Depletion (Fossil Fuels) | Global Warming (GWP100a) | Ozone Layer Depletion (ODP) | Human Toxicity | Freshwater Aquatic Ecotoxicity | Marine Aquatic Ecotoxicity | Terrestrial Ecotoxicity | Photochemical Oxidation | Acidification | Eutrophication | |
|---|---|---|---|---|---|---|---|---|---|---|---|
| ES | 8.31 × 10⁻¹² | 1.73 × 10⁻¹⁰ | 6.91 × 10⁻¹¹ | 2.37 × 10⁻¹³ | 1.71 × 10⁻¹¹ | 2.12 × 10⁻¹⁰ | 2.85 × 10⁻⁹ | 9.13 × 10⁻¹¹ | 1.45 × 10⁻¹¹ | 6.12 × 10⁻¹¹ | 4.3 × 10⁻¹¹ |
| S1 | 7.53 × 10⁻¹² | 1.65 × 10⁻¹⁰ | 6.5 × 10⁻¹¹ | 2.1 × 10⁻¹³ | 1.57 × 10⁻¹¹ | 1.97 × 10⁻¹⁰ | 2.62 × 10⁻⁹ | 9.04 × 10⁻¹¹ | 1.45 × 10⁻¹¹ | 5.68 × 10⁻¹¹ | 4.0 × 10⁻¹¹ |
| S2 | 6.37 × 10⁻¹² | 1.53 × 10⁻¹⁰ | 5.9 × 10⁻¹¹ | 1.69 × 10⁻¹³ | 1.37 × 10⁻¹¹ | 1.74 × 10⁻¹⁰ | 2.27 × 10⁻⁹ | 8.9 × 10⁻¹¹ | 1.44 × 10⁻¹¹ | 5.04 × 10⁻¹¹ | 3.57 × 10⁻¹¹ |
| S3 | 4.43 × 10⁻¹² | 1.33 × 10⁻¹⁰ | 4.89 × 10⁻¹¹ | 1.01 × 10⁻¹³ | 1.04 × 10⁻¹¹ | 1.37 × 10⁻¹⁰ | 1.7 × 10⁻⁹ | 8.67 × 10⁻¹¹ | 1.42 × 10⁻¹¹ | 3.96 × 10⁻¹¹ | 2.84 × 10⁻¹¹ |
| S4 | 2.48 × 10⁻¹² | 1.13 × 10⁻¹⁰ | 3.88 × 10⁻¹¹ | 3.39 × 10⁻¹⁴ | 7.15 × 10⁻¹² | 9.98 × 10⁻¹¹ | 1.13 × 10⁻⁹ | 8.44 × 10⁻¹¹ | 1.41 × 10⁻¹¹ | 2.88 × 10⁻¹¹ | 2.12 × 10⁻¹¹ |
| S5 | 1.0 × 10⁻¹¹ | 1.69 × 10⁻¹⁰ | 6.68 × 10⁻¹¹ | 2.39 × 10⁻¹³ | 1.66 × 10⁻¹¹ | 2.02 × 10⁻¹⁰ | 2.72 × 10⁻⁹ | 9.08 × 10⁻¹¹ | 1.23 × 10⁻¹¹ | 5.88 × 10⁻¹¹ | 3.99 × 10⁻¹¹ |
Disclaimer/Publisher’s Note: The statements, opinions and data contained in all publications are solely those of the individual author(s) and contributor(s) and not of MDPI and/or the editor(s). MDPI and/or the editor(s) disclaim responsibility for any injury to people or property resulting from any ideas, methods, instructions or products referred to in the content. |
© 2024 by the authors. Licensee MDPI, Basel, Switzerland. This article is an open access article distributed under the terms and conditions of the Creative Commons Attribution (CC BY) license (https://creativecommons.org/licenses/by/4.0/).
Share and Cite
Tunçok-Çeşme, B.; Yıldız-Geyhan, E.; Çiftçioğlu, G.A. Environmental Life Cycle Assessment of Two Types of Flexible Plastic Packaging under a Sustainable Circular Economy Approach. Sustainability 2024, 16, 3149. https://doi.org/10.3390/su16083149
Tunçok-Çeşme B, Yıldız-Geyhan E, Çiftçioğlu GA. Environmental Life Cycle Assessment of Two Types of Flexible Plastic Packaging under a Sustainable Circular Economy Approach. Sustainability. 2024; 16(8):3149. https://doi.org/10.3390/su16083149
Chicago/Turabian StyleTunçok-Çeşme, Börçe, Eren Yıldız-Geyhan, and Gökçen Alev Çiftçioğlu. 2024. "Environmental Life Cycle Assessment of Two Types of Flexible Plastic Packaging under a Sustainable Circular Economy Approach" Sustainability 16, no. 8: 3149. https://doi.org/10.3390/su16083149
APA StyleTunçok-Çeşme, B., Yıldız-Geyhan, E., & Çiftçioğlu, G. A. (2024). Environmental Life Cycle Assessment of Two Types of Flexible Plastic Packaging under a Sustainable Circular Economy Approach. Sustainability, 16(8), 3149. https://doi.org/10.3390/su16083149