
Driving Factors in Carbon Emission Reduction in Prefabricated Building Supply Chains Based on Structural Equation Modelling
School of Civil Engineering and Architecture, East China Jiaotong University, Nanchang 330013, China
*
Author to whom correspondence should be addressed.
Sustainability 2024, 16(8), 3150; https://doi.org/10.3390/su16083150
Submission received: 11 December 2023
/
Revised: 23 March 2024
/
Accepted: 8 April 2024
/
Published: 10 April 2024
(This article belongs to the Topic Sustainability in Buildings: New Trends in the Management of Construction and Demolition Waste, 2nd Volume)
Abstract
:As one of the development paths of construction industrialization, prefabricated buildings (PBs) are an important means for China’s construction industry to achieve the “double carbon” goal. To better leverage the energy-saving and emission-reduction benefits of prefabricated buildings, we have analyzed the driving factors and driving paths of carbon emission reduction in prefabricated buildings from the perspective of the supply chain. The carbon emission-reduction driving index system of prefabricated building supply chains (PBSCs) was constructed through the literature review method and the questionnaire investigation method. The structural equation model (SEM) was used to analyze the relationship of each driving factor. The importance of each driving factor was quantitatively analyzed on account of the model’s operation results. The results showed: the order of importance of driver levels is technology-driven > economic-driven > market-driven > government-driven > supply chain coordination-driven. The key driving factors are summarized based on the ranking of driving factor indicators in each dimension, providing a reference for participants in PBSCs to adopt low-carbon measures and providing a basis for government departments to formulate carbon emission-reduction strategies.
1. Introduction
In September 2020, China proposed a “dual carbon” goal, stating that carbon dioxide emissions will peak in 2030 and achieve carbon neutrality in 2060 [1]. Prefabricated buildings (PBs) have become a focus of attention in the construction industry due to their advantages in saving resources [2], reducing carbon emissions [3], and reducing environmental pollution [4] compared with traditional buildings. The construction industry produces about 33% of global greenhouse gas emissions annually, and the resources consumed each year account for about 40% of global resource consumption. It is expected that by 2050, the energy consumption of the construction industry will increase by 1–3 times [5]. Against this background, China has begun to vigorously develop prefabricated buildings so as to diminish resource consumption and greenhouse gas emissions caused by the construction industry. PBs are a type of building in which cast-in-place components are transferred to a prefabricated component factory for modular production, and then transported to the construction site for installation. Since many building components of PBs are manufactured in factories, their working environment is cleaner, and material loss and resource waste are lower. Therefore, PBs have grown the leading stream in the advancement of China’s construction industry [6]. However, the current development process of domestic PBs is slow, and there are many deficiencies in terms of quality, schedule, cost, technology, and comprehensive benefits. This has also caused the development of PBs in China to be challenged to varying degrees [7]. To better promote PBs and encourage the sustainable development of China’s construction field, the energy-saving and emission-reduction effectiveness of PBs must be fully exploited.
In the late 1980s, the idea of supply chains was led into the construction industry. In light of the features of production operations in the construction industry, some scholars combined the supply chain with the construction production process and proposed the notion of the construction supply chain [8]. At present, many scholars have defined PBSCs from different perspectives. From the perspective of information sharing, Zhang et al. defined PBSCs as a coordination network structure composed of construction units, contractors, design units, and other enterprises [9]. From the perspective of benefit distribution, Chi Zhang et al. believe that PBSCs are a green supply chain system with PBs as the final product [10]. From the perspective of carbon emissions, this paper defines PBSCs as a functional chain structure that includes information flow, cash flow, logistics, carbon flow, and a system in which many entities participate in prefabricated production activities. The main communication path is shown in Figure 1 [11]. PBSCs have changed the production model of the traditional building supply chain, greatly reducing resource loss and carbon emissions [8], but the transformation of production models also leads to changes in factors affecting carbon emissions. For example, the market, environment, and economic benefits of PBSCs are different from those of the traditional building supply chain, and there are significant differences in the coordination effects and degree of influence among the various participating entities [12]. Some scholars have shown that in the entire life cycle of PBs, the carbon emissions in the component production process account for more than 85%, and good technical support can effectively reduce carbon emissions in this stage [13]. In addition, practical experience has proven that changes in environmental policies will have an impact on the carbon emission reduction through PBSCs, and the current environmental and economic policies also face many problems, such as different subsidy levels, carbon price fluctuations, etc., which also bring many challenges to the implementation of carbon emission reduction through PBSCs [14,15]. Therefore, when researching the driving factors in carbon emission reduction through PBSCs, apart from considering the impact of the policy environment and economic benefits on carbon emission reduction, the characteristics of and changes in PBSCs must also be considered.
Therefore, this paper proposes research hypotheses on the driving factors in carbon emission reduction through using PBSCs and uses SEM to establish an evaluation model to evaluate the driving factors on carbon emission reduction through using PBSCs. The aims mainly include the following two points: (1) Define the driving factors of carbon emission reduction through PBSCs, establish a driving factor model, and determine the key driving factors. (2) Analyze the driving mechanisms of various factors on carbon emission reduction through PBSCs and provide corresponding strategies to improve the carbon emission reduction benefits of PBSCs. This paper provides a theoretical reference for the formulation of carbon reduction strategies for PBSCs, applies the SEM to establish a driving index evaluation model, and enriches the theoretical research system for carbon emission reduction through PBSCs. In practice, it provides a paradigm for the transformation of the construction business and sustainable development in the construction field, providing a basis for government departments to formulate policies, effectively reducing the carbon emissions of PBSC enterprises and improving the energy-saving and emission reduction benefits of the construction industry.
2. Literature Review
To emphasize the research focus of this paper, the literature involved is distinguished into four genres, namely, carbon emissions from PBs, emission reduction benefits of PBSCs, influencing factors in carbon emissions, and the application of SEM in PBs. In addition, the main research content and methodology of this paper were determined by analyzing the literature.
PBs can effectively lessen the adverse impacts of buildings and have become a building model accepted and advocated in China’s construction field. They are also gradually becoming an important carrier of future sustainable development in the field of construction in China [16]. Accordingly, many scholars have researched the carbon emissions of PBs. Dong et al. have calculated the carbon emissions in the entire logistics and distribution process of prefabricated building components and found that off-site carbon emissions during transportation and construction site hoisting stages are the main sources of carbon emissions in the entire logistics and transportation process [17]. Xie et al. have used the carbon emission coefficient method to construct a calculation mold to measure and analyze the carbon emissions over the course of the construction phase of PBs [18]. Sun et al. have set up an index system of carbon emission-influencing factors in the stage of PB construction and evaluated it by using the hierarchical fuzzy comprehensive evaluation method, finding that the use of the prefabricated assembled construction method can effectively reduce carbon emissions [19]. Xu et al. constructed a calculation model for carbon emissions during the transportation of composite beams and other components, and it was found that medium-sized diesel trucks produced the most carbon emissions during the transportation stage [20]. Omar et al. have analyzed PBs in comparison to traditional cast-in-place buildings and they found that the use of prefabricated wall panel systems can reduce total carbon emissions by 26.27% [21]. It can be seen that PBs have good emission reduction benefits, but to further promote the low-carbon development of the construction industry, it is necessary to analyze the carbon reduction mechanisms of PBs systematically.
With the increasing pressure surrounding carbon emissions in the construction industry, many scholars have researched the overall carbon emissions of PBs from the perspective of the supply chain as a way to improve the emission reduction effect of PBs. Wang et al. have established a game-oriented system dynamics model to study the low-carbon execution effect of PBSCs, and they discovered that low-carbon practices, developers’ environmental consciousness, and carbon tax policies can promote the implementation of carbon emission reductions in PBSCs [11]. Pons and Wadel have used the theoretical method of life cycle assessment to explore the environmental influence of PBs on 200 prefabricated schools in Spain, and they have suggested that the use of prefabricated building technology can effectively cut construction costs, resource consumption, and construction waste, thereby achieving carbon emission-reduction effects in the construction industry [22]. Waltho et al. have manifested that a good carbon tax policy can effectively reduce carbon emissions in the green supply chain system [23]. However, most research has explored the emission reduction benefits of PBSCs, but there is a lack of research on the drivers of carbon emission reduction benefits through PBSCs, especially the driving factors.
Regarding influencing factors, Ding et al. have delineated the indicators of PB carbon emission-influencing factors from five dimensions, and they established an improved TOPSIS model to analyze the degree of influence; the results showed that the degree of influence in descending order was pressure, state, driving force, influence, and response [24]. Du et al. have systematically summarized the influencing factors on carbon emissions in PBSCs, including government factors, technical factors, market factors, and supply chain-coordination factors [6]. Liu et al. have used the COWA operator and the cloud modeling theory to determine the level of sustainability of PBSCs, finding that the sustainability of PBs is reflected in four dimensions: economic development, ecological environment, resource utilization, and social development [25]. Gao et al. have simulated the speed and effect of the sustainable development of PBSCs. Their results show that ecological design and standard setting can positively promote the sustainable development effect of PBSCs [26]. In addition, some studies have indicated that environmental and social costs have a noticeable effect on the sustainability of the supply chain [27]. Nevertheless, few scholars have systematically studied and described the driving factors of carbon emission reduction through PBSCs and the influencing mechanisms between factors.
SEM can reveal the key influencing factors and their influence paths in complex systems, and it has been widely used in research in the field of PBs [28]. For example, Zhang et al. started from the perspective of the hidden costs of PBs and used a combination of SEM and MEA (extension matter element method) to establish an evaluation model for the hidden cost control level of PBs [29]. Chen et al. have used SEM to analyze the construction costs of PBs, and it was shown that the production cost of prefabricated components has a positive impact on transportation costs and installation costs [30]. At the same time, many scholars are using the TOPSIS model [31], Delphi [32], DEMATEL-ISM [33], and other methods to research the promotion of PBs and carbon emission-influencing factors, but such methods often have the disadvantages of complicated operation processes, high specializations for respondents, and susceptibility to subjective factors. SEM can tolerate measurement errors during use, requires a sufficient sample size to effectively reduce the influence of subjective factors, and provides the ability to estimate the causal relationship between multiple variables simultaneously [34,35]. Therefore, SEM has significant advantages and applicability in the study of factors and mechanisms of action in complex systems and can effectively support the research in this paper.
In summary, the current research on carbon emission reduction in PBSCs focuses on a specific stage, and few scholars have systematically analyzed and summarized the driving influence of driving factors on carbon emission reduction in PBSCs. Therefore, this paper begins from the perspective of the supply chain and applies SEM theories, aiming to systematically study the driving relationships and mechanisms of carbon emission-reduction factors in PBSCs and provide guidance for participants of carbon reduction in PBSCs.
3. Materials and Methods
This paper mainly erects a hypothetical mold of carbon emission reduction in PBSCs, using SEM to verify the hypothetical model, and finally evaluates the importance of each driving factor on carbon emission reduction through PBSCs. The method in this paper mainly involves five stages. In the first stage, the SEM theory is described; in the second stage, through a review and analysis of the literature related to carbon emissions of PBs, using the PEST theory and combining it with expert opinion revisions, the driving factors in five dimensions of government, market, economy, technology and supply chain coordination were finally determined (Table 1); in the third stage, five driving hypotheses were proposed to establish a hypothetical model of carbon emission reduction in PBSCs; in the fourth stage, data were collected and validated through questionnaire degree inspection. Finally, the data collected were validated and analyzed by using SEM.
3.1. Structural Equation Modeling
Structural equation modeling (SEM) is a multivariate statistical analysis method that combines “factor analysis” in traditional analysis methods with “regression analysis” in linear models to analyze the relationship between variables based on their covariance matrices [36]. SEM consists of two components, measurement modeling and structural modeling, where measurement modeling is used to describe how latent variables are measured by their corresponding observed variables, while structural modeling is used to describe causal relationships between latent variables and other unexplained parts of the model. The expression of the measurement model is shown in Formulas (1) and (2).
where X is an external derivative observed variables; is the factor loading of X; is an external derivative potential variable; is the measurement error term for the external derivative potential variable; Y is an internal derivative observed variables; is the factor loading of Y; is an internal derivative potential variable; and is the measurement error term for the internal derivative potential variable.
The expression for the structural model is shown in Formula (3).
where is the relationship between internal derivative potential variables; is the effect of external derivative potential variables on internal derivative potential variables; and is the error term.
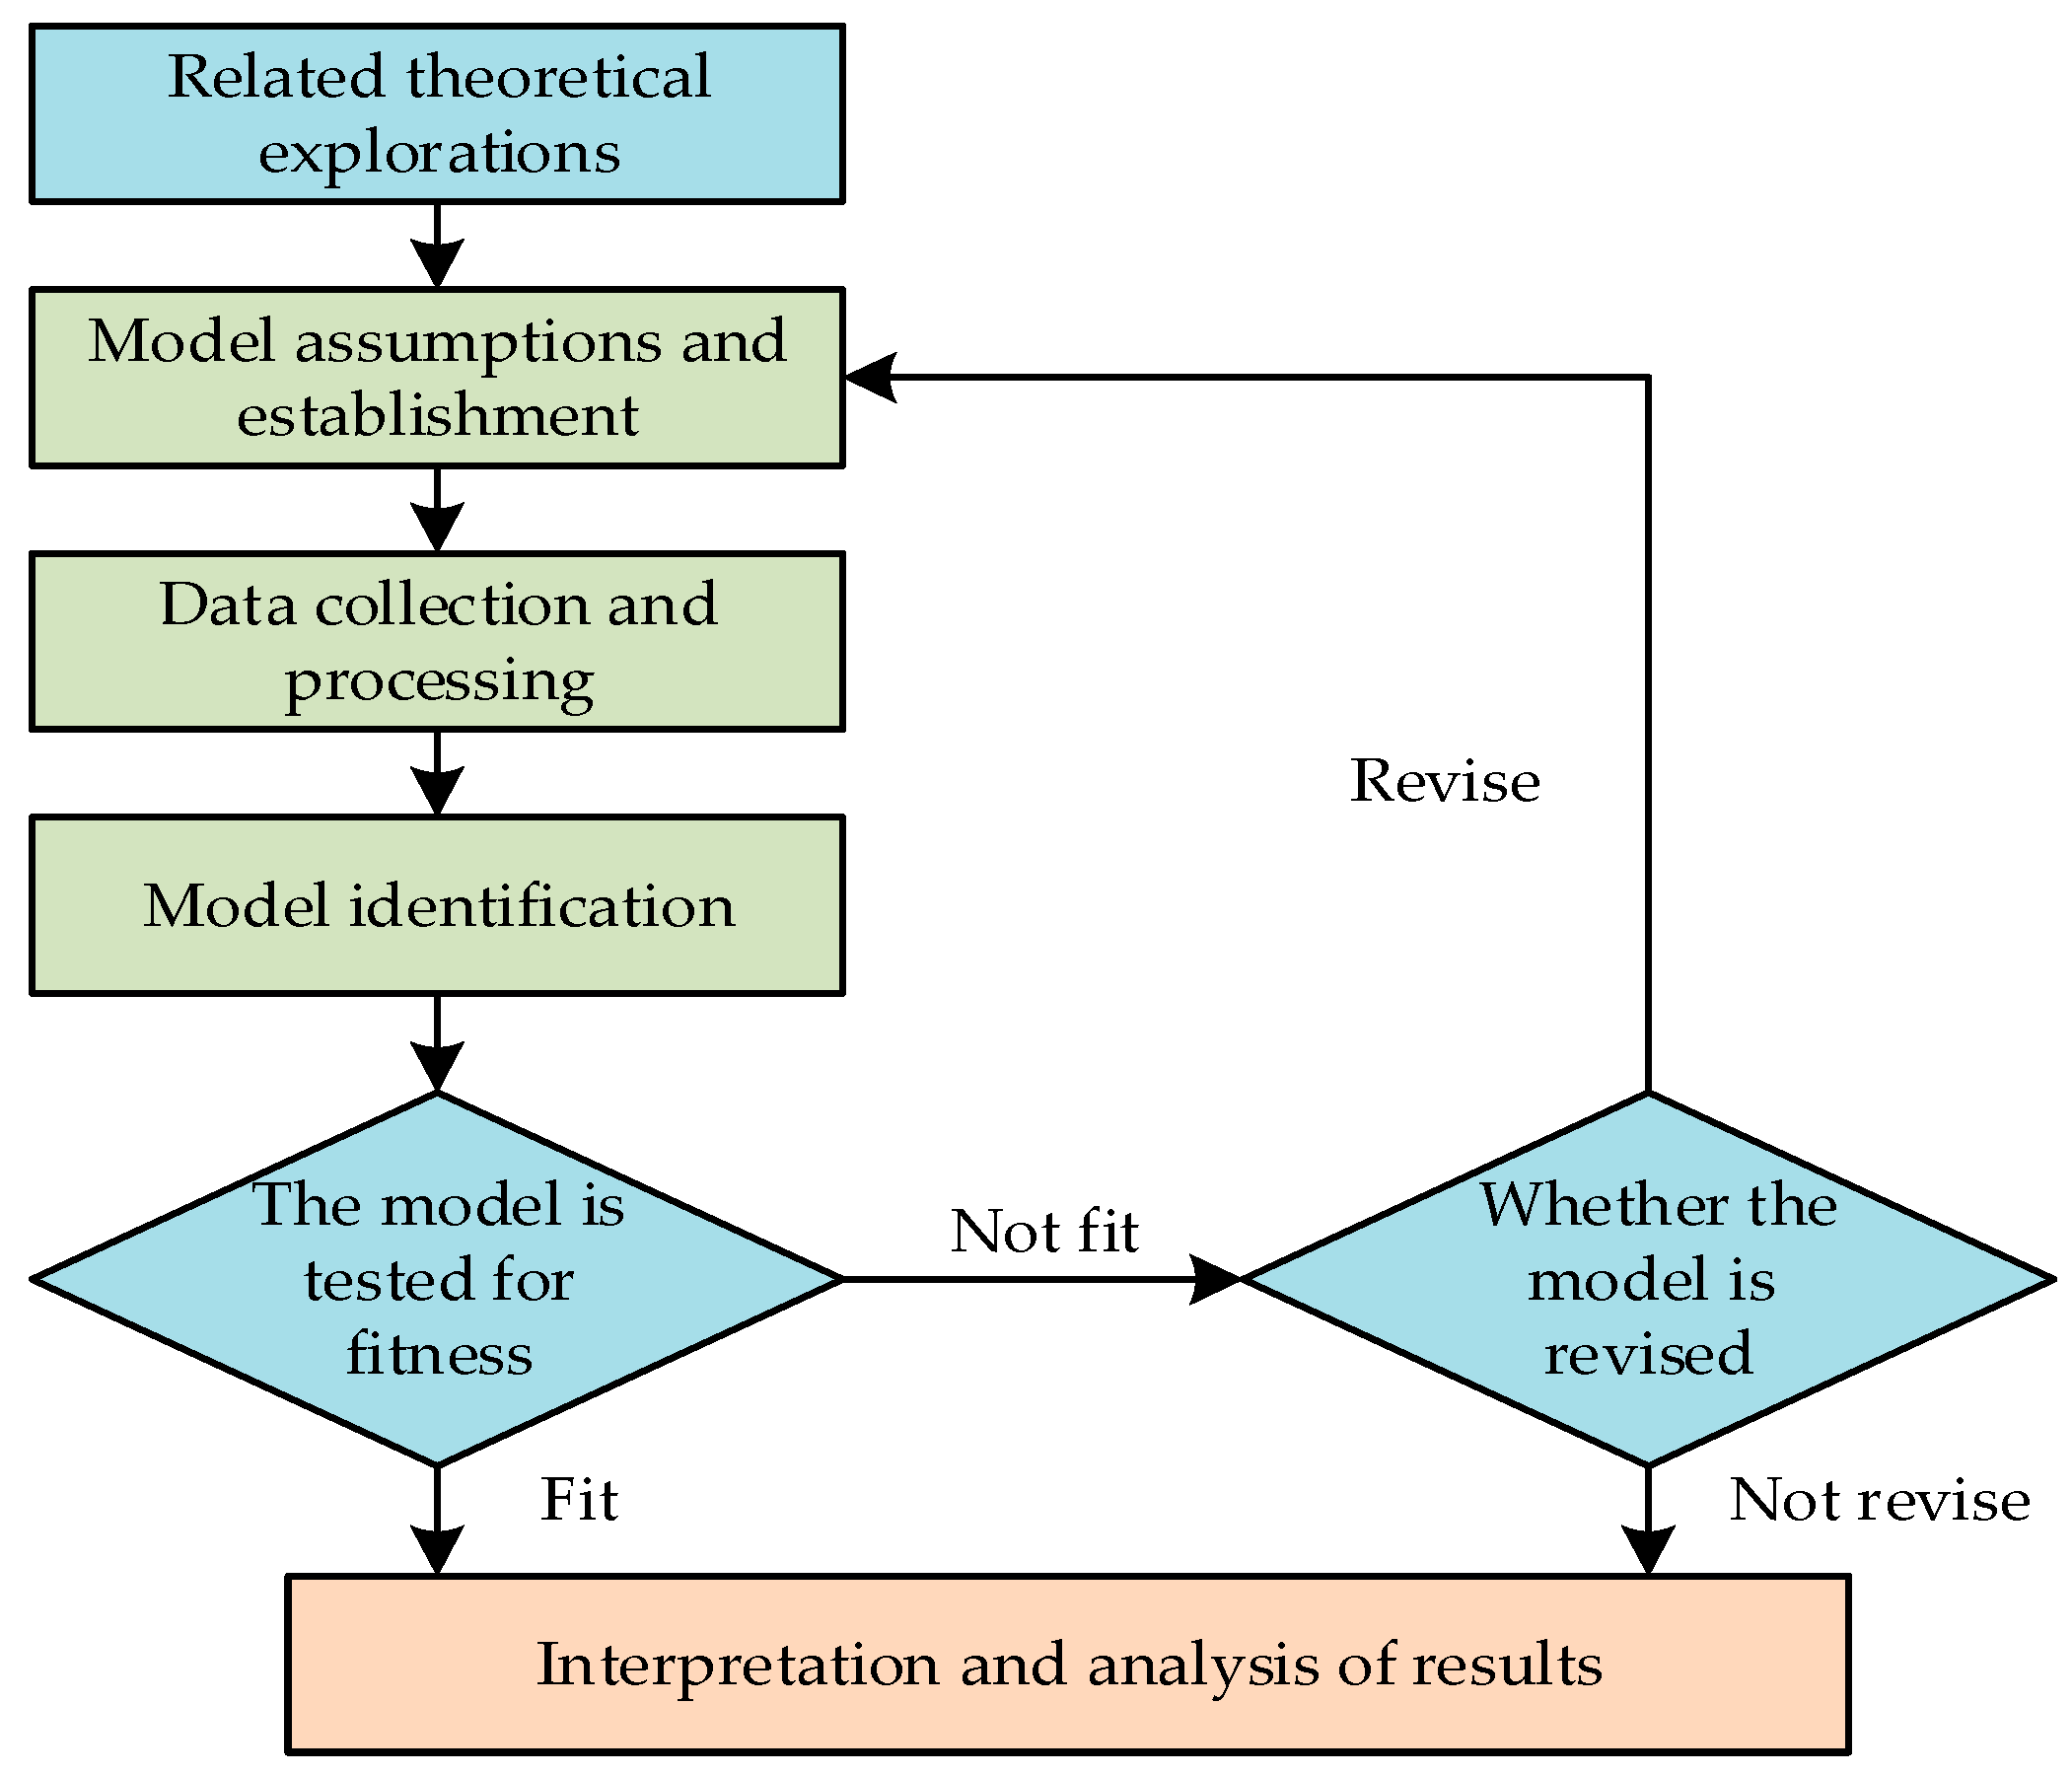
SEM has several advantages: (1) it enables the simultaneous estimation of causal relationships between multiple variables; (2) it allows for the presence of measurement error; (3) it evaluates the degree of fit of the variables in the model [34]. In this paper, SEM is applied to explore the drivers and driving relationships of carbon reduction in the assembly building supply chain, and the main application process is shown in Figure 2.

Table 1.
PBSC carbon emission reduction driving factor indicator system.
| Primary Indicators | Secondary Indicators | Descriptions | References |
|---|---|---|---|
| Government-driven (GD) | Government subsidy policy (GD1) | Government subsidies can increase the carbon emission reduction rate of enterprises and increase the total carbon emissions of the reverse supply chain. | [37,38] |
| Government carbon emission cap standards (GD2) | Carbon emission quota policies and carbon emission tax policies are conducive to the expansion of enterprise scale, optimization, and upgrading of enterprises, thereby reducing carbon emissions. | [38] | |
| Government supervision (GD3) | The government supervises the behavior and emission parameters of PBSC companies. | [39] | |
| Market-driven (MD) | Low-carbon awareness of enterprise (MD1) | The trade-off between economic benefits and environmental benefits of participating companies in PBSCs. | [40,41] |
| Low-carbon awareness of user (MD2) | Increased environmental awareness among users increases the carbon emission reduction rate. | [42] | |
| Low-carbon construction costs (MD3) | The lower the cost of low-carbon construction, the higher the likelihood that companies will adopt low-carbon behaviors. | [33] | |
| Competition among enterprises (MD4) | Companies take more carbon emission reduction measures to maintain market competitiveness. | [43] | |
| Prefabrication rate (MD5) | The higher the prefabrication rate, the more obvious the environmental benefits of PBs. | [44] | |
| Economic-driven (ED) | Regional economic development level (ED1) | The level of regional economic level affects the scale of PBs, thereby affecting the carbon emission reduction efforts of PBs. | [45] |
| Technology R&D capital investment (ED2) | Capital investment affects the research and development of innovative technologies, which in turn affects the efficiency of carbon emission reduction. | [46] | |
| Corporate capital flow (ED3) | The capital liquidity of enterprises affects the choice of low-carbon behaviors of enterprises. | [47] | |
| Clean energy usage funds (TD4) | Use clean energy to produce energy to improve the emission reduction efficiency of PBs. | [6] | |
| Technology-driven (TD) | Standardized design level (TD1) | A higher level of standardized design can effectively reduce resource consumption. | [48] |
| Low-carbon production technology (TD2) | Adopt production processes that reduce raw material loss and pollution during the production process. | [49] | |
| Level of recycling of building materials (TD2) | Recycling of building materials can reduce waste of resources | [41] | |
| Low-carbon construction technology (TD4) | Adopting low-carbon construction can reduce carbon emissions during the construction phase. | [50] | |
| Low carbon design of building structure (TD5) | Building structure design affects carbon emissions during building use, such as adaptability, durability, etc. | [49,51] | |
| Supply chain coordination-driven (SCCD) | Low-carbon leadership of core enterprises (SCDD1) | Construction units control corporate low-carbon behavior over their corporate low-carbon leadership. | [41] |
| PBSC enterprise information sharing (SCDD2) | Good information sharing and communication among PBSC companies can effectively help companies choose the best low-carbon measures. | [52] | |
| PBSC enterprise logistics and transportation level (GD3) | Efficient logistics and transportation can effectively reduce energy consumption and reduce the impact on the environment. | [17] | |
| Carbon emission reduction in PBSCs (CEPBSCs) | Direct carbon emission reduction (DCE) | Direct carbon reduction reduces the amount of carbon emissions released into the environment by affecting construction production activities. | [53] |
| Indirect carbon emission reduction (ICE) | Indirect carbon emission reduction reduces carbon emissions by affecting the production activities of other industries. |
3.2. PBSCs Carbon Emission-Reduction Driving Factor Indicator System
With the help of the PEST theory, the external macro-environment of the industry is analyzed from the four dimensions of political, economic, social, and technological perspectives, combined with the method of chronological literature order, to analyze the production characteristics of PBSCs and uncover the driving factors in five dimensions: government-driven, market-driven, economic-driven, technology-driven, and supply chain coordination-driven. This paper uses these five driving factors as latent variables in SEM. Each latent variable corresponds to several measurement indicators and thus is established as a measurement model. In addition, carbon emission reduction through PBSCs is used as the dependent variable of this measurement. The measurement indicators of driving factors for carbon emission reduction in PBSCs are shown in Table 1.
3.3. Research Hypothesis
3.3.1. Government-Driven Dimension
As the main standard setter and supervisor of the industry, government departments can provide policy support and behavioral guidelines for energy saving and emission reduction in PBSCs, playing an important role in promoting carbon emission reduction in PBSCs [54]. Among the government driving factors are government subsidy policies for carbon emission reductions, relevant standards for carbon emission quotas, and government supervision systems. The government implements relevant policies to constrain the carbon emission reduction behaviors of PBSC enterprises. Secondly, perfection of the government supervision system can also further standardize corporate carbon emission reduction measures.
3.3.2. Market-Driven Dimension
Some scholars have shown that a good low-carbon market environment can effectively reduce the carbon emissions of PBSCs [55]. Among the driving factors of the carbon emission reduction market in PBSCs are the low-carbon awareness of enterprises participating in the supply chain, the low-carbon awareness of users, low-carbon construction costs per unit participating in the materialization stage, competition between enterprises, and prefabrication rates. These factors have a considerable effect on the carbon emission reduction benefits of PBSCs. In the PBSC market, the low-carbon awareness of participating enterprises and end users affects the carbon emissions of the entire life cycle of PBs. From the perspective of market economy and market competition, the cost of low-carbon construction affects the choice of low-carbon behavior of enterprises. Competition between enterprises can actively encourage enterprises to execute green technology innovation and improve the profitability and carbon emission reduction rates of prefabricated construction enterprises [56].
3.3.3. Economic-Driven Dimension
Increasing capital investment in low-carbon technology and new energy development for PBs can efficaciously reduce carbon emissions [46]. Improving the carbon emission reduction efficiency of PBSCs requires substantial financial backing. It mainly involves capital investment in new energy and new technologies as well as capital flows between enterprises. From a macroeconomic perspective, the overall economic level of a region also has a significant ascendancy on the low-carbon development of PBs [57].
3.3.4. Technology-Driven Dimension
In the production process of PBs, supply chain enterprises can continuously increase their efforts in energy conservation and emission reduction by improving the level of technological innovation [31]. Involving standardized design level, low-carbon production technology level, low-carbon construction level, and building material recycling level, the above methods can effectively reduce resource consumption and energy loss in the process of production. At the beginning of a design, the carbon emissions during the use stage of a building can also be reduced through the low-carbon design of PBs.
3.3.5. Supply Chain Coordination-Driven Dimension
Supply chain coordination has been proven to be the main influencing factor in supply chain carbon emission reduction [58]. Among the drivers of coordination in PBSCs, the level of information sharing and logistics between enterprises can affect the low-carbon efficiency of PBSCs to a certain extent [17,52]. The construction unit is the core enterprise of PBSCs, and its low-carbon leadership of other companies directly affects a company’s low-carbon behavior and controls carbon emission reduction through PBSCs.
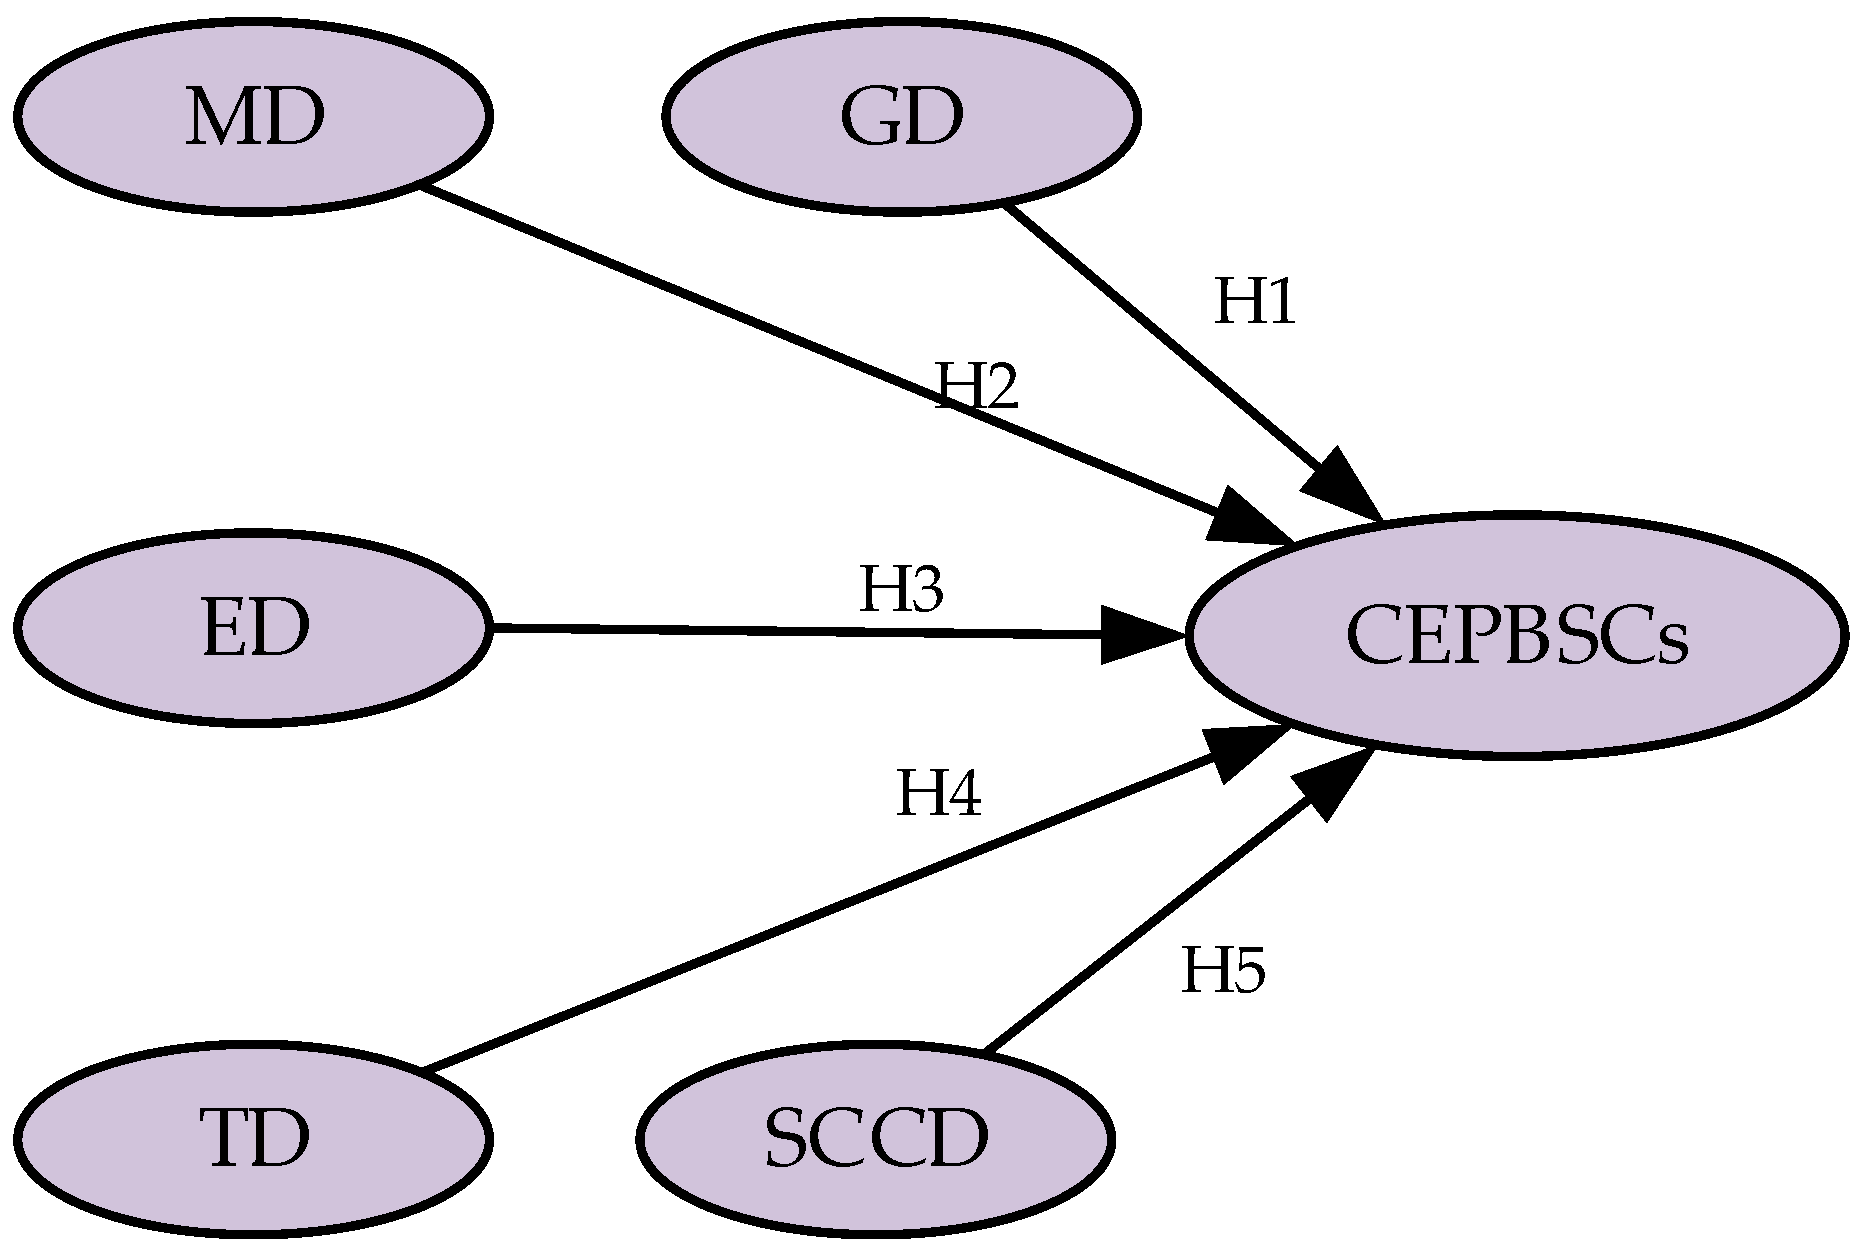
In view of the above content, this paper proposes the following hypothesis. The hypothesis model is shown in Figure 3.
H1.
The government-driven dimension has a positive correlation with carbon emission reduction in PBSCs.
H2.
The market-driven dimension has a positive correlation with carbon emission reduction in PBSCs.
H3.
The economic-driven dimension has a positive correlation with carbon emission reduction in PBSCs.
H4.
The technology-driven dimension has a positive correlation with carbon emission reduction in PBSCs.
H5.
The supply chain coordination-driven dimension has a positive correlation with carbon emission reduction in PBSCs.
3.4. Data Collection
In this paper, experts were invited to fill in the questionnaire mainly by means of an online communication platform and a telephone consultation. The questionnaire mainly comprises two parts. Part 1 comprises the basic information of the interviewee. Part 2 contains the indicator measurement scale for the carbon emission-reduction driving factors of PBSCs. It contains a total of 22 questions and is based on the carbon emission-reduction driving indicators of PBSCs collected above and the research hypotheses proposed. Some scholars have shown that when using a Likert scale for scoring, the more detailed the score setting, the better the reliability and validity of the data obtained, and the reliability of the data obtained by using the seven-point scale is significantly improved compared with the five-point scale [59]. Therefore, this paper takes comprehensive consideration and uses a seven-point Likert scale to solicit respondents’ attitudes towards the measurement indicators, with the degree of influence increasing step by step from “1” to “7”.
To ensure the validity of these data, the interviewees were mainly selected from areas with relatively advanced developments of PBs in China, such as Shanghai, Jiangsu, and Guangdong. In the design and processing of the questionnaire, a reverse question was added to the questionnaire. When the respondent took less than 2 min to answer the questionnaire or gave the opposite answer in the reverse question, their response to the questionnaire was regarded as invalid. In addition, the remaining questionnaires were strictly screened, 21 invalid questionnaires were finally eliminated, and 280 valid questionnaires were recovered. The number of valid questionnaires is 10-times greater than the number of questions set, which meets the requirements of SEM analysis [60]. The interviewees included all participating departments in PBSCs as well as experts who have been engaged in PBs at various stages. The scholars and experts involved were comprehensively selected to ensure that the data obtained are more in line with objective facts.
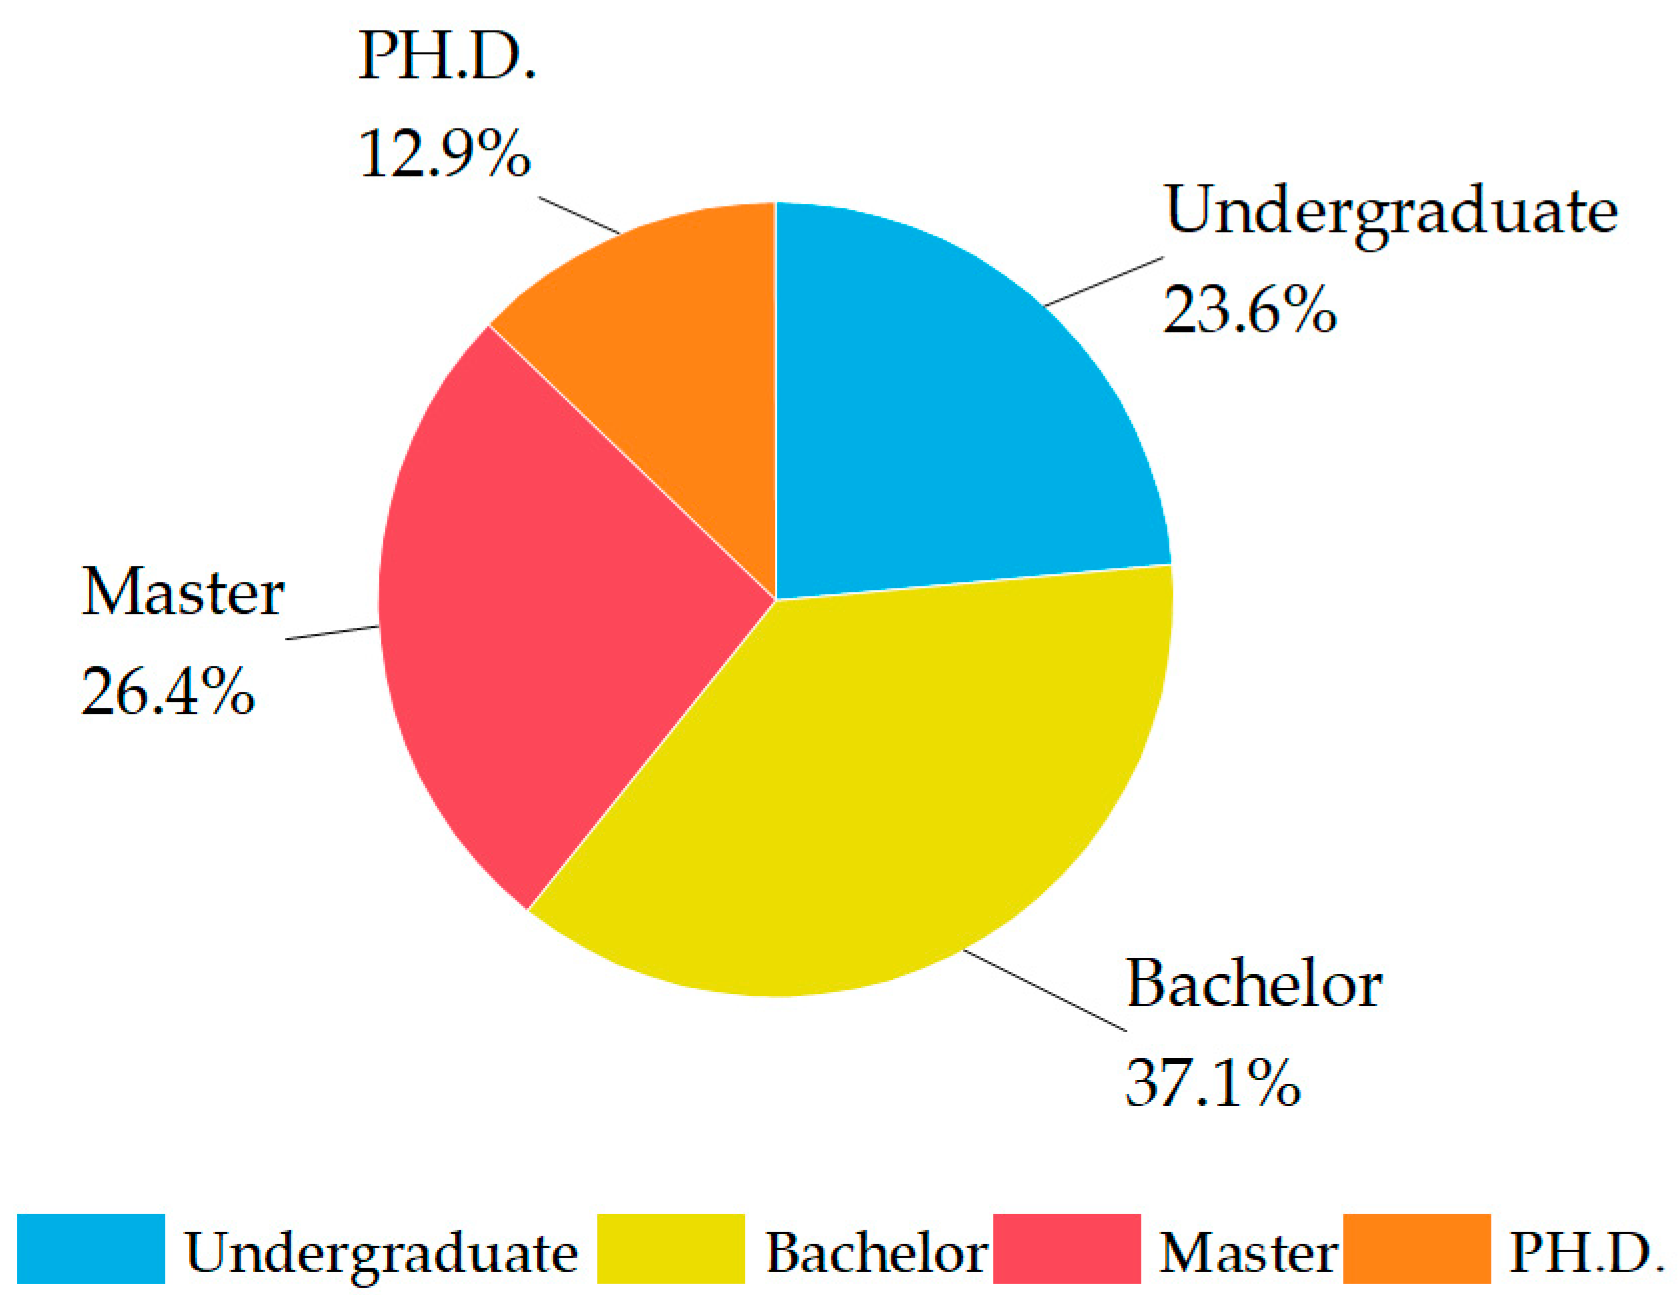
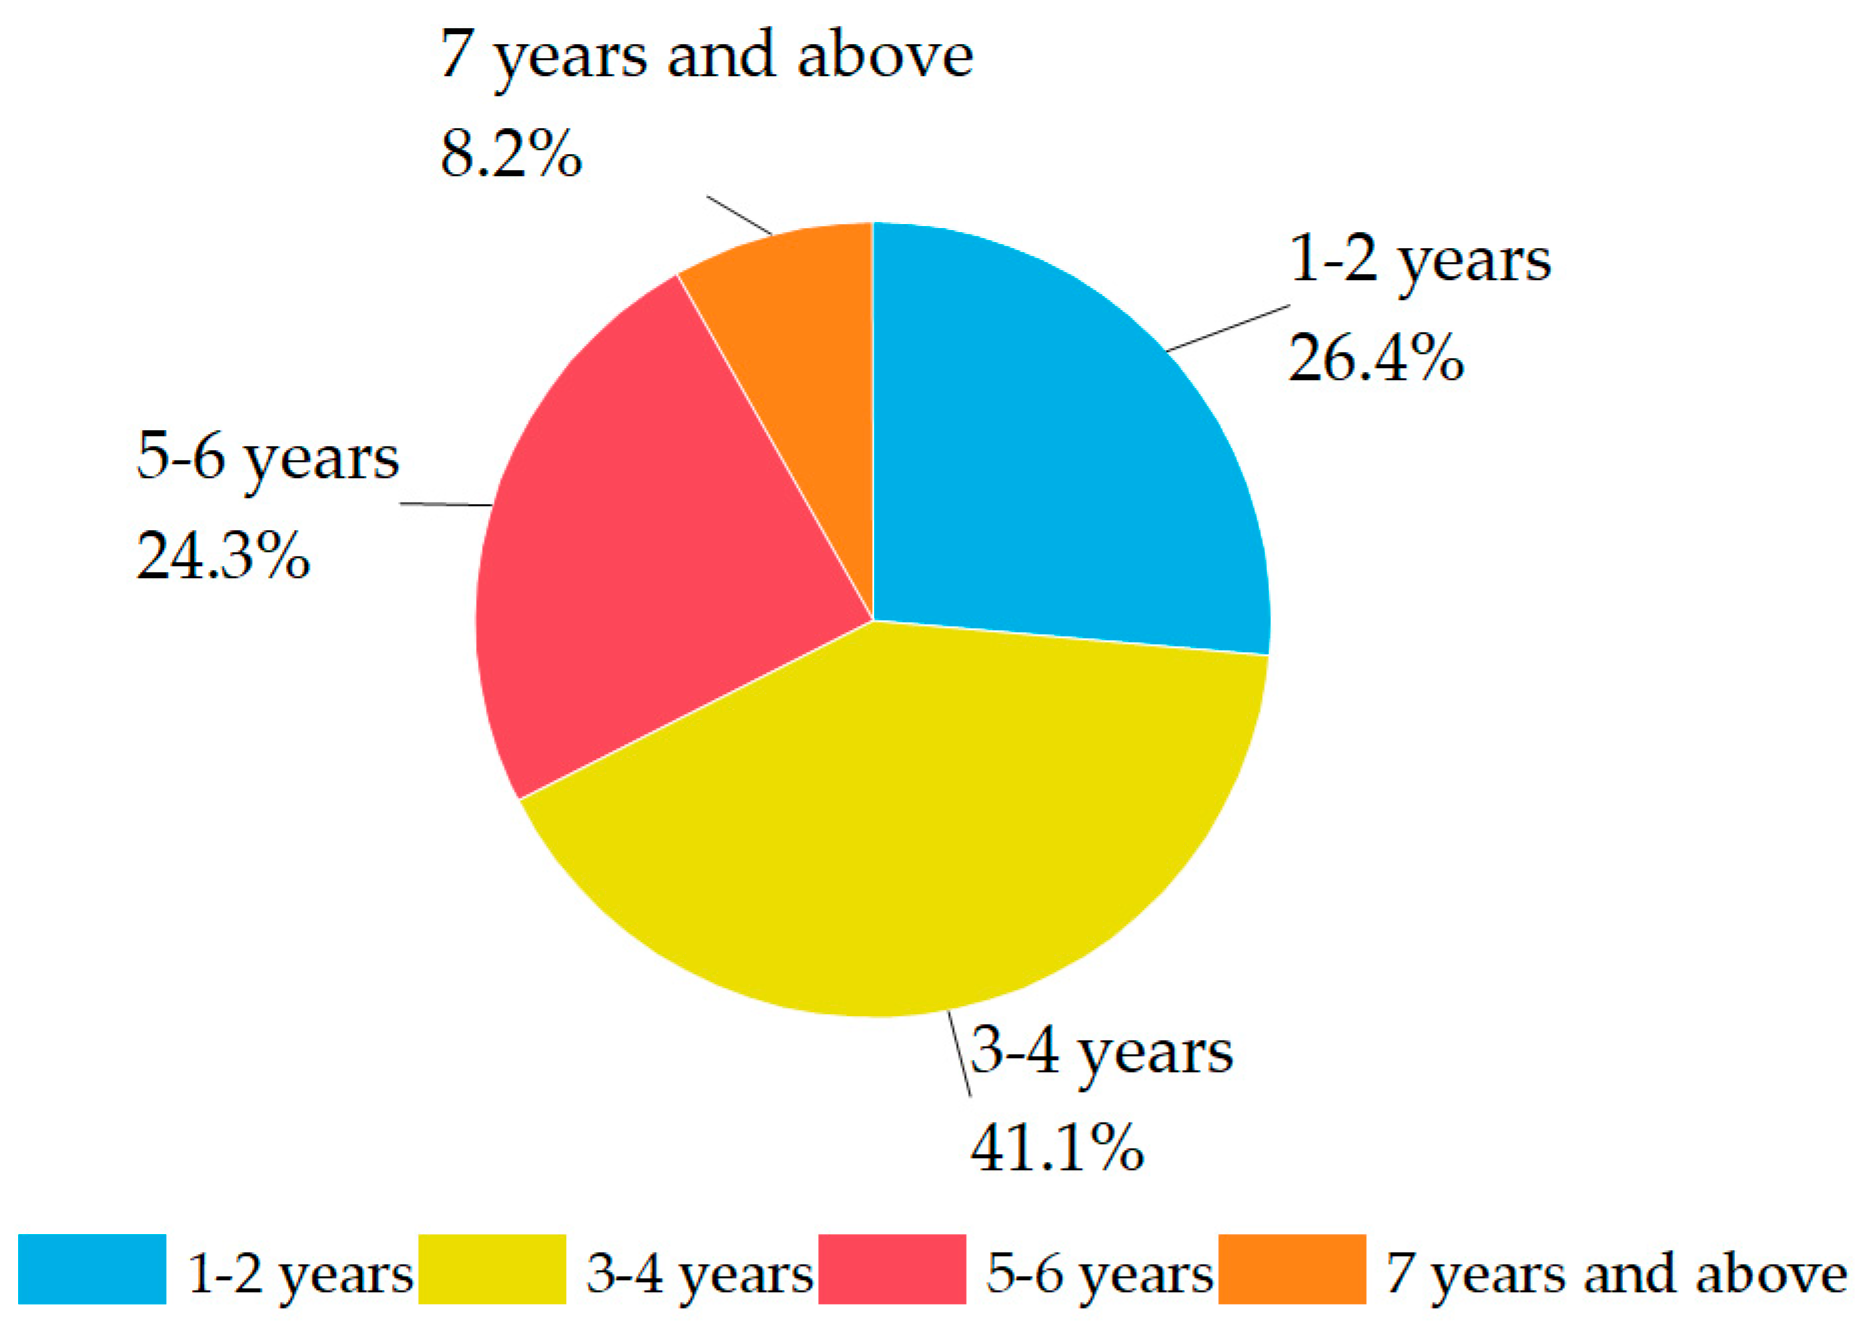
The educational background of the interviewees is shown in Figure 4, the years of working experience in PBs is shown in Figure 5, and the work department is shown in Figure 6. Please see Appendix A for the questionnaire.
3.5. Data Analysis
3.5.1. Component Analysis
To further verify the rationality of the questionnaire design, component analysis had to be performed on the scale. SPSS26.0 software was used to calculate the KMO value and Bartlett’s sphericity test to assess the fitness of the data. Generally, when both the KMO test coefficient is greater than 0.6 and the Sig value of the Bartlett sphericity test is less than 0.05, it shows that the questionnaire has good structural validity and is suitable for factor analysis. The calculation results are shown in Table 2. As can be seen from Table 2, the KMO value is 0.751, and the Sig value of Bartlett’s sphericity test is 0.000. Therefore, factor analysis can be performed on the scale data, and the calculated results are shown in Table 3.
From Table 3, we can see that the principal component analysis results show that the total initial eigenvalues of the 6 component indicators are greater than 0.8, and that the cumulative variance contribution rate reaches 73.2%, indicating that the 22 factors included in this questionnaire can effectively converge into 6 common component indicators. So, the questionnaire on driving factors for carbon emission reduction in PBSCs has considerable validity.
3.5.2. Reliability and Validity Test
Before running the model, SPSS26.0 and Amos24.0 were used to conduct reliability and validity analyses. The commonly used Cronbach’s alpha was used to perform reliability analysis on the questionnaires. Generally speaking, when Cronbach’s alpha is less than 0.6, the internal consistency is considered to be insufficient. When Cronbach’s alpha is between 0.6 and 0.7, the scale reliability is considered to be good. The reliability is between 0.7 and 0.8, the internal consistency to have considerable reliability. When the number is greater than Cronbach’s alpha of 0.8, the reliability is very high [33]. Secondly, the convergent validity of the scale was tested by using combined reliability (CR) and average variance extracted (AVE). When Cronbach’s alpha and CR both outweigh 0.7, and the AVE overtakes 0.5, it indicates that the scale has good internal consistency and convergent validity [61].
According to the calculation results in Table 4, the Cronbach’s alpha of each latent variable is greater than 0.7, implying that the questionnaire data collected at this time have good reliability. In terms of validity, convergent validity and discriminant validity are used for validity testing. As can be seen from Table 4, the CR of each latent variable outweighed 0.7 and the AVE outweighed 0.5, implying that the scale has very good internal convergent validity. For discriminant validity, we used correlation indicators to calculate this metric. Generally, when the internal correlation coefficient of each dimension is greater than its external correlation coefficient, it is considered to have good discriminant validity. According to Table 5, the internal correlation coefficients of the six latent variable indicators are larger than the correlation coefficients with other dimensions, thus proving that the model has good discriminant validity.
All of the above calculation results show that the model data meet the requirements of reliability and validity and can be used for structural equation model analysis.
4. Results
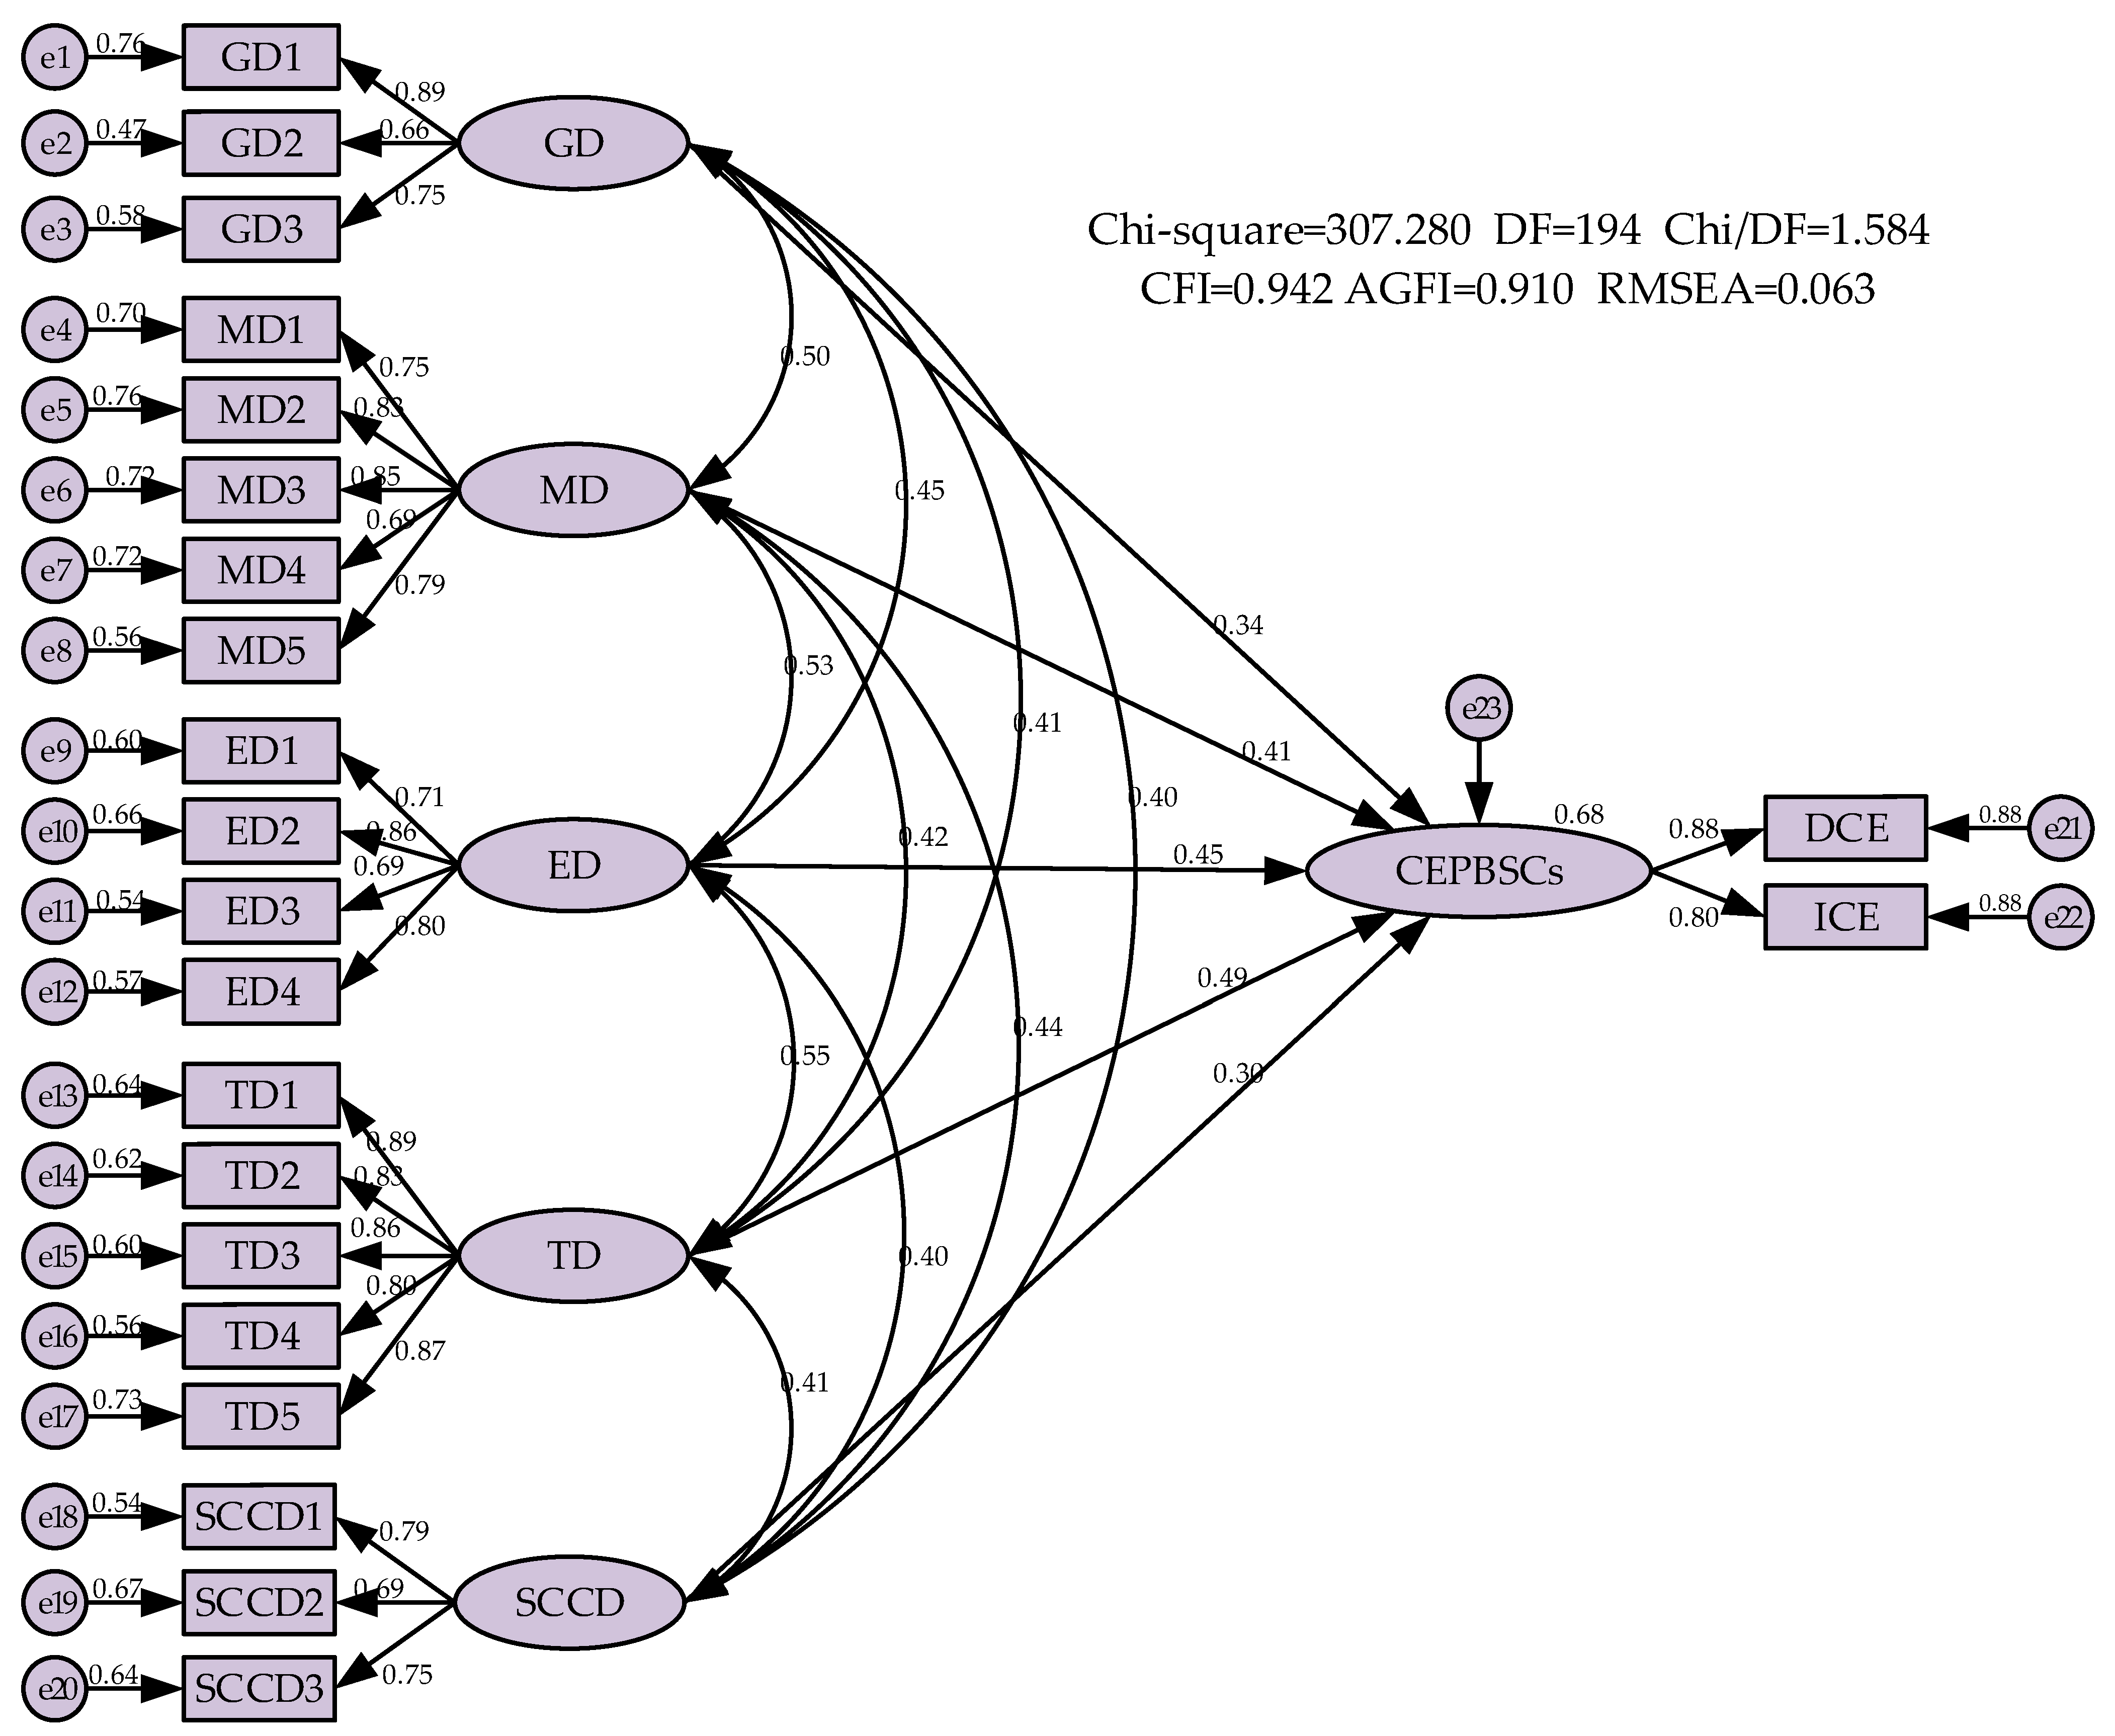
By revising the initial model, the model was modified to pass the SEM fitting test and we established the final driving model (Figure 7). The results of the model test show that the five hypotheses proposed are all supported. In addition, the weight of each driving factor was calculated and sorted based on the results outputted by the model. It was found that the driving forces are technology-driven > economic-driven > market-driven > government-driven > supply chain coordination-driven.
4.1. Model and Path Assumption Results
Initially, the questionnaire data were analyzed and it was found that the established assumptions and questionnaire design met the requirements of reliability and validity. Secondly, we used AMOS24.0 to establish a model of driving factors for carbon emission reduction in PBSCs. Additionally, we conducted violation estimation tests and fitting tests on the initial model and the model observation data. Generally speaking, when the latent variable indicator error has a negative value or the normalized path coefficient is too close to 1, data violations are determined to be present [41]. This indicates that the model needs to be further modified until it passes the data test and the model’s fitness test.
After the initial model passes the violation estimation test, the model is tested for fitness. According to the running results of the AMOS24.0, we selected χ2/d.f. (1.000–3.000), GFI (>0.800), and RMSEA (<0.100) as the absolute fitness test indicators; NFI (>0.900), IFI (>0.900), and CFI (>0.900) were used as value-added fitness test indicators; and NFI (>0.900), IFI (>0.900), and CFI (>0.900) were used as value-added fitness test indicators [6,7,8,9,10,11,12,13]. According to the initial model fitness test data, GFI, NFI, IFI, and CFI did not meet the standards, and the model needed to be corrected further.
Since the invisible relationships between the observed variables were not considered in the initial model, variable relationships among the GD, MD, ED, TD, and SCCD variables were added into the model revision process. Secondly, χ2/d.f. is easily affected by the sample size. In the later model modification process, we continued to collect 50 sample datapoints, and we made corresponding adjustments to unreasonable samples. After the correction, it was found that the fitness indicators GFI, NFI, IFI, and CFI had been adjusted accordingly, and after several rounds of corrections and inspections, the fitness index met the standard, indicating that the fitting degree of the finally established model meets the requirements. The results of the fitness test index before and after the model modification are shown in Table 6.
The structural equation model of PBSCs is shown in Figure 7. The standardized path coefficients and p values between each antecedent variable output by using AMOS24.0 are shown in Table 7, from which the government drive dimension can be observed to have a significant positive impact on carbon emission reduction in PBSCs, with a path coefficient of 0.337 (p *** < 0.001) and H1 being established. Market drive has a positive impact on carbon emission reduction in PBSCs, the path coefficient is 0.431 (p = 0.004 < 0.01), and H2 is established. Economic drive has a significant positive impact on carbon emission reduction in PBSCs, with a path coefficient of 0.452 (p = 0.007 < 0.01), and H3 is established. Technological drive has a significant positive impact on carbon emission reduction through PBSCs, with a path coefficient of 0.488 (p *** < 0.01), and H4 is established. Supply chain coordination drive has a positive impact on carbon emission reduction in the supply chain of prefabricated buildings. The path coefficient is 0.297 (p = 0.023 < 0.05), and H5 is established. The standardized path coefficients of each of the above assumptions are all positive, which shows that the five driving factors of government, market, economy, technology, and supply chain coordination can positively drive carbon emission reduction through PBSCs. And the larger the coefficient, the better the carbon emission reduction benefits of the PBSCs.
4.2. Weight Analysis of Driving Factors for Carbon Emission Reduction through PBSCs
Figure 7 shows that the standardized path coefficient represents the importance of the influence between variables. Therefore, the impact of driving factors on carbon emission reduction in PBSCs can be quantified by calculating the weight of each driving factor. This paper uses weighted averages to calculate weights. The specific calculation steps are as follows.
Let Ai (i = 1,2,3,4,5) be the weight value of the latent variable indicator (first-level weight). Bi (i = 1,2,3,4,5) is the path coefficient between latent variables; then, the weight value (first-level weight) calculation formula of the latent variable is shown in Formula (4).
Let aij be the contribution value of each measurement index to the latent variable, which is called the second-level weight. bij (j = 1, 2, 3, 4, k) is the measured value of each measurement index. Then, the calculation formula of the secondary weight of the measurement index weight value is shown in Formula (5).
In the formula, k is the number of measurement indicators corresponding to each latent variable. The weight values of each driving factor are calculated as shown in Table 8.
As can be seen from Figure 7, the standardized path coefficients of the five driving factors are 0.34, 0.41, 0.45, 0.49, and 0.40, respectively, which shows that the five driving factors can have a significant positive impact on carbon emission reduction in PBSCs. Technological drive has the utmost effect on carbon emission reduction in the carbon supply chains of prefabricated buildings, followed by economic drive in the analysis from the perspective of weight. Among technological drivers, the level of standardized design has the greatest impact on carbon emission reductions in PBSCs, and the low-carbon and energy-saving design of building structures can also significantly affect the carbon emission reduction benefits of PBSCs. Some research has shown that carbon emissions in the production process of PBs can be successfully reduced by promoting standardized design models [42]. Some studies have also found that among the influencing factors of carbon emissions in PBSCs, technical factors are the most important [6], which also supports the research conclusion of this paper. Therefore, in the process of promoting carbon emission reduction through PBSCs, we should pay attention to the impact of technological innovation and economic benefits on carbon emission reduction. Secondly, market-driven, government-drive, and supply chain coordination-driven dimensions also have a significant impact on carbon emission reduction through PBSCs. The order of importance of the drive levels is as follows: technology-driven > economic-driven > market-driven > government-driven > supply chain coordination-driven.
5. Discussion
The SEM analysis results explain the importance of driving factors in carbon emission reduction through PBSCs, and the influencing relationship of various observation indicators has also been quantified. Based on the above results, the driving factors of carbon emission reduction through PBSCs are discussed to provide a reference for heightening the carbon emission-reduction benefits of PBSCs.
5.1. Technology-Driven Dimension
The results show that technological drivers have the strongest positive impact on carbon emission reduction through PBSCs. In the entire life cycle of PBs, the carbon emissions in the user phase account for up to 91% of the aggregate carbon emissions [62]. In the stage of PB fabrication, the carbon emissions from materials production and component production account for 89% [63]. Therefore, it is crucial to develop new low-carbon construction technologies and improve the low-carbon structural design of PBs. In the era of construction industrialization, intelligent construction and digital technology are widely used in China’s PBs, which are mainly built by using artificial intelligence, cloud computing, big data, and BIM technology. BIM technology can disassemble the PB production and construction processes, realize the industrialization of components, standardized production purposes, and effectively improve the material utilization rate and construction efficiency [64].
At the beginning of a design, digital modeling software can be employed to conduct effective simulations to formulate good decisions, which can further reduce energy consumption [65]. In the production process of prefabricated components, optimizing the energy conversion model and vigorously developing clean energy can effectively reduce carbon emissions [41]. During the construction process, the use of low-carbon construction technology can allow for more careful control of operations; reduce the number of hoisting equipment uses and tools; and reduce the investment in construction site personnel, materials, and equipment [66]. During the use phase of the project, the low-carbon design of a building structure is more conducive to extending the service life of a prefabricated building. The use of environmentally friendly building materials and energy-saving structural design can reduce energy consumption [67]. At present, there are still many obstacles to the innovation and application of low-carbon technologies, which are mainly limited by the construction of standard systems and economic benefits. Therefore, the question of how to solve the industrialization development of PBs and the coordinated development of economic benefits and technological innovation is an urgent problem for the government and society to solve.
5.2. Economic-Driven Dimension
Economic drivers are second only to technological drivers in their impact on driving carbon reduction through PBSCs. The low-carbon benefits of PBSCs are closely related to the level of carbon costs. Under the carbon tax system, supply chain companies can reduce the whole cost of a supply chain by adopting low-carbon measures, ensuring economic benefits while mitigating the pressure of carbon emissions [37]. The research, development, and promotion of low-carbon energy-saving technologies depend, to a certain extent, on the overall economic benefits of PBSCs, and also on the corresponding carbon tax policy that can be implemented to encourage supply chain enterprises to pay attention to the benefits of carbon emission reduction, mobilizing the enthusiasm of supply chain enterprises to reduce carbon emissions [7]. At present, people’s awareness of environmental protection has been gradually improved, and supply chain enterprises and consumers are more and more inclined to low-carbon production and low-carbon products. Furthermore, encouraging enterprises to increase capital investment in low-carbon production can cater to the market’s needs and improve economic efficiency, thus promoting the sustainable development of PBSC enterprises.
5.3. Market-Driven Dimension
A good market-driven environment can effectively promote corporate carbon emission reductions. The opening of the carbon emission rights trading market could significantly improve the innovation level and environmental awareness of enterprises and may take effect by promoting the implementation of corporate carbon emission-reduction actions [68]. PBs in China mainly face problems such as uneven development, insufficient development, and low standardization. Therefore, compared with traditional cast-in-situ buildings, the market competitiveness of PBs is weaker, which makes the low-carbon construction costs of PBSC companies significantly higher. In addition, users’ low-carbon energy-saving awareness greatly affects carbon emissions during the use stage of PBSCs [42]. Research results show that among market driving factors, low-carbon construction costs are the primary factor driving carbon emission reductions in PBSCs. Low-carbon construction costs are severely affected by the market environment, including users’ willingness to disburse for low-carbon products, competitiveness among construction companies, and the market economic benefits of PBSCs. Secondly, the prefabrication rate of PBs is a noteworthy indicator that reflects the development level of PBs. Cities with high prefabrication rates of prefabricated buildings have significantly reduced carbon emissions from the construction industry [69].
Therefore, enterprises can realize energy-saving technological transformation and building material innovation by increasing investment in technological research and development in order to accelerate internal technology upgrades and reduce low-carbon construction costs [70]. The government can also decrease the carbon tax costs of PBSC companies by formulating corresponding carbon trading market policies, promoting the low-carbon development of the PB market.
5.4. Government-Driven Dimension
Government drive mainly refers to the government providing support and guidance for energy conservation and emission reduction through PBSCs. The government can regulate financial policies to enhance the financing competitive advantage of PB enterprises and promote the transition of traditional construction enterprises to prefabricated construction, thereby reducing carbon emissions in the construction industry [54]. Due to the objective existence of the incremental costs of carbon emission reduction, enterprises are not willing to develop prefabricated building projects. The government can formulate corresponding subsidy policies to ease the financial pressure on enterprises and mobilize market demand, thereby stimulating the motivation of relevant enterprises to implement carbon emission-reduction production behaviors.
In terms of behavioral constraints, the current urban construction industry for corporate carbon emissions monitoring is mainly indirectly measured through the form of apportionment, which brings certain limitations to the allocation of carbon emission allowances [69]. The government can strengthen the monitoring of carbon emissions through remote sensing monitoring technology or data sampling to encourage enterprises to make carbon emission reduction the focus of their work. However, mandatory policies may lead many prefabricated construction companies to blindly pursue carbon emission reductions and prefabrication rates, ignoring quality and safety issues [67]. Therefore, the government should adopt policies that combine incentives and mandatory policies to effectively drive the implementation of carbon emission reductions in PBSCs.
5.5. Supply Chain Coordination-Driven Dimension
From the analysis of the results, supply chain coordination is a smaller driving force on carbon emission reduction in PBs than the other driving factors. In the entire life cycle of PBs, the use stage has the largest carbon emissions and is slightly affected by supply chain coordination [62]. The low-carbon leadership of core firms is related to supply chain members’ profits and carbon abatement cost coefficients [58]. Supply chain coordination affects the carbon emissions of PBSCs by affecting the degree of logistics transportation, component storage, and construction coordination between enterprises. However, the current level of coordination in domestic PBSCs is underdeveloped, and there are problems such as untimely data sharing and opaque and asymmetric information. This is the primary reason that supply chain coordination is not enough to drive carbon emission reduction [12].
In this regard, we can use information technology platforms to strengthen information interaction between enterprises in the supply chain system; utilize cloud technology and BIM technology to achieve dynamic control of information, logistics and funds; and provide a more refined supply chain operation model. Optimizing the transportation plan of prefabricated components, reducing uncertainty in the entire process, and improving supply chain coordination can effectively reduce carbon emissions.
5.6. Suggestions on Carbon Emission-Reduction Drive for PBSCs
The above discussion can provide a reference for the Chinese government to formulate corresponding driving measures for carbon emission reduction through PBSCs. Firstly, the government can improve the market competitiveness and carbon emission-reduction benefits of PBs by formulating corresponding carbon tax policies, financial policies, and carbon emission-monitoring policies. Secondly, in terms of technical support, increasing investment in the development of low-carbon energy-saving technologies, promoting cooperation between enterprises and scientific research institutions, and cultivating innovative talents for the low-carbon development of PBs will improve the level of green innovation in PBSCs. Finally, it is necessary to formulate relevant policies based on the development characteristics of different cities and local conditions, strengthen the planning and management of cities with high assembled ratio, actively create demonstration cities for PBs, actively carry out publicity and incentive work, and give full play to the demonstration effect. For areas where the development of PBs is slow, supporting their deficiencies in economic construction and technological innovation and formulating clear development plans and goals for PBs would promote the process of energy saving and emission reduction in the construction industry in different regions.
PBSC companies can actively develop and apply low-carbon production and assembly technologies for prefabricated components by establishing cooperation platforms with universities and other scientific research institutions, and they can also develop the digital and intelligent construction technologies. Furthermore, strengthening the training of corporate managers can improve project management efficiency. Enterprises must enhance coordination and cooperation capabilities, always pay attention to relevant government low-carbon policies, focus on the cultivation of relevant technical talents, enhance their company’s own green innovation capabilities, and improve their company’s low-carbon construction standard system.
6. Conclusions
This paper combines the PEST theory and uses literature analysis and expert interviews to delineate the driving factors behind carbon emission reduction through PBSCs. It constructs a carbon reduction model for PBSCs from the five dimensions of government, market, economy, technology, and supply chain coordination. By ranking the driver indicator system based on previous research, we have established a carbon emission-reduction driving model for the prefabricated building supply chain, designed a questionnaire which collected data based on the hypothesis model, and used the SEM theory to analyze and verify each hypothesis. The aim was to study the relationship between the driving factors in carbon emission reduction through PBSCs, recognize the crucial driving factors, quantitatively analyze the importance of each driving factor, and provide strategies for the effective implementation of emission reduction through the main bodies of PBSCs. The following points are the main conclusions:
- (1)
- Through literature analysis and field research combined with the PEST theory, a total of 20 driving factors for carbon emission reduction through PBSCs were identified from the five dimensions of government, market, economy, technology, and supply chain coordination. A hypothetical model of carbon emission reduction through PBSCs was established, and a questionnaire was designed. Principal component analysis and reliability and validity testing were used to verify the rationality of the questionnaire and the collected data. Finally, the driving factors for carbon emission reduction through PBSCs were summarized.
- (2)
- Based on the research hypothesis, SEM of the carbon emission-reduction driving forces of PBSCs was established. The model passed the fitness test and verified that the five proposed hypotheses were all true. Through quantitative analysis of the path coefficients, it was concluded that the importances of the driving factors for carbon emission reduction through PBSCs is as follows: technology-driven > economic-driven > market-driven > government-driven > supply chain coordination-driven. The weight calculation of the direct indicators of driving factors found that standardized design level, low-carbon design of building structure, technology R&D capital investment, low-carbon construction costs, and government subsidy policy are the main driving factors for carbon emission reduction through PBSCs.
Theoretically, this paper enriches the research in the field of carbon emission reduction through PBSCs. This paper combines the characteristics of PBSCs with the perspective of carbon emission reduction, establishes a complete set of indicators of carbon emission-reduction drivers, identifies the key drivers, and analyzes the mechanistic role of each driver through scientific methods. In practice, by analyzing the key drivers that inform the low-carbon behavioral choices of the actors involved in PBSCs, it also provides a strategy for the participants PBSCs to choose a low-carbon production mode that promotes the green development of the construction industry.
In this paper, based on the questionnaire data, SEM was used to analyze the driving factors in PBSCs. Although the influence of subjective factors on the results was minimized as much as possible, the expressed causality relied on cross-sectional data. Therefore, other suitable methods can be selected for further research on this issue in the future.
Author Contributions
Conceptualization, W.L.; methodology, W.L. and G.F.; funding acquisition, W.L.; supervision, W.L.; validation, W.L. and G.F.; writing—original draft, G.F. and Z.L.; writing—review and editing, W.L. and G.F. All authors have read and agreed to the published version of the manuscript.
Funding
National Natural Science Foundation of China project (Project number: 72261012); Jiangxi University Humanities and Social Sciences Research Program (Project number: GL23123); Jiangxi Provincial Department of Education Science and Technology Research Project (Project number: GJJ2200648).
Institutional Review Board Statement
Not applicable.
Informed Consent Statement
Not applicable.
Data Availability Statement
The data presented in this study are available on request from the corresponding author.
Conflicts of Interest
The authors declare no conflicts of interest.
Appendix A
Questionnaire on the driving factors of carbon emission reduction in prefabricated building supply chains (PBSCs).
Dear experts:
First of all, thank you very much for taking time out of your busy schedule to participate in this survey. In an effort to systematically study the driving relationship and mechanism of carbon emission-reduction factors in the PBSCs, this paper has identified a total of 20 driving factors for carbon emission reduction in the prefabricated building supply chain. For quantify the importance of the driving factors, you are now invited to rate the following questions. Thank you for your support and cooperation! I wish you success in your work and good health!
Table A1.
Questionnaire form.
| Part 1 | ||||
| 1. What is your age? | A. 20–30 years old | B. 31–40 years old | C. 41–50 years old | D. over 50 years old |
| 2. What is your academic qualification? | A. Undergraduate | B. Bachelor | C. Master | D. PH.D. |
| 3. How many years have you been engaged in work (research) related to PBs? | A. 1–2 years | B. 3–4 years | C. 5–6 years | D. 7 years and above |
| 4. What is your workplace? | A. Government department | B. Manufacturer of PB-components | C. Universities | |
| D. Construction | E. Design institutes | F. Owner’s | G. Others | |
| Part 2 | ||||
| Importance rating scale | 1-extremely low; 2-very low; 3-low; 4-medium; 5-high; 6 very high; 7-extremely high | |||
| Government-Driven | ||||
| 1. How important do you think the government subsidy policy is to the carbon emission reduction of the PBSCs? | ||||
| 2. How important do you think the government carbon emission cap standards is to the carbon emission reduction of the PBSCs? | ||||
| 3. How important do you think the government supervision is to the carbon emission reduction of the PBSCs? | ||||
| Market-Driven | ||||
| 1. How important do you think the low-carbon awareness of enterprise is to the carbon emission reduction of the PBSCs? | ||||
| 2. How important do you think the low-carbon awareness of user is to the carbon emission reduction of the PBSCs? | ||||
| 3. How important do you think the low-carbon construction costs is to the carbon emission reduction of the PBSCs? | ||||
| 4. How important do you think the competition among enterprises is to the carbon emission reduction of the PBSCs? | ||||
| 5. How important do you think the prefabrication rate is to the carbon emission reduction of the PBSCs? | ||||
| Economic-Driven | ||||
| 1. How important do you think the regional economic development level is to the carbon emission reduction of the PBSCs? | ||||
| 2. How important do you think the technology R&D capital investment is to the carbon emission reduction of the PBSCs? | ||||
| 3. How important do you think the corporate capital flow is to the carbon emission reduction of the PBSCs? | ||||
| 4. How important do you think the clean energy usage funds is to the carbon emission reduction of the PBSCs? | ||||
| Technology-Driven | ||||
| 1. How important do you think the standardized design level is to the carbon emission reduction of the PBSCs? | ||||
| 2. How important do you think the low-carbon production technology is to the carbon emission reduction of the PBSCs? | ||||
| 3. How important do you think the level of recycling of building materials is to the carbon emission reduction of the PBSCs? | ||||
| 4. How important do you think the low-carbon construction technology is to the carbon emission reduction of the PBSCs? | ||||
| 5. How important do you think the low carbon design of building structure is to the carbon emission reduction of the PBSCs? | ||||
| Supply chain coordination-Driven | ||||
| 1. How important do you think the low-carbon leadership of core enterprises is to the carbon emission reduction of the PBSCs? | ||||
| 2. How important do you think the PBSCs enterprise information sharing is to the carbon emission reduction of the PBSCs? | ||||
| 3. How important do you think the enterprise logistics and transportation level is to the carbon emission reduction of the PBSCs? | ||||
| 1.What do you think are the direct carbon emission reduction benefits of the PBSCs? | ||||
| 2. What do you think are the indirect carbon emission reduction benefits of the PBSCs? | ||||
References
- Dai, D.; Wang, Y. Research on the coordination of government subsidies, carbon emission reduction and pricing in multi-cycle supply chains under the “dual carbon” goal. Comput. Integr. Manuf. Syst. 2023, 1, 22. [Google Scholar]
- Zheng, X.; Xu, X. Research on carbon emissions in the whole life cycle of prefabricated buildings based on LCA: A case study of a light steel prefabricated integrated villa in Chongqing. Constr. Econ. 2019, 40, 107–111. [Google Scholar]
- Cao, X.; Miao, C.; Pan, H. Comparative analysis and research on carbon emissions of prefabricated concrete and cast-in-place buildings based on carbon emission model. Build. Struct. 2021, 51 (Suppl. S2), 1233–1237. [Google Scholar]
- Li, J.; Liu, S. Research on carbon footprint evaluation of prefabricated concrete in the building stage. Constr. Econ. 2021, 42, 101–105. [Google Scholar]
- Li, M.; Chen, W.; Li, L. Research on carbon emission calculation and influencing factors in the stage of prefabricated buildings. J. Saf. Environ. 2023, 1, 10. [Google Scholar]
- Du, Q.; Pang, Q.; Bao, T. Critical factors influencing carbon emissions of prefabricated building supply chains in China. J. Clean. Prod. 2021, 280, 124398. [Google Scholar] [CrossRef]
- Li, D.; Wang, Y. The construction unit takes the initiative to adopt the driving and hindrance factors of prefabricated buildings. J. Civ. Eng. Manag. 2019, 36, 7–11. [Google Scholar]
- Sun, S.; Chen, Y.; Wang, A. An Evaluation Model of Carbon Emission Reduction Effect of Prefabricated Buildings Based on Cloud Model from the Perspective of Construction Supply Chain. Buildings 2022, 12, 1534. [Google Scholar] [CrossRef]
- Zhang, R.; Li, L. Research on Evolutionary Game and Simulation of Information Sharing in Prefabricated Building Supply Chain. Sustainability 2023, 15, 9885. [Google Scholar] [CrossRef]
- Zhang, C.; Zhang, W.; He, K. Research on the distribution of benefits in the green supply chain of prefabricated buildings. Constr. Econ. 2023, 44, 79–87. [Google Scholar] [CrossRef]
- Wang, X.; Du, Q.; Li, C. Exploration in carbon emission reduction effect of low-carbon practices in prefabricated building supply chain. J. Clean. Prod. 2022, 368, 133153. [Google Scholar] [CrossRef]
- Xiao, Z.; Zhang, S.; Feng, J. Evolutionary game of information sharing in prefabricated building supply chain based on blockchain technology. J. Civ. Eng. Manag. 2023, 40, 91–97. [Google Scholar]
- Gao, Y.; Li, Z.; Zhang, H. Carbon emission analysis of the whole process of prefabricated building construction based on LCA. J. Eng. Manag. 2018, 32, 30–34. [Google Scholar]
- Du, Q.; Yang, M.; Wang, Y. Dynamic simulation for carbon emission reduction effects of the prefabricated building supply chain under environmental policies. Sustain. Cities Soc. 2024, 100, 105027. [Google Scholar] [CrossRef]
- Wu, L.; Ye, K.; Makarand, H. A comparison study on environmental policies for expressway construction projects between China and the US: A tiered analysis approach. J. Environ. Manag. 2022, 305, 114298. [Google Scholar] [CrossRef] [PubMed]
- Liu, W.; Yu, S. Research on the driving mechanism and influencing path of green building development based on SEM. J. Civ. Eng. Manag. 2021, 38, 91–97. [Google Scholar]
- Dong, S.; Wang, L.; Huang, Y. Research on carbon emissions in the logistics and distribution process of prefabricated building prefabricated components. Logist. Sci-Tech 2023, 46, 17–21. [Google Scholar]
- Xie, W.; Li, X.; Yang, T. Research on carbon emission measurement in the construction stage of prefabricated buildings. J. Eng. Manag. 2022, 36, 52–57. [Google Scholar]
- Sun, Y.; Liu, J.; Xia, B. Research on carbon emission evaluation in the stage of prefabricated buildings. J. Shenyang Jianzhu Univ. (Nat. Sci.) 2018, 34, 881–888. [Google Scholar]
- Xu, K.; Kang, H.; Wang, W. Carbon Emission Estimation of Assembled Composite Concrete Beams during Construction. Energies 2021, 14, 1810. [Google Scholar] [CrossRef]
- Omar, W.; Doh, J.; Panuwatwanich, K. Assessment of the embodied carbon in precast concrete wall panels using a hybrid life cycle assessment approach in Malaysia. Sustain. Cities Soc. 2014, 10, 101–111. [Google Scholar] [CrossRef]
- Pons, O.; Wadel, G. Environmental impacts of prefabricated school buildings in Catalonia. Habitat Int. 2011, 35, 553–563. [Google Scholar] [CrossRef]
- Waltho, C.; Elhedhli, S.; Gzara, F. Green supply chain network design: A review focused on policy adoption and emission quantification. Int. J. Prod. Econ. 2019, 208, 305–318. [Google Scholar] [CrossRef]
- Ding, X.; Xu, X.; Wang, Q. Research on the influencing factors of carbon emission of prefabricated buildings based on DPSIR and improved TOPSIS model. J. Eng. Manag. 2022, 36, 47–51. [Google Scholar]
- Liu, Z.; Zhang, Y.; Ouyang, H. Sustainability evaluation of prefabricated building supply chain based on cloud-matter-element theory. J. Civ. Eng. Manag. 2020, 37, 109–115. [Google Scholar]
- Gao, D.; Zhang, Y.; Ouyang, H. Sustainable development analysis of prefabricated buildings from the perspective of supply chain management. J. Eng. Manag. 2019, 33, 15–20. [Google Scholar]
- Khan, M.; Hussain, M.; Saber, M. Information sharing in a sustainable supply chain. Int. J. Prod. Econ. 2016, 181, 208–214. [Google Scholar] [CrossRef]
- Zhang, L.; Wei, W.; Chen, L. Evaluation of Hidden Cost Risk of Prefabricated Construction Based on SEM-MEECM. Appl. Sci. 2023, 13, 7902. [Google Scholar] [CrossRef]
- Zhang, J.; Wei, W.; Chen, K. Research on the evaluation of implicit cost control level of prefabricated buildings based on SEM-MEA. Build. Sci. 2023, 39, 202–210. [Google Scholar]
- Chen, W.; Wu, Y.; Zhou, S. Analysis of influencing factors of prefabricated building construction cost based on SEM. J. Civ. Eng. Manag. 2019, 36, 50–55. [Google Scholar]
- Ding, X.; Xu, X.; Wang, Q. Research on the influencing factors of carbon emission reduction of prefabricated building prefabricated components based on SEM. Build. Energy Effic. 2023, 51, 123–128. [Google Scholar]
- Dai, H.; Qin, Y. Delphi-ISM-MICMAC based correlation study of constraints on the promotion of prefabricated concrete buildings. J. Beijing Univ. Archit. 2020, 36, 85–94. [Google Scholar]
- Sun, H.; Fang, Y.; Yin, M. Research on the Restrictive Factors of Vigorous Promotion of Prefabricated Buildings in Yancheng under the Background of “Double Carbon”. Sustainability 2023, 15, 1737. [Google Scholar] [CrossRef]
- Grace, B.; Schoolmaster, D.R., Jr.; Guntenspergen, G.R.; Little, A.M.; Mitchell, B.R.; Miller, K.M.; Schweiger, E.W. Guidelines for a graph-theoretic implementation of structural equation modeling. Synth. Integr. 2012, 3, 1–44. [Google Scholar] [CrossRef]
- Wang, Q.; Pan, M.; Guo, X. Research on the formation mechanism of green railroad construction capacity based on structural equation modeling. J. Railw. Sci. Eng. 2024, 21, 1–9. [Google Scholar] [CrossRef]
- Wu, M. Structural Equation Modeling-AMOS Operations and Applications, 1st ed.; Chongqing University Publishing House: Chongqing, China, 2013; pp. 1–45. [Google Scholar]
- Jiang, L.; Tang, J.; Rao, W. The impact of reward and punishment mechanism on carbon emission reduction and recycling price in reverse supply chain from the perspective of carbon neutrality. J. Ind. Eng. Eng. Manag. 2024, 2, 1–18. [Google Scholar]
- Karlsson, I.; Rootzén, J.; Johnsson, F. Reaching net-zero carbon emissions in construction supply chains -Analysis of a Swedish road construction project. Renew. Sustain. Energy Rev. 2020, 120, 109651. [Google Scholar] [CrossRef]
- Zhang, L.; Yang, W.; Yuan, Y. An Integrated Carbon Policy-Based Interactive Strategy for Carbon Reduction and Economic Development in a Construction Material Supply Chain. Sustainability 2017, 9, 2107. [Google Scholar] [CrossRef]
- An, H.; Kuang, Y.; Yang, W. Analysis of the motivation of prefabricated building supply chain integration based on SEM. J. Civ. Eng. Manag. 2020, 37, 50–56. [Google Scholar]
- Liu, J.; Liu, X.; Li, Z. Research on the influencing factors of carbon emission in the stage of modular integration of buildings from the perspective of stakeholders. J. Saf. Environ. 2023, 1–12. [Google Scholar] [CrossRef]
- Zhao, Y.; Sun, S.; Liu, L. Research on the driving factors and paths of carbon emission reduction of prefabricated buildings. Constr. Econ. 2022, 40, 90–95. [Google Scholar]
- Luthra, S.; Garg, D.; Haleem, A. The impacts of critical success factors for implementing green supply chain management towards sustainability: An empirical investigation of Indian automobile industry. J. Clean. Prod. 2016, 121, 146–158. [Google Scholar] [CrossRef]
- Guo, F.; Zhang, Y.; Chang, Y. Carbon Emissions of Assembly Buildings Constrained by Flexible Resource: A Study on Cost Optimization. Buildings 2022, 13, 90. [Google Scholar] [CrossRef]
- Pan, Y.; Wu, S. Research on the Mechanism of Improving the Landing Effect of Assembly Building Based on System Dynamics--Taking Jiangsu Province as an Example. Constr. Econ. 2020, 40. [Google Scholar] [CrossRef]
- Zhu, R.; Li, L. SEM-Based Analysis of Carbon Emission Reduction Pathway Study during the Materialization Stage of Prefabricated Buildings: Evidence from Shenyang and Guiyang, China. J. Environ. Public Health 2022, 2022, 9721446. [Google Scholar] [CrossRef] [PubMed]
- Qin, J.; Han, Y.; Wei, G. The value of advance payment financing to carbon emission reduction and production in a supply chain with game theory analysis. Int. J. Prod. Res. 2020, 558, 2200–2219. [Google Scholar] [CrossRef]
- Sun, H.; Liu, Q.; Li, Y. Factors Influencing Carbon Emissions of Assembled Building Construction Enterprises. J. Sustain. Dev. Green Build. 2023, 1, 1–7. [Google Scholar]
- Chen, H.; Zhou, Y.; Feng, W. Factors That Influence the Quantification of the Embodied Carbon Emission of Prefabricated Buildings: A Systematic Review, Meta-Analysis and the Way Forward. Buildings 2022, 12, 1265. [Google Scholar] [CrossRef]
- Sun, S.; Chen, Y.; Ma, L. Analysis of the contribution factors of prefabricated buildings based on the theory of carbon neutrality. Concrete 2022, 11, 133–137. [Google Scholar]
- Zhao, Y.; Sun, Q.; Wei, W. Research on the impact of building structure design on carbon emissions. Build. Struct. 2023, 53, 19–23. [Google Scholar]
- Mei, T.; Qin, Y.; Li, P. Influence Mechanism of Construction Supply Chain Information Collaboration Based on Structural Equation Model. Sustainability 2023, 15, 2155. [Google Scholar] [CrossRef]
- Sun, Y.; Hao, S.; Long, X. A study on the measurement and influencing factors of carbon emissions in China’s construction sector. Build. Environ. 2023, 229, 109912. [Google Scholar] [CrossRef]
- Li, W.; Zhang, T.; Liu, M. Simulation of prefabricated building industry policy and evaluation of energy conservation and emission reduction benefits based on system dynamics. Ind. Constr. 2022, 52, 196–205. [Google Scholar]
- Chen, T.; Ling, W.; Wang, L. Research on low-carbon behavior decision-making of chemical enterprises based on carbon trading and green credit. Chin. J. Manag. Sci. 2023, 1–14. [Google Scholar] [CrossRef]
- Sun, J.; Lu, Y.; Teng, C. Research on the impact of blockchain technology on low-carbon supply chain cooperation strategy. Chin. J. Manag. Sci. 2023, 1–15. [Google Scholar] [CrossRef]
- Wu, Z.; Huang, H.; Chen, X. Research on the low-carbon transformation countermeasures of the construction industry under the “dual carbon” goal. Strateg. Study CAE 2023, 25, 202–209. [Google Scholar] [CrossRef]
- Dai, D.; Wang, Y. Research on the coordinated decision-making of carbon emission reduction in multi-cycle supply chain under the “dual carbon” goal. J. Chongqing Technol. Bus. Univ. (Nat. Sci. Ed.) 2023, 40, 1–8. [Google Scholar]
- Brown, J. Likert items and scales of measurement. Statistics 2011, 15, 10–14. [Google Scholar]
- Lefcheck, S. Piecewise SEM: Piecewise structural equation modelling in r for ecology, evolution, and systematics. Methods Ecol. Evol. 2016, 7, 573–579. [Google Scholar] [CrossRef]
- Yang, X.; Peng, D.; Xie, F. Research on the Impact of Perceived Risk Perception on User Trust and Behavior Based on TAM/TPB: A Case Study of Yu’e Bao, a Payment Value-added Product. Manag. Rev. 2016, 28, 21–27. [Google Scholar]
- Li, J.; Liu, Y. Calculation model of carbon emissions of construction projects based on the whole life cycle. J. Eng. Manag. 2015, 29, 12–16. [Google Scholar]
- Wu, L.; Li, S.; Liao, C. Analysis and research of carbon emissions in the whole process of prefabricated building construction. Constr. Technol. 2023, 52, 81–86. [Google Scholar]
- Wang, Y.; Zhao, J.; Gao, N. Application of intelligent construction technology in EPC mode of prefabricated buildings and research on carbon emissions. Concrete 2023, 1–8. Available online: https://kns.cnki.net/kcms2/article/abstract?v=ttOPOQ75YvLjuyGwSxxsubJ-zc1-MhzEq7lwiwt9GM6XX7YYK6t8sT5JCF89JYSwRi0R5hcBbQuQPNvBCemrILEj4RYqgqU9Ac2HBzWoZkoMBeki5cBSCrL2ieZtbO3exJtLiUgGCYk=&%20uniplatform=NZKPT (accessed on 10 December 2023).
- Saeed, H.; Aame, M.; Rehan, M. A multi-facet BIM based approach for Green Building design of new multi-family residential building using LEED system. Int. J. Constr. Manag. 2023, 23, 2024–2038. [Google Scholar]
- Yang, H.; Liu, Y.; Wang, Y. Analysis of the sustainable development direction of prefabricated buildings based on lean construction. Constr. Econ. 2023, 44, 89–96. [Google Scholar]
- Yazeed, A.; Krishanu, R.; Liang, H. Thermal performance of different construction materials used in New Zealand dwellings comparatively to international practice—A systematic literature review. J. Build. Eng. 2023, 72, 106346. [Google Scholar]
- Fang, L.; Tang, H. The Effect of Carbon Emission Trading on Corporate Carbon Emission Reduction: A Quasi-Natural Reality Based on the Data of Chinese Listed Companies. J. Shaanxi Norm. Univ. (Philos. Soc. Sci. Ed.) 2022, 51, 14–29. [Google Scholar]
- An, M.; Liu, M.; Wu, H. Research on the carbon emission reduction effect of prefabricated building demonstration city policy on the construction industry and its mechanism. Acta Sci. Circumstantiae 2024, 44, 1–13. [Google Scholar]
- Qi, B.; Zhu, Y.; Ma, B. Research on the comprehensive benefit analysis method of prefabricated buildings. Constr. Technol. 2016, 45, 39–43. [Google Scholar]
Figure 1.
Prefabricated building supply chains (PBSCs).
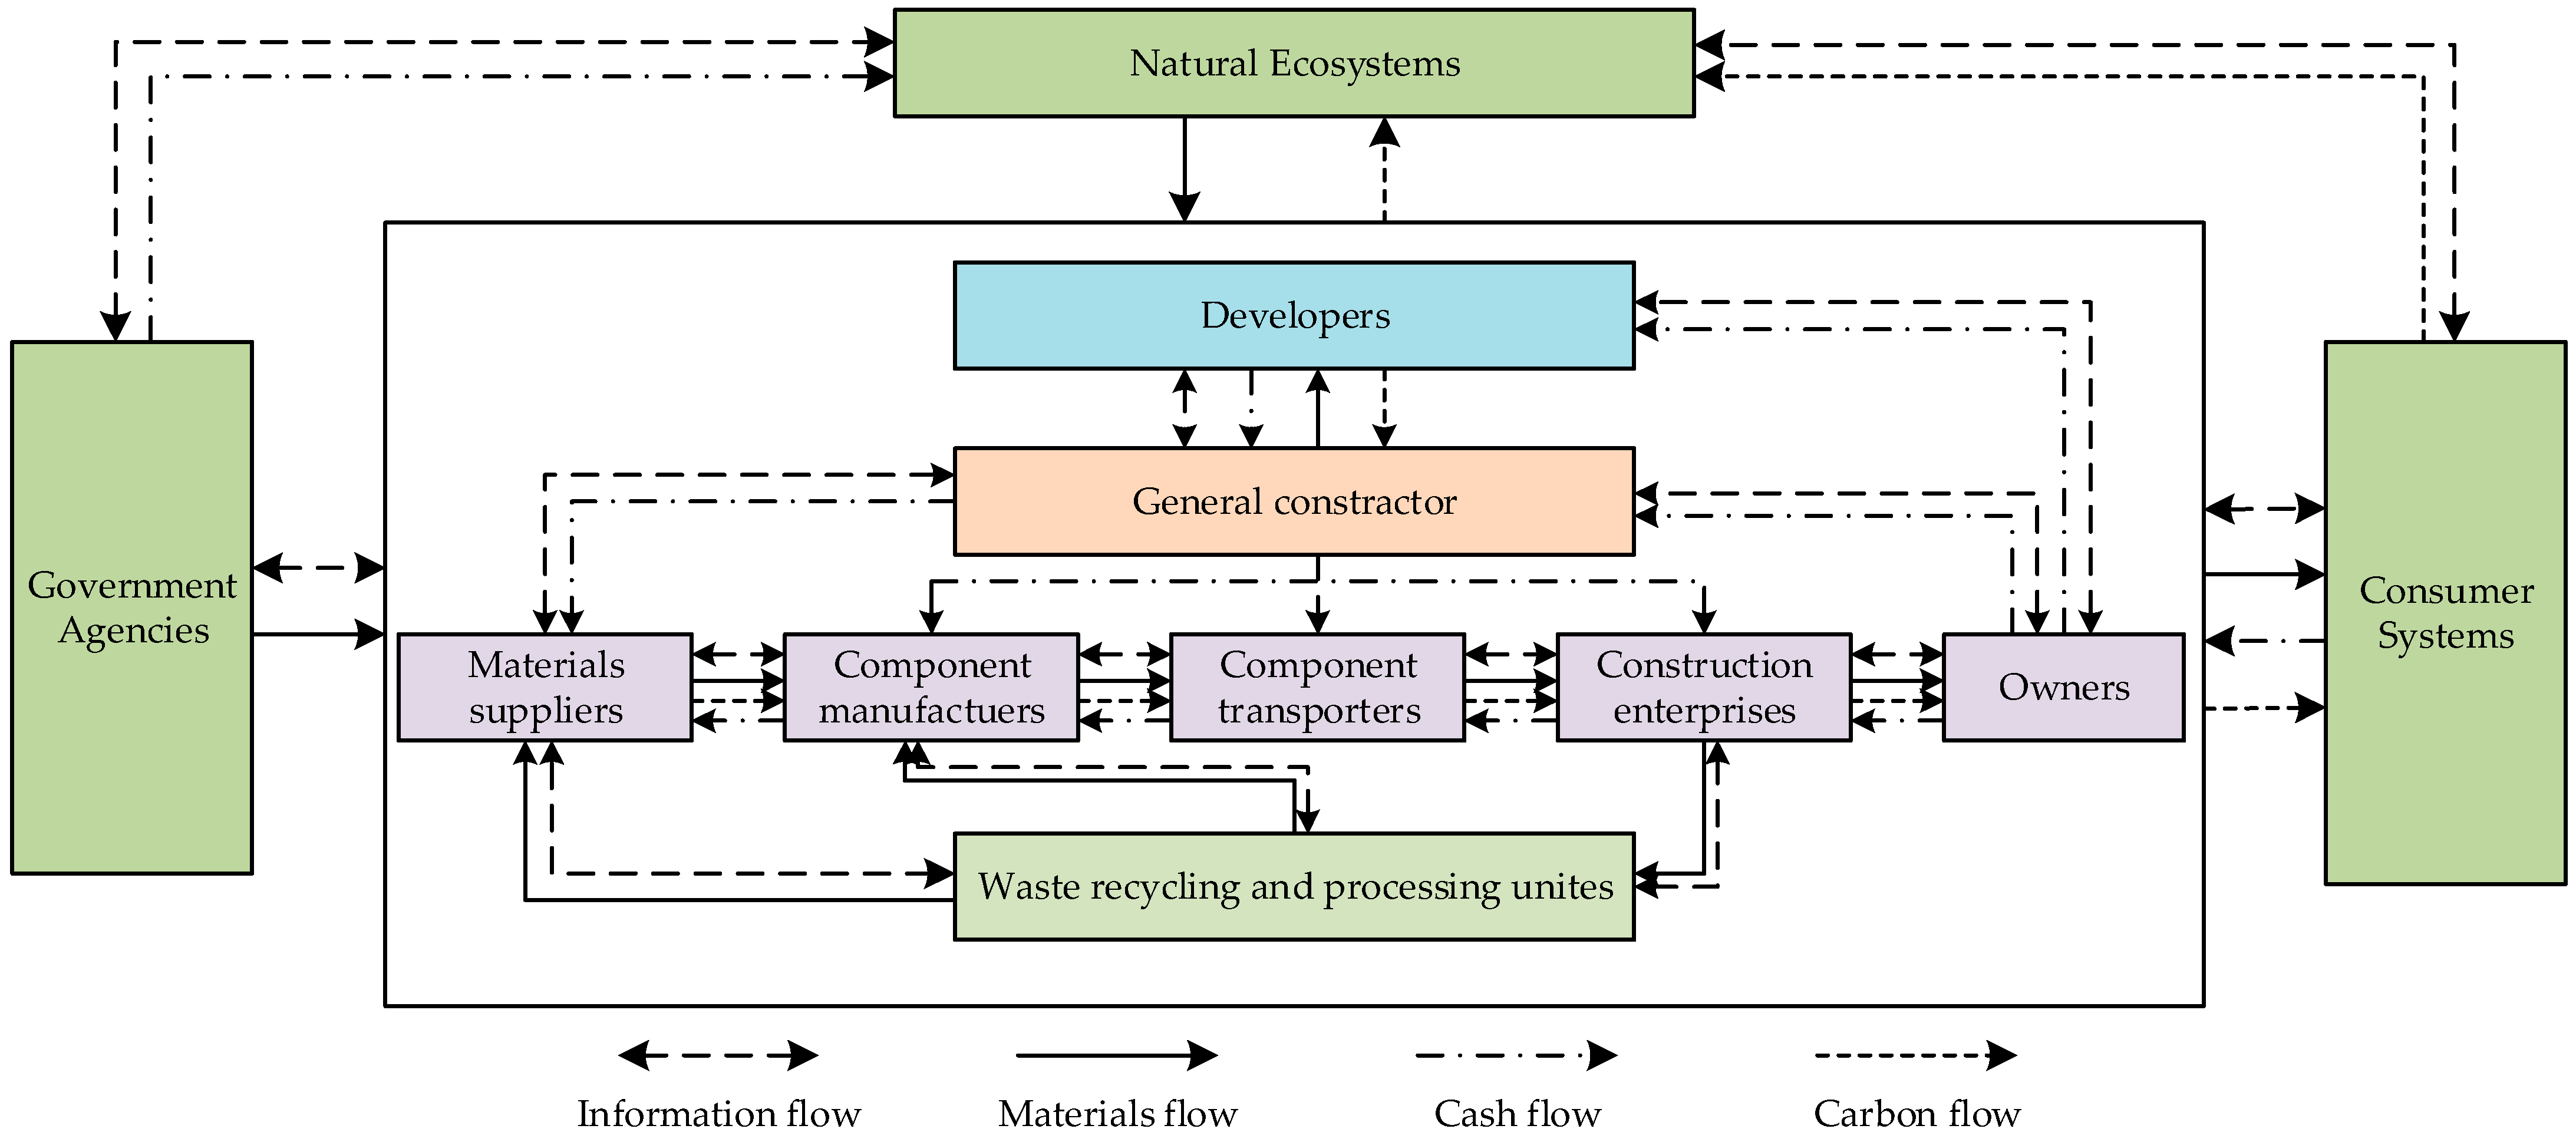
Figure 2.
SEM application process.

Figure 3.
Hypothetical model of driving factors for carbon emission reduction in PBSCs.

Figure 4.
Educational background of the interviewees.

Figure 5.
Number of years the interviewees have been engaged in PBs.

Figure 6.
Work department of the interviewees.

Figure 7.
Structural equation model of driving factors for carbon emission reduction in PBSCs.

Table 2.
KMO and Bartlett’s test of sphericity.
| KMO Sampling Suitability Quantity | 0.751 | |
| Bartlett’s test of sphericity | Approximate chi-square | 3221.699 |
| degrees of freedom | 231 | |
| Significance | 0.000 | |
Table 3.
Total variance.
| No. | Initial Eigenvalue | Extraction Sums of Squared Loadings | Rotation Sums of Squared Loadings | ||||||
|---|---|---|---|---|---|---|---|---|---|
| Total | Percentage Variance/% | Sum/% | Total | Percentage Variance/% | Sum/% | Total | Percentage Variance/% | Sum/% | |
| 1 | 3.678 | 16.717 | 16.717 | 3.678 | 16.717 | 16.717 | 3.497 | 15.895 | 15.895 |
| 2 | 3.218 | 14.627 | 31.344 | 3.218 | 14.627 | 31.344 | 3.209 | 14.587 | 30.481 |
| 3 | 3.079 | 13.994 | 45.338 | 3.079 | 13.994 | 45.338 | 3.080 | 14.000 | 44.482 |
| 4 | 2.298 | 10.446 | 55.784 | 2.298 | 10.446 | 55.784 | 2.398 | 10.901 | 55.383 |
| 5 | 2.251 | 10.234 | 66.018 | 2.251 | 10.234 | 66.018 | 2.283 | 10.376 | 65.759 |
| 6 | 1.581 | 7.188 | 73.206 | 1.581 | 7.188 | 73.206 | 1.638 | 7.447 | 73.206 |
| 7 | 0.704 | 3.198 | 76.404 | ||||||
| …… | |||||||||
Table 4.
Reliability test results.
| Latent Variable | Item | Factor Loadings | CR | AVE | Cronbach’s Alpha |
|---|---|---|---|---|---|
| GD | GD1 | 0.718 | 0.898 | 0.7485 | 0.828 |
| GD2 | 0.936 | ||||
| GD3 | 0.924 | ||||
| MD | MD1 | 0.806 | 0.8969 | 0.6352 | 0.856 |
| MD2 | 0.831 | ||||
| MD3 | 0.812 | ||||
| MD4 | 0.763 | ||||
| MD5 | 0.771 | ||||
| ED | ED1 | 0.886 | 0.9291 | 0.7661 | 0.898 |
| ED2 | 0.876 | ||||
| ED3 | 0.868 | ||||
| ED4 | 0.871 | ||||
| TD | TD1 | 0.830 | 0.918 | 0.6915 | 0.890 |
| TD2 | 0.814 | ||||
| TD3 | 0.817 | ||||
| TD4 | 0.837 | ||||
| TD5 | 0.859 | ||||
| SCCD | SCCD1 | 0.868 | 0.9134 | 0.7786 | 0.865 |
| SCCD2 | 0.888 | ||||
| SCCD3 | 0.891 | ||||
| CEPBSCs | DCE | 0.885 | 0.884 | 0.7921 | 0.759 |
| ICE | 0.895 |
Table 5.
Validity test results.
| AVE | GD | MD | ED | TD | SCCD | CEPBSCs | |
|---|---|---|---|---|---|---|---|
| GD | 0.7485 | 0.865 | |||||
| MD | 0.6352 | 0.570 | 0.797 | ||||
| ED | 0.7661 | 0.492 | 0.480 | 0.875 | |||
| TD | 0.6915 | 0.577 | 0.525 | 0.504 | 0.832 | ||
| SCCD | 0.7786 | 0.478 | 0.496 | 0.502 | 0.439 | 0.882 | |
| CEPBSCs | 0.7921 | 0.594 | 0.578 | 0.554 | 0.568 | 0.592 | 0.890 |
Note: The words in bold are the internal correlation coefficients, which are equal to the arithmetic square root of AVE.
Table 6.
Fitness test results.
| Index | Absolute Fitness | Value-Added Fitness | Simple Fitness | |||||
|---|---|---|---|---|---|---|---|---|
| χ2/d.f. | GFI | RMSEA | NFI | IFI | CFI | PGFI | PNFI | |
| Recommendations | <3.000 | >0.900 | <0.100 | >0.900 | >0.900 | >0.900 | >0.500 | >0.500 |
| Initial model | 2.460 | 0.840 | 0.073 | 0.849 | 0.832 | 0.870 | 0.754 | 0.783 |
| Judgment of fitness | Yes | No | Yes | No | No | No | Yes | Yes |
| Modified model | 1.584 | 0.910 | 0.063 | 0.905 | 0.942 | 0.942 | 0.760 | 0.787 |
| Judgment of fitness | Yes | Yes | Yes | Yes | Yes | Yes | Yes | Yes |
Table 7.
Model hypothesis testing and path coefficients.
| Hypotheses | Relationship | Standardized Factor Loadings | p-Value | Support |
|---|---|---|---|---|
| H1 | GD→CEPBSCs | 0.337 | *** | yes |
| H2 | MD→CEPBSCs | 0.413 | 0.004 | yes |
| H3 | ED→CEPBSCs | 0.452 | 0.007 | yes |
| H4 | TD→CEPBSCs | 0.488 | *** | yes |
| H5 | SCCD→CEPBSCs | 0.297 | 0.023 | yes |
Note: (*** indicates p-value < 0.001).
Table 8.
Indicator weight of carbon emission-reduction driving factors in PBSCs.
| Latent Variable | First-Level Weight | Sort | Item | Second-Level Weight | Sort |
|---|---|---|---|---|---|
| GD | 0.171 | 4 | GD1 | 0.387 | 1 |
| GD2 | 0.287 | 3 | |||
| GD3 | 0.326 | 2 | |||
| MD | 0.206 | 3 | MD1 | 0.192 | 4 |
| MD2 | 0.212 | 2 | |||
| MD3 | 0.217 | 1 | |||
| MD4 | 0.176 | 5 | |||
| MD5 | 0.202 | 3 | |||
| ED | 0.226 | 2 | ED1 | 0.232 | 4 |
| ED2 | 0.281 | 1 | |||
| ED3 | 0.225 | 3 | |||
| ED4 | 0.261 | 2 | |||
| TD | 0.246 | 1 | TD1 | 0.209 | 1 |
| TD2 | 0.195 | 4 | |||
| TD3 | 0.202 | 3 | |||
| TD4 | 0.188 | 5 | |||
| TD5 | 0.205 | 2 | |||
| SCCD | 0.151 | 5 | SCCD1 | 0.354 | 1 |
| SCCD2 | 0.309 | 3 | |||
| SCCD3 | 0.336 | 2 |
Disclaimer/Publisher’s Note: The statements, opinions and data contained in all publications are solely those of the individual author(s) and contributor(s) and not of MDPI and/or the editor(s). MDPI and/or the editor(s) disclaim responsibility for any injury to people or property resulting from any ideas, methods, instructions or products referred to in the content. |
© 2024 by the authors. Licensee MDPI, Basel, Switzerland. This article is an open access article distributed under the terms and conditions of the Creative Commons Attribution (CC BY) license (https://creativecommons.org/licenses/by/4.0/).
Share and Cite
MDPI and ACS Style
Liu, W.; Fan, G.; Liu, Z. Driving Factors in Carbon Emission Reduction in Prefabricated Building Supply Chains Based on Structural Equation Modelling. Sustainability 2024, 16, 3150. https://doi.org/10.3390/su16083150
AMA Style
Liu W, Fan G, Liu Z. Driving Factors in Carbon Emission Reduction in Prefabricated Building Supply Chains Based on Structural Equation Modelling. Sustainability. 2024; 16(8):3150. https://doi.org/10.3390/su16083150
Chicago/Turabian StyleLiu, Wei, Guohao Fan, and Zixuan Liu. 2024. "Driving Factors in Carbon Emission Reduction in Prefabricated Building Supply Chains Based on Structural Equation Modelling" Sustainability 16, no. 8: 3150. https://doi.org/10.3390/su16083150
Note that from the first issue of 2016, this journal uses article numbers instead of page numbers. See further details here.