Article

Study on Dynamic Damage of Crash Barrier under Impact Load of High-Speed Train

1
China Academy of Railway Sciences, Beijing 100081, China
2
School of Civil Engineering, Southwest Jiaotong University, Chengdu 610031, China
3
Sichuan Highway Planning Survey Design Institute Co., Ltd., Chengdu 610041, China
4
Sichuan West Rail Disaster Prevention Technology Co., Ltd., Chengdu 610094, China
*
Author to whom correspondence should be addressed.
Sustainability 2024, 16(8), 3147; https://doi.org/10.3390/su16083147
Submission received: 26 January 2024 / Revised: 3 March 2024 / Accepted: 5 March 2024 / Published: 10 April 2024

Abstract

:
The derailment of a high-speed train in a tunnel will cause a very serious accident, but there are few research articles on anti-collision facilities in tunnels. In order to promote the sustainable development of high-speed trains and reduce the severity of accidents caused by derailment in tunnels of high-speed trains, this paper puts forward a crash barrier scheme in tunnels through the method of numerical simulation; the coupling finite element model of train–crash barrier–tunnel is established by using ABAQUS. The changes in lateral velocity and lateral displacement after the train hits the crash barrier without embedding steel bars are explored. We also explore the influence of different reinforcement amounts on the changes in the lateral speed and lateral displacement of trains under the condition of embedding steel bars. The results show that with the increase in stirrups and vertical reinforcement, the anti-impact and sustainable operation capability of the crash barrier are greater. It can also be seen from the lateral displacement of the train that the train shows the reverse movement trend, and the crash barrier plays a good role in intercepting the train. These research results can provide a reference for the sustainable development of transportation infrastructure construction.

1. Introduction

In recent years, a large number of disasters have affected the safety of road engineering [1,2,3,4,5,6,7], among which railway engineering is one of the most seriously damaged objects. Train derailments not only cause a large number of casualties but also cause significant damage to railway infrastructure, especially when they occur in tunnels, where derailed trains run off the track into tunnel structures or even into other lines, causing secondary disasters, which pose a serious threat to the sustainable use of trains and tunnels. Therefore, anti-collision facilities such as crash barriers set in the tunnel can prevent more disasters after a train derails and ensure the safety of the train and personnel.
Research on the prevention of a train collision after derailment mainly focuses on two aspects. On the one hand, it studies the process of train collision by means of simulation; on the other hand, it studies the derailment behavior itself. In the aspect of train collision, Li et al. [8] found that the time to achieve collision avoidance is constrained by the timing of events, such as wireless communication latency, driver reaction, safety protection distance, and deceleration rate. Xie et al. [9] used HyperMesh software to establish the finite element model of the first three carriages and tracks of a train to evaluate the crashworthiness of a subway train. The energy absorption research of an anti-climbing energy absorption device under static compression and the collision analysis of the whole train are carried out. The contribution of the proposed energy-absorbing structure (coupler and draft gear at the end of cab, each part) to the overall energy absorption in a train collision is calculated. Baykasoğlu [10] and others put forward a crashworthiness evaluation and modification suggestions for train carriages. In order to evaluate crashworthiness, the finite element (FE) method is used to simulate the collision between a train carriage and a rigid wall. Singhal et al. [11] focus on the artificial intelligence-empowered road vehicle–train collision risk prediction assessment regarding the evaluation of rail–road collision risk by the development of a road vehicle–train collision frequency and severity prediction model using Poisson and gamma-log regression techniques, respectively. Xia et al. [12] analyzed the dynamic responses of the bridge and running safety indices of a train on a bridge under three types of collision loads and found that, largely, the responses of the bridge induced by collision strongly threaten the running safety of trains. Li et al. [13] found that collision causes a significant increase in the train’s lateral acceleration, lateral wheelset force, wheel unloading rate, and derailment coefficient by a finite element model. The effect of a collision on a train’s vertical acceleration is much smaller. Yu et al. [14] presented the scaled similitude rule for train collision, which follows the principle of acceleration consistency.
In terms of the aspect of train derailment, Hung et al. [15] proposed a technology to detect the early signs of train derailment. A numerical analysis was conducted using a scaled vehicle model to simulate wheelclimb derailment at low speeds. The scale model of railway vehicles was designed and made. On the basis of a numerical analysis and scale derailment test, a pre-detection algorithm for derailment signs was proposed and verified. Liu et al. [16] classified the track type, derailment speed, and accident cause. This paper analyzes the train derailment data of each track type from 2001 to 2010 in the FRA railway equipment accident database and considers occurrence frequency according to the reasons for and number of derailed trains. Statistical analysis was carried out to check the influence of accident cause, track type, and derailment speed. Reznikov D O [17] proposed a multilevel model for assessing the risk of train derailment. Emmanuel Nii et al. [18] employed a vine copula quantile regression model, an interval estimation approach, to predict the conditional mean and quantiles of derailment severity outcomes. Ulf Friesen et al. [19] tested a new electronic derailment detector for slab tracks that has no or only a minimal number of sleepers. The new model-based validation process will focus on a detection algorithm that can be used for all vehicle types. Sakdirat Kaewunruen et al. [20] focus predominantly on the structural response and performance evaluation of composite rail track slabs through 3D finite element analysis using ABAQUS2020. The response and performance of a composite track slab subjected to derailment actions have been observed. M. Tanabe et al. [21] constructed a computational model to solve the dynamic interaction of a high-speed train and railway structure, including derailment, during an earthquake. Nico Burgelman et al. [22] put forward a method to quickly estimate the derailment risk of braking trains in bends and turnouts by quantifying the lateral force between wheels and rails. Costa Mariana A et al. [23] combined wavelet analysis with vehicle dynamics simulations to evaluate how track irregularities, filtered in various wavelength ranges and reconstructed with different wavelets and coefficient amplitudes, impact vehicle safety in terms of the Nadal safety criterion Y/Q. KAMOSHITA Shogo et al. [24] developed a bogie for reducing the risk of derailment. Chellaswamy C et al. [25] describe an easy way to monitor railway track abnormalities and update information on the track’s status to the cloud.
For the study of anti-collision facilities after train derailment, Yan Qixiang et al. [26] studied the impact load of high-speed trains with a speed of 200 km/h and analyzed the protective effect of the secondary lining of a shield tunnel on segment lining. Xiang Jun et al. [27] obtained a calculation formula of the force on the collision wall by numerical simulation of the whole process of the derailment of high-speed trains on ballastless track bridges of high-speed railways. Wu Biao et al. [28] checked the transverse anti-collision strength of the flange plate of a reinforced concrete wall guardrail of a large bridge. Gao Guangjun et al. [29] proposed an elastic–plastic guardrail design for high-speed railway bridges, which is composed of columns, energy-absorbing blocks, and beams. The above research mainly focuses on the response of the train itself after collision and the anti-collision design, and the related research on anti-collision measures is very limited and mainly focuses on the bridge structure.
At present, research on anti-collision measures for train derailment primarily focuses on bridge anti-collision walls, but there is a lack of research on crash barriers within tunnels. The contact and stress involved in train collisions are highly complex, and current research findings are insufficient to address the requirements of disaster mitigation initiatives and sustainable development in railway tunnels. Therefore, it is urgent to conduct systematic research on the mechanisms causing disasters, impact parameters, and the effectiveness of anti-collision facilities for trains derailing in tunnels. In order to accurately depict the train derailment and collision with the crash barrier, it is essential to develop a nonlinear contact coupling model between the train and the crash barrier. This model should investigate the mechanical behavior of the crash barrier under the impact load caused by a train derailment, analyze the dynamic response of the train, and provide insights for the design, structural optimization, and sustainable construction of crash barriers in tunnels.
In this paper, an anti-collision system installed inside a tunnel is proposed. A coupled finite element model of a train–crash barrier–tunnel embedded with steel bars is developed to investigate the variations in lateral speed and lateral displacement when the train collides with the crash barrier without embedded steel bars. The study also examines the impact of different levels of reinforcement on the changes in lateral speed and lateral displacement of the train when reinforcement is embedded. Since the paper focuses on the impact resistance of the crash barrier, the wheel–rail dynamic response under the complex derailment mechanism is not considered. Therefore, the factors related to the wheel–rail relationship are ignored, and the wheel–rail modeling is omitted in the finite element model to enhance computational efficiency.

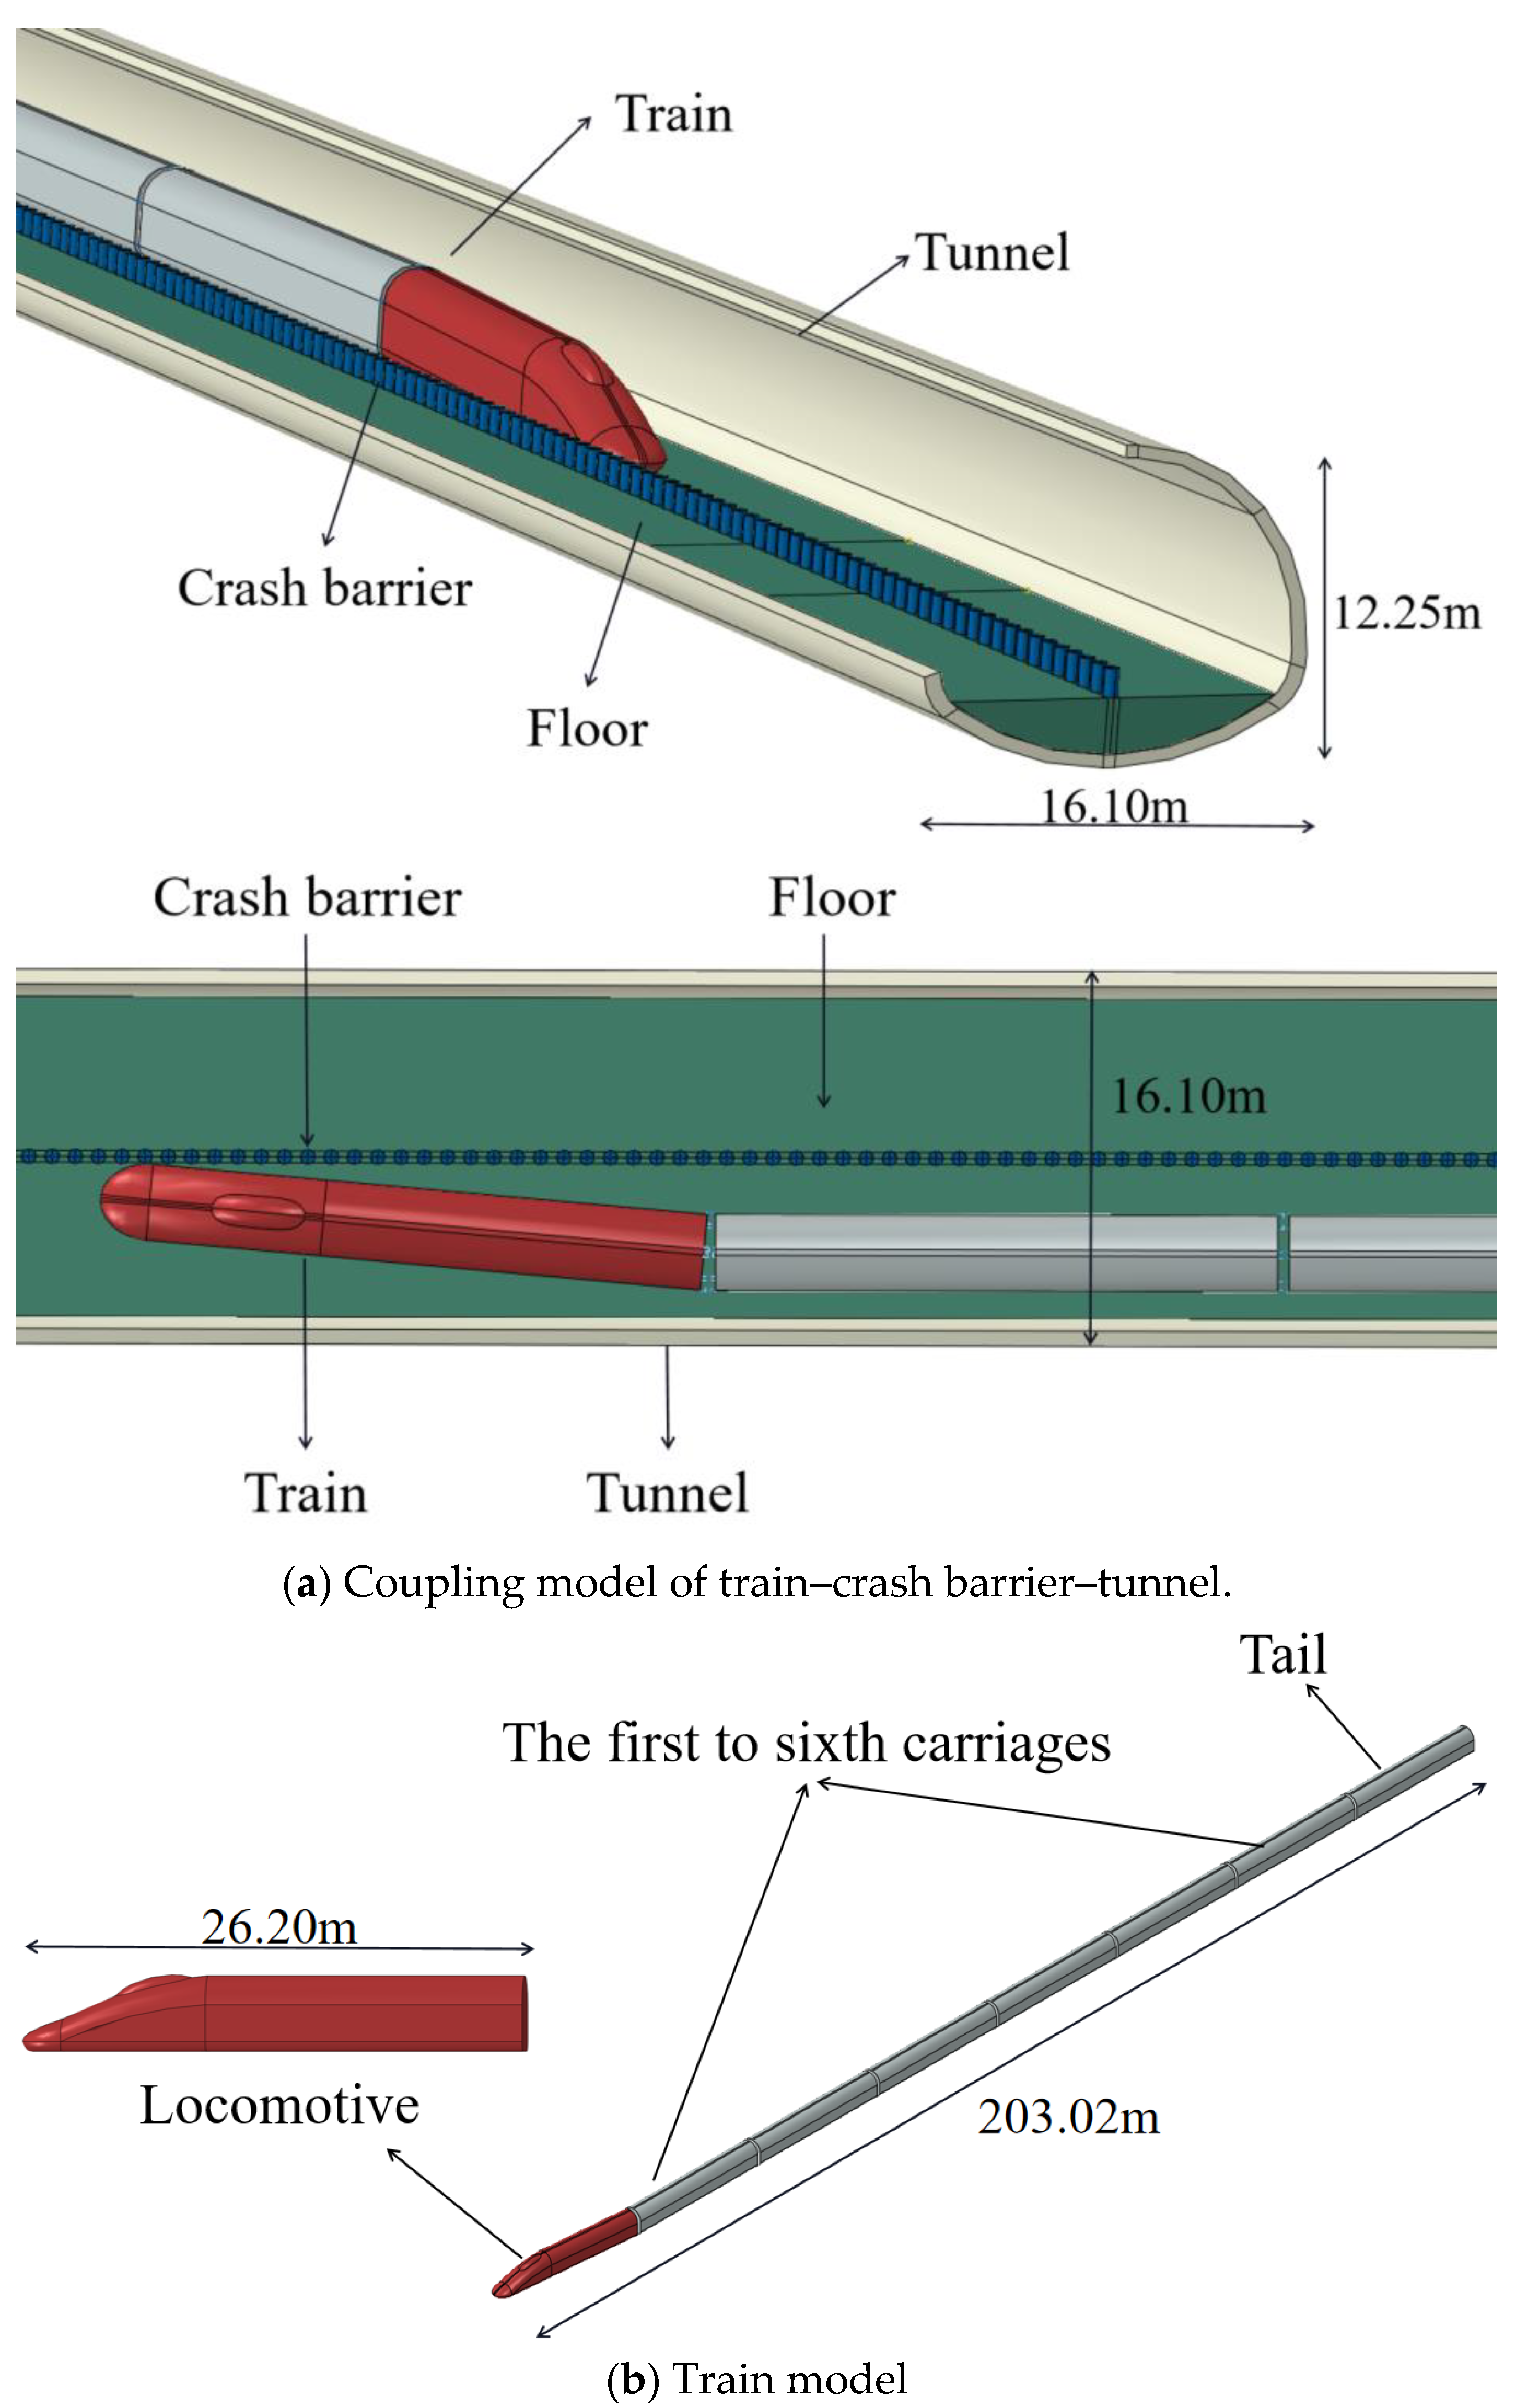
2. Dynamic Contact Model between Train and Crash Barrier

The entire model is divided into the train, crash barrier, surrounding rock, and tunnel lining structure. Among these components, the train and crash barrier structures are the most crucial as they directly participate in the impact process and significantly influence the trajectory of the train after impact. However, an overly accurate model can significantly reduce calculation efficiency, hindering the achievement of satisfactory results. The focus of this study is not on the reasons for train derailment. Therefore, the model should be appropriately simplified in the calculation.

2.1. Train Model Establishment

The dynamic contact model of a train–crash barrier is established using ABAQUS2020. In order to establish an accurate impact model and enhance calculation efficiency, the streamlined front end is simplified based on the prototype size of the train to improve convergence.
Figure 1 shows the dynamic contact analysis model of a train–crash barrier. The total length of the locomotive is 26.20 m, with a streamlined area of 4.78 m. The carriage measures 24.76 m, and there is a 0.5 m interval between carriages. Springs are used to simulate the connection between carriages. The mechanical parameters of the spring refer to the mechanical properties of couplers and buffer devices commonly used in China to achieve a spring stiffness of 2000 kN/m and a spring damping coefficient of 40 kN/m [30]. Assuming that the derailment scenario involves the locomotive, eight standard carriages are chosen to be involved in the collision process. The streamlined part of the locomotive is made of FRP, and the rest is made of aluminum alloy. The mechanical parameters of train materials are shown in Table 1.

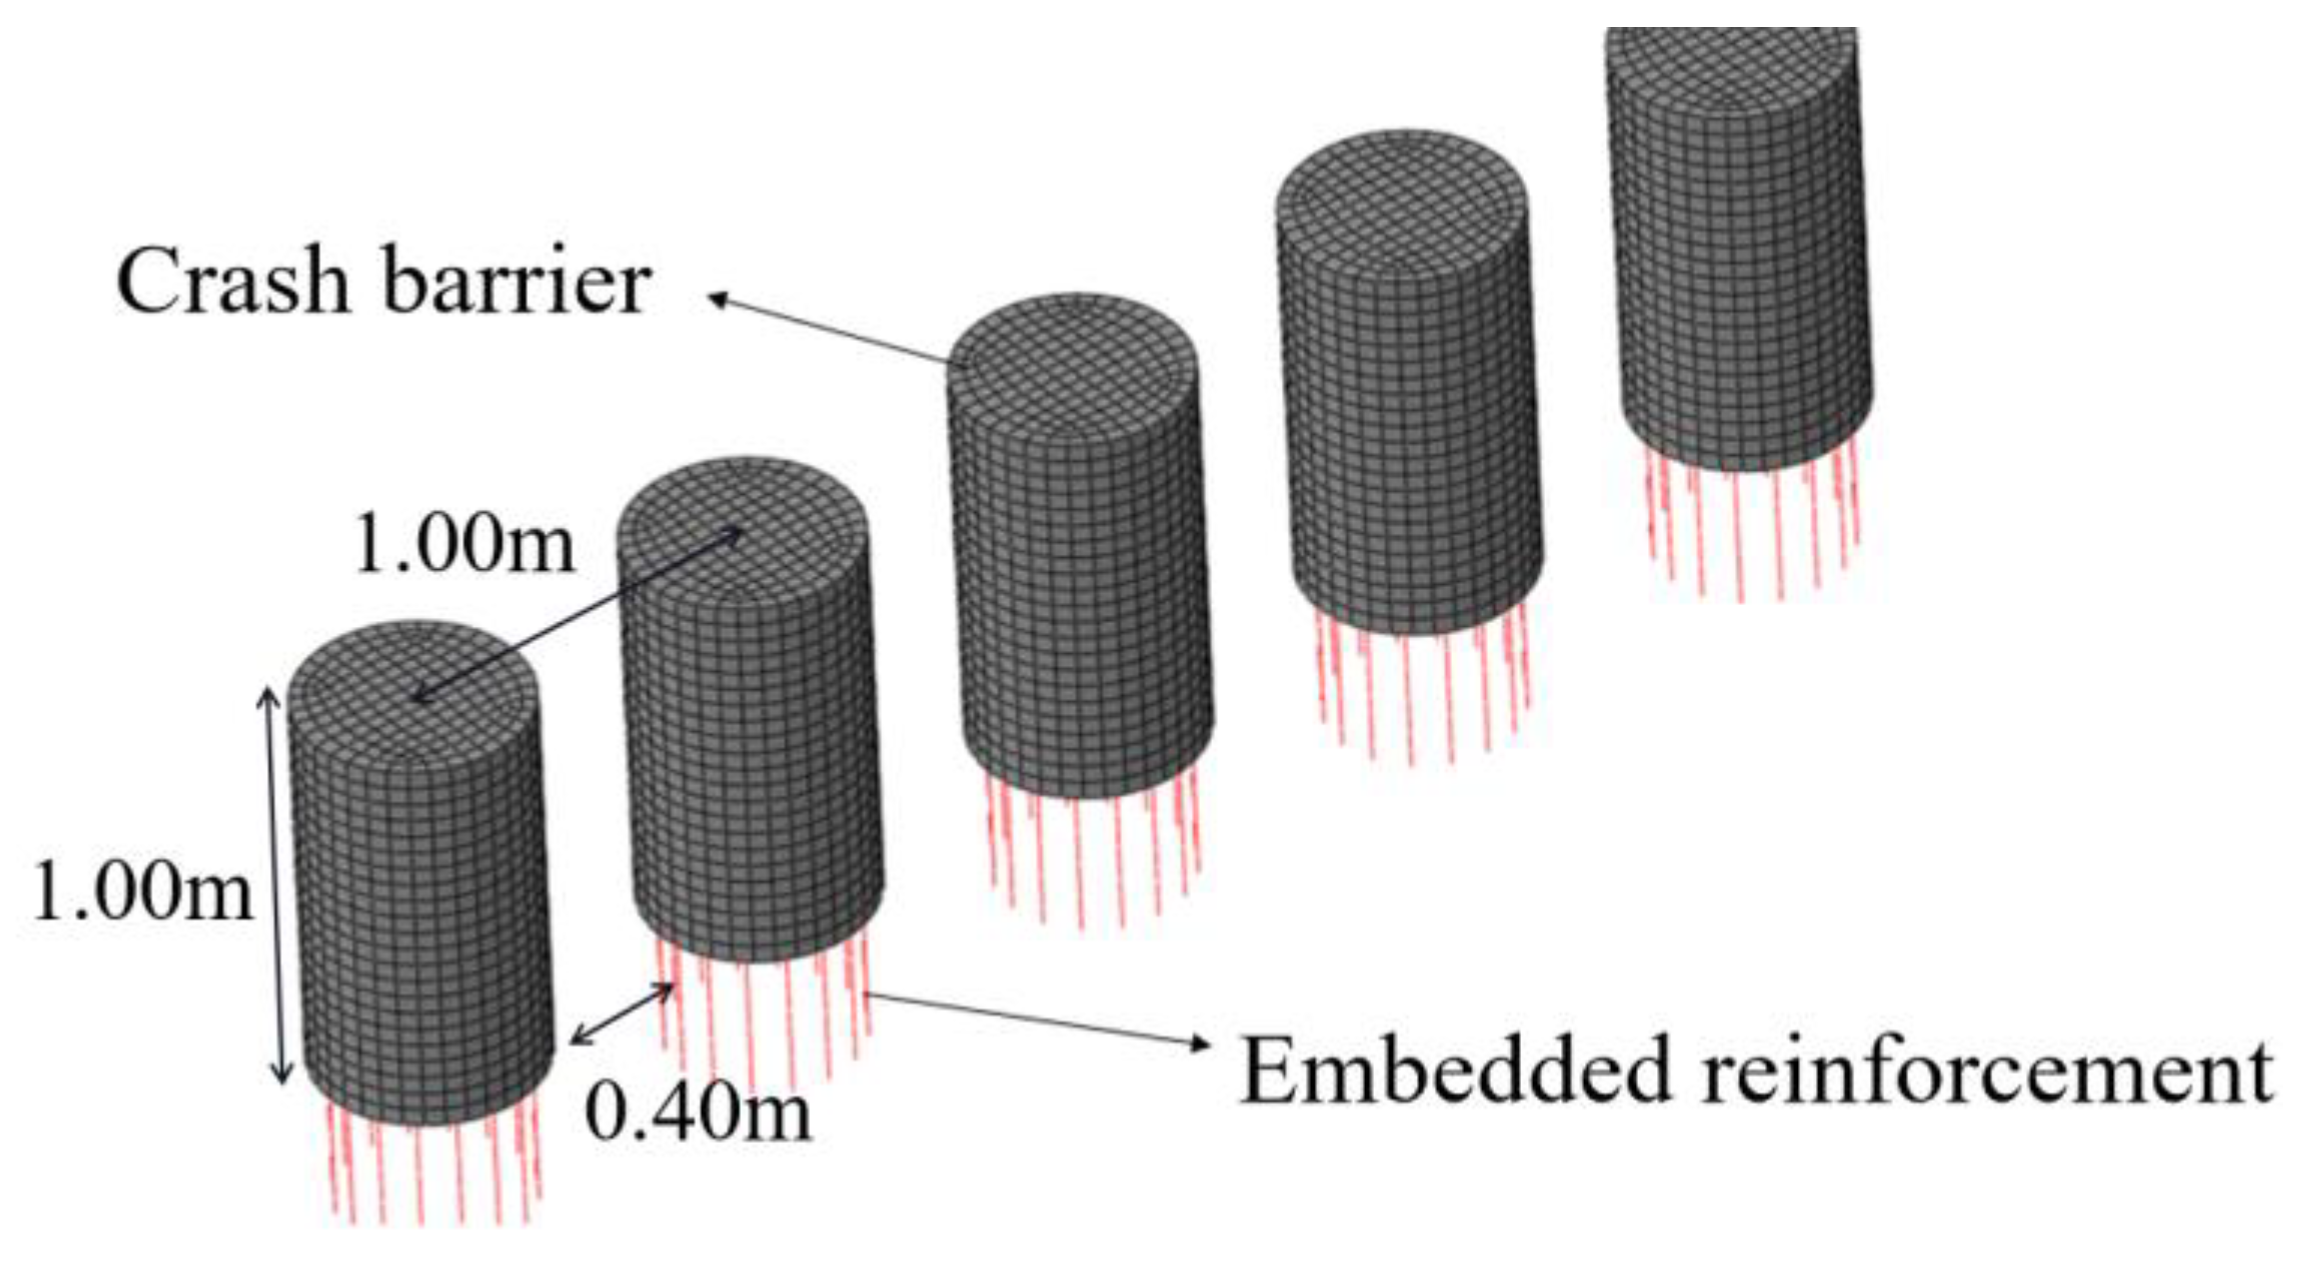
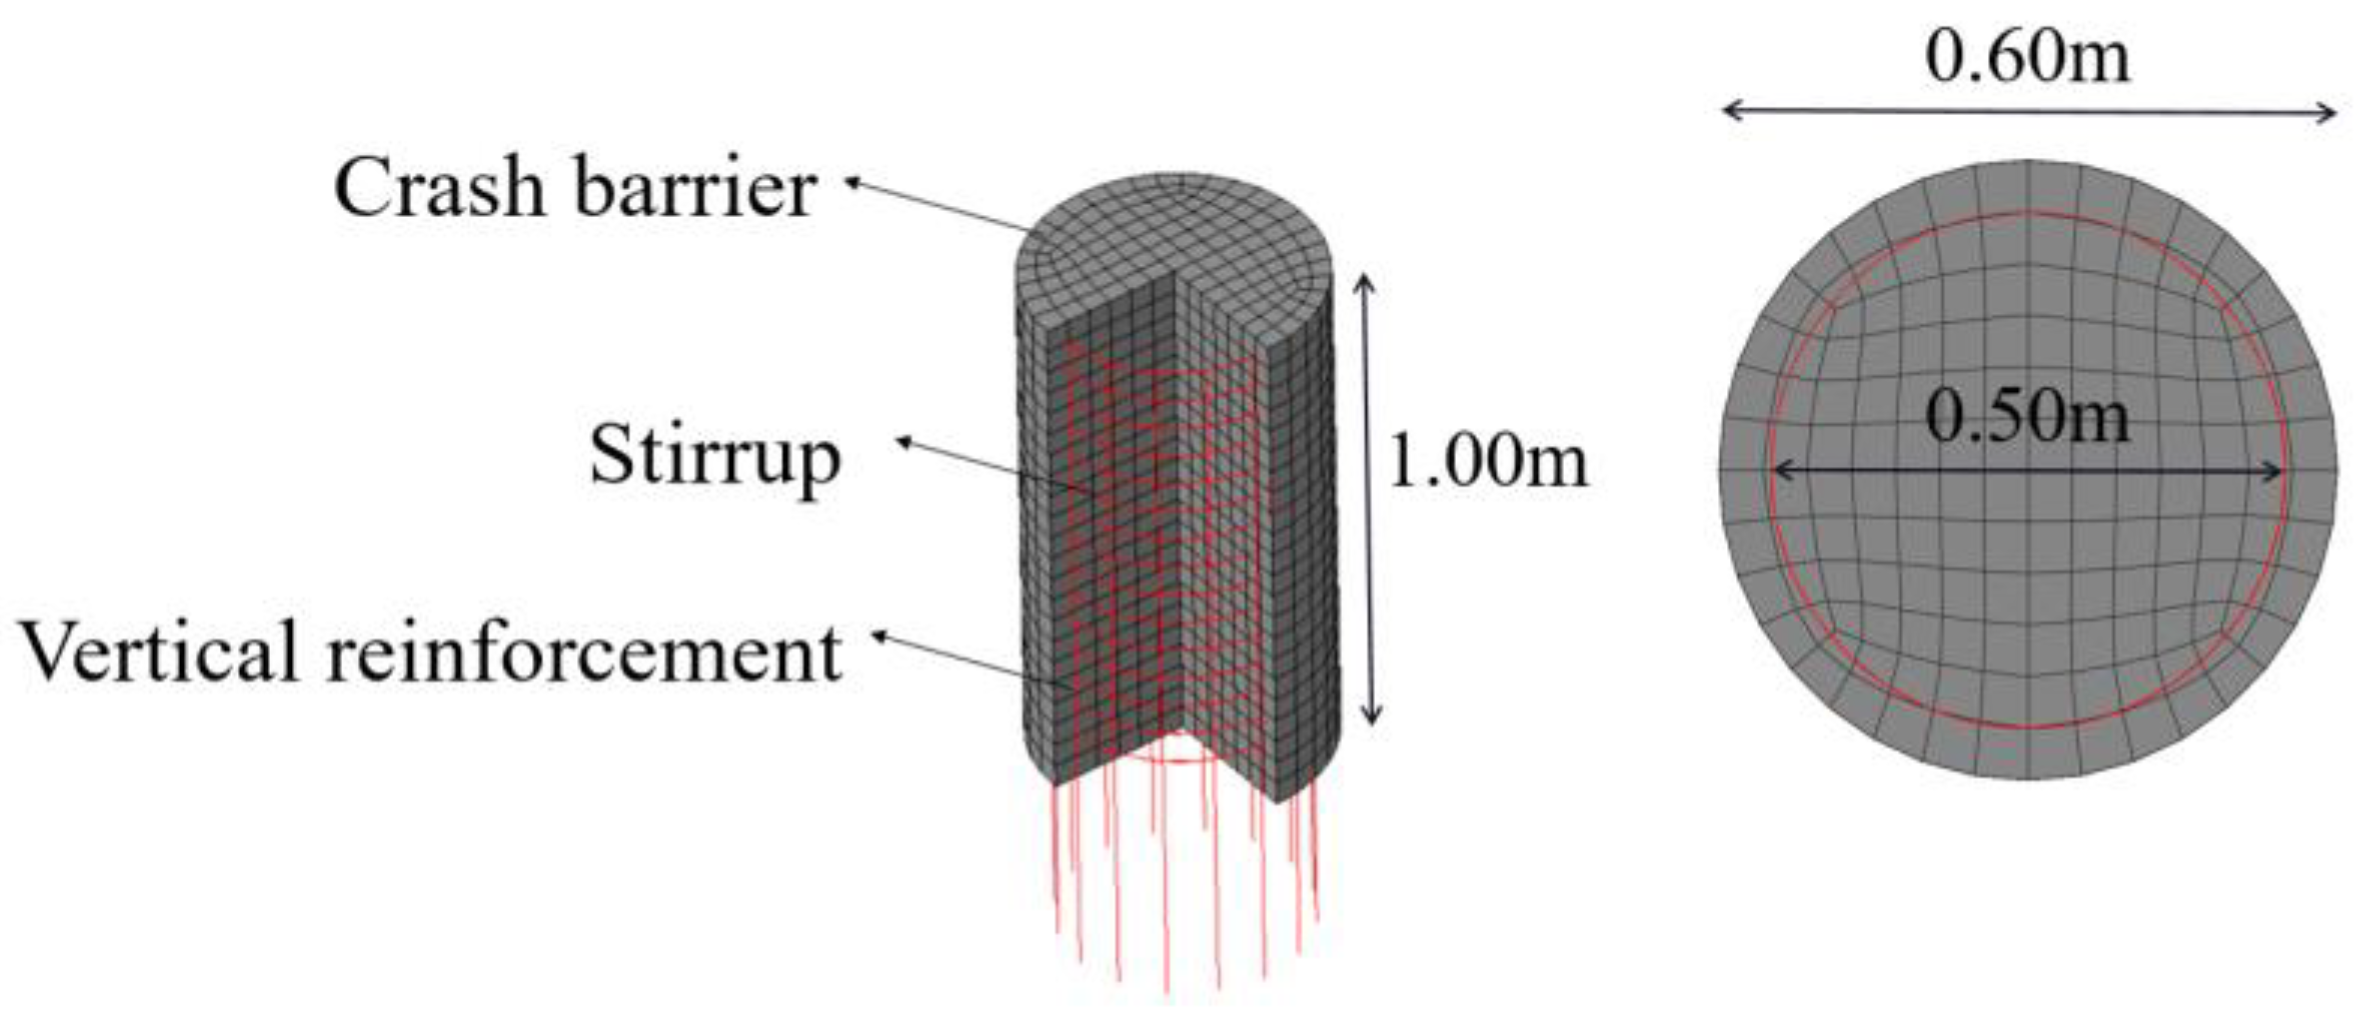
2.2. Crash Barrier Model

The models of a crash barrier with and without embedded steel bars are established. The former is used to simulate the crash effect of crash barriers when they are subjected to train impact loads without embedded steel bars. The latter explores the impact of different reinforcement amounts on the changes in lateral speed and lateral displacement of trains when steel bars are embedded.
Based on the drawings provided by the design institute, the crash barrier model with the same size is established. The crash barrier has a diameter of 0.6 m, a height of 1.1 m, and a spacing of 1 m. The vertical concrete model is constructed using the plastic damage model provided by ABAQUS. The friction formula for tangential behavior in the contact characteristic setup is selected as the Lagrange multiplier (standard), and the friction coefficient is set to 0.5. The evolution parameters for tensile and compressive damage are calculated using the damage evolution equation based on the Code for Design of Architecture & Concrete Structures (GB50010-2010) [31]. The damage data entered in ABAQUS are shown in Table 2 and Table 3.
As shown in Figure 2 and Figure 3, a reinforcing cage is embedded in the crash barrier to enhance its ability to withstand train impact loads. There are embedded steel bars at the bottom of the concrete pier to ensure a secure connection between the crash barrier and the foundation. The reinforcement cage, consisting of vertical bars and stirrups, is embedded in the crash barrier, and the reinforcement and concrete are connected through “embedding” in ABAQUS.

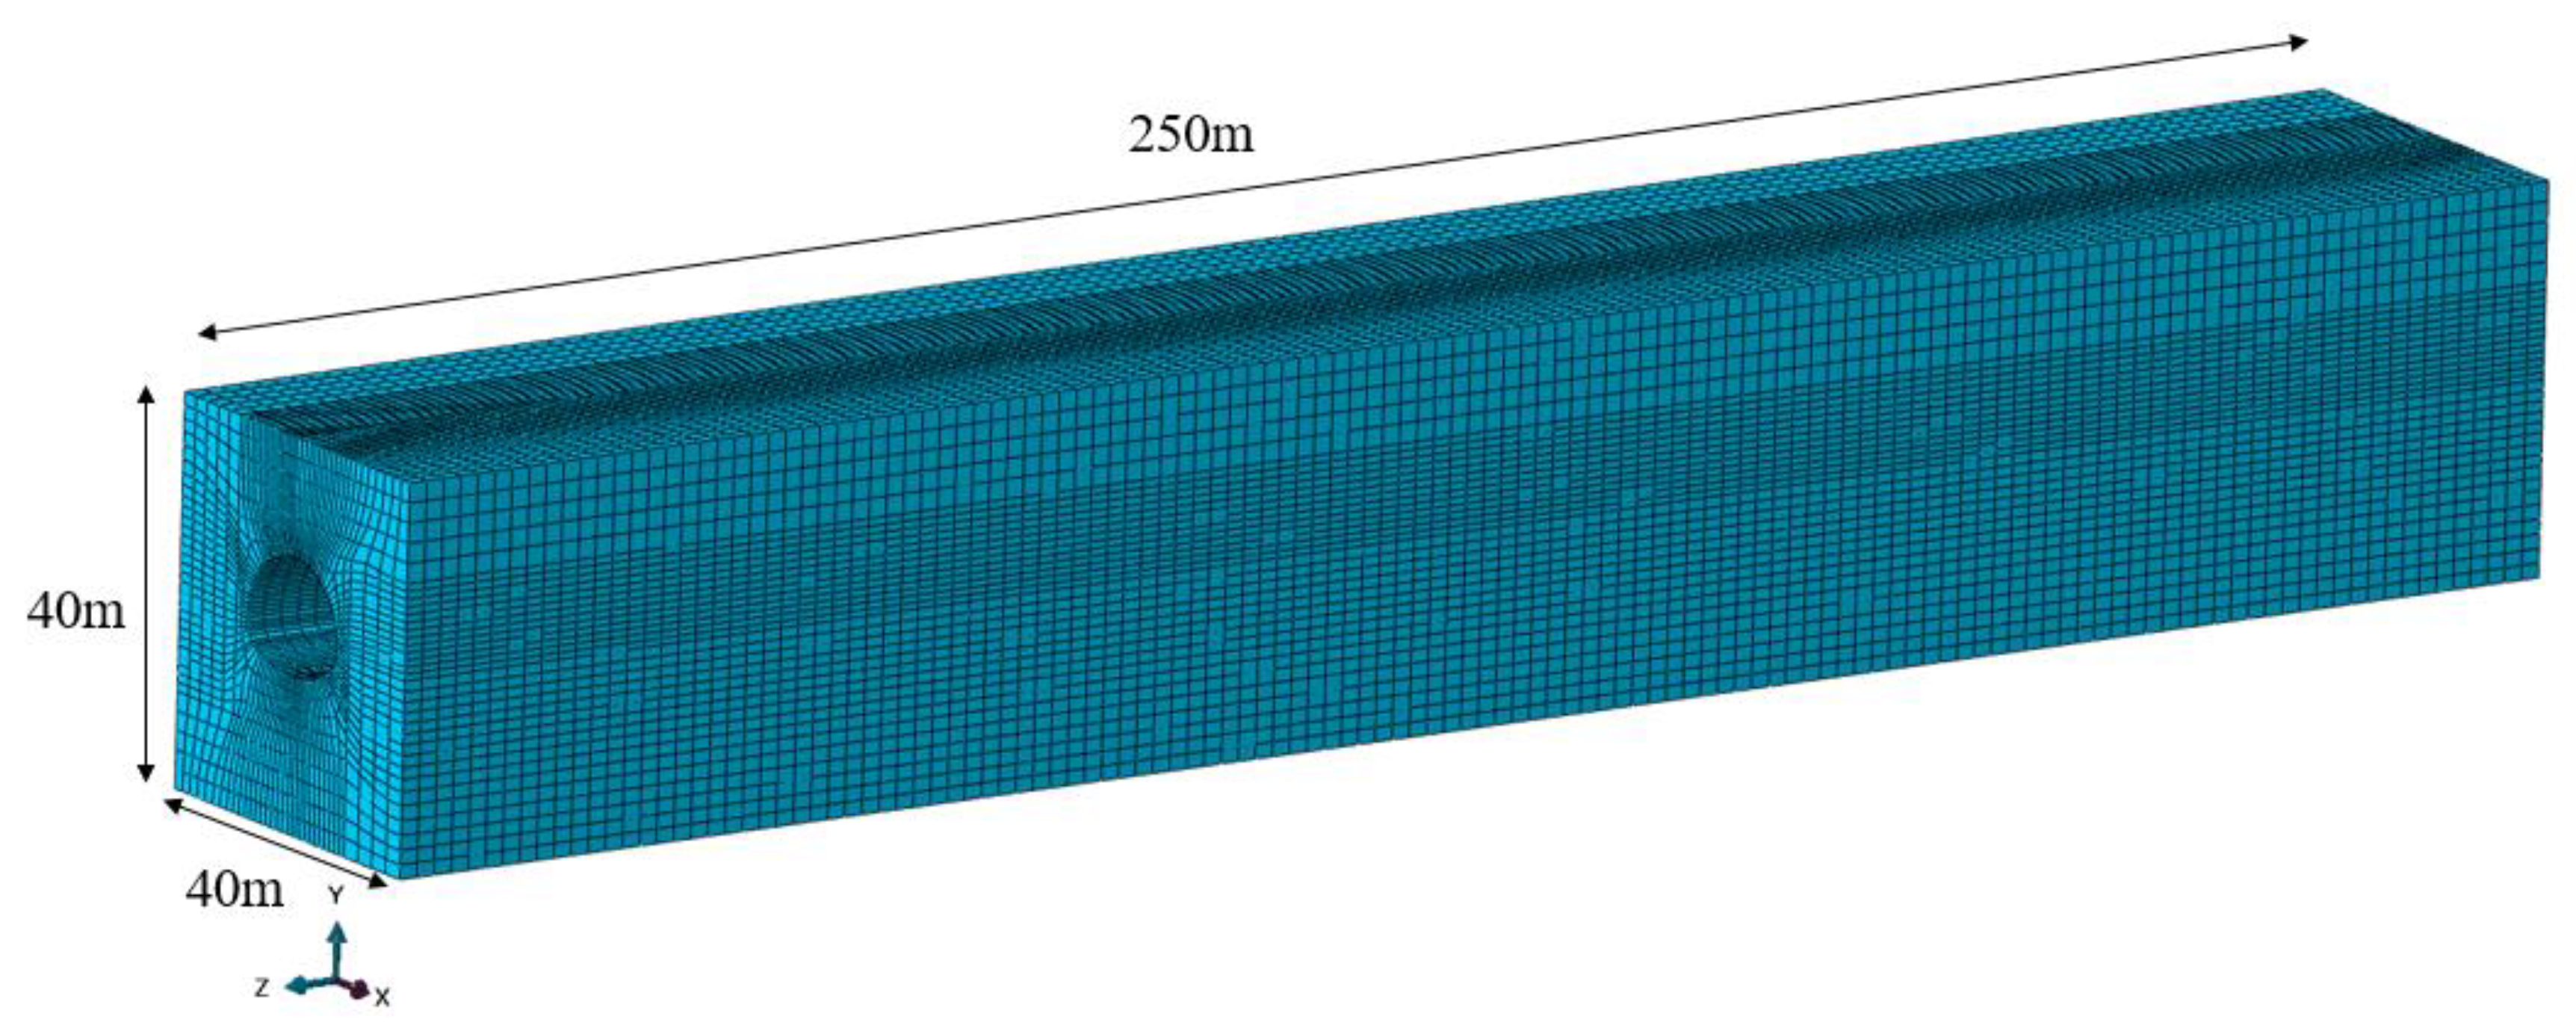
2.3. Tunnel Surrounding Rock Model

Considering the train’s length and the longitudinal and lateral dynamic boundary effects of the tunnel, the overall dimensions of the surrounding rock model around the tunnel are 250.0 meters long, 40.0 meters wide, and 40.0 meters high. Because the tunnel lining does not directly participate in the impact process, it has little influence on the impact process. Therefore, the lining does not adopt ring splicing, and the lining and surrounding rock are connected by “binding”. The surrounding rock model and grid division are shown in Figure 4.

3. Calculation Results and Analysis

3.1. The Motion Response of the Train

The impact resistance of crash barriers is primarily evident in the motion characteristics of the train, including its speed and displacement. Therefore, the dynamic response of the train itself warrants attention. In this study, the key parameters are the lateral (X-direction) speed and lateral displacement of the train. The lateral speed of the train can be used to determine whether the derailed train will continue to veer off the track or switch onto other tracks. The lateral displacement of the train can indicate whether the train has switched to other tracks, helping to determine the train’s movement status and evaluate the crash barrier’s impact resistance. The train was set to impact at a speed of 200 km/h and an angle of 5 degrees. The impact lasted for 0.5 s, and the derailment of the locomotive was analyzed.

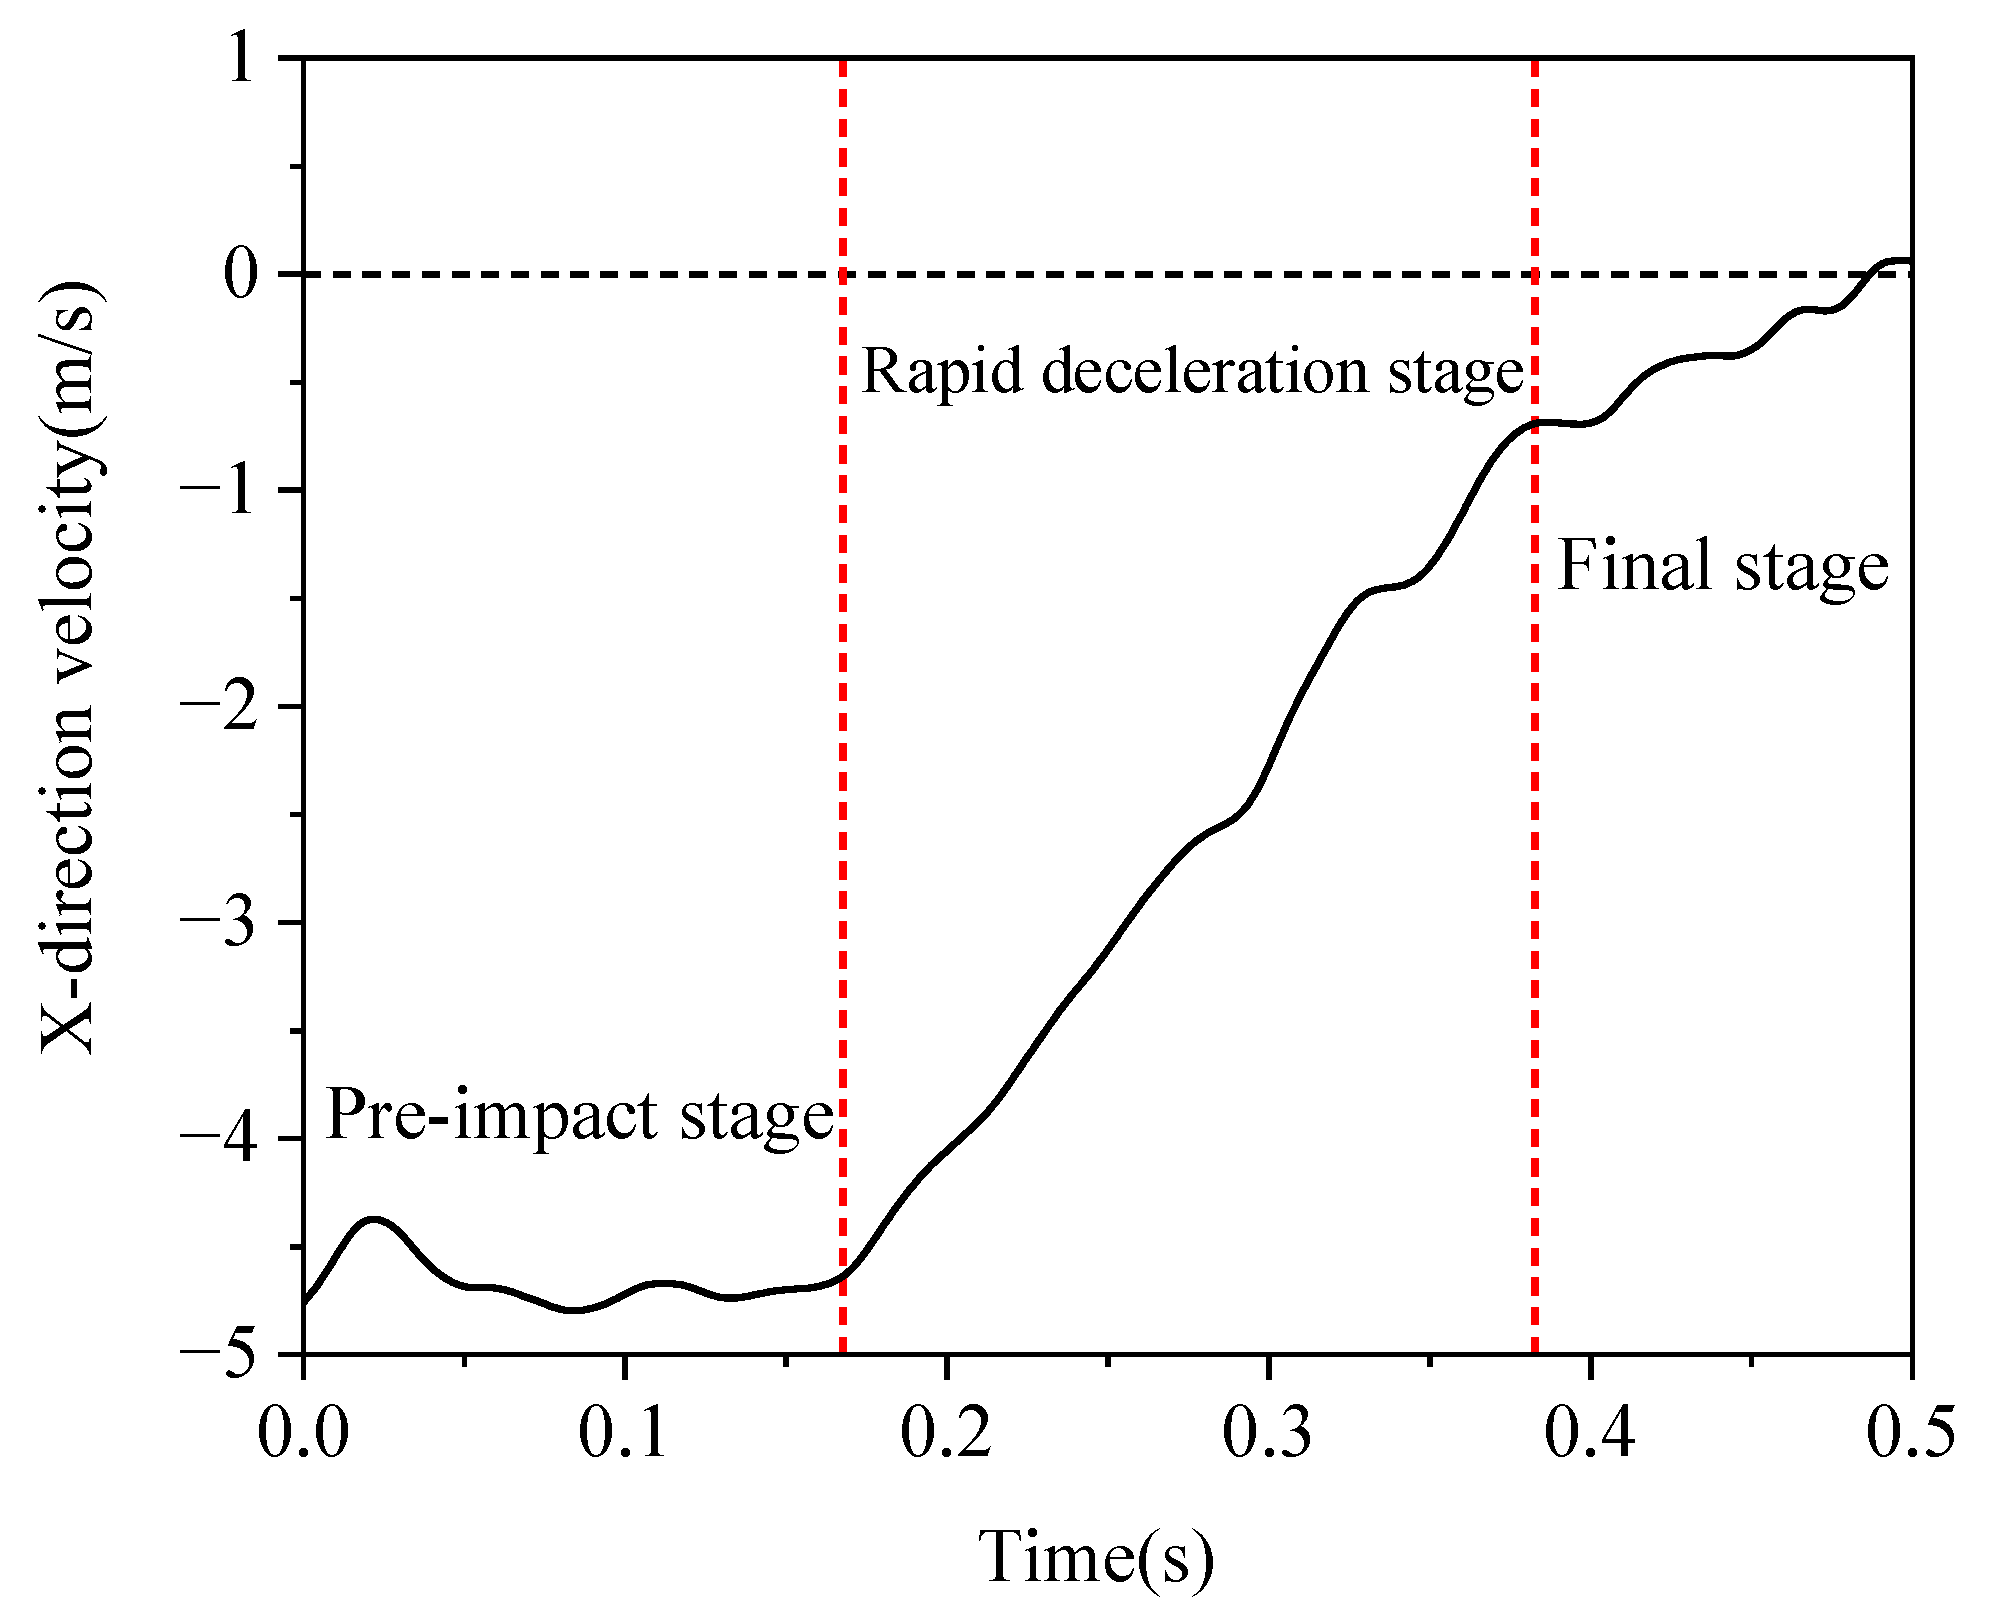
3.1.1. Train Motion Response When It Hits barriers without Embedded Steel Bars

When the concrete crash barrier is hit, the speed and acceleration responses vary at different positions along the train. Therefore, the points in the streamlined front part of the train are selected to determine the average value. Subsequently, the speed characteristic value is obtained during the impact process, and the time history curve of this value is extracted. Figure 5 shows the velocity–time curve when the locomotive derails. The speed is 200 km/h, and the gradient is 0 degrees. As depicted in the figure, the lateral speed (X-direction) at the front of the train has decreased from 17.43 km/h to approximately 0 km/h. During the speed reduction process, the train went through three stages: the pre-impact stage, the rapid deceleration stage, and the final stage. The speed stabilized in the final stage, effectively preventing the derailed train from veering onto other tracks. Figure 6 shows the lateral displacement–time curve of the train during the collision. It can be observed that the displacement curve of the train gradually flattens during the collision. After experiencing the rapid displacement stage, the train’s displacement speed gradually decreases, entering the slow displacement stage, and eventually stabilizes at about 1.37 meters. There is also a trend of reverse displacement, possibly caused by the release of plastic properties absorbed by the train during the collision, leading to a rebound in the opposite direction. Overall, the train did not switch to other tracks.

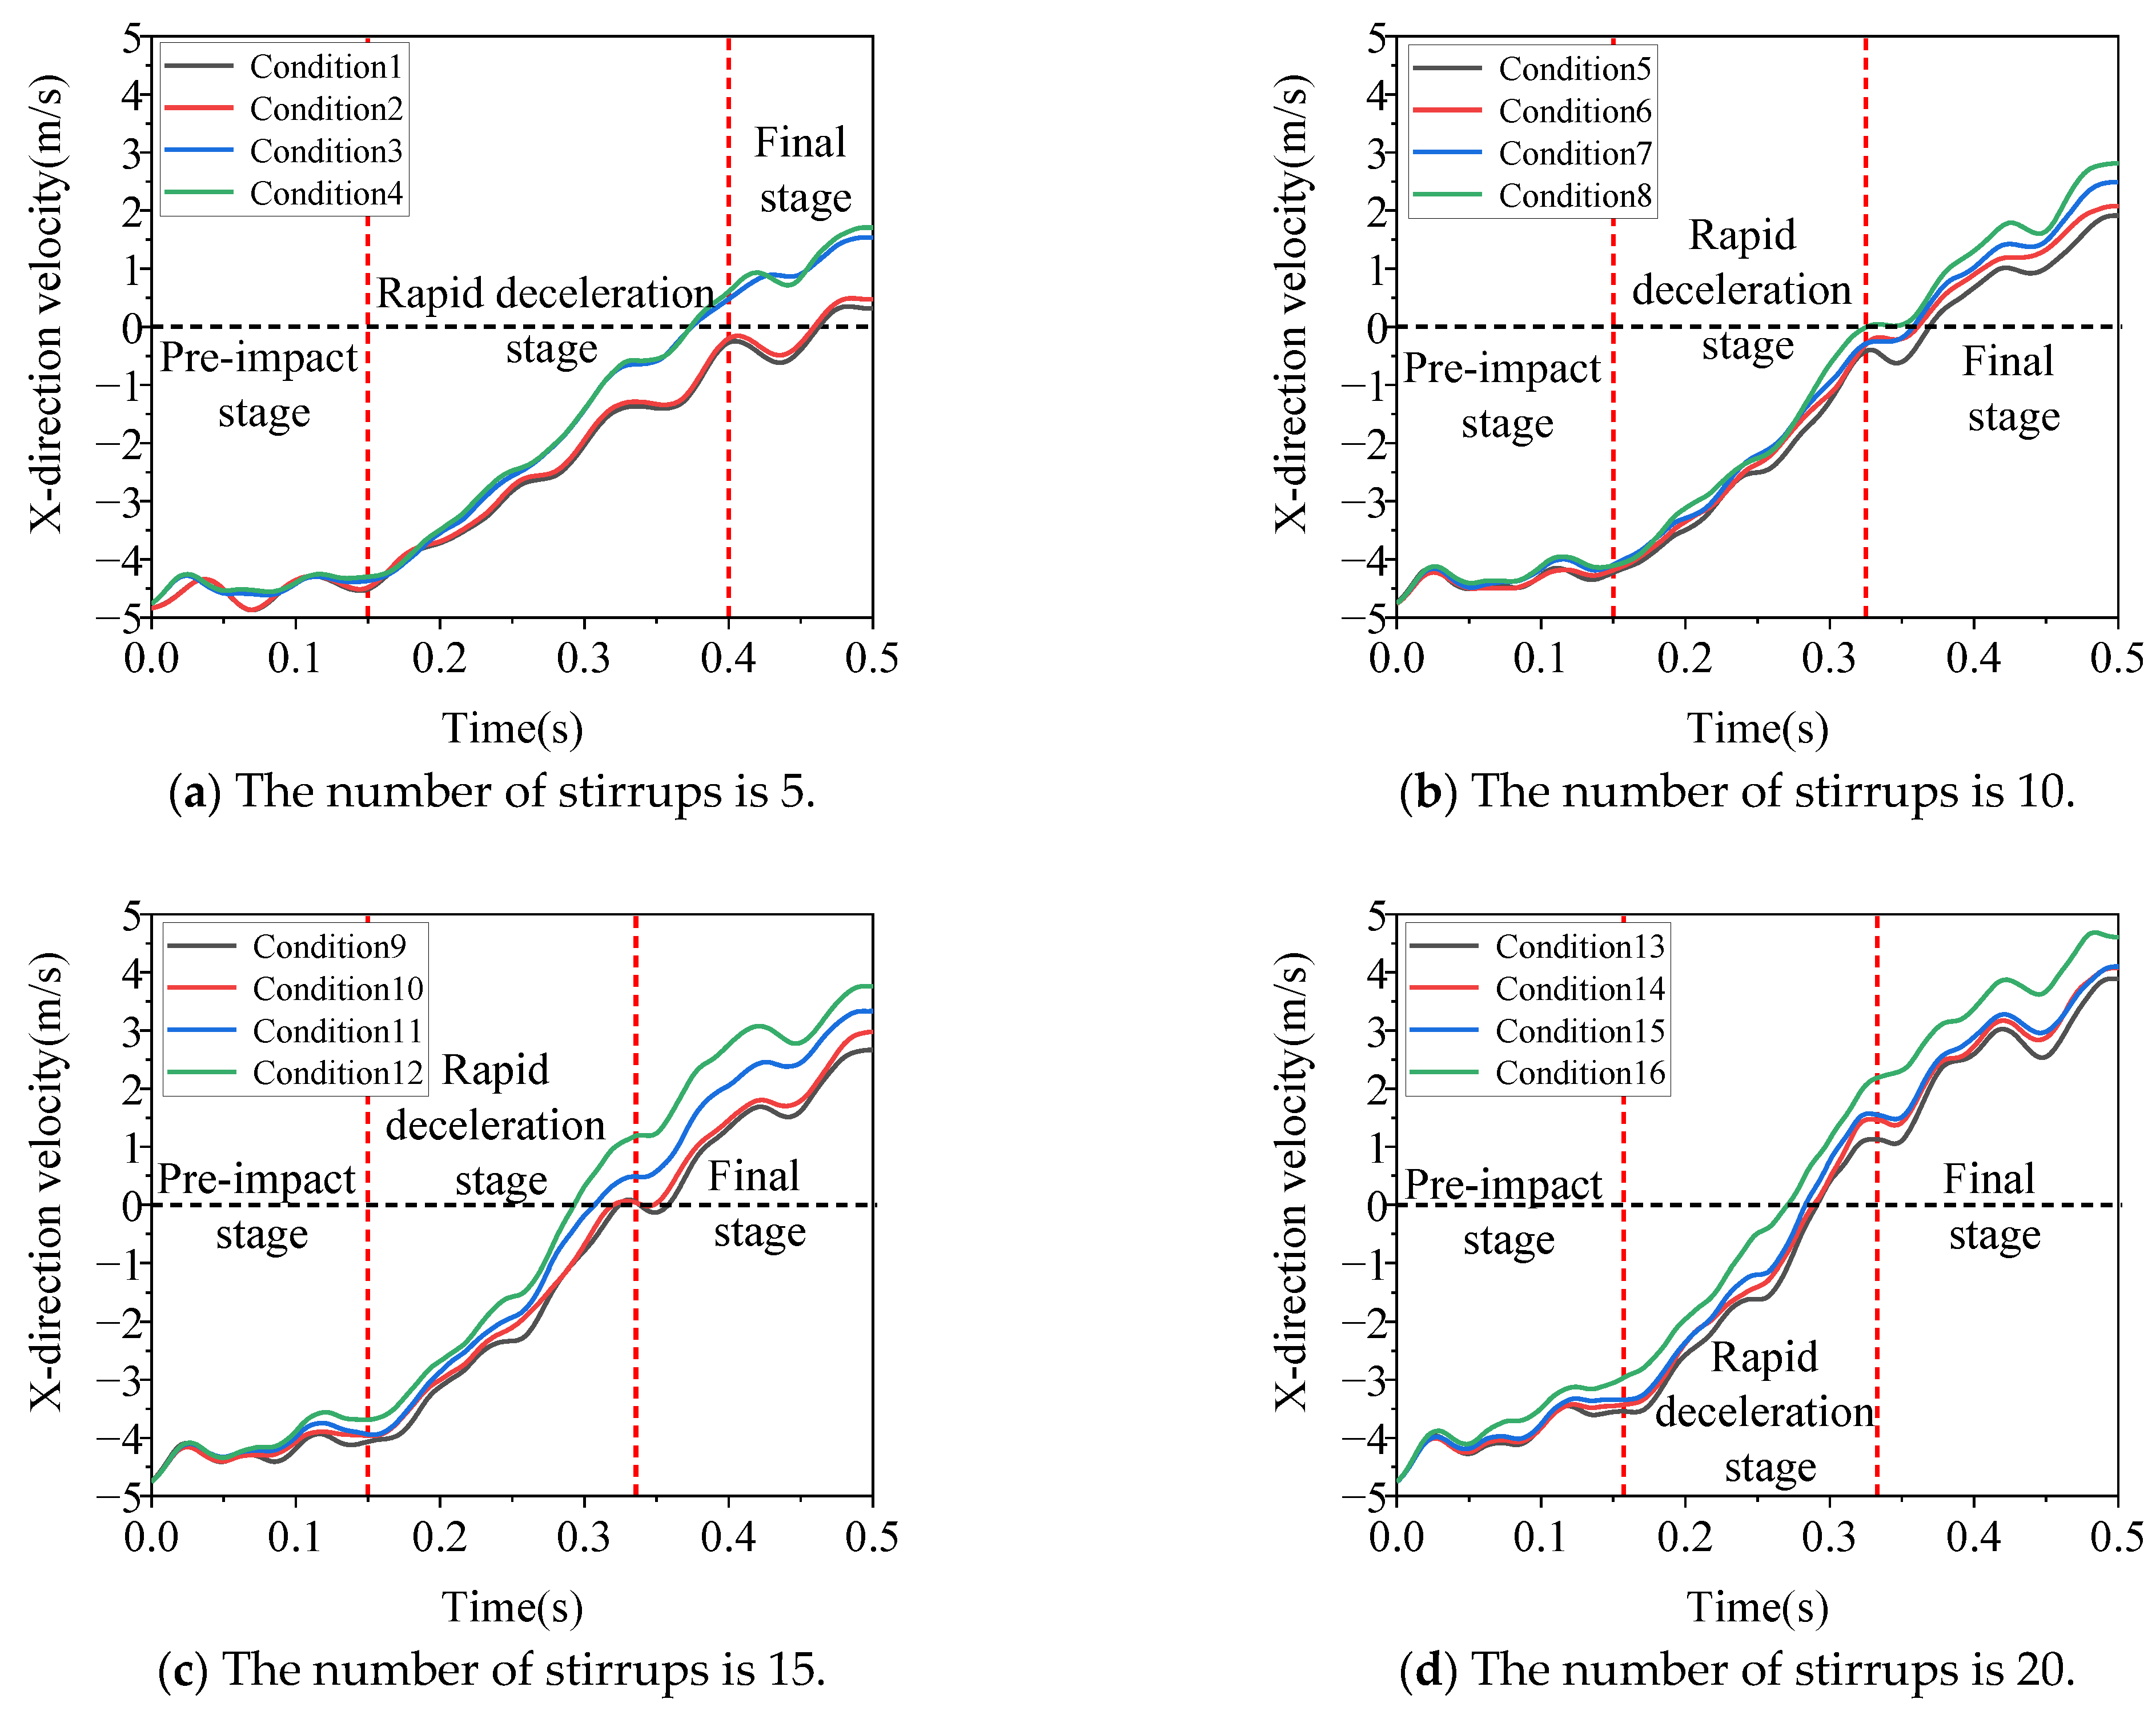
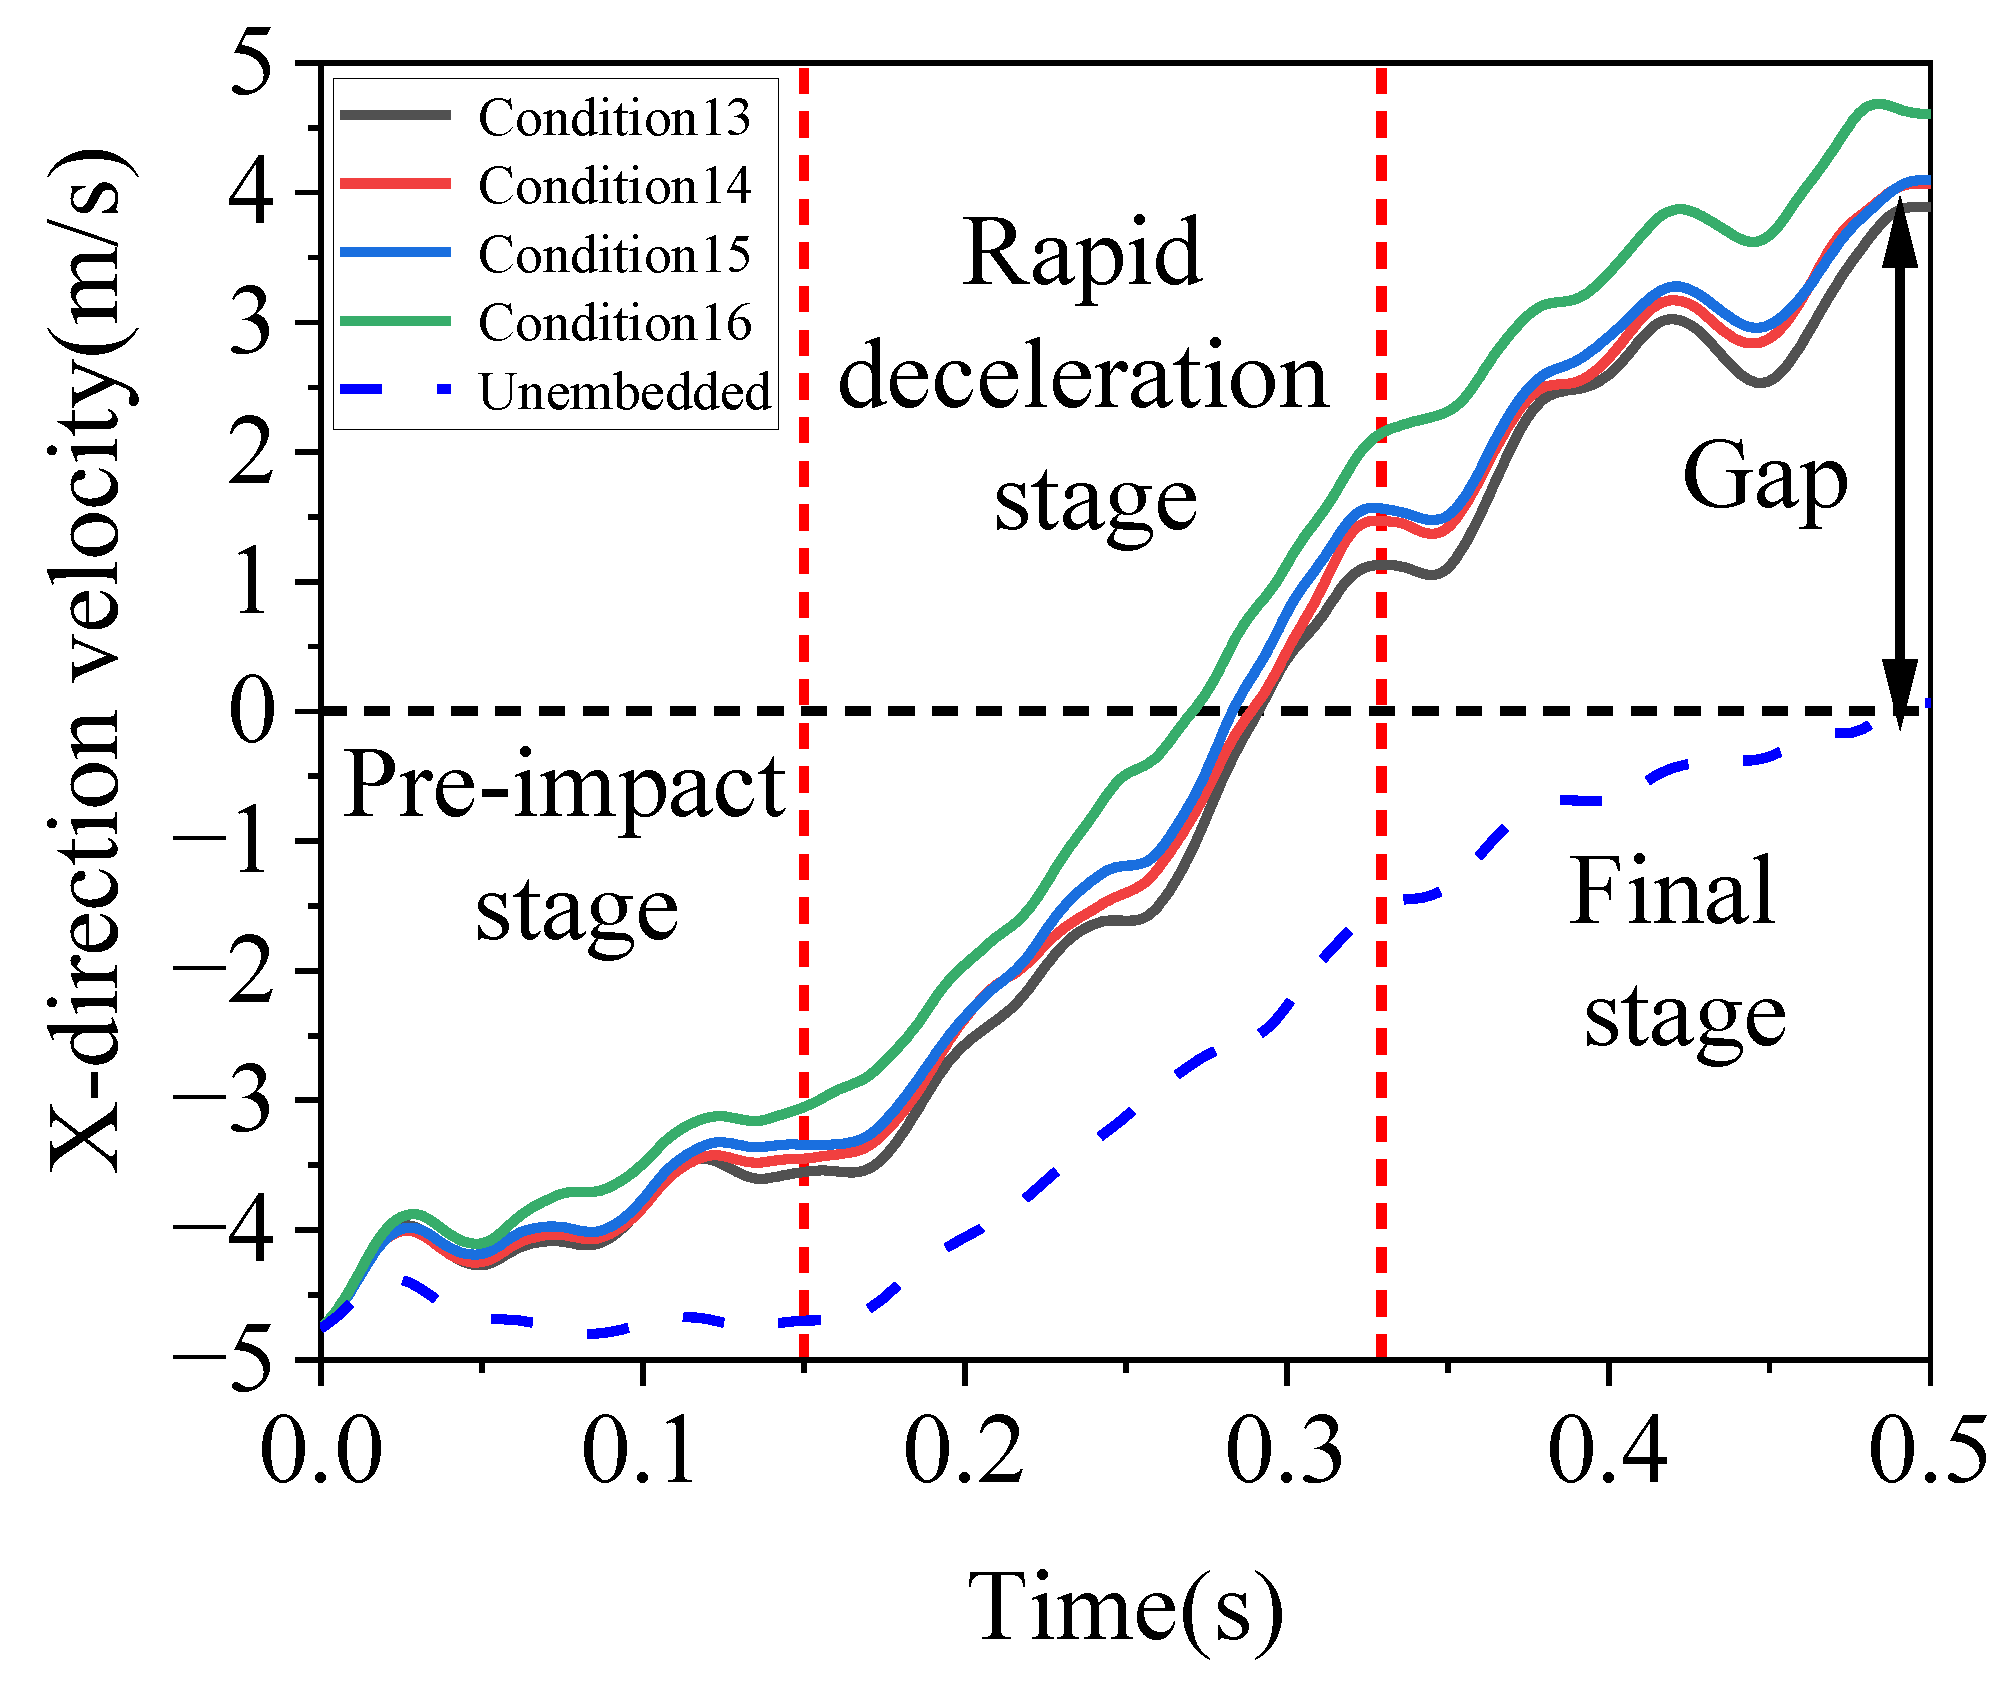
3.1.2. Train Motion Response When It Hits Barriers with Embedded Steel Bars

In Section 3.1.1, the discussion covers the damage of concrete crash barriers without steel bars and the dynamic response of trains. However, in practice, crash barriers typically incorporate steel bars to enhance their crash resistance. The embedded steel bars are also anchored to the ground to ensure stability and durability. Therefore, it is necessary to embed steel reinforcement cages in crash barriers to more accurately simulate the train movement characteristics after derailment. After embedding the reinforcement cages, the crash barrier’s impact resistance will be significantly enhanced. However, an excessive reinforcement ratio can lead to wastage. In order to explore the optimal reinforcement layout and quantity, 16 different combinations of vertical reinforcement and stirrups are designed, as illustrated in Table 4.

Lateral Speed of the Train

Figure 7 displays the time–history curve after the train collides with the crash barrier under various working conditions. For a more intuitive comparison, the same stirrup working conditions are placed on the same diagram. The speed of the point near the impact area of the front of the locomotive is extracted as the representative value of the train’s speed. As can be seen from the figure, the lateral speed of the train decreases continuously after hitting the crash barrier, then reverses and increases to a positive value after reaching 0. This demonstrates that during a collision, the lateral speed is dissipated, preventing the transfer of impact force to other tracks. As the speed increases in the opposite direction, the train naturally realigns itself with its original track direction.
As can be seen from working condition 1 in Figure 7a, the lateral speed of the train changes significantly with the increase in vertical reinforcement ratio under the same stirrup. When the vertical reinforcement ratio is 0.2224% and the calculation time is 0.5 s, the speed increases from negative to 0.31 m/s. When the reinforcement ratio of the vertical bars doubled to 0.4448%, the final speed increased to 0.47 m/s. When the reinforcement ratio increases to 0.6672%, the final speed reaches 1.54 m/s. Further increasing the reinforcement ratio to 0.8896% results in the final speed reaching 1.71 m/s. Under these working conditions, the transverse final speed of the train changes from negative to positive, and the speed change is greatly influenced by the reinforcement ratio of vertical bars. It shows that under this reinforcement ratio, the direction of impact by the train has shifted, indicating a tendency to veer off course. As can be seen from Figure 7, the variation in the number of stirrups significantly affects the lateral speed of the train. With the increase in the number of stirrups, the change in train speed is also increasing.
At the same time, compare the X-direction speed change curve of the train after the collision with the crash barrier without steel bars in Section 3.1.1. As can be seen from Figure 8, the reduction in the lateral speed of the train significantly increases after the steel bars are added. This demonstrates that the crash barrier’s anti-impact ability is significantly improved after the reinforcement is integrated. This enhancement makes it challenging for a derailed train to veer onto other tracks, thereby preventing secondary disasters that could seriously jeopardize the sustainable operation of trains.

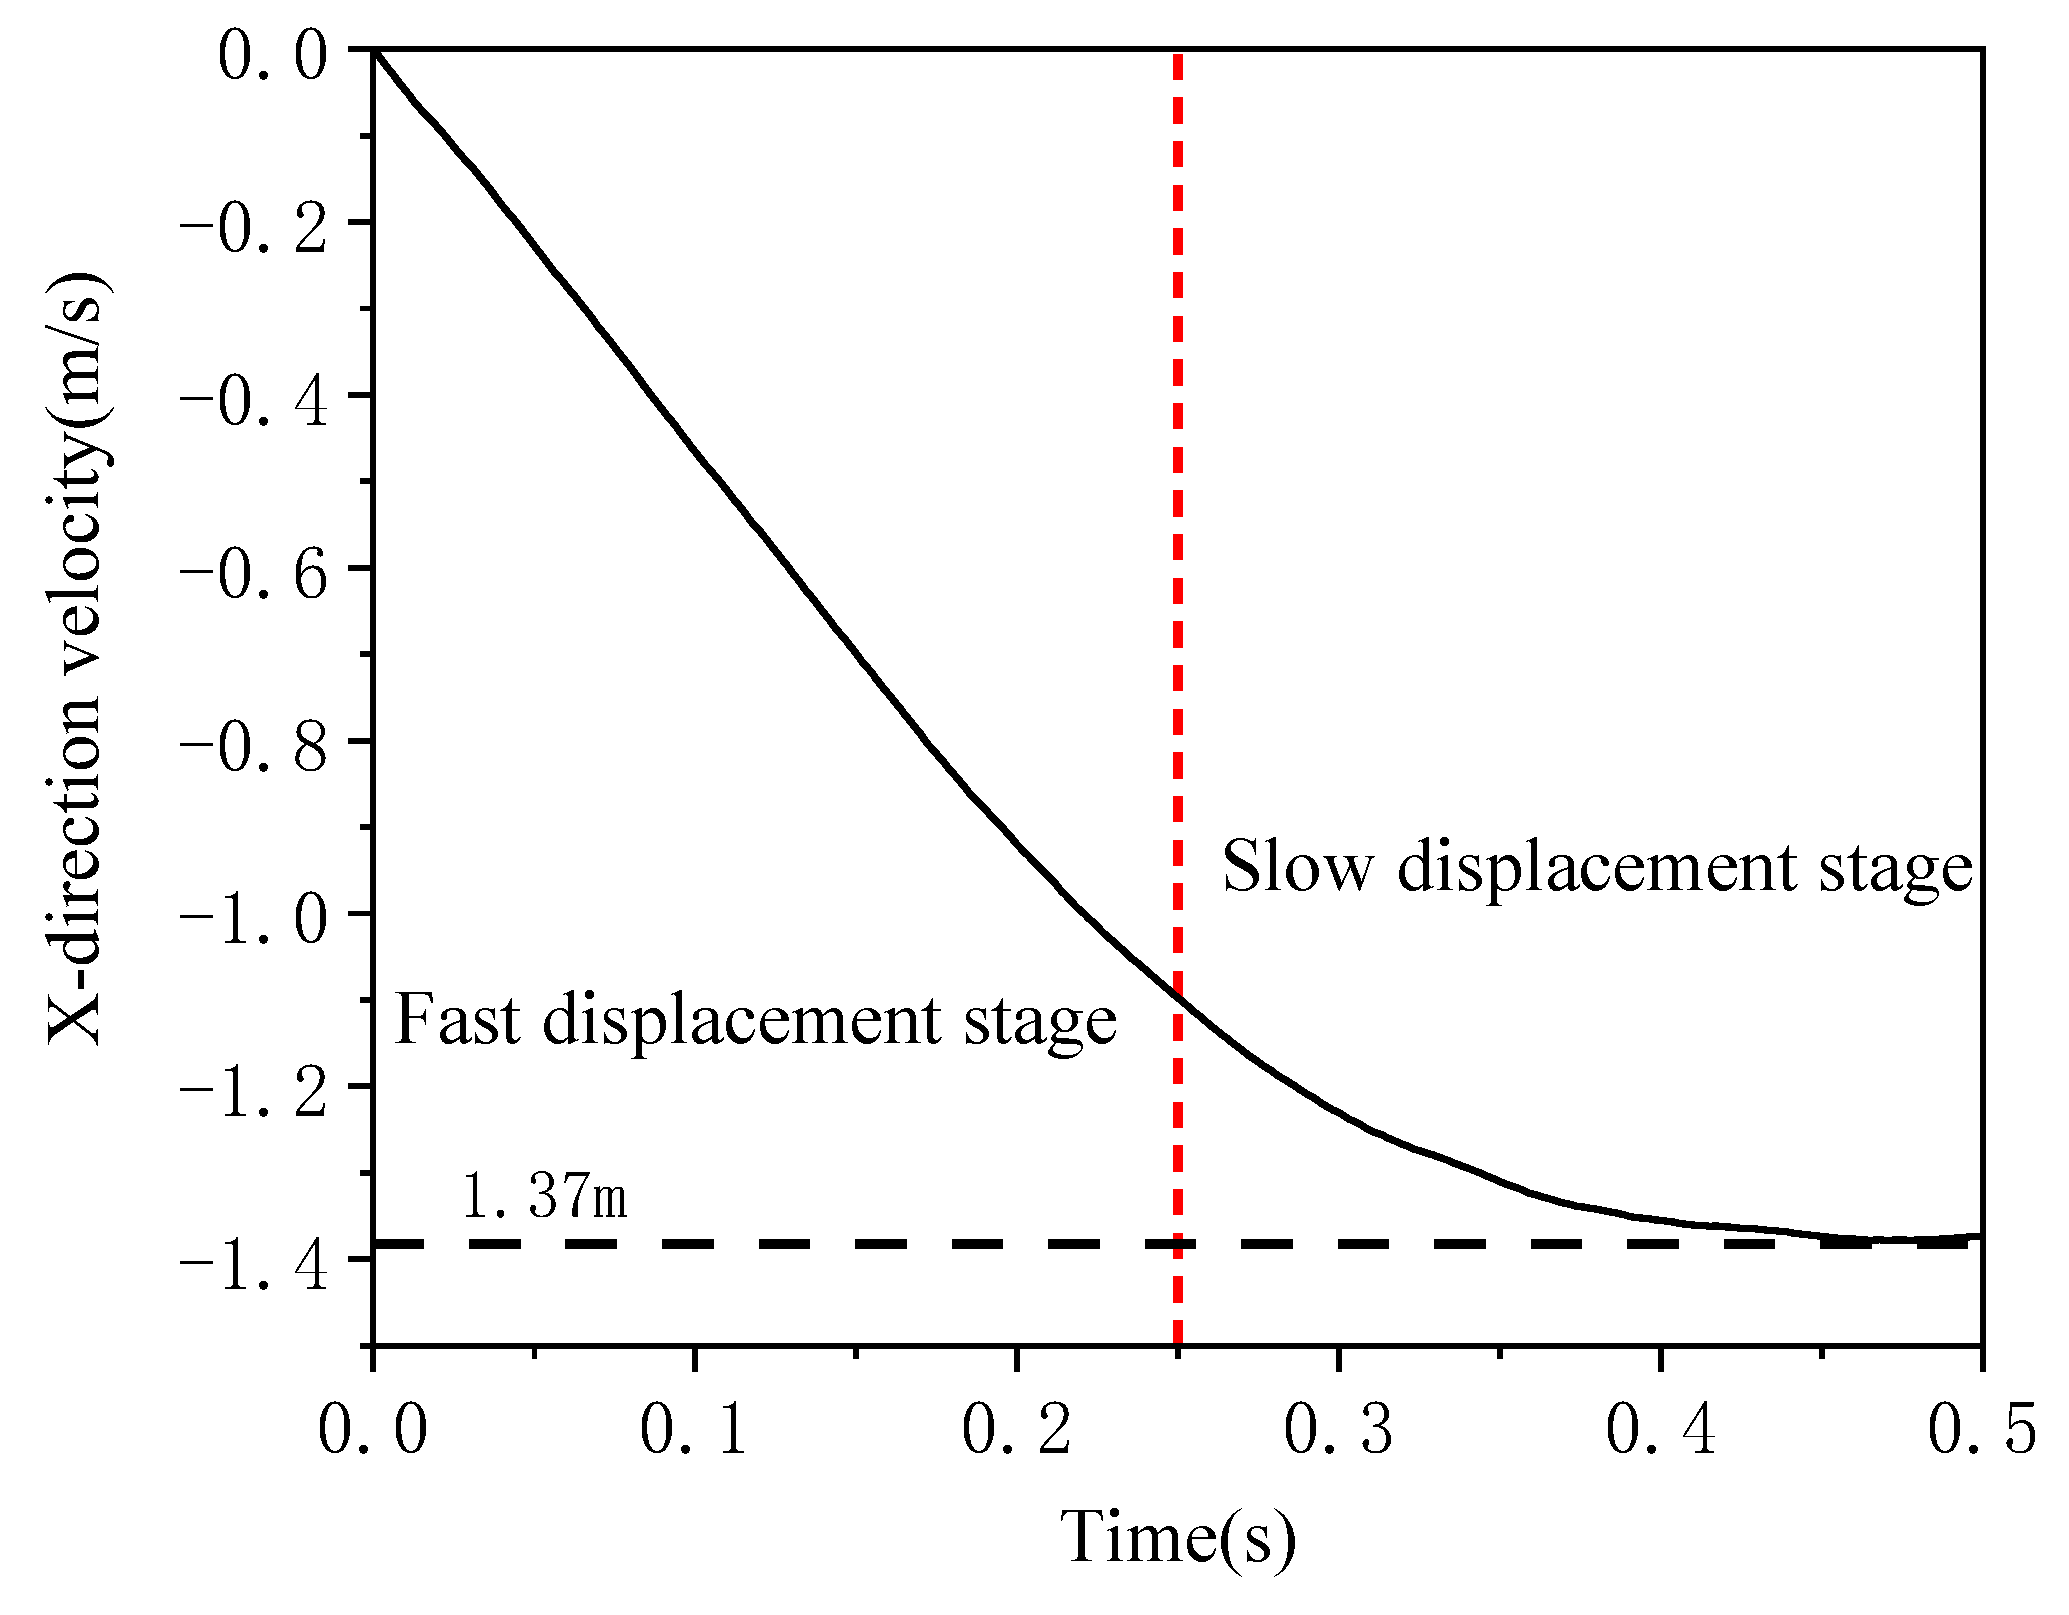
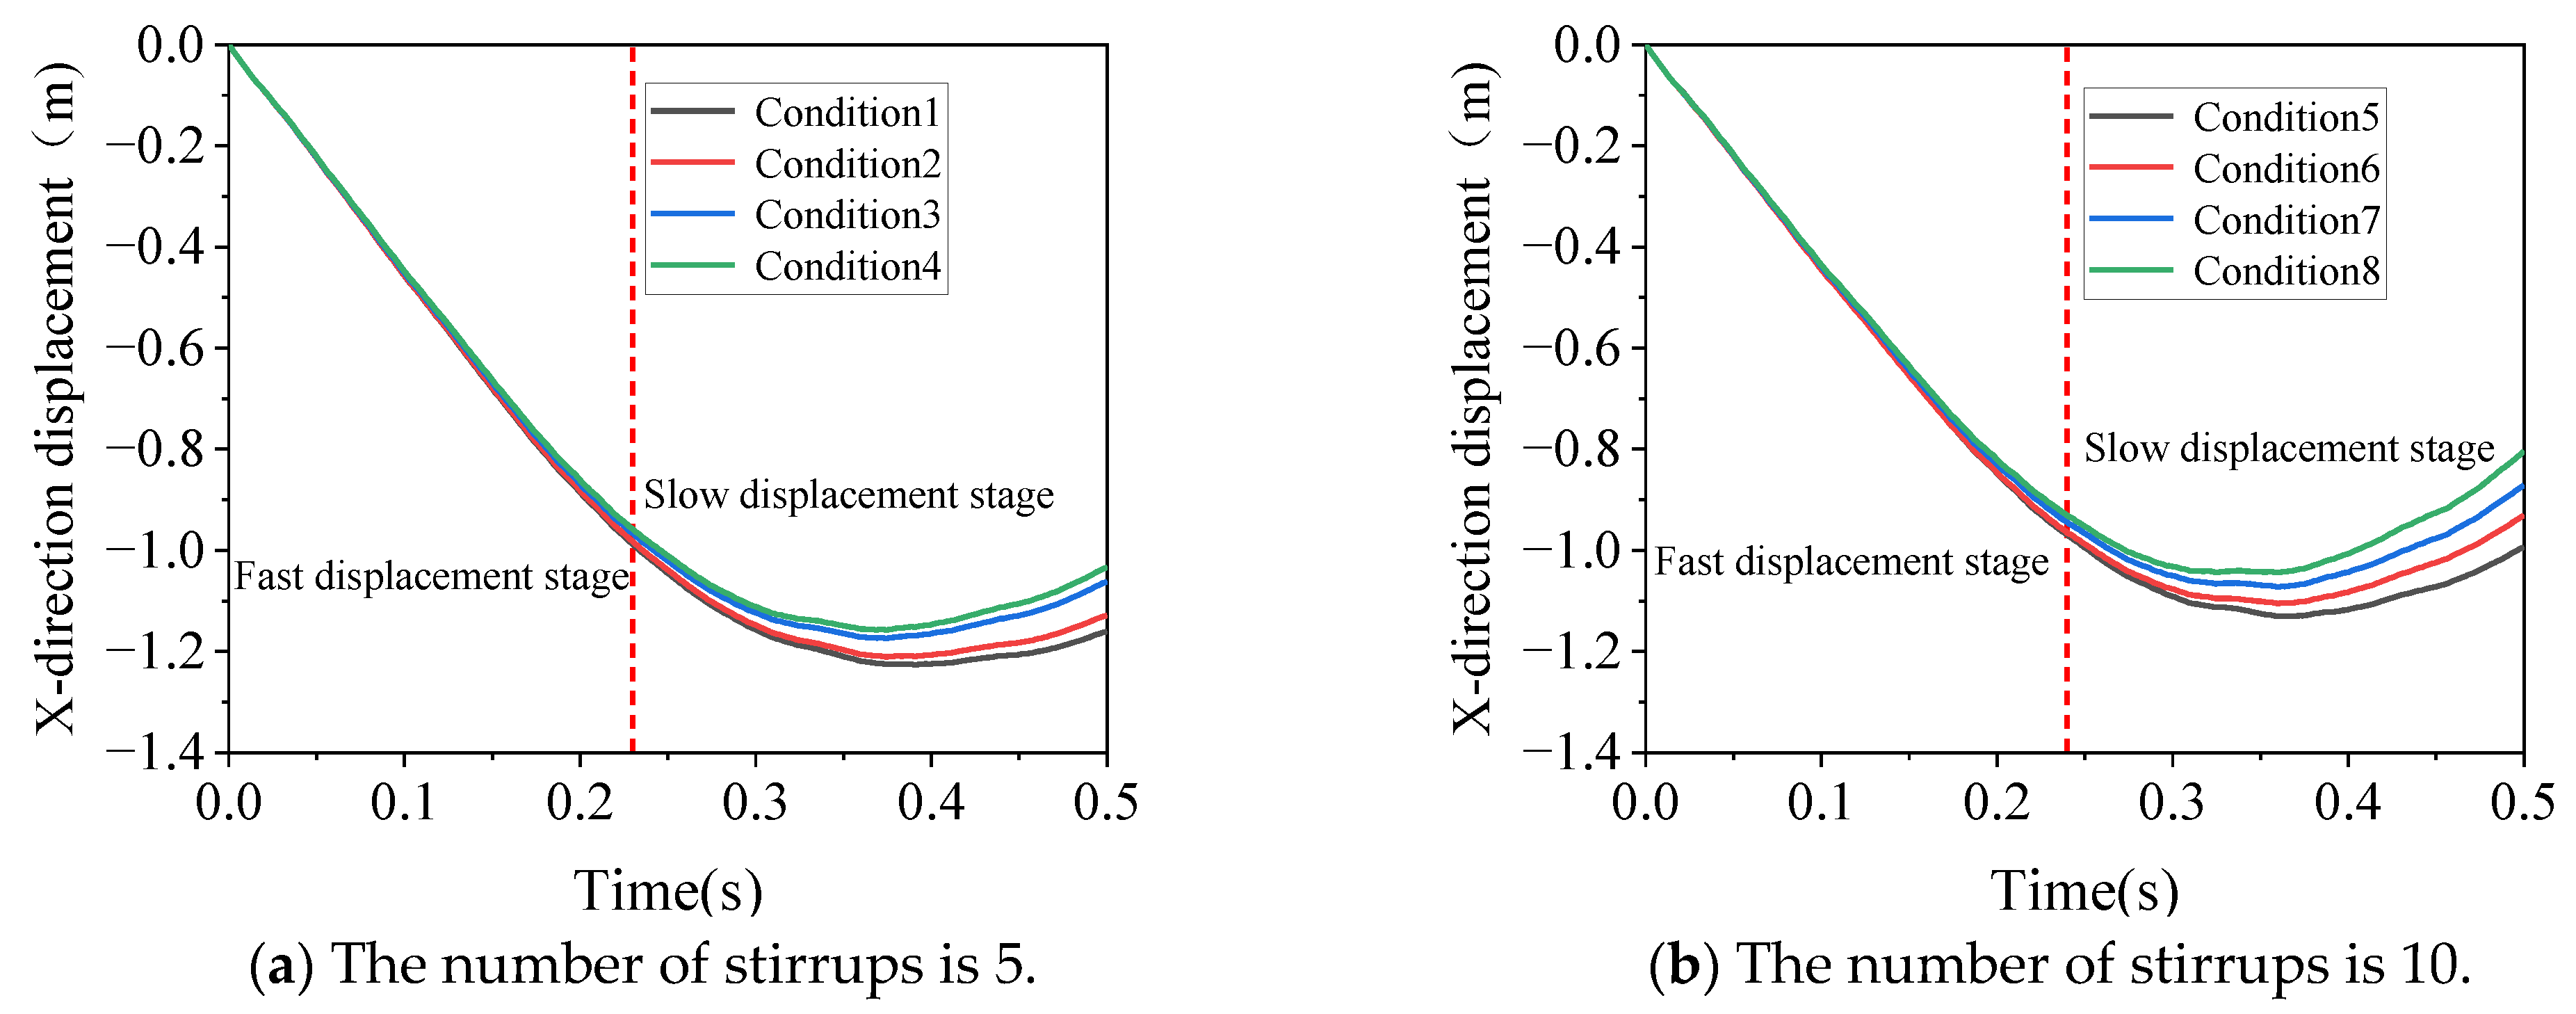
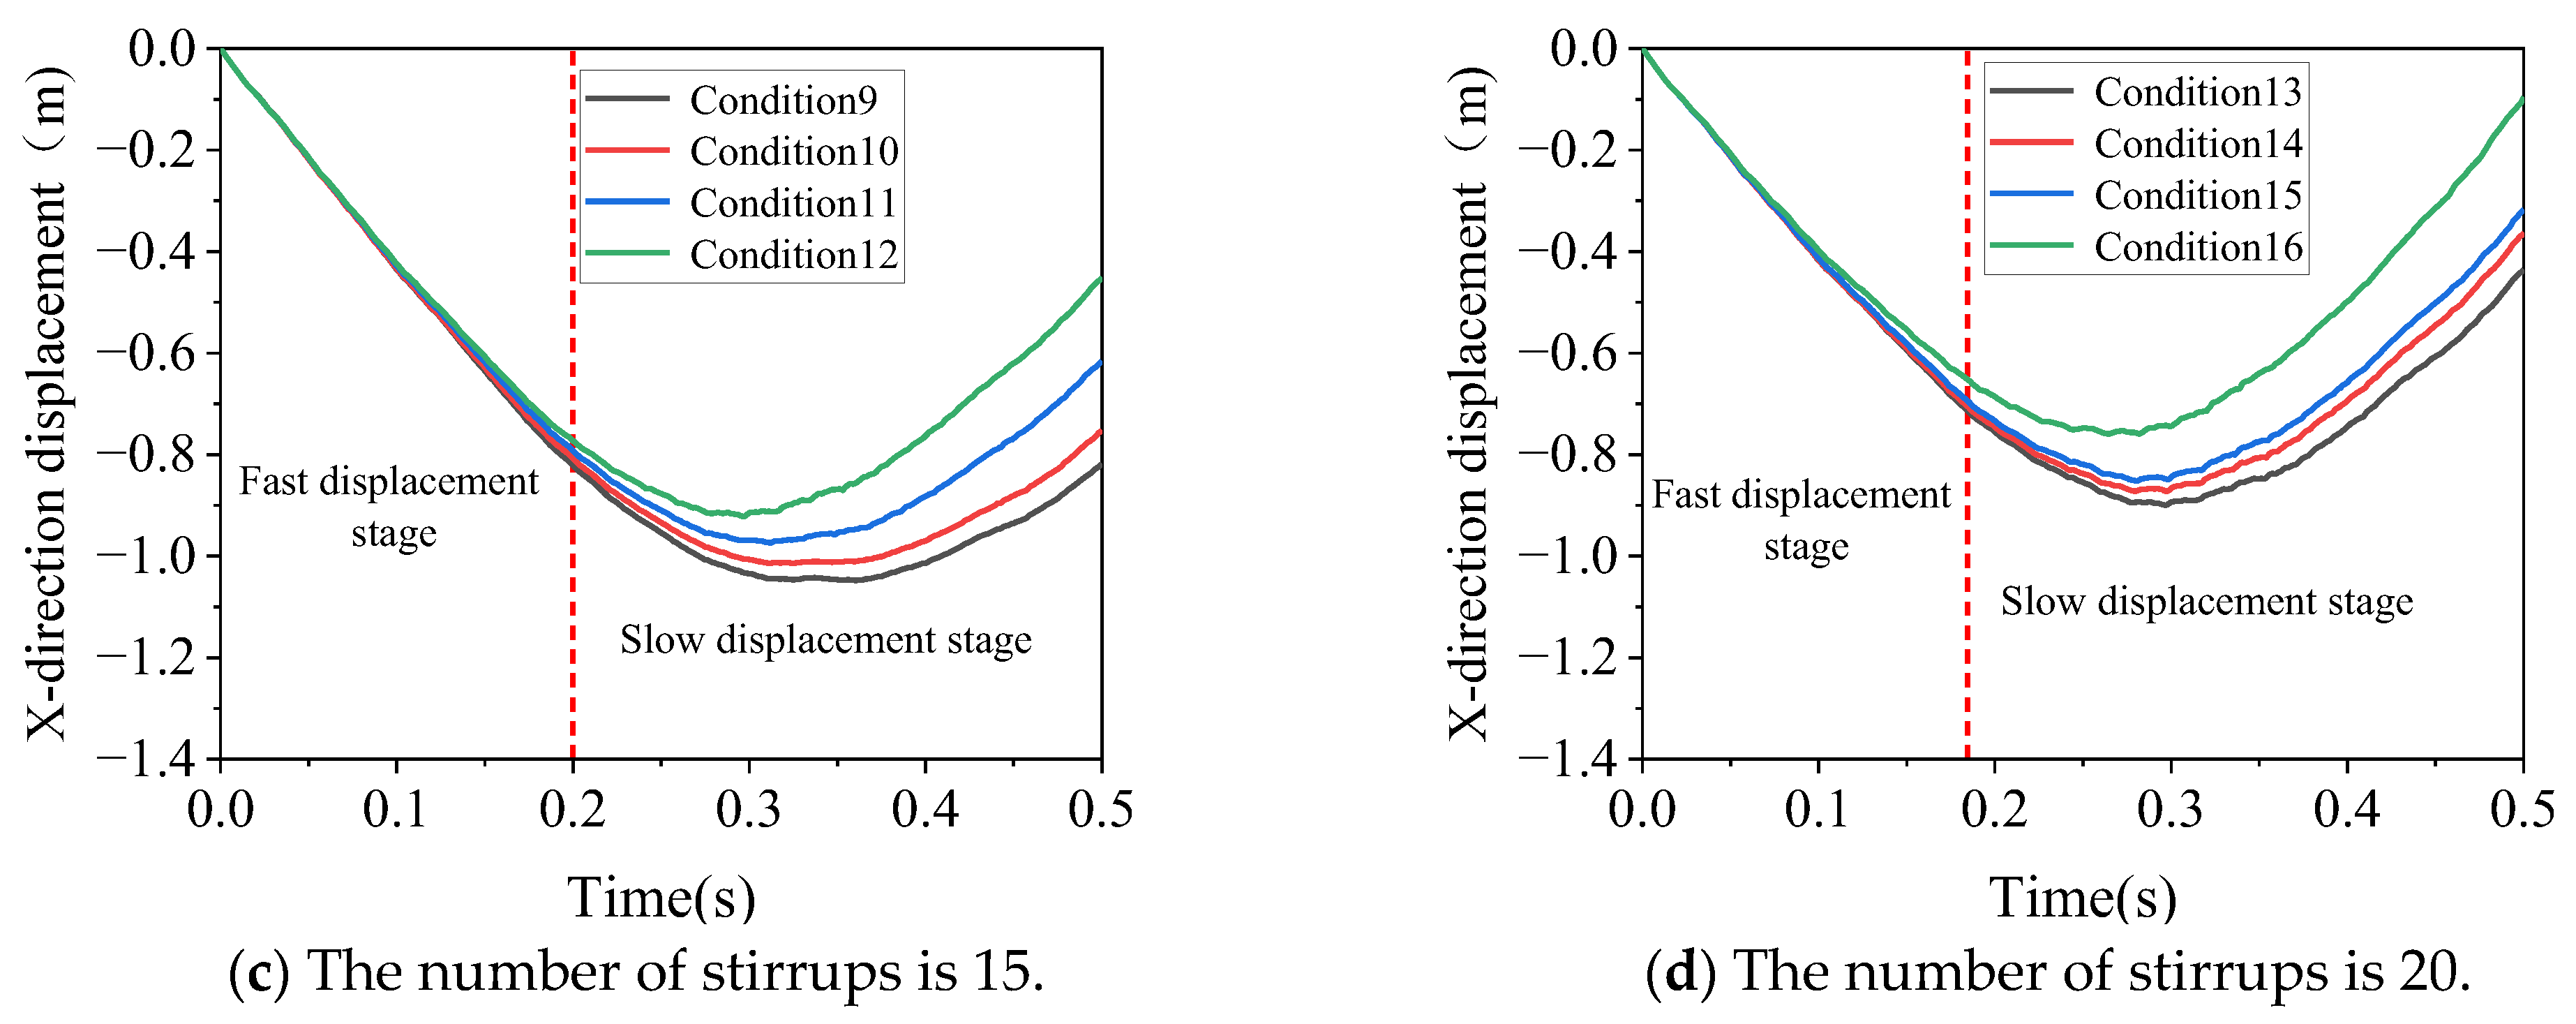
Lateral Displacement of the Train

The displacement–time curve of the locomotive under various operating conditions is also analyzed to illustrate the train’s displacement. For the convenience of comparison, the working conditions of the same stirrup are presented in a single image. From Figure 9, it can be observed that the lateral displacement of the train initially increases, then stabilizes around a certain value, and finally exhibits a decreasing trend. This indicates that the lateral movement of the train stops after reaching a certain value, stabilizing within a specific range. There is also a tendency for reverse movement, demonstrating that the crash barrier in this operational state effectively intercepts derailed trains.

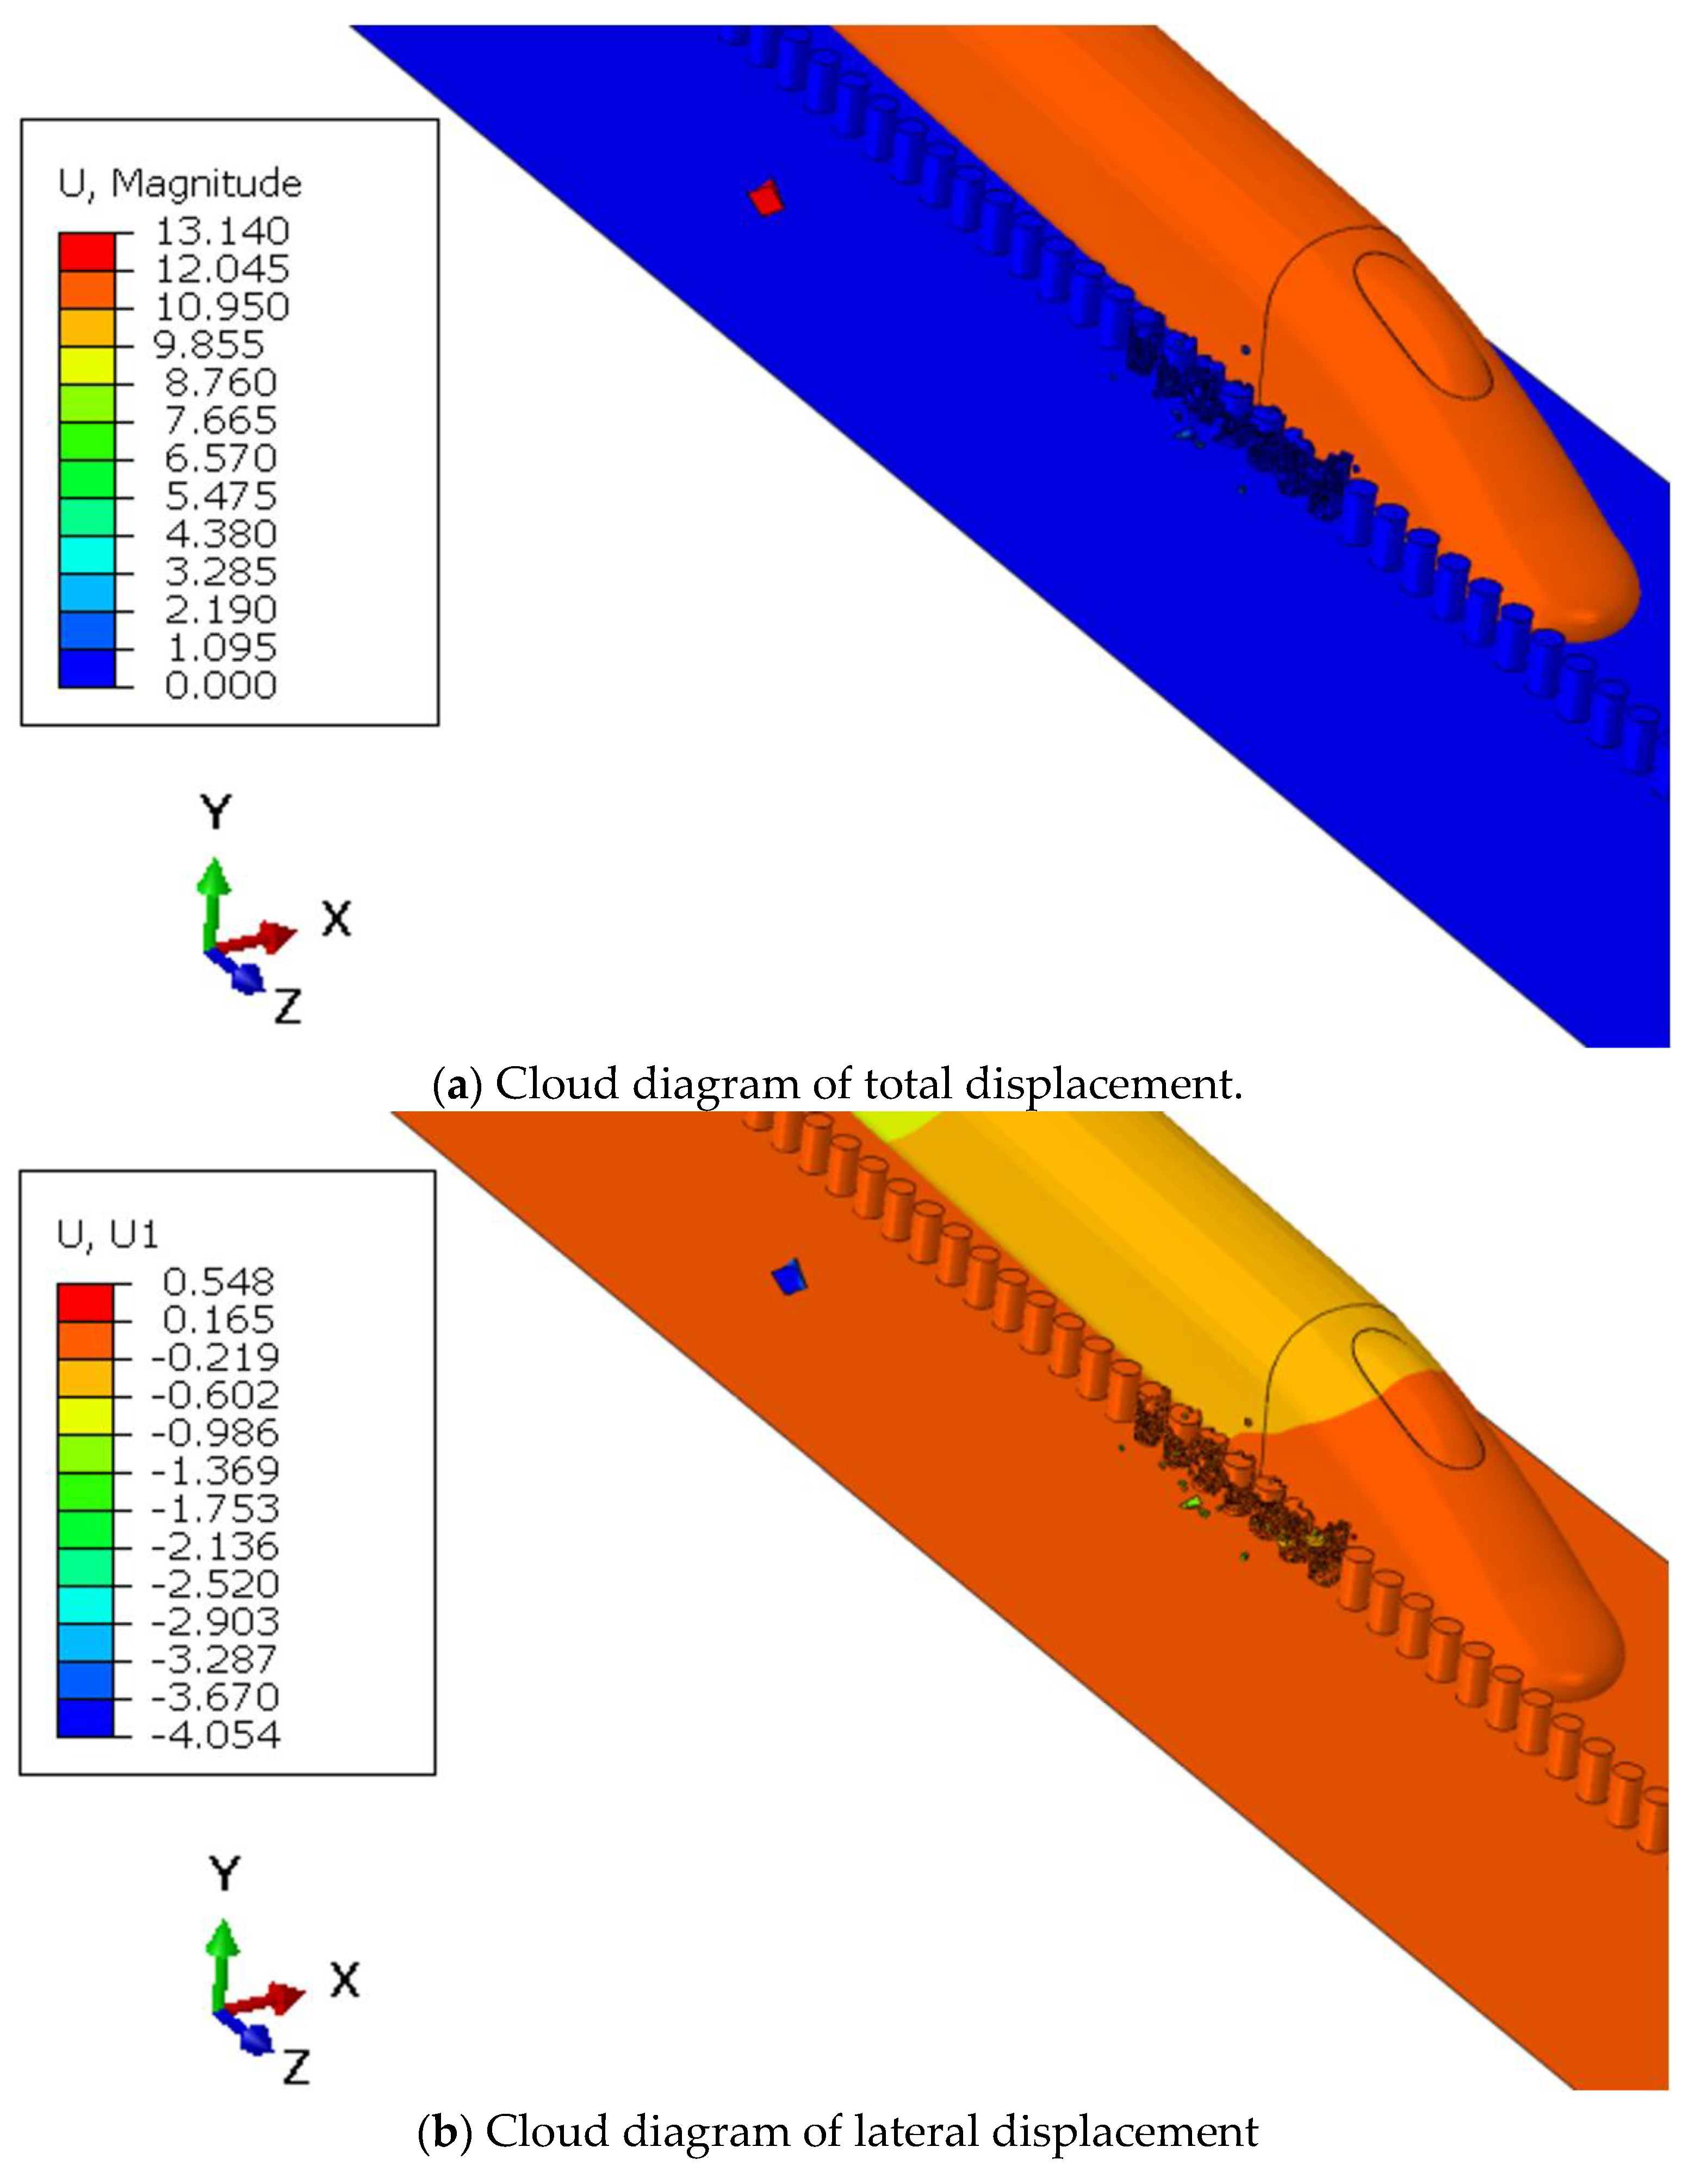
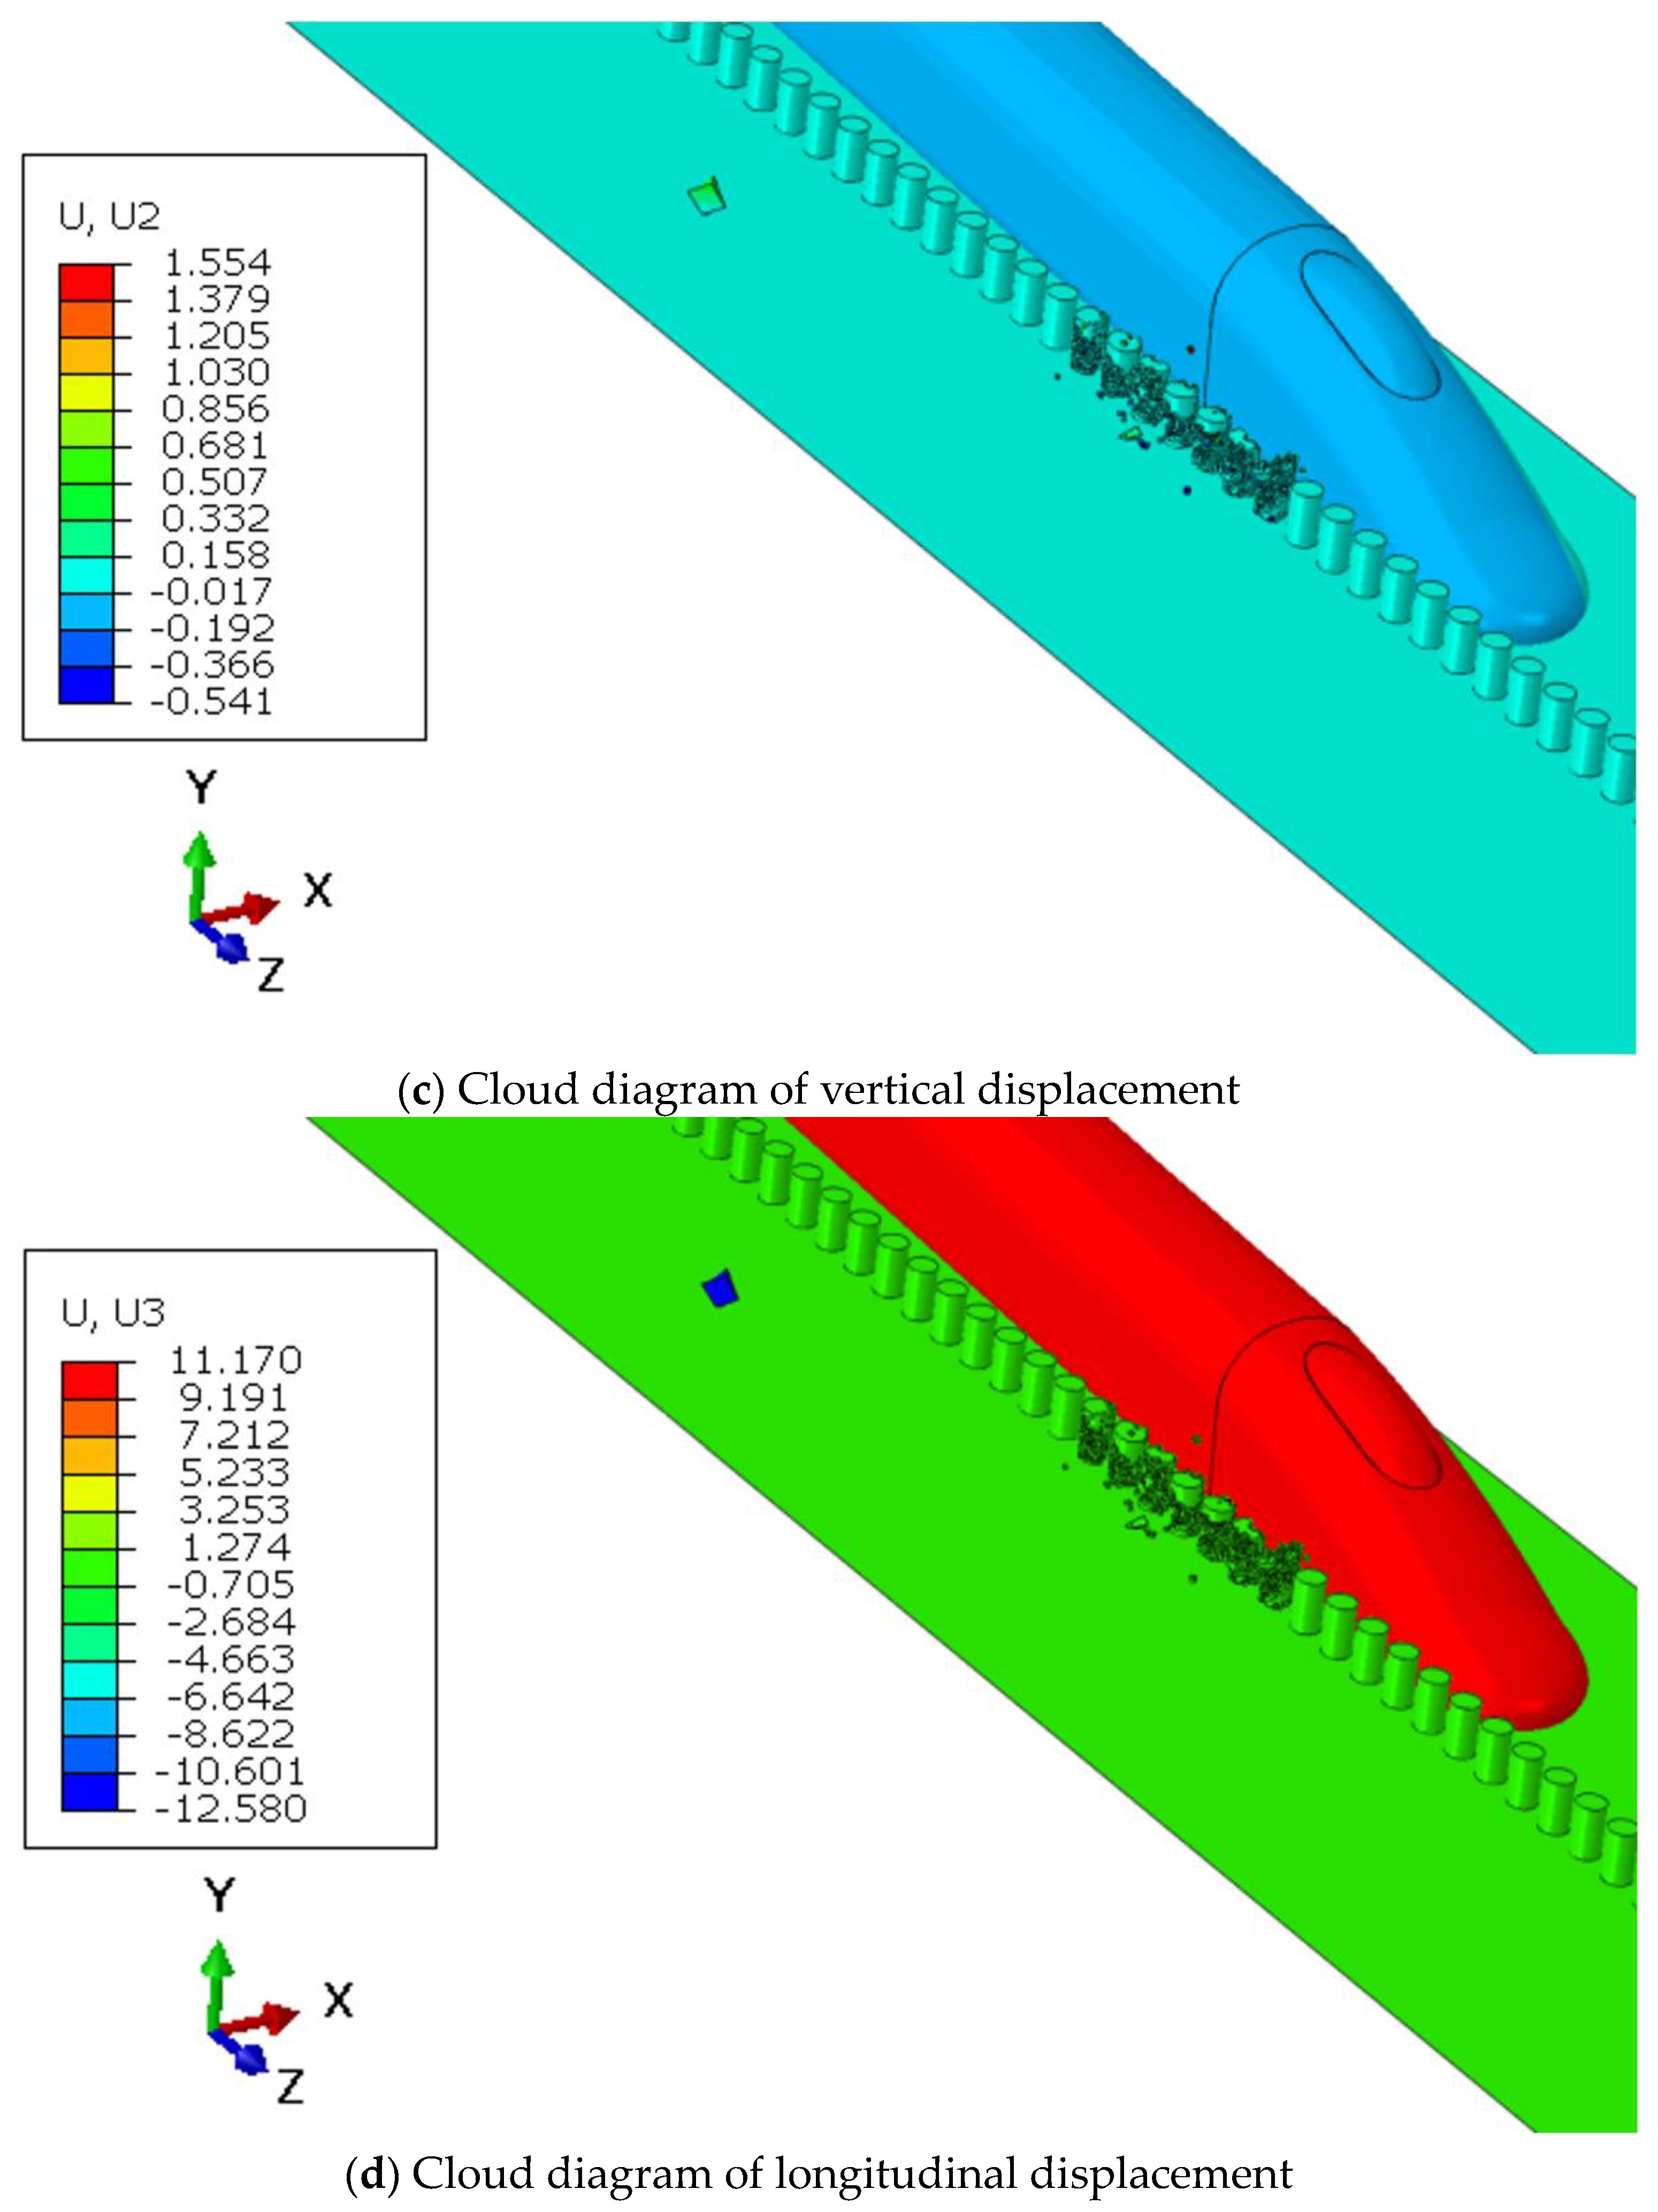
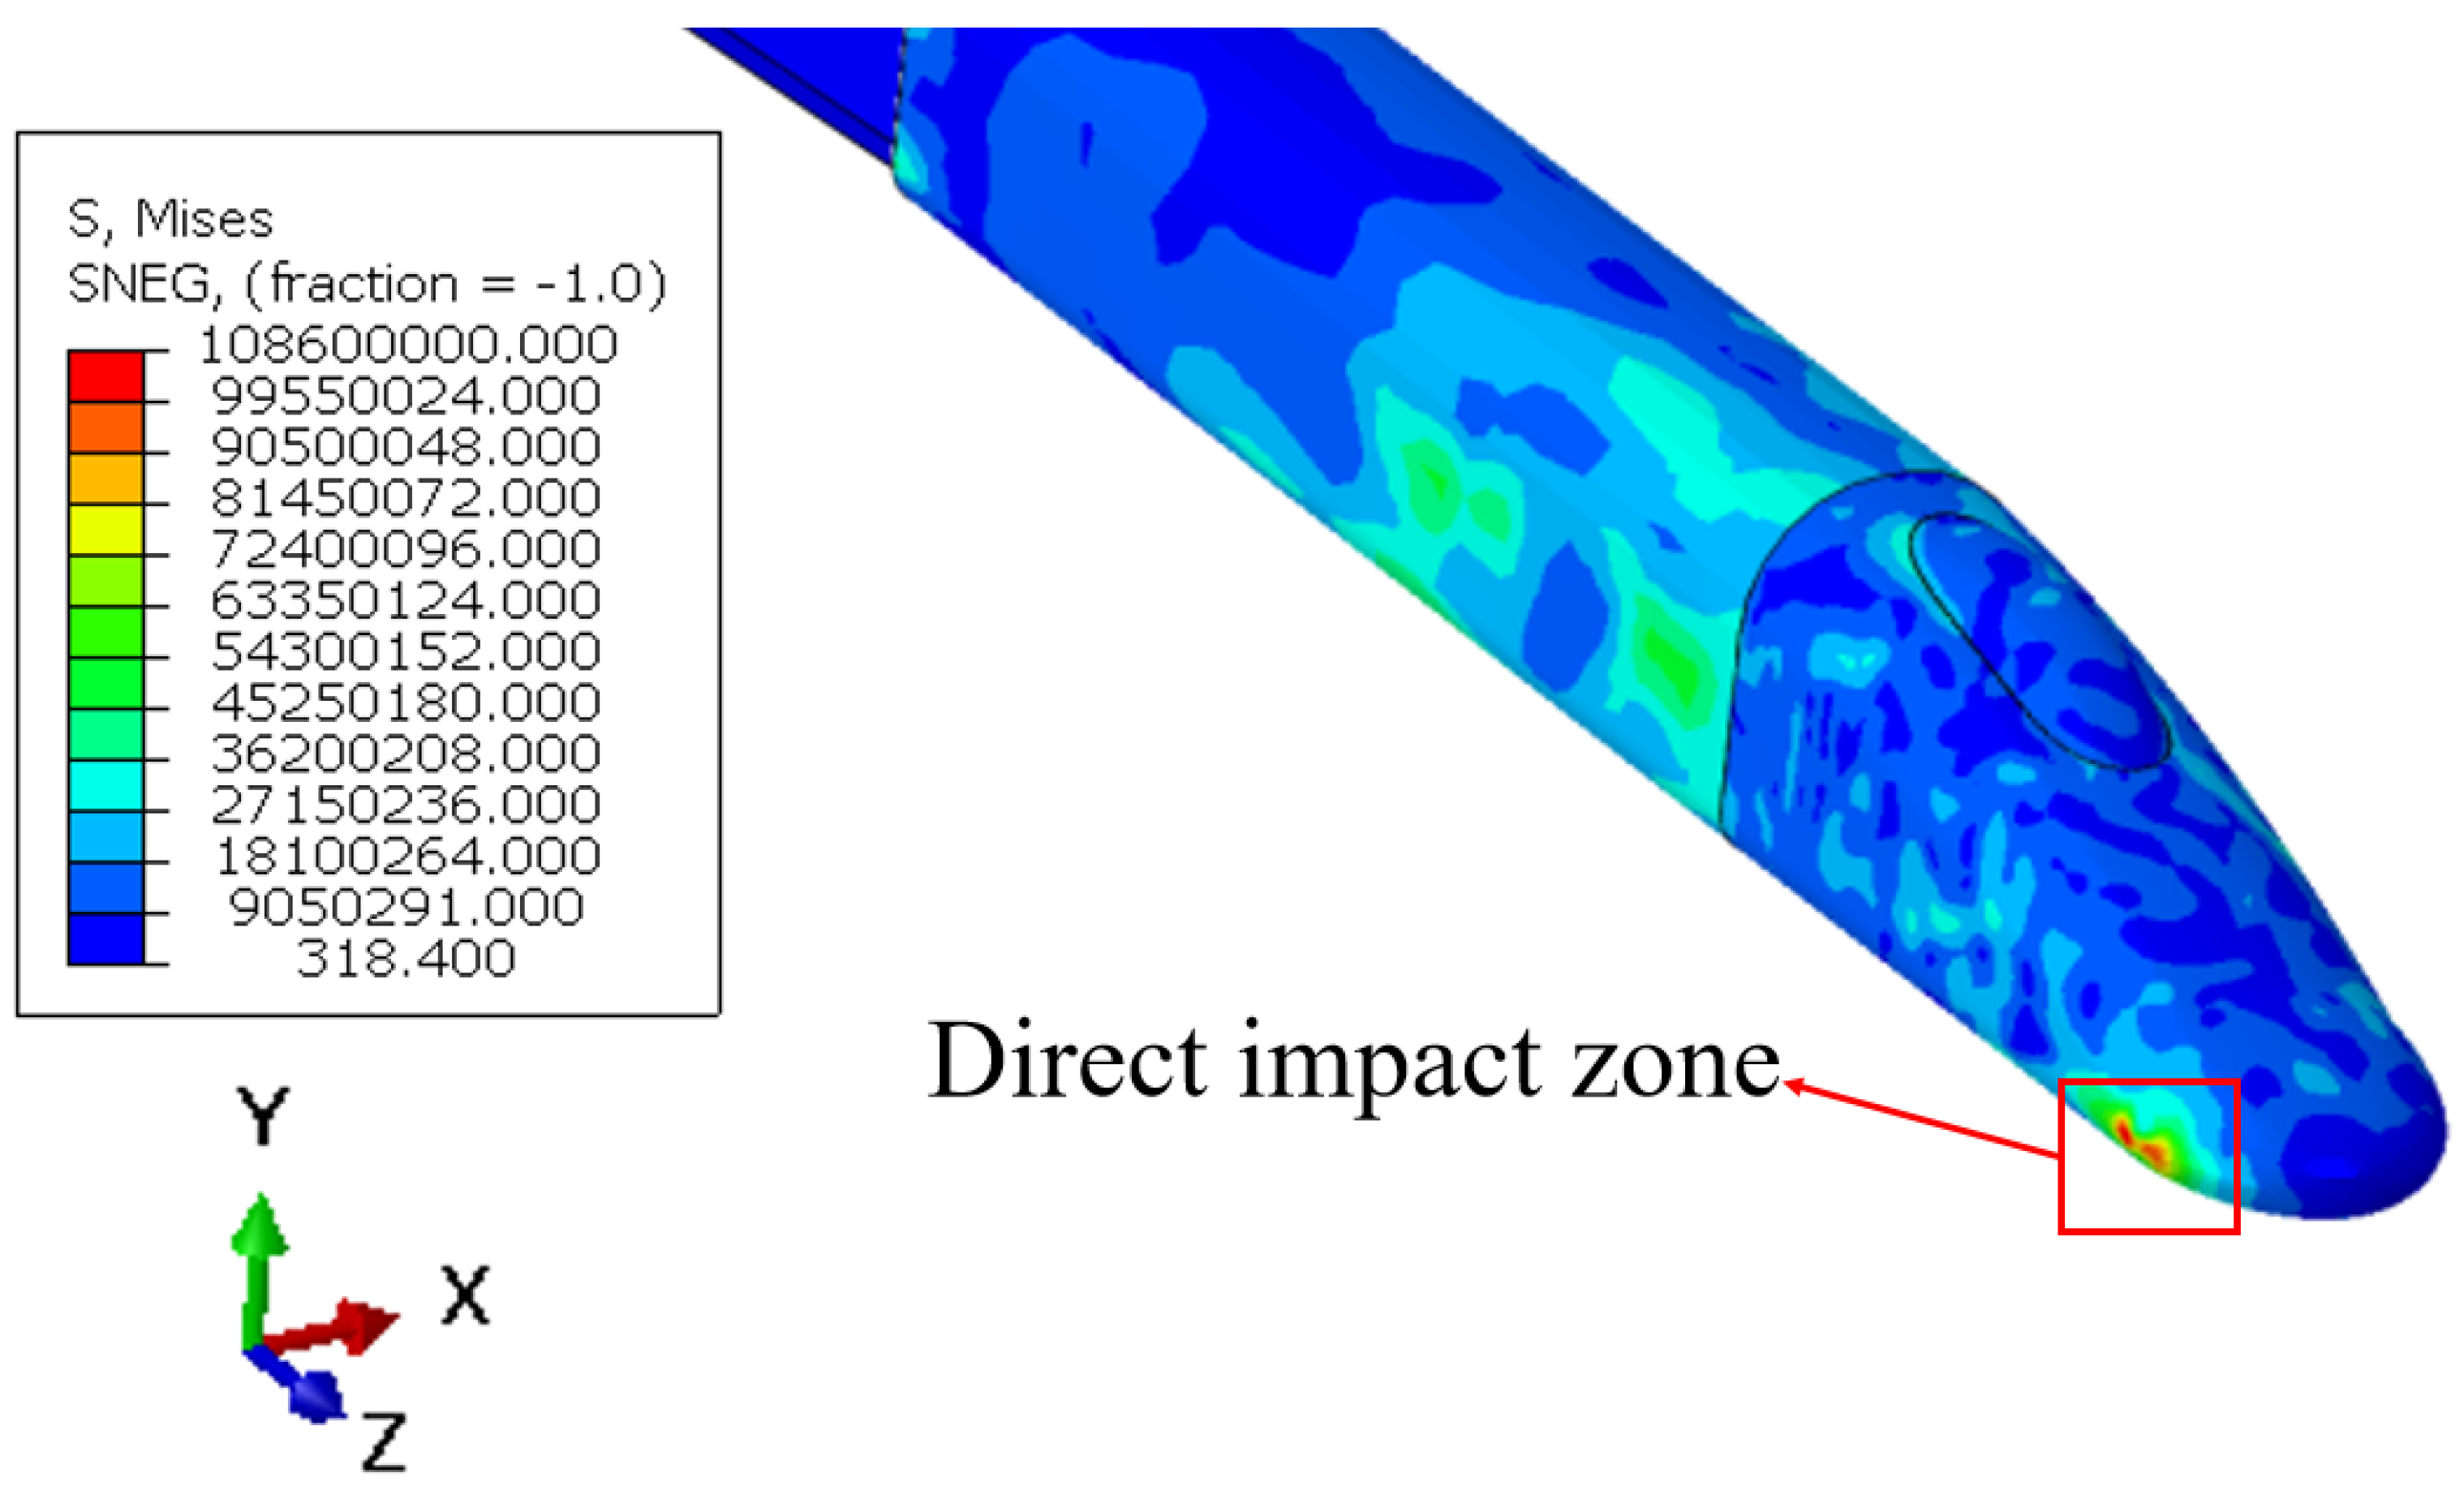
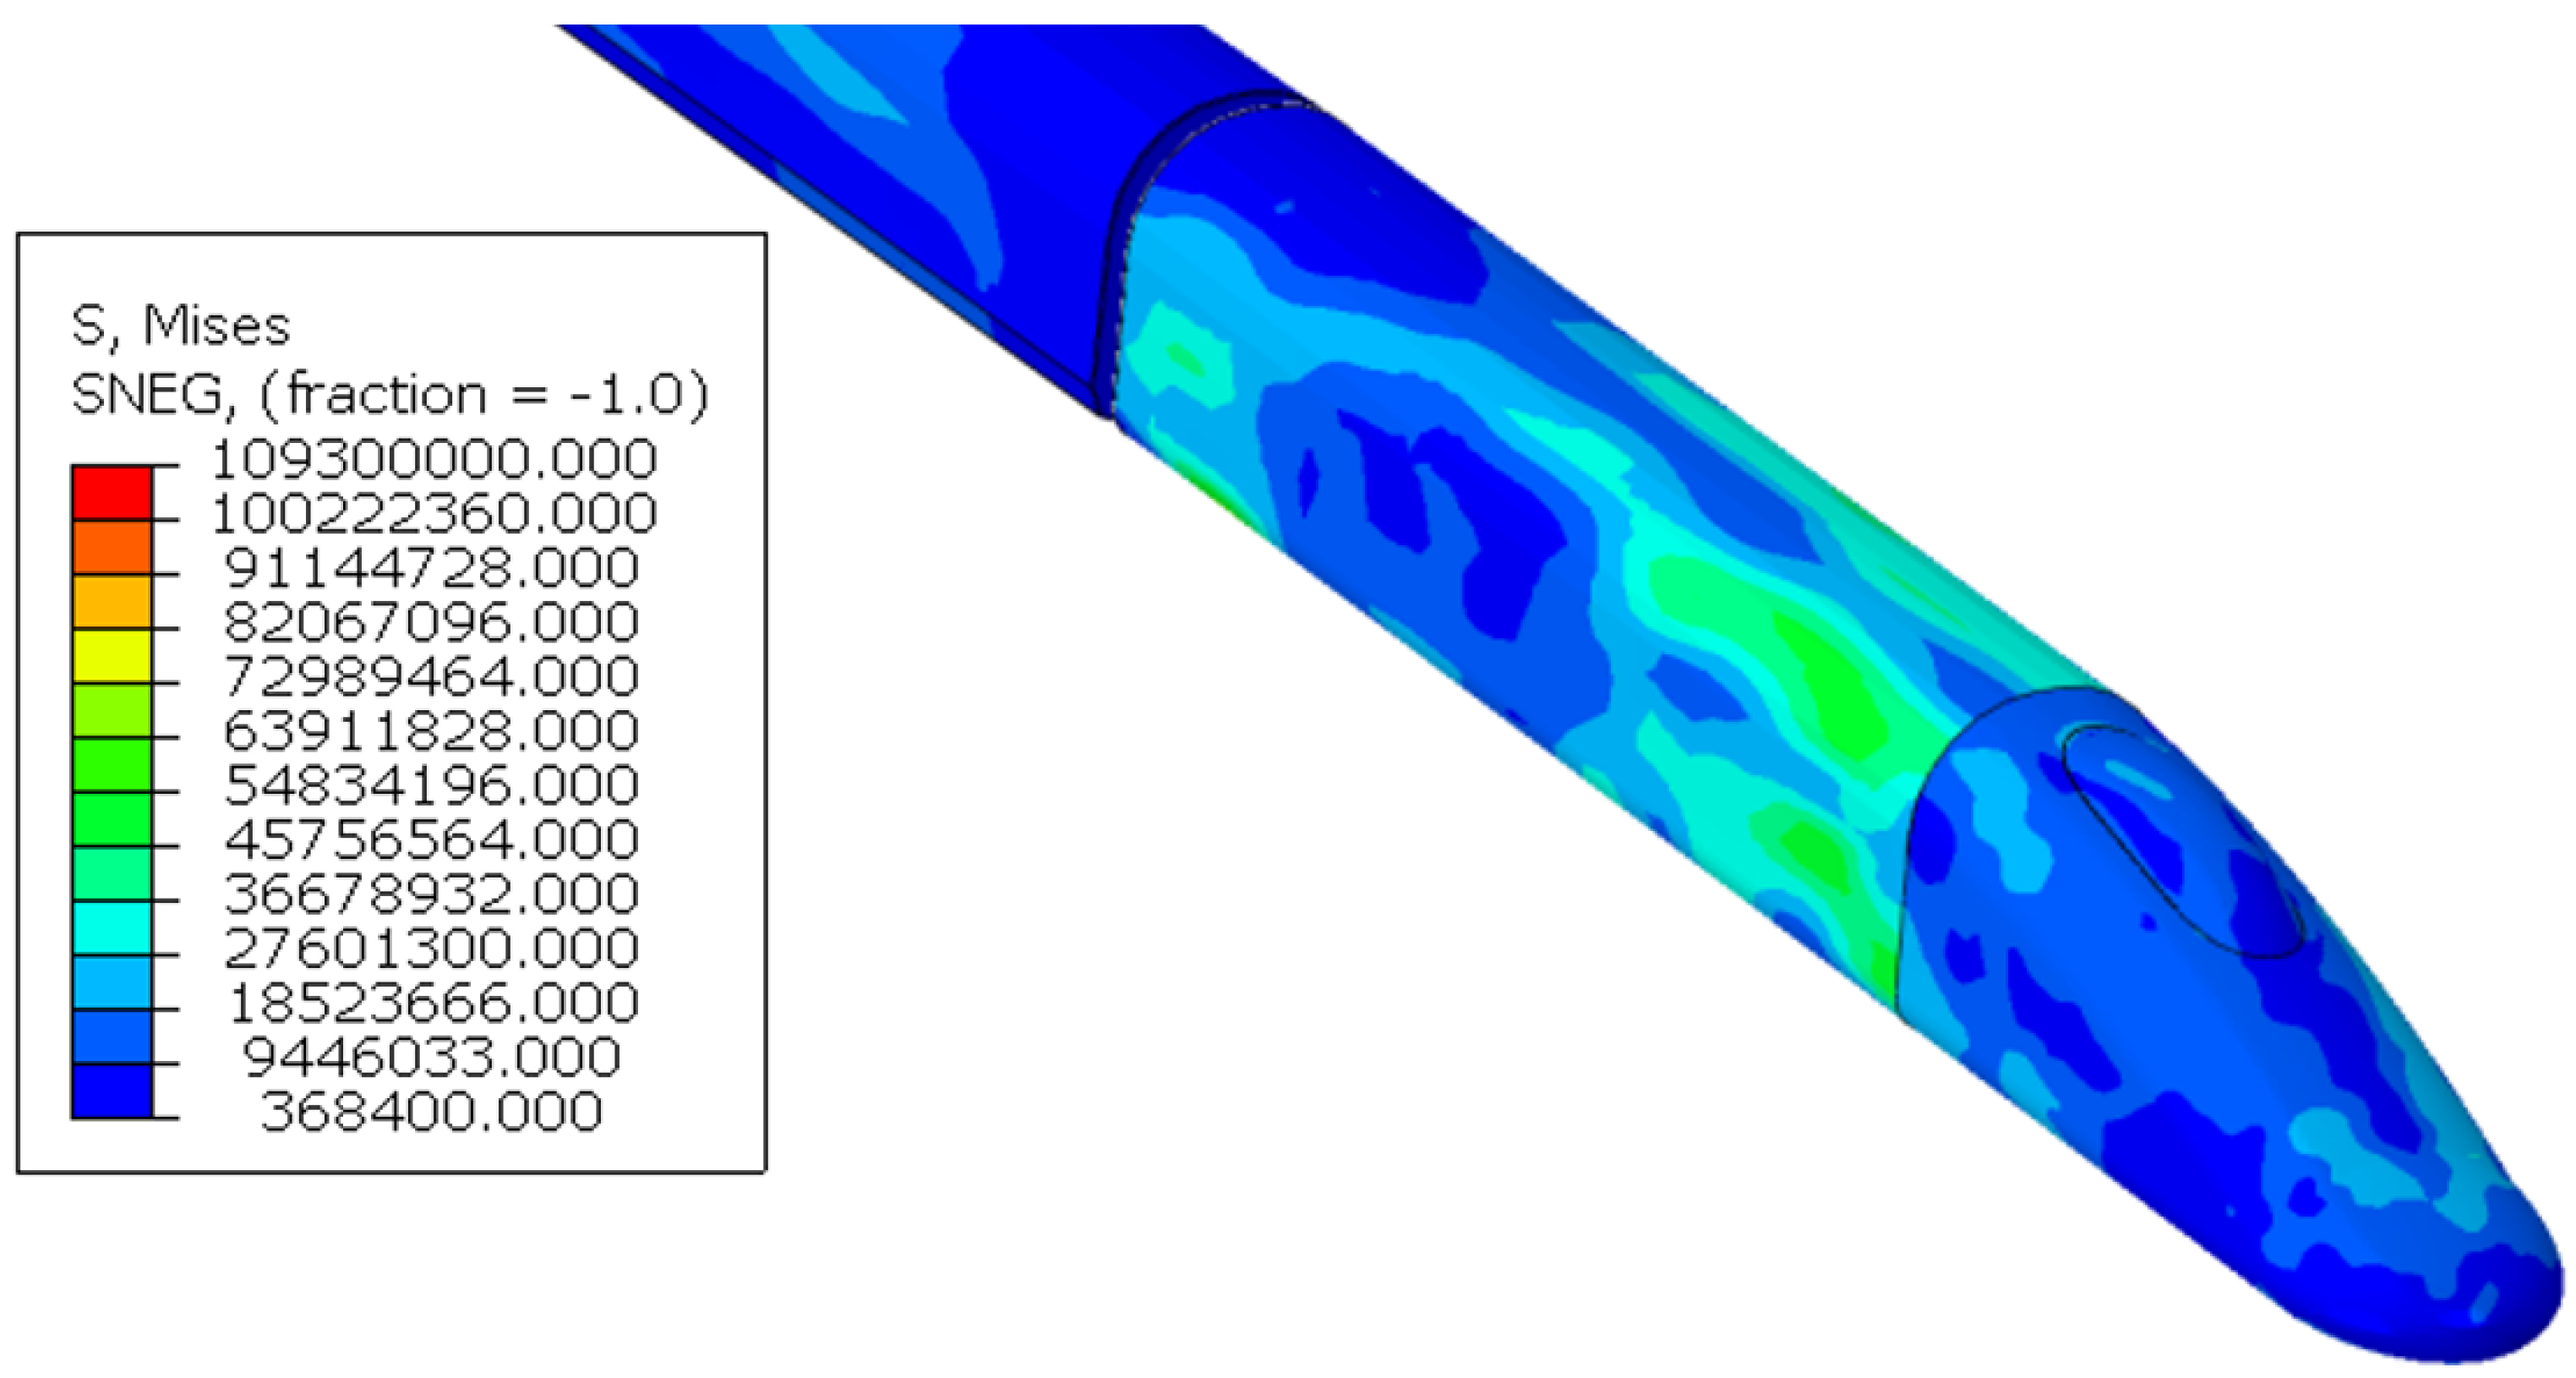
3.2. The Deformation Characteristics of the Train

In the process of a train collision, many large deformations and highly nonlinear dynamic problems are involved. The train collision process involves various types of nonlinear behavior characteristics, such as material nonlinearity, geometric nonlinearity, and dynamic boundary nonlinearity, primarily influenced by contact friction but that is not all. A train collision is not simply a single collision problem; it also involves the interaction and collision between train carriages. Therefore, it is necessary to analyze the deformation characteristics, energy conversion relationships, and dynamic responses of trains during collisions to provide a theoretical basis for subsequent research.
Figure 10 illustrates the train’s transformation before and after the collision. The analysis focused on the attitude changes at 0.05 s, 0.1 s, 0.15 s, and 0.2 s post-impact. It was observed that the front of the train experienced the most significant deformation at 0.2 s. Additionally, the degree of deformation decreased as the distance from the point of collision increased, with the rear vehicle showing minimal deformation. This demonstrates that not only does the head directly participate in the collision process, but the subsequent vehicles also indirectly participate in the collision process due to the connection effect of the coupler buffer device and the “stacking effect” of the subsequent vehicles on the head. However, this “stacking effect” also has a certain range of influence. In a certain distance, the “stacking effect” caused by impact gradually weakens as the distance increases. In this simulation, the “stacking effect” caused by the impact is mainly concentrated in the first four carriages, while the rear carriages are mostly unaffected.
The overall displacement state of the train during the collision is analyzed below. Figure 11 shows the displacement cloud diagram of the train in all directions during the collision at 0.2 s. As can be seen from Figure 11a, the total displacement of the train after the collision is almost the same, with a maximum displacement of 12.04 m. In Figure 11b, the lateral displacement of the front end of the locomotive is smaller than that of the rear end. The crash barrier prevents the front end of the locomotive from undergoing further lateral displacement. Figure 11c illustrates the vertical displacement of the train during the collision, showing minimal vertical movement of the train. Figure 11d illustrates the longitudinal displacement of the train during the collision. The crash barrier has minimal impact on the train’s longitudinal displacement, primarily affecting the lateral displacement. Figure 12 shows the stress cloud diagram of the train at 0.065 s. During the collision process, it can be observed that the area of increased stress is mainly concentrated in the direct impact zone of the head, and it diminishes as it moves towards the rear carriages. Figure 13 displays the stress cloud diagram of the train at 0.2 s, indicating the commencement of stress transfer to the rear carriages.

4. Conclusions

In this paper, a coupled finite element model of a train–crash barrier and tunnel with and without embedded reinforcement is established. By analyzing the resistance action of the crash barrier on the train during impact and studying the stress deformation characteristics, energy variation, and dynamic response of the train, the following conclusions are drawn:
(1)
It has been found that the impact resistance of the crash barrier has greatly improved after embedding steel bars. Under the impact of a crash barrier, the transverse velocity of the train decreases continuously until it reaches 0, then gradually increases to a positive value. In contrast, when there are no embedded steel bars in the crash barrier, the transverse velocity of the train also decreases to 0 but does not reach a positive value. This indicates that during the impact process, the lateral velocity of the train gradually decreases, preventing the train from moving onto other tracks. Instead, the train tends to realign with its original track direction as its speed changes to a positive value. With the increase in stirrup and vertical reinforcement, the rate of change also increases, leading to a significant enhancement of the crash barrier’s anti-impact capability. From the lateral displacement of the train, it can also be observed that after the steel bars are embedded, the train tends to move in the opposite direction. This indicates that the crash barrier effectively intercepts the train.
(2)
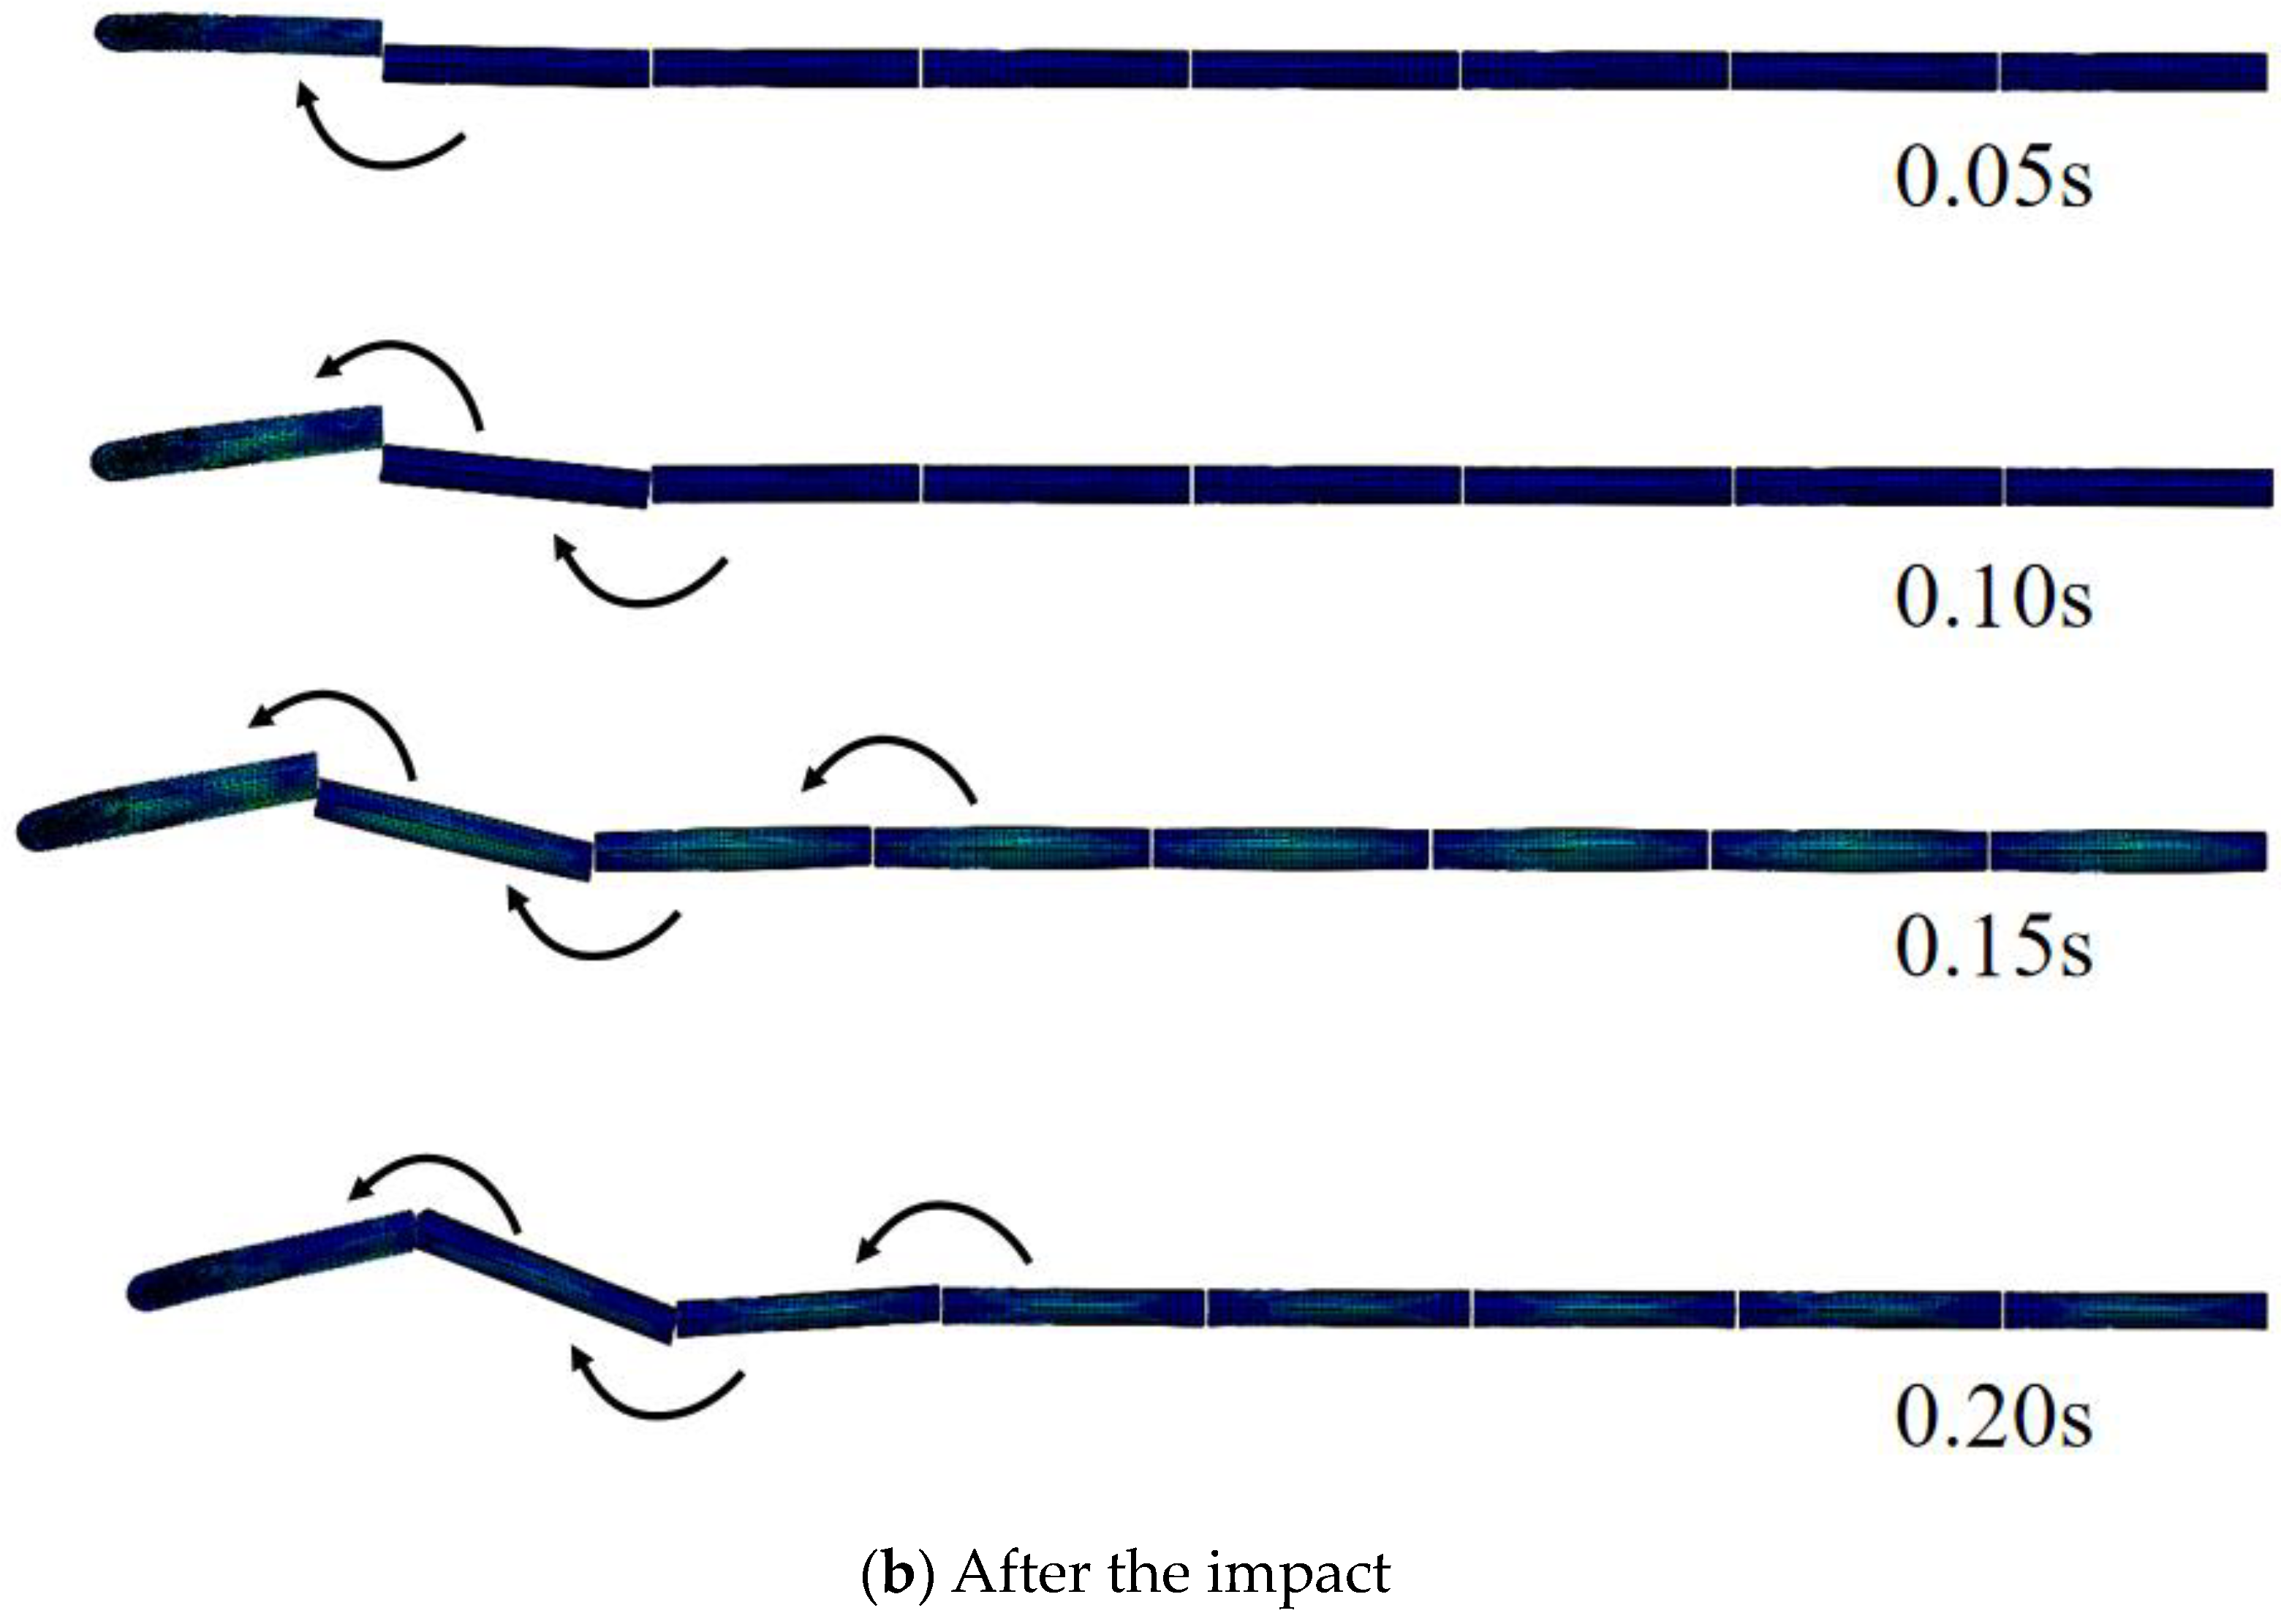
When the train derails, it has a “drag” effect on the adjacent carriages, which leads to the “stacking effect” between the coupler buffer device and the following vehicles. In the process of a collision, not only does the locomotive directly participate but the subsequent vehicles also indirectly participate in the collision process. However, this "stacking effect" also has a certain range of influence. In a certain distance, the "stacking effect" caused by impact gradually weakens as the distance increases. The stress concentration is primarily focused in the impact area, and as it moves towards the rear carriages, the transmission of stress decreases. The plastic deformation area is present in the direct impact zone of the locomotive, whereas it is absent in other parts of the train.
(3)
At present, research on anti-collision measures for train derailment primarily focuses on bridge anti-collision walls, but there is a lack of research on crash barriers within tunnels. The crash barriers installed inside the tunnel proposed in this paper are simpler than the existing anti-collision facilities on the bridge, and they have been proven effective in stopping trains. This can provide valuable insights for the design, structural optimization, and ongoing construction of anti-collision measures in tunnels.

Author Contributions

Conceptualization, K.Q.; Methodology, K.Q.; Software, K.Q.; Formal analysis, G.W.; Investigation, G.W.; Resources, H.M.; Data curation, H.M. and H.Z.; Writing—original draft, G.W.; Writing—review & editing, H.M.; Visualization, G.W.; Project administration, H.Z.; Funding acquisition, H.M. and H.Z. All authors have read and agreed to the published version of the manuscript.

Funding

This research received no external funding.

Institutional Review Board Statement

Not applicable.

Informed Consent Statement

Not applicable.

Data Availability Statement

The data that support the findings of this study are available from the corresponding author upon reasonable request.

Conflicts of Interest

Author Kun Qian was employed by the company China Academy of Railway Sciences Group Co., Ltd.; Author Hongsheng Ma was employed by the company Sichuan Highway Planning Survey Design Institute Co., Ltd.; Author Hailing Zeng was employed by the company Sichuan West Rail Disaster Prevention Technology Co., Ltd. The remaining authors declare that the research was conducted in the absence of any commercial or financial relationships that could be construed as a potential conflict of interest.

References

  1. Choe, T.; Kim, J.; Shin, M.; Kim, K.; Kim, M. Complex disaster response framework to reduce urban disaster vulnerability. Sci. Prog. 2023, 106, 00368504231152770. [Google Scholar] [CrossRef]
  2. Yang, C.; Tong, X.; Chen, G.; Yuan, C.; Lian, J. Assessment of seismic landslide susceptibility of bedrock and overburden layer slope based on shaking table tests. Eng. Geol. 2023, 323, 107197. [Google Scholar] [CrossRef]
  3. Kim, J.; Park, S.; Kim, M. Safety map: Disaster management road network for urban resilience. Sustain. Cities Soc. 2023, 94, 104650. [Google Scholar] [CrossRef]
  4. Yang, C.; Tong, X.; Wu, D.; Lian, J.; Ding, X. A new model for mechanical calculation of h-type anti-slide piles. Structures 2023, 56, 104891. [Google Scholar] [CrossRef]
  5. Tong, X.; Lian, J.; Zhang, L. Damage evolution mechanism of rock-soil mass of bedrock and overburden layer slopes based on shaking table test. J. Mt. Sci. 2022, 19, 3645–3660. [Google Scholar] [CrossRef]
  6. Lin, C.; Lai, Y.; Wu, S.; Mo, F.; Lin, C. Assessment of potential sediment disasters and resilience management of mountain roads using environmental indicators. Nat. Hazards 2022, 111, 1951–1975. [Google Scholar] [CrossRef]
  7. Tong, X.; Lian, J.; Yang, C.; Zhang, L. Shaking table test on dynamic damage characteristics of bedrock and overburden layer slopes. J. Test. Eval. 2023, 51, 989–1009. [Google Scholar] [CrossRef]
  8. Li, S.H.; Cai, B.G.; Liu, J.; Wang, J. Collision risk analysis based train collision early warning strategy. Accid. Anal. Prev. 2018, 112, 94–104. [Google Scholar] [CrossRef] [PubMed]
  9. Xie, S.; Du, X.; Zhou, H.; Wang, D.; Feng, Z. Analysis of the crashworthiness design and collision dynamics of a subway train. Proc. Inst. Mech. Eng. Part F J. Rail Rapid Transit 2020, 234, 1117–1128. [Google Scholar] [CrossRef]
  10. Baykasoğlu, C.; Sünbüloğlu, E.; Bozdağ, S.E.; Aruk, F.; Toprak, T.; Mugan, A. Railroad passenger car collision analysis and modifications for improved crashworthiness. Int. J. Crashworthiness 2011, 16, 319–329. [Google Scholar] [CrossRef]
  11. Singhal, V.; Jain, S.S.; Anand, D.; Singh, A.; Verma, S.; Kavita; Rodrigues, J.J.P.C.; Jhanjhi, N.Z.; Ghosh, U.; Jo, O.; et al. Artificial Intelligence Enabled Road Vehicle-Train Collision Risk Assessment Framework for Unmanned Railway Level Crossings. IEEE Access 2020, 8, 113790–113806. [Google Scholar] [CrossRef]
  12. Xia, C.Y.; Xia, H.; De Roeck, G. Dynamic response of a train-bridge system under collision loads and running safety evaluation of high-speed trains. Comput. Struct. 2011, 140, 23–38. [Google Scholar] [CrossRef]
  13. Li, Y.; Deng, J.; Wang, B.; Yu, C. Running Safety of Trains under Vessel-Bridge Collision. Shock Vib. 2015, 2015, 252574. [Google Scholar] [CrossRef]
  14. Yu, Y.; Gao, G.; Guan, W.; Liu, R. Scale similitude rules with acceleration consistency for trains collision. Proc. Inst. Mech. Eng. Part F J. Rail Rapid Transit 2018, 232, 2466–2480. [Google Scholar] [CrossRef]
  15. Hung, C.; Suda, Y.; Aki, M.; Tsuji, T.; Morikawa, M.; Yamashita, T.; Kawanabe, T.; Kunimi, T. Study on detection of the early signs of derailment for railway vehicles. Veh. Syst. Dyn. 2010, 48 (Suppl. S1), 451–466. [Google Scholar] [CrossRef]
  16. Liu, X.; Saat, M.R.; Barkan, C.P.L. Analysis of Causes of Major Train Derailment and Their Effect on Accident Rates. Transp. Res. Rec. 2012, 2289, 154–163. [Google Scholar] [CrossRef]
  17. Reznikov, D.O. Development of multilevel models for assessment of risk of train derailment. IOP Conf. Ser. Mater. Sci. Eng. 2021, 1023, 012024. [Google Scholar] [CrossRef]
  18. Martey, E.N.; Attoh-Okine, N. Analysis of train derailment severity using vine copula quantile regression modeling. Transp. Res. Part C 2019, 105, 485–503. [Google Scholar] [CrossRef]
  19. Friesen, U.; Herden, M.-O.; Kreisel, N.; Herrmann, T.; Götz, G.; Dongfang, S.; Hecht, M. Bogie-monitoring technology: Extending the detection of derailments to cover applications with slab tracks. Proc. Inst. Mech. Eng. Part F J. Rail Rapid Transit 2018, 232, 2385–2391. [Google Scholar] [CrossRef]
  20. Kaewunruen, S.; Wang, Y.; Ngamkhanong, C. Derailment-resistant performance of modular composite rail track slabs. Eng. Struct. 2018, 160, 1–11. [Google Scholar] [CrossRef]
  21. Tanabe, M.; Goto, K.; Watanabe, T.; Sogabe, M.; Wakui, H.; Tanabe, Y. An efficient contact model for dynamic interaction analysis of high-speed train and railway structure including derailment during an earthquake. Int. J. Transp. Dev. Integr. 2017, 1, 540–551. [Google Scholar] [CrossRef]
  22. Burgelman, N.; Li, Z.; Dollevoet, R. Fast estimation of the derailment risk of a braking train in curves and turnouts. Int. J. Heavy Veh. Syst. 2016, 23, 213–229. [Google Scholar] [CrossRef]
  23. Costa Mariana, A.; Costa João, N.; Andrade António, R.; Jorge, A. Combining wavelet analysis of track irregularities and vehicle dynamics simulations to assess derailment risks. Veh. Syst. Dyn. 2023, 61, 150–176. [Google Scholar] [CrossRef]
  24. Kamoshita, S.; Umehara, Y.; Suzuki, M.; Tadashi, I.; Hondo, T. Development of the Bogie for Reducing Risk of Derailment. Proc. Mech. Eng. Congr. Jpn. 2019, 2019, F10102. [Google Scholar] [CrossRef]
  25. Chellaswamy, C.; Geetha, T.S.; Surya Bhupal Rao, M.; Vanathi, A. Optimized Railway Track Condition Monitoring and Derailment Prevention System Supported by Cloud Technology. Transp. Res. Rec. 2021, 2675, 346–361. [Google Scholar] [CrossRef]
  26. Yan, Q.; Li, B.; Zhang, M.; Chen, C. Protective Effect of Secondary Lining of Shield Tunnel on Segment Lining under Derailment impact at the Speed of 200 km·h−1. China Railw. Sci. 2014, 35, 70–78. [Google Scholar]
  27. Xiang, J.; Gong, K.; Mao, J.H.; Zeng, Q.Y. Analysis on the Running Safety of High-speed Train and the Force of Bridge Collision-proof Wall. J. China Railw. Soc. 2011, 33, 83–87. [Google Scholar]
  28. Wu, B.; Wang, Y. On Transverse Reinforcement based on Computation Checking of Transverse Crash Strength of Bridge Flange Slab. China Munic. Eng. 2004, 2, 19–20. [Google Scholar]
  29. Gao, G.; Chen, G.; Guan, W.; Wu, Y. Design of elastic-plastic guardrail on the railway bridge and its crash simulation study. J. Railw. Sci. Eng. 2019, 16, 121–128. [Google Scholar]
  30. Wang, N.; Ma, W. Influence of spring stiffness and damping coefficient of automatic coupler on the longitudinal dynamics of train. Railw. Locomot. Mot. Car 2010, 9, 1–3+55. [Google Scholar]
  31. GB50010-2010; Code for Design of Architecture & Concrete Structures. Architecture & Building Press: Beijing, China, 2010. (In Chinese)
Figure 1. Dynamic contact train–crash barrier–tunnel coupling impact model.
Sustainability 16 03147 g001
Figure 2. Integral grid model of crash barrier embedded with steel bars.
Sustainability 16 03147 g002
Figure 3. Internal diagram of crash barrier embedded with steel bars.
Sustainability 16 03147 g003
Figure 4. Surrounding rock model and grid division.
Sustainability 16 03147 g004
Figure 5. Velocity–time curve during impact.
Sustainability 16 03147 g005
Figure 6. Displacement–time curve in the X-direction during impact.
Sustainability 16 03147 g006
Figure 7. Velocity–time curve of the train in different working conditions.
Sustainability 16 03147 g007
Figure 8. Comparison of the crash barrier with and without embedded reinforcement bars.
Sustainability 16 03147 g008
Figure 9. Displacement–time curve in the X-direction in different working conditions.
Sustainability 16 03147 g009aSustainability 16 03147 g009b
Figure 10. Deformation attitude of train after the impact (schematic diagram).
Sustainability 16 03147 g010aSustainability 16 03147 g010b
Figure 11. Cloud diagram of train displacement in all directions.
Sustainability 16 03147 g011aSustainability 16 03147 g011b
Figure 12. Cloud diagram of train impact stress (0.065 s).
Sustainability 16 03147 g012
Figure 13. Cloud diagram of train impact stress (0.2 s).
Sustainability 16 03147 g013
Table 1. Train material parameters.
Material Type Modulus of Elasticity/MPaPoisson RatioDensity/(kg/m3)Yield Strength/MPa
Aluminum alloy70,0000.302700225
Fiber-reinforced plastic (FRP)84000.401600150
Table 2. Plastic damage parameters of crash barrier under compression.
Yield Stress/MPa Inelastic Strain Damage ParametersInjury Strain
26.891995000
38.4550.0006551120.2086660.000655112
34.9967040.0010947550.3092870.001094755
28.6924590.0016155050.4200160.001615505
23.0056540.0021185180.5135880.002118518
18.6397610.0025837160.5867910.002583716
15.4013910.0030166180.6433770.003016618
12.9853510.0034259350.6875650.003425935
9.7246960.0041993730.7510140.004199373
6.315210.0056560520.8242670.005656052
3.6236650.0084460820.8900160.008446082
1.7842250.014837690.9415180.01483769
Table 3. Tensile plastic damage parameters of crash barrier.
Yield Stress/MPaCracking StrainDamage ParametersCracking Strain
3.423939000
3.2576970.00002859120.1254662.85912 × 10−5
2.701560.0001052410.3497360.000105241
2.1694530.0001812010.4953450.000181201
1.5613940.0003200910.6504230.000320091
1.0450340.0005778550.7784590.000577855
0.6758970.0010742690.8671850.001074269
0.4307030.0020523170.9228390.002052317
0.2722940.0039961130.9559440.003996113
0.1713340.0078662980.9750750.007866298
0.1076510.015558140.9859490.01555814
0.0678760.030764170.9920650.03076417
Table 4. Working conditions of different combinations.
Working ConditionDiameter of Reinforcement (mm)Number of Vertical ReinforcementsReinforcement Ratio (%)Stirrup Radius (m)Stirrup Number
11080.22240.255
210160.44480.255
310240.66720.255
410320.88960.255
51080.22240.2510
610160.44480.2510
710240.66720.2510
810320.88960.2510
91080.22240.2515
1010160.44480.2515
1110240.66720.2515
1210320.88960.2515
131080.22240.2520
1410160.44480.2520
1510240.66720.2520
1610320.88960.2520
Disclaimer/Publisher’s Note: The statements, opinions and data contained in all publications are solely those of the individual author(s) and contributor(s) and not of MDPI and/or the editor(s). MDPI and/or the editor(s) disclaim responsibility for any injury to people or property resulting from any ideas, methods, instructions or products referred to in the content.

