Article

Simulation and Forecasting Study on the Influential Factors of PM2.5 Related to Energy Consumption in the Beijing–Tianjin–Hebei Region

School of Management, China University of Mining and Technology (Beijing), Beijing 100083, China
*
Author to whom correspondence should be addressed.
Sustainability 2024, 16(8), 3152; https://doi.org/10.3390/su16083152
Submission received: 15 March 2024 / Revised: 7 April 2024 / Accepted: 8 April 2024 / Published: 10 April 2024

Abstract

:
It is still necessary to regularly investigate the breakdown of socio-economic elements as a starting point for analyzing the effects of diverse human production activities on PM2.5 intensity from industrial and regional viewpoints. In this paper, the emission factor model was adopted to measure PM2.5 emissions in the Beijing–Tianjin–Hebei (BTH) region at the regional and industrial levels. The logarithmic mean Divisia index (LMDI) decomposition model was employed to analyze the factors affecting PM2.5 emissions related to energy consumption in the BTH region at the regional and sectoral levels. Building on this foundation, a system dynamics (SD) model was established to make a prediction regarding PM2.5 pollution in the BTH region in 2025. This study found that secondary industry was a major source of PM2.5 emissions in the BTH region. Coal remained the main form of energy consumption in the BTH region. Secondly, the effect size of the factors affecting PM2.5 intensity ranked in the order of energy intensity, energy structure, and industrial structure. Thirdly, in 2025, PM2.5 emissions in the BTH region will decline appreciably, but there is still a certain gap in terms of meeting the targets of “the 14th Five-Year Plan” between the three provinces and cities. These results indicate that the BTH region should achieve the effective management of PM2.5 pollution at the source through the following initiatives: it is necessary to carry out the continuous adjustment of energy structures to gradually increase the proportion of clean energy; we must steadily promote the decline in energy intensity reduction, and gradually strengthen scientific and technological innovation; and we must continue to promote the optimization of the industrial structure and increase the proportion of tertiary industry every year.

1. Introduction

The environment has been seriously damaged by rapid economic and industrial development. Atmospheric pollution, specifically PM2.5 pollution, has become a critical environmental issue affecting the green and sustainable development of human society [1]. The fraction of exceedance days in which PM2.5 is the principal pollutant is still high, despite China having met the nine ecology- and environment-related binding targets of “the 13th Five-Year Plan” in 2020. PM2.5 had the highest number of exceedance days compared to other pollutants, accounting for 6.8 percent of the total number of days. At the same time, PM2.5 as the primary pollutant accounted for 51 percent of the exceedance days of all pollutants and 77.7 percent of the exceedance days for all pollutants above the severe level. PM2.5 pollution is more harmful than the other five pollutants, which are PM10, O3, NO2, SO2, and CO [2]. The fine granular matter known as PM2.5 has an aeronautical corresponding diameter of less than 2.5 μm. In terms of initial forms, PM2.5 consists of water-soluble inorganic ions, organic carbon (OC), elemental carbon (EC), and heavy metals [2]. These precursors can cause serious harm to human health and may lead to respiratory diseases, cardiovascular and cerebrovascular diseases, immune diseases, tumors, and other illnesses [3]. The World Health Organization (WHO) has stated that human death risks increase by 15% when mean yearly PM2.5 concentrations exceed 35 μg/m3 as opposed to 10 μg/m3 [4]. As a result, the management of PM2.5 pollution has emerged as a key concern in China’s effort to construct an ecological civilization. The significance of the avoidance and integrated management of source pollution is emphasized in “the 14th Five-Year Plan”. Therefore, determining the levels of PM2.5 emissions related to energy consumption, pinpointing the key variables that influence PM2.5 emissions, and effectively controlling PM2.5 pollution have become significant research topics in China.
Source resolution [5,6,7,8], meteorological factors [9,10,11,12,13], and socio-economic factors [14,15,16,17,18] have been the key areas of attention in recent research on the factors that influence PM2.5 emissions. From the standpoint of source apportionment, some papers have used positive definite matrix factorization (PMF) and chemical mass balance modeling (CMB) to study the origin of PM2.5 emissions [19], concluding that coal combustion sources and motor vehicle sources are important factors affecting PM2.5 emissions. Due to regional transmission, the implications regarding PM2.5 sources vary between regions [20,21]. Various meteorological factors, including precipitation, air pressure, temperature, wind speed, and relative humidity, also influence PM2.5 levels, inducing strong regional heterogeneity and seasonal characteristics [22,23]. Socio-economic factors, like population size, economic development, energy consumption, and industrial construction, also contribute to PM2.5 emissions. Studies have indicated that the primary socio-economic determinants determining PM2.5 emissions include population density, economic structure, industrial structure, and energy structure [24,25].
National experts have studied and explored the factors affecting PM2.5 emissions from different perspectives and on varied levels. However, there have been limited exploration activities on the intensity of PM2.5, particularly regarding the socio-economic factors that contribute directly to its generation. Furthermore, the research level has been mostly focused on countries and cities, without paying attention to the level of industrial segmentation. Based on this, the paper focuses on the BTH region, which has the largest economy in northern China and plays a decisive role in green and high-quality development. The object of study is the PM2.5 emissions brought about by the use of fossil fuels. By creating emission factor models, the PM2.5 emissions associated with energy consumption are quantified. The PM2.5 intensity is then divided into the co-driving impacts of energy structure, energy intensity, and industrial structure by using the LMDI factor decomposition model. The trend of PM2.5 emissions in the BTH region and its influencing factors are investigated from an industrial perspective. Based on this, a system dynamics framework is developed to simulate and predict PM2.5 emissions in the BTH region in 2025. The aim is to provide rational recommendations for reducing PM2.5 emissions and improving efficiency in the BTH region.
This study makes the following primary contributions: (1) The primary cause of PM2.5 emissions is the use of fossil fuels. To circumvent the shortcomings of using conventional imagery from satellites and field surveillance data, which are unable to differentiate between regions and industries, an emission factor model was established to measure PM2.5 emissions. (2) We developed a comprehensive LMDI-SD decomposition analysis model to examine and investigate the mechanisms and underlying causes of PM2.5 emissions related to energy consumption in the BTH region. This model will allow researchers to comprehensively elucidate the root reasons behind the variations in PM2.5 emissions. (3) To broaden the scope of the research, the effects of each driver are considered at the industrial level, thus providing research support for the improvement of PM2.5 pollution management strategies in the BTH region.

2. Research Methodology and Data

2.1. Research Methodology

2.1.1. Emission Factor Modeling

The emission factor model is constructed by utilizing PM2.5 energy consumption emission coefficients. This model overcomes the limitations of using conventional spacecraft observation and surface surveillance information, which cannot differentiate between industries and areas. PM2.5 emission situation is measured to explore the emission trend. The resulting emission factor models are listed below:
P M = i , j E i , j × E F i , j × X i × ( 1 η i )
where PM denotes the PM2.5 emissions; i denotes primary, secondary, and tertiary industries, respectively; j denotes energy type; E denotes energy consumption; EF denotes the PM2.5 emission coefficients of each energy variety in each industry; Xi denotes the velocity of dispersion for pollution control technologies in industry sector i; and ηi denotes the effectiveness of disinfection for industrial pollution treatment technologies. By further integrating the PM2.5 emission coefficients of each energy variety, as well as the distribution rate and decontamination efficiency of pollution control technologies, the above equation can be simplified as:
P M = i , j E i , j × E F j
where EFj represents the computed energy emission parameter for PM2.5. The value of EFj is shown in Table 1 [26].

2.1.2. Emission Factor Modeling

Decomposing PM2.5 emissions is made easier with the LMDI decomposition model. The mission intensity of PM2.5 can be measured through the calculation of PM2.5 per unit of GDP in a given country, sector, or industry during a certain period. The expression for this is as follows:
P M I = P M / G D P
where PMI denotes PM2.5 intensity, PM denotes PM2.5 emissions, and GDP denotes gross domestic product [26].
The PM2.5 intensity is broken down as follows:
P M I n = P M n / G D P n = ( P M n / E n ) × ( E n / G D P n ) = ( P M n / E n ) × ( i E i n / i Y i n ) = ( P M n / E n ) × i ( E i n / Y i n ) × ( Y i n / i Y i n ) = P M C n × i E I i n × S Y i n
where n denotes regions; i denotes primary, secondary, and tertiary industries, respectively; E i n and Y i n denote the energy consumption and economic output generated by industry i in region n, respectively; and PMCn denotes the integrated energy emission coefficient of region n. Since the PM2.5 energy emission coefficients of each fossil energy source selected in this study are fixed constants (as shown in Table 1), the change in the value of PMCn can reflect the change in the energy structure of region n. EI i n and SY i n represent the energy intensity and industrial structure of industry i in region n, respectively. Based on the above decomposition, it can be learned that the magnitude of PM2.5 intensity depends on the three driving factors of energy structure, industrial structure, and energy intensity [26].
Using the additive concept of the LMDI factor decomposition model, three drivers and their contribution ratios are used to calculate the change in PM2.5 intensity from cycle t to the main cycle. The formula is as follows:
Δ P M I n , i = Δ P M I n , i p m c + Δ P M I n , i e i + Δ P M I n , i s y = i L ( W n , i τ , W n , i t ) l n ( P M C n , i τ / P M C n , i t ) + i L ( W n , i τ , W n , i t ) l n ( E I n , i τ / E I n , i t ) + i L ( W n , i τ , W n , i t ) l n ( S Y n , i τ / S Y n , i t )
where W n , i t = P M C n , i t × E I n . i t × S Y n , i t , and L ( , ) is a weighting function, which is expressed in the following Equation (6) as:
L ( x , y ) = ( x y ) / ( l n x l n y ) , x y x , x = y
where Δ P M I n , i pmc , Δ P M I n , i e i , and Δ P M I n , s y , respectively, denote the changes in PM2.5 intensity resulting from variations in energy structure, energy intensity, and industrial structure [27]. The change in PM2.5 intensity indicates the difference in PM2.5 intensity in year i compared to the base year. Positive changes imply an increase in PM2.5 intensity, whereas negative changes suggest a decrease in comparison to the base year. Similarly, when a motorist’s change value is smaller than zero, it means that the driver in question is aiding in the reduction in PM2.5 intensity. On the other hand, it can also have a negative effect. A decrease in the intensity of PM2.5 compared to the base year is indicated by a negative change, while a positive change implies an increase.

2.1.3. The LMDI-SD Model

The LMDI-SD model is created by applying the system dynamics modeling technique to the key variables that are strongly linked with each influential component based on the incremental disintegration results obtained from the LMDI factor decomposition model. The modeling concept is shown in Figure 1.
The influential factor system of energy-consumption-related PM2.5 emissions is very complicated. Depending on the LMDI decomposition, the system boundaries are established within four areas: energy structure, energy intensity, industrial structure, and PM2.5 emissions related to energy consumption intensity. Therefore, the model should consist of three subsystems. The first subsystem is factors that influence the energy structure, which reflects the rational allocation of the energy consumption structure. The second subsystem is factors influencing energy intensity, which highlights the impact of technological progress on environmental quality improvement. The third subsystem is factors influencing industrial structure, which indicates the consequences of shifting the focus of industrial development towards the construction of an ecological environment in the context of steady economic development.

2.2. Data Sources

This study focuses on the BTH region. The primary, secondary, and tertiary industries involved are, respectively, “agriculture, forestry, animal husbandry, and fishery”, “industry” and “construction”, as well as “transportation, storage, and postal services”, “wholesale, retail trade, hotels and restaurants” and “others” [27,28,29,30]. The data related to the energy consumption and economic development of each industrial subsector are taken from the China Energy Statistical Yearbook and Statistical Yearbook of Municipalities and Provinces. The time frame for this study is from 2005 to 2020. GDP figures from these years are transformed, using 2005 prices as a constant. The fossil energy category includes coal, petroleum, and natural gas, with coal covering raw coal, washed coal, coal products, coke, coke oven gas, blast furnace gas, and other gases, and petroleum covering crude oil, gasoline, kerosene, diesel fuel, fuel oil, and liquefied petroleum gas, and so on. The discounted standard coal coefficients of various energy sources are determined based on the China Energy Statistics Yearbook 2021 and China GB/T 2589-2008 General Rules for Comprehensive Energy Consumption Calculation.

3. Results and Analysis of PM2.5 Emission Measurement and Decomposition of Influential Factors

3.1. Calculation Results and Analysis of PM2.5 Emission

The PM2.5 emissions related to energy consumption in the BTH region are measured according to the emission factor modeling Equation (2), which is derived on the basis of the elements outlined below:
From the perspective of total emissions, between 2005 and 2013, the overall PM2.5 emissions in the BTH region increased from 879.9 million tons to 1347.4 million tons. Emissions rose annually, with an increase of 53.13%. Since then, except for the plunge in total emissions in 2017, there has been a developmental trend of decreasing yearly. The total level of emissions in 2020 decreased by 11.89% compared with that in 2013. On the contrary, this was an overall increase of 34.93% compared with that in 2005. This shows a developmental trend of increasing emissions in general (Figure 2a,c). This indicates that effective control of PM2.5 pollution was initially achieved against the policy backdrop of the National Action Plan for the Prevention and Control of Air Pollution in 2013–2017 and the Blue-Sky Action Plan in 2018–2020. This reduction was also based on the rapid economic swift economic growth in the BTH region and its significantly higher urbanization pace. However, there is still a gap between current development and the goal of building a modern socialist society with green and high-quality development.
From the perspective of industry types, both the emissions and contribution assessments associated with the primary industry in this area reached a peak in 2012 and then began to decline year by year. Emissions decreased from 22.09 million tons in 2012 to 5.66 million tons in 2020, showing a significant drop of 74.38%. However, the contribution rate only decreased by 1.45 percentage points. The primary industry generates very limited PM2.5 emissions as compared with both secondary and tertiary industries. Therefore, it is not the main factor influencing the shift in PM2.5 emissions within the BTH region. Emissions from the secondary industry rose annually from 2005 to 2013 and from 2017 to 2020, but decreased year by year from 2013 to 2017. The overall developmental trend shows growth, decline, and then growth again. In 2020, there was an increase of 335.9339 million tons compared to 2005, which was a whopping 49.40%. Even though the secondary industry’s share of the rate varied between 2005 and 2017 and increased annually following 2017, it always exceeded 75%. When compared to 2005, the secondary sector’s involvement rate increased by 8.29%, reaching its peak in 2020. Emissions from the tertiary industry roughly showed a developmental trend of growth and then decline. They rose to the highest value in 2016, with an increase of 91.8764 million tons compared to 2005, a total increase of 48.20%. Afterward, emissions from the tertiary industry declined year by year, and in 2020, they fell to the lowest level seen in fifteen years, with a decrease of 25.0879 million tons compared with 2005, marking a total decrease of 13.16%. The tertiary sector’s earnings rate has been varying continuously, although it peaked in 2017 and has since been declining year after year. The contribution of the tertiary sector in 2020 was 9.42% lower than in 2017, while it was 7.72% lower than that seen in 2005 (Figure 2a,b). This suggests that the BTH region, as the largest regional economy in northern China, has mainly seen steady and quick expansion within the local economy due to the development of the industrial sector there, which has resulted in significant increases in PM2.5 emissions during the process. Therefore, the secondary industry is not only an important starting point in terms of promoting economic growth and regional development in the BTH region, but also a major source of pollution that should be focused on in the management of PM2.5 pollution.
From the perspective of energy type, from 2005 to 2020, the BTH region showed an energy usage pattern dominated by coal consumption. Additionally, the lowest percentage of coal-driven PM2.5 emissions related to energy consumption in the BTH region was as high as 89.14%. In 2020, the amount of PM2.5 emissions brought on by the usage of coal increased by 253.8927 million tons compared with that seen in 2005, with a growth rate of 30.81%. However, the contribution rate of PM2.5 emissions caused by coal consumption decreased from 93.64% to 90.7% compared with that of 2005, with a total reduction of 2.86%. The PM2.5 emissions caused by oil consumption increased annually from 2005 to 2012; they then decreased until 2016 before increasing again. In 2020, PM2.5 emissions caused by oil consumption increased by 16.9734 million tons compared with the level of 2005, representing an increase of 35.24%. Its contribution rate fluctuates continuously, and it reached its peak in 2017 with an increase of 2.27% from 2005. PM2.5 emissions caused by natural gas consumption have shown a trend of steady growth over the years, quadrupling to 36.4633 million tons in 2020 compared to 2005. The contribution rate of PM2.5 emissions caused by natural gas consumption has also been showing a rough trend of increasing year-by-year, with an increase of 2.84% in 2020 compared to 2005 (Figure 2c,d). This shows that, although the BTH region is strictly implementing and deeply practicing the five new development concepts, vigorously developing a green economy, accelerating the construction of a green environment that is ecologically pleasant to live in, continuously optimizing and adjusting its energy structure, and accelerating the transition from industrialized to modernized development, coal consumption is still the most important form of energy consumption in this BTH region and occupies a dominant position.

3.2. PM2.5 Intensity Decomposition Results and Analysis

The decomposition of PM2.5 intensity related to energy consumption in the BTH region is based on the LMDI factor decomposition model Equations (4) and (5).
From the perspective of overall decomposition, the three main driving factors, energy structure, industrial structure, and energy intensity, combined to cause PM2.5 intensity in the BTH region to decrease year over year, with a cumulative decrease of 2.5901 in 2020 compared to 2005. The decline in PM2.5 intensity could be attributed to the energy structure effect, energy intensity effect, and industrial structure effect. The energy structure effect constantly fluctuated in all of these, with a cumulative decrease of 0.5299 in 2020 compared with 2005. The energy intensity effect decreased year by year after 2007, with a significant cumulative decrease of 1.7642 in 2020 compared with 2005. On the other hand, the industrial structure effect showed a developmental trend of growth followed by a decline and a slight increase in 2020, with a cumulative decrease of 0.296 in 2020 compared to 2005. In terms of the contribution rate, optimizing and adjusting the energy structure was the main factor promoting the reduction in PM2.5 pollution in 2006. However, after 2007, the energy intensity effect replaced the energy structure effect to become the primary influential factor in PM2.5 emissions. Except for 2008, the contribution rate of the energy intensity effect exceeded 50% in each year, with a maximum rate of 84.70% (Figure 3). This showed that one key strategy in terms of supporting the efficient realization of PM2.5 pollution control in this region is to consistently encourage the improvement reduction in energy intensity in the BTH region.
From the perspective of industry-type decomposition, primary industry’s impact on the energy structure throughout the BTH region keeps fluctuating constantly and has decreased slightly year by year since 2018. Compared to 2005, there was a cumulative decrease of 0.0113 in 2020. This contributed to facilitating a decrease in PM2.5 intensity, except from 2006 to 2007 and 2013. The energy intensity effect fluctuated from 2006 through 2011 and decreased year by year from 2012 onwards, with a cumulative decrease of 0.011 in 2020 compared with the level of 2005. In addition, except for inhibiting the decline in PM2.5 intensity between 2010 and 2017, all this evidence indicates a facilitating effect. The impact of industrial structure generally showed a declining and then growing developmental tendency, and it consistently contributed to the fall in PM2.5 intensity. The industrial structure effect cumulatively decreased by 0.0162 in 2020 compared with that seen in 2005. The contribution rates of the three major driving factors of primary industry were all relatively small, and the degree of influence on the intensity of PM2.5 was relatively weak. As the pillar industry behind the expansion of economic development in the BTH region, the energy structure effect, energy intensity effect, and industrial structure effect of the secondary industry played very prominent roles in contributing to the decline in PM2.5 intensity in this region. As a result, the three primary forces driving the secondary industry had significant impacts on PM2.5 emissions in this area. Among them, the energy structure effect showed the developmental trend of rising and then falling and rising again, with a cumulative decrease of 0.1821 in 2020 compared to 2005. The energy intensity effect decreased year by year, with a cumulative decrease of 1.277 in 2020 compared with 2005. Typically, the industrial structure effect exhibited a rising, followed by a falling, development tendency, with a total drop of 0.3753 in 2020 compared to 2005. The impact of the secondary industry on industrial structure was the elementary, influential factor contributing to the decrease in PM2.5 intensity in the BTH region. Its contribution rate has been maintained at a high level since 2006, exceeding 120% every year. The tertiary industry’s energy structure effect, energy intensity effect, and industrial structure effect also have relatively large impacts on the intensity change in PM2.5. Among all of them, the energy structure effect fluctuated continuously between 2006 and 2013 then decreased yearly from 2014, with a cumulative decrease of 0.3365 in 2020 compared to 2005. This contributed to the decline in PM2.5 intensity. The energy intensity impact declined year by year, with a cumulative decrease of 0.4763 in 2020 compared to 2005. It consistently made a significant contribution to the decrease in PM2.5 intensity. The industrial structure effect showed the developmental trend of first rising, before falling and rising again, with a cumulative rise of 0.0956 in 2020 compared to 2005. However, it always inhibited the decline in PM2.5 intensity (Figure 4). This demonstrates how crucial it is to continually improve the industrial framework of the secondary sector in order to support the rapid economic growth of the BTH region and achieve the development objective of creating a green and ecological living environment. However, the tertiary industry’s industrial structure, which is the second most important factor determining the concentration of PM2.5 in this area, is not reasonably configured, but rather weakens the effectiveness of the implementation of policies on PM2.5 pollution control in this region. Therefore, additional policy optimization and adjustment will be applied to the industrial structure of the tertiary industry.

4. LMDI-SD Model Construction and Simulation Prediction Analysis

4.1. LMDI-SD Model Construction

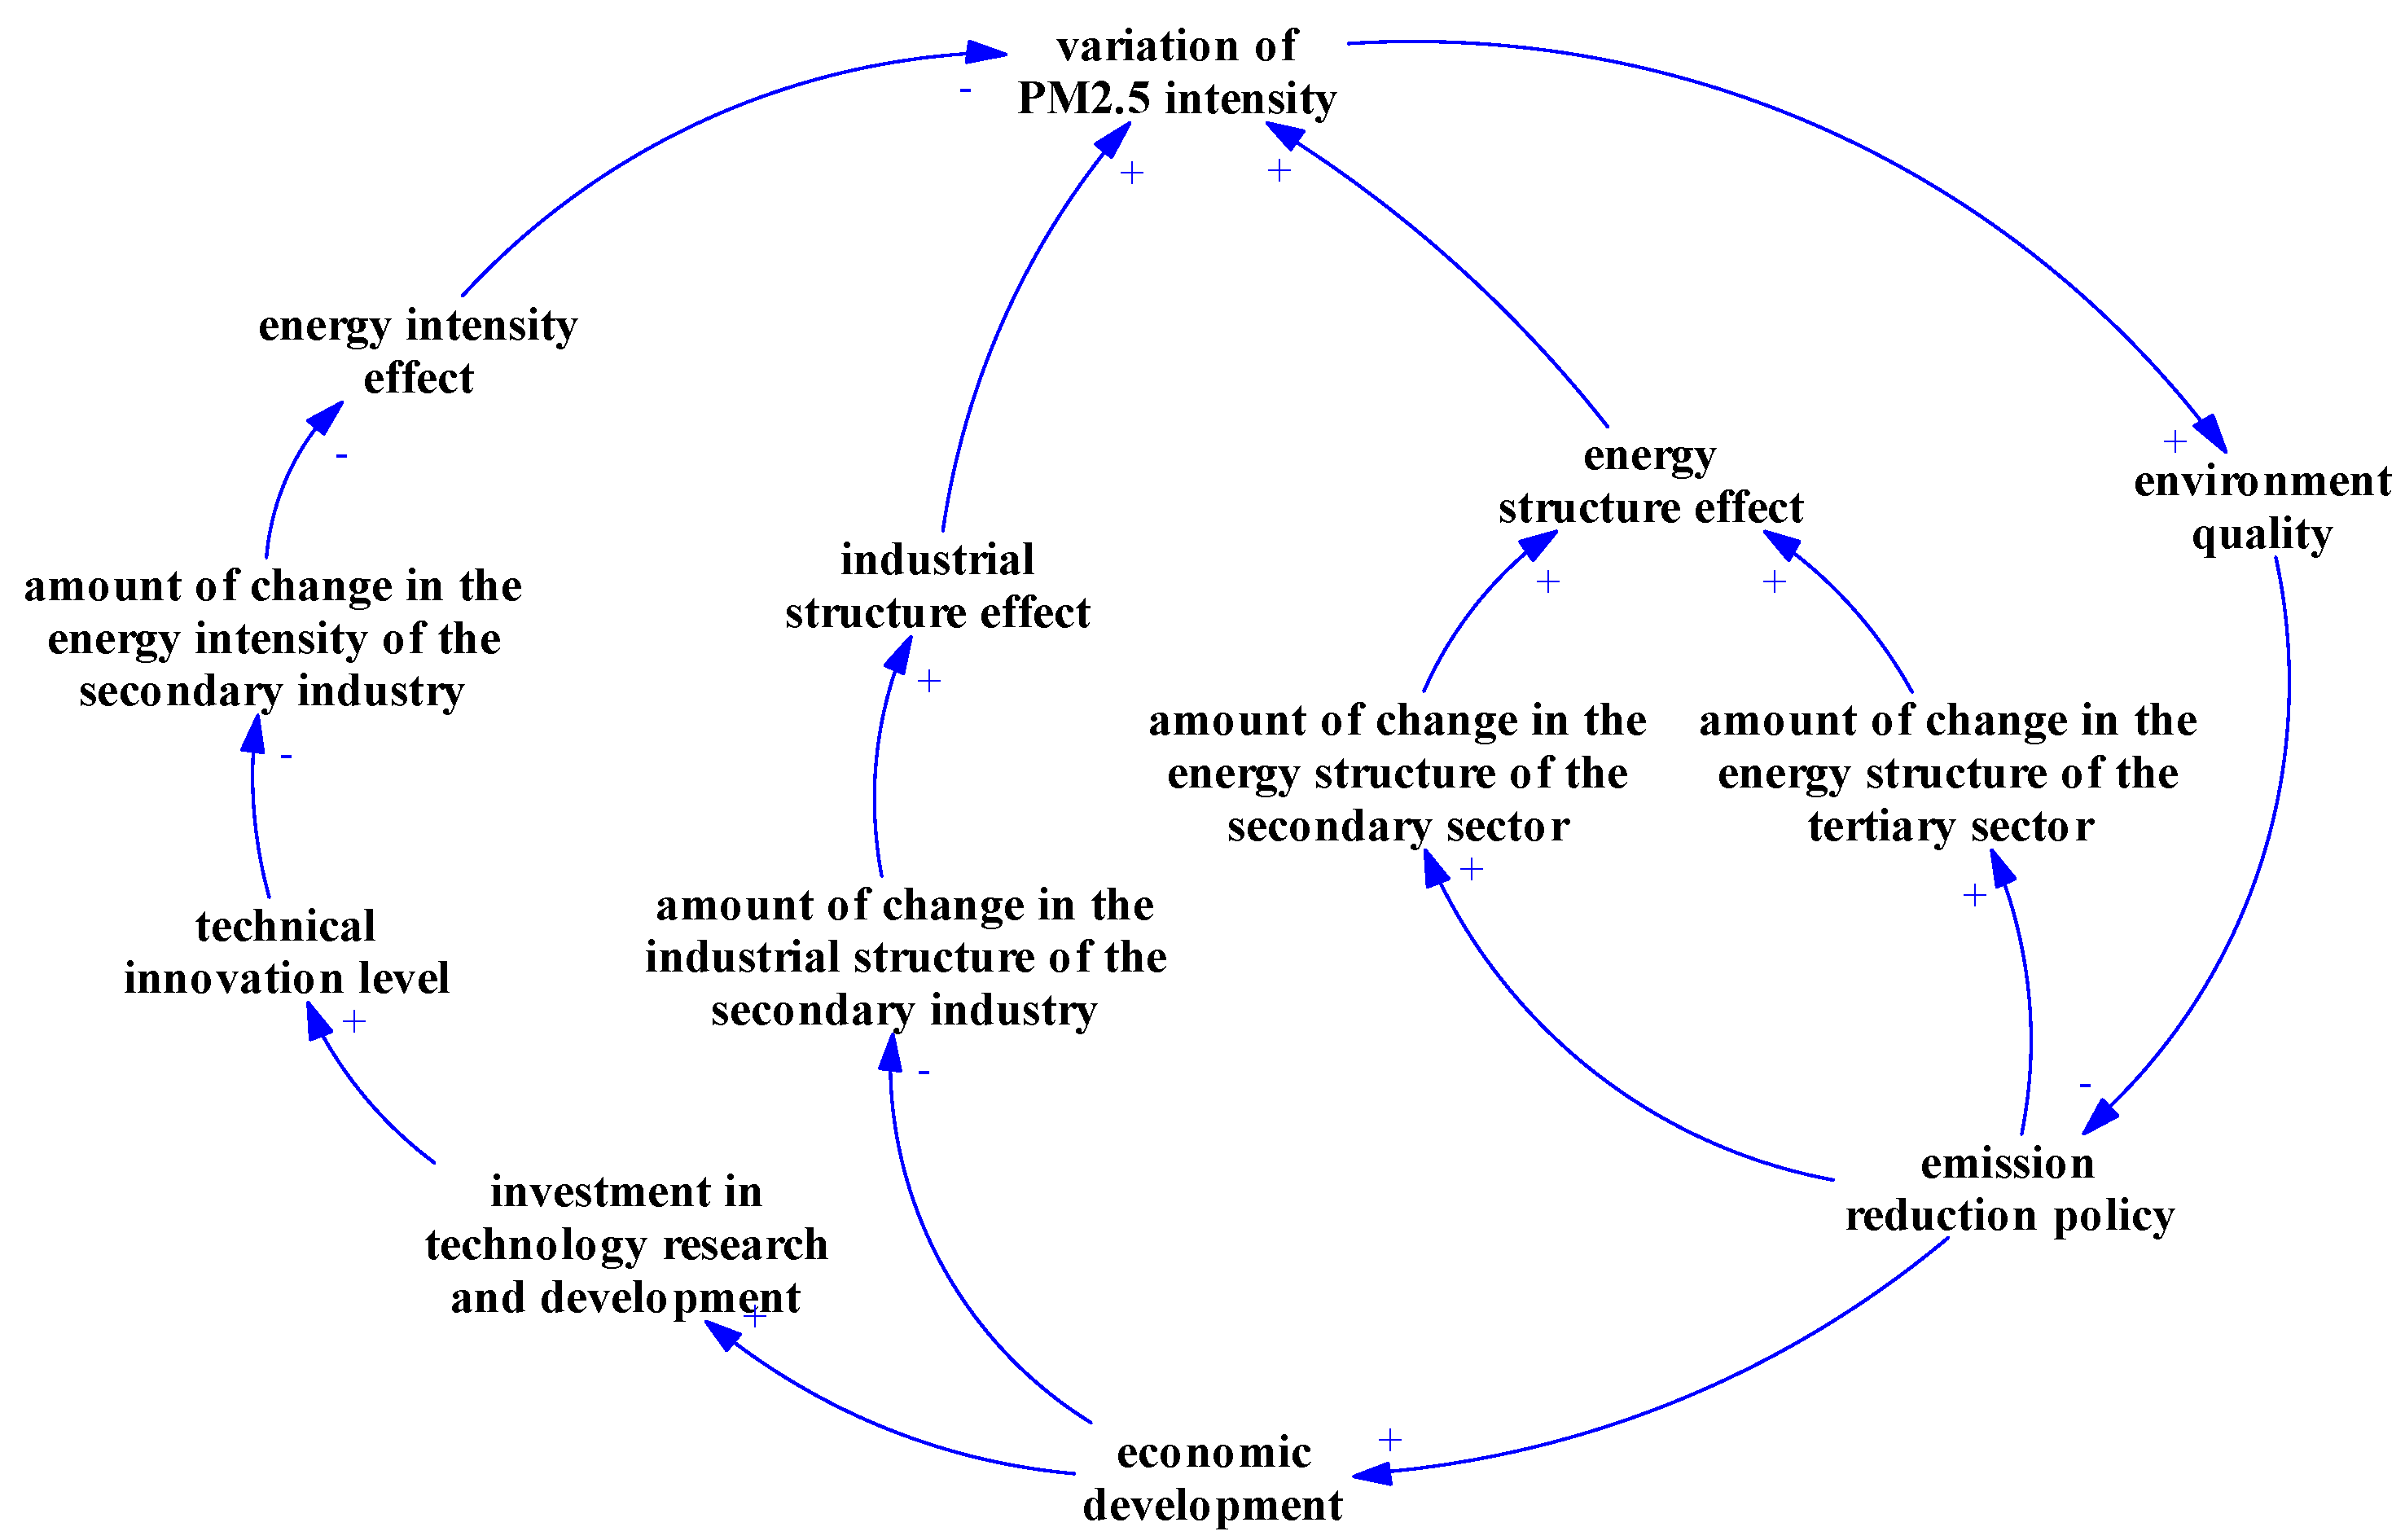
The indicators that display high contribution rates in each influencing component are selected depending on the outcomes of the empirical research in the preceding section, and the links between the indicators are examined to create the causal loop diagram depicted in Figure 5.
The assumptions that must be met by the developed system dynamics model are given according to the diagram of causality shown in the preceding picture. To be more precise, they are as follows:
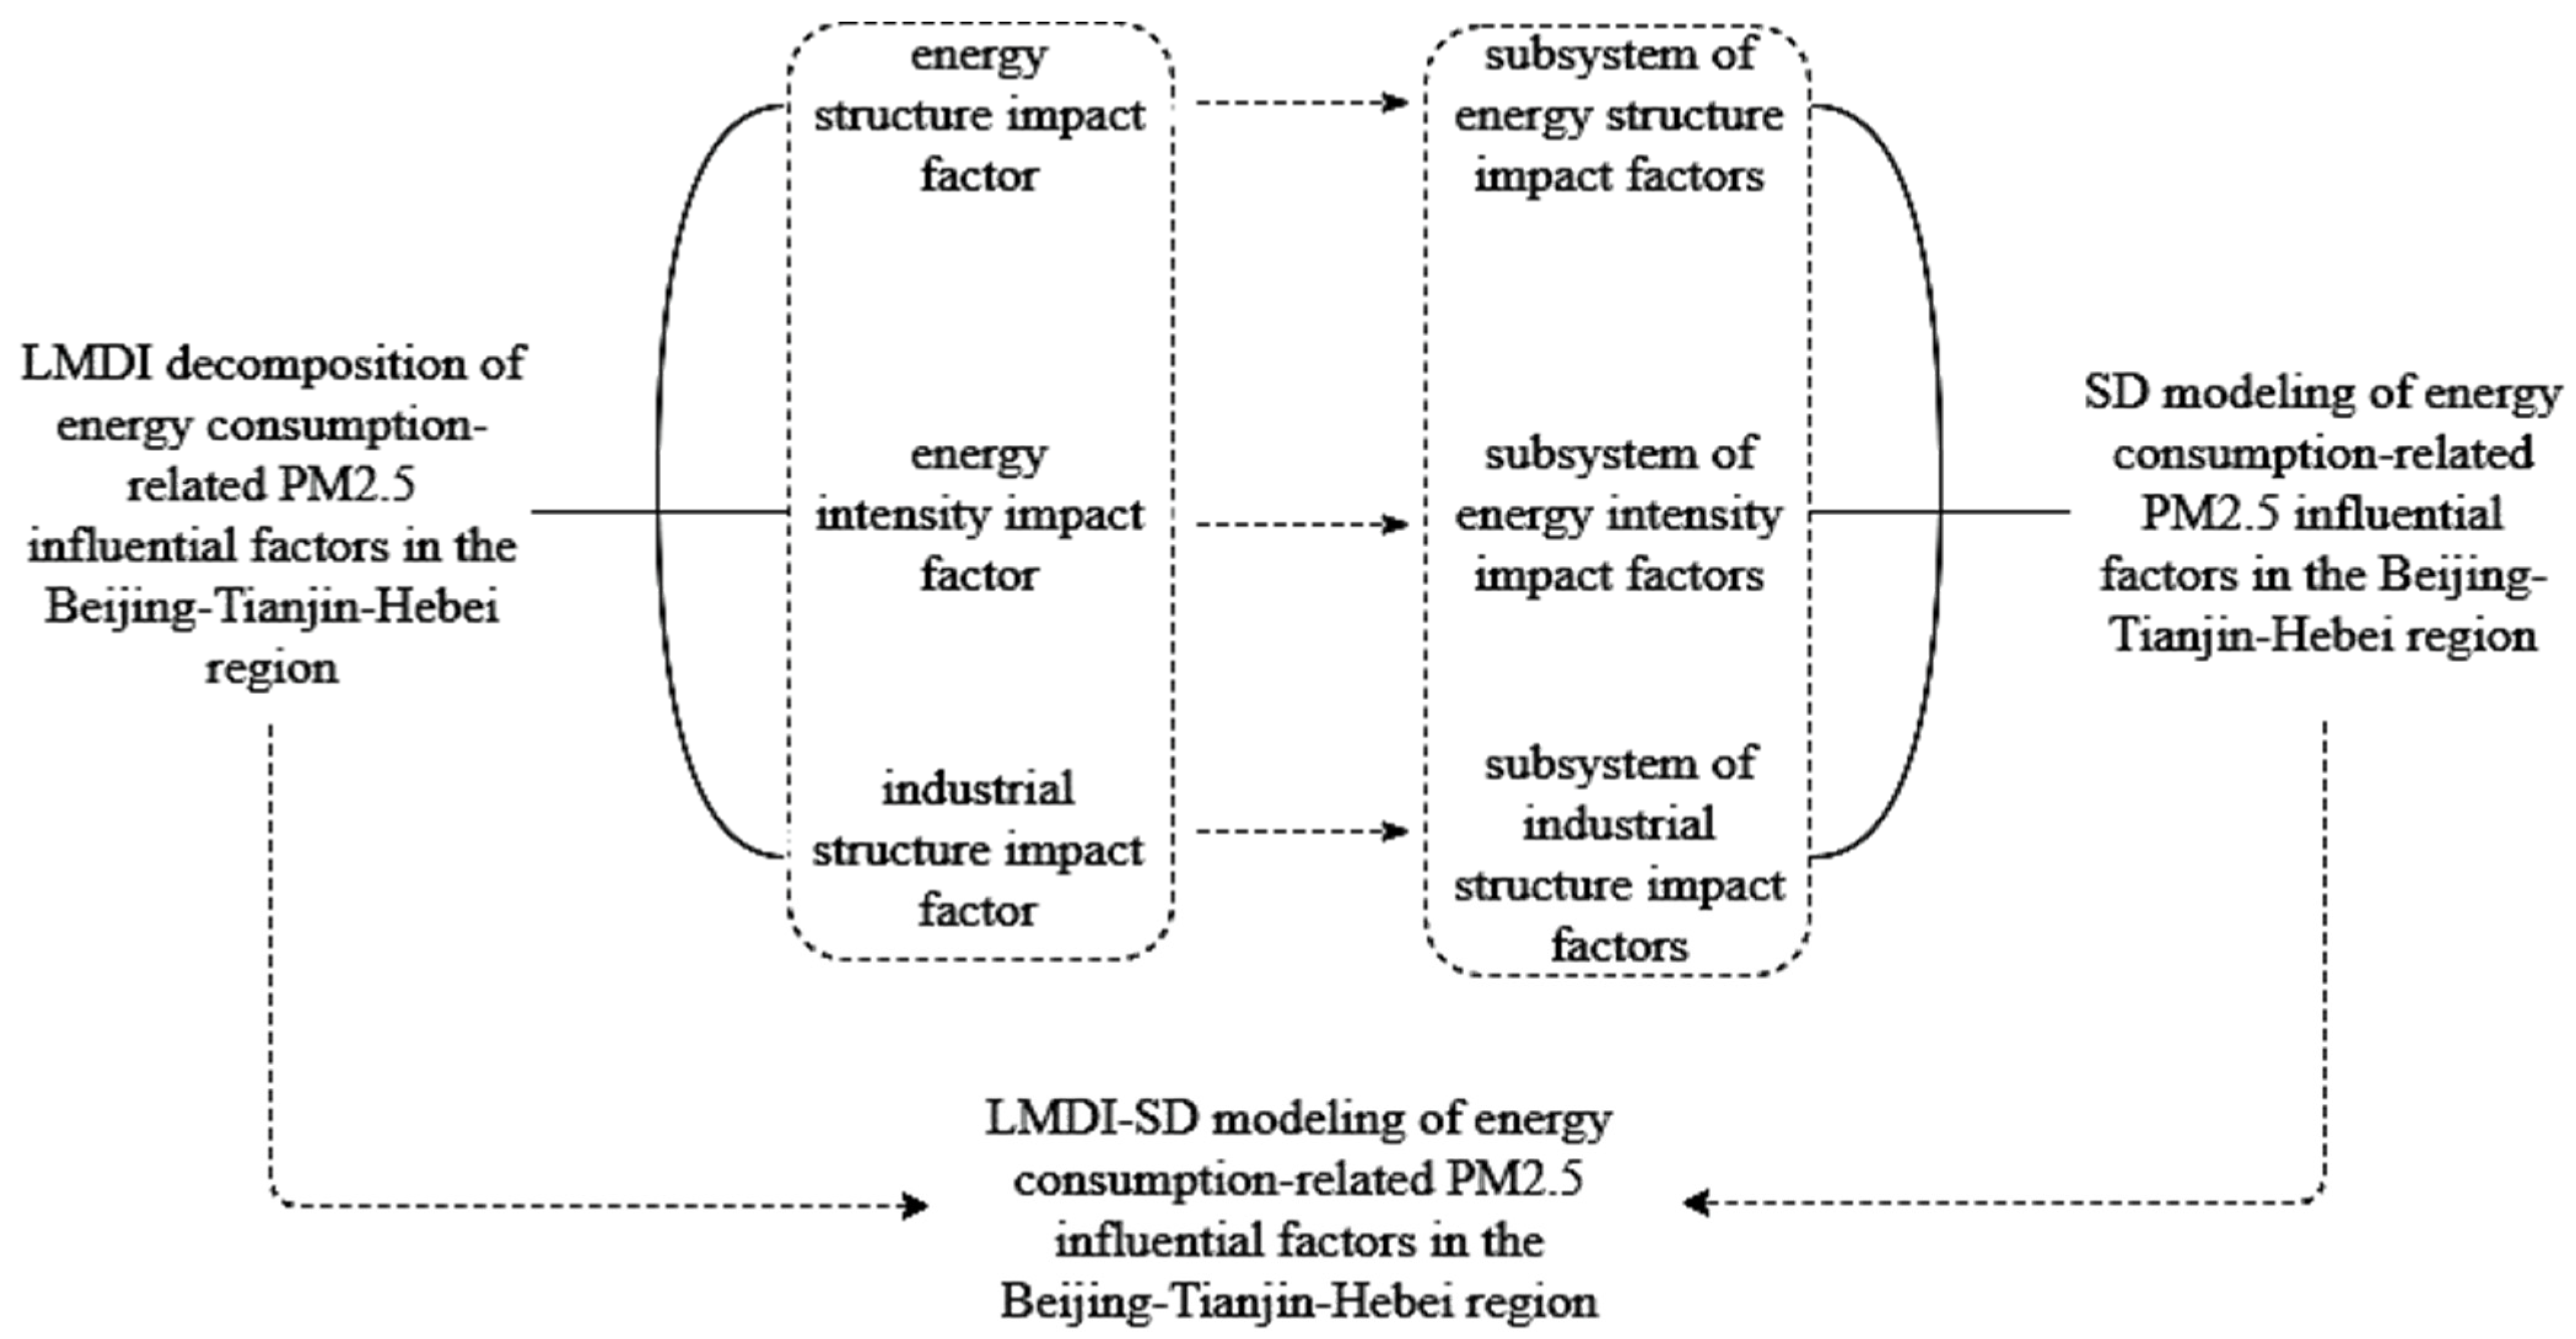
(1) According to division outcomes from LMDI, the energy structure impact factor, energy intensity impact factor, and industry structure impact factor are all connected with the corresponding measurement indicators, which are selected in the process of determining the system’s boundaries;
(2) The model takes 2005 as the base year, and variables like the rate of growth in GDP, total GDP, and output value of each industry are all accounted for using the constant price of 2005 as the base. To study the developmental trend of PM2.5 emissions connected to energy consumption in the BTH region, the model runs from 2006 to 2020 with a one-year step duration;
(3) The increase in energy efficiency is the only effect of technological research and development that benefits the model. In other words, it is expected that the region’s degree of commercial growth will be unaffected by investments made in technology-related research and development.
Based on the above assumptions, combined with the constructed causal feedback structure of the BTH region, the nature of each variable within the system is further clarified (as shown in the following Table 2, Table 3 and Table 4).
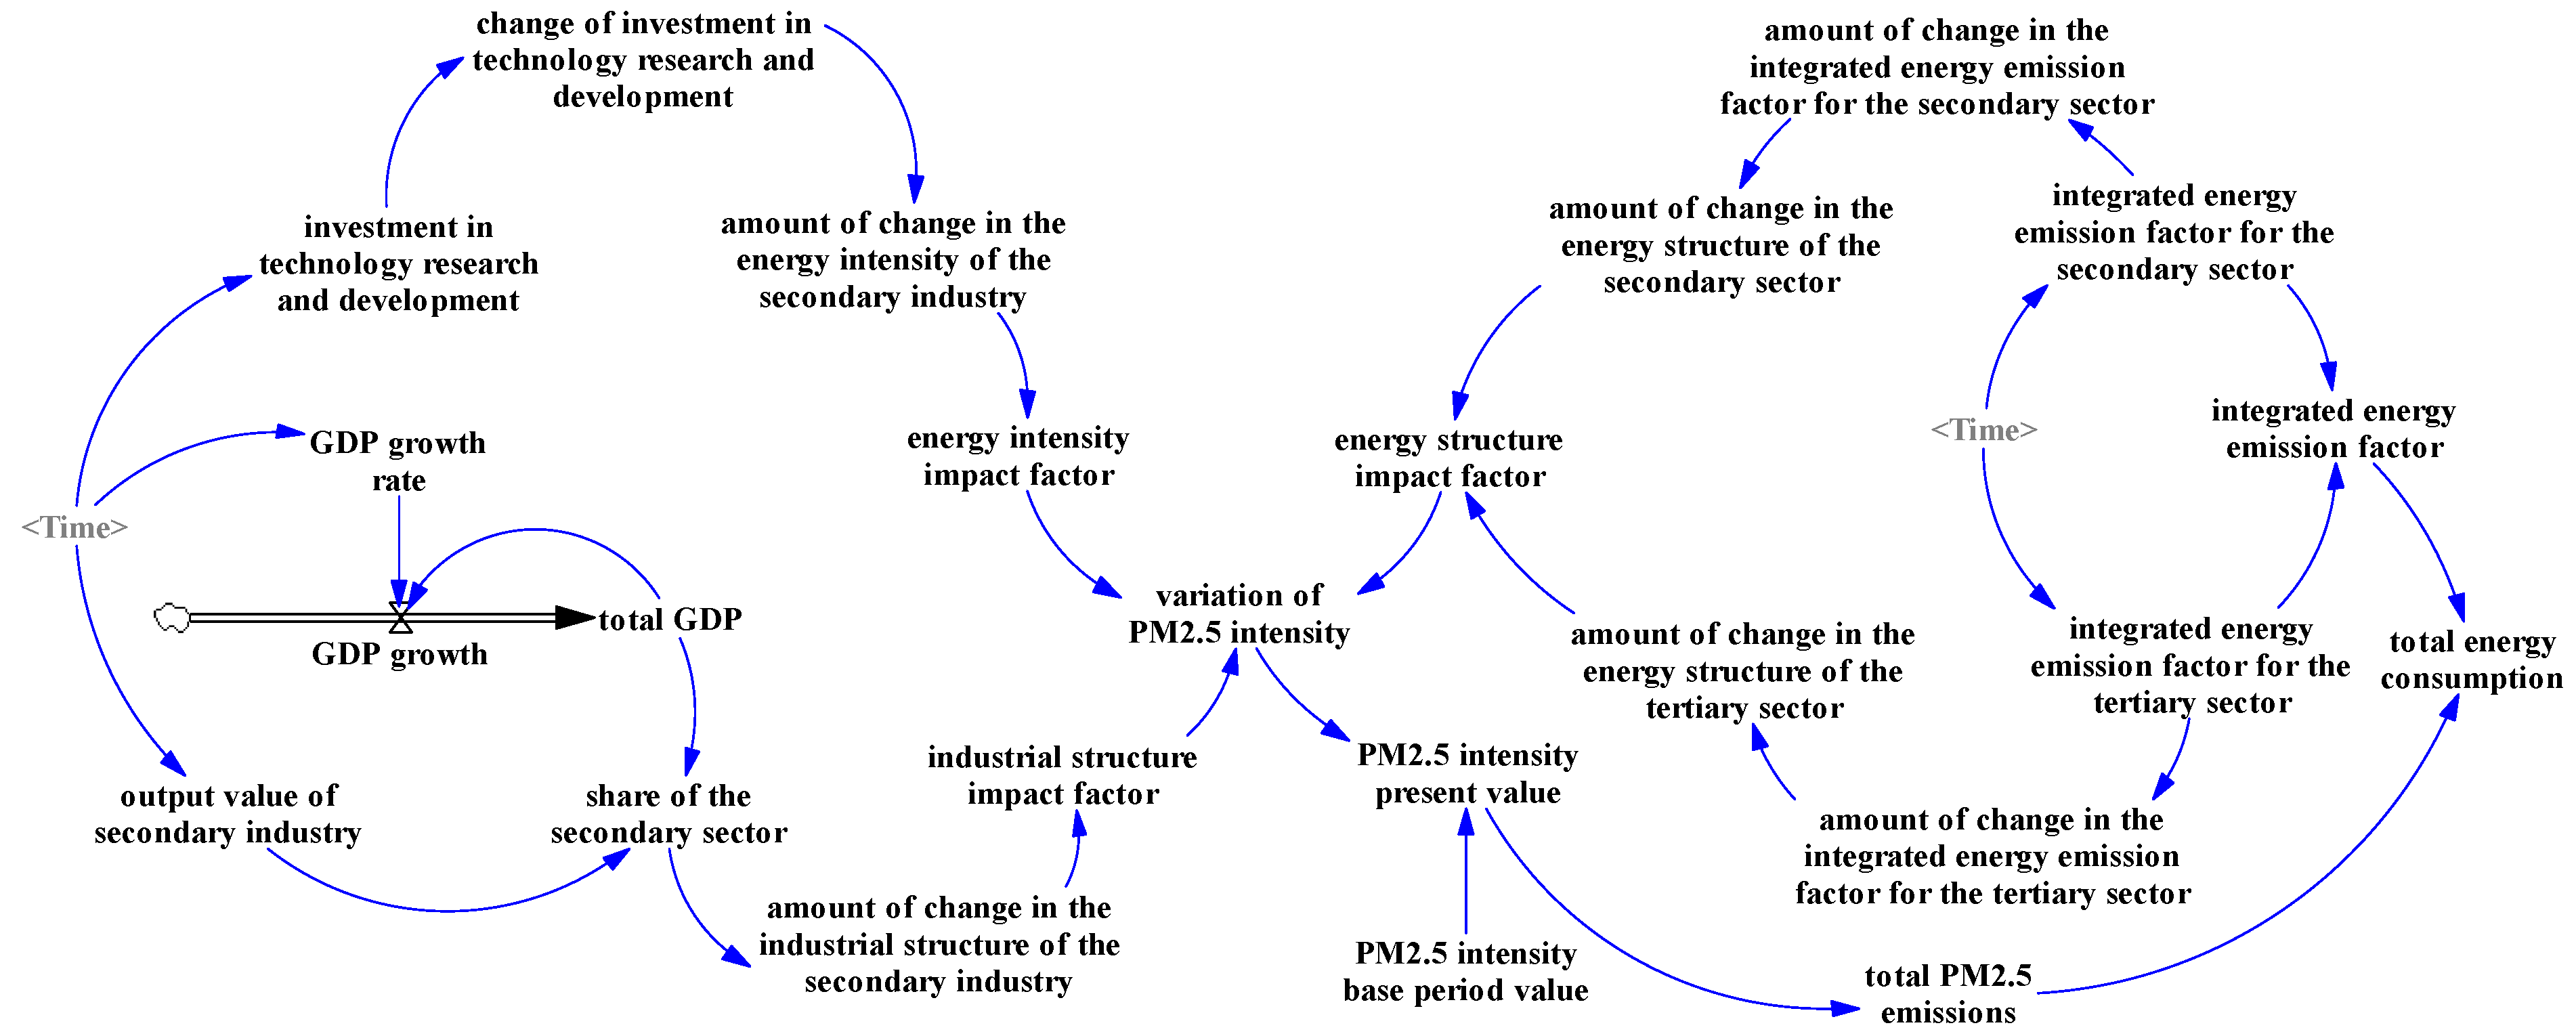
The LMDI-SD model of the BTH region, which is centered on the three driving factors of energy structure, energy intensity, and industrial structure, is formed to establish a flow diagram, which is shown in Figure 6. This represents the logical relationship between the elements within the system of factors influencing PM2.5 emissions in relation to energy consumption in the BTH region.
The correlations between the variables are further determined. On this basis, the model equations are established using Vensim PLE 32 software. The specific expression is as follows:
(1) GDP growth rate = WITH LOOKUP (Time,([(0,−0.1 − (4000,10)],(2006,0.11424),)(2007,0.120268),(2008,0.080385),(2009,0.091513),(2010,0.099861),(2011,0.089603),(2012,0.080766),(2013,0.7979),(2014,0.069573),(2015,0.066015),(2016,0.066376),(2017,0.064043),(2018,0.063056),(2019,0.061256),(2020,0.024529)))
(2) GDP growth = GDP growth rate × total GDP
(3) total GDP = INTEG (GDP growth, 19,081.7)
(4) variation in PM2.5 intensity = industry structure impact factor + energy intensity impact factor + energy structure impact factor
(5) PM2.5 intensity base period value = 4.61123
(6) PM2.5 intensity present value = variation in PM2.5 intensity + PM2.5 intensity base period value
(7) total PM2.5 emissions = total GDP × PM2.5 intensity present value
(8) industrial structure impact factor = 0.019416 + 0.806576 × amount of change in the industrial structure of the secondary industry
(9) investment in technology research and development = WITH LOOKUP (Time,([(2006,0)(6.1152e + 007,6e + 006)],)(2006,605),(2007,733),(2008,899),(2009,982),(2010,1207),(2011,1436),(2012,1670),(2013,1896),(2014,2048),(2015,2246),(2016,2405),(2017,2490),(2018,2863),(2019,3263),(2020,3446)))
(10) change in investment in technology research and development = −511.69 + 1.00012 × investment in technology research and development
(11) integrated energy emission factors for the tertiary sector = WITH LOOKUP (Time,([(0,0)(4000,10)],)(2006,4.463),(2007,4.155),(2008,4.357),(2009,4.264),(2010,4.195),(2011,4.006),(2012,3.858),(2013,4.264),(2014,4.128),(2015,3.934),(2016,3.796),(2017,3.459),(2020,2.664)(2016,3.796),(2017,3.472),(2018,3.459),(2019,2.955),(2020,2.664)))
(12) amount of change in the integrated energy emission factor for the tertiary sector = −4.82374 + 0.999981 × integrated energy emission factor for the tertiary sector
(13) amount of change in the energy structure of the tertiary sector = −0.026761 + 0.149423 × amount of change in the integrated energy emission factor for the tertiary sector
(14) amount of change in the industrial structure of the secondary industry = −2.57884 + 6.36548 × share of the secondary sector
(15) output value of secondary industry = 2034.23 + 0.318942 × total GDP
(16) share of the secondary sector = output value of secondary industry/total GDP
(17) integrated energy emission factor for the secondary sector = WITH LOO-KUP(Time,([(0,0)(4000,10)],(2006,5.226),(2007,5.446),(2008,5.268),(2009,5.24),(2010,5.124),(2011,4.958),(2012,5.005),(2013,5.481),(2014,5.492),(2015,5.474),(2016,5.279),(2017,4.944),(2018,5.012),(2019,5.037),(2020,5.148)))
(18) amount of change in the integrated energy emission factor for the secondary sector = −5.53306 + 1.00032 × integrated energy emission factor for the secondary sector
(19) amount of change in the energy intensity of the secondary industry = 1.58169 − 0.000252 × change in investment in technology research and development
(20) amount of change in the energy structure of the secondary sector = −0.009522 + 0.509058 × amount of change in the integrated energy emission factor for the secondary sector
(21) integrated energy emission factor = −0.208256 + 0.770631 × integrated energy emission factor for the tertiary sector + 0.270206 × integrated energy emission factor for the secondary sector
(22) energy intensity impact factor = −3.25933 + 2.02065 × amount of change in the energy intensity of the secondary industry
(23) total energy consumption = total PM2.5 emissions/energy intensity impact factor
(24) energy structure impact factor = 0.004757 + 1.01932 × amount of change in the energy structure of the secondary sector + 1.0374 × amount of change in the energy structure of the tertiary sector

4.2. Data Simulation and Test of the LMDI-SD Model

In order to obtain the predicted amounts for the key variables, the LMDI-SD model is run first. To ascertain whether the model is approximate and reliable, and to study the degree of influence of factors contributing to PM2.5 emissions in relation to energy consumption in the BTH region, the analog and actual quantities of the main variables of each subsystem are compared and analyzed. The formula for calculating the error is error = (simulated value − actual value)/actual value × 100%. Table 5 presents the computation outcomes. It is found that, from 2018 through 2020, the errors of the key indicators within the system, which build for the influential factors of PM2.5 emissions related to energy consumption in the BTH region, are all lower than 15 percent, and the fitting effects are all more in line with the requirements. This indicates that the LMDI-SD model for the BTH region established in this study can reflect the real situation of PM2.5 emissions related to energy consumption in the region, which is consistent with the facts. The model developed in this work can be applied for use in future analysis and prediction.

4.3. Prediction Results and Analysis of the LMDI-SD Model

To model scenarios for the development of the BTH region, this study combines the economic targets outlined in “the 14th Five-Year Plan” of each province and city, along with the energy structure trends seen from 2005 to 2020. The exogenous variables involved in the model mainly include the GDP growth rate, level of investment in technology and R&D, comprehensive energy emission coefficients of the secondary industry, and comprehensive energy emission coefficients of the tertiary industry. Among them, the GDP growth rate is based on the economic targets of the “14th Five-Year Plan” formulated by Beijing Municipality, Tianjin Municipality, and Hebei Province (the average annual growth rate is 5%, 6% and 6%, respectively). After comprehensive calculation, the average yearly expansion of GDP in the BTH region is determined to be 5.61 percent. In accordance with “the 14th Five-Year Plan”, the investment in technology research and development is determined by calculating the proportion of technology R&D investment in GDP for the three provinces and municipalities from 2021 to 2025. The upward trend of the energy structure in this region from 2005 to 2020 is the foundation for the integrated energy emission factor of the secondary and tertiary industries. On this basis, the partial least-squares method is applied to perform the regression analysis. At the same time, the goodness of fit and relative percentage deviation (RPD) of the calculated regression equations are examined. In this instance, the equations fit better when the R2 amount is closer to 1. On the other hand, when 1.4 ≤ RPD ≤ 2, the equation has an average predictive ability, and when RPD ≥ 2, it has an excellent predictive ability. After the test, the regression equations established in this study all display a good degree of fit and predictive ability (the results are shown in Table 6), enabling them to used for the prediction of development change data in the BTH region from 2021 to 2025.
To sum up, the predicted values of the four exogenous variables for the period 2021–2025 are shown in Table 7.
The LMDI-SD model for the BTH region is run to predict the PM2.5 emissions in 2025, and the results are shown in Table 8. The data indicate the following:
The influential factors of energy intensity in the BTH region are expected to decrease year by year between 2021 and 2025. These factors will decrease from −1.7642 in 2020 to −2.7232 in 2025, which is a highly significant decrease of 54.36%. Additionally, the amount of change in the secondary industry’s energy intensity will decrease each year. It will rapidly decrease from 0.9701 in 2020 to 0.2653 in 2025, which is a very significant decrease of 72.65%. To encourage the decrease in PM2.5 intensity, it will be crucial to consider both the energy intensity impact factor and the amount of change in the energy intensity of the secondary industry. This suggests that the BTH region can simultaneously achieve the pollution management goal of a significant decrease in the energy intensity of the secondary industry under the premise of realizing the economic goals set out in “the 14th Five-Year Plan”. Therefore, the effective management and control of energy intensity in the region will be promoted to realize the efficient treatment of PM2.5 pollution.
The influential factor of energy structure in the BTH region will always show a trend of rising year by year from 2021 to 2025. In 2025, it will increase by 24.78% compared with 2020, which will be a significant increase. The amount of change in the energy structure of the secondary industry will also maintain the same developmental trend. In 2025, it will increase by 78.20% compared with the level in 2020. However, the amount of change in the energy structure of the tertiary industry will decrease each year from 2020 through 2025, with a cumulative decrease of 3.94% in 2025 compared with 2020, which will be a small decrease. This indicates that the energy structure of the secondary industry in the BTH region still has the problem of irrational allocation. As an important influential factor, it will contribute significantly to the overall factors influencing energy structure, which will lead to the continuous weakening of the overall energy structure influential factors in order to promote a decrease in PM2.5 intensity in this area. Therefore, optimizing and adjusting the energy structure of the secondary industry is crucial to reducing PM2.5 emissions there and achieving the fundamental development goals of the collaborative governance of the BTH region.
Between 2021 and 2025, the weight of the industrial structure in the BTH region will decrease annually. However, it will instead increase in 2025 compared to 2020, with a cumulative increase of 5.34%. The industrial weight of the secondary industry will also decrease yearly from 2021 to 2025. In 2025, the proportion will be 34.68 percent. This is a relatively smaller decrease than that seen in 2020, standing at 0.13%. This shows that the BTH region is gradually building a modern industrial construction layout of “three, two, one”. To effectively manage PM2.5 pollution during regional economic growth and construction, the industrial structure must be continuously upgraded and optimized.
The PM2.5 intensity in the BTH region is expected to show a downward trend year by year between 2020 and 2025. In 2025, it will be reduced to being 40.16 percentage points lower than that in 2020, which is a very significant decrease. However, prior analysis suggests that the region’s rapidly growing economy may be to blame for the area’s large decline in PM2.5 intensity. The total amount of PM2.5 emissions will also continue to decline from 2021 to 2025, with a 25.56 percent drop compared to 2020. The research presented here shows that the PM2.5 pollution situation in this region will be significantly improved by achieving the binding objectives of “the 14th Five-Year Plan” for economic development and technology R&D investment. At present, it is worth noting that there are no air quality standards for PM2.5 intensity and total PM2.5 emissions in China. To investigate the management of PM2.5 pollution control, this study quantifies the energy intensity of the BTH region by calculating the combined consumption of energy and gross GDP in relation to the region’s total PM2.5 emissions. The calculated energy intensity is expected to decrease annually from 2021 to 2025, with a decrease of 9.07% in 2025 compared to 2020. However, in 2020 there was still a certain gap between energy consumption per unit in terms of the regional GDP reduction rate and the development goals of 13.5 percent, 15 percent, and 17 percent, respectively, as proposed in the “Energy Development Plan for the 14th Five-Year Period of Beijing Municipality”, “the 14th Five-Year Plan for the National Economic and Social Development of Hebei Province and the Visionary Targets of 2035”, and the “Energy Development Plan for Tianjin Municipality”. This indicates that the PM2.5 pollution control policies in this area have not been able to fully and effectively fulfill their role in reducing emissions. Therefore, it is necessary to continue to optimize PM2.5 pollution control initiatives and increase efforts to control PM2.5 pollution.

5. Conclusions and Suggestions

5.1. Main Findings

By building an emission factor model, this study seeks to examine the PM2.5 emissions associated with energy consumption in the BTH region. After that, a LMDI factor decomposition model is built to look into how energy structure, energy intensity, and industrial structure all affect the extent to which PM2.5 emissions are present in the air. As a result, the evolution of PM2.5 emissions and the factors that influence it are examined. To investigate the PM2.5 pollution levels in the BTH region in 2025, the LMDI-SD model was developed. This study aimed to identify an effective management strategy to comprehensively improve the PM2.5 pollution levels in the region and promote emission reduction and efficiency increases. Our main conclusions are as follows:
(1) The PM2.5 emissions associated with energy consumption in the BTH region have generally risen. PM2.5 emissions produced by the secondary sector’s energy consumption are an important source of PM2.5 pollution in this region. In the BTH region, coal consumption continues to be the most significant kind of energy consumption from the standpoint of the type of energy use. This is compatible with China’s structure of energy consumption, which is dominated by coal. In the BTH region, there has been a tendency for rising and then falling oil consumption. Natural gas consumption has been growing steadily and rapidly.
This is consistent with China’s coal-dominated energy consumption structure. Oil consumption in the BTH region showed a trend of increasing and then decreasing. Natural gas consumption has been growing steadily and rapidly.
(2) From the overall point of view, the contribution rates of the three major drivers of PM2.5 intensity in relation to energy consumption in the BTH region are, in turn, energy intensity, energy structure, and industrial structure. Moreover, all three drivers contribute to the decrease in PM2.5 intensity. From the perspective of industry type, the primary variables that have an important influence on PM2.5 intensity are, in order, the secondary industry’s industrial structure effect, tertiary industry’s industrial structure effect, secondary industry’s energy intensity effect, tertiary industry’ energy structure effect, and secondary industry’s energy structure effect. Among these factors, the tertiary industry’s impact on the industrial structure prevents a decrease in PM2.5 intensity.
(3) The PM2.5 emissions associated with energy consumption in the BTH region will be significantly reduced from 2021 to 2025. However, the reduction in energy intensity derived from the LMDI-SD model for the BTH region will still display a certain gap with “the 14th Five-Year Plan” targets set by Beijing, Tianjin, and Hebei provinces.

5.2. Policy Recommendations

The following policy suggestions are made in light of this study’s findings:
(1) A continuous adjustment of energy structure should be carried out to gradually increase the proportion of clean energy. Studies have shown that optimizing and adjusting our energy structure has a positive impact on managing PM2.5 pollution in the BTH region. As a result, we need to speed up the construction of a modern energy system and continue to work together to prevent, control, and treat air pollution. We must also complete the integration of energy in the BTH region and encourage different provinces and cities to collaborate. At the same time, we need to ensure our energy security while steadily reducing our consumption of coal. Our goal is to develop a modern and intelligent energy system that focuses on controlling coal, expanding gas, increasing electricity, and utilizing renewable energy sources. To achieve this, we should continue to develop non-fossil energy sources, such as solar energy, composite photovoltaic, wind resources, onshore and offshore power generation, medium and deep-sea geothermal energy, and bioenergy. We must also cultivate new dynamics in the energy field and improve the level of renewable energy consumption while upgrading the level of cleaner energy use in the secondary industry. By doing this, we can further optimize our regional energy structure and establish a good pattern of coordinated management of PM2.5 pollution.
(2) Steadily promote the decline in energy intensity reduction and gradually strengthen scientific and technological innovation. Factor decomposition analysis has shown that energy intensity is the key factor contributing to PM2.5 emissions. It is essential to recognize that economic development cannot come at the cost of environmental protection, which is in line with China’s green development concept. As such, the region should prioritize the dual control of energy intensity and consumption while continuing to improve the regional economy. This can be achieved by establishing a comprehensive energy management information platform, regulating energy demand management, developing advanced industrial clusters, promoting strategic emerging industries, and utilizing renewable energy resources. The focus should be on reducing energy intensity in secondary and tertiary industries while coordinating efforts to manage PM2.5 pollution.
(3) Continue to promote the optimization of the industrial structure and increase the proportion of the economy dedicated to tertiary industry every year. Empirical research suggests that the BTH region must optimize and adjust its industrial structure to reduce PM2.5 emissions and improve efficiency. To accomplish this, the region should learn from the industrial construction methods of developed countries, enhance connections between regional industries, promote the growth of the tertiary industry, and accelerate the development of a modernized industrial layout. In addition, the region should promote the integration of industry, innovation, and supply chains, and foster a shared and symbiotic ecosystem for the development of the BTH industry. This will lead to effective and coordinated control of PM2.5 pollution.
The limitations of this study were that the thesis currently only considers the impact of structural indicators on energy-consumption-related PM2.5 emissions, simplifies the complex system behind the mechanisms influencing PM2.5 release, and only analyses PM2.5 pollution in the baseline scenario. In future studies, we will set up a variety of simulation scenarios reasonably, add input and output data, and carry out more in-depth and extensive research.

Author Contributions

Conceptualization, D.L.; methodology, D.L. and Y.S. (Ying Shi); software, D.L.; validation, D.L. and Y.S. (Yingshan Sun); formal analysis, D.L. and Y.X.; investigation, J.X.; data curation, D.L., Y.S. (Yingshan Sun) and Y.X.; writing—original draft preparation, D.L.; writing—review and editing, Y.S and R.Z.; funding acquisition, Y.S. (Ying Shi) and R.Z. All authors have read and agreed to the published version of the manuscript.

Funding

This research was funded by the Academic Research Topics of Beijing Higher Education Society’s Technical Materials Research Branch in 2024 [No.JSWZ202416], General Program of Beijing Higher Education Society in 2022 [No.MS2022316], and Research topic of higher education in the coal industry in 2022 [No.2021MXJG218].

Institutional Review Board Statement

Not applicable.

Informed Consent Statement

Not applicable.

Data Availability Statement

Data will be made available on request.

Conflicts of Interest

The authors declare no conflicts of interest.

Nomenclature

Variable NameVariable Definition
PMthe emissions of PM2.5
iprimary, secondary, and tertiary industries, respectively
jenergy type
Eenergy consumption
EFthe PM2.5 emission coefficients of each energy variety in each industry
Xithe velocity of dispersion for pollution control technologies in the industry sector i
ηithe effectiveness of disinfection for industrial pollution treatment technologies
EFjthe computed energy emission parameter for PM2.5
PMIPM2.5 intensity
PMPM2.5 emissions
GDPgross domestic product
nregions
E i n the energy consumption by industry i in region n
Y i n the economic output generated by industry i in region n
PMCnthe integrated energy emission coefficient of region n
EI i n the energy intensity of industry i in region n
SY i n the industrial structure of industry i in region n
Δ PMI n , i pmc the changes in PM2.5 intensity resulting from variations in energy structure
Δ PMI n , i ei the changes in PM2.5 intensity resulting from variations in energy intensity
Δ PMI n , i sy the changes in PM2.5 intensity resulting from variations in industrial structure

References

  1. Pak, U.; Ma, J.; Ryu, U.; Ryom, K.; Juhyok, U.; Pak, K.; Pak, C. Deep Learning-Based PM2.5 Prediction Considering the Spatiotemporal Correlations: A Case Study of Beijing, China. Sci. Total Environ. 2020, 699, 133561. [Google Scholar] [CrossRef] [PubMed]
  2. Zhong, S.; Zhang, L.; Jiang, X.; Gao, P. Comparison of Chemical Composition and Airborne Bacterial Community Structure in PM2.5 during Haze and Non-Haze Days in the Winter in Guilin, China. Sci. Total Environ. 2019, 655, 202–210. [Google Scholar] [CrossRef]
  3. Pope, C.A.; Coleman, N.; Pond, Z.A.; Burnett, R.T. Fine Particulate Air Pollution and Human Mortality: 25+ Years of Cohort Studies. Environ. Res. 2020, 183, 108924. [Google Scholar] [CrossRef]
  4. Krzyzanowski, M.; Cohen, A. Update of WHO Air Quality Guidelines. Air Qual. Atmos. Health 2008, 1, 7–13. [Google Scholar] [CrossRef]
  5. Chow, J.C.; Watson, J.G.; Lowenthal, D.H.; Solomon, P.A.; Magliano, K.L.; Ziman, S.D.; Richards, L.W. PM10 and PM2.5 Compositions in California’s San Joaquin Valley. Aerosol Sci. Technol. 1993, 18, 105–128. [Google Scholar] [CrossRef]
  6. Kim, Y.S.; Kim, W.S. Concentration of chemical elements of PM2.5 in korean industrial area. Epidemiology 1998, 9, S67. [Google Scholar] [CrossRef]
  7. Lai, A.M.; Carter, E.; Shan, M.; Ni, K.; Clark, S.; Ezzati, M.; Wiedinmyer, C.; Yang, X.; Baumgartner, J.; Schauer, J.J. Chemical Composition and Source Apportionment of Ambient, Household, and Personal Exposures to PM 2.5 in Communities Using Biomass Stoves in Rural China. Sci. Total Environ. 2019, 646, 309–319. [Google Scholar] [CrossRef]
  8. Huang, H.; Yin, X.; Tang, Y.; Zou, C.; Li, J.; Yu, C.; Zhu, F. Seasonal Distribution and Source Apportionment of Chemical Compositions in PM2.5 in Nanchang, Inland Area of East China. Atmosphere 2023, 14, 1172. [Google Scholar] [CrossRef]
  9. Tai, A.P.; Mickley, L.J.; Jacob, D.J. Correlations between fine particulate matter (PM2.5) and meteorological variables in the United States: Implications for the sensitivity of PM2.5 to climate change. Atm Environ. 2010, 44, 3976–3984. [Google Scholar] [CrossRef]
  10. He, J.; Gong, S.; Yu, Y.; Yu, L.; Wu, L.; Mao, H.; Song, C.; Zhao, S.; Liu, H.; Li, X.; et al. Air pollution characteristics and their relation to meteorological conditions during 2014–2015 in major Chinese cities. Environ. Pol. 2017, 223, 484–496. [Google Scholar] [CrossRef]
  11. Li, R.; Wang, Z.; Cui, L.; Fu, H.; Zhang, L.; Kong, L.; Chen, W.; Chen, J. Air Pollution Characteristics in China during 2015–2016: Spatiotemporal Variations and Key Meteorological Factors. Sci. Total Environ. 2019, 648, 902–915. [Google Scholar] [CrossRef] [PubMed]
  12. Amarillo, A.; Carreras, H.; Krisna, T.; Mignola, M.; Busso, I.T.; Wendisch, M. Exploratory analysis of carbonaceous PM2.5 species in urban environments: Relationship with meteorological variables and satellite data. Atm Environ. 2021, 245, 117987. [Google Scholar] [CrossRef]
  13. Chen, Z.; Chen, D.; Zhao, C.; Kwan, M.P.; Cai, J.; Zhuang, Y.; Zhao, B.; Wang, X.; Chen, B.; Yang, J.; et al. Influence of Meteorological Conditions on PM2.5 Concentrations across China: A Review of Methodology and Mechanism. Environ. Int. 2020, 139, 105558. [Google Scholar] [CrossRef] [PubMed]
  14. Rafiq, S.; Salim, R.; Nielsen, I. Urbanization, openness, emissions, and energy intensity: A study of increasingly urbanized emerging economies. Energy Econ. 2016, 56, 20–28. [Google Scholar] [CrossRef]
  15. Ji, X.; Yao, Y.; Long, X. What causes PM2.5 pollution? Cross-econom yempirical analysis from socioeconomic perspective. Energy Policy 2018, 119, 458–472. [Google Scholar] [CrossRef]
  16. Dong, F.; Li, J.; Li, K.; Sun, Z.; Yu, B.; Wang, Y.; Zhang, S. Causal Chain of Haze Decoupling Efforts and Its Action Mechanism: Evidence from 30 Provinces in China. J. Clean. Prod. 2020, 245, 118889. [Google Scholar] [CrossRef]
  17. Andrei, J.V.; Avram, S.; Băncescu, I.; Gâf Deac, I.I.; Gheorghe, C. Evolution of Romania’s Economic Structure and Environment Degradation—An Assessment Through LMDI Decomposition Approach. Risk Manag. Healthc. Policy 2021, 14, 3505–3521. [Google Scholar] [CrossRef] [PubMed]
  18. Yu, B.; Fang, D. Decoupling economic growth from energy-related PM2.5 emissions in China: A GDIM-based indicator decomposition. Ecol. Indic. 2021, 127, 107795. [Google Scholar] [CrossRef]
  19. Gibson, M.D.; Haelssig, J.; Pierce, J.R.; Parrington, M.; Franklin, J.E.; Hopper, J.T.; Li, Z.; Ward, T.J. A Comparison of Four Receptor Models Used to Quantify the Boreal Wildfire Smoke Contribution to Surface PM2.5 in Halifax, Nova Scotia during the BORTAS-B Experiment. Atmos. Chem. Phys. 2015, 15, 815–827. [Google Scholar] [CrossRef]
  20. Jiang, N.; Li, Q.; Su, F.; Wang, Q.; Yu, X.; Kang, P.; Zhang, R.; Tang, X. Chemical Characteristics and Source Apportionment of PM2.5 between Heavily Polluted Days and Other Days in Zhengzhou, China. J. Environ. Sci. 2018, 66, 188–198. [Google Scholar] [CrossRef]
  21. Zhang, C.; Zhang, Y.; Liu, X.; Liu, Y.; Li, C. Characteristics and Source Apportionment of PM2.5 under the Dual Influence of the Spring Festival and the COVID-19 Pandemic in Yuncheng City. J. Environ. Sci. 2023, 125, 553–567. [Google Scholar] [CrossRef]
  22. Yang, J.; Liu, S.; Geng, Q.; Chen, G.; Wang, Y. Estimation of PM2.5 Concentration Considering Meteorological Factors, Policy, and Interregional Atmospheric Transport. Int. J. Environ. Sci. Technol. 2022, 19, 8479–8490. [Google Scholar] [CrossRef]
  23. Fattah, M.A.; Morshed, S.R.; Kafy, A.A.; Rahaman, Z.A.; Rahman, M.T. Wavelet Coherence Analysis of PM2.5 Variability in Response to Meteorological Changes in South Asian Cities. Atmos. Pollut. Res. 2023, 14, 101737. [Google Scholar] [CrossRef]
  24. Wang, J.; Li, R.; Xue, K.; Fang, C. Analysis of Spatio-Temporal Heterogeneity and Socioeconomic Driving Factors of PM2.5 in Beijing–Tianjin–Hebei and Its Surrounding Areas. Atmosphere 2021, 12, 1324. [Google Scholar] [CrossRef]
  25. Wu, Y.; Zhou, Y.; Xu, B. Decoupling Relationship between Economic Growth and PM2.5emissions in the Transportation Sector in China: Regional Differences and Influencing Factors. Environ. Res. Lett. 2022, 17, 044065. [Google Scholar] [CrossRef]
  26. Sun, X.; Zhang, R.; Wang, G.; Guo, J.; Liu, Z. Factor Decomposition, Reduction Potential, and Rebound Effect of Energy Consumption Related PM 2.5 in China. J. Clean. Prod. 2021, 322, 129088. [Google Scholar] [CrossRef]
  27. Zhang, T. Which Policy Is More Effective, Carbon Reduction in All Industries or in High Energy-Consuming Industries?—From Dual Perspectives of Welfare Effects and Economic Effects. J. Clean. Prod. 2019, 216, 184–196. [Google Scholar] [CrossRef]
  28. Ding, Y.Y.; Li, Z.; Ge, X.; Hu, Y. Empirical Analysis of the Synergy of the Three Sectors’ Development and Labor Employment. Technol. Forecast. Soc. Chang. 2020, 160, 120223. [Google Scholar] [CrossRef]
  29. Li, X.; Chen, D.; Fu, J.; Liu, S.; Geng, X. Construction and application of fuzzy comprehensive evaluation model for rockburst based on microseismic monitoring. Appl. Sci. 2023, 13, 12013. [Google Scholar] [CrossRef]
  30. Fu, J.; Chen, D.; Li, X.; Li, H.; Liu, S.; Li, C.; Zhang, J. Research on the technology of gob-side entry retaining by pouring support beside the roadway in three soft coal seam A case study. Phys. Fluids 2024, 36, 017123. [Google Scholar] [CrossRef]
Figure 1. Modeling idea of LMDI-SD model in the BTH region.
Sustainability 16 03152 g001
Figure 2. PM2.5 emissions related to energy consumption in the BTH region: (a) emissions by industry; (b) contribution by industry; (c) emissions by energy type; (d) contribution by energy type.
Sustainability 16 03152 g002
Figure 3. Decomposition results and contribution rates of influential factors of PM2.5 related to energy consumption in the BTH region.
Sustainability 16 03152 g003
Figure 4. Decomposition results and contribution rates of influential factors of PM2.5 related to energy consumption by industries in the BTH region.
Sustainability 16 03152 g004
Figure 5. Causal loop diagram of the LMDI-SD model in the BTH region.
Sustainability 16 03152 g005
Figure 6. LMDI-SD model flow diagram for the BTH region.
Sustainability 16 03152 g006
Table 1. PM2.5 energy emission factors.
Fuel TypeFuel NameEmission Factor
(g/kg, m3)
Fuel TypeFuel NameEmission Factor
(g/kg, m3)
coalraw coal0.740petrochemicalcrude oil0.310
water-washed coal0.740diesel0.125
charcoal briquette0.740gasoline0.310
coke (processed coal used in blast furnaces)0.144diesel fuel0.310
blast furnace gas0.170fuel oil0.310
coke oven gas0.170liquefied petroleum gas0.150
other gases0.170petroleumpetroleum0.170
Table 2. Subsystem variables table of factors influencing energy.
Variable NameVariable PropertyVariable Declaration
Integrated energy emission factorAuxiliary variableThe overall situation of the energy structure
Integrated energy emission factor for the secondary sectorAuxiliary variableThe overall situation of the energy structure of the secondary industry
Integrated energy emission factor for the tertiary sectorAuxiliary variableThe overall situation of the energy structure of the tertiary sector
Amount of change in the integrated energy emission factor for the secondary sectorAuxiliary variableChanges in the energy structure of the secondary industry
Amount of change in the integrated energy emission factor for the tertiary sectorAuxiliary variableChanges in the energy structure of the tertiary sector
Amount of change in the integrated energy emission factor for the secondary sectorAuxiliary variableCumulative changes in the energy structure of the secondary industry
Amount of change in the energy structure of the tertiary sectorAuxiliary variableCumulative changes in the energy structure of the tertiary sector
Energy structure impact factorAuxiliary variableCumulative change effect of energy structure
Total energy consumptionAuxiliary variableenergy consumption situation
Variation in PM2.5 intensityAuxiliary variableDifference between PM2.5 intensity in the current period and the base period
PM2.5 intensity base period valueAuxiliary variablePM2.5 intensity in 2005 (base period)
PM2.5 intensity present valueAuxiliary variablePM2.5 intensity in every year except the base year.
Total PM2.5 emissionsauxiliary variablePM2.5 emissions
Table 3. Subsystem variables table of factors influencing energy intensity.
Variable NameVariable PropertyVariable Declaration
Investment in technology research and developmentAuxiliary variableInput cost of scientific and technological innovation
Change in investment in technology research and developmentAuxiliary variableChanges of input cost for scientific and technological innovation
Amount of change in the energy intensity of the secondary industryAuxiliary variableCumulative change in energy intensity of the secondary industry
Energy intensity impact factorAuxiliary variableCumulative change effect of energy intensity
Table 4. Subsystem variables table of industrial influencing factors.
Variable NameVariable PropertyVariable Declaration
Total GDPState variableRegional development level
GDP growth rateAuxiliary variableRate of GDP change
GDP growthRate variableGDP variation
The output value of secondary industryAuxiliary variableThe development level of the secondary industry
The output value of secondary industryAuxiliary variableThe proportion of output value of the secondary industry to GDP
Amount of change in the industrial structure of the secondary industryAuxiliary variableChanges in the industrial structure of the secondary industry
Industrial structure impact factorAuxiliary variableCumulative change effect of industrial structure
Table 5. Model simulation error statistics for the BTH region.
Particular YearEnergy Structure SubsystemEnergy Intensity SubsystemIndustrial Structure SubsystemDiscussion Variables
Error in the Amount of Change in the Energy Structure of the Secondary SectorError in the Amount of Change in the Energy Intensity of the Secondary SectorError in the Amount of Change in the Industrial Structure of the Secondary SectorError in PM2.5 Intensity Present Value
20187.65%−3.55%10.12%12.11%
201911.73%−8.02%1.92%10.46%
202012.40%−13.19%10.03%7.54%
Table 6. Equation fitting and prediction ability.
Exogenous VariableR2FitRPDPredictive Capacity
Comprehensive energy emission coefficients of the secondary sector0.9892Favorable248.9315Favorable
Comprehensive energy emission coefficients of the tertiary industry0.9892Vavorable10.9675Vavorable
Table 7. Forecast data of exogenous variables from 2021 to 2025.
Exogenous Variable20212022202320242025
GDP growth rate5.61%
Investment in technology research and development4595.964857.315133.625425.765734.62
Comprehensive energy emission coefficients of the secondary sector5.2080835.2740905.3400975.4061035.472110
Comprehensive energy emission coefficients of the tertiary industry3.0694252.9675352.8656462.7637562.661867
Table 8. Forecast data of main variables of LMDI-SD model of Beijing-Tianjin-Hebei region from 2021 to 2025.
Variable Name20212022202320242025
Energy intensity impact factor−2.1433−2.2764−2.4171−2.5659−2.7232
Amount of change in the energy intensity of the secondary industry0.55230.48640.41680.34320.2653
Energy structure impact factor−0.4724−0.454−0.4355−0.417−0.3986
amount of change in the energy structure of the secondary sector−0.1741−0.1405−0.1069−0.0733−0.0397
Amount of change in the energy structure of the tertiary sector−0.2889−0.3041−0.3194−0.3346−0.3498
Industrial structure impact factor−0.2453−0.2547−0.2637−0.2721−0.2802
Share of the secondary sector35.36%35.17%35.00%34.83%34.68%
total GDP58,74262,03765,51769,19373,075
Total energy consumption27,22527,81128,39628,98229,568
PM2.5 intensity present value1.75021.62621.49501.35621.2093
Total PM2.5 emissions102,811100,88297,94693,83888,372
Disclaimer/Publisher’s Note: The statements, opinions and data contained in all publications are solely those of the individual author(s) and contributor(s) and not of MDPI and/or the editor(s). MDPI and/or the editor(s) disclaim responsibility for any injury to people or property resulting from any ideas, methods, instructions or products referred to in the content.

