Article

The Adoption of Renewable Energy Technologies by Oil-Producing Countries: An Inevitable Outcome at a Time of Global Challenges and Demand for Sustainable Development

by
Nashwa Mostafa Ali Mohamed
1,
Karima Mohamed Magdy Kamal
1 and
Jawaher Binsuwadan
2,*
1
Department of Economics, College of Business, King Saud University, P.O. Box 173, Riyadh 11942, Saudi Arabia
2
Department of Economics, College of Business Administration, Princess Nourah bint Abdulrahman University, P.O. Box 84428, Riyadh 11671, Saudi Arabia
*
Author to whom correspondence should be addressed.
Sustainability 2024, 16(8), 3155; https://doi.org/10.3390/su16083155
Submission received: 7 March 2024 / Revised: 6 April 2024 / Accepted: 8 April 2024 / Published: 10 April 2024
(This article belongs to the Special Issue Energy Economics and Energy Policy towards Sustainability)

Abstract

:
This paper addresses the necessity of adopting renewable energy technologies in order to achieve sustainable development goals in light of increasing global challenges, with a particular focus on the current generation’s well-being. It addresses the potential impacts of global crises, such as energy and food crises, on the transition to renewable energy. Using a descriptive and analytical approach, this paper examines the environmental and economic costs and benefits of renewable energy as well as the commitment of oil-producing countries to international environmental treaties. The research utilises an econometric model to analyse the relationship between sustainable development goals and global challenges. Data from the United Nations Conference on Trade and Development and the International Renewable Energy Agency are used to inform the analysis. The findings showed that the rights and well-being of current generations are currently maintained by the persistent use of fossil fuels in oil-producing nations. Fossil fuels continue to be, and may likely remain, the primary energy source in various sectors of development, despite their significant contribution to environmental and climate issues. The paper offers insights and recommendations for policymakers seeking to determine when government spending should best be allocated to renewable energy technologies, balancing national economic interests with international agreements.

1. Introduction

For sustainable development to be achieved, the needs of both current and future generations must be balanced. The United Nations set out its 17 Sustainable Development Goals (SDGs) in 2015, with many countries following suit, with this aim in mind [1]. SDG 7 aims to increase shares of renewable energy among energy sources globally, expand the adoption of related technologies to protect the environment from climate changes that result from fossil fuel emissions and preserve non-renewable energy sources from depletion [2]. To achieve this, the Kingdom of Saudi Arabia (KSA) has established 13 projects within the National Renewable Energy Programme [3,4]. More government investment must be allocated to these 13 projects for them to achieve their targeted economic, environmental, and social returns in the long term. However, given the energy and food crises that have followed the Russian Ukrainian war, it has become necessary to evaluate whether changes must be made to the current rate at which renewable energy technologies are being adopted [5].
Oil prices rose by an average of USD 116 per barrel in March 2022, which has had a direct positive impact on oil-producing countries [6]. At the same time, however, this positive impact may fade due to the indirect negative impact of the rise in the cost of commodity imports from non-oil countries. The World Bank’s price index for food commodities rose by 14% in the first quarter of 2022, and the ultimate impact of this rise is reflected in the living standards of current generations in oil-producing countries [7]. Therefore, continued investment in renewable energy technologies at the present time may benefit future generations at the expense of current generations. In light of the rise in oil prices, the recent transformations witnessed in the oil market, and the shift of dominance within that market from the forces of demand to those of supply, it may be necessary to change the projected spending timeline for the adoption of renewable energy technologies to achieve the goals of the National Renewable Energy Programme.
Much uncertainty still exists about the relationship between the well-being of oil-producing countries and the adoption of renewable energy technologies [8,9,10]. The main aim of this paper is to explore this relationship in light of global challenges and the necessity of sustainable development. To explain the importance of adopting renewable energy technologies, several tasks must be considered in this study. First, we determine the extent to which adopting renewable energy technologies is necessary to achieve the Sustainable Development Goals (SDGs) given the emergence of global challenges. Second, we address the needs of present generations while also preserving future generations. Third, we explain how renewable energy technologies contribute to the broader goal of sustainable development, which encompasses the protection of the rights of both current and future generations. Furthermore, we investigate the opportunities and challenges presented by global crises to strike a balance between the nation’s economic interests and its obligations under international agreements. Finally, we offer various recommendations to assist policymakers in determining the optimal timing for government investment in projects focused on renewable energy technology adoption. Therefore, this paper makes a major contribution to research on the adoption of renewable energy technologies by demonstrating the global challenges and sustainable development requirements.
This research attempts to achieve the main aim and objectives stated above by applying a descriptive and analytical approach. These methods clarify the research concepts and explain the basic relationships between generations’ well-being and the transition to renewable energy. Moreover, it reviews the status of renewable energy and analyses its environmental costs and economic benefits. In addition, this study utilizes an econometric model that expresses these basic relationships and the extent to which they are affected by global challenges, such as the energy and food crisis. The unbalanced panel data are used for a cross-section representing the 23 countries that belong to the Organization of Petroleum Exporting Countries OPEC and OPEC+ with time series from 2010 to 2021, constituting 222 observations. OPEC member countries currently include Algeria, Angola, Equatorial Guinea, Gabon, Iran, Iraq, Kuwait, Libya, Nigeria, the Republic of the Congo, Saudi Arabia, United Arab Emirates, and Venezuela. OPEC+ is an alliance between a group of major countries and other oil exporters that are not members such as Russia, Azerbaijan, Bahrain, Brunei, Kazakhstan, Malaysia, Mexico, Oman, South Sudan, and Sudan. The annual growth rate index of the average per capita real gross domestic product (GDP) is used to express the well-being of the current generations as a dependent variable in its relationship to the explanatory variables expressing global challenges and the SDGs. The current account balance indicator as a percentage of GDP is used to reflect the state of surplus and deficit in global challenges.
The importance and originality of this study are that it explores the opportunities and crises resulting from the global challenges to oil-producing countries. The share of renewable energy from the total sources of electricity generation is used as an indicator of the shift toward clean energy and the adoption of related technologies to meet SDG 7. The reduction of fossil fuel emissions of carbon dioxide (CO2) to meet SDG 13 is used in the analysis. The model estimation in the short run is based on the generalized least squares (GLS) method by contrasting pooled regression models with fixed effects and random effects. Before the model estimation, unit root testing of the panel data was carried out to verify the stationarity of the time series, followed by tests to check the quality of the results. Data were obtained from the United Nations Conference on Trade and Development (UNCTAD), the International Renewable Energy Agency (IRENA), and the United Nations Sustainable Development Report [1,11,12]. Thus, the analysis enhances our understanding of the role of renewable energy technologies in oil-producing countries.
The remainder of this paper is divided into seven parts. Section 2 deals with the theoretical background and literature review. Section 3 discusses SDGs 7 and 13, and Section 4 analyses the costs and benefits of switching to renewable energy. Section 5 presents the methodology used in this paper and the econometric model. In Section 6 contains the results and Section 7 presents a discussion of these results. Section 8 concludes the paper and proposes recommendations for policymakers.

2. Theoretical Background and Literature Review

More than a century ago, in 1886, the Swedish chemist Svante Arrhenius published an original study, considered the first of its kind, entitled ‘On the Effect of Carbonic Acid in the Air on the Temperature of the Ground’. In this paper, Arrhenius warned of the harms and risks of the increasing CO2 emissions resulting from human activity and the changes that might result in the Earth’s surface temperature due to thermal retention [13]. Although this study did not explicitly state that global warming is due to the burning of fossil fuels, a 1920 study entitled ‘The Problem of the World’s Supply of Energy’ confirmed this to be the case [14]. Thereafter, in 1938, Guy Callendar linked the increase in CO2 in the Earth’s atmosphere to global warming in a study entitled ‘The Artificial Production of Carbon Dioxide and its Effect on Temperature’ [15]. However, despite the risks mentioned in these studies, it would be decades before the world took action to confront the dangers of ‘global warming’ through international agreements.
As awareness of global warming grew, an increasing number of studies were published in the economic literature analysing the role of renewable energy in reducing climate change and achieving SDGs. Abu Al-Leif [16] made it clear that the adoption of renewable energy has a significant impact on achieving sustainable development and contributes to eliminating poverty, improving health, and meeting basic human needs. Sustainable development is also necessary so that current social well-being can be ensured and today’s development and environmental goals can be met without compromising the ability of future generations to achieve their own goals. However, not expanding the use of fossil energy sources poses a challenge that hinders the growth of renewable energy and limits its application. On the contrary, a study by Fischer et al. [17] indicated, using a descriptive analytical method based on the German experience, that it is better to use renewable energies because doing so can meet both economic and environmental goals. The study also pointed out that governments have a role to play in supporting renewable energy by adopting policies and regulations that encourage its production and financing. The importance of the government in fostering the use of renewable energies was demonstrated by the German experience, which can be taken by other countries as a model to achieve comprehensive sustainable development economically, socially, and environmentally. The study confirms that, in order to switch to renewable energy sources and alternative energy sources, specific financially supported goals must be set. Moreover, their implementation must begin via governments and the private sector, and scientific research and development activities must be adopted and innovation and scientific exchange processes supported.
Salah et al. [18] studied renewable energy and reviewed the extent to which traditional energy challenges can be met. They focused on how Egypt can become a more attractive market for the carbon trade and used both inductive and deductive methods for analysing information. The study concluded that Egypt’s dependence on oil constitutes a dependence on a conventional and depleted energy source that is becoming less available and less able to meet future needs and demand; thus, the security of future energy availability is under threat. It is, therefore, necessary to shift to renewable energy sources, such as solar and wind energy, which are only exploited to a limited extent despite being available in large quantities and could be used in the production of electricity, in particular.
Makki and Mosly [19] identified five factors influencing KSA’s decision to adopt renewable energy technologies: government regulations and policies, the degree of knowledge and awareness of renewable energy and the benefits of its use, environmental conditions, the local market, and the availability of infrastructure. The study pointed out the importance of shared responsibility and the role of governments and decision makers in setting policy goals and regulating the process of adopting renewable energy.
Youssef [20] reviewed the current state of renewable energy and what can be expected from it in the future. The study analysed and described the exploitation of renewable energy at the lowest possible costs and the challenges that need to be overcome. It also used a remap programme, that is, a road map adopted by the IRENA that works to create realistic and high-value investments to support countries in the transition to sustainable energy. The study indicated the need to develop incentive policies and systems to adopt renewable energy, support its production, and provide the necessary funding for it including attracting private capital, searching for new methods of financial support, and working with the remap programme. The study concluded that it is necessary to have effective communication strategies that contribute to the implementation of renewable energy production and consumption plans and underlined that it is important that governments are convinced of the economic benefits of this implementation so they will make the necessary investments.
Despite the availability of renewable energy sources in many African countries, most remain reliant on fossil energy; hence, CO2 emissions have doubled over the last 20 years as a result of economic development processes. Seeking to explain this phenomenon, Inal, Addi, Çakmak, Torusdağ and Çalışkan [8] analysed data from a number of African oil-producing countries, namely Angola, Algeria, Equatorial Guinea, Egypt, Gabon, Congo, Libya, Nigeria, and Sudan, for the period from 1990 to 2014 to determine the role of renewable energy and CO2 emissions in achieving economic growth in these countries. While the results of the study showed that CO2 had a significant effect on economic growth in some countries, renewable energy did not have a significant effect on economic growth in all the countries in the study sample. These findings support the neutral theory, namely, that there is no causal relationship between renewable energy consumption and economic growth. The researchers attributed the insignificant effect of renewable energy consumption on economic growth in these countries to the underutilisation of renewable energy sources.
Furthermore, Abban, Hongxing, Nuta, Dankyi, Ofori and Cobbinah [10] applied wavelet coherence analysis to examine the relationship between renewable energy, economic growth, and CO2 emissions from 2000 to 2019 using a dataset of nine oil-producing nations in Africa. The study’s main results showed that there is a positive correlation between economic growth and CO2 emission, as well as a positive correlation between trade openness and CO2 emissions. The study concluded that environmental quality is improved by renewable energy technologies. Consequently, it is helpful for these particular nations to be cautious while consuming a variety of energy sources. In addition, Dilanchiev et al. [21] used panel data analysis to compare the impacts of renewable energy on environmental quality in the top remittance-receiving nations. The paper utilised Cross-Sectionally and Pooled Mean Group Auto Regressive Distribute Lags analysis. The study highlighted how renewable energy and carbon emissions are correlated. In the case of the panel’s developing countries, enhancing environmental quality in the early phases of implementing renewable energy cannot accomplish the intended carbon mitigation impact. But, beyond a certain point, renewable energy starts to play a major role in combating environmental pollution.
On the other hand, Dadashi et al. [22] studied the prospects and developments of energy, the environment, and sustainable development and confirmed that fossil fuels are still, and will long remain, the primary source of energy in most development sectors even though they are the main causes of environmental and climate pollution. The study reviewed areas of clean energy (solar, water, and wind) in the Arab countries and indicated that the solar energy available in these countries because of their climates should be exploited, as this resource is the most likely to ensure success in the process of converting to renewable energy [23].
It is clear from the literature reviewed above that some studies have applied economic and environmental perspectives, in particular, to the relationship between renewable energy and sustainable development to assess the feasibility of replacing energy sources [24,25,26]. Some studies have addressed the global challenges of shifting towards renewable energy [27,28]. Others have concluded that renewable energy is not significant in achieving economic growth and confirmed the continued dominance of fossil fuels as a major source of energy [29,30]. Accordingly, it is clear that no analysis has been undertaken of the impact of the transition to renewable energy and the adoption of related technologies on the well-being of current generations in oil-producing countries, which is the primary aim of the current paper, indicating a gap in the economic literature.

3. Renewable Sources and CO2 Emission

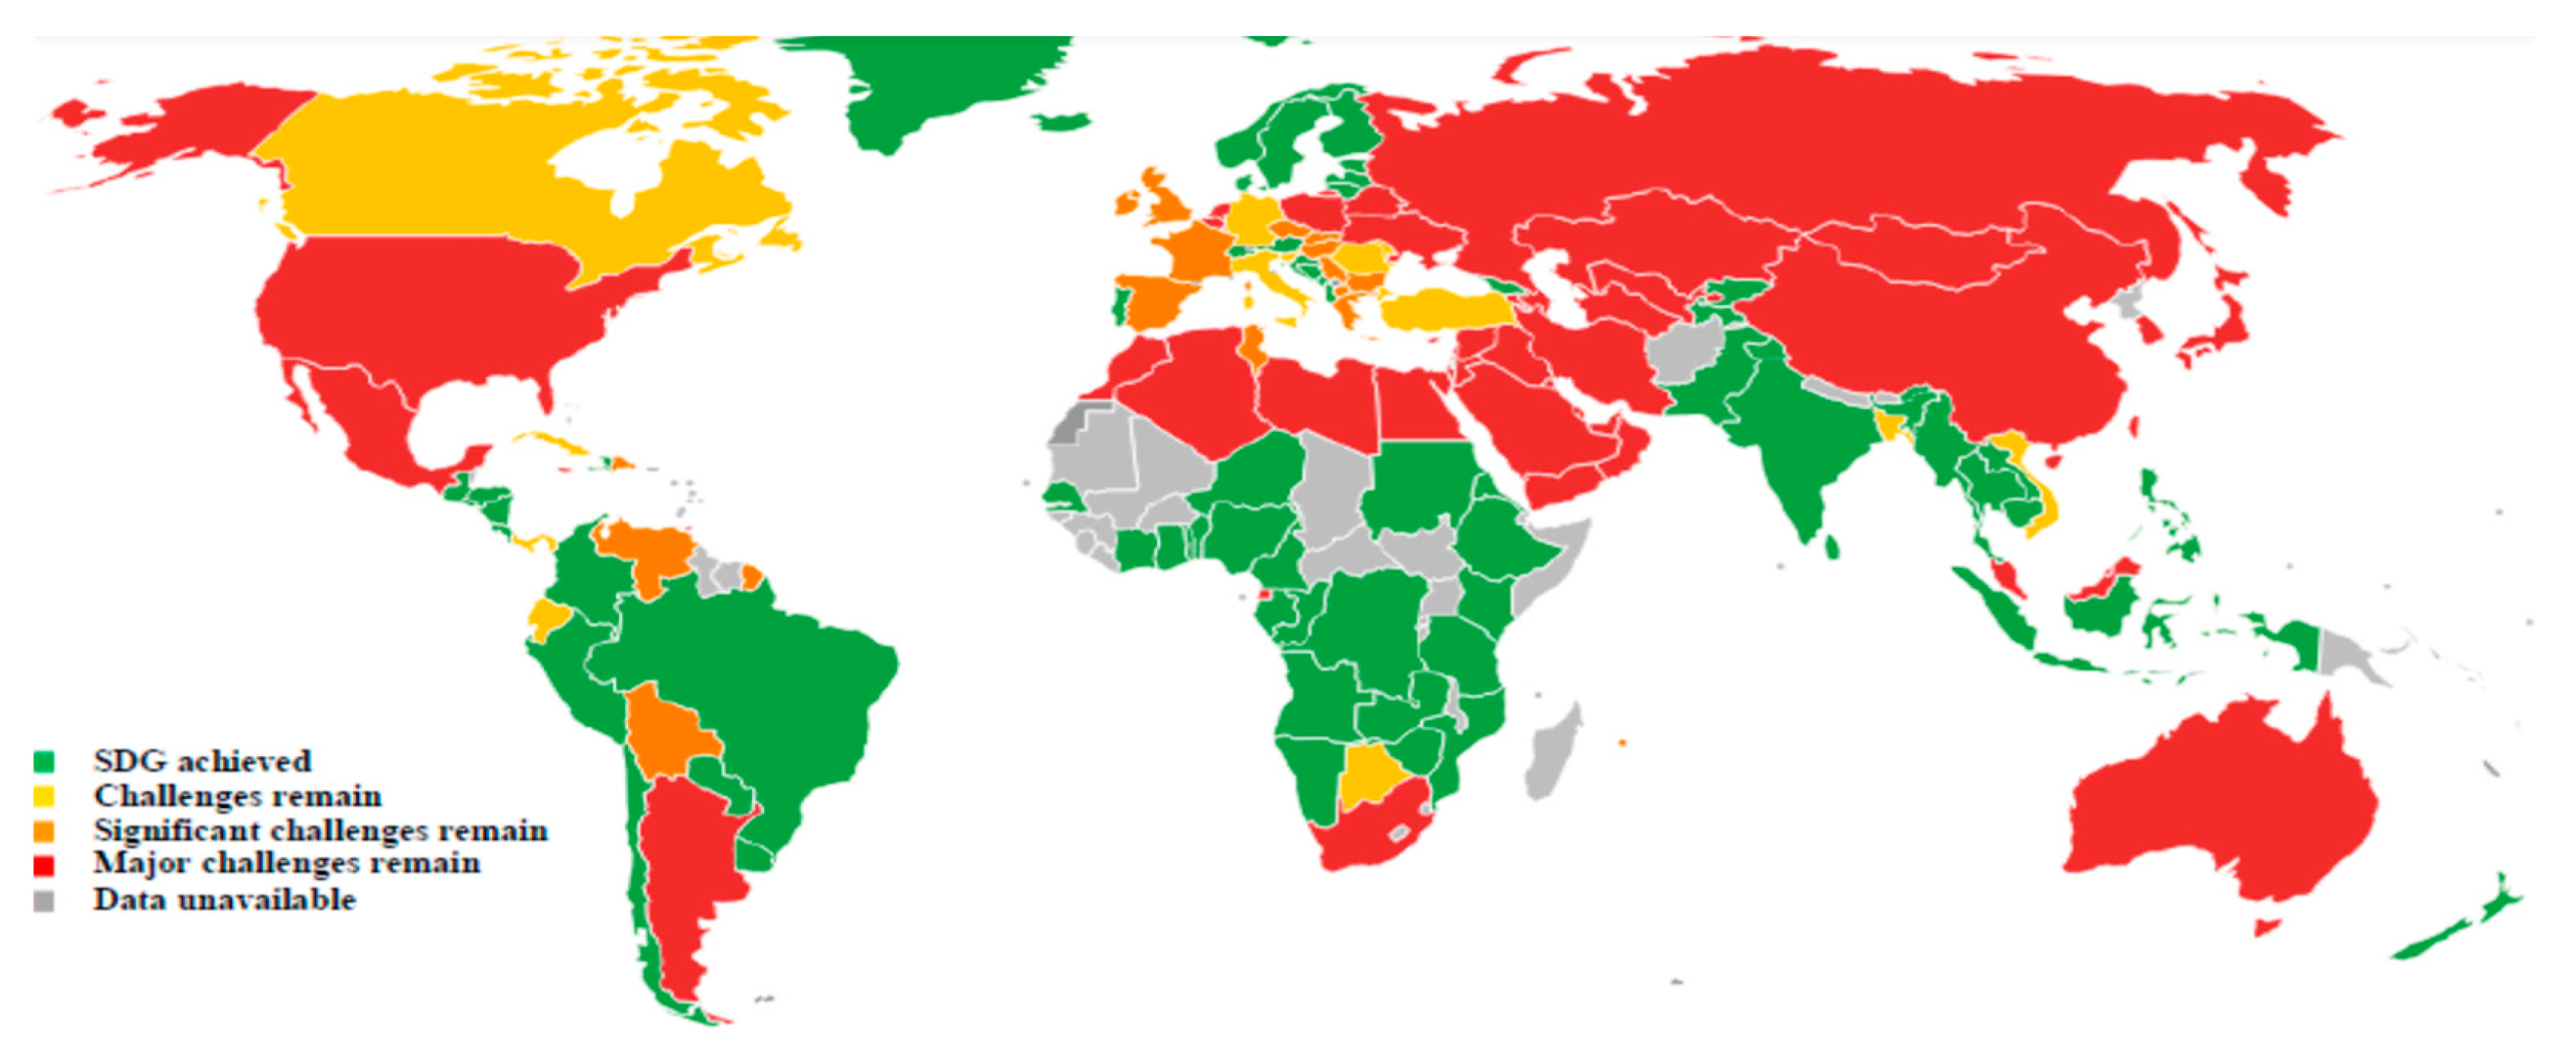
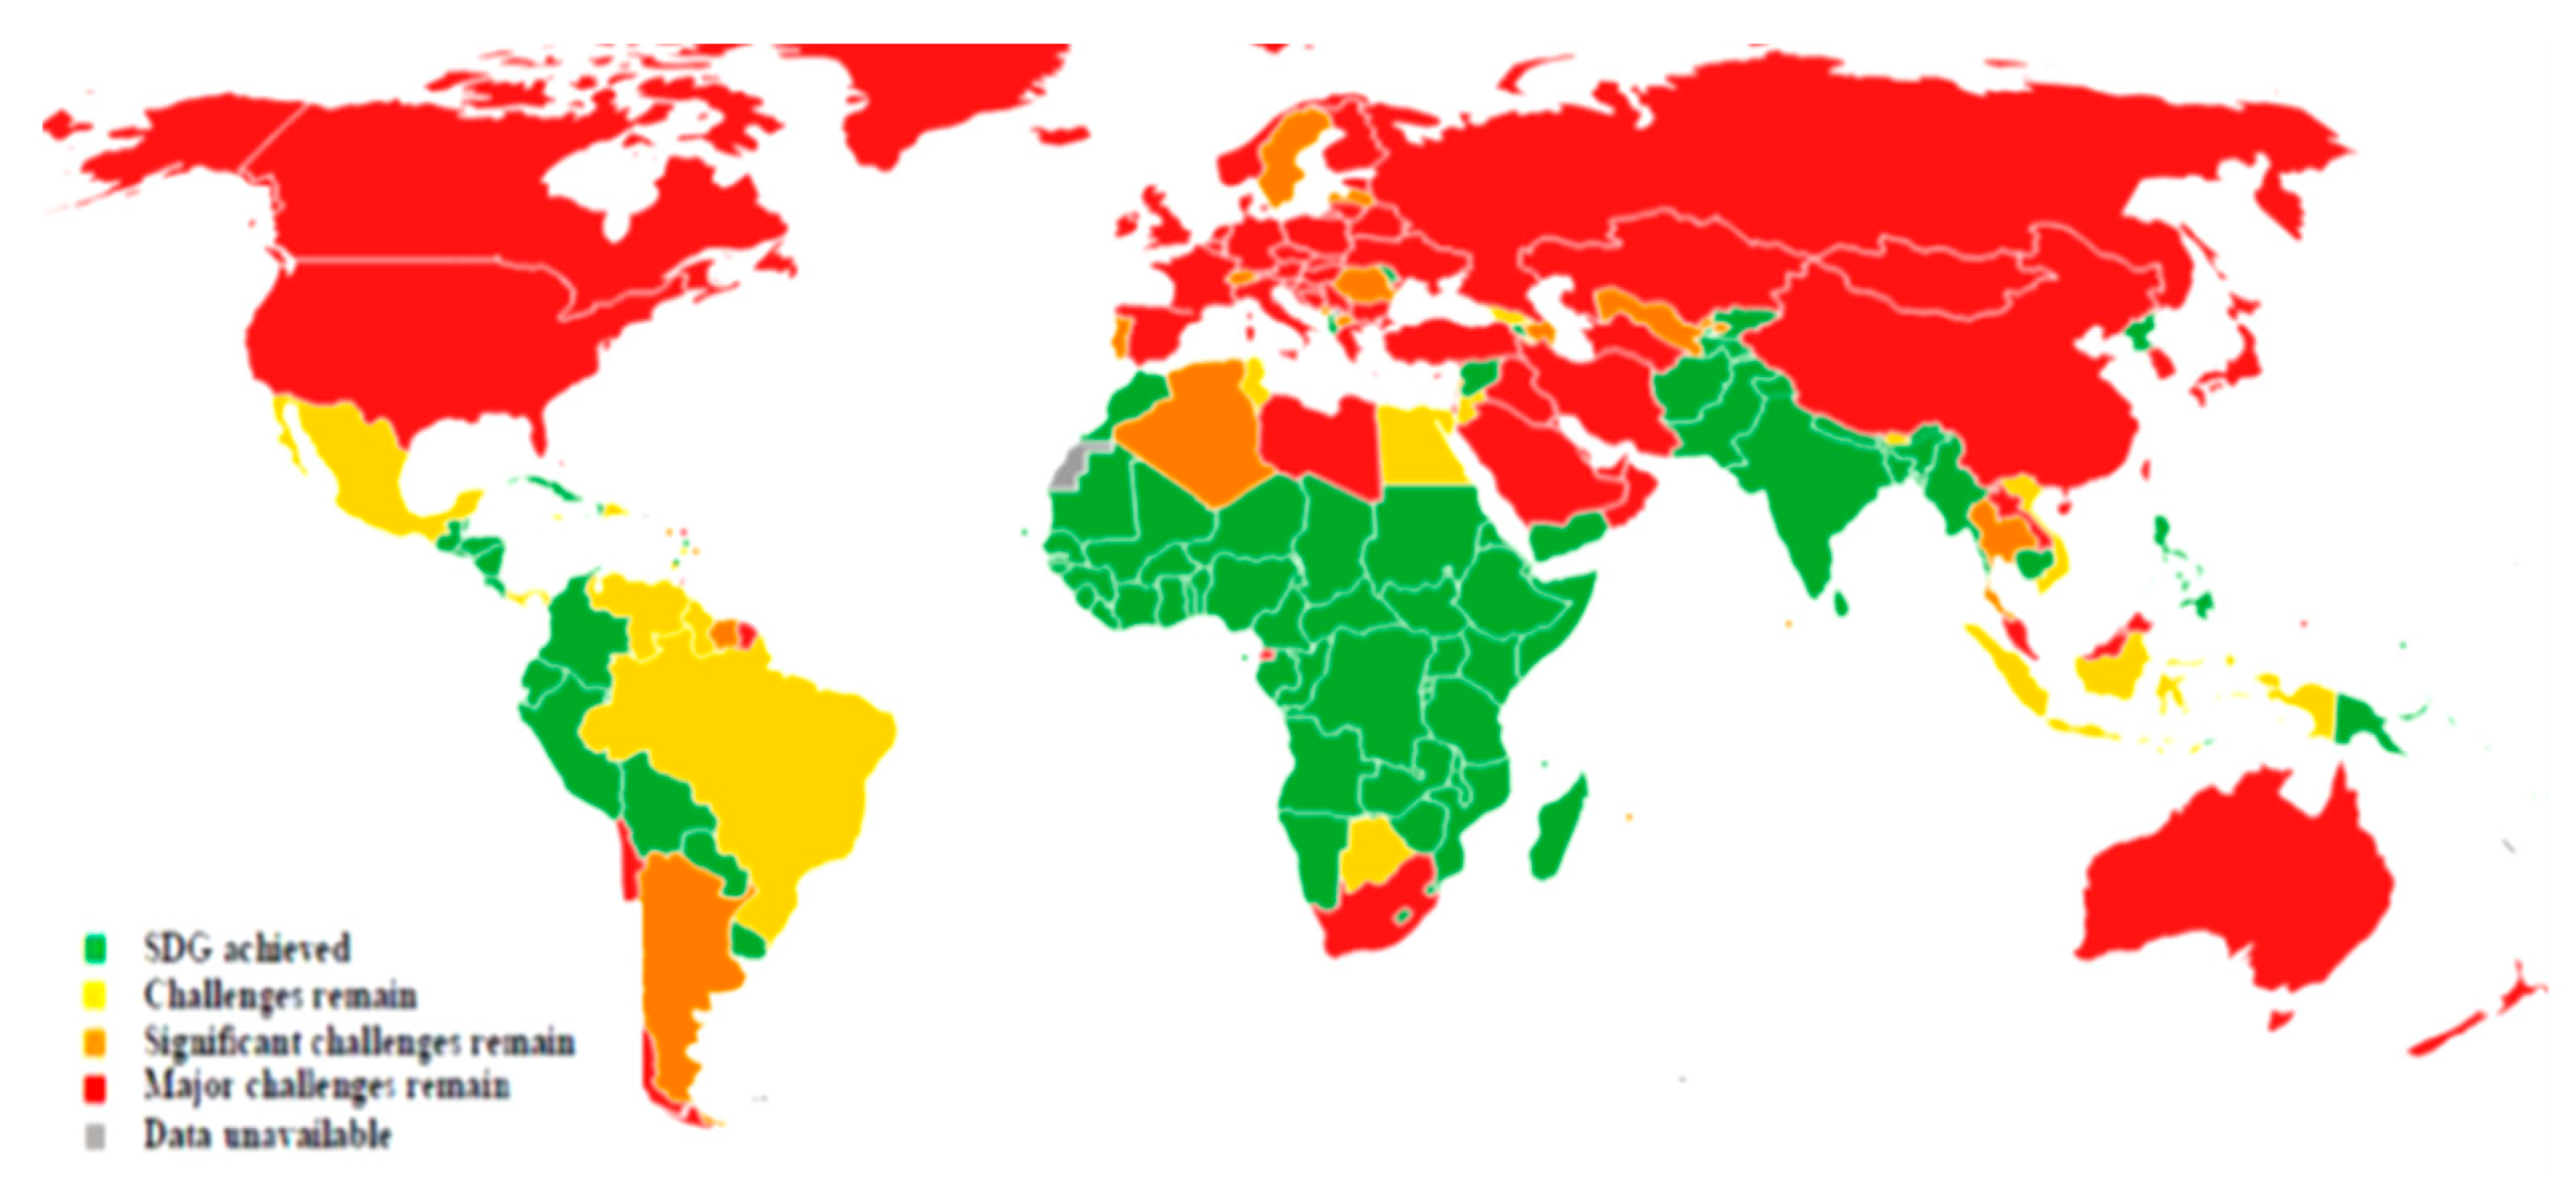
SDG 7 of the United Nations Development Programme (2015) aims to achieve a transition to renewable energy whereby it accounts for 51% of the total primary energy supply by 2030. Figure 1 confirms that only a small number of OPEC and OPEC+ countries have achieved the goal of transitioning to renewable energy, namely, Gabon, Nigeria, Sudan, Congo, and Angola, which are all African countries. Mexico and Venezuela face great challenges and are progressing at a rate that will not lead to their achievement of SDG 7 by 2030. The majority of Arab countries, such as KSA, Kuwait, Bahrain, Oman, and Algeria, face enormous challenges that hinder the introduction of enough renewable energy to achieve the SDGs in the long term: currently, renewable energy does not even account for 1% of total primary energy sources.
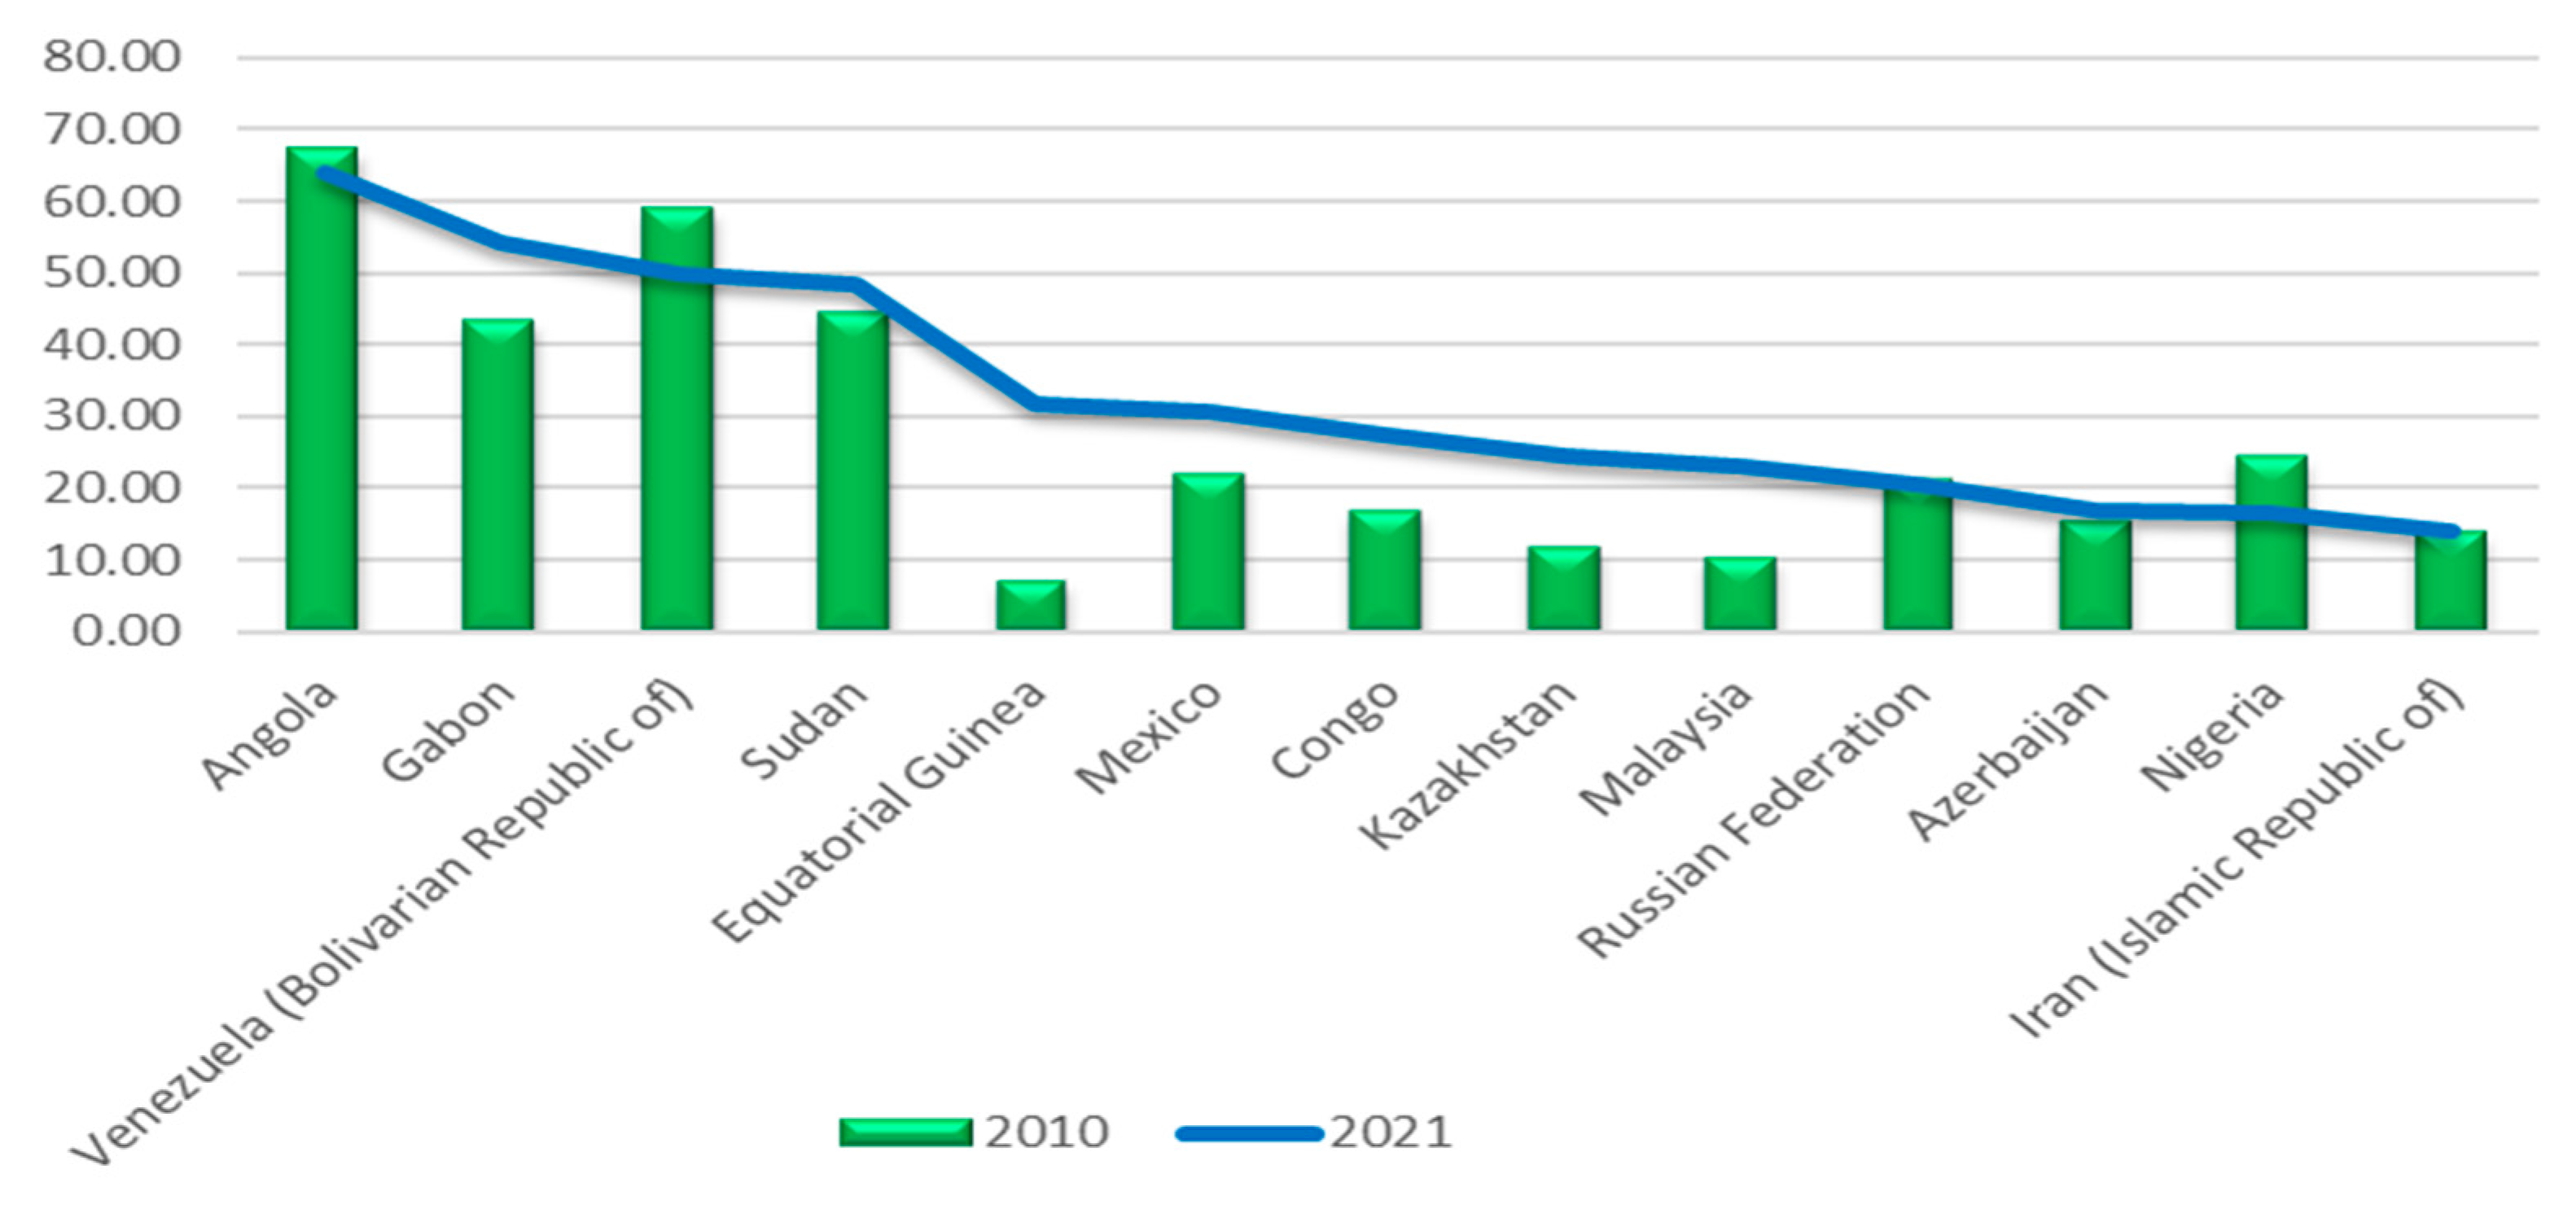
The level of progress of OPEC and OPEC+ countries toward achieving the goal of transitioning to renewable energy can be determined by following up on some indicators of transition to renewable energy. Figure 2 shows the share of renewable energy sources in electricity production for countries in which the percentage of renewable energy increases the electrical power generation capacity (only 13 countries out of all the OPEC and OPEC+ countries in 2021) and compares it to the same percentage in 2010. It is noted that there are no Arab countries among the top 10 countries in terms of the percentage of renewable energy within electrical power generation capacity in 2021. While the average increase of OPEC and OPEC+ countries was 3% of renewable energy in electrical power generation capacity during the period from 2010 to 2021, there was a significant difference among countries, ranging from a decrease of about 8% in Venezuela to an increase of 25% in Equatorial Guinea.
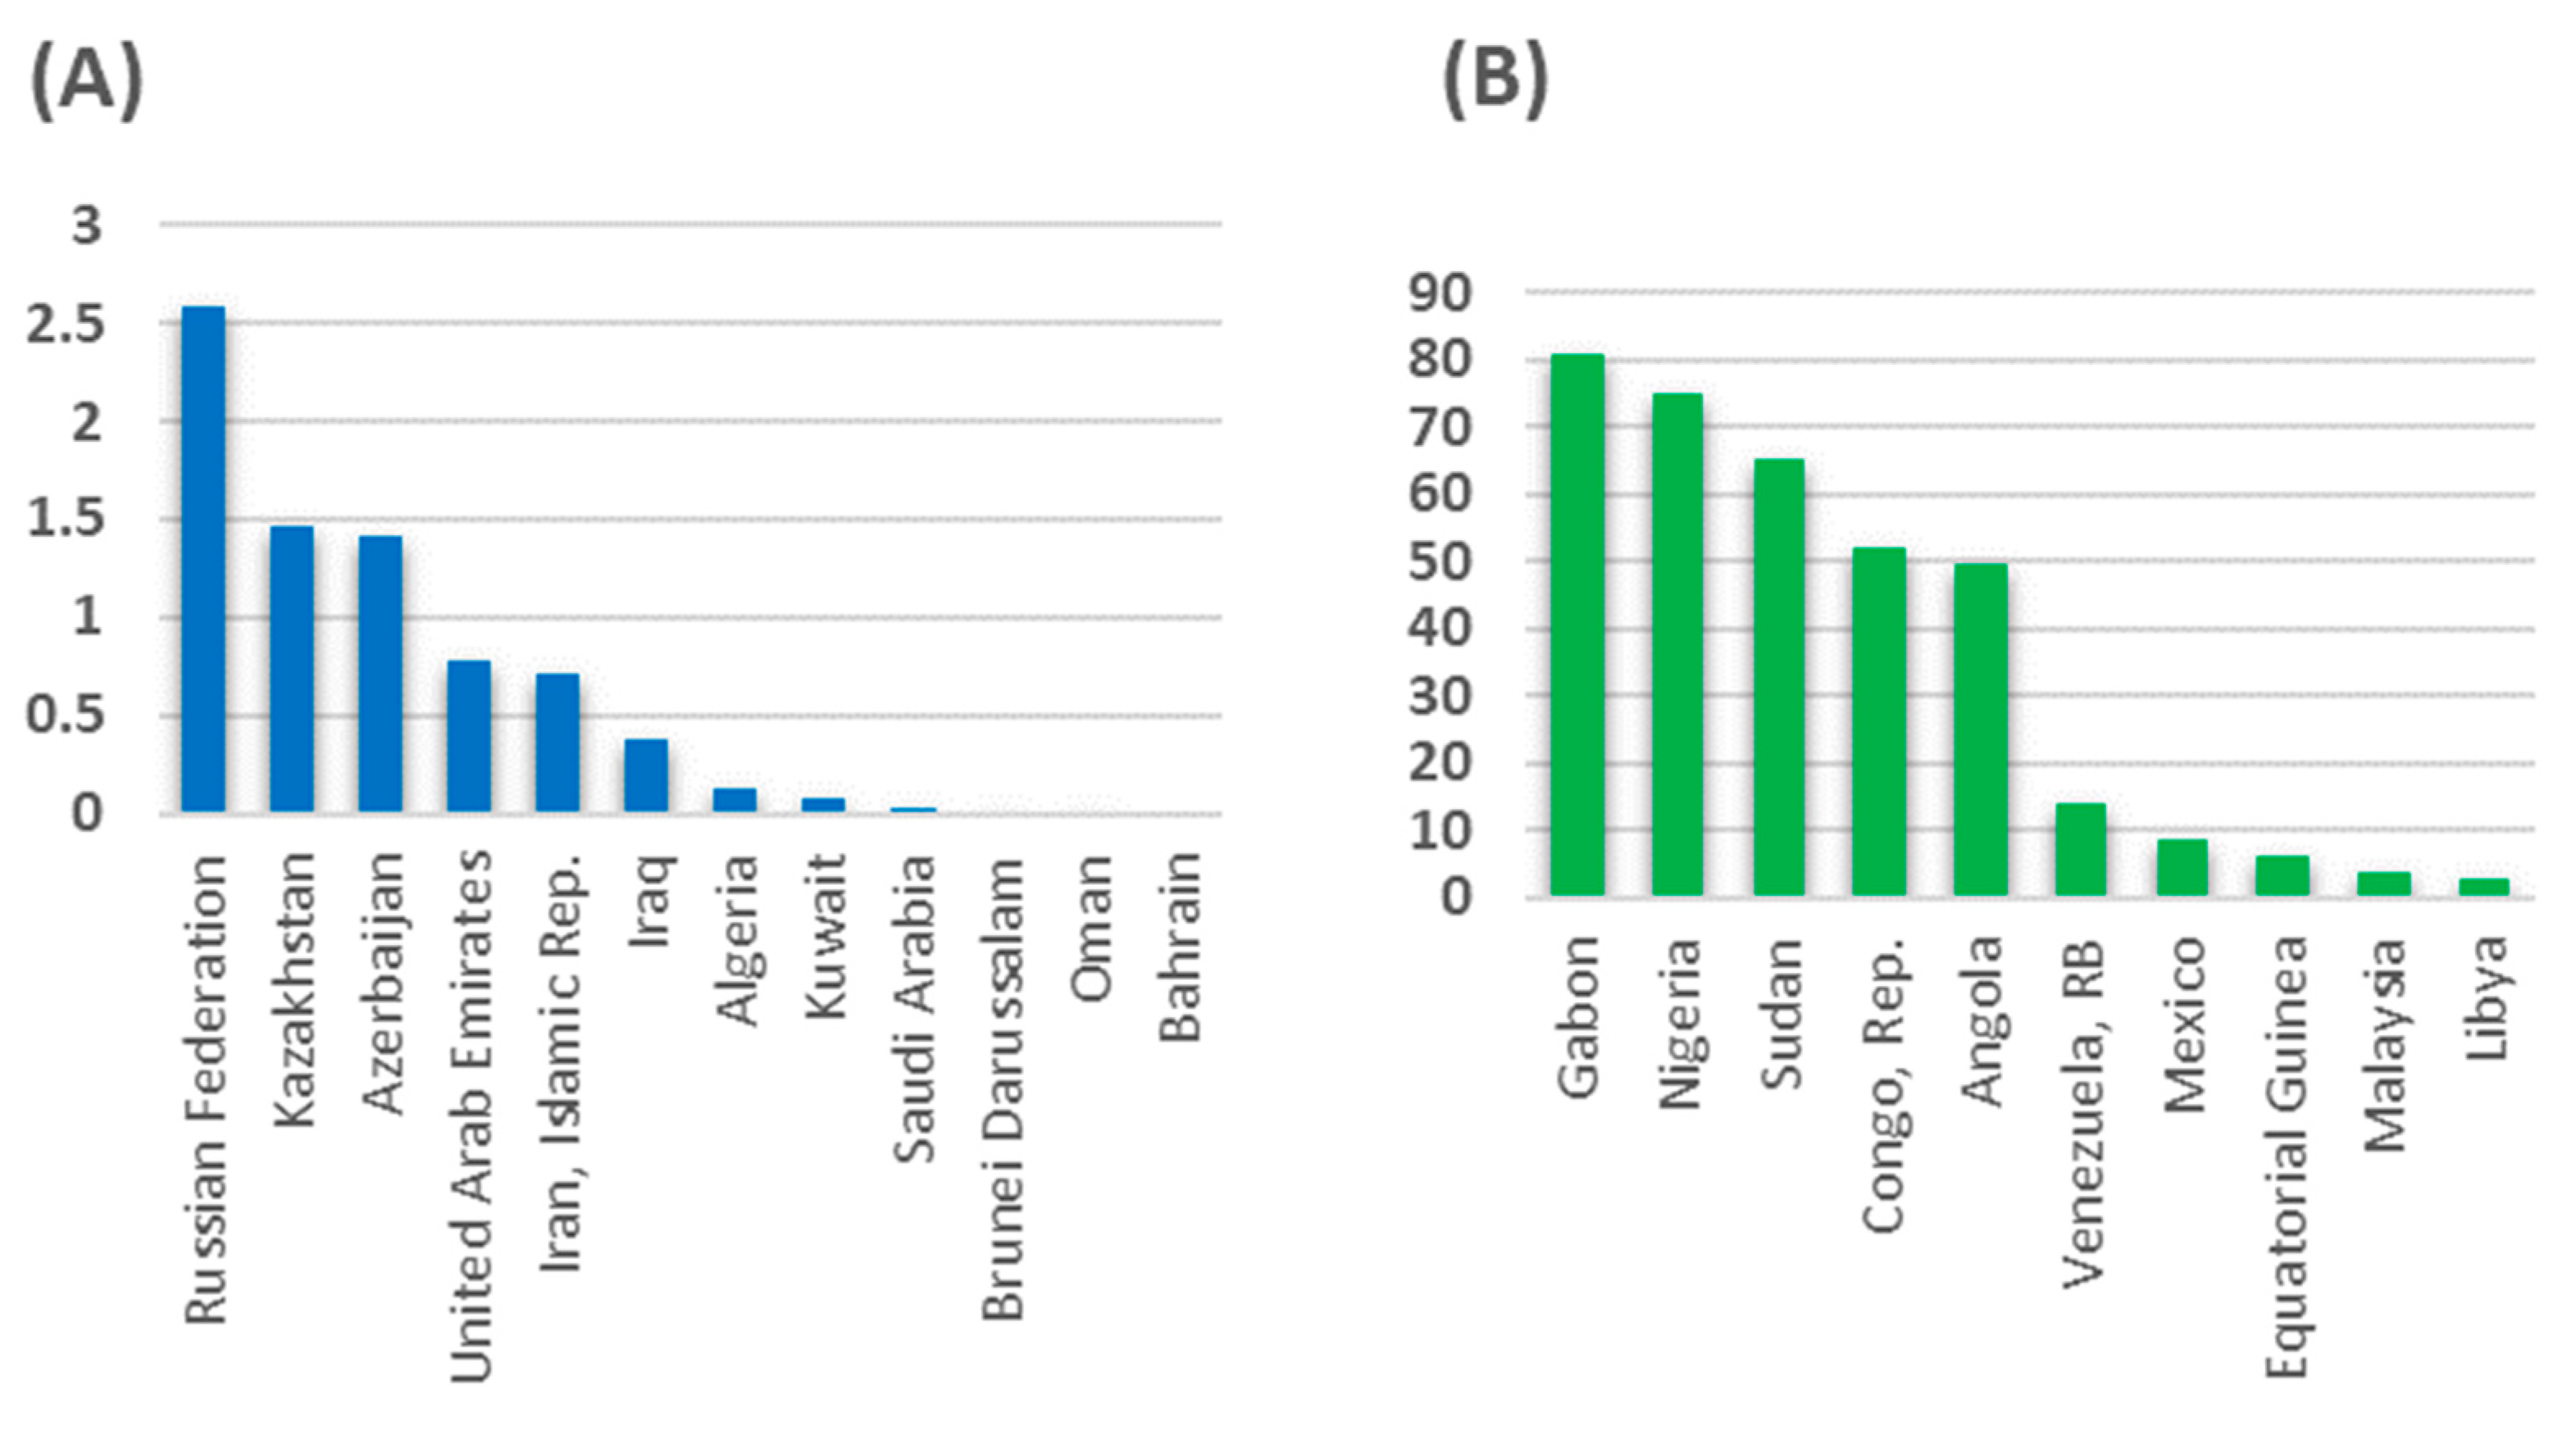
Figure 3 compares the current situation in 2021 for renewable energy sources as a percentage of the total supplies of primary energy sources in OPEC and OPEC+ countries. Countries can be divided for analysis into two groups. In the first group (A), the percentages ranged from 80.83% in Gabon to 2.75% in Libya, while in the second group (B), they ranged from 2.58% in Russia to almost 0% in Bahrain, indicating the large differences among oil-exporting countries in adopting renewable energy sources.
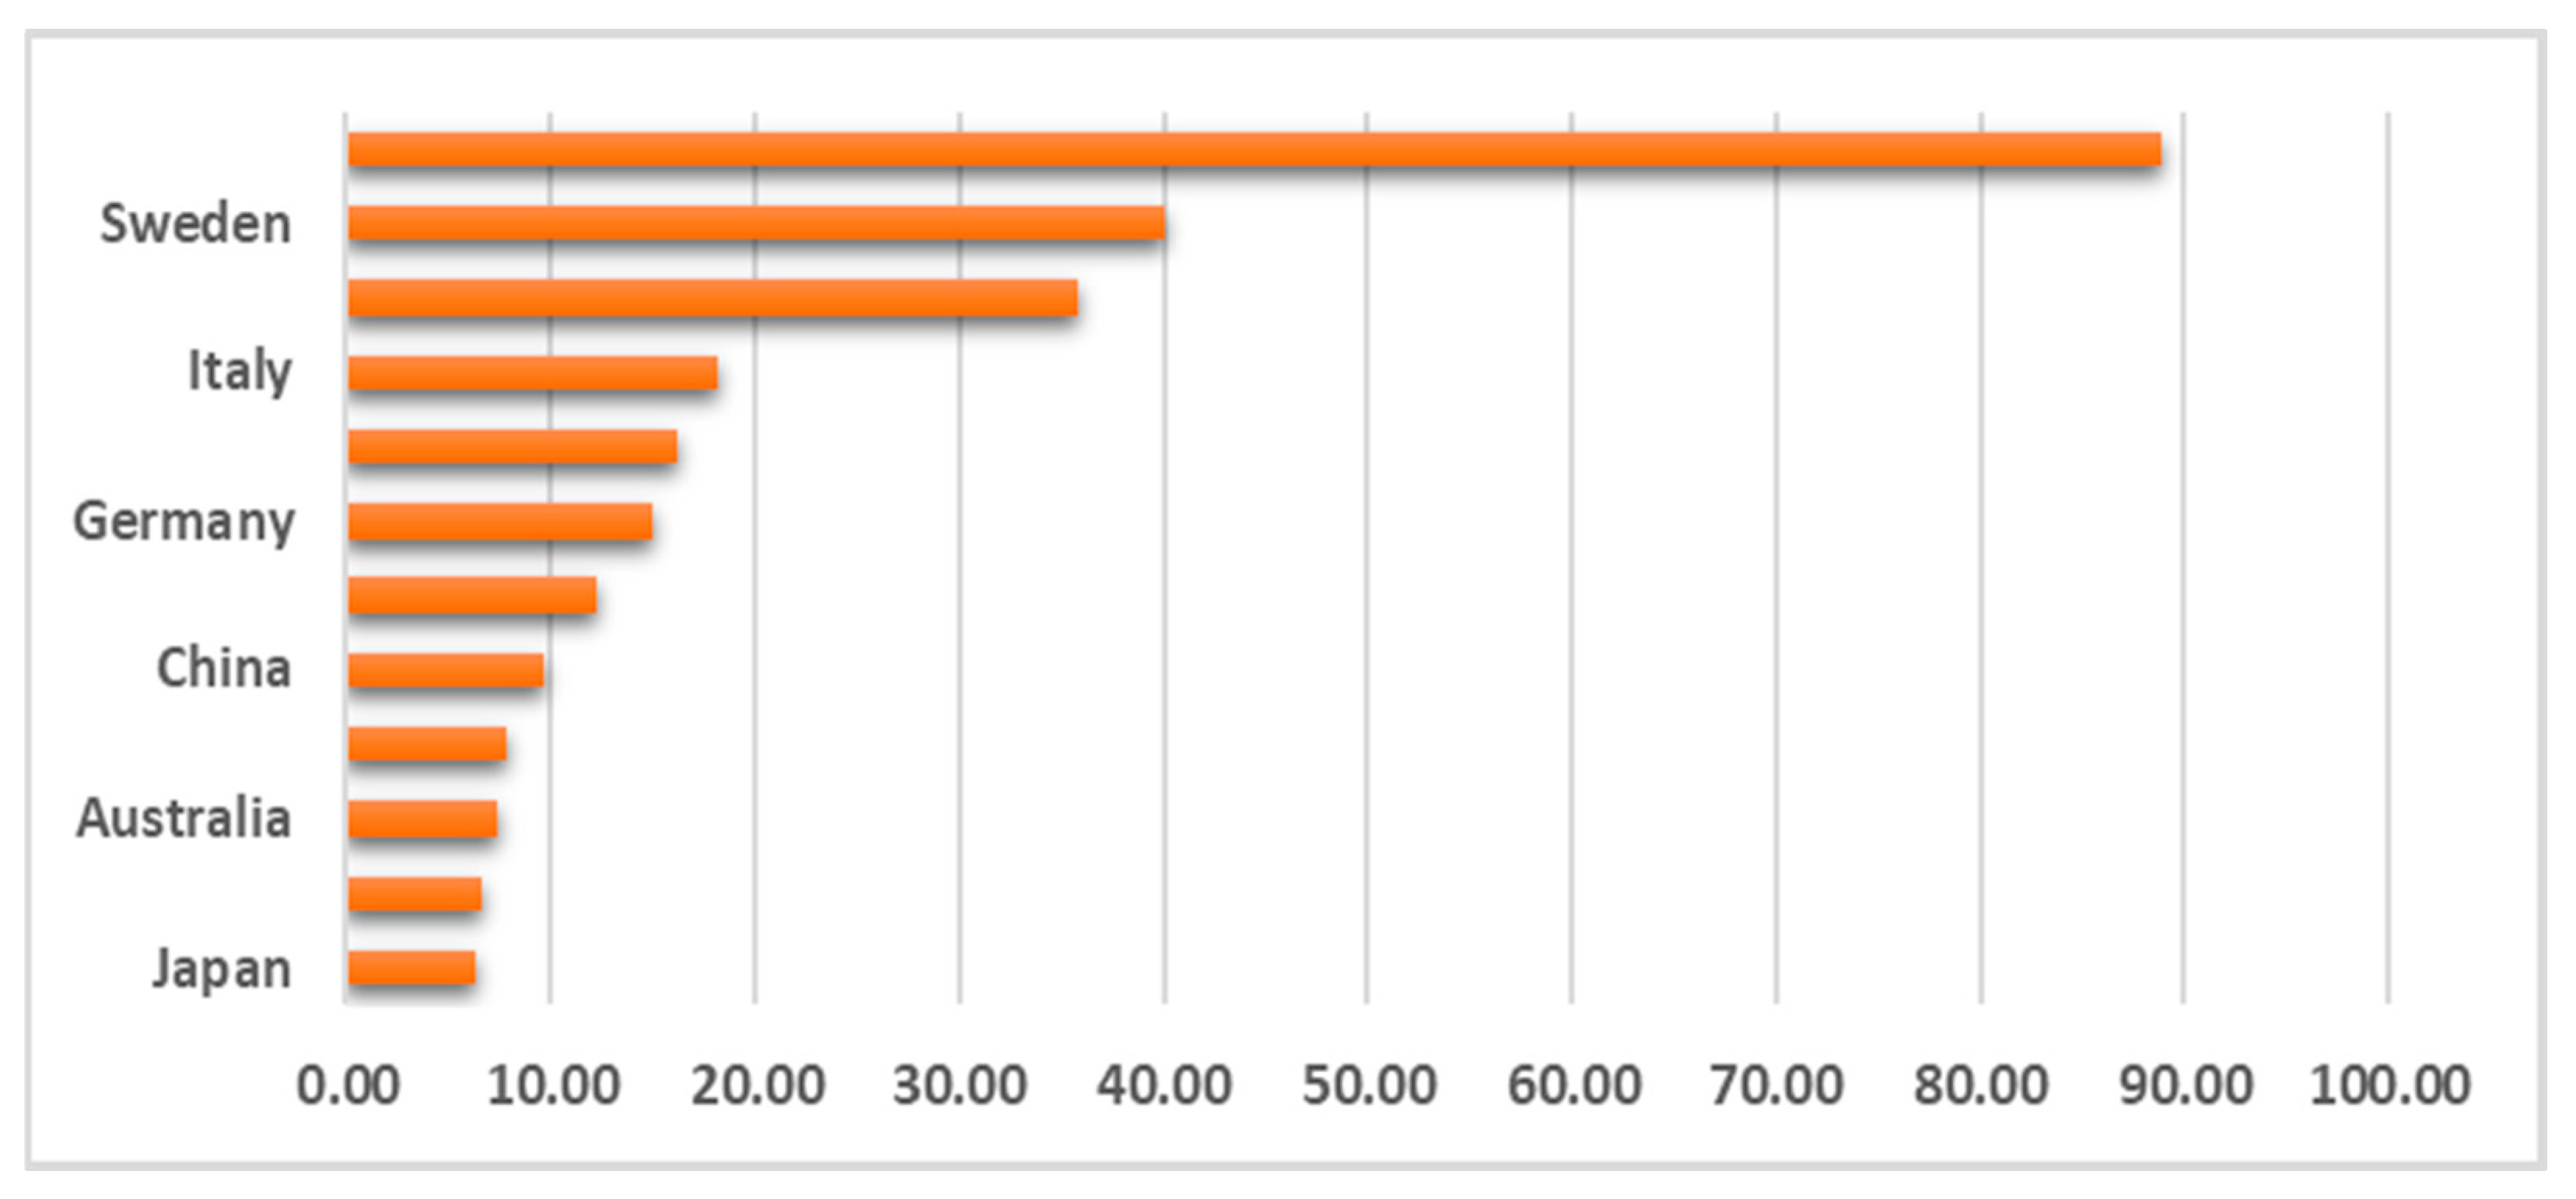
It is noted that the countries with the highest percentage of renewable energy within the total primary energy supply among the OPEC and OPEC+ countries were, with the exception of Sudan, non-Arab countries. The low percentage of renewable energy in the mix of some oil-producing and -exporting countries may be justified by their abundance of fossil energy, but the low percentage in some developed Western oil-importing countries, as shown in Figure 4, is not convincing, especially during the current energy crisis caused by the Russian–Ukrainian war. This is partly due the lobby groups funded by major companies that work in the field of traditional energy production to defend their interests and because establishing new power plants powered by renewable energy requires relatively large investments in infrastructure. Existing policies, investments, and infrastructure in the energy sector were created to favour fossil energy. If it is more economical to run new power plants with renewable energy sources than with fossil energy, the infrastructure of existing power projects may sometimes make it more profitable to continue operating power plants with fossil fuels.
SDG 13 is to reduce CO2 emissions from the burning of fossil fuels and the cement industry to zero by the year 2030. Figure 5 shows that in the African countries (Sudan, Congo, Nigeria, Angola, and Gabon) within the OPEC and OPEC+ group (except Equatorial Guinea), CO2 emissions have been very low. In contrast, most Arab and Islamic countries, led by Brunei, Kuwait, Bahrain, KSA, Kazakhstan, the UAE, and Malaysia, still have high CO2 emissions, which prevents them from achieving the SDGs by 2030. Although Algeria, Mexico, and Venezuela have not yet achieved the required reduction in CO2, they are on the right track and face moderate challenges.
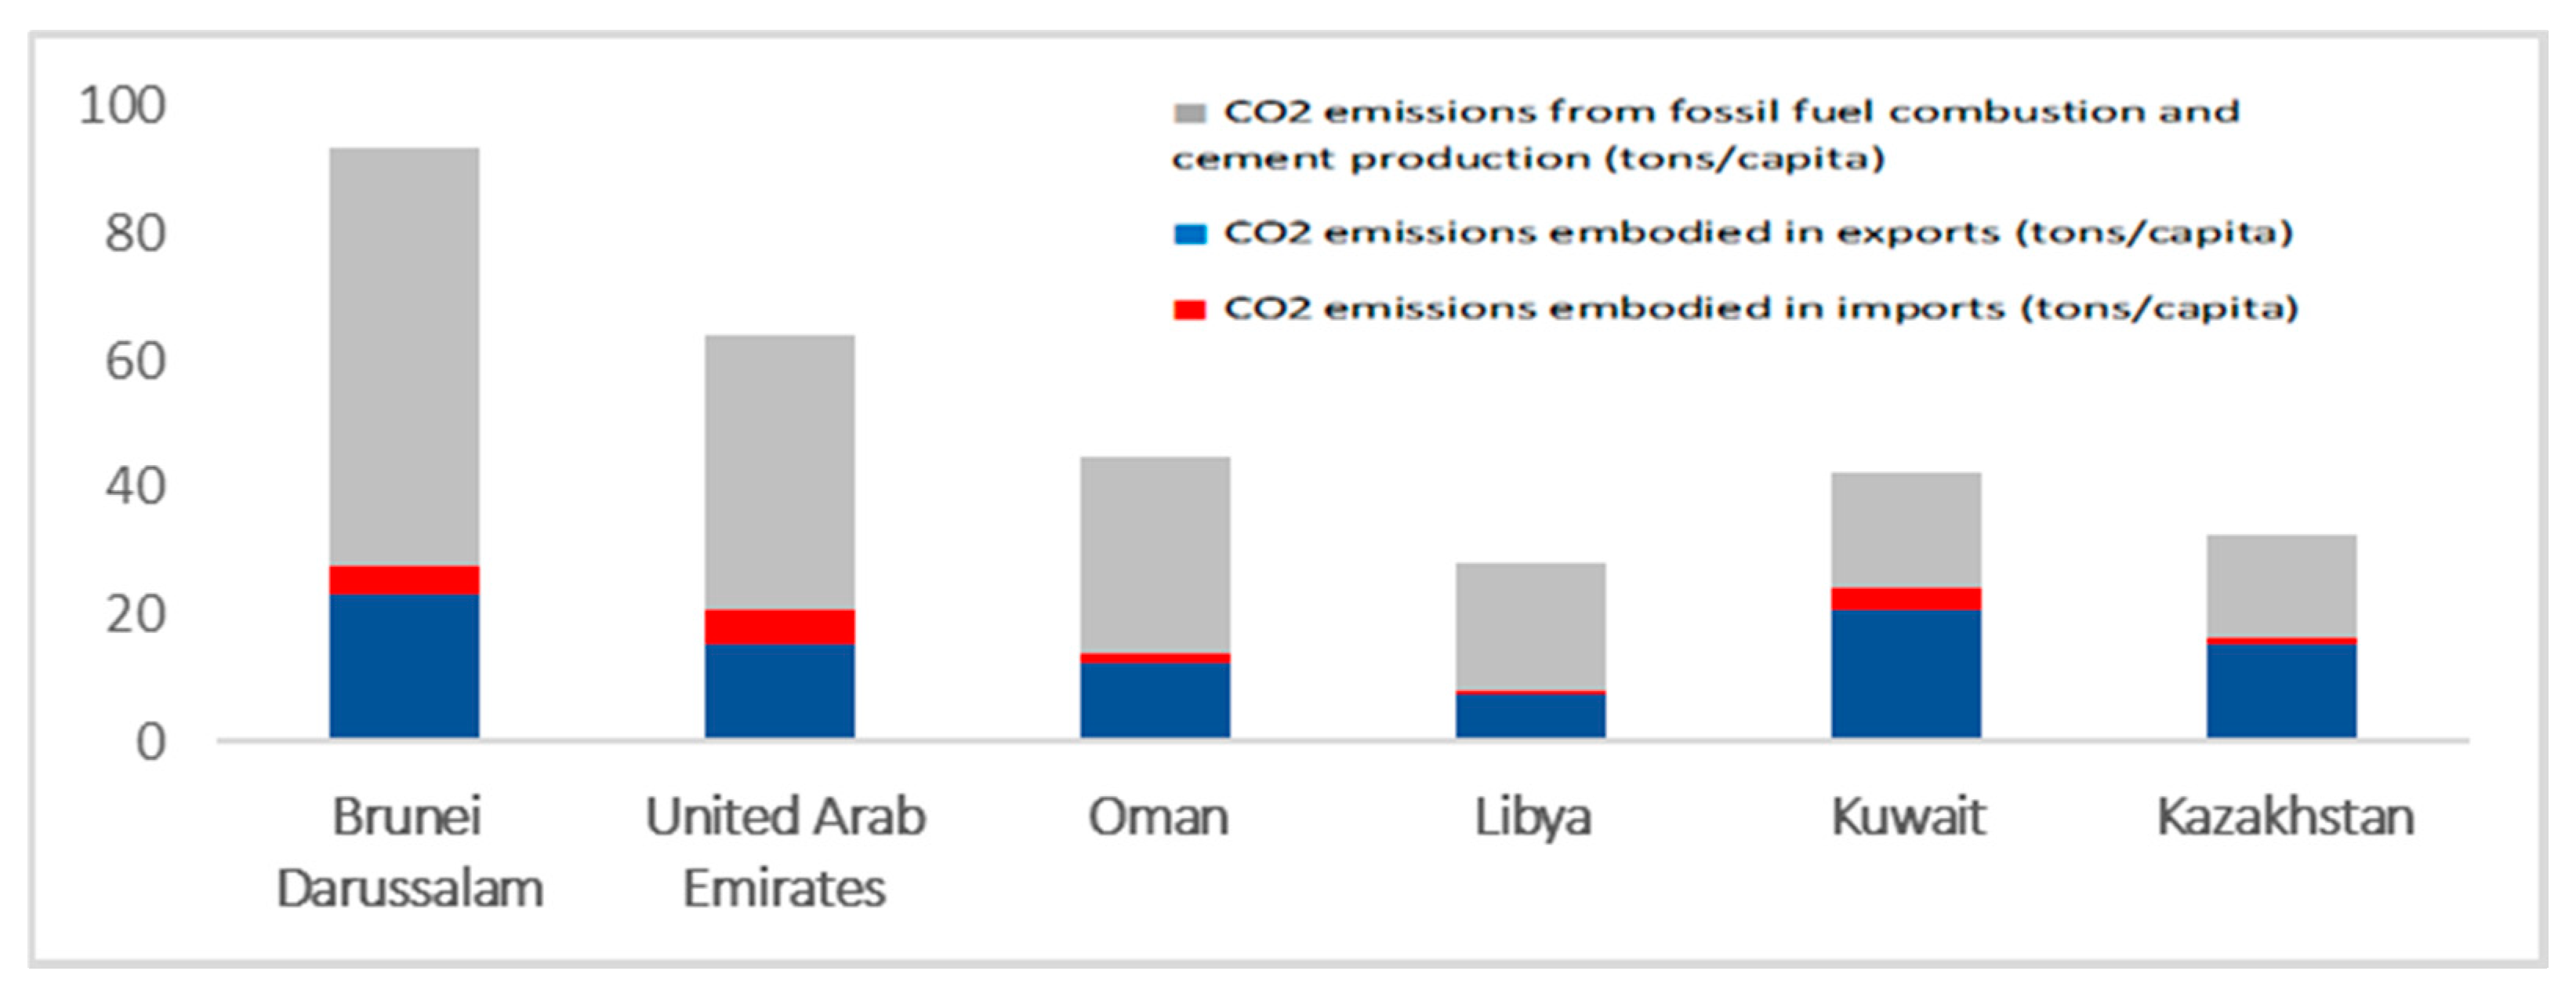
It should be noted that harmful emissions are transmitted not only through the atmosphere that everyone shares but also through international trade in products that rely on traditional energy for their production, as shown in Figure 6. It is not enough for societies to replace traditional energy within their own countries with renewable energy and then resettle environmentally polluting industries in countries whose local environmental laws are less stringent or to encourage the continued import of products produced with traditional energy. Thus, this paper finds that some countries export pollution and others import it as a result not only of importing oil but also importing products that were produced or transported using fossil fuels.
It is expected that the continued growth of people’s awareness of the harms of climate change will contribute not only to supporting the efforts of environmentalists to switch to renewable energy sources but also to supporting the establishment of stricter environmental restrictions on exports and imports, which may have a positive impact on overall CO2 emissions. 
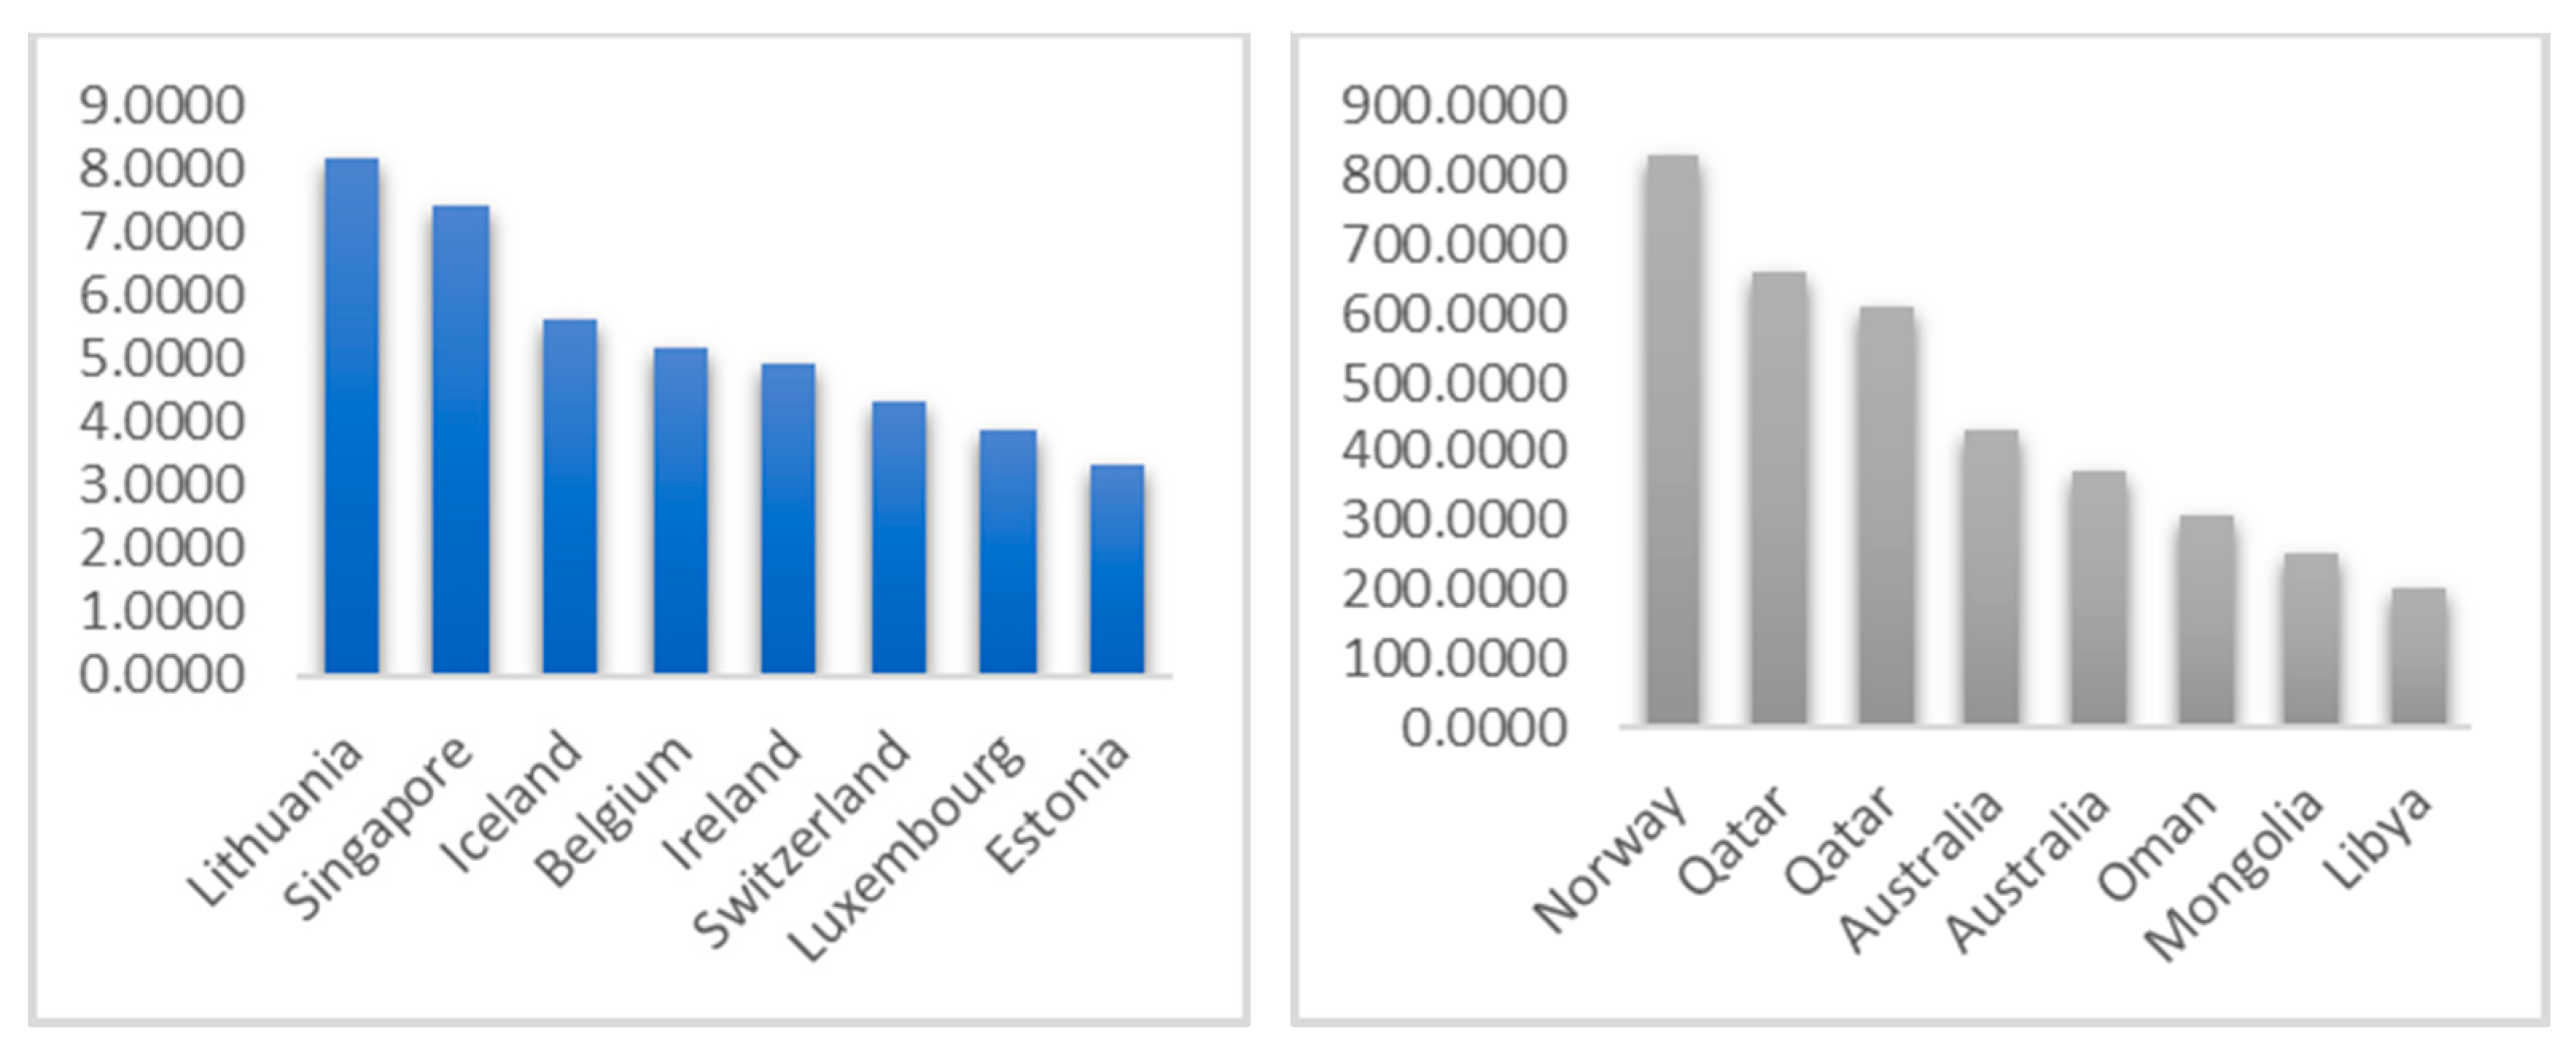
Figure 7 show the countries importing and exporting the most pollution, respectively. Lithuania is one of the largest importing countries, while Norway is the largest exporting country. Although Norway is not a member of OPEC or OPEC+, it is considered one of the world’s largest oil exporters, especially to the European Union and the United Kingdom.

4. Cost/Benefit Analysis of the Transition to Renewable Energy

4.1. Costs of Generating Energy from Renewable Energy Sources

In addition to traditional energy prices, that is, the prices of fossil fuels such as coal, oil, and natural gas, the costs of replacing them partially or completely with renewable energy sources play important roles in determining national environmental policies and the degree of countries’ commitments to international environmental treaties, such as the Paris Agreement. Xiao et al. [32] investigated future scenarios of changes in the estimated costs of investing in renewable energy as the result of ongoing technological progress and the resulting electricity prices until the year 2050 in a large number of published studies and compared these scenarios with market prices and tender prices. Actual auction prices from the IRENA found large discrepancies between studies in estimates of future costs, but they were high overall, which could lead not only to incorrect environmental policies but even to postponement of the energy transition. The period from 2010 to 2020 witnessed a significant decrease not only in the costs of constructing and installing electricity generation projects that rely on renewable energy sources but also in the costs of electricity itself, as can be seen in Figure 8. This situation increased the competitiveness of renewable energy sources versus fossil energy.
According to a report by the IRENA, the addition to the production capacity of electrical energy from renewable energy sources in 2020 was more than four times that of other energy sources [33]. The sharp decline in the cost of electricity generation resulted in the levelized cost of the electricity index. Many renewable energy sources, especially solar photovoltaic (PV) and onshore wind, have often become less expensive than generating electricity from fossil fuels. Several factors have contributed to reducing the cost of constructing power plants operated by renewable energy sources; in addition to technological progress and the learning curve, the use of renewable energy is increasingly widespread. The production capacity of power generation plants based on renewable energy sources, thus, increases as it benefits from economies of scale.
The costs of generating electricity from fossil fuels varied across countries in 2020 according to the type of fuel user and range. According to estimates by the IRENA, these costs were between 0.055 USD/kWh and 0.148 USD/kWh [34]. The lowest cost of generating electricity was using coal in China. Despite this, reliance on fossil energy sources has not decreased as much as expected, perhaps because lobbying groups are paid to defend the interests of the fossil fuel industry (oil, gas, and coal) and closely related industries.

4.2. Benefits of Generating Energy from Renewable Energy Sources

4.2.1. Environmental Benefits

If human activity, represented by the burning of fossil fuels and deforestation, is a fundamental cause of climate change and its devastating effects, then humans can find solutions to the climate crisis through increased reliance on renewable energy sources. The benefits of increasingly using renewable instead of traditional energy sources are measured by the value of the tons of carbon that were not produced. Table 1 shows the amount of reduction in CO2 emissions that could result from replacing uneconomical coal-fired power plants with ones powered by solar or wind energy in some of the major coal-consuming countries in the world. The numbers can also act as an indicator of possible CO2 reductions and savings that might be achievable if oil plants were also replaced by renewable energy resources.

4.2.2. Economic Benefits

While there is little doubt that adopting renewable energy reduces CO2 emissions, the role of renewable energy in inducing economic growth is less clear. A study on Africa’s top 10 oil-producing countries from 1990 to 2014 shows no significant effect of renewable energy on economic growth in accordance with the neutrality hypothesis, which assumes that renewable energy consumption plays an insignificant role in explaining economic growth [8]. On the other hand, a study on BRICS countries and 25 OECD countries from 1995 to 2021 opposes the neutrality hypothesis and found evidence to support the decisive role of renewable energy production and consumption not only in reducing CO2 emissions but also in fostering sustainable economic growth [35]. The differing results of the two studies [8,35], which might indicate that oil-producing countries benefit less than oil-importing countries from the transition to renewable energy sources, need further study.
As only profitable investment in renewable energy can be sustainable in the long run, an important aspect leading to the expansion of sustainable energy technologies is the profitability of investments in renewable energy in the private sector, which is affected by the policy support of the government. Governments aware of the various welfare implications of renewable energy and offer various incentives and financial support to encourage private investment in renewable energy. Different national energy policies might explain the uneven expansion of renewable energy across the world. According to the World Energy Investment Report 2023, more than 90% of the increase in clean energy investment since 2021 took place in developed countries and China [36].
The importance of government support is also evident in a study on renewable energy electrical power facilities in Italy, where it was shown that long-term profitability relied on financial support and that intended future reductions in financial support must be accompanied by significant reductions in cost [37]. Bertsch and Di Cosmo [38] applied a simulation model of power systems covering the European electricity market to analyse the profitability of wind and solar energy investments across European countries and found evidence that investments become less subsidy-driven once there are noticeable cost reductions. As the profitability varies considerably among European countries, the study suggests that coordination among countries could lead to higher profitability than countries following their national interests. Another important result indicates that, while wind offshore and solar PV are expected to be profitable by the year 2030, the profitability of wind offshore remains dependent on financial support [38].
Another important economic benefit of transitioning to renewable energy is the continued increase in related jobs, including jobs in construction, processing, manufacturing, operations and maintenance, and sales and distribution. Figure 9 shows an increase in the number of these jobs globally, from 7.28 million to 12.67 million in 2021, or 74%. China and the United States accounted for nearly half of the total jobs, at 42% and 7%, respectively, in the global renewable energy sector [39].
However, the ability of the renewable energy sector to create new jobs varies depending on its type and the technologies used. Figure 10 shows that solar PV energy accounted for the largest share of jobs, at about 34%, followed by liquid biofuels and hydroelectric energy, at about 19% each, and wind energy, at about 11%.
With regard to the number of jobs in the field of renewable energy in those OPEC and OPEC+ countries for which data are available, non-Arab countries were at the forefront, as shown in Figure 11. Malaysia, Mexico, and Russia increased the number of jobs in the energy renewable sector by more than 60,000 jobs, while Azerbaijan and Algeria have fewer than 10,000 jobs. This is despite the fact that most oil-exporting Arab countries have huge potential to convert to solar energy due to their geographical locations.

5. Methodology

The paper seeks to confirm if it is imperative for oil-producing countries to prioritize achieving sustainable development, particularly in meeting SDGs 7 and 13. This includes adopting renewable energy technologies, transitioning to clean energy, and reducing fossil fuel emissions to ensure the well-being of future generations. Given the escalating global challenges that unquestionably affect the well-being of present generations, it is essential for governments to prioritize such endeavours in their spending allocations.
Based on the fact that, first, previous studies have principally sought to shed light on the rights of future generations and, second, striving to achieve the SDGs will lead to preserving such rights, this research will take a different approach. It will focus on the rights of current generations by formulating an econometric model to estimate the impact of achieving the SDGs, particularly SDG 7, and the challenges seen in the global economic arena on the well-being of the current generations in the short term using the GLS method based on unbalanced panel data. The paper includes 222 observations representing 23 oil-producing countries (OPEC and OPEC+ countries) during the period 2010–2021 to reflect some of the relatively recent global changes and countries’ commitments to the SDGs. According to Baltagi [40], panel data deal with omitted variable bias due to heterogeneity in the data by controlling for variables that we cannot observe, are not available, or cannot be measured but are correlated with the predictors. In addition, panel data give more informative data, more variability, and less collinearity among variables.
R G D P _ P C i t = α i + β 1   C B i t   + β 2   R E _ E L C i t + β 3   C O 2 i t + μ i + e i t
where αi is the unknown intercept for each country (n country-specific intercepts).
β 1 ,   β 2 , a n d   β 3 parameters to be estimated represent a common effect across entities controlling for individual heterogeneity, i = 1,…, n; t = 1,…, T. The dependent variable for country i at time t is R G D P _ P C (growth in real income per capita), which represents the well-being of current generations, while the independent variable C B is the current balance as a percentage of GDP-expressed global challenges. The seventh goal of sustainable development, SDG 7, is R E _ E L C , which is related to the transition toward clean energy. SDG 13 relates to climate change and reducing CO2 emissions from fossil fuels. ui is the within-entity error term; eit is the overall error term. Table 2 shows the model variables, measurement indicators, and data sources.
Descriptive statistics indicate heteroskedasticity via high Std. Dev. and large differences between the mean and median are showed in 
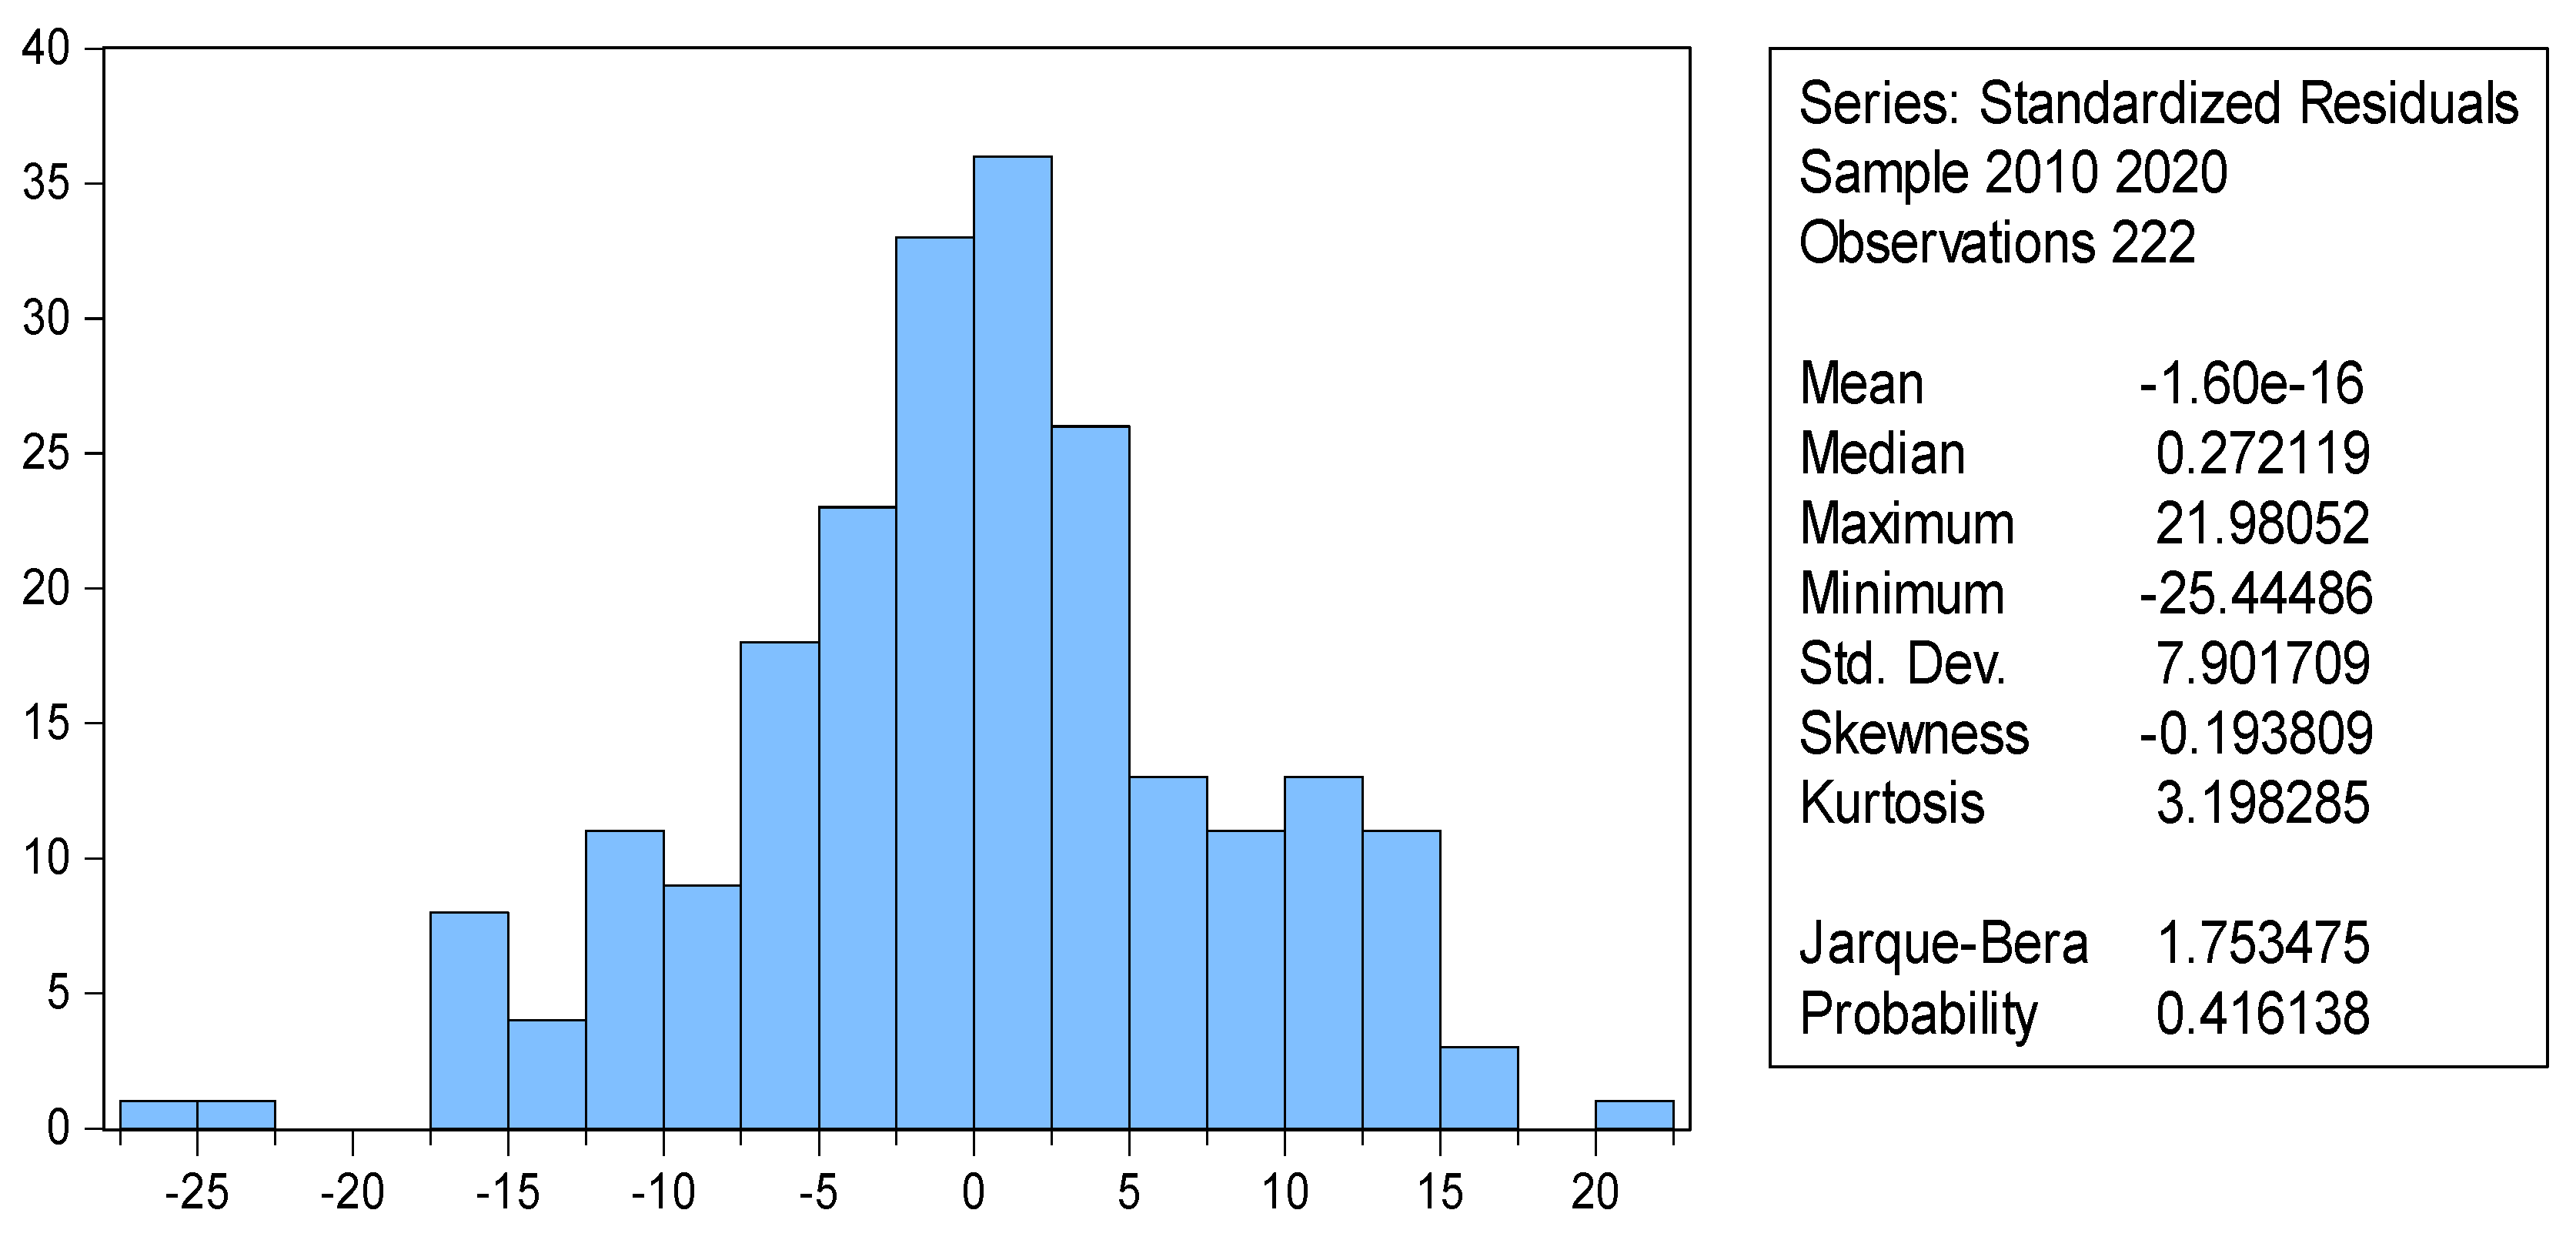
Table 3. This problem can be treated using a fixed effects model which assumes homoskedasticity where the variance of the error term does not systematically change across observations. In addition, there is a non-normality in the predictor variables according to Jarque Bera probability. Although non-normal predictors do not violate the conditions required to estimate the econometric model using the suggested three methods, it will be essential to verify that the error terms from the estimations’ results are normally distributed.

6. Results

Estimating the econometric model requires first verifying that the time series of the model variables are free of a unit root and, therefore, stationary.

6.1. Results of Estimating Time Series Test for Panel Data

Table 4 shows the results of the unit root test for panel data, which showed stability and stationarity of the time series at the level of all the variables of the econometric model, according to most of the tests shown in the table, at a significance level of 5%. The null hypothesis of the presence of a unit root in the time series was rejected for these tests, and the alternative hypothesis was accepted, namely, that there is no unit root in the time series. Thus, it is possible, using the least squares method, to reach results that are free of the possibility of spurious regression.

6.2. Estimation Results of Econometric Model Parameters

Model parameters were estimated using the estimated GLS method with the use of cross-section weights panel EGLS (cross-section weights). The estimation was based on three methods: the pooled regression, fixed effects, and random methods. The pooled regression model ignores individual and time effects, treating the data as a single pool and estimating a common intercept for all observations, while the fixed effects model assumes that each country in the cross section differs in its fixed term, and the random effects method assumes that each country in the cross section differs in the error term from other countries [40]. Cross-section weights are used to give different countries varying levels of importance in the analysis. This is particularly important for the study, as it involves a diverse range of oil-producing countries with varying sizes, economic structures, and energy sectors. Therefore, this can help to reduce bias by accounting for heterogeneity across oil-producing countries and achieving consistent and efficient estimates, which algins with [41,42]. Table 5 shows the estimation results.
Cross-section fixed effects can control for the unobserved heterogeneity by allowing each cross-section to have its intercept, as shown in Table 6, while our attempt to apply time fixed effects resulted in the presence of heterogeneity across cross-sections; this suggests that some unique characteristics or shocks are specific to each cross-section (oil-producing country) and are not captured by time fixed effects.
The values show a mix of positive and negative effects, some of which are relatively large in magnitude, which would typically be interpreted as evidence of heterogeneity. This heterogeneity could be due to various unobserved factors that are specific to each unit and influence the dependent variable. This may make the fixed effects model the more appropriate method to account for heterogeneity by allowing each unit to have its own intercept. To investigate its fitness compared to the other two models, a redundant fixed effect was first conducted, as shown in Table 7, to compare the pooled regression and fixed effects estimation methods; the null hypothesis was that the pooled regression model is the best, and the alternative hypothesis was that the fixed effects model is the best. If the p-value was less than 5%, the null hypothesis would be rejected and the alternative hypothesis accepted, indicating that the fixed effects model is the best.
A graded Hausman test was carried out to compare the fixed and random effects models [43]. It was based on the null hypothesis that the random effects model is the best and the alternative hypothesis that the fixed effects model is the best. As can be seen from the test results, the value p-value is less than 5%; therefore, the null hypothesis is rejected and the alternative hypothesis is accepted, which indicates the superiority of the fixed effects model to the random effects model, as shown in Table 8.

6.3. Robustness of Model Results

A Durbin–Watson statistical test was run to check the quality of the model results. The results of estimating the fixed effects model are free from the serial correlation problem serial correlation between the remainders where the value of the test statistic reached 1.566015 close to 2. To ensure the quality of the results obtained, further tests were required. The correlation between the independent variables was tested to ensure that the results were free of the problem of linear correlation between the independent variables and multicollinearity by testing the normal distribution of the residuals [44]. The results of the correlation between the independent variables shown in Table 9 indicate that the correlation coefficients are close to zero, confirming that the results are free of the problem of linear correlation between the independent variables. The probability value of the test was Jarque–Bera 5%, as shown in Figure 12, which confirms that the residuals follow a normal distribution. To analyse heterogeneity across the cross-sections, Pesaran CD and Bias-corrected scaled LM tests of cross-section dependence were conducted; the tests have probability values 0.7256 and 0.0583, respectively, as shown in Table 10, which are less than 5%, indicating no heterogeneity.

7. Discussion

Oil-producing countries are adopting renewable energy technologies to shift towards clean energy and reduce emissions from fossil fuels in the hope of preserving the rights of future generations within the framework of their commitment to achieving the SDGs. This requires directing a portion of their oil revenues to investment in renewable energy projects to preserve depletable energy sources and the environment from pollution within the framework of related international treaties and agreements. Hence, a portion of government spending must be allocated to investments, most of which are long-term. In light of a global atmosphere fraught with successive and accelerating challenges, the rise in energy prices and, thus, increased oil revenues are sometimes represented as opportunities for oil-producing countries. At other times, these developments are seen to embody a crisis in global food supply chains, followed by a rise in global food prices to a degree that has affected the costs of living and levels of well-being of current generations in most countries of the world. However, the impact of these challenges on oil-producing countries depends on the net impact resulting from their revenues and costs. If the commitment of such countries to international agreements and treaties is added, especially with regard to SDGs, it becomes important to determine the nature of the relationship between these factors and the well-being of the current generation.
This paper, therefore, adopted the descriptive analytical method to review the costs and returns of renewable energy technologies. It has shown that the cost of renewable energy technologies has decreased globally in recent years, although the economic return in terms of increasing employment opportunities has not been experienced by oil-producing countries to the same extent as non-oil-producing countries, such as China. In addition, the paper examined the repercussions of the recent global challenges that resulted in rising inflation, economic deflation, and rising food and oil prices globally.
The econometric model was formulated using 222 observations of unbalanced cross-section data representing 23 countries and a 10-year time series during the period from 2010 to 2021, representing the most recent available data, to express the relationship between global challenges and SDG 7 on renewable energy, on the one hand, and the well-being of the current generation, on the other. Most previous studies have focused on measuring the factors that achieve the rights of future generations, without giving the same degree of attention to the analysis and study of the entitlement of the current generation to live well. This entitlement was expressed as the growth rate in average real GDP per capita to reflect the purchasing power of real per capita income as prices and costs of living rise. Global challenges were also expressed in the net current balance as a percentage of GDP so that the surplus expresses the opportunity achieved by oil-producing countries from these variables, which overcame their negative impact, while the negative value indicates that the seriousness of the crises exceeds the possible opportunities they generate. The share of renewable energy in the total energy sources used in electricity generation was also included to express the transition to renewable energy and adoption of related technologies. The variable fossil fuel emissions were also added, as reducing such emissions represents another sub-goal emerging from SDG 7.
The result of the econometric model, after the necessary tests were conducted to compare the estimated models and verify the quality of the estimate, was expressed as an explanatory R2 for the independent variables—it is estimated at 57.4%. The results, thus, indicate that the global challenges in their entirety during the studied period constituted opportunities for oil-producing states that were reflected positively in the well-being of the current generations, as the relationship was significant and positive between the current balance and current generations’ well-being index. This asserts that oil-producing countries have reaped the benefits of global challenges by channelling surplus funds to improve living standards, potentially through increased government spending on public services and infrastructure. Despite the negative sign of the parameter of the share of renewable energy in the total sources of energy generation, as an indicator of the adoption of renewable energy technologies and the commitment of oil-producing countries to achieving SDG 7, the results did not show the significance of this relationship, and the parameter of fossil fuel emissions was significant and positive in its impact on the well-being of current generations. This finding means that the increasing emissions associated with the combustion of fossil fuels by one ton/capita increases the annual growth rate of the average per capita share of real income by about 1.14%. This result agreed with Inal, Addi, Çakmak, Torusdağ and Çalışkan [8] study of a number of African oil-producing countries for the period 1990–2014 to determine the role of renewable energy and CO2 emissions in achieving economic growth in these countries. A significant effect of CO2 on economic growth was found in some sample countries, while the impact of renewable energy on economic growth was evident in all sample countries, which supports the neutral theory null hypothesis that states that there is a causal relationship between energy consumption and economic growth. This effect is consistent with the findings of a study by [22]. Fossil fuels are still and will remain the primary source of basic energy in most development sectors despite being the main cause of environmental and climate pollution.
These results seem to be consistent with other research which found that CO2 emissions can be correlated with generation well-being and economic growth [8,45]. Inal, Addi, Çakmak, Torusdağ and Çalışkan [8] used data for African oil-producing countries only while Zhang, Yin, Li, Jin, Arshad and Jiang [45] applied Asian country’s data, with the use of different econometric methods in both studies. This interesting finding is likely to be related to the effect of fossil oil on the rapidity of obtaining economic benefits, as well as the high cost of renewable energy adoption. It is, therefore, likely that such connections exist between adopting renewable energy technologies and future generations’ well-being. These findings reveal something about the nature of oil-producing countries and their aim to balance economic and environmental benefits. Future research is needed to assess the risks of fossil fuels as a primary source of energy in oil-producing countries.

8. Conclusions

The primary aim of the current study was to investigate the role of renewable energy technologies in the attainment of the current generation’s well-being in light of emerging global challenges. Based on the results above, it is clear that prioritising the achievement of the SDGs through the adoption of renewable energy technologies to transition toward clean energy is not a decisive factor in preserving the rights and well-being of current generations [46,47]. The continuation of reliance on fossil energy sources in oil-producing countries, despite the resulting emissions, appears to be more effective, at present, in ensuring such rights and well-being. Hence, it can be stated that allocating a portion of oil revenues to adopt renewable energy technologies, at present may not have significant benefits for current generations and the desired benefits for future generations.
The most obvious finding to emerge from this study is that global challenges have created opportunities for oil-producing countries and have positively impacted the well-being of current generations, as there was a significant relationship between the current balance and the well-being of current generations. The second key finding was that fossil fuel emissions significantly influence the well-being of current generations. The findings of this paper provide insights for policymakers to continue relying on fossil energy sources in oil-producing countries despite the emissions resulting from their consumption. However, benefits from the energy revenues can be shifted to renewable energy technologies by increasing related investments.
In light of these findings, it is recommended that the sequencing of the stages of the transition process towards renewable and clean energy be adjusted to prioritize short-term investments that depend on fossil energy sources and offer a relatively quick return for current generations. However, the long-term risks and costs of this recommendation need to be more thoroughly evaluated by future studies [48]. Moreover, countries are advised to harness their technological capabilities for producing renewable energy instead of importing technology, as this approach will lower the future costs of local energy production and enhance production efficiency, thereby stimulating economic growth. Furthermore, it is suggested that countries take advantage of the current increase in traditional energy prices before importing countries expand their renewable energy replacement initiatives, eventually phasing out traditional energy sources and risking economic depletion. To mitigate the adverse environmental impacts of fossil fuel consumption, efforts should be made to reduce polluting emissions by expanding afforestation and green spaces. Additionally, a harmonious balance between realistic local national plans, considering domestic interests, and the commitments laid out in international agreements and treaties to reduce environmentally harmful emissions should be sought to address evolving global economic circumstances.
Rather than investing in a single technology, oil corporations should concentrate on a range of competitive low-carbon solutions. This will be especially noticeable in light of the fact that oil-exporting nations are at a developmental stage when their economic expansion is dependent on energy consumption; as a result, it is anticipated that domestic energy consumption will increase, decreasing their ability to export. Although the economics of renewables in oil-exporting countries would be impacted by fluctuations in oil prices, this investment case is strengthened when the benefits of released hydrocarbons are included.
These nations’ economies will be dominated by the oil industry throughout the transition, but, if diversification is successful, it is anticipated that this sector will begin to decline. Further levels of complexity and unpredictability will result from the success or failure of oil-exporting nations in their efforts to diversify their economies, affecting oil prices and accelerating the global energy transition [49]. Therefore, governments should declare that shifting to renewable energy policies will be the best action to avoid the unfavourable effects of any impending energy bottleneck. It would be interesting to determine the ideal amount of traditional and renewable energy production to ensure economic growth while reducing global warming as a future addition to this field of study.
The study was limited by the absence of data for some variables that could have been used in the analysis such as the structure of the economy and the technological development level of countries. Despite this limitation, the study certainly adds to our understanding of how oil-producing countries can balance the needs of current and future generations. In terms of the analysis, it can be further enhanced by applying other variables influencing the attributes of the generations’ well-being and advanced econometric models, such as including control variables and selecting larger observations that further enhance the outcomes. Further studies regarding the role of renewable energy technologies would be worthwhile. For instance, current development objectives may be formulated and carried out as an extra incentive to increase the use of renewable energy sources, which, in turn, may stimulate and encourage the current generation’s well-being. Subsequent research endeavours ought to investigate the impact of governance frameworks, regional policy frameworks, socio-economic circumstances, and other pertinent contextual variables on the mix of energy, economic growth, and environment. This research can offer a more thorough grasp of the difficulties involved that have influenced specific policy suggestions.

Author Contributions

Conceptualization N.M.A.M., K.M.M.K. and J.B.; methodology N.M.A.M.; software, N.M.A.M. and K.M.M.K.; validation N.M.A.M., K.M.M.K. and J.B.; formal analysis N.M.A.M. and K.M.M.K.; investigation N.M.A.M., K.M.M.K. and J.B.; resources, J.B.; writing—original draft preparation N.M.A.M., K.M.M.K. and J.B.; writing—review and editing J.B.; funding acquisition J.B. All authors have read and agreed to the published version of the manuscript.

Funding

This research was funded by the Princess Nourah bint Abdulrahman University Researchers Supporting Project (number PNURSP2024R540), Princess Nourah bint Abdulrahman University, Riyadh, Saudi Arabia.

Informed Consent Statement

Not applicable.

Data Availability Statement

The data that support the findings of this study are openly available for public viewing.

Acknowledgments

The authors extend their appreciation to the Princess Nourah bint Abdulrahman University Researchers Supporting Project (number PNURSP2024R540), Princess Nourah bint Abdulrahman University, Riyadh, Saudi Arabia.

Conflicts of Interest

The authors declare no conflicts of interest.

References

  1. United Nations. Transforming Our World: The 2030 Agenda for Sustainable Development; United Nations: New York, NY, USA, 2015. [Google Scholar]
  2. World Health Organization. Tracking Sdg 7: The Energy Progress Report 2021; World Health Organization: Geneva, Switzerland, 2021. [Google Scholar]
  3. Amran, Y.A.; Amran, Y.M.; Alyousef, R.; Alabduljabbar, H. Renewable and Sustainable Energy Production in Saudi Arabia According to Saudi Vision 2030; Current Status and Future Prospects. J. Clean. Prod. 2020, 247, 119602. [Google Scholar] [CrossRef]
  4. Alghassab, M. A Computational Case Study on Sustainable Energy Transition in the Kingdom of Saudi Arabia. Energies 2023, 16, 5133. [Google Scholar] [CrossRef]
  5. Chowdhury, P.R.; Medhi, H.; Bhattacharyya, K.G.; Hussain, C.M. Severe Deterioration in Food-Energy-Ecosystem Nexus Due to Ongoing Russia-Ukraine War: A Critical Review. Sci. Total Environ. 2023, 902, 166131. [Google Scholar] [CrossRef] [PubMed]
  6. Energy Information Administration. Eia Expects Crude Oil Prices Higher Than $100 Per Barrel in Coming Months. Available online: https://www.eia.gov/todayinenergy/detail.php?id=51658 (accessed on 9 January 2023).
  7. UN, Food and Agricultyre Organization of the United Nations. FAO Food Price Index; Food and Agricultyre Organization of the United Nations: Roma, Italy, 2022. [Google Scholar]
  8. Inal, V.; Addi, H.M.; Çakmak, E.E.; Torusdağ, M.; Çalışkan, M. The Nexus between Renewable Energy, Co2 Emissions, and Economic Growth: Empirical Evidence from African Oil-Producing Countries. Energy Rep. 2022, 8, 1634–1643. [Google Scholar] [CrossRef]
  9. Çakmak, E.E.; Acar, S. The Nexus between Economic Growth, Renewable Energy and Ecological Footprint: An Empirical Evidence from Most Oil-Producing Countries. J. Clean. Prod. 2022, 352, 131548. [Google Scholar] [CrossRef]
  10. Abban, O.J.; Hongxing, Y.; Nuta, A.C.; Dankyi, A.B.; Ofori, C.; Cobbinah, J. Renewable Energy, Economic Growth, and Co2 Emissions Contained Co-Movement in African Oil-Producing Countries: A Wavelet Based Analysis. Energy Strategy Rev. 2022, 44, 100977. [Google Scholar] [CrossRef]
  11. Unctadstat. Data Centre. Edited by United Nations Conference on Trade and Development. 2022. Available online: https://unctadstat.unctad.org/datacentre/ (accessed on 9 January 2023).
  12. IRENA. “International Renewable Energy Agency”. 2022. Available online: https://www.irena.org/ (accessed on 9 January 2023).
  13. Arrhenius, S. XXXI. On the Influence of Carbonic Acid in the Air Upon the Temperature of the Ground. Lond. Edinb. Dublin Philos. Mag. J. Sci. 1896, 41, 237–276. [Google Scholar] [CrossRef]
  14. Arrhenius, S.A. The Problem of the World’s Supply of Energy. J. Frankl. Inst. 1920, 190, 114–121. [Google Scholar] [CrossRef]
  15. Calendar, G.S. The Artificial Production of Carbon Dioxide and Its Effect on Temperature. QJR Meteorol. Soc. 1938, 64, 223–240. [Google Scholar] [CrossRef]
  16. Al-Leif, A.; bin Muhammad, K. Energy, Environment and Sustainable Development. In Proceedings of the Tenth Arab Energy Conference, Doha, Qatar, 11–12 December 2014. [Google Scholar]
  17. Fischer, W.; Hake, J.-F.; Kuckshinrichs, W.; Schröder, T.; Venghaus, S. German Energy Policy and the Way to Sustainability: Five Controversial Issues in the Debate on the “Energiewende”. Energy 2016, 115, 1580–1591. [Google Scholar] [CrossRef]
  18. Salah, S.I.; Eltaweel, M.; Abeykoon, C. Towards a Sustainable Energy Future for Egypt: A Systematic Review of Renewable Energy Sources, Technologies, Challenges, and Recommendations. Clean. Eng. Technol. 2022, 8, 100497. [Google Scholar] [CrossRef]
  19. Makki, A.A.; Mosly, I. Factors Affecting Public Willingness to Adopt Renewable Energy Technologies: An Exploratory Analysis. Sustainability 2020, 12, 845. [Google Scholar] [CrossRef]
  20. Youssef, S.A.H. Renewable Energy between Reality and Aspiration. Sci. J. Econ. Trade Remap 2020, 243–492. [Google Scholar]
  21. Dilanchiev, A.; Sharif, A.; Ayad, H.; Nuta, A.C. The Interaction between Remittance, Fdi, Renewable Energy, and Environmental Quality: A Panel Data Analysis for the Top Remittance-Receiving Countries. Environ. Sci. Pollut. Res. 2024, 31, 14912–14926. [Google Scholar] [CrossRef]
  22. Dadashi, Z.; Mahmoudi, A.; Rashidi, S. Capacity and Strategies of Energy Production from Renewable Sources in Arab Countries until 2030: A Review from Renewable Energy Potentials to Environmental Issues. Environ. Sci. Pollut. Res. 2022, 29, 47837–47866. [Google Scholar] [CrossRef] [PubMed]
  23. Mahmoudi, A.; Bostani, M.; Rashidi, S.; Valipour, M.S. Challenges and Opportunities of Desalination with Renewable Energy Resources in Middle East Countries. Renew. Sustain. Energy Rev. 2023, 184, 113543. [Google Scholar] [CrossRef]
  24. Østergaard, P.A.; Duic, N.; Noorollahi, Y.; Kalogirou, S. Renewable Energy for Sustainable Development. Renew. Energy 2022, 199, 1145–1152. [Google Scholar] [CrossRef]
  25. Noor, M.; Khan, D.; Khan, A.; Rasheed, N. The Impact of Renewable and Non-Renewable Energy on Sustainable Development in South Asia. Environ. Dev. Sustain. 2023, 1–18. [Google Scholar] [CrossRef]
  26. Gao, D.; Zhou, X.; Mo, X.; Liu, X. Unlocking Sustainable Growth: Exploring the Catalytic Role of Green Finance in Firms’ Green Total Factor Productivity. Environ. Sci. Pollut. Res. 2024, 31, 14762–14774. [Google Scholar] [CrossRef]
  27. Hoang, A.T.; Nižetić, S.; Olcer, A.I.; Ong, H.C.; Chen, W.-H.; Chong, C.T.; Thomas, S.; Bandh, S.A.; Nguyen, X.P. Impacts of COVID-19 Pandemic on the Global Energy System and the Shift Progress to Renewable Energy: Opportunities, Challenges, and Policy Implications. Energy Policy 2021, 154, 112322. [Google Scholar] [CrossRef]
  28. Hassan, Q.; Viktor, P.; Al-Musawi, T.J.; Ali, B.M.; Algburi, S.; Alzoubi, H.M.; Al-Jiboory, A.K.; Sameen, A.Z.; Salman, H.M.; Jaszczur, M. The Renewable Energy Role in the Global Energy Transformations. Renew. Energy Focus 2024, 48, 100545. [Google Scholar] [CrossRef]
  29. Shahbaz, M.; Raghutla, C.; Chittedi, K.R.; Jiao, Z.; Vo, X.V. The Effect of Renewable Energy Consumption on Economic Growth: Evidence from the Renewable Energy Country Attractive Index. Energy 2020, 207, 118162. [Google Scholar] [CrossRef]
  30. Moutinho, V.; Neves, C.; Leitão, J. Revisiting the Nexus between Renewable and Non-Renewable Energy, CO2 Emissions, and Economic Growth: An Empirical Application to Asian and African Economies. In Global Challenges of Climate Change, Volume 2: Risk Assessment, Political and Social Dimension of the Green Energy Transition; Springer: Berlin/Heidelberg, Germany, 2022; pp. 137–156. [Google Scholar]
  31. Sachs, J.; Lafortune, G.; Kroll, C.; Fuller, G.; Woelm, F. From Crisis to Sustainable Development: The Sdgs as Roadmap to 2030 and Beyond: Includes the Sdg Index and Dashboards; Cambridge University Press: Cambridge, UK, 2022. [Google Scholar]
  32. Xiao, M.; Junne, T.; Haas, J.; Klein, M. Plummeting Costs of Renewables-Are Energy Scenarios Lagging? Energy Strategy Rev. 2021, 35, 100636. [Google Scholar] [CrossRef]
  33. IRENA. World Energy Transitions Outlook: 1.5 °C Pathway; International Renewable Energy Agency: Abu Dhabi, United Arab Emirates, 2021. [Google Scholar]
  34. IRENA. Renewable Power Generation Costs in 2020; International Renewable Energy Agency: Abu Dhabi, United Arab Emirates, 2021. [Google Scholar]
  35. Addis, A.K.; Cheng, S. The Nexus between Renewable Energy, Environmental Pollution, and Economic Growth across Brics and Oecd Countries: A Comparative Empirical Study. Energy Rep. 2023, 10, 3800–3813. [Google Scholar] [CrossRef]
  36. Giroud, A. World Investment Report 2023: Investing in Sustainable Energy for All; Springer: Berlin/Heidelberg, Germany, 2024. [Google Scholar]
  37. Cucchiella, F.; D’Adamo, I.; Gastaldi, M. Financial Analysis for Investment and Policy Decisions in the Renewable Energy Sector. Clean Technol. Environ. Policy 2015, 17, 887–904. [Google Scholar] [CrossRef]
  38. Bertsch, V.; Di Cosmo, V. Are Renewables Profitable in 2030? A Comparison between Wind and Solar across Europe; Fondazione Eni Enrico Mattei: Milano, Italy, 2018. [Google Scholar]
  39. IRENA; ILO. Renewable Energy and Jobs: Annual Review 2022; International Renewable Energy Agency: Geneva, Switzerland, 2022. [Google Scholar]
  40. Baltagi, B.H. Econometric Analysis of Panel Data; Springer: Berlin/Heidelberg, Germany, 2008; Volume 4. [Google Scholar]
  41. Gao, D.; Li, Y.; Tan, L. Can Environmental Regulation Break the Political Resource Curse: Evidence from Heavy Polluting Private Listed Companies in China. J. Environ. Plan. Manag. 2023, 1–27. [Google Scholar] [CrossRef]
  42. Ren, X.; Li, W.; Duan, K.; Zhang, X. Does Climate Policy Uncertainty Really Affect Corporate Financialization? Environ. Dev. Sufstain. 2024, 26, 4705–4723. [Google Scholar] [CrossRef]
  43. Hausman, J.A. Specification Tests in Econometrics. Econom. J. Econom. Soc. 1978, 46, 1251–1271. [Google Scholar] [CrossRef]
  44. Wooldridge, J.M. Econometric Analysis of Cross Section and Panel Data; MIT Press: Cambridge, MA, USA, 2010. [Google Scholar]
  45. Zhang, T.; Yin, J.; Li, Z.; Jin, Y.; Arshad, A.; Jiang, B. A Dynamic Relationship between Renewable Energy Consumption, Non-Renewable Energy Consumption, Economic Growth and Co2 Emissions: Evidence from Asian Emerging Economies. Front. Environ. Sci. 2023, 10, 1092196. [Google Scholar] [CrossRef]
  46. Jaiswal, K.K.; Chowdhury, C.R.; Yadav, D.; Verma, R.; Dutta, S.; Jaiswal, K.S.; Karuppasamy, K.S.K. Renewable and Sustainable Clean Energy Development and Impact on Social, Economic, and Environmental Health. Energy Nexus 2022, 7, 100118. [Google Scholar] [CrossRef]
  47. Nautiyal, A.; Ramlal, A. Clean Energy Sources for a Better and Sustainable Environment of Future Generations. Energy Cris. Chall. Solut. 2021, 151–168. [Google Scholar]
  48. Axon, C.; Darton, R. Sustainability and Risk—A Review of Energy Security. Sustain. Prod. Consum. 2021, 27, 1195–1204. [Google Scholar] [CrossRef]
  49. Fattouh, B.; Poudineh, R.; West, R. The Rise of Renewables and Energy Transition: What Adaptation Strategy Exists for Oil Companies and Oil-Exporting Countries? Energy Transit. 2019, 3, 45–58. [Google Scholar] [CrossRef]
Figure 1. The performance of the world’s countries in achieving the goal of transitioning to renewable energy as a percentage of total primary energy supply in general. Source: prepared by researchers based on https://dashboards.sdgindex.org/map/indicators/share-of-renewable-energy-in-total-primary-energy-supply/ratings (accessed on 13 December 2023).
Sustainability 16 03155 g001
Figure 2. The share of renewable energy in electricity generation. Source: prepared by researchers based on data from Renewable Energy Statistics 2022, International Renewable Energy Agency [12].
Sustainability 16 03155 g002
Figure 3. Share of renewable energy in total primary energy supply (%) for OPEC (A) and OPEC+ (B) countries in 2021. Source: prepared by researchers based on from the Sustainable Development Report 2022 [31].
Sustainability 16 03155 g003
Figure 4. Share of renewable energy (%) of primary energy supply in some developed oil-importing countries in 2021. Source: prepared by researchers based on data from Sustainable Development Report 2022 [31].
Sustainability 16 03155 g004
Figure 5. The performance of the world’s countries in achieving the goal of reducing CO2 emissions from fossil fuel combustion and cement production (tons CO2/per capita) in 2021. Source: prepared by researchers based on https://dashboards.sdgindex.org/map/indicators/co2-emissions-from-fossil-fuel-combustion-and-cement-production (accessed on 13 December 2023).
Sustainability 16 03155 g005
Figure 6. CO2 emission from fossil fuel production in some oil-exporting countries emissions embodied in their imports and exports in 2020 (tons/capita). Source: prepared by researchers based on data from the Sustainable Development Report 2022 [31]. There is no data on CO2 exports for the Kingdom of Saudi Arabia, Bahrain, and some other countries.
Sustainability 16 03155 g006
Figure 7. Top countries importing and exporting CO2. Source: prepared by researchers based on data from Sustainable Development Report 2022 [31].
Sustainability 16 03155 g007
Figure 8. Costs of constructing and installing the production capacity for generating electrical power in 2010 and 2020. Source: prepared by researchers based on data from [12].
Sustainability 16 03155 g008
Figure 9. Change in global employment (in millions) in the renewable energy sector from 2012 to 2021. Source: prepared by researchers based on data from [39].
Sustainability 16 03155 g009
Figure 10. Number of jobs in the renewable energy sector in thousands according to the technology in 2021. Source: prepared by researchers based on data from [39].
Sustainability 16 03155 g010
Figure 11. Number of jobs in the renewable energy sector (in thousands) in some OPEC and OPEC+ countries in 2021. Source: prepared by researchers based on data from [39].
Sustainability 16 03155 g011
Figure 12. Test of residuals normal distribution.
Sustainability 16 03155 g012
Table 1. Annual reduction in CO2 emissions and financial savings from replacing uneconomic coal power plants with renewable energy plants in 2020.
CountriesAnnual Savings from Replacing Uncompetitive Coal Power Plants with New Solar and Wind Energy Powered Plants (Billion US Dollars)Annual Reductions in CO2 Emissions from Replacing Uncompetitive Coal Power Plants with New Solar and Wind Energy Powered Plants (Million Tons/Year)
Germany3.399
India6.4643
United States of America5.6332
The rest of the world17.01899
The world322973
Source: adapted by researchers from Table 1.1 from [12].
Table 2. Variables description of the econometric model.
VariablesIndicatorsData Sources
RGDP_PCAverage annual growth rate of per capita real GDP to express growth in real income per capita. It represents the well-being of the current generation.UNCTAD Stat
UNCTADstat
CB Current balance as a percentage of GDP, where it expresses the global challenges:
CB surplus (+): expresses the opportunities for oil-producing countries from these challenges.
CB deficit (−): Expresses the crises facing the oil countries due to these challenges.
UNCTAD Stat
UNCTADstat
RE_ELCSDG 7
Share of renewable energy in electricity generation.
Renewable Energy Statistics 2022, International Renewable Energy Agency (IRENA)
Renewable Energy Statistics 2022 (irena.org, accessed on 9 January 2024)
CO2SDG 13
Fossil fuel carbon dioxide emissions in tons per capita.
United Nations, Sustainable Development Report 2022
SDG Indicators (un.org, accessed on 9 January 2024)
Table 3. Descriptive statistics.
RGDP_PCCBRE_ELCCO2
Mean0.3074813.78299515.937252.40997
Median0.8332743.001887.4651.9635
Maximum96.5369545.4601278.7114.045
Minimum−47.80404−39.3912200.843
Std. Dev.9.41207511.8112721.272041.49536
Skewness4.2116920.3257961.3817954.51124
Kurtosis54.690025.4919823.60347331.9683
Jarque-Bera2537161.3695374.014918515.23
Probability0000
Sum68.26085839.82483538.07535.014
Sum Sq. Dev.19,577.7630,830.86100,002.5494.18
Observations222222222222
Table 4. Results of panel data unit root test.
Independent VariablesDependent VariableThe ConditionThe Test
CO2 *RE_ELC
Lag(1)
CB
Lag(1)
RGDP_PC *
−9.46
0.000
−3.49
0.000
−9.16
0.000
−5.40
0.000
BoycottLevin, Lin & Chu t *
−2.67
0.682
−2.50
0.006
−7.85
0.000
−6.04
0.000
categorical and directional
−4.47
0.000
−8.53
0.000
−8.46
0.000
−9.54
0.000
without
−0.67
0.251
−1.45
0.073
−3.73
0.000
4.42
0.000
BoycottIm, Pesaran and Shin W-stat
0.47
0.682
−0.69
0.2447
−0.97
0.1655
−4.12
0.000
categorical and directional
--------without
64.62
0.036
61.13
0.066
90.01
0.000
98.31
0.000
BoycottADF—Fisher Chi-square
45.65
0.486
54.20
0.189
63.40
0.02
101.82
0.000
categorical and directional
95.53
0.000
132.86
0.000
127.22
0.000
166.13
0.000
without
53.12
0.218
126.57
0.000
63.21
0.046
111.83
0.000
BoycottPP—Fisher Chi-square
65.92
0.028
132.24
0.000
49.85
0.251
111.63
0.000
categorical and directional
105.44
0.000
205.82
0.000
121.50
0.000
193.01
0.000
without
* Automatic lag length selection based on SIC: 0 to 1, Newey–West fixed bandwidth, and Bartlett kernel.
Table 5. Results of estimating econometric model parameters.
VariablesPooled RegressionFixed EffectsRandom Effects
Coefficientp-ValueCoefficientp-ValueCoefficientp-Value
C0.48460.2579−2.71070.0051 *−0.22560.8619
CB0.08720.0000 *0.14000.0000 *0.14550.0068 *
RE_ELC−0.01120.2275−0.01560.6695−0.01150.6951
CO20.12840.53821.13630.0000 *0.06900.8677
R-squared0.0952 0.5737 0.0353
Adjusted R-squared0.08280.51930.0221
F-statistic7.652510.55292.6648
Prob(F-statistic)0.0000 *0.0000 *0.0487 *
Durbin-Watson1.05211.56602.4596
Note: * denotes 5% significance level.
Table 6. Individual cross-section effects.
Cross-SectionEffectCross-SectionEffect
Algeria1.409392Libya1.656913
Angola−1.98143Malaysia4.151561
Azerbaijan−0.16854Mexico2.825281
Bahrain2.160227Nigeria−0.69014
Brunei Darussalam−3.50462Oman−1.86278
Equatorial Guinea−2.10434Russian Federation1.587739
Congo−11.1069Saudi Arabia0.123015
Gabon0.688798South Sudan7.065247
Iran (Islamic Republic of)−0.75983Sudan3.774511
Iraq1.465255United Arab Emirates1.311314
Kazakhstan2.797168Venezuela (Bolivarian Rep. of)−1.85828
Kuwait−5.55495
Table 7. Redundant fixed effects test to compare the pooled regression model and the fixed effects model.
Effects TestStatisticaldfProb.
Cross-section F10.0472(22,196)0.000
Table 8. Hausman test to compare between the fixed and random effects models.
TableChi-Sq. StatisticalChi-Sq. dfProb.
Cross-section random14.940230.0019
Table 9. Correlation matrix between independent variables.
CBRE_ELCCO2
CB1.0000−0.1967−0.1271
RE_ELC−0.19671.00000.0536
CO2−0.12710.05361.0000
Table 10. Cross-section dependence test.
TestStatisticd.f.Prob.
Bias-corrected scaled LM1.8932462530.0583
Pesaran CD0.351015 0.7256
Disclaimer/Publisher’s Note: The statements, opinions and data contained in all publications are solely those of the individual author(s) and contributor(s) and not of MDPI and/or the editor(s). MDPI and/or the editor(s) disclaim responsibility for any injury to people or property resulting from any ideas, methods, instructions or products referred to in the content.

