

Enhancing Pavement Sustainability: Prediction of the Pavement Condition Index in Arid Urban Climates Using the International Roughness Index


Abstract
1. Introduction
1.1. Utilization of IRI in PMMS
1.2. PCI versus IRI
2. Study Area
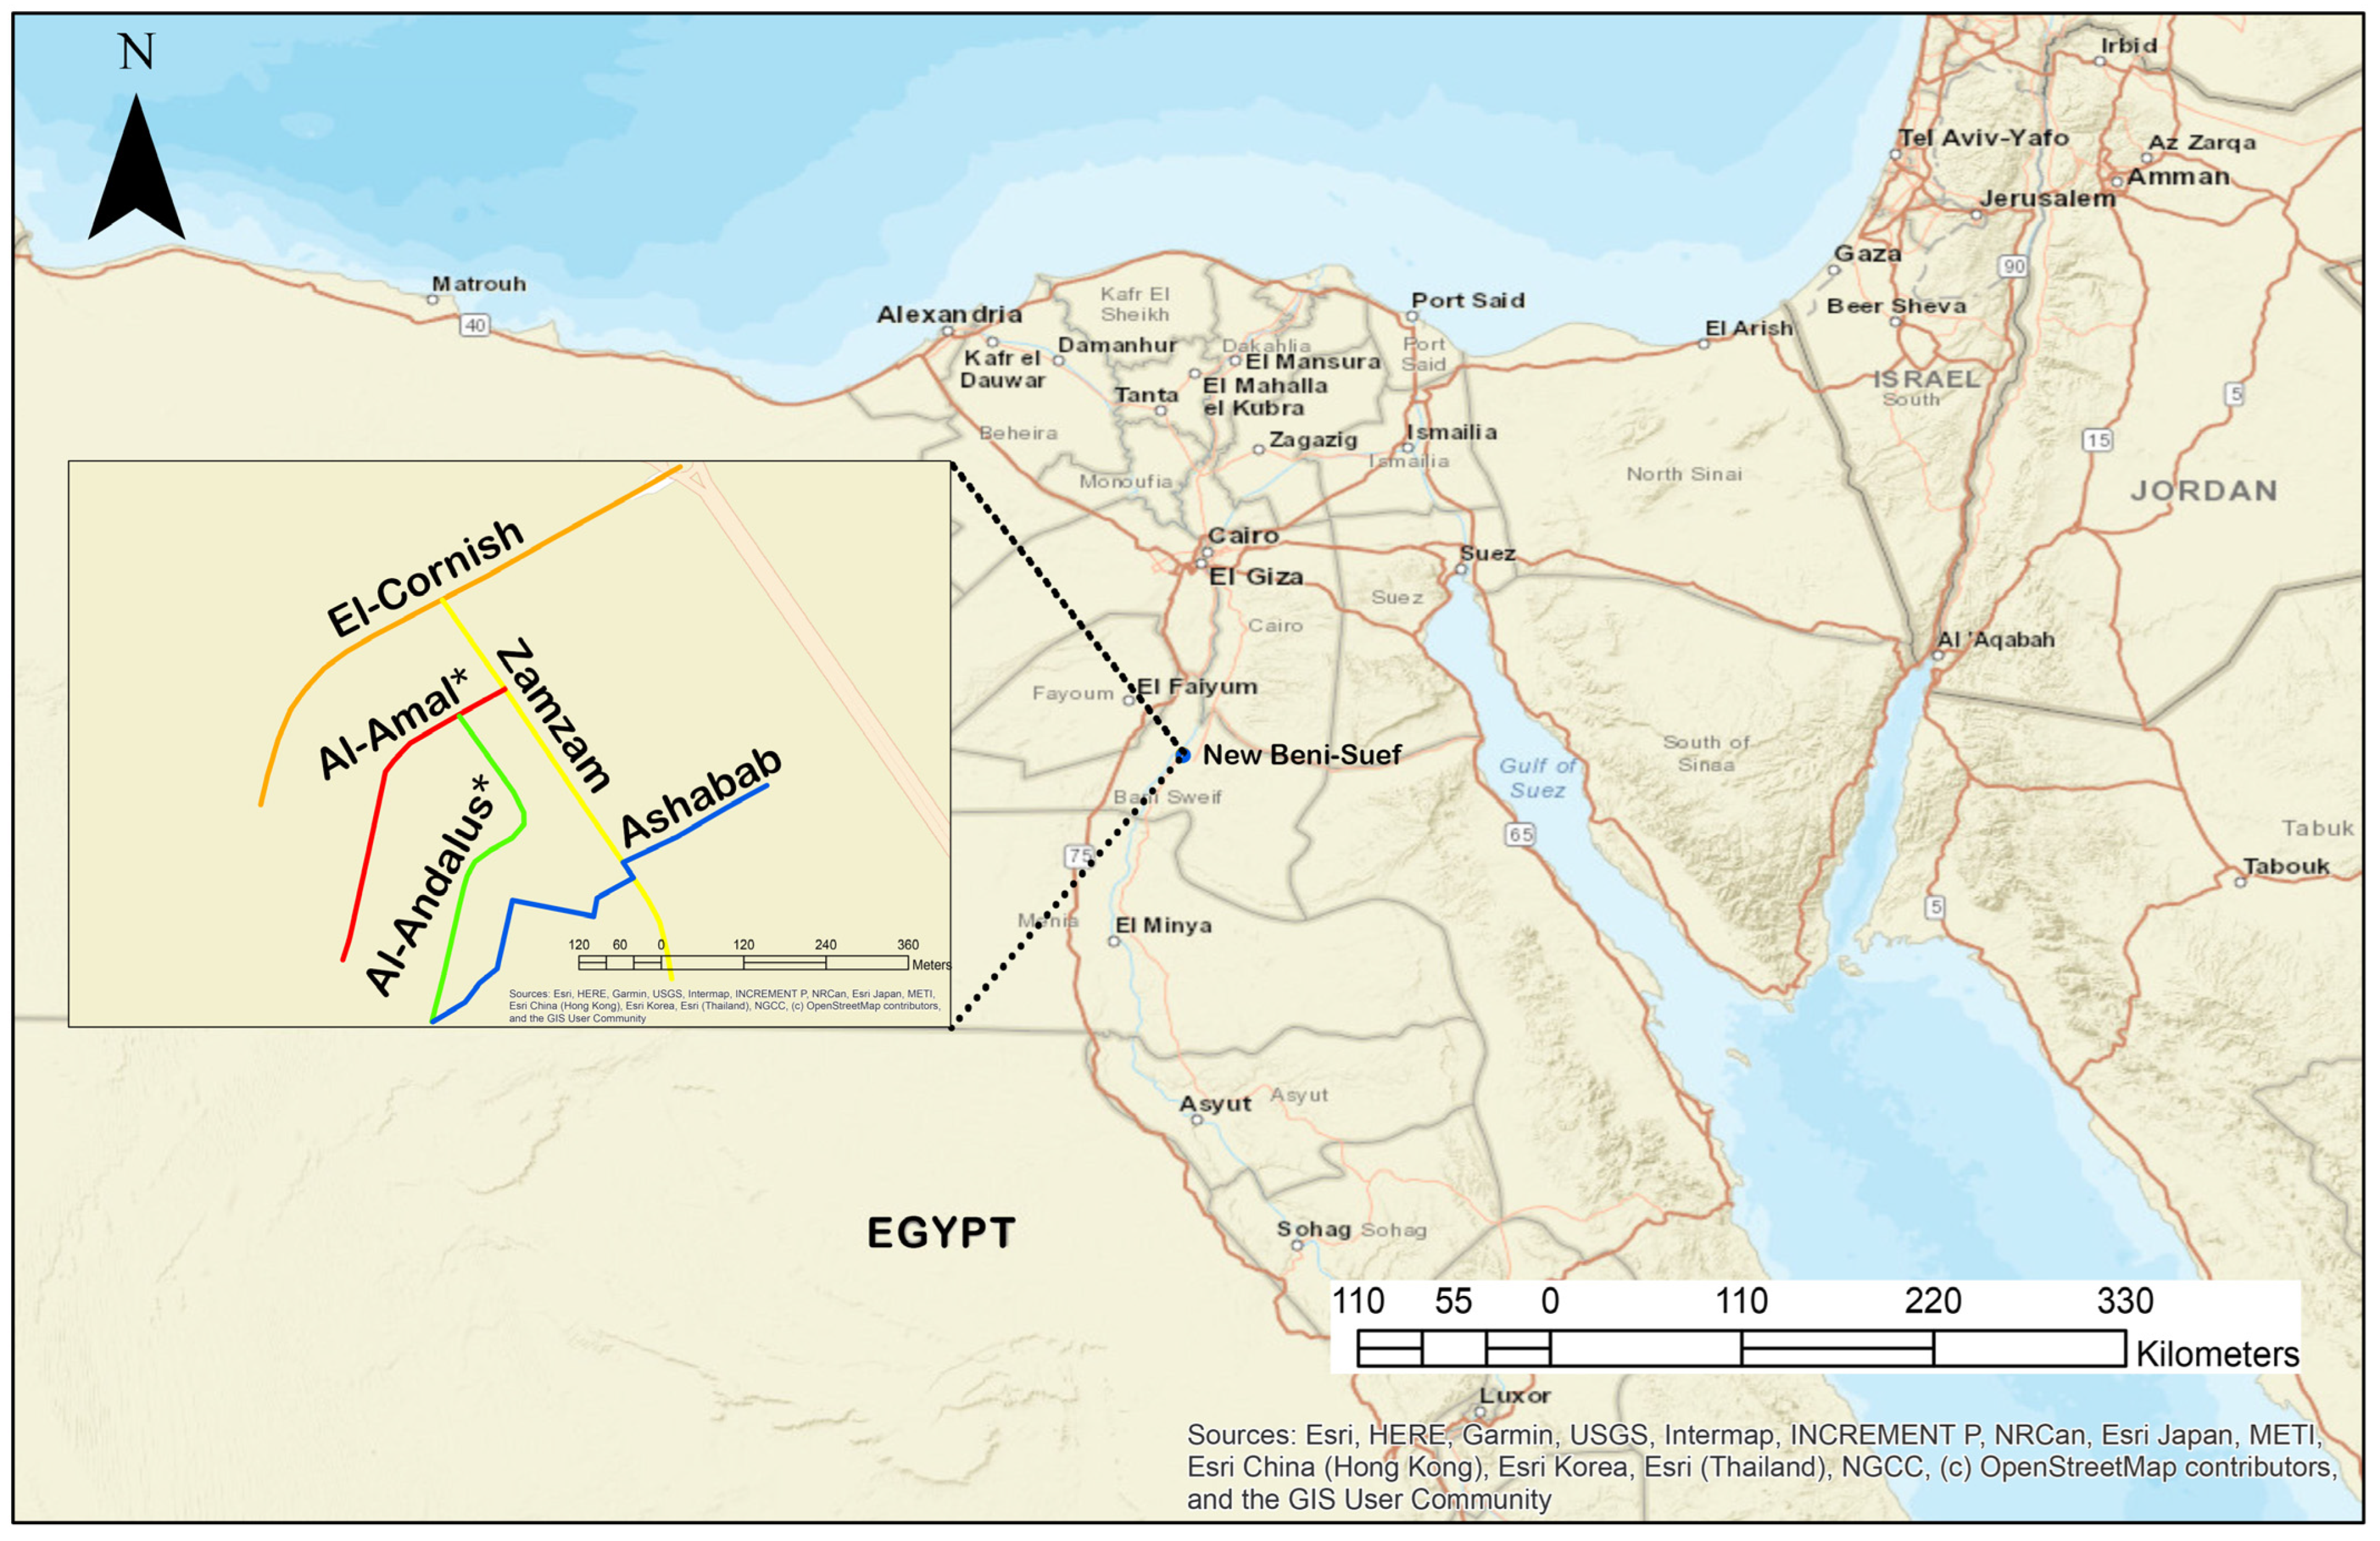
2.1. Location and Climate
2.2. Traffic
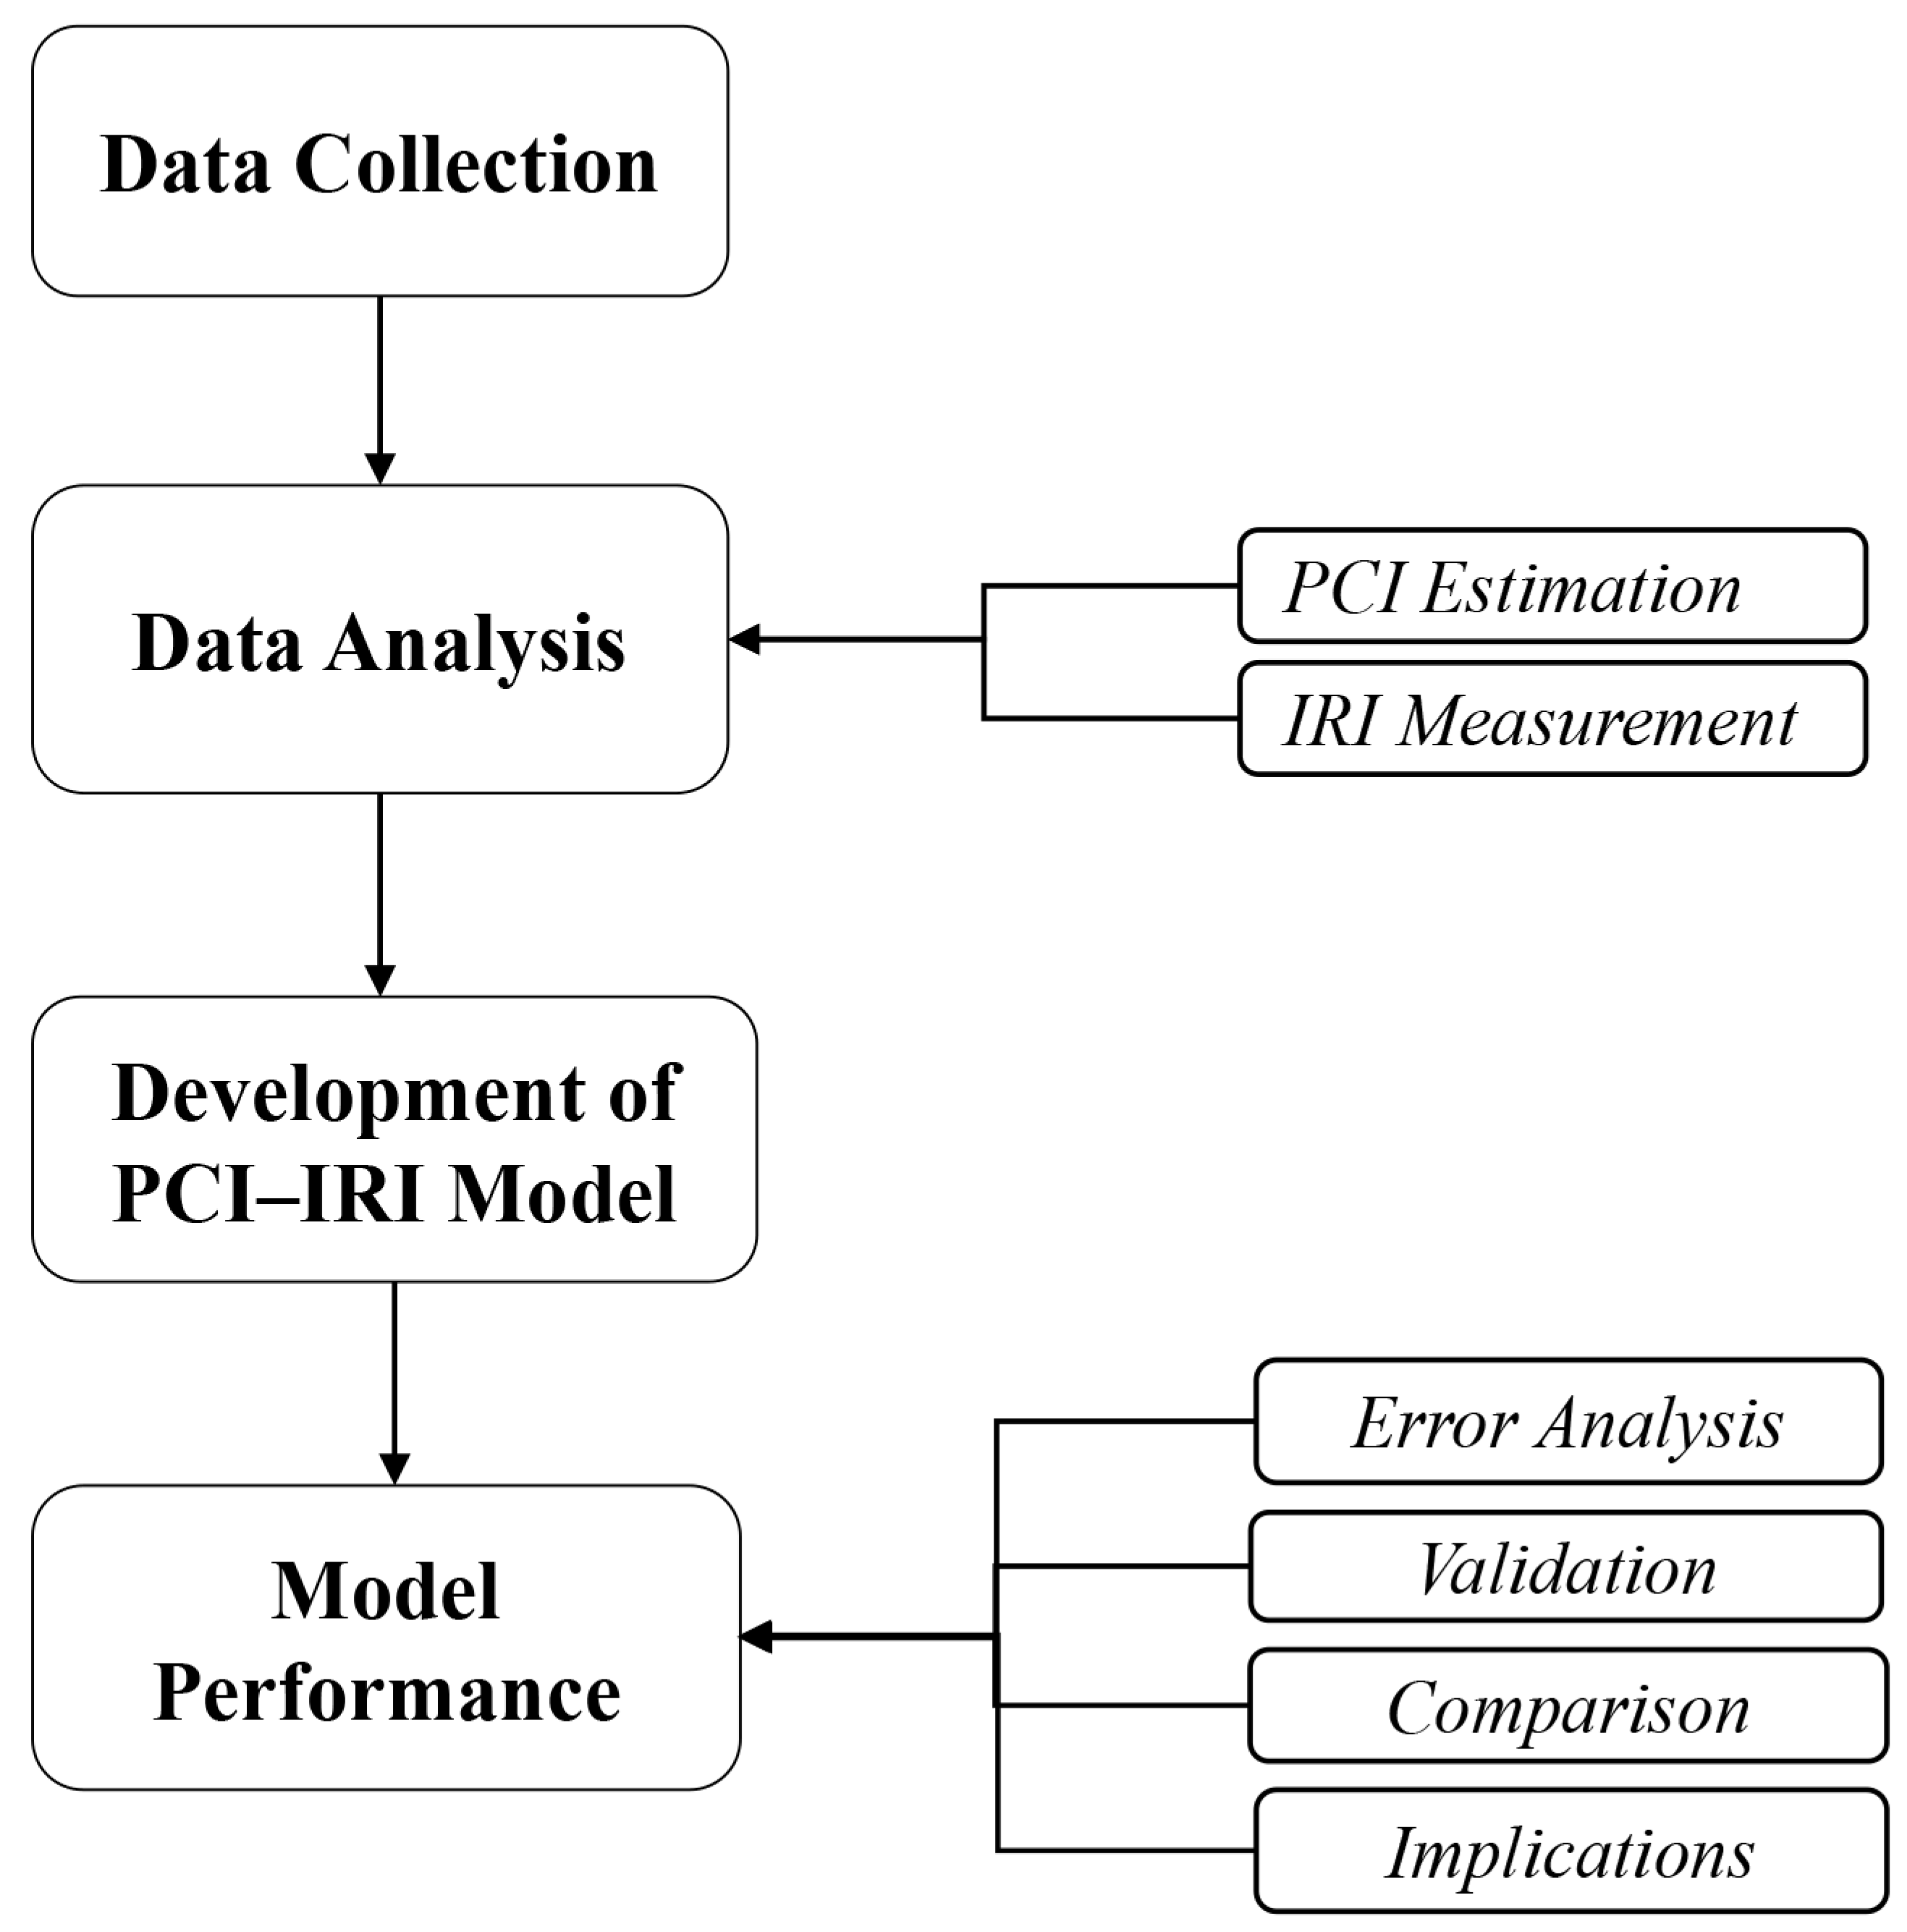
3. Data Collection
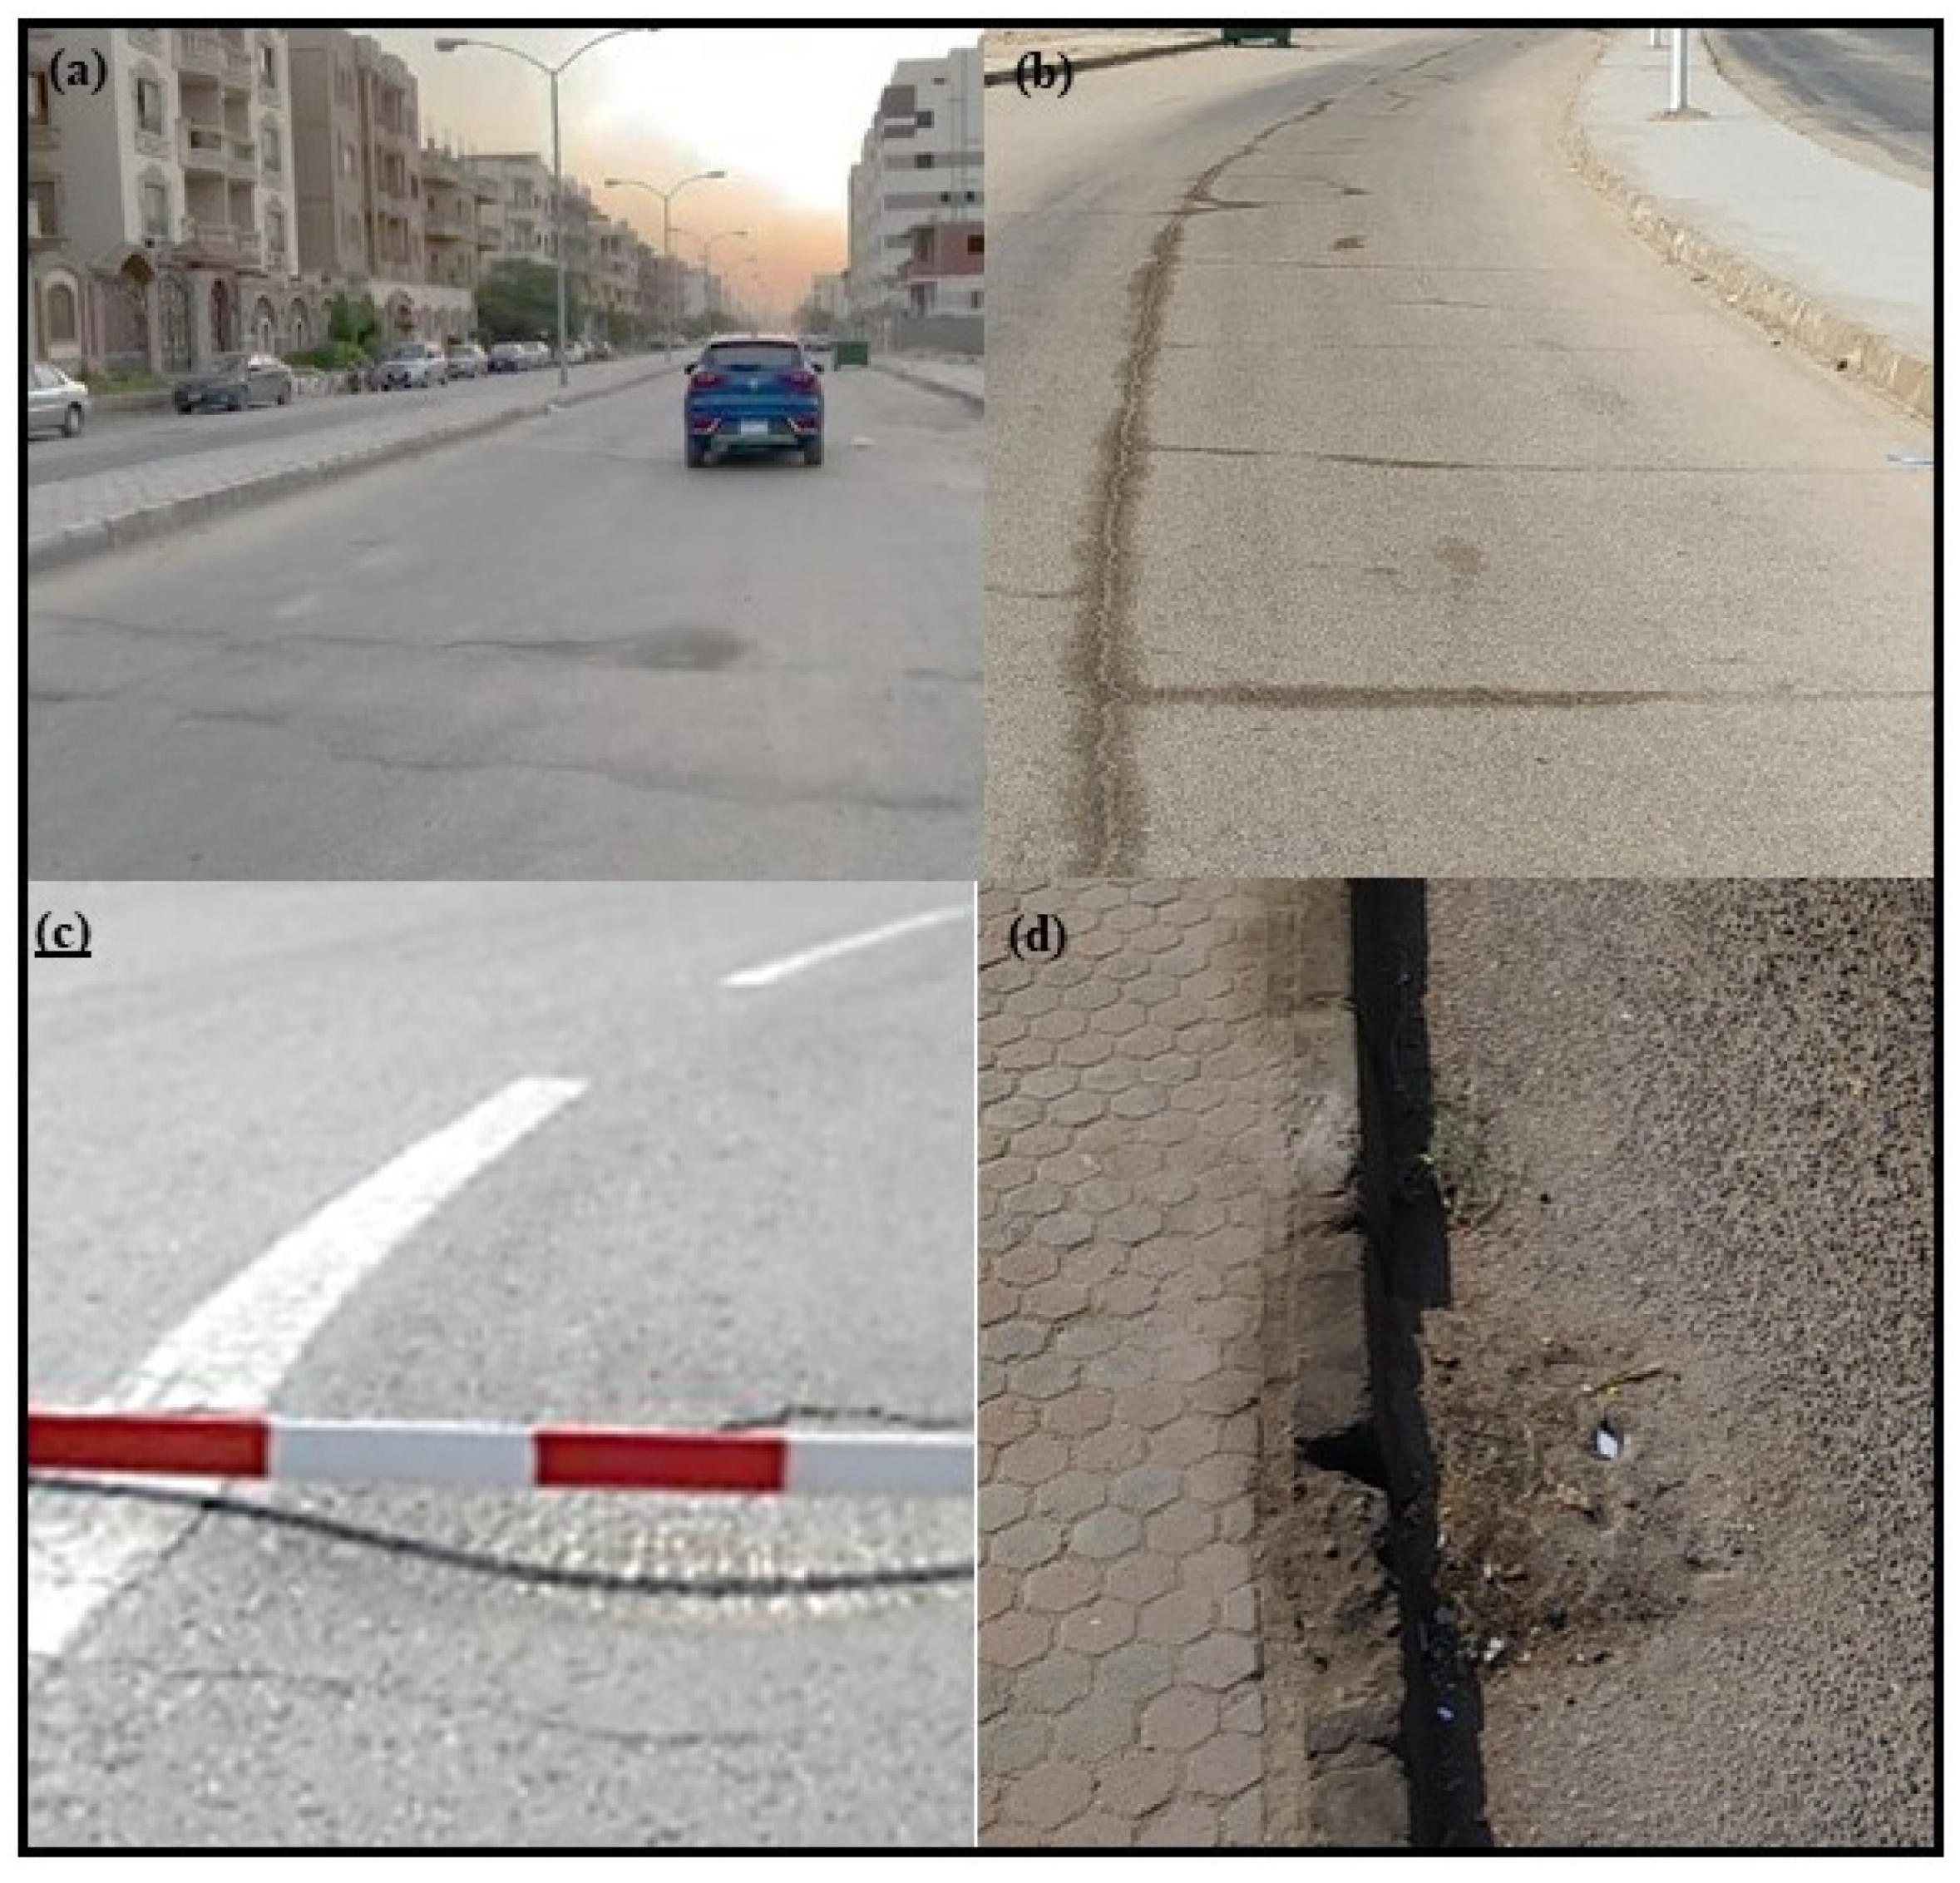
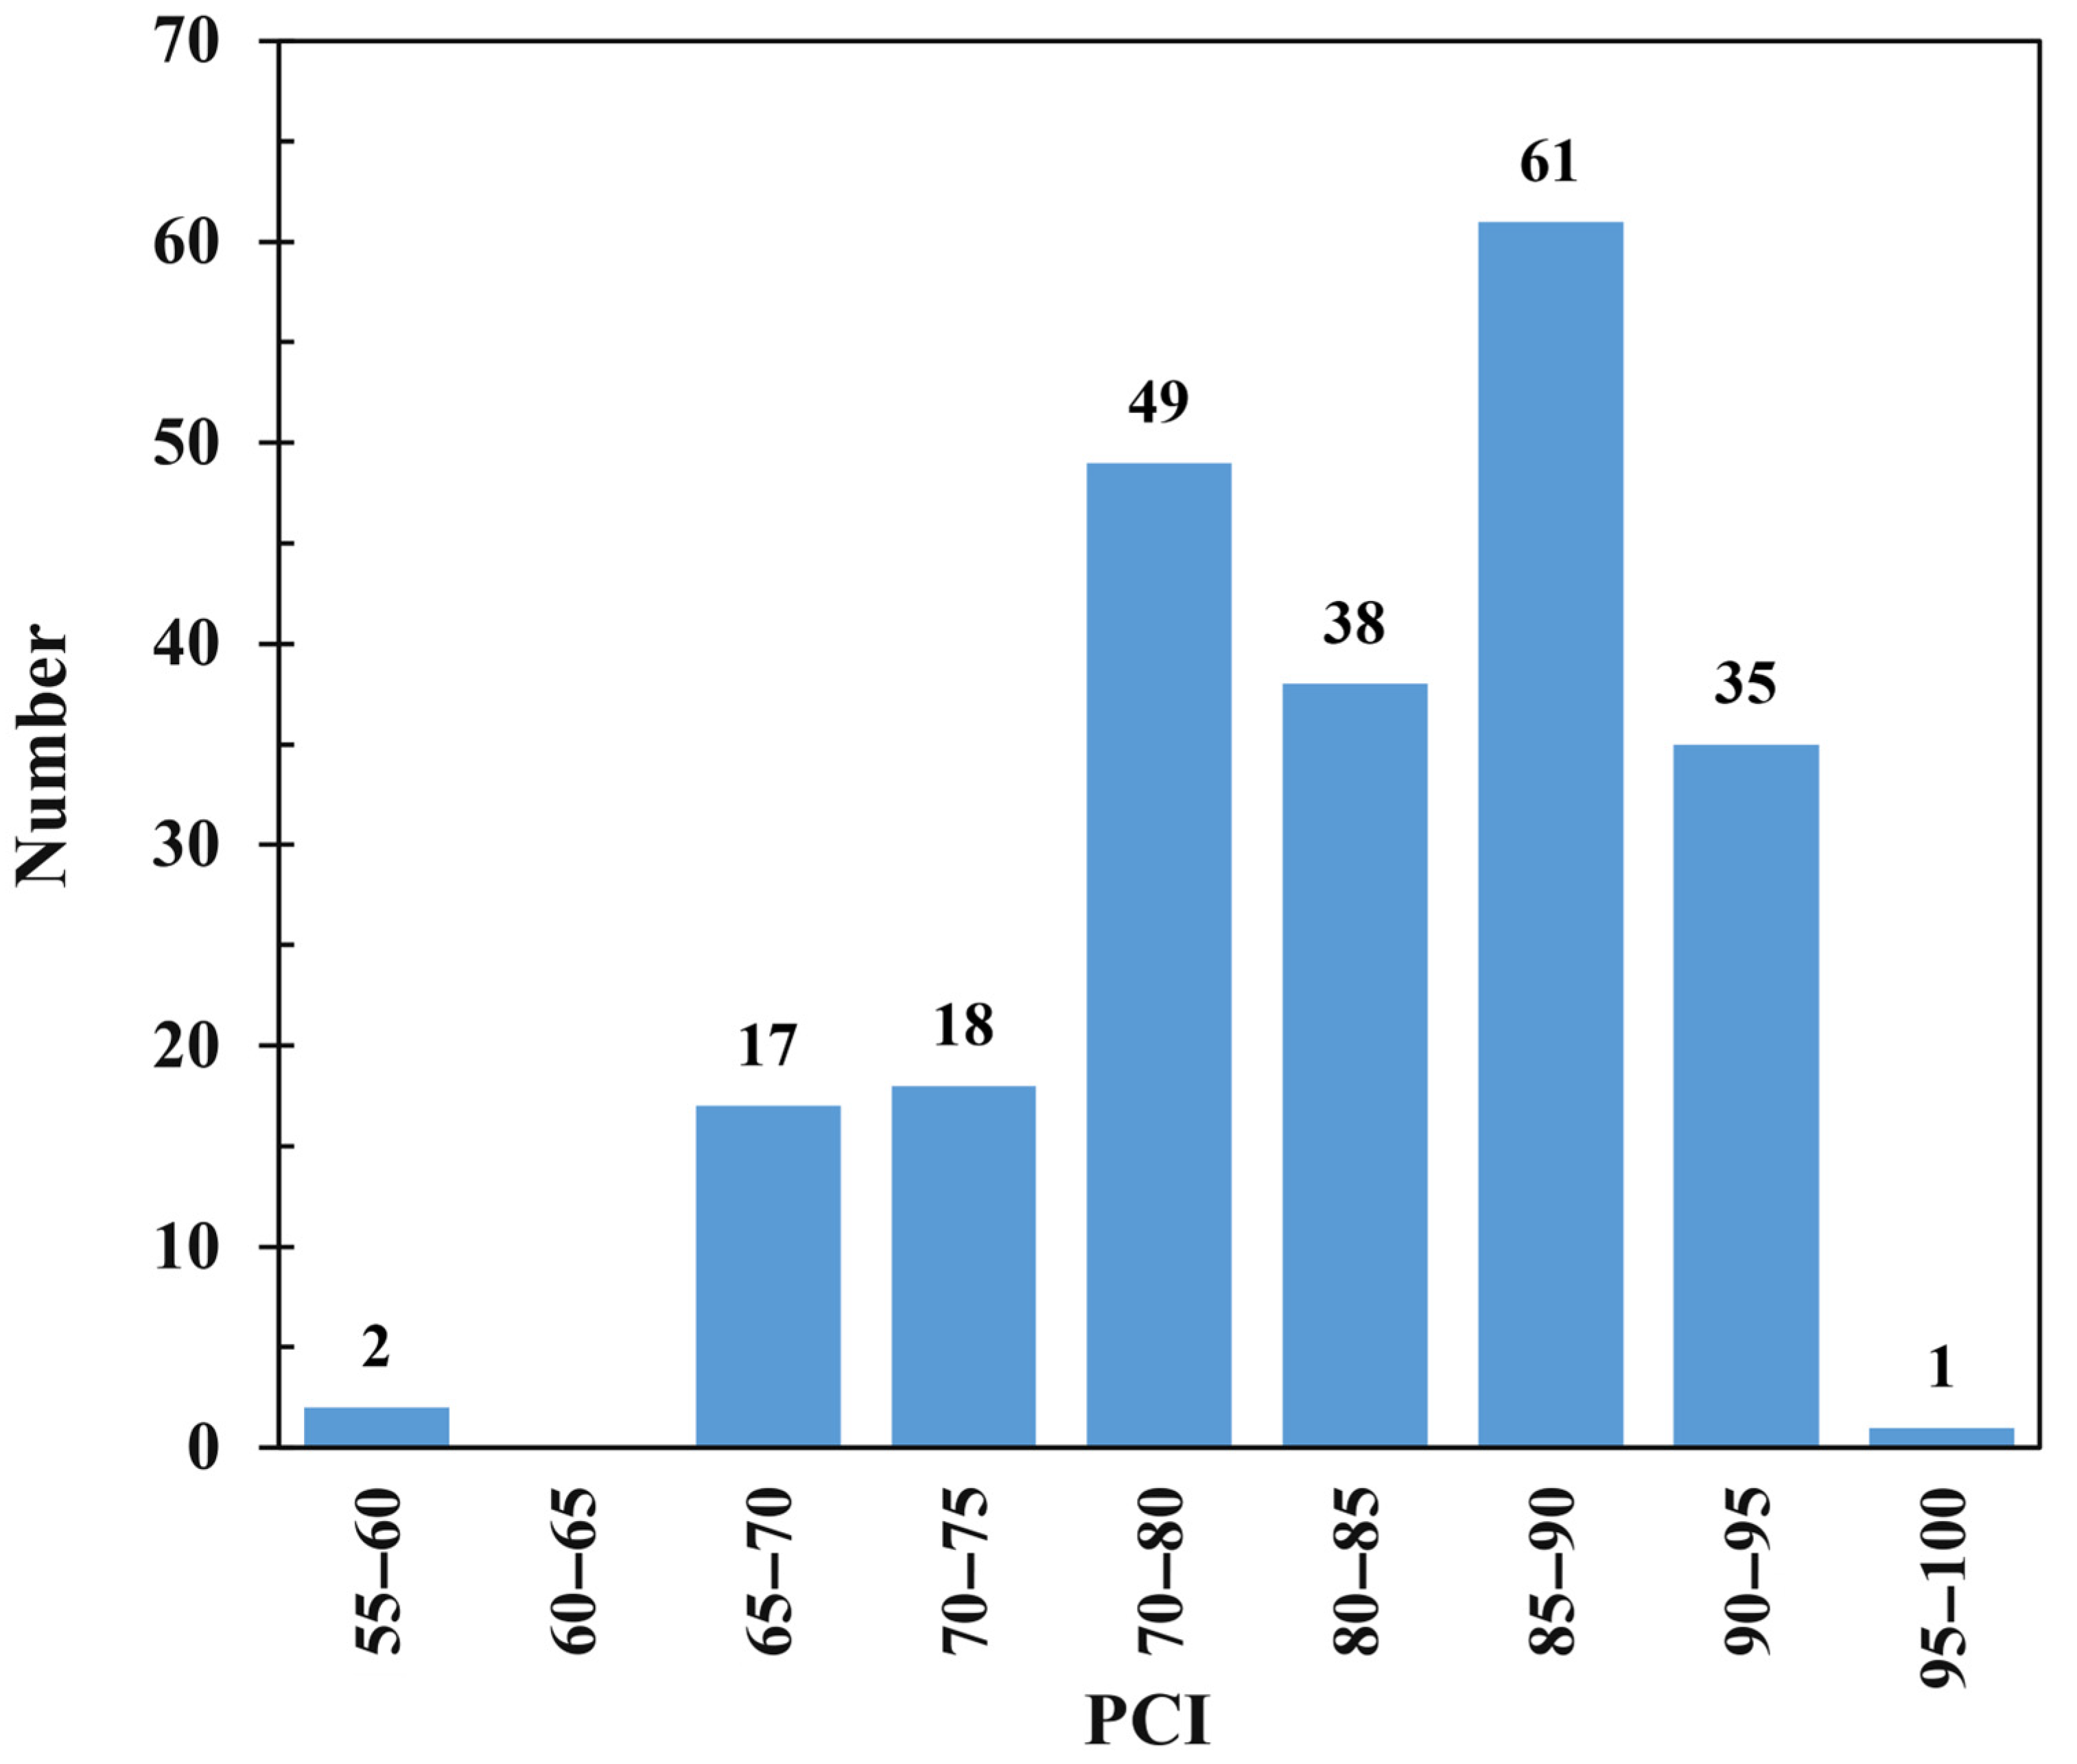
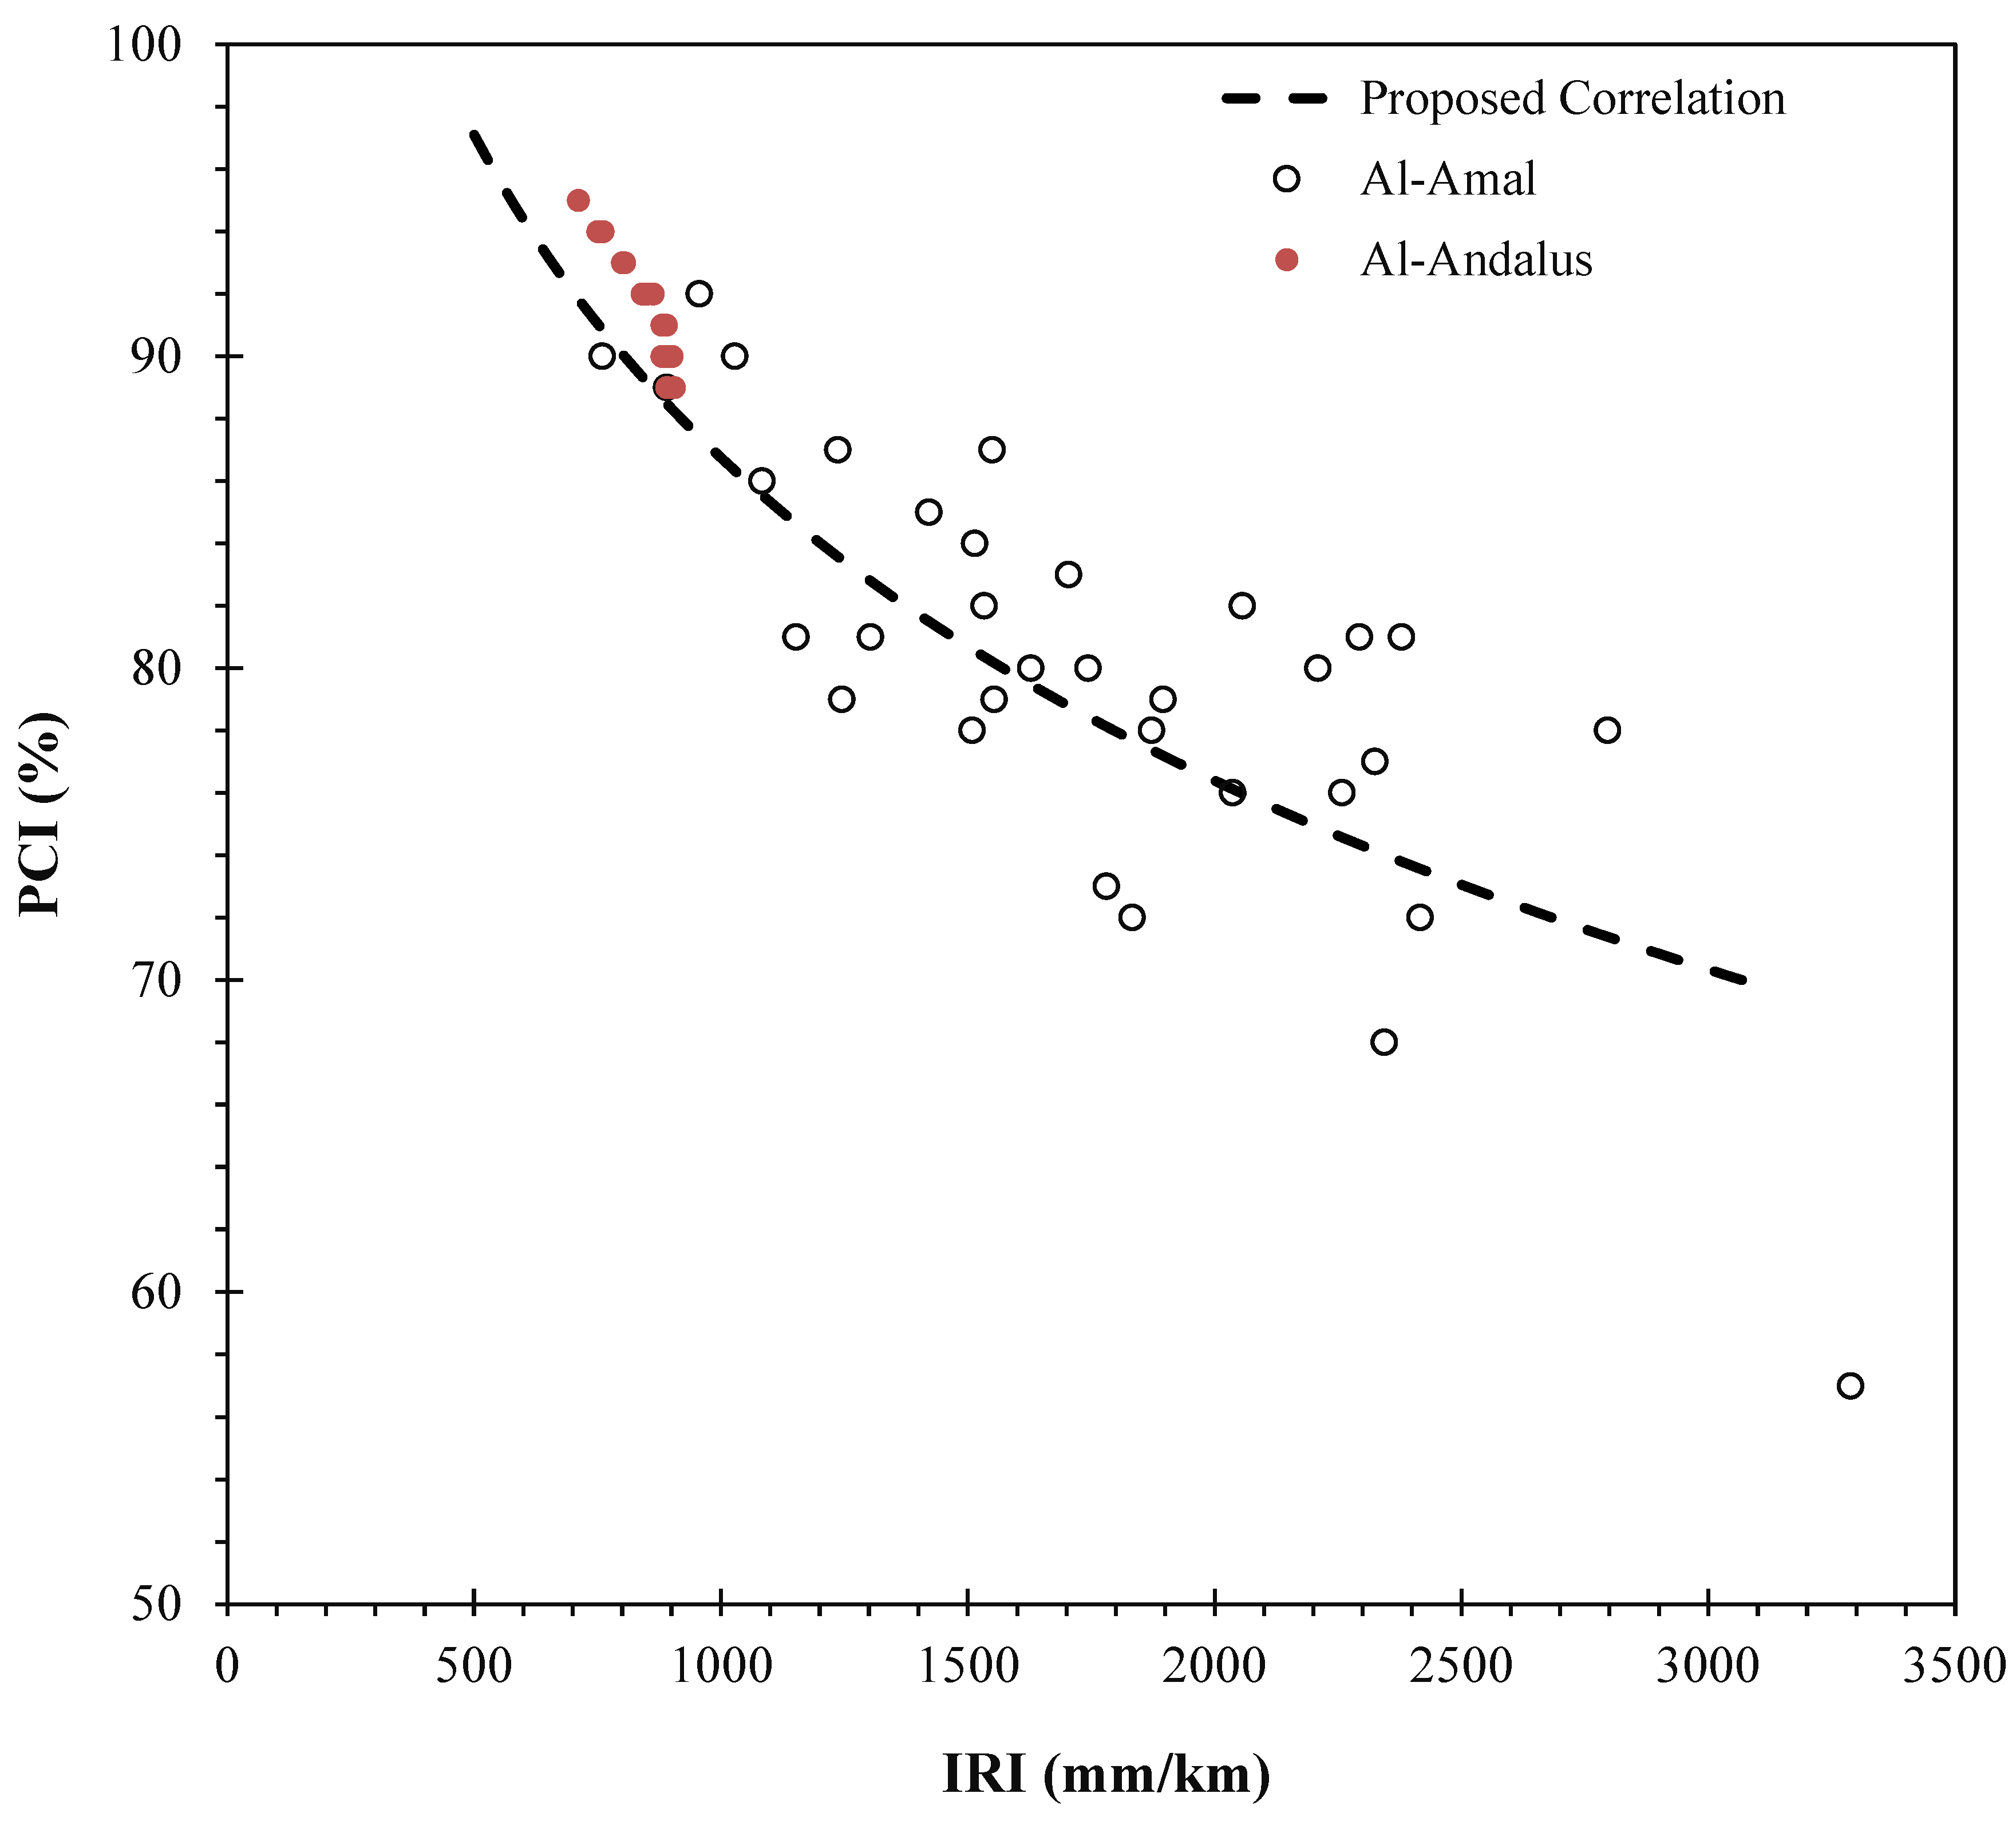
3.1. PCI Survey
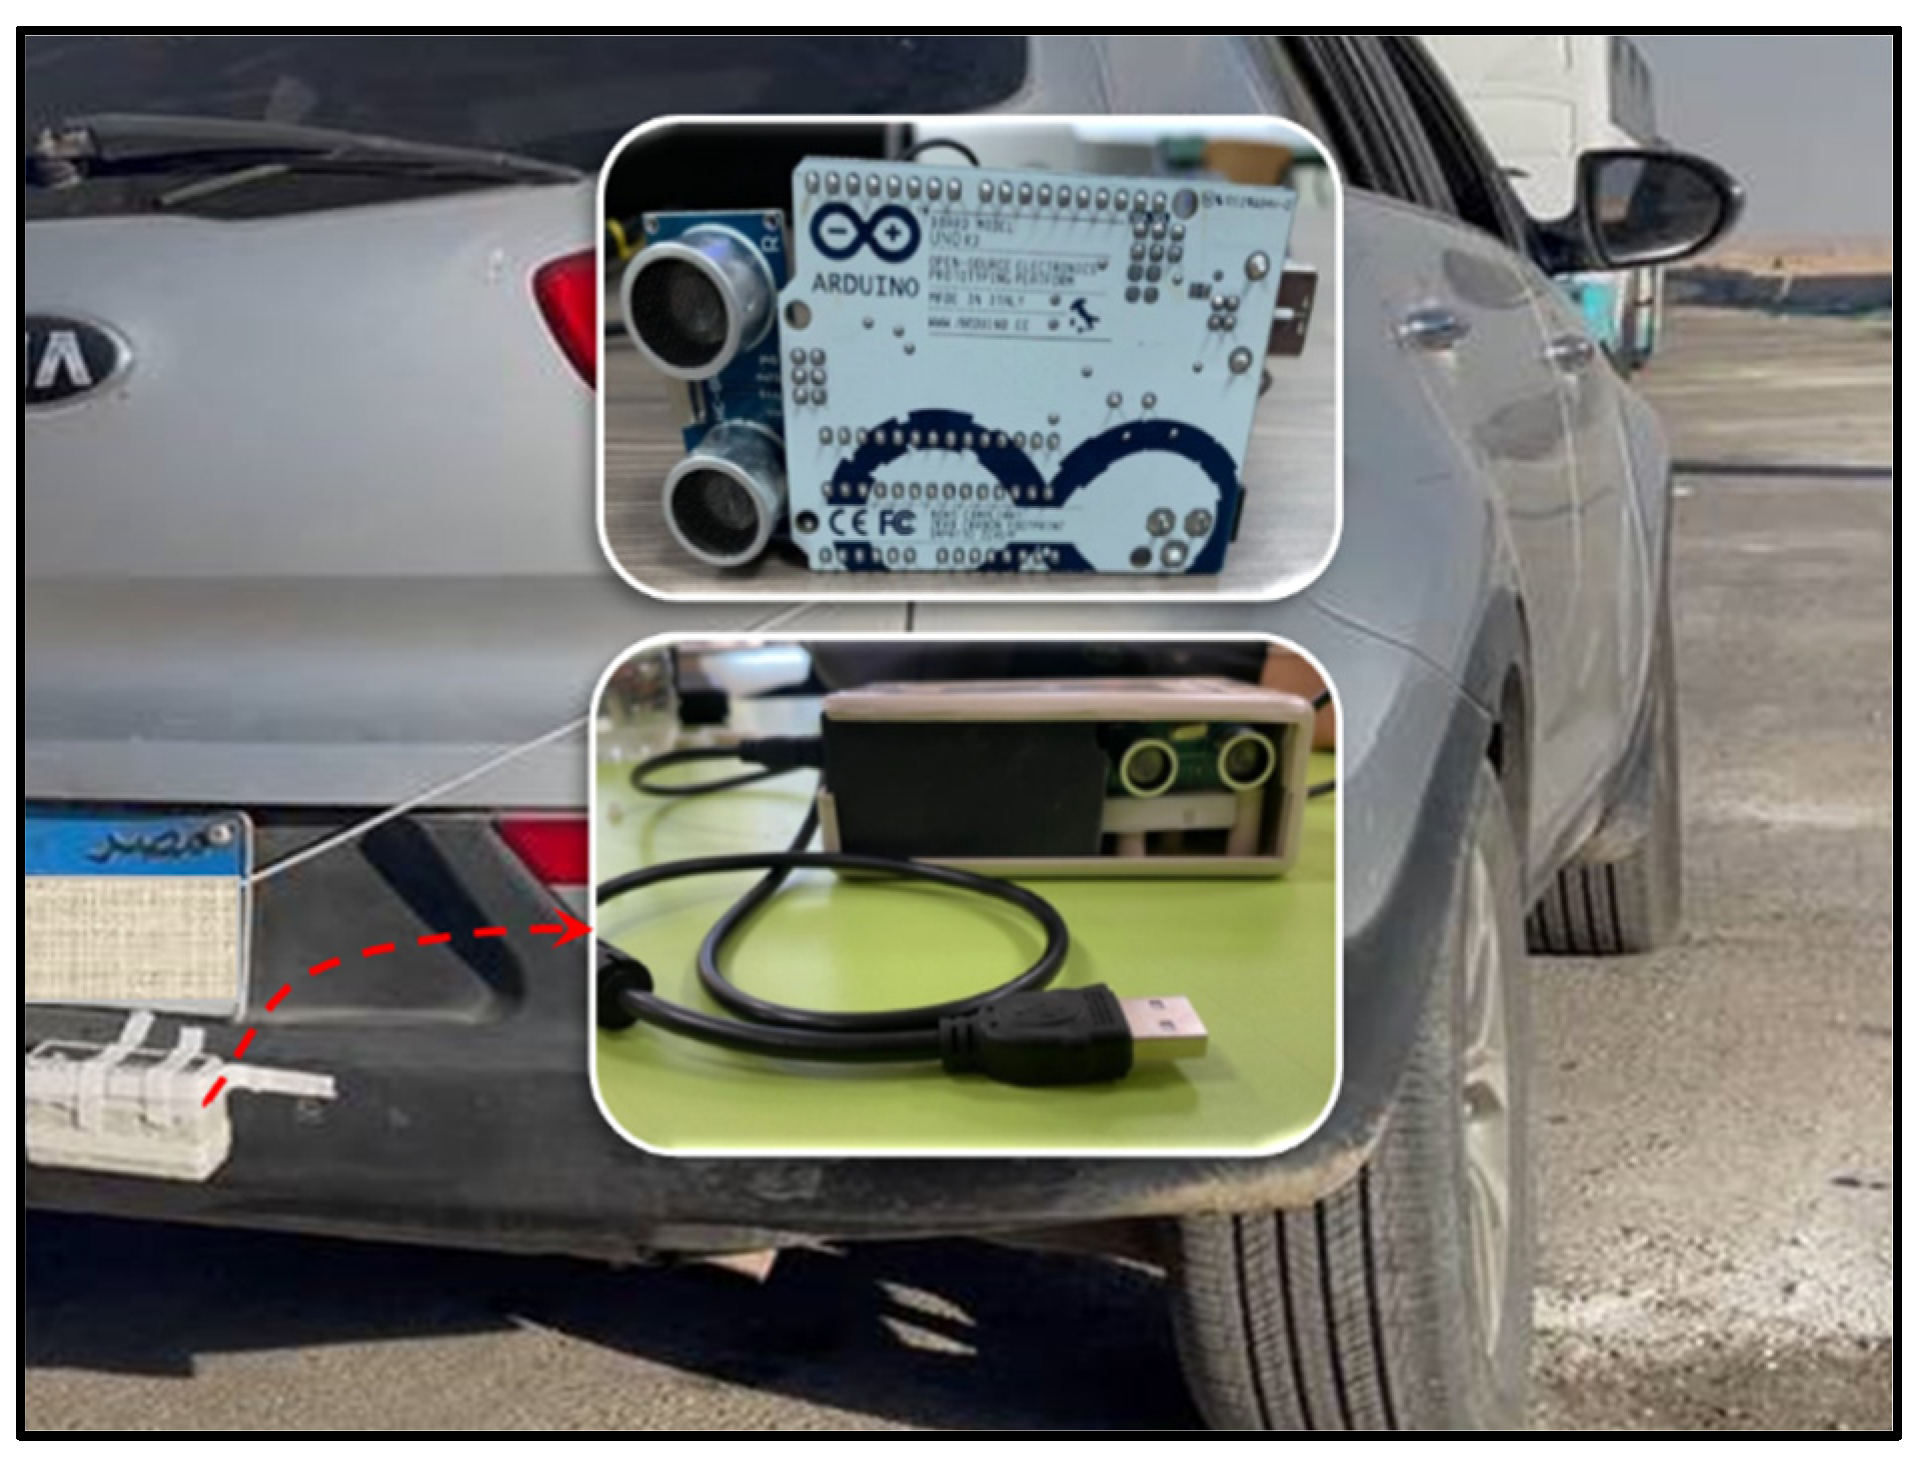
3.2. IRI Survey
4. Model Development
5. Model Performance
5.1. Error Analysis
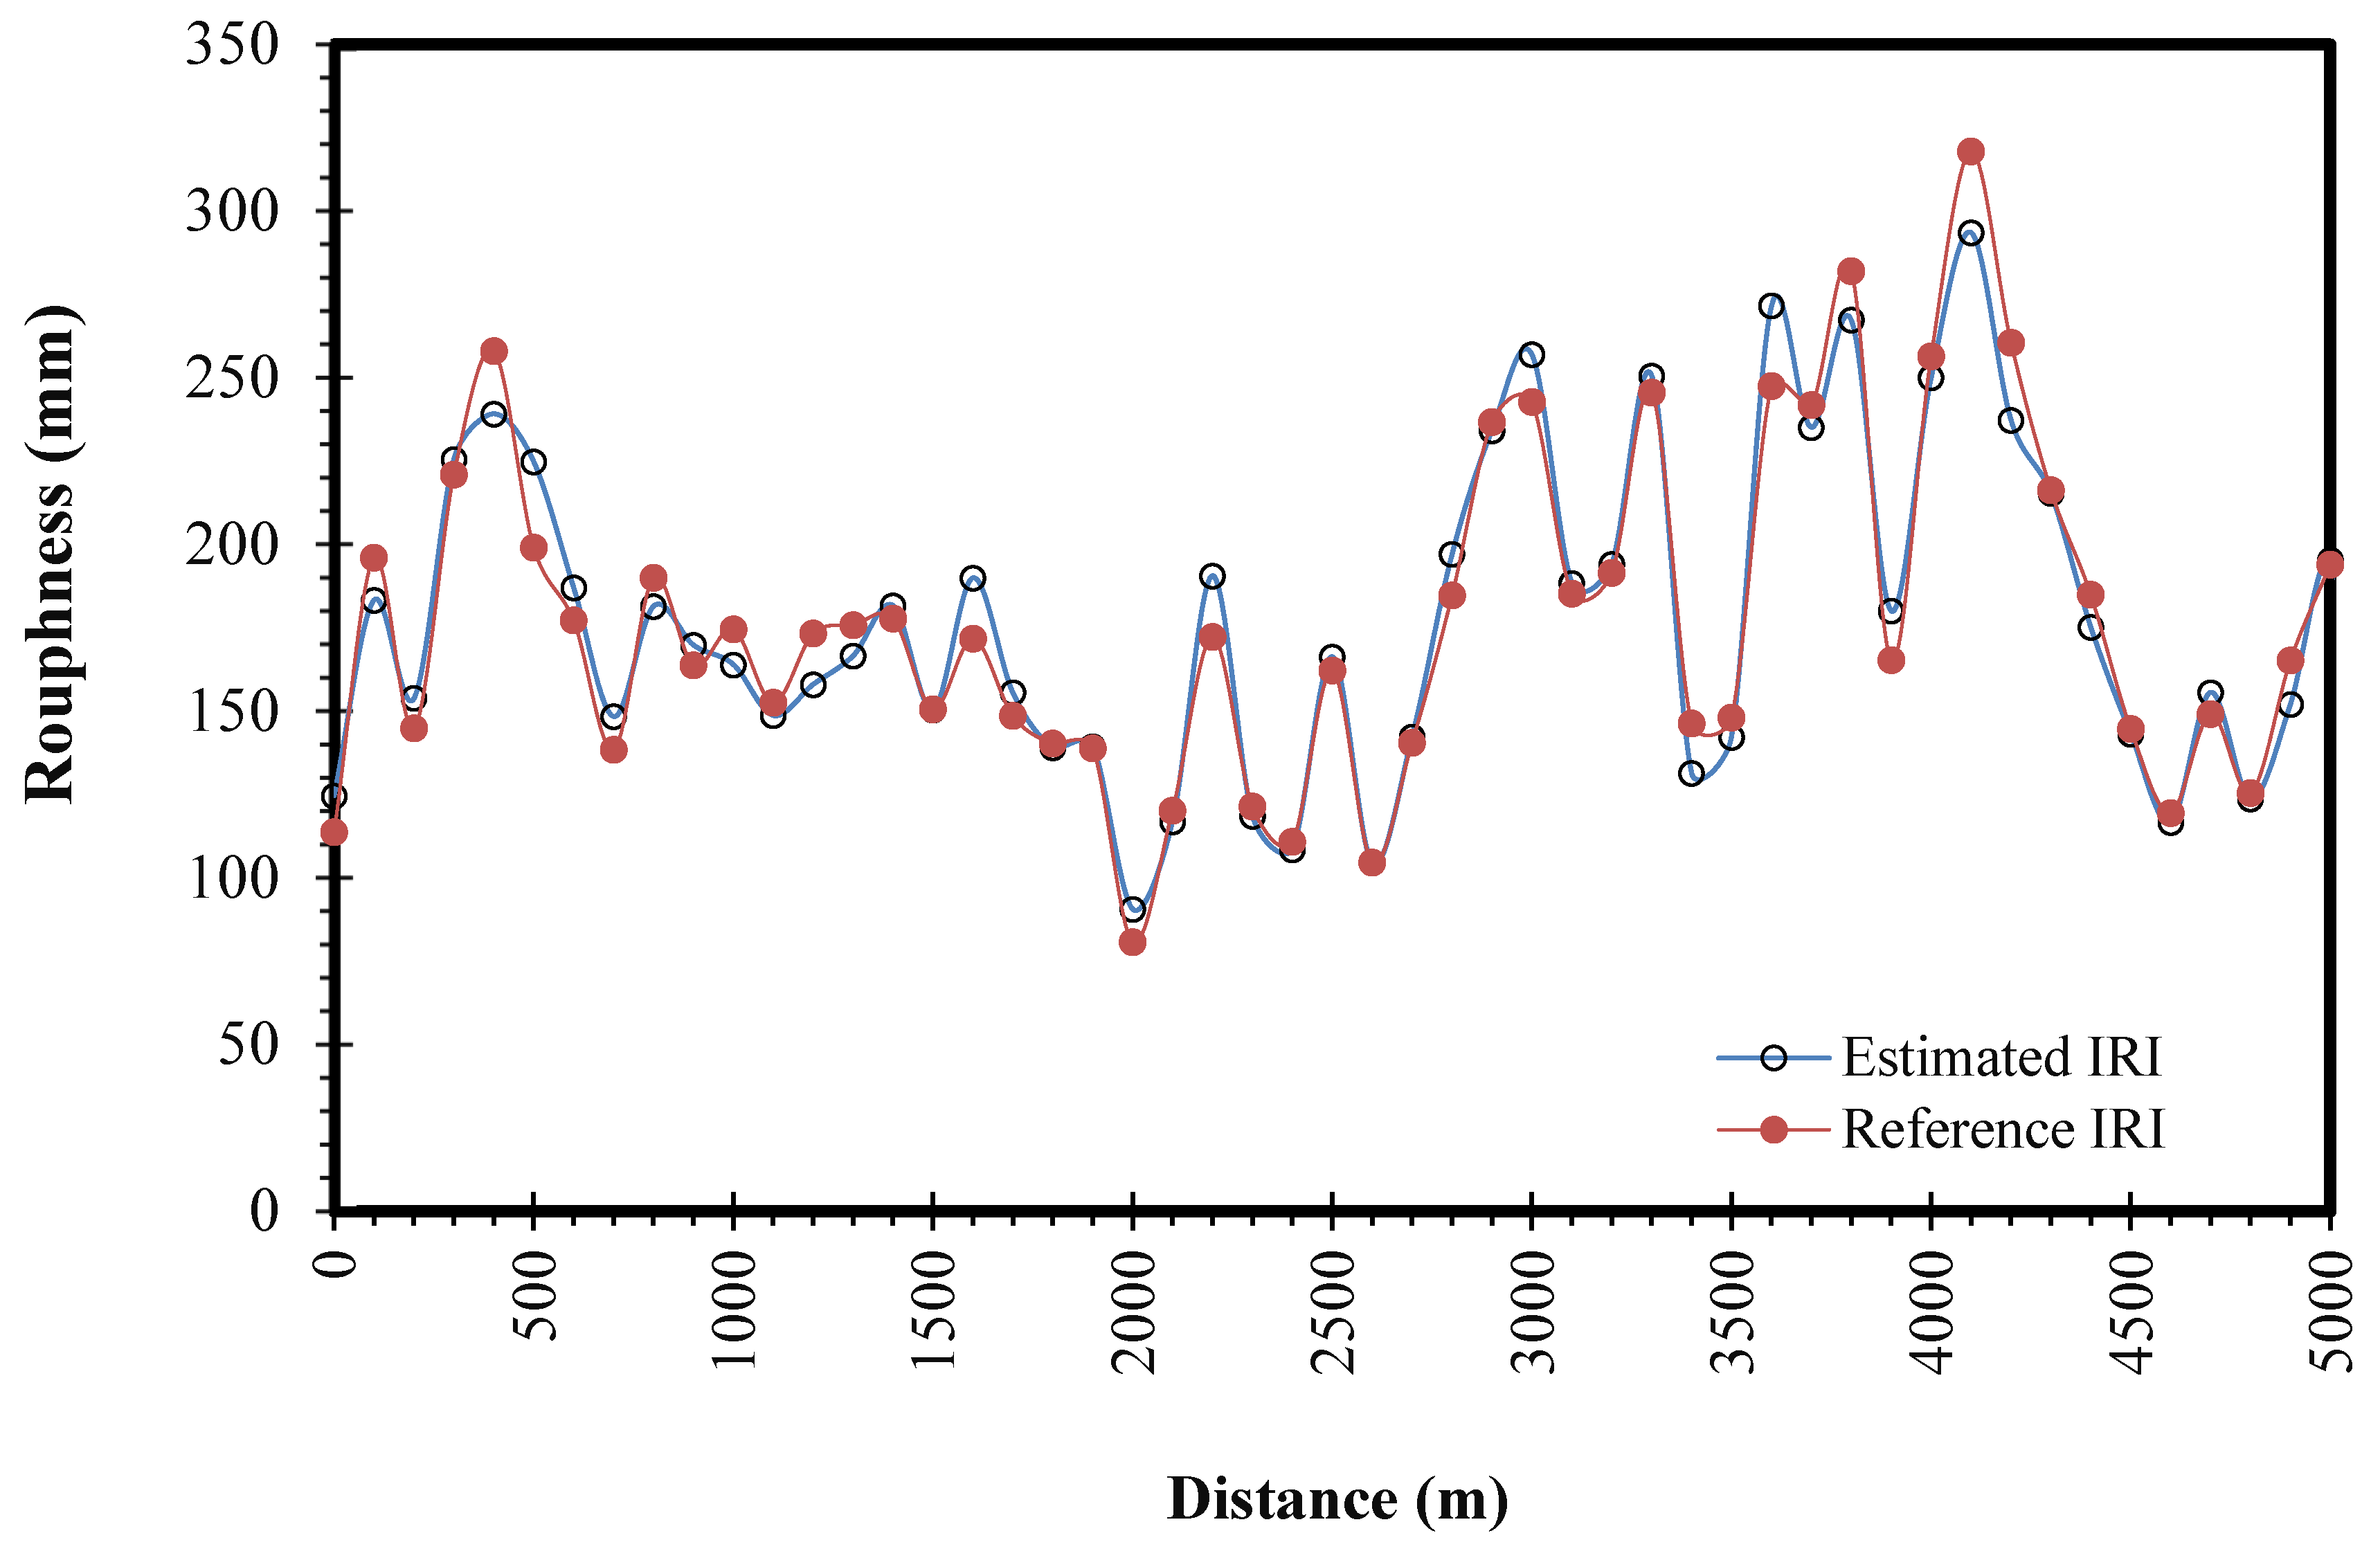
5.2. Validation
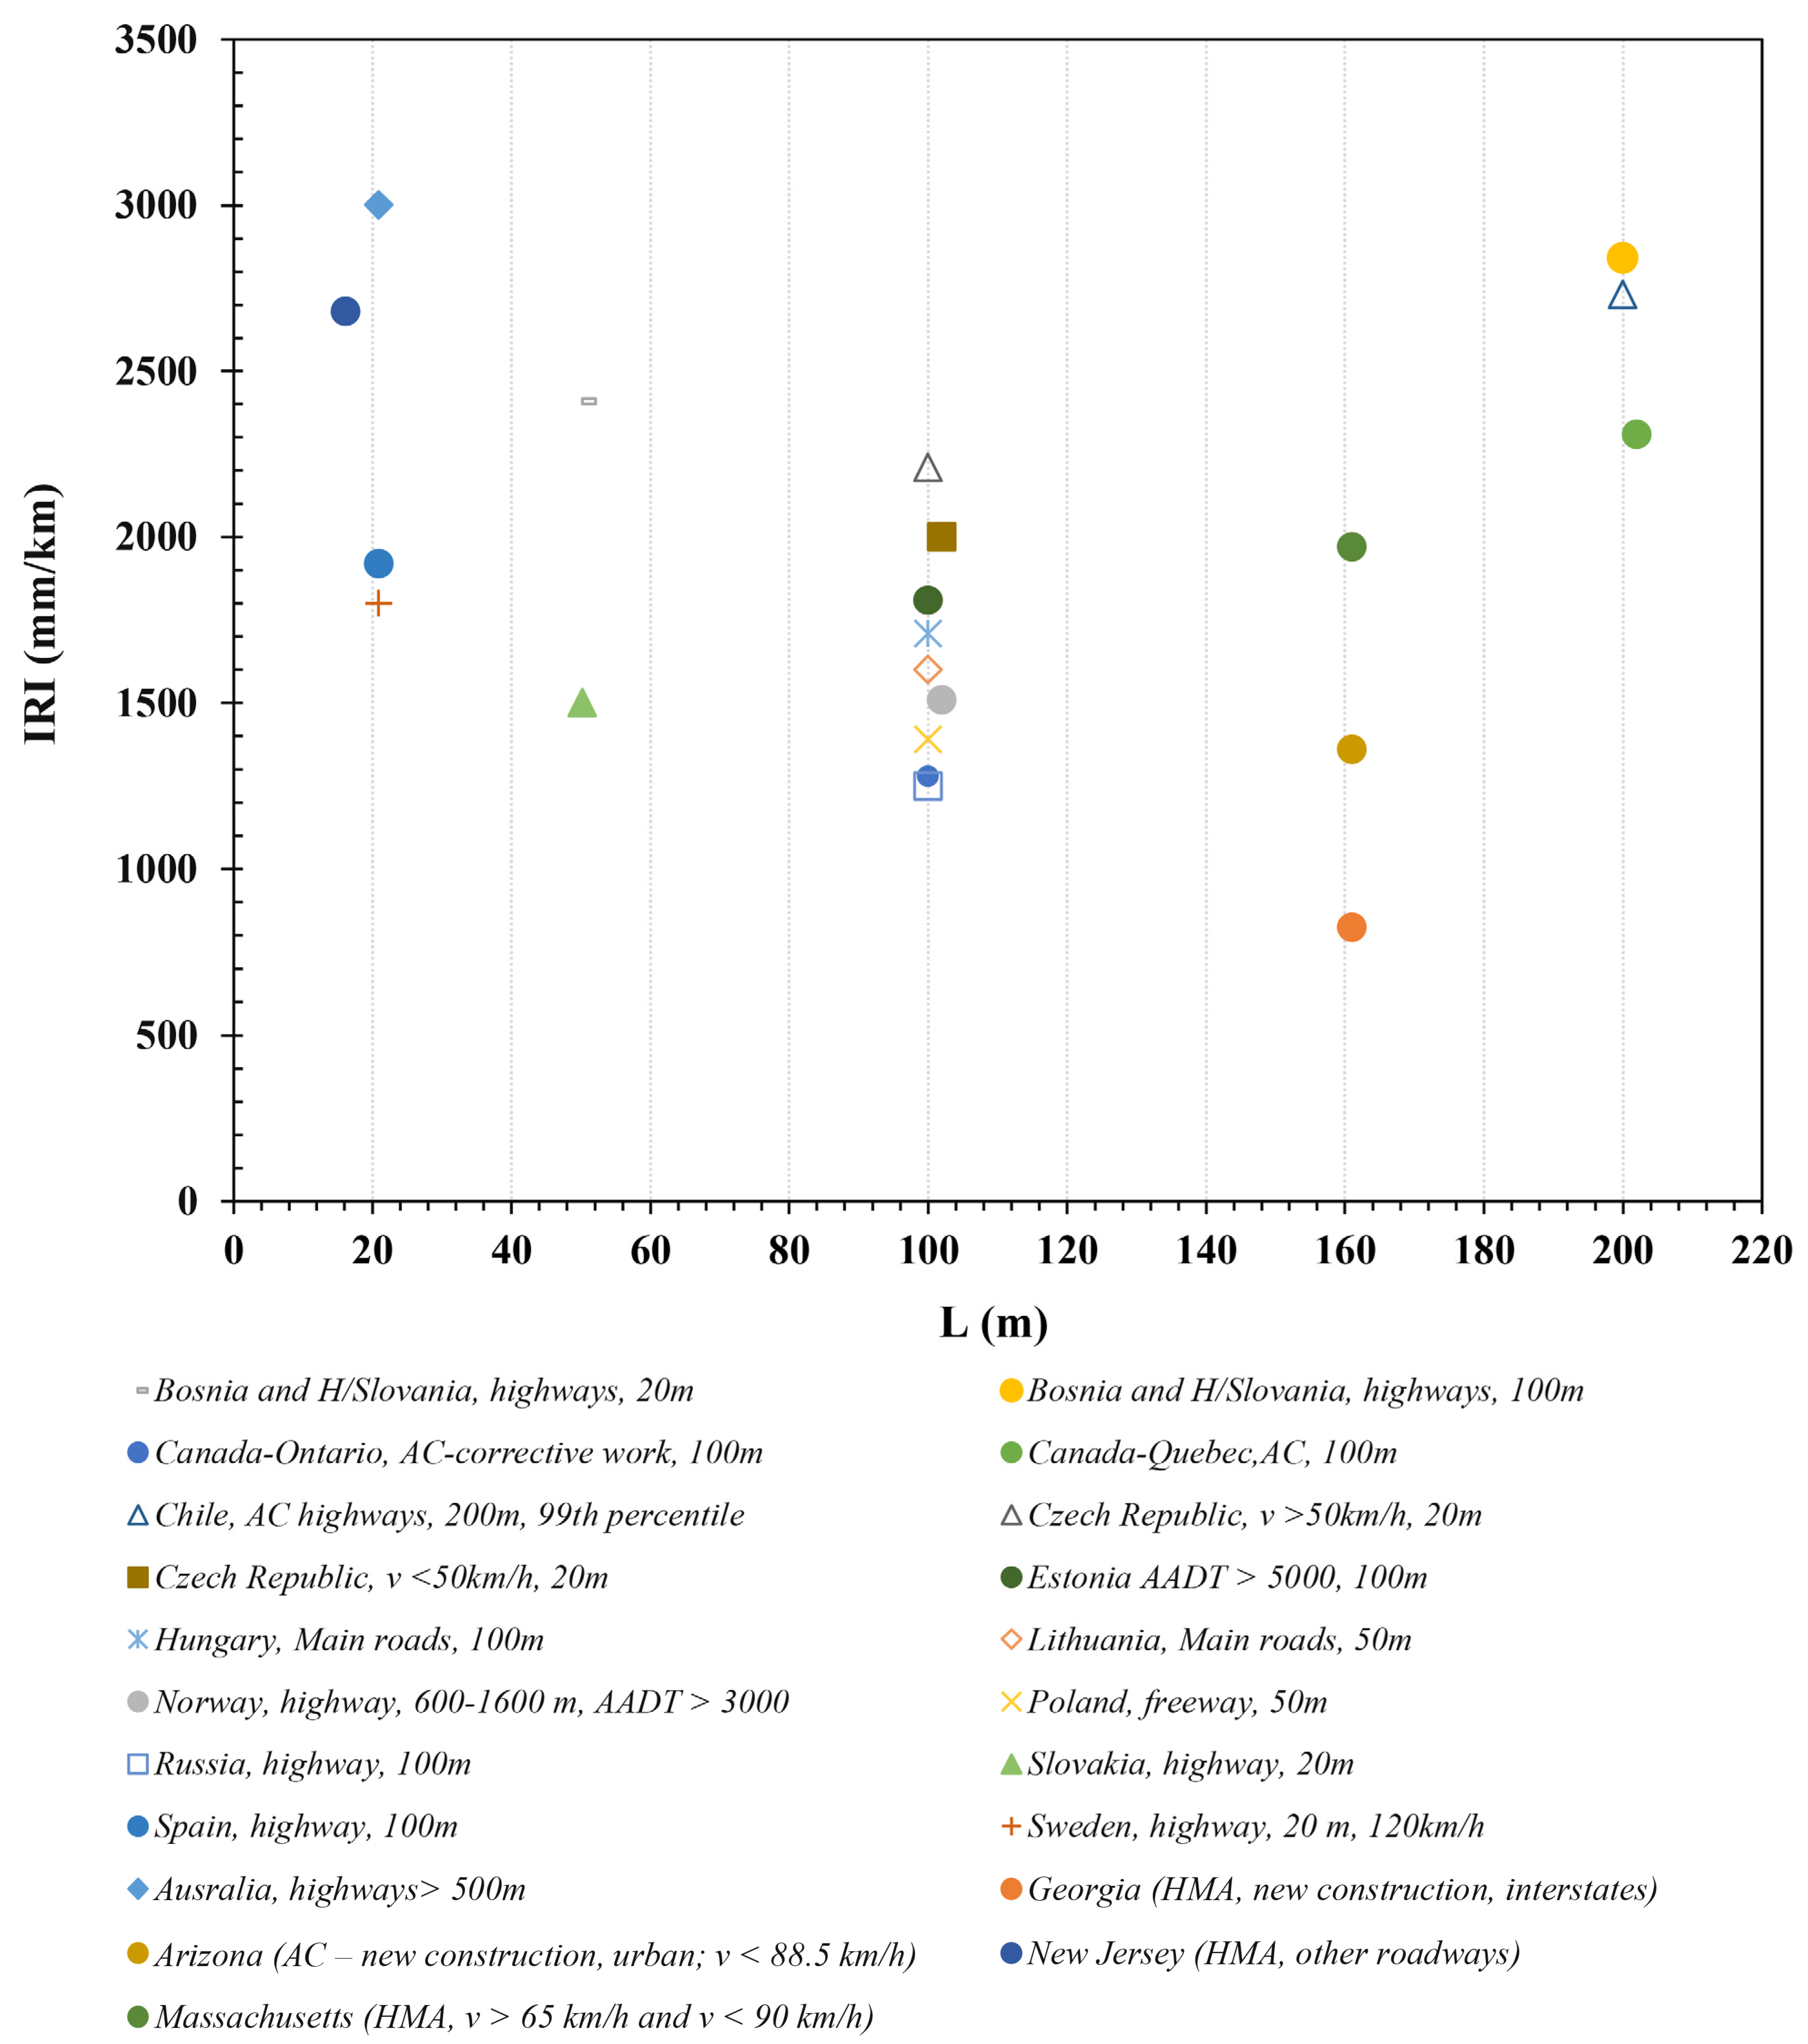
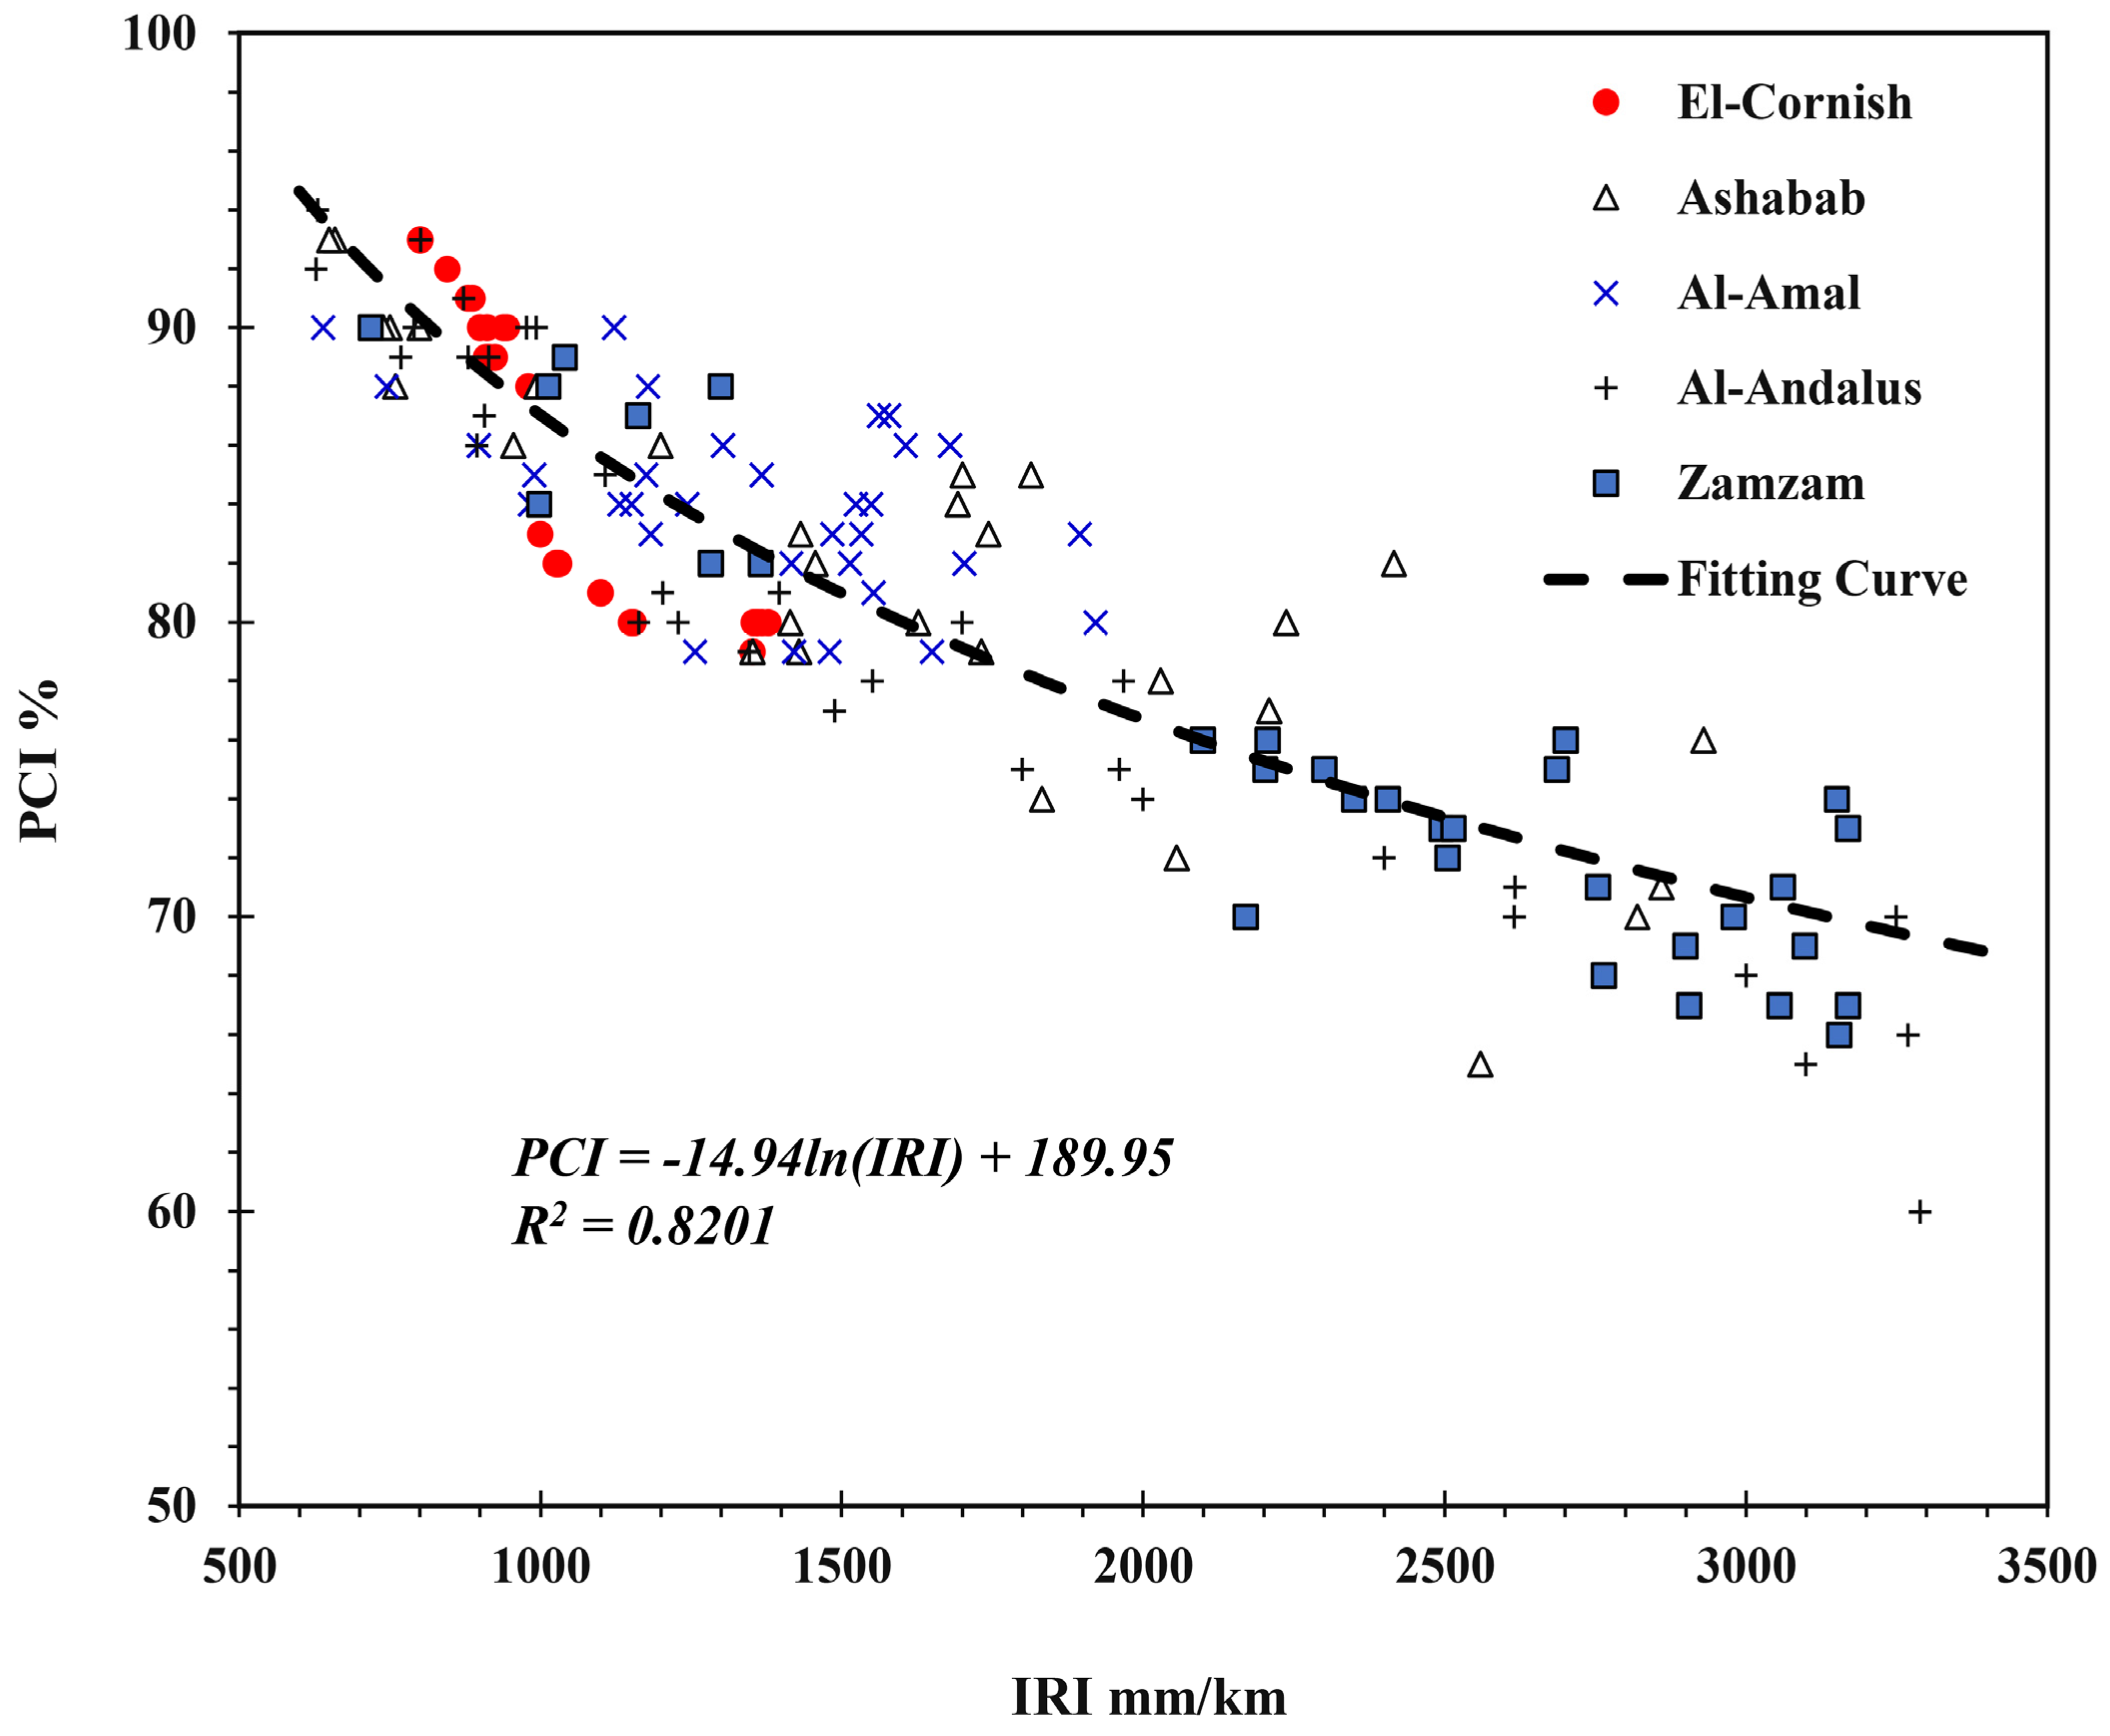
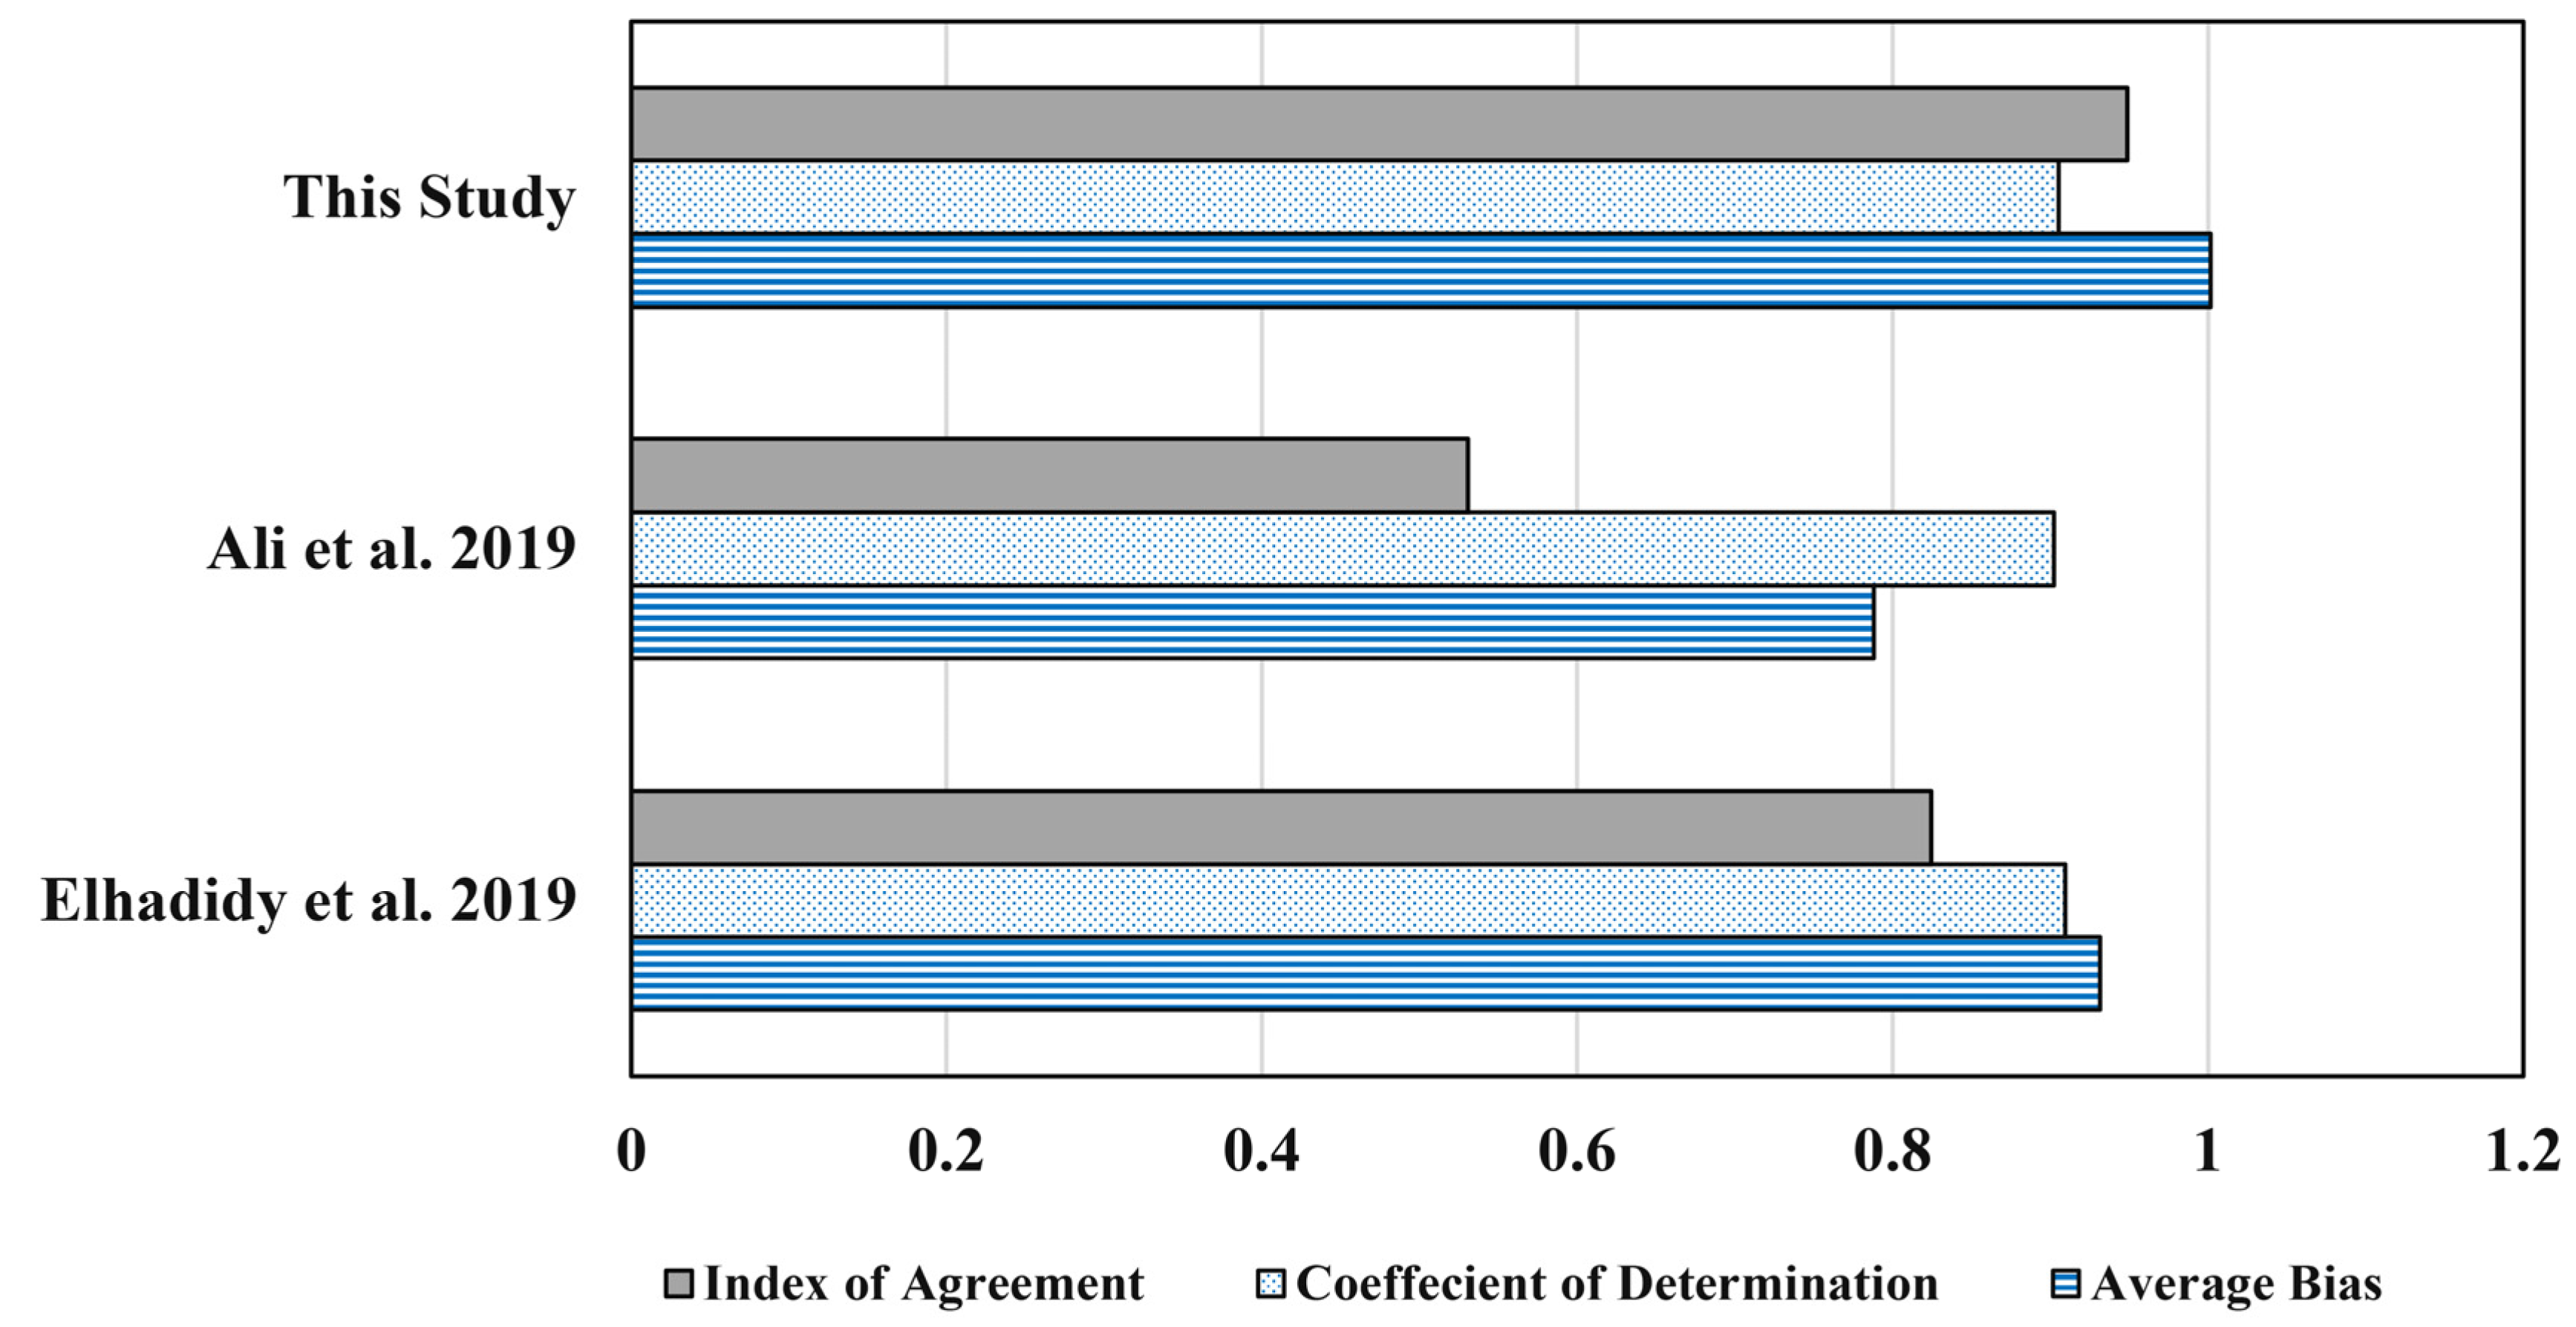
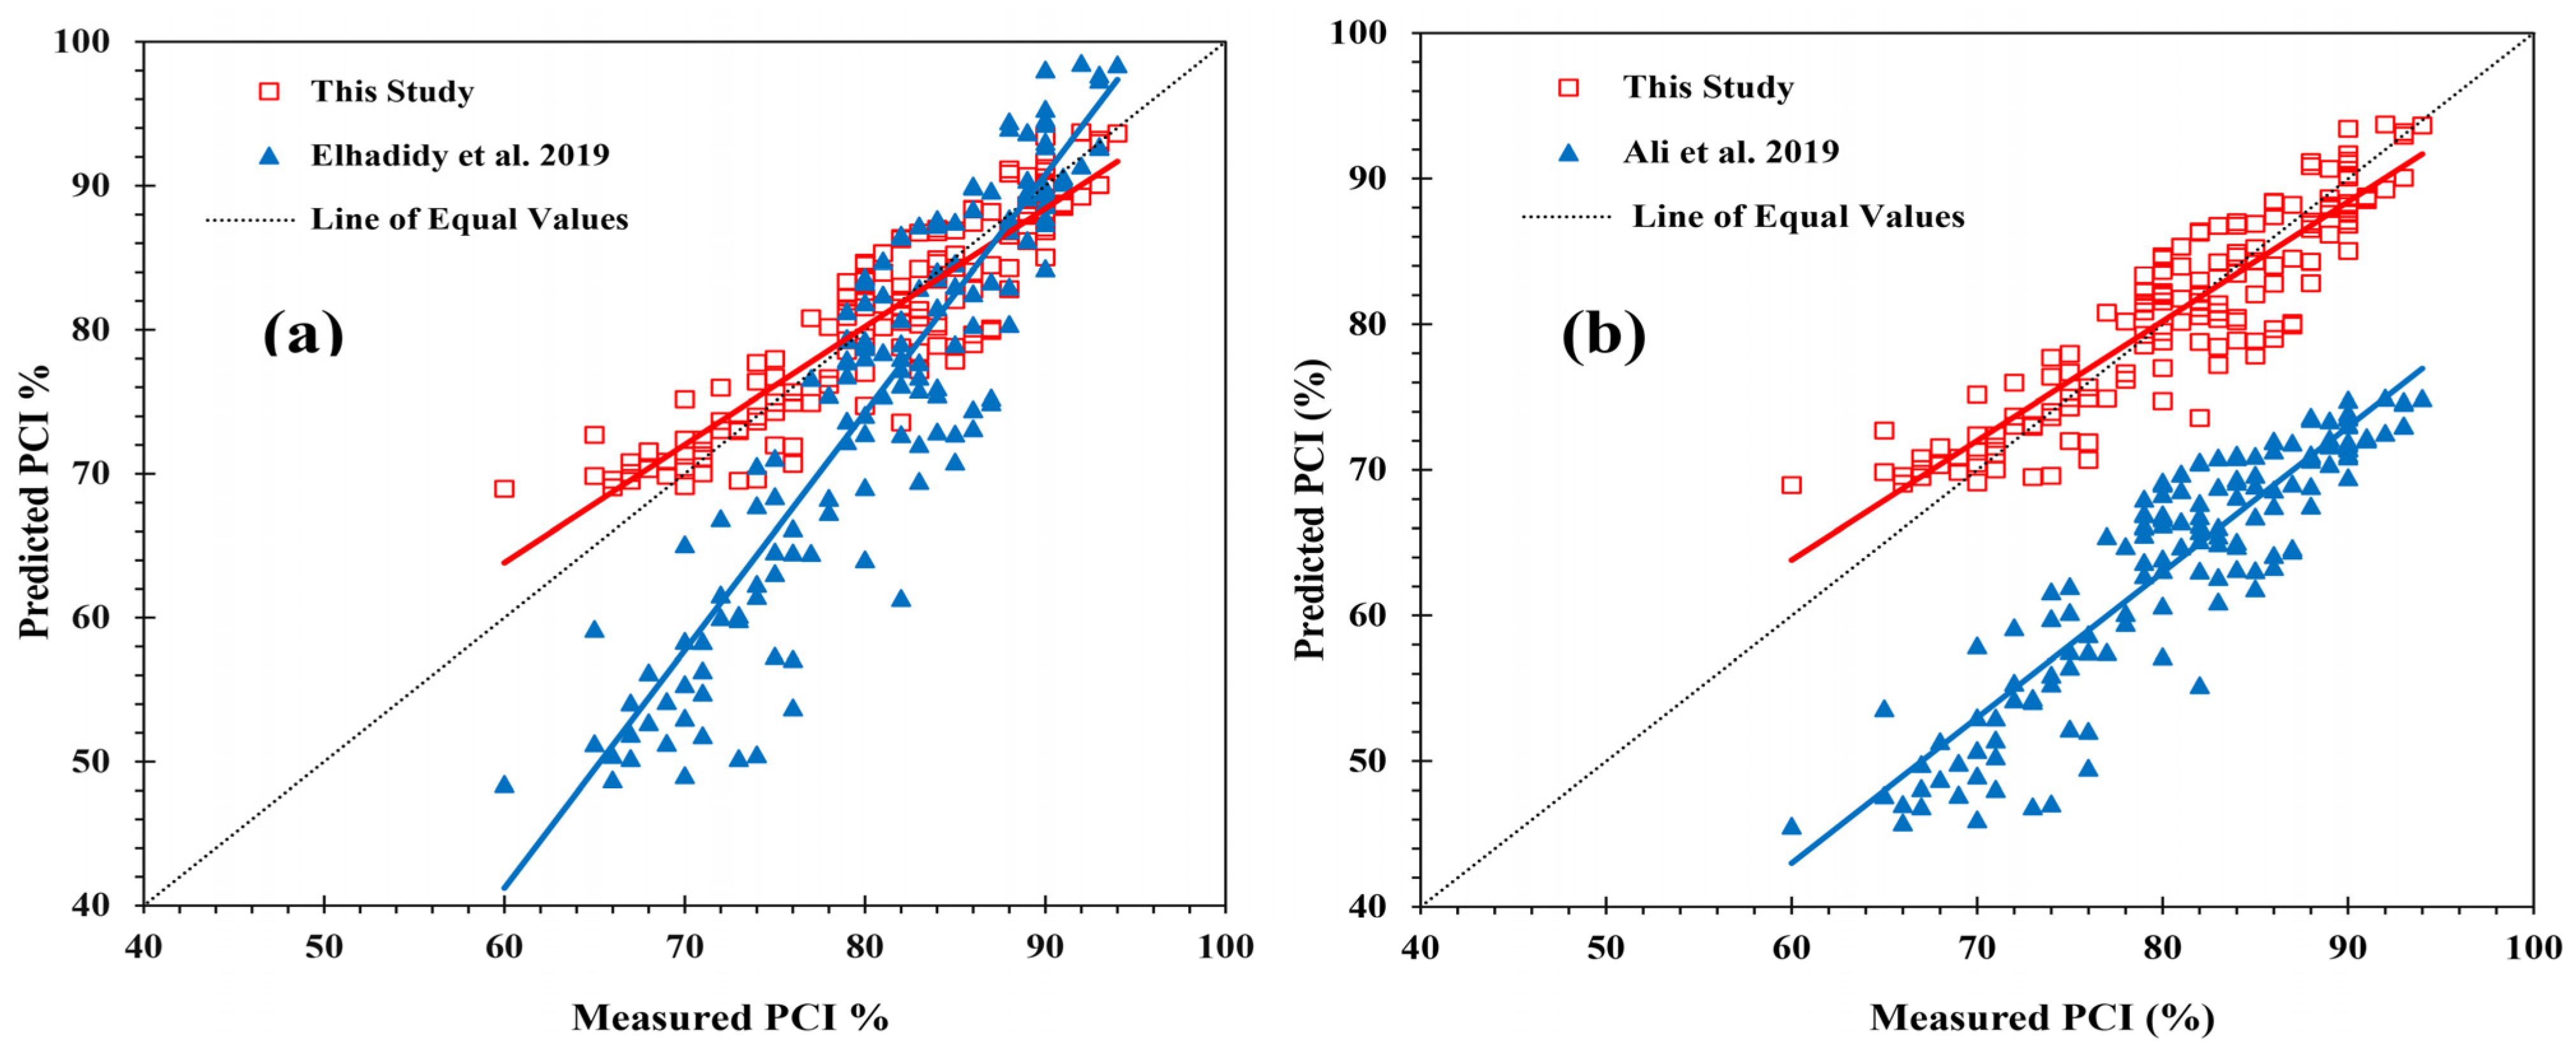
5.3. Comparisons with Existing Models
5.4. Implication on Developing Countries
6. Conclusions and Future Direction
Author Contributions
Funding
Institutional Review Board Statement
Informed Consent Statement
Data Availability Statement
Conflicts of Interest
Abbreviations
| AADT | Annual Average Daily Traffic |
| B | Average bias |
| BPN | British Pendulum Number |
| DC | Direct current |
| DHV | Design Hourly Volume |
| ESAL | Traffic loading represented by Equivalent Single Axle Load |
| FWD | Falling Weight Deflectometer |
| HMA | Hot Mix Asphalt |
| Ia | Index of Agreement |
| IRI | International Roughness Index |
| LIDAR | Light Detection and Ranging |
| LTPP | Long-Term Pavement Performance |
| MAE | Mean Absolute Error |
| MSE | Mean Square Error |
| PCI | Pavement Condition Index |
| PE | Potential Error |
| PMMS | Pavement Maintenance Management System |
| PMS | Pavement Management System |
| PSR | Pavement Service Rating |
| RMSE | Root Mean Square Error |
| Coefficient of determination | |
| SE | Standard Error |
| σ | Standard Deviation |
| UAV | Unmanned Aerial Vehicle |
References
- Hikmah, N.; Tan, S.J.; Zahran, E.S.M.M.; Yap, Y.H.; Taib, H. Statistical Correlation between Road Surface Roughness and Traffic Accidents. In Proceedings of the 7th Brunei International Conference on Engineering and Technology 2018 (BICET 2018), IET Conference Proceedings, Bandar Seri Begawan, Brunei, 12–14 November 2018. [Google Scholar]
- Ali, A.; Hossain, K.; Hussein, A.; Swarna, S.; Dhasmana, H.; Hossain, M. Towards development of PCI and IRI models for road networks in the City of St. John’s. In Proceedings of the Airfield and Highway Pavements, Chicago, IL, USA, 21–24 July 2019. [Google Scholar]
- Adeli, S.; Najafi Moghaddam Gilani, V.; Kashani Novin, M.; Motesharei, E.; Salehfard, R. Development of a Relationship between Pavement Condition Index and International Roughness Index in Rural Road Network. Adv. Civ. Eng. 2021, 2021, 1–9. [Google Scholar] [CrossRef]
- Elhadidy, A.A.; El-Badawy, S.M.; Elbeltagi, E.E. A simplified pavement condition index regression model for pavement evaluation. Int. J. Pavement Eng. 2019, 22, 643–652. [Google Scholar] [CrossRef]
- Khahro, S.; Memon, Z.; Gungat, L.; Yazid, M.; Rahim, A.; Mubaraki, M.; Md Yusoff, N. Low-Cost Pavement Management System for Developing Countries. Sustainability 2021, 13, 5941. [Google Scholar] [CrossRef]
- Bayoumi, A. On the evaluation of settlement measurements using borehole extensometers. Geotech. Geol. Eng. 2011, 29, 75–90. [Google Scholar] [CrossRef]
- Sarsam, S.I. Pavement maintenance management system: A review. Trends Transp. Eng. Appl. 2016, 3, 19–30. [Google Scholar]
- Abohashima, M.A. Lecture Notes for Post-Graduation in Pavement Maintenance Management System. 2011; unpublished. [Google Scholar]
- Xiao, M.; Luo, R.; Yu, X. Assessment of asphalt pavement overall performance condition using functional indexes and FWD deflection basin parameters. Constr. Build. Mater. 2022, 341, 127872. [Google Scholar] [CrossRef]
- Hasibuan, R.P.; Surbakti, M.S. Study of Pavement Condition Index (PCI) relationship with International Roughness Index (IRI) on Flexible Pavement. In Proceedings of the International Conference on Sustainable Civil Engineering Structures and Construction Materials (SCESCM 2018), Yogyakarta, Indonesia, 5–7 September 2018; MATEC Web of Conferences. EDP Sciences: Les Ulis, France, 2019; p. 03019. [Google Scholar]
- International, A. Standard Practice for Roads and Parking Lots Pavement Condition Index Surveys; ASTM International: West Conshohocken, PA, USA, 2018. [Google Scholar]
- Shahin, M.Y.; Kohn, S.D. Pavement Maintenance Management for Roads and Parking Lots; Construction Engineering Research Lab (Army): Champaign, IL, USA, 1981. [Google Scholar]
- Wang, K.C.P. Automated Survey and Visual Database Development for Airport and Local Highway Pavement; No. MBTC-2042; TRB: Washington, DC, USA, 2007. [Google Scholar]
- Youssef, M.A.; Elbasher, A.A. Optimal Maintenance Works for the Aborshada Road in the Western Region of Libya. Slovak J. Civ. Eng. 2014, 22, 37. [Google Scholar] [CrossRef]
- Piryonesi, S.M.; El-Diraby, T.E. Examining the relationship between two road performance indicators: Pavement condition index and international roughness index. Transp. Geotech. 2021, 26, 100441. [Google Scholar] [CrossRef]
- Liu, C.; Wu, D.; Li, Y.; Jiang, S.; Du, Y. Mathematical insights into the relationship between pavement roughness and vehicle vibration. Int. J. Pavement Eng. 2022, 23, 1935–1947. [Google Scholar] [CrossRef]
- Shahin, M.Y. Pavement Management for Airports, Roads, and Parking Lots; Springer: Berlin/Heidelberg, Germany, 2005; Volume 501. [Google Scholar]
- Abdelaziz, N.; Abd El-Hakim, R.T.; El-Badawy, S.M.; Afify, H.A. International Roughness Index prediction model for flexible pavements. Int. J. Pavement Eng. 2020, 21, 88–99. [Google Scholar] [CrossRef]
- Gao, H.; Zhang, X. A Markov-based road maintenance optimization model considering user costs. Comput.-Aided Civ. Infrastruct. Eng. 2013, 28, 451–464. [Google Scholar] [CrossRef]
- Shtayat, A.; Moridpour, S.; Best, B.; Rumi, S. An overview of pavement degradation prediction models. J. Adv. Transp. 2022, 2022, 7783588. [Google Scholar] [CrossRef]
- Zahran, E.S.M.M.; Tan, S.J.; Yap, Y.H.; Tan, E.H.; Pena, C.M.F.; Yee, H.F.; Uddin, M.R. An investigation into the impact of alternate road lighting on road traffic accident hotspots using spatial analysis. In Proceedings of the 4th International Conference on Intelligent Transportation Engineering, ICITE 2019, Singapore, 5–7 September 2019; pp. 242–246. [Google Scholar]
- Alkhatni, F.; Ishak, S.Z.; Hashim, W.B.; Borhan, M.N.; Zahran, E.M.M. Spatial Analysis of the Contribution of Parking Service Facilities to Traffic Crashes along Limited-access Roadways. Open Transp. J. 2023, 17, e187444782212300. [Google Scholar] [CrossRef]
- Zahran, E.S.M.M.; Tan, S.J.; Tan, E.H. A novel spatial analysis method to evaluate the safety impact of alternate road lighting. Int. J. Inj. Control Saf. Promot. 2022, 29, 372–381. [Google Scholar] [CrossRef] [PubMed]
- Robbins, M.M.; Tran, N.H. A synthesis Report: Value of Pavement Smoothness and Ride Quality to Roadway Users and the Impact of Pavement Roughness on Vehicle Operating Costs; NCAT Report; National Center for Asphalt Technology (NCAT) at Auburn University: Auburn, AL, USA, 2016. [Google Scholar]
- Múčka, P. International Roughness Index specifications around the world. Road Mater. Pavement Des. 2017, 18, 929–965. [Google Scholar] [CrossRef]
- Dewan, S.; Smith, R. Estimating IRI from pavement distresses to calculate vehicle operating costs for the cities and counties of San Francisco Bay area. Transp. Res. Rec. 2002, 1816, 65–72. [Google Scholar] [CrossRef]
- Park, K.; Thomas, N.E.; Wayne Lee, K. Applicability of the international roughness index as a predictor of asphalt pavement condition. J. Transp. Eng. 2007, 133, 706–709. [Google Scholar] [CrossRef]
- Gawad, A.M.A.A. Modeling Subgrade and Asphalt Concrete Moduli Variation with Environmental Changes for Pavement Design and Rehabilitation in Egypt. Ph.D. Thesis, Fayoum University, Faiyum, Egypt, 2013. [Google Scholar]
- Radwan, M.; Mostafa, A.-H.; Hashem, M.; Faheem, H. Modeling pavement performance based on LTPP database for flexible pavements. Tek. Dergi 2020, 31, 10127–10146. [Google Scholar] [CrossRef]
- KA Abd El-Samie, M.; EA Khalifa, M. Impact of the Present Land Use and Environmental Conditions on Agricultural Development at Wadi Sannur, Beni Suef, EGYPT. Alex. Sci. Exch. J. 2011, 32, 205–214. [Google Scholar] [CrossRef]
- Council, N. Highway Capacity Manual; Transportation Research Board: Washington, DC, USA, 2000. [Google Scholar]
- Kırbaş, U.; Karaşahin, M. Performance models for hot mix asphalt pavements in urban roads. Constr. Build. Mater. 2016, 116, 281–288. [Google Scholar] [CrossRef]
- Abo-Hashema, M.A. Modeling pavement temperature prediction using artificial neural networks. In Airfield and Highway Pavement 2013: Sustainable and Efficient Pavements; American Society of Civil Engineers (ASCE): Reston, VA, USA, 2013; pp. 490–505. [Google Scholar]
- Benmhahe, B.; Chentoufi, J.A. Automated pavement distress detection, classification and measurement: A review. Int. J. Adv. Comput. Sci. Appl. 2021, 12, 708–718. [Google Scholar] [CrossRef]
- Ali, A.; Heneash, U.; Hussein, A.; Eskebi, M. Predicting Pavement Condition Index Using Fuzzy Logic Technique. Infrastructures 2022, 7, 91. [Google Scholar] [CrossRef]
- Wang, J.; Xu, X.; Pan, Z.; Jiang, L.; Liu, X. Recent Developments in Pavement Management for Road Maintenance: Equipment, Software, and Standard. CICTP 2020, 2020, 883–893. [Google Scholar]
- Li, W.; Burrow, M.; Metje, N.; Ghataora, G. Automatic road survey by using vehicle mounted laser for road asset management. IEEE Access 2020, 8, 94643–94653. [Google Scholar] [CrossRef]
- Psarianos, B.; Paradisis, D.; Nakos, B.; Karras, G. A cost-effective road surveying method for the assessment of road alignments. In Proceedings of the IV International Symposium Turkish-German Joint Geodetic Days, Berlin, Germany, 3–6 April 2001; pp. 235–244. [Google Scholar]
- Attoh-Okine, N.; Adarkwa, O. Pavement condition surveys–overview of current practices. In Delaware Center for Transportation; University of Delaware: Newark, DE, USA, 2013. [Google Scholar]
- Dong, Q.; Chen, X.; Dong, S.; Ni, F. Data analysis in pavement engineering: An overview. IEEE Trans. Intell. Transp. Syst. 2021, 23, 22020–22039. [Google Scholar] [CrossRef]
- Mousa, A.; Hussein, M. Prediction of Shear Wave Velocity in Fine-grained Soils From Cone Penetration Test Data: Toward a Global Approach. Transp. Res. Rec. 2022, 2676, 565–582. [Google Scholar] [CrossRef]
- Legates, D.R.; Davis, R.E. The continuing search for an anthropogenic climate change signal: Limitations of correlation-based approaches. Geophys. Res. Lett. 1997, 24, 2319–2322. [Google Scholar] [CrossRef]
- Sullivan, J.H.; Warkentin, M.; Wallace, L. So many ways for assessing outliers: What really works and does it matter? J. Bus. Res. 2021, 132, 530–543. [Google Scholar] [CrossRef]
- Pereira, H.R.; Meschiatti, M.C.; Pires, R.C.d.M.; Blain, G.C. On the performance of three indices of agreement: An easy-to-use r-code for calculating the Willmott indices. Bragantia 2018, 77, 394–403. [Google Scholar] [CrossRef]
- Arhin, S.A.; Williams, L.N.; Ribbiso, A.; Anderson, M.F. Predicting pavement condition index using international roughness index in a dense urban area. J. Civ. Eng. Res. 2015, 5, 10–17. [Google Scholar]
- El-Ashwah, A.S.; Awed, A.M.; El-Badawy, S.M.; Gabr, A.R. A new approach for developing resilient modulus master surface to characterize granular pavement materials and subgrade soils. Constr. Build. Mater. 2019, 194, 372–385. [Google Scholar] [CrossRef]
- Arhin, S.A.; Noel, E.C. Predicting Pavement Condition Index from International Roughness Index in Washington, DC; Final Report; TRB: Washington, DC, USA, 2014. [Google Scholar]
- Rifai, M.; Setyawan, A.; Handayani, F.S.; Arun, A.D. Evaluation of functional and structural conditions on flexible pavements using pavement condition index (PCI) and international roughness index (IRI) methods. In Proceedings of the Third International Conference of Construction, Infrastructure, and Materials (ICCIM 2023), DKI Jakarta, Indonesia, 27 July 2023; E3S Web of Conferences. EDP Sciences: Les Ulis, France, 2023; p. 05011. [Google Scholar]
- Imam, R.; Murad, Y.; Asi, I.; Shatnawi, A. Predicting Pavement Condition Index from International Roughness Index using Gene Expression Programming. Innov. Infrastruct. Solut. 2021, 6, 139. [Google Scholar] [CrossRef]


| Road | Road Length (km) | AADT | Design Hourly Volume (DHV) |
|---|---|---|---|
| Ashabab | 12.5 | 12,734 | 1528 |
| El-Cornish | 11.5 | 14,829 | 1780 |
| Zamzam | 5.4 | 13,598 | 1632 |
| Al-Amal * | 9 | 11,583 | 1390 |
| Al-Andalus * | 5.6 | 14,536 | 1744 |
| Distress Type | Quantity | Severity Level |
|---|---|---|
| Bleeding () | 30 | medium |
| Depression () | 11.7 | high |
| Longitudinal cracking () | 17.5 | low |
| Patching () | 68.95 | medium |
| Potholes (No.) | 4 | low |
| Edge cracking | 70 | high |
| Lane/shoulder drop off | 22 | medium |
| Power supply | +5 V DC |
| Quiescent Current | <2 mA |
| Working Current | 15 mA |
| Working Frequency | 40 Hz |
| Effectual Angle | <15° |
| Trigger Input Pulse width | 10 uS TTL pulse |
| Echo Output Signal | TTL pulse proportional to the distance range |
| Dimensions | 45 mm × 20 mm × 15 mm |
| Number of points | 221 |
| Minimum | 57.00 |
| Maximum | 95.00 |
| Median | 83.00 |
| Mean | 82.59 |
| σ | 7.786 |
| SE | 0.5237 |
| Coefficient of variation | 9.43% |
| Correlation significant (alpha = 0.05)? | Yes |
| KS normality test | |
| KS distance | 0.1071 |
| p value | p < 0.0001 |
| Passed normality test (alpha = 0.05)? | No |
| Shapiro–Wilk normality test | |
| W | 0.9533 |
| p value | p < 0.0001 |
| Passed normality test (alpha = 0.05)? | No |
| D’Agostino and Pearson omnibus normality test | |
| K2 | 12.18 |
| p value | 0.0023 |
| Passed normality test (alpha = 0.05)? | No |
| Country | Model | (This Study) | B | Ia | Source | |
|---|---|---|---|---|---|---|
| USA | 0.995 | 0.826 | 0.95 | 0.824 | [4] | |
| USA | 0.69 | 0.815 | 1.41 | 0.234 | [45] | |
| USA | 0.8 | 0.817 | 0.94 | 0.268 | [47] | |
| USA | 0.66 | 0.792 | 0.95 | 0.758 | [27] | |
| USA | 0.53 | 0.815 | 0.87 | 0.392 | [26] | |
| Canada | 0.79 | 0.815 | 0.79 | 0.530 | [2] | |
| Iran | 0.999 | 0.820 | 1.48 | 0.284 | [3] | |
| Indonesia | 0.59 | 0.821 | 1.16 | 0.658 | [10] |
Disclaimer/Publisher’s Note: The statements, opinions and data contained in all publications are solely those of the individual author(s) and contributor(s) and not of MDPI and/or the editor(s). MDPI and/or the editor(s) disclaim responsibility for any injury to people or property resulting from any ideas, methods, instructions or products referred to in the content. |
© 2024 by the authors. Licensee MDPI, Basel, Switzerland. This article is an open access article distributed under the terms and conditions of the Creative Commons Attribution (CC BY) license (https://creativecommons.org/licenses/by/4.0/).
Share and Cite
Radwan, M.M.; Mousa, A.; Zahran, E.M.M. Enhancing Pavement Sustainability: Prediction of the Pavement Condition Index in Arid Urban Climates Using the International Roughness Index. Sustainability 2024, 16, 3158. https://doi.org/10.3390/su16083158
Radwan MM, Mousa A, Zahran EMM. Enhancing Pavement Sustainability: Prediction of the Pavement Condition Index in Arid Urban Climates Using the International Roughness Index. Sustainability. 2024; 16(8):3158. https://doi.org/10.3390/su16083158
Chicago/Turabian StyleRadwan, Mostafa M., Ahmad Mousa, and Elsaid Mamdouh Mahmoud Zahran. 2024. "Enhancing Pavement Sustainability: Prediction of the Pavement Condition Index in Arid Urban Climates Using the International Roughness Index" Sustainability 16, no. 8: 3158. https://doi.org/10.3390/su16083158
APA StyleRadwan, M. M., Mousa, A., & Zahran, E. M. M. (2024). Enhancing Pavement Sustainability: Prediction of the Pavement Condition Index in Arid Urban Climates Using the International Roughness Index. Sustainability, 16(8), 3158. https://doi.org/10.3390/su16083158