Article

Coupling and Quantifying Sustainability and Resilience in Intelligent Buildings

1
Engineering System Management, College of Engineering, American University of Sharjah, Sharjah P.O. Box 26666, United Arab Emirates
2
Civil Engineering Department, College of Engineering, American University of Sharjah, Sharjah P.O. Box 26666, United Arab Emirates
*
Authors to whom correspondence should be addressed.
Sustainability 2024, 16(8), 3175; https://doi.org/10.3390/su16083175
Submission received: 20 December 2023 / Revised: 22 March 2024 / Accepted: 23 March 2024 / Published: 10 April 2024
(This article belongs to the Special Issue Intelligent Sustainable Buildings and Information Technologies)

Abstract

:
Over recent years, the sustainability and resilience concept has increased its significance in the construction industry. Sustainability is associated with implementing best practices in the construction industry, while resilience is the adaptability and tolerance of systems in harsh conditions. The concepts are learned in the construction process. Moreover, building automation is growing rapidly, and buildings are becoming increasingly dependent on complex systems and technology and susceptible to unanticipated failure. Though sustainability and resilience concepts are interlinked, limited research quantifies their combination, resulting in a limited comprehension of how both concepts interact during application by developers in a smart building. Therefore, this study has established a financial model that employs Net Present Value (NPV) in studying the inference and clampdown of investment in both concepts. NPV was estimated using indirect and direct costs and benefits derived from the continuous integration of sustainability and resilience in a smart building. To quantify sustainability, its three components had to be quantified. Reduced energy expenditure and government environmental incentives were used to calculate the environmental component. Workers’ cost savings, fire insurance cost savings, and additional system maintenance costs were used to calculate the economic component. The social component of sustainability measured hard-to-quantify attributes like productivity, indoor environment quality, reputation, extra profit, services, and safety. To quantify them, a survey and RII method were used. The two concepts were then coupled by estimating the benefits and costs of installing and keeping resilience tools in design that are sustainable in the smart building and the impact study on the NPV outcome. Application of the design model was also carried out on four smart buildings that were selected in Dubai. The result indicated that coupling sustainable approaches and resilience yields higher NPV by at least 22%. Nevertheless, for NPV to be maintained positively and reduce the cost of failure, faulty detection tools should be assimilated while designing sustainable and smart buildings. The findings of this study will contribute to the benefit of other researchers, developers, investors, managers, engineers, and anyone who is involved in the design or construction process of intelligent buildings.

1. Introduction

The concepts of sustainability and resilience have become the pivot of numerous research efforts and trends, and their application is widely used in different sectors. Therefore, the need to quantify both of them is very crucial. As a result of the benefits derived from the concepts, a score of research is being conducted to integrate and quantify the concepts [1]. The attempts to integrate and quantify the concepts are emerging from different fields such as urban planning, landscape planning, urban drainage systems, and civil infrastructures. The world is experiencing rapid modernization, where new technologies are used every day, and engineers and designers are becoming keen on the performance of buildings. Over recent years, there has been an increased demand for modern construction processes and design, which necessitate the application of new and intelligent technology for a smart structure that satisfies the client’s needs and achieves a high level of sustainable performance [2].
Additionally, several approaches have been used to implement resilience in smart buildings, creating highly resilient structures. However, a few have emphasized integrating sustainability and resilience in smart buildings [1]. This suggests that some buildings have advanced technology that can enable them to meet sustainability goals and be environmentally friendly. Others could have advanced technology that could help detect defects in the system, preventing failure and allowing quick recovery in case of any failure. The importance of sustainability has grown in recent years and is regarded as a critical factor in modern projects [3]. Different opinions exist about sustainability, with one describing it as a normative concept that enhances the balance between different generations. It is also perceived as the ability to utilize the available earth resources to meet our current needs without necessarily depleting them so they can meet the needs of the future generation [4]. In this definition, sustainability can also mean a method to stabilize the Triple Bottom Line (TBL). TBL comprises the social, economic, and environmental consequences of growth [5] (pp. 3, 6–8).
As mentioned, sustainable or resilient buildings may be financially beneficial. However, their integration will be more profitable. A few studies quantified smart building sustainability and resilience after extensive research. There was no financial model that quantified and coupled smart building costs. One study used as a starting point for this study evaluated the costs and benefits of intelligent systems and then performed a sensitivity analysis to assess building system durability. The sensitivity analysis was based on a rough hypothetical assumption of increased energy consumption, which was considered a sign of smart building system failure [6].
Thus, functionality loss or fault cost was used to quantify smart building system resilience. Cost–benefit evaluation was used to measure smart system sustainability and resilience. A realistic financial model was created using NPV to analyze data from four Dubai smart buildings. The costs and benefits of four smart buildings in Dubai were retrieved, along with data from a survey and other studies, to formulate the model and determine the sustainability component variables for calculations. The aim of this work is to develop a financial model that could be used to quantify the sustainability benefits of having smart systems in buildings while at the same time quantifying the benefits of having resilience integrated alongside sustainability. Driven by the fact that the new emerging intelligent buildings are becoming a growing trend in the modern world, the need for integrating the concept of resilience with sustainability in those intelligent buildings is of high importance due to the numerous benefits of such integration.
The findings of this study will contribute to the benefit of other researchers, developers, investors, managers, engineers, and anyone who is involved in the design or construction process of intelligent buildings. The following points will summarize the contributions to the body of knowledge:
  • Quantify the resilience of smart building systems.
  • Couple both sustainability and resilience using a cost–benefit evaluation method.
  • The contributions of this study to the business are summarized in the following points:
  • Measure the financial damages that might occur when resilience is not coupled with sustainability.
  • Minimize the possible financial losses and turn them into a potential profit.

2. Literature Review

2.1. Methods to Assess and Quantify Sustainability

Today, buildings continue to adopt new technical innovations under the concept of sustainability to improve their environmental performance [7]. Due to this, the need for assessment methodologies to capture and quantify the benefits of integrating sustainable solutions in buildings has become necessary. First method: The Award Rating System is one of the most well-known assessment tools widely used nowadays and is dependent on a points system used to weigh the environmental impacts of the evaluated building. Some of those assessment methodologies include Building Research Establishment Environmental Assessment Methodology (BREEAM); Leadership in Energy and Environmental Design (LEED), developed in 1993 in the USA by the Green Building Council; and DGNB, which are the initials of its developer Deutsche Gesellschaft für Nachhaltiges Bauen, the “German Sustainable Building Council. Nevertheless, these tools do not explicitly consider any monetary value nor a real measured quantification [8,9]. Other methods include the Life Cycle Assessment (LCA) and the Net Present Value (NPV). LCA is a widely recognized framework for quantifying the potential environmental impacts of targeted systems and providing a basis for informed decision-making [10]. This assessment method bases its calculation of the benefits of sustainability on the outcomes of producing a particular product. LCA is a systematic approach that considers the environmental burdens and benefits of a product or system from raw material extraction through production, use, and end-of-life disposal or recycling. According to [11], in the construction industry, LCA plays a crucial role in assessing the environmental performance of buildings and infrastructure projects. By conducting an LCA, stakeholders can identify opportunities to reduce environmental impacts, optimize resource use, and make informed decisions to enhance sustainability. LCA in construction typically considers factors such as energy consumption, greenhouse gas emissions, water usage, waste generation, and other environmental indicators [12].
Several studies have highlighted the importance of LCA in the construction industry. For example, research by [13] emphasized the significance of LCA in identifying the environmental hotspots in building materials and construction processes. By conducting LCAs on different building materials and construction techniques, stakeholders can compare environmental performance and select options that minimize overall environmental impacts. LCA aims to measure the impacts of constructing a certain structure (building) from the first moment of its construction until it reaches the end of its life by quantifying the building’s consumed energy, gas emissions (greenhouse gases), solid waste, and water waste. However, LCA seems to address the environmental aspect of sustainability. Another similar method for sustainability assessment is the NPV method, which focuses more on the economic aspect of sustainability. It is also a very important tool for the analysis of a process/system from its cradle to [14,15]. This method is mostly used to obtain a more accurate analysis of costs and benefits, converting them into an equivalent present value that could be positive or negative. A negative number indicates that the project is not worth investing in, while a positive number indicates that the project is worth investing in [16,17,18].
There are many other methods that could be used to quantify sustainability, such as the Clean Development Mechanism Sustainable Development (CDMSD) method, the Benefits Assessment Method, and the Climate Community Biodiversity (CCB) method. These three methods measure the qualitative benefits of sustainability. In other words, they compare a situation in which a sustainable solution has been implemented to a baseline situation in which the solution has not been implemented. For example, comparing carbon emissions after implementing a sustainable solution to the emission before implementing a sustainable solution [19]. The methods will be the focus of this study.

2.2. Resilience Definition and Dimensions

The resilience concept has been widely discussed, defined, and reviewed in multiple studies. Some studies describe it as a way of preventing a structure or building from failing [20]. Some describe it as a way of measuring the durability of a structure [21]. Nonetheless, most studies define resilience as a human group’s capability to withstand and recuperate from the agitation to build their infrastructure and environment. According to [1], resilience is directly connected to members of society and how they strive to build their environment.
Figure 1 illustrates the meaning of resilience by studying the performance of three systems before and after a disruptive event. As the figure illustrates, System 1 returned to its original performance level after a drop in performance, being exposed to a disruptive event such as a temporary power outage in a computer network causing a brief disruption in service. While System 2 could not fully recover without being affected by the disruptive event, the new level of performance with which it started functioning was less than the original one. An example of a disruptive event for System 2 could be a cyberattack that compromises the security of its data, leading to ongoing issues and reduced functionality even after the initial attack has been mitigated. As for System 3, the system started to collapse gradually after being exposed to the disruptive event. A potential disruptive event for System 3 might occur as a natural disaster, such as a hurricane or earthquake, which causes significant damage to essential infrastructure. This damage would result in a sustained deterioration in functionality, ultimately leading to the failure of the system. These examples illustrate varying degrees of resilience to disruptive events among the systems analyzed, with some systems capable of complete recovery, others facing persistent difficulties, and still others enduring long-term consequences.

2.3. Methods to Assess and Quantify Resilience

As defined, resilience is the ability of human communities to withstand and recover from the perturbations in their built environment and infrastructure. This definition connects resilience directly to communities and societies rather than the built structures. Due to this relationship, it can be concluded that the impact of the bridge damage can be quantified by the traffic disruption costs and the socioeconomic benefits of its prompt recovery [1]. This means that one way of indicating the amount of resilience a structure has is by studying the effect of the structure’s failure on its surroundings and the benefits of its quick recovery. One of the most commonly used methods to quantify and measure resilience is the labeling system. Similar to the concept of the awarded points rating systems used to quantify sustainability in buildings, new assessment tools have recently begun to be used to quantify and rate the resistance strength of structures. One of the emerging methods is the Certification of the Predisposition of Resistance of Edifices to Disasters (CePRED). This certification evaluates buildings by offering them a “Blue shields” labeling system, where five blue shields indicate a very high resistance against potential disasters and extreme conditions, while one blue shield indicates poor performance when it comes to withstanding those extreme conditions [23].
Another method is the Risk Assessment Method. As mentioned earlier in the previous section, this method tends to quantify the monetary value, measuring the expected cost resulting from a certain process or function of a building or a structure. But when it comes to resilience, this method is used to quantify the damages that would result from the failure of that process or function or even the losses incurred during the recovery period of that process or function. To be more precise, to quantify risk using this method, a function that multiplies the probability of failure occurrence by the resulting consequence of failure, estimated in monetary units, is used [24]. However, due to the growing need to measure and quantify resilience, many other different methods were used to achieve the goal, such as benefit assessment models, cost-to-benefit assessment models, resilience index, decision flow diagrams, performance-based frameworks, etc. [1,22,23].

2.4. Integrating New Technologies in Buildings to Create Intelligent Buildings

Over recent years, the world’s rapid evolution and the corresponding changes in people’s needs have necessitated integrating information technology into the construction sector. In the United States of America, the phrase “intelligent building” was first used at the beginning of the 1980s. An intelligent building is a unit that governs and controls the building services environment by optimizing user comfort, safety, energy consumption, and work efficiency using new computer technologies [25]. According to the European Intelligent Building Group, intelligent buildings are those that maximize the productivity of their occupants by providing a comfortable internal environment with minimal lifetime costs. Similarly, inhabitants of the Intelligent Building Institute of the United States define intelligent buildings as entities that provide a cost-effective and productive environment for their inhabitants by optimizing the four basic elements of a building, which include structure, systems, services, and management [18]. Intelligent buildings are characterized by incorporating emerging innovative advanced technologies into their system components. The technologies are installed within the building subsystem services. The qualities that make the buildings efficient and productive begin to be generated as soon as they start using these technologies. This enables the building to offer high levels of functionality, safety, flexibility, energy, thermal efficiency, and acoustical and visual comfort [18].
Nevertheless, using advanced technologies in buildings is insufficient to make buildings intelligent. There should be a successful integration of these technologies into the building for intelligent buildings. Incorporating technologies such as the Internet of Things (IoT), Building Automation Systems (BAS), Communication Management Systems (CMS), Office Automation (OA), as well as Energy Management Systems (EMS) allows for controlling, supervising, and enhancement of the integration process between the implemented subsystems [18]. This study will follow the Intelligent Building Institute definition of intelligent buildings as those that integrate various building systems to manage resources in a coordinated manner, with the goal of enhancing technical performance, flexibility, and cost savings from the perspectives of building owners and managers [26].
Additionally, sustainability and resilience are essential components of smart buildings, especially concerning their systems. Highlight the significance of wireless monitoring systems for sustainable parameters in intelligent buildings and the necessity for a sustainable assessment model grounded in the “whole life cycle” [27]. This supports the notion that intelligent buildings should be assessed based on the criteria of overall sustainability, encompassing environmental, economic, and social factors [28]. Emphasize the importance of energy conservation, environmental protection, and intelligence in intelligent buildings, as discussed by [29].
Furthermore, due to the rapid increase in the earth’s population, the intensifying urbanization, and the scarcity of land, compacted design approaches need to be implemented, allowing for a wider spread of higher buildings worldwide [23,30]. This emerging trend has evolved rapidly over time, where people not only focus on reaching new heights but also seek to provide comfortable spaces, energy-efficient systems, environmentally friendly structures, and iconic landmarks that resemble more than just places to live and work [31,32]. In an attempt to attain these aspirations, various advanced technologies were integrated into buildings, leading to the emergence of the intelligent building concept. Intelligence building has become a crucial part of sustainable development. It has brought both positive and negative understanding of how buildings affect our environment. To meet sustainability requirements, it is necessary to apply fundamental practices and principles, such as construction and building techniques and customizing products and buildings. The benefits can be realized by measuring the employee’s productivity level and the amount of savings in expenses [33]. Additionally, intelligent buildings are significant in controlling and monitoring techniques and methods in modern buildings. They help preserve smart systems and detect future failures [18]. There are many other examples that integrate advanced technologies into buildings to fulfill sustainability requirements, such as the Okhta Tower in Russia, the World Trade Center Towers in Bahrain, the Lighthouse Tower in Dubai, and many others.

2.5. Coupling Sustainability and Resilience

The terms “sustainability” and “resilience” appear to dominate many research trends in different fields, including civil infrastructure, buildings, urban drainage systems, landscape, and urban planning. However, few studies examine both terms using the same methodology or approach, particularly in intelligent buildings [30]. Hence, since this study will focus on quantifying and integrating sustainability and resilience in smart buildings, similar studies have been reviewed. A similar study by [24], “Coupling and measuring resilience and sustainability in facilities management,” studied the effects of buildings’ cooling systems failing during heat waves. The study used a risk assessment model to measure and combine resilience and sustainability. This model used two variables to quantify lost system functionality: cost and probability. For sustainability losses, environmental, social, and economic elements were measured independently. The amount of money measured the resilience of a building lost due to decreased staff productivity whenever the cooling systems failed, beginning when the heat wave reached the building and continuing until the full performance was restored. The monetary value of the total quantified losses was then calculated by adding the quantified losses in terms of sustainability and resilience [24]. A similar study, “Cost-benefit evaluation for building intelligent systems with special consideration on intangible benefits and energy consumption”, aimed to evaluate the costs and benefits of the intelligent systems and then perform a sensitivity analysis to assess the durability of the building’s systems and decide whether these systems are worth investing in or not. However, this study did not mention anything explicit about sustainability or resilience, and the sensitivity analysis was based on a rough hypothetical assumption of an increased level of energy consumption. The evaluation method proposed in that study could be used to quantify and couple sustainability and resilience.
The study suggests that an evaluation method is required to quantify and couple sustainability and resilience [18]. This indicates that, during the calculation process, the research prioritizes the intelligent building’s intangible and tangible benefits and costs and uses them to determine the NPV. The tangible components used in the calculation include savings on the future value cost of energy, the cost of fire insurance, labor, and the additional cost of maintaining the smart system [24]. The calculation of the intangible components consisted of the expected future value of the intelligent building’s benefits. The intangible components were then measured using the Analytical Hierarchy Process (AHP) to derive the value of the intangible benefits, which included reduced service time, increased rates on rentals, and increased efficiency of the employees [6].
Integrating “sustainability” and “resilience” into intelligent buildings has many benefits. Real validation was needed to establish this integration’s benefits. Intelligent buildings with sustainability and resilience are convenient, efficient, and comfortable. What happens when a defect arises? How might this affect stakeholders? What would failure cost? Is it worth investing in a smart, sustainable building? All of these questions must be answered to determine if the benefits of this integration outweigh the drawbacks. Table 1 summarizes various research studies investigating how smart technologies, sustainability, and resilience influence project costs. In this study, the study’s outcome has concluded that the application of a smart system increases the profitability of the building, hence generating a high NPV. In case some faults emerge before detection, NPV exhibits a steep drop. This study demonstrates that the implementation of smart technology creates sustainable structures and buildings with increased profitability, while the incorporation of resilience within the building not only reduces potential failure-related losses but also enhances their financial performance.
Based on the studies found in Table 1, it can be concluded that most smart buildings are designed to be sustainable. In other words, integrating smart technologies into any building is usually aimed at making the building more convenient, highly efficient, comfortable, and even environmentally friendly. However, only a few studies addressed all four concepts concurrently; two are listed in the table below. One of them consists of studies on smart, resilient systems and the financial savings that would result from such integration [44], while the other one suggests a cost–benefit evaluation method for integrating smart systems into buildings, using LCA and NPV to determine if investing in those systems is worth it. In addition, a sensitivity analysis was integrated into this study to check the effects of the increased energy consumption, which indicates the failure of the intelligent building systems on the NPV [6]. In addition, a sensitivity analysis was integrated into this study to check the effects of the increased energy consumption, which indicates the failure of the intelligent building systems on the NPV [6].

2.5.1. Environmental Attributes

As mentioned in the literature review, sustainable approaches have been used widely in many intelligent buildings, from providing natural ventilation to natural lighting. Utilizing these approaches seems to help reduce the building’s total energy consumption. Studies have revealed that HVAC, lighting, and security systems account for almost half of the building’s total energy consumption [45]. Table 2 summarizes the most common attributes used to measure the environmental component.

2.5.2. Social Attributes

Many attributes could be considered when it comes to quantifying the social costs of a structure or a system. Such social attributes include the functionality and usability of the created space that utilizes that system, the indoor environment quality and comfort, reputation (measured by the number of people coming to rent spaces in the building, whether it is a residential or an office building), rate of productivity of people working in the space (in case it is an office building), quality of services, profits coming from the exclusive rental rate, and market position. Nevertheless, almost all of the abovementioned attributes are difficult to measure. Therefore, the Relative Importance Index (RII) method was used to make that quantification more tangible. As for the first step to initiate the quantification process, some of the most used indices to quantify the social component are shown below. A summary of each index and the list of references can be found in Table 3.

2.5.3. Economic Attributes

The economic cost is likely the easiest to quantify since it is already expressed in monetary terms. Compared to the social and environmental attributes of sustainability, many attributes could be used to quantify the economic dimension: for example, the lifetime value of the structure, adaptability, and flexibility of the system, property performance assessment, maintenance, fire insurance, and the number of workers [2,6,52]. Nevertheless, not all of the abovementioned attributes can be measured or related to this study. Therefore, Table 4 summarizes the most common attributes used to measure the economic component.
In conclusion, there has been considerable reconsideration of the design and construction methodologies to incorporate intelligent technology into new buildings. Moreover, several strategies have been proposed to include resilience in smart buildings, leading to the development of exceptionally robust structures. However, it is worth noting that only a limited number of these implementations focus on integrating both sustainability and resilience in smart buildings simultaneously. This implies that certain buildings may incorporate novel and sophisticated technologies to achieve sustainability objectives and transform into environmentally conscious structures. Nevertheless, integrating these two principles into smart buildings has been subject to little research. Hence, the objective of this study is to integrate the principles of sustainability and resilience into smart buildings by utilizing a cost–benefit evaluation approach. The study intends to construct a comprehensive financial model that uses Net Present Value (NPV) as the primary metric for assessing the quantifiable aspects of sustainability and resilience. This model will be utilized to evaluate the significance of integrating these two factors.

3. Materials and Methods

The following section will be about applying the previously discussed literature, coupling resilience and sustainability, and quantifying them with reference to some of the world’s modern intelligent buildings. The methodology will be further discussed, and the steps of the suggested model will be elaborated.

3.1. Data Collection

The study used four buildings to acquire data and achieve its objectives. The four buildings included two residential buildings, one office building, and one labor camp. Using the four buildings as case studies, the first part of the analysis was to quantify sustainability. The analysis was categorized into three main components: Environment, Social, and Economic. In order to quantify sustainability, its three components had to be quantified. For the environmental component, the reduced energy expenditure and the government environmental incentives were used to perform the calculations. For the economic component, the workers’ cost savings, fire insurance cost savings, and additional system maintenance costs were used to perform the calculations. The social component of sustainability measured productivity, indoor environment quality, reputation, extra profit, services, and safety. However, in order to be able to quantify the social components, a survey was conducted, and the RII method was used. The survey was sent to 15 people, including project managers, architects, engineers, and scholars familiar with the use of intelligent systems in buildings. Only 10 out of the 15 managed to participate in the survey. The responses were used to rank the six social attributes, weigh them, and eventually obtain the social benefit coefficient. Then, the social component was calculated by multiplying the social benefit coefficient by the rental profit of the building. Using the results of the three components, the net annual savings were calculated and then used alongside the smart system’s capital investment to obtain the NPV.
As for the resilience part of the analysis, resilience was quantified and coupled with sustainability by measuring the effect of faults on the calculated NPV and observing how much the NPV would drop when faults occur in these buildings. To do that, the following information should be available: the number of faults occurring annually in a smart system, the losses incurred from these faults, the cost of fixing these faults, and how long it would take to fix them. Therefore, to demonstrate an example of what the ideal model calculations could look like, some literature review articles and studies were used to obtain a rough estimation for these numbers. The retrieved data included: the number of faults occurring yearly in smart buildings, the cost of these faults, and the initial cost of having fault detection and diagnosis tools. However, using this information will not give accurate results as it is not dependent on the number of floors in the building, assumes a fixed number of faults, and considers a fixed cost from within the range of costs. Therefore, a better approach to obtain an estimation for the fault cost was using a percentage that tied up to the total energy consumption of the building. This means that each of the four buildings (case studies) had a different fault cost based on the energy expenditure of the building. Using the PERT (Program Evaluation and Review Technique) model, three scenarios were assumed: pessimistic, optimistic, and most likely. Those scenarios were used to test the effects of different fault costs (low, average, and high) on the NPV, exploring the financial effects of integrating resilience tools within the smart systems of sustainable buildings.

3.2. Model Formulation

As previously stated, utilizing smart systems in buildings makes them sustainable, which leads to the first integration or combination addressed in this study.
Smart systems + Building = Sustainability = Environmental + Social + Economic
The following equations were used to perform such calculations:
N P V = A n e t ( 1 + i ) N 1 i ( 1 + i ) N C 0
A n e t = A i + A e + A w + A f A m + A s
In Equation (1), A n e t is the net annual savings that could be obtained by installing a smart system in a building, and C 0 is the initial cost of the smart system installation. N is the number of years (time horizon) used in the analysis; a 10-year study period was used in this study [6,61,62]. Whereas i is the discount rate in the UAE, which is 2.25% [63]. Equation (2) consists of three parts which are the three aspects of sustainability. The environmental aspect was quantified by A i , which represents some possible government incentives, and A e , which represents the cost saving from optimizing energy levels. The economic aspect was quantified by A w , which represents the cost saving that results from reducing the number of workers, A f representing the cost saving that results from not having fire insurance, and A m , which was an added cost that represents the maintenance cost of the smart system. As for the social aspect, it was quantified by A s , which represents the cost saving due to some intangible benefits. As for the social calculations and the resilience part, further data had to be collected. Therefore, the following two sections will be dedicated to explaining the processes used to attain the data on both the social component of sustainability and resilience part.

3.3. Survey Development

After identifying the used indices to quantify the social component of sustainability, a survey was conducted to obtain two values. The first value was the evaluating scores ( E ) of the indices, while the second was the weights of those indices ( W ) . To find the proportion ( δ ) of the total profit ( P ) that represents the social benefits ( A s ) , Equations (3) and (4) were used [6]:
δ = W E .
A s = δ P
To put it more simply, the social benefit coefficient ( δ ) was obtained by multiplying the weights of the selected criteria by the evaluating scores. The social benefit coefficient represents the percentage or proportion of the profit or rental income attained by the social aspect of sustainability (social benefits). Therefore, in Equation (4), the coefficient ( δ ) is multiplied by the total profit ( P ) . The survey was sent to 15 people who were familiar with the topic, including project managers, architects, engineers, and academics. However, only ten of the fifteen respondents completed the survey. The two following sections contain further explanations of the structure and design of the survey.

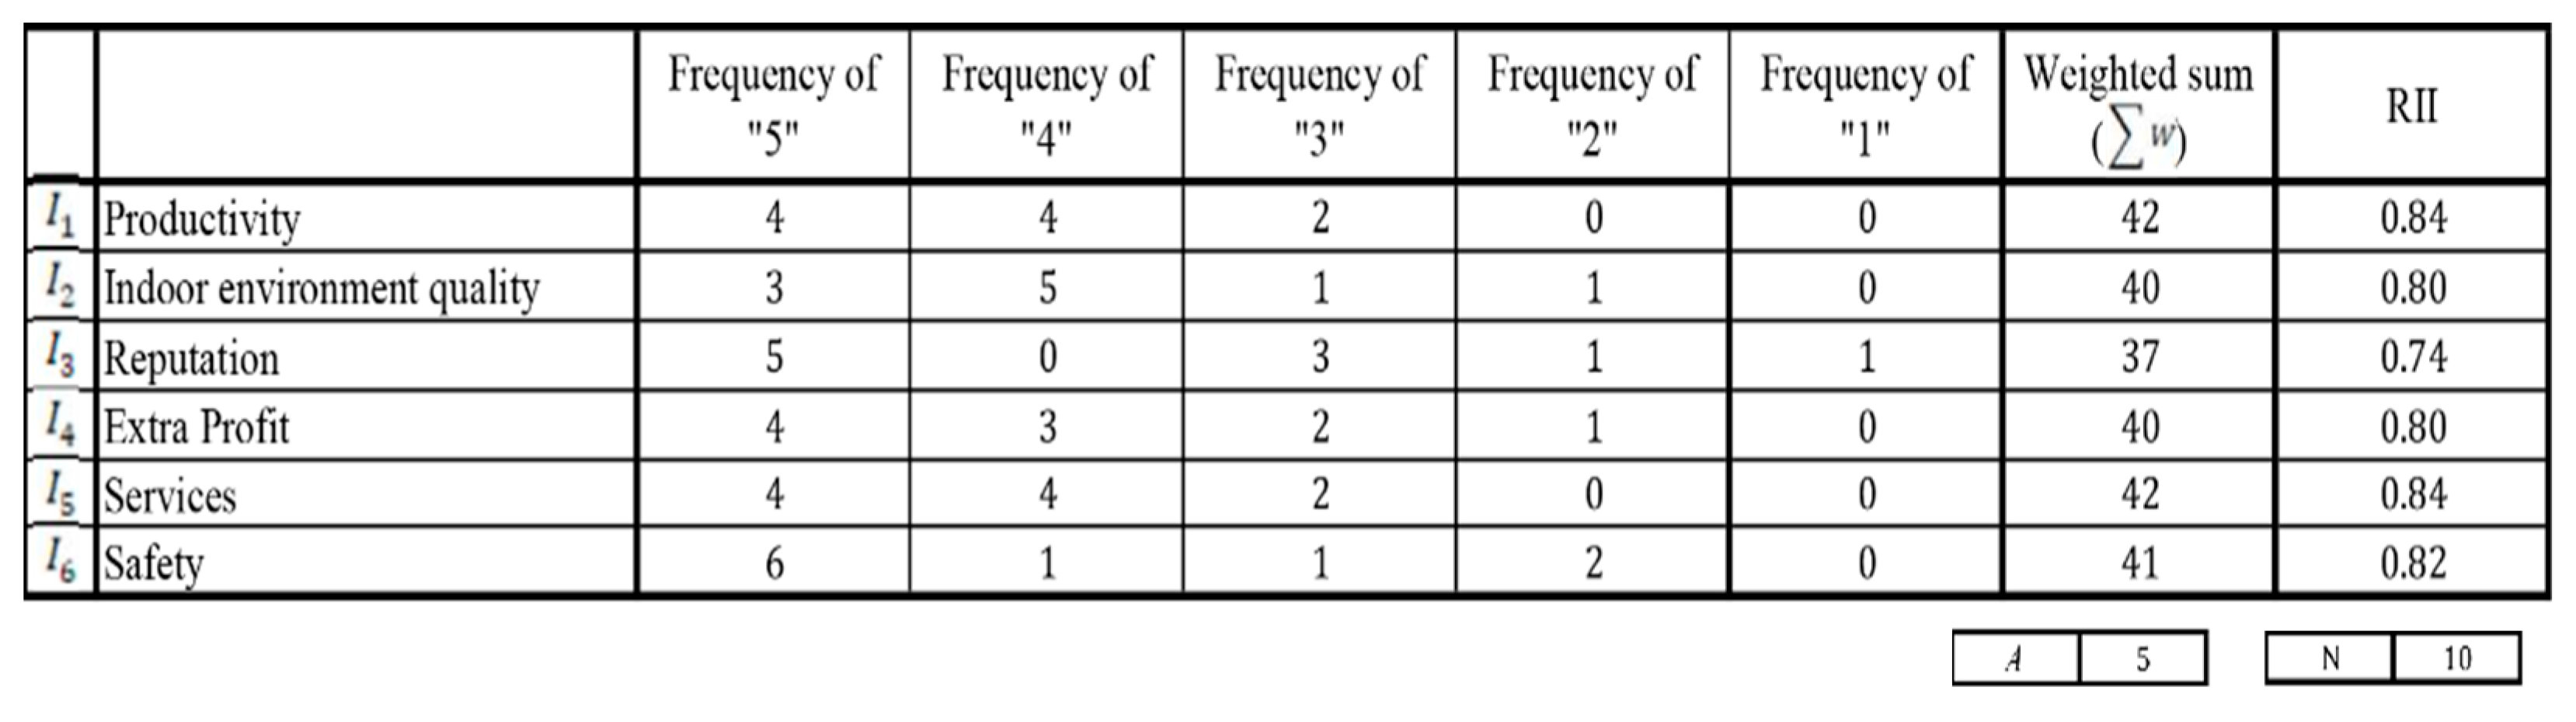
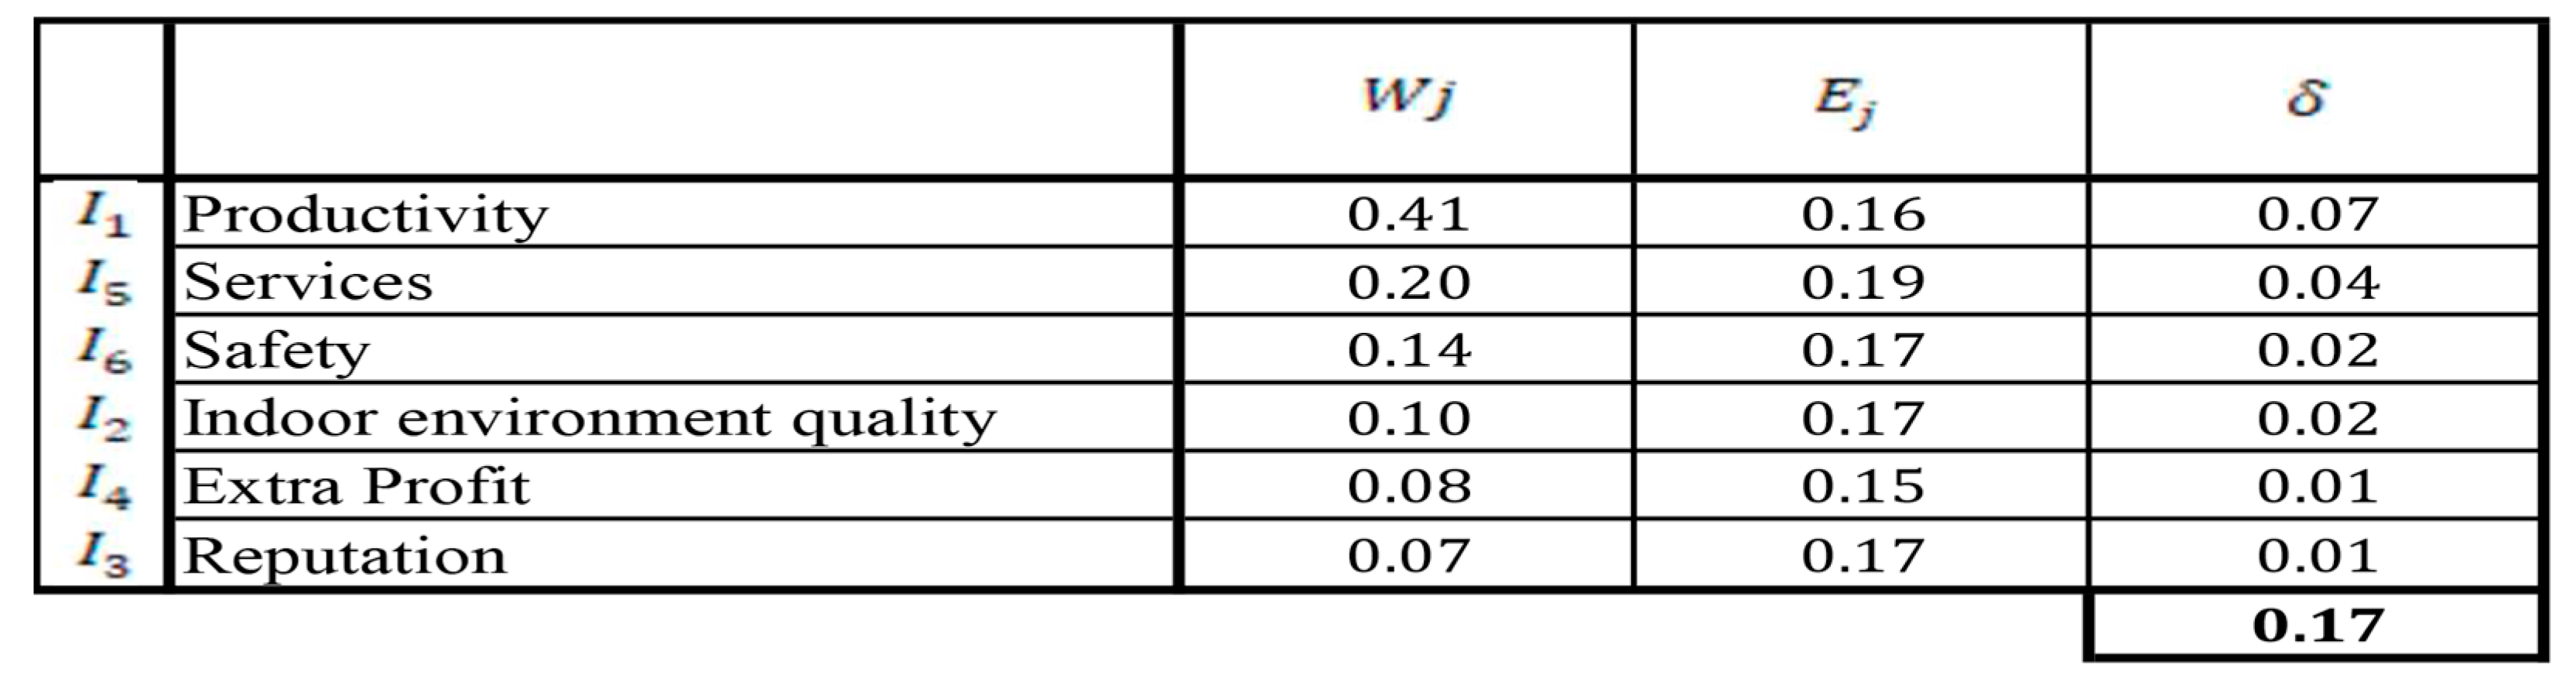
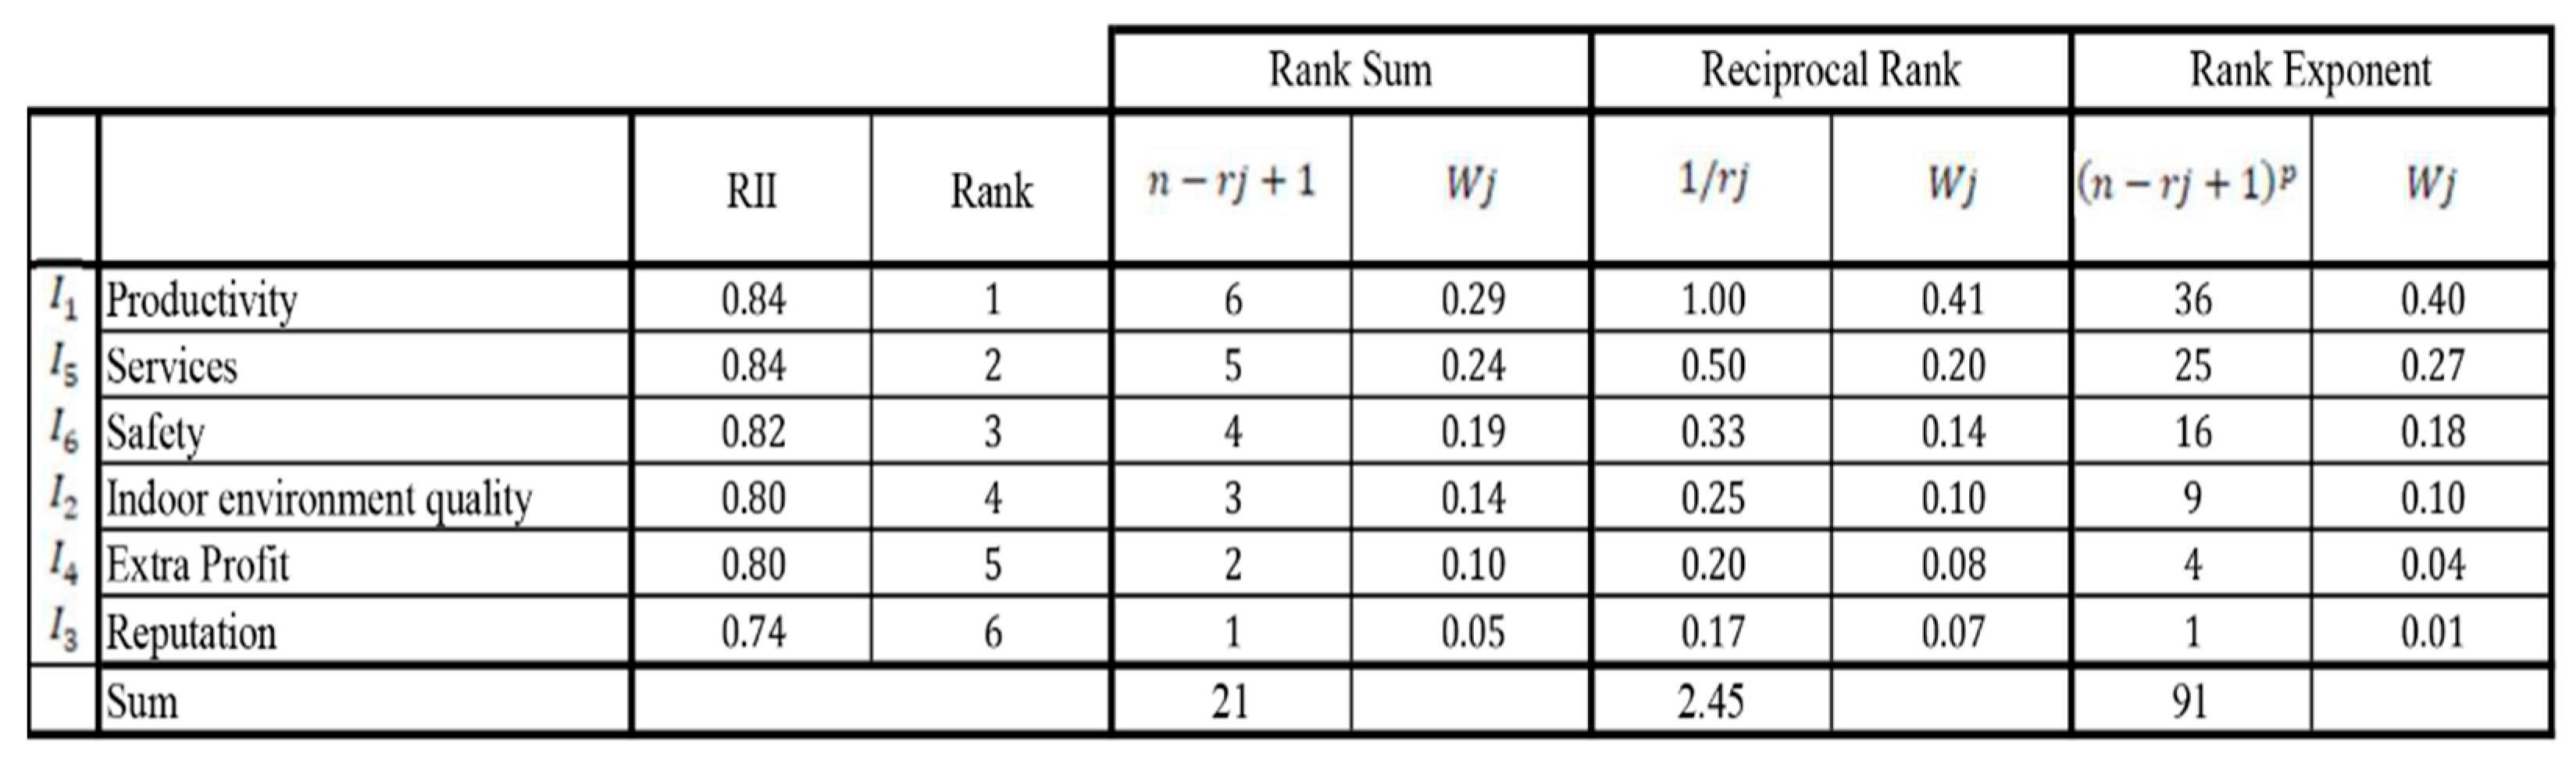
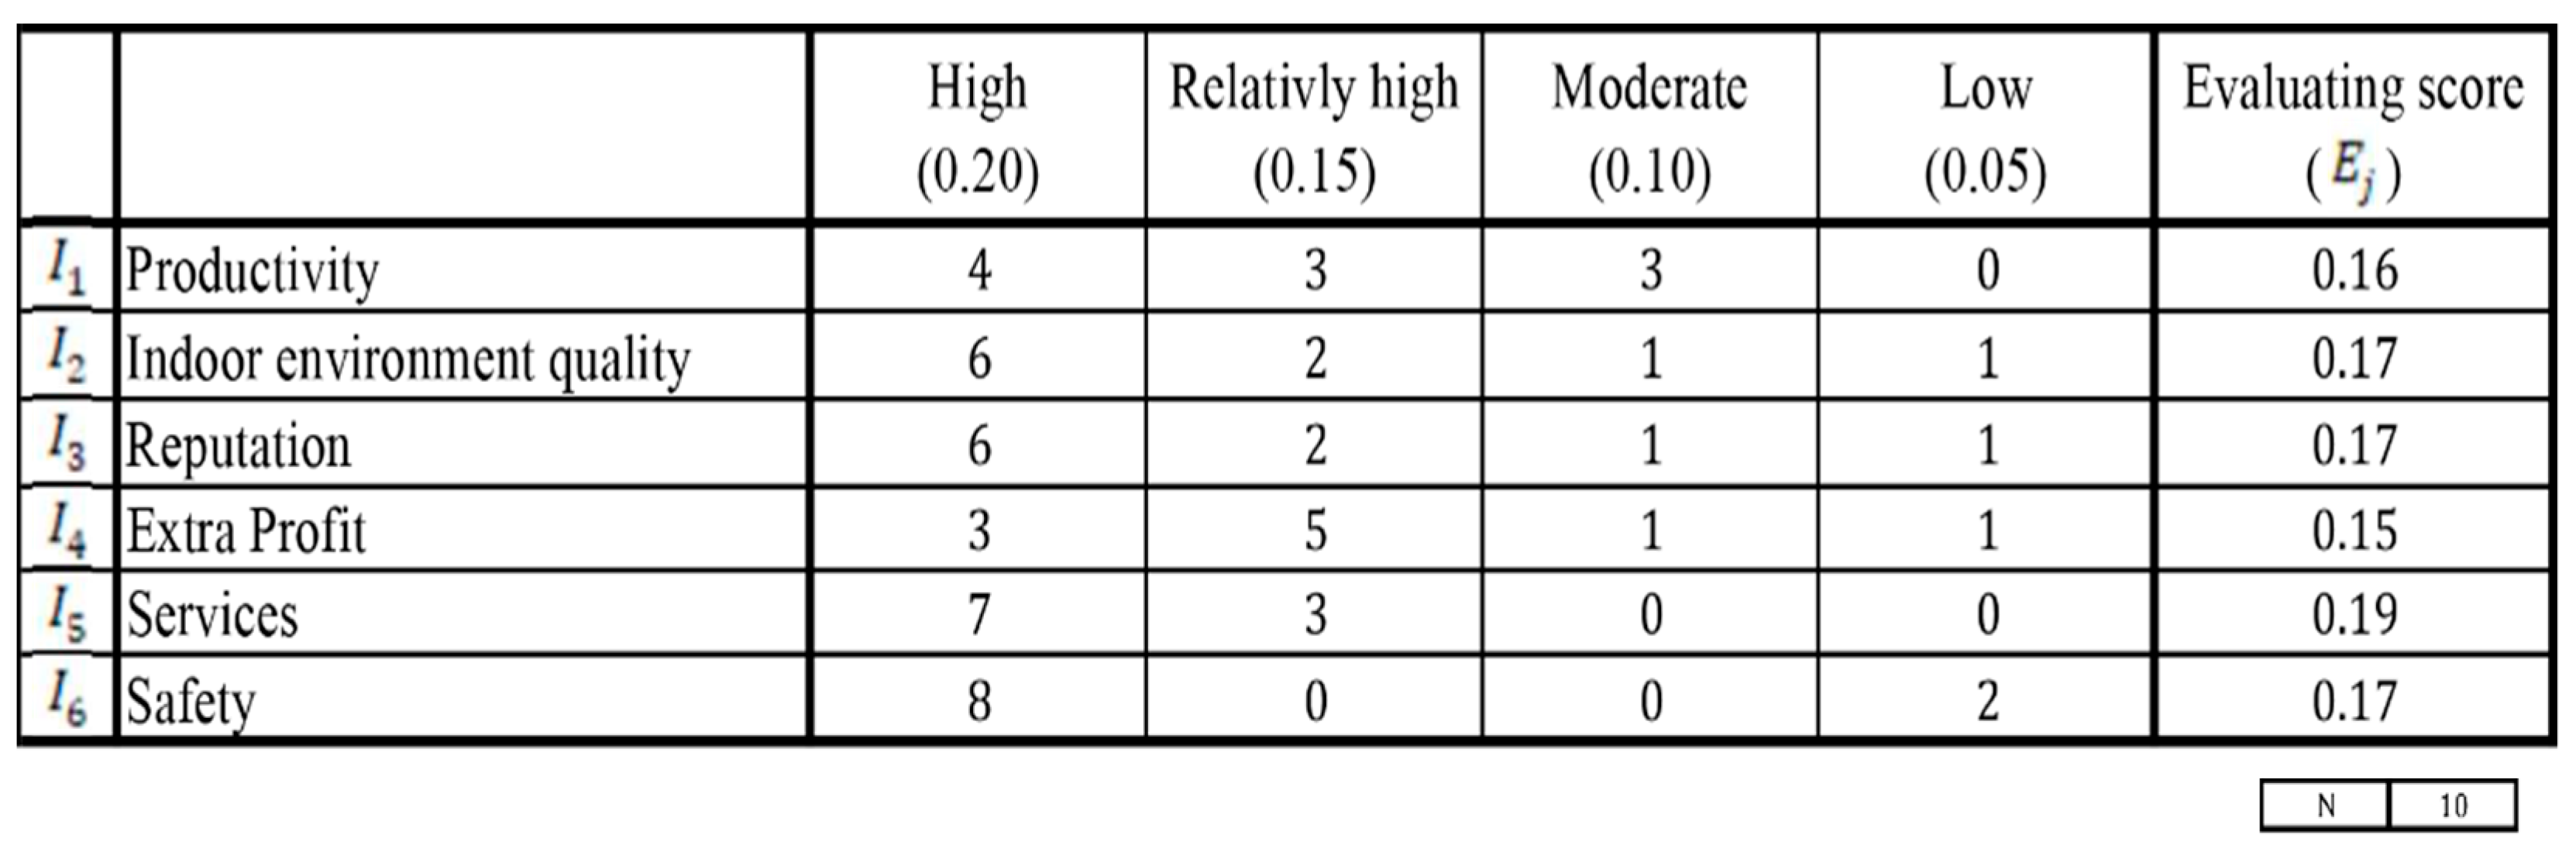
3.4. Indices Quantification and Weights

In this study section, respondents were asked two questions about each index. The first was whether they agreed that the chosen index was appropriate for the study, and the second was how much they thought having smart systems would improve that index compared to not having smart systems. Using improved indoor environment quality as an example, the respondents were asked if “installing smart systems in buildings would improve the indoor environment quality and make users more comfortable practicing their daily activities”. The simple explanatory example was automatic lighting/temperature adjustment. The respondents were given three options to choose from “Yes, No, and Irrelevant” [6]. The respondents who answered “Yes” to the first question would then be asked, “To what extent do you think having smart systems would improve the indoor environment quality compared to not having smart systems?” and given four options to choose from: “High, relatively high, Moderate, and Low” [6]. Thus, after using the results of the survey, each index shall have an evaluating value E j   ( j = 1 , 2 , 3 , 4 , 5 , 6 ) , which eventually forms the evaluating vector E = [ E 1 ,   E 2 ,   E 3 ,   E 4 ,   E 5 ,   E 6 ] used in Equation (3). The assigned scoring system used in this part of the study was 20% for High, 15% for Relatively High, 10% for Moderate, and 5% for Low [6].
The answers to the third question about each index are used to calculate the indices’ weights, where respondents were asked, “In your opinion, how important do you think this index (For example, indoor environment quality) is to quantify the social benefits of sustainability?”, then given five answers to choose from: “Extremely important, very important, somewhat important, not so important, and Not important at all” [6]. Using the respondents’ answers and the RII to weight and rank the indices, a 1 to 5 rating system was used to weight and rank the indices based on the responses of the respondents and the RII. In other words, each of the previously mentioned answers was assigned a weight, where 5 represents the weight of the “Extremely important” answer, and 1 represents the weight of the “Not at all important” answer” (Table 5). Those weights were then multiplied by the number of people who chose each answer, as shown in Equations (5) and (6) [64], where W is the summation of each weight multiplied by the number of answers (frequency) for each index n i , where i ranges from 5 to 1.
Table 5. Summary RII to weight and rank the indices.
Extremely important5
Very important4
Somewhat important3
Not so important2
Not at all important1
R I I = W A N
W = 5 n 5 + 4 n 4 + 3 n 3 + 2 n 2 + 1 n 1
In this study, A is the highest weight in the used Likert scale, which is 5, and N is the total number of respondents, which is 10. Obtaining the RII for each index indicates its importance compared to the other indices, but it does not reflect the index’s weight. Therefore, to obtain the weights that correspond with the ranks of these indices, three non-pairwise weighting methods were used: rank sum, rank reciprocal, and rank exponential [64].

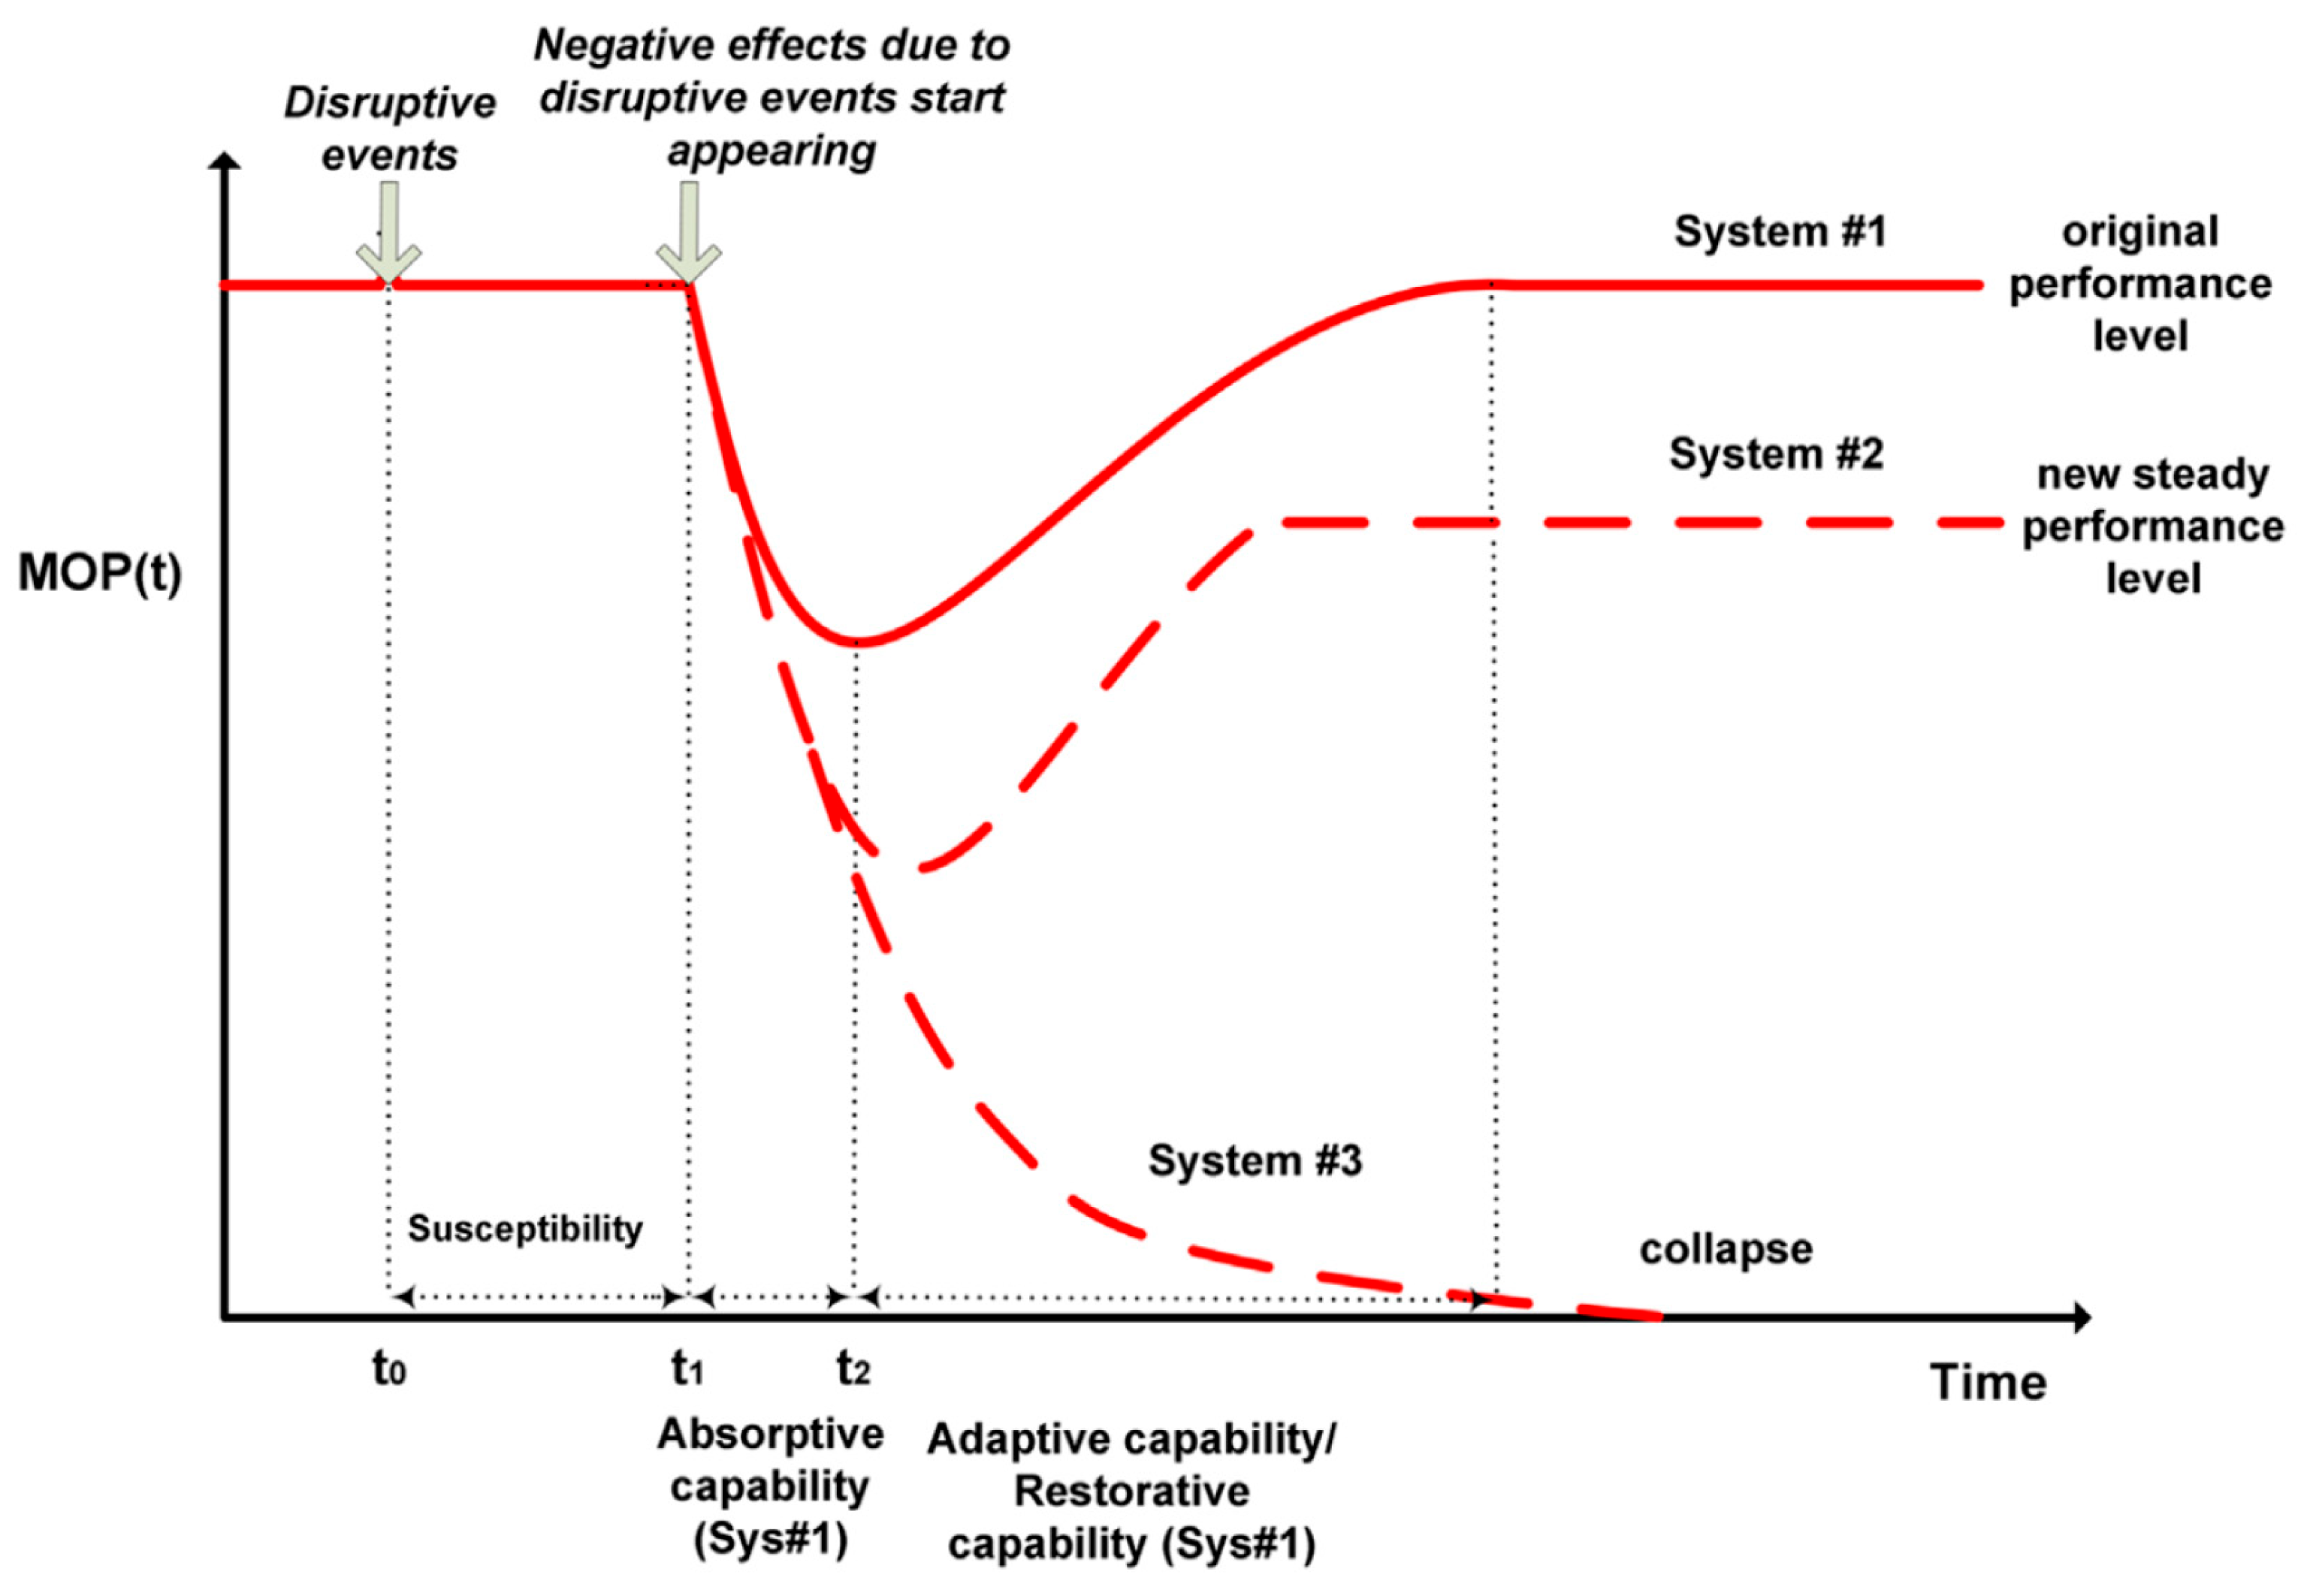
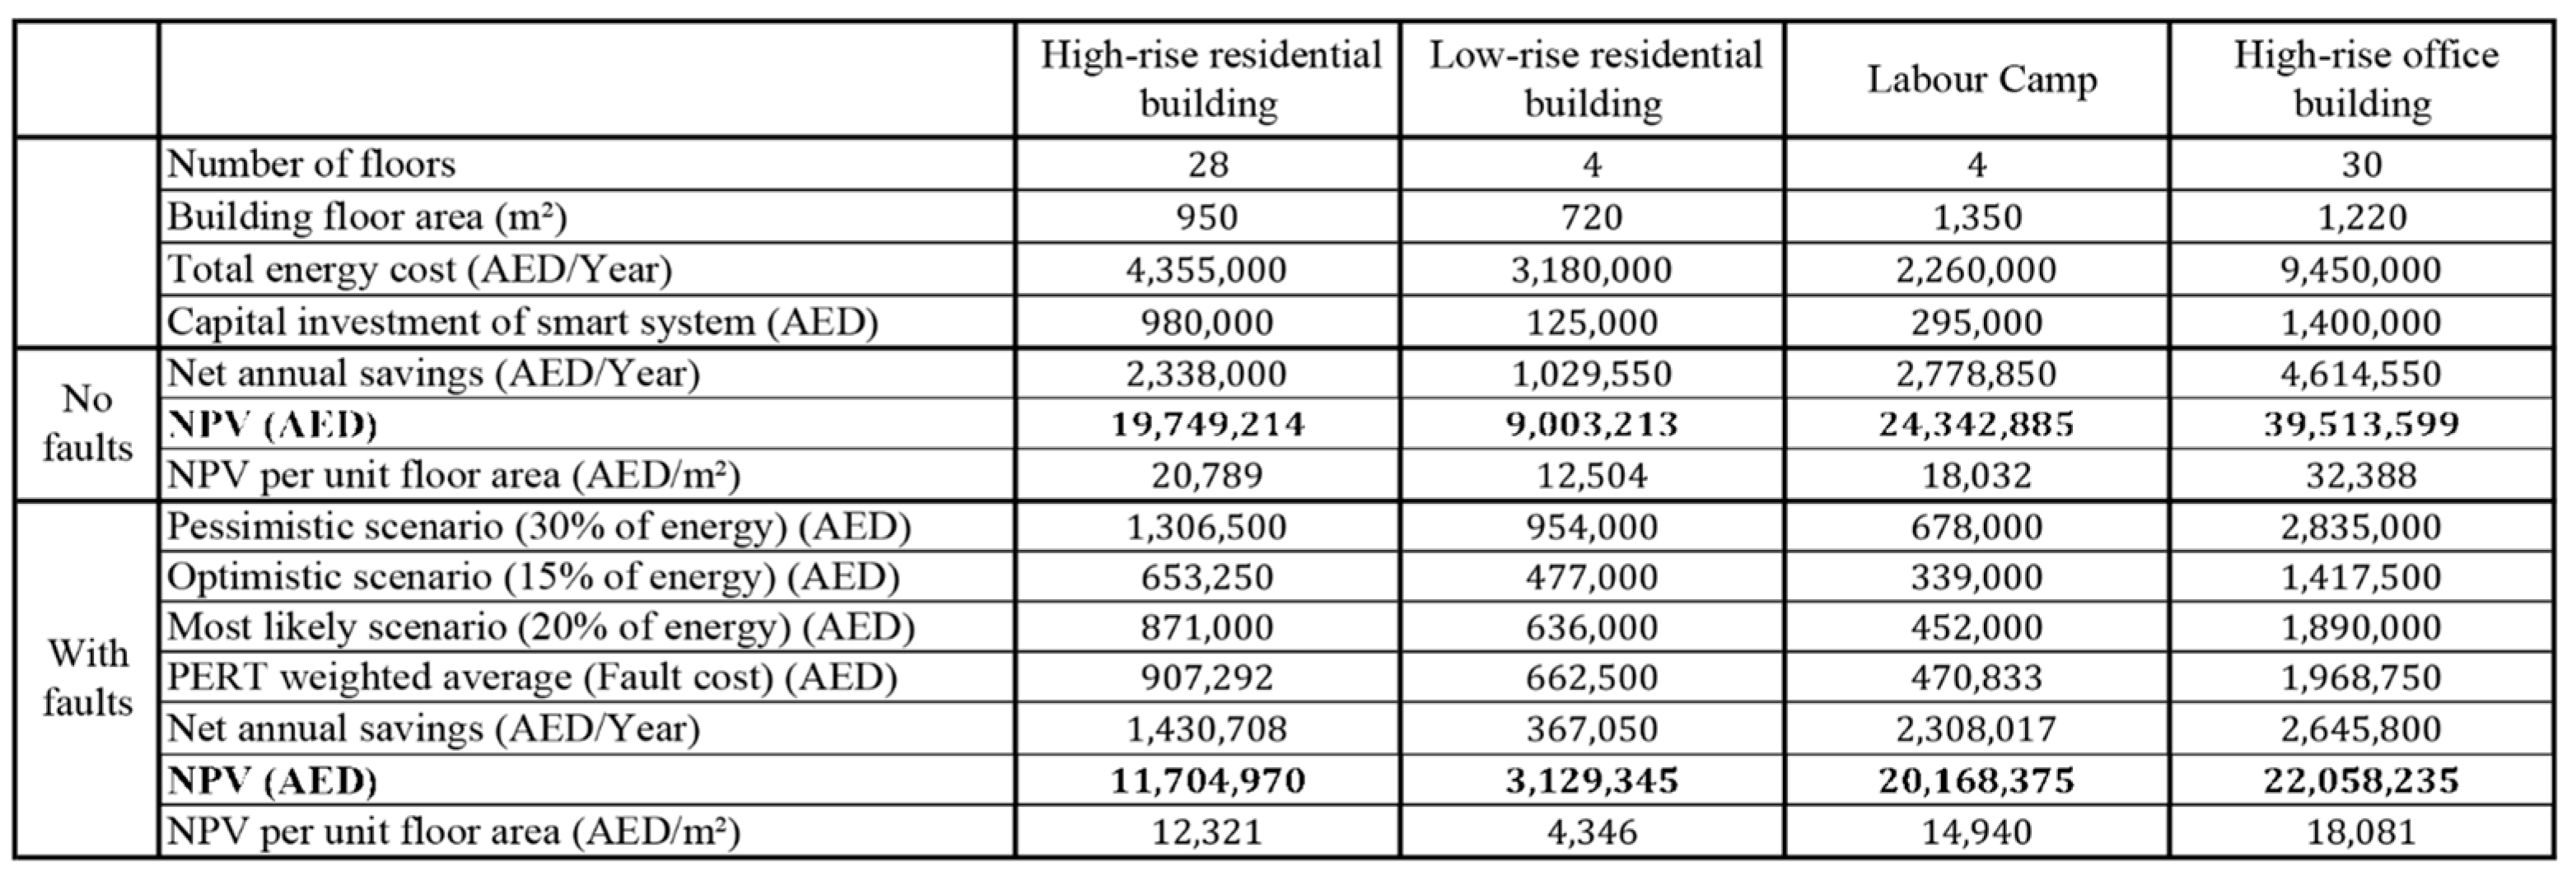
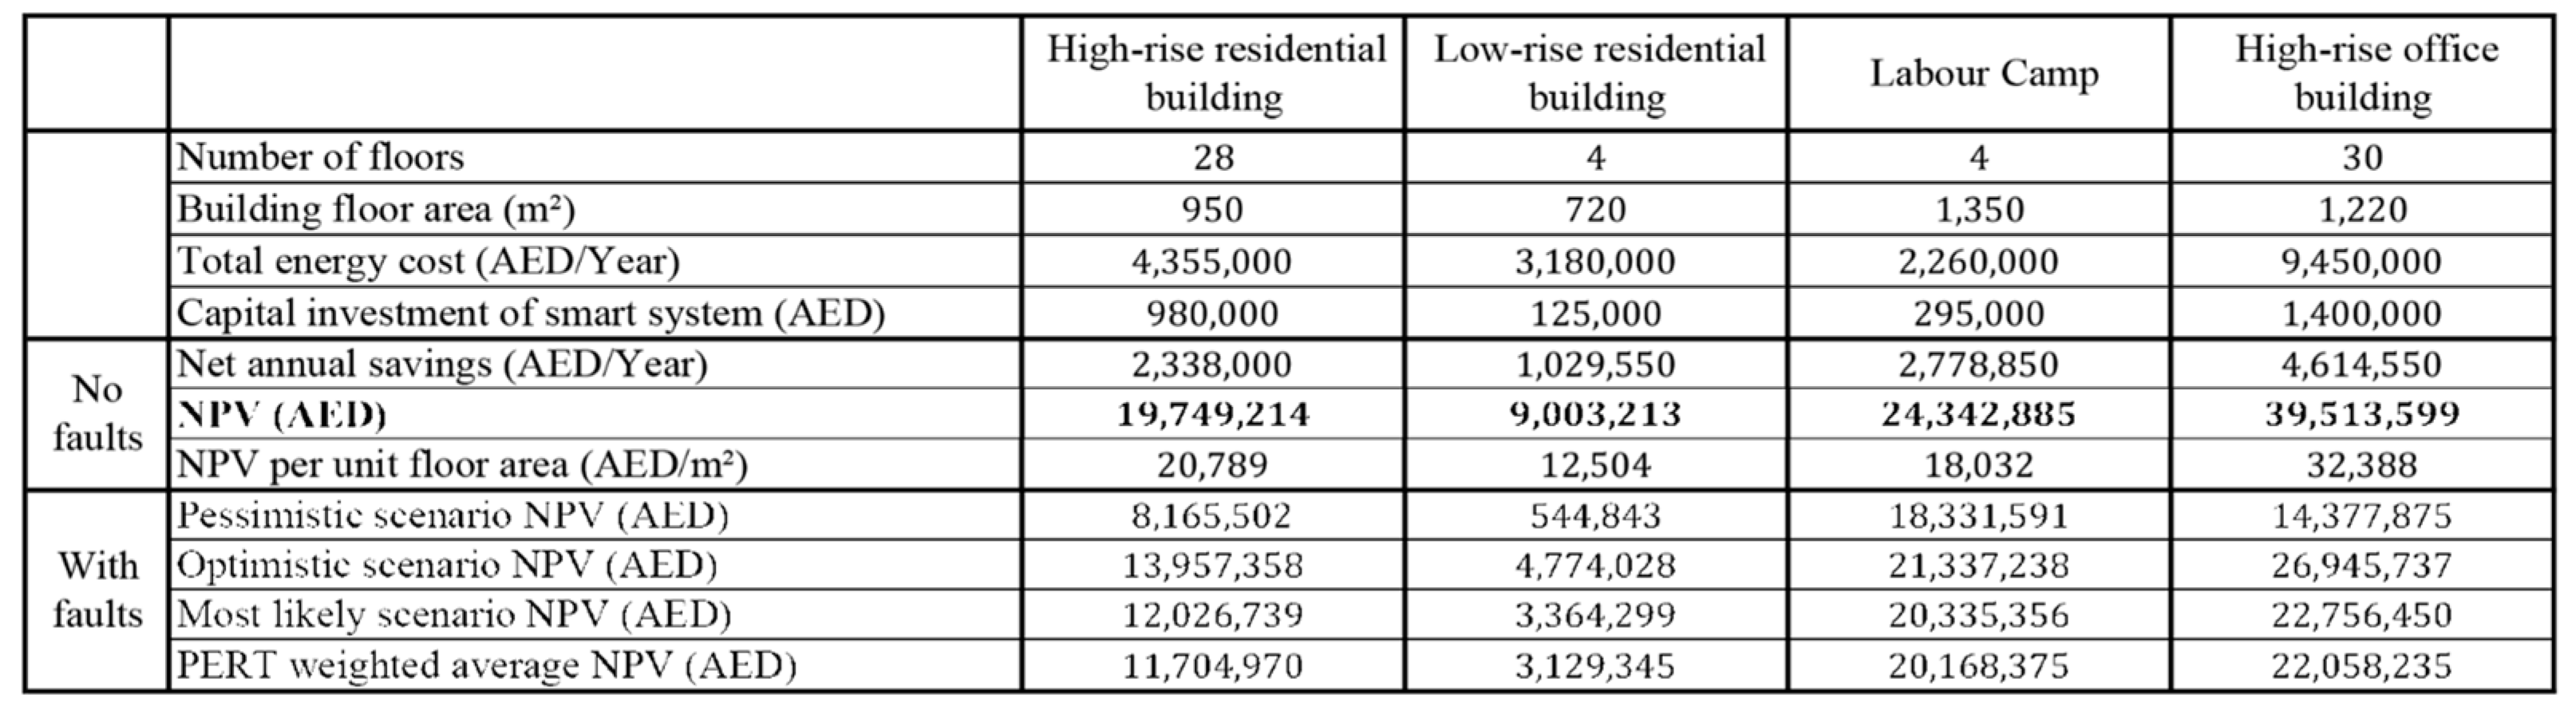
3.5. Assessing the Resilience of Smart Systems in Buildings

In this study, the concept of resilience is paired with smart systems. After defining smart buildings as sustainable buildings, this study aims to assess the resilience of those smart/sustainable systems. This could be accomplished by observing how much the NPV drops when faults occur in these buildings and measuring the effect of having faults on the calculated NPV of the sustainability part. Therefore, to demonstrate an example of what the ideal model calculations could look like, some literature review articles and studies were used to obtain a rough estimation for these numbers. According to a paper on fault detection and diagnostics for smart buildings, faulty and incorrectly configured smart systems equipment, including fault detection ones, wastes a significant amount of energy [41]. Therefore, it is crucial to equip Fault Detection and Diagnosis (FDD) tools in Building Management Systems (BMS), as they contribute to saving around 15–30% of the total energy expenditure of the building [41]. CGnal, a software firm based in Milan, conducted a one-year study on a building in Italy, where sensors were implanted into the different systems of the building, and a machine learning algorithm was used to take the readings for the first half of 2015. In the second half of the year, the installed system began collecting data for abnormalities, which resulted in predicting 76 faults out of a total of 124 real faults. Therefore, using the predicted number of faults throughout the six months, a (76 × 2 ≈ 150) potential faults per year shall be used for this study [65]. Single faults were estimated to cost between $130 and $16,000, which is equivalent to 500 and 59,000 AED [66]. For the sake of simplicity, a single fault shall be assumed to cost 5000 AED a year. However, using this method will not give accurate results as it is not dependent on the number of floors in the building, assumes a fixed number of faults, and considers a fixed cost from within the range of costs found in the literature. According to some studies, degraded and faulty equipment accounts for 15% to 30% of the waste of the building’s energy [67,68,69]. This means that each of the four buildings (case studies) will have a different fault cost based on the energy expenditure of the building. Using the PERT (Program Evaluation and Review Technique) model, three scenarios were considered:
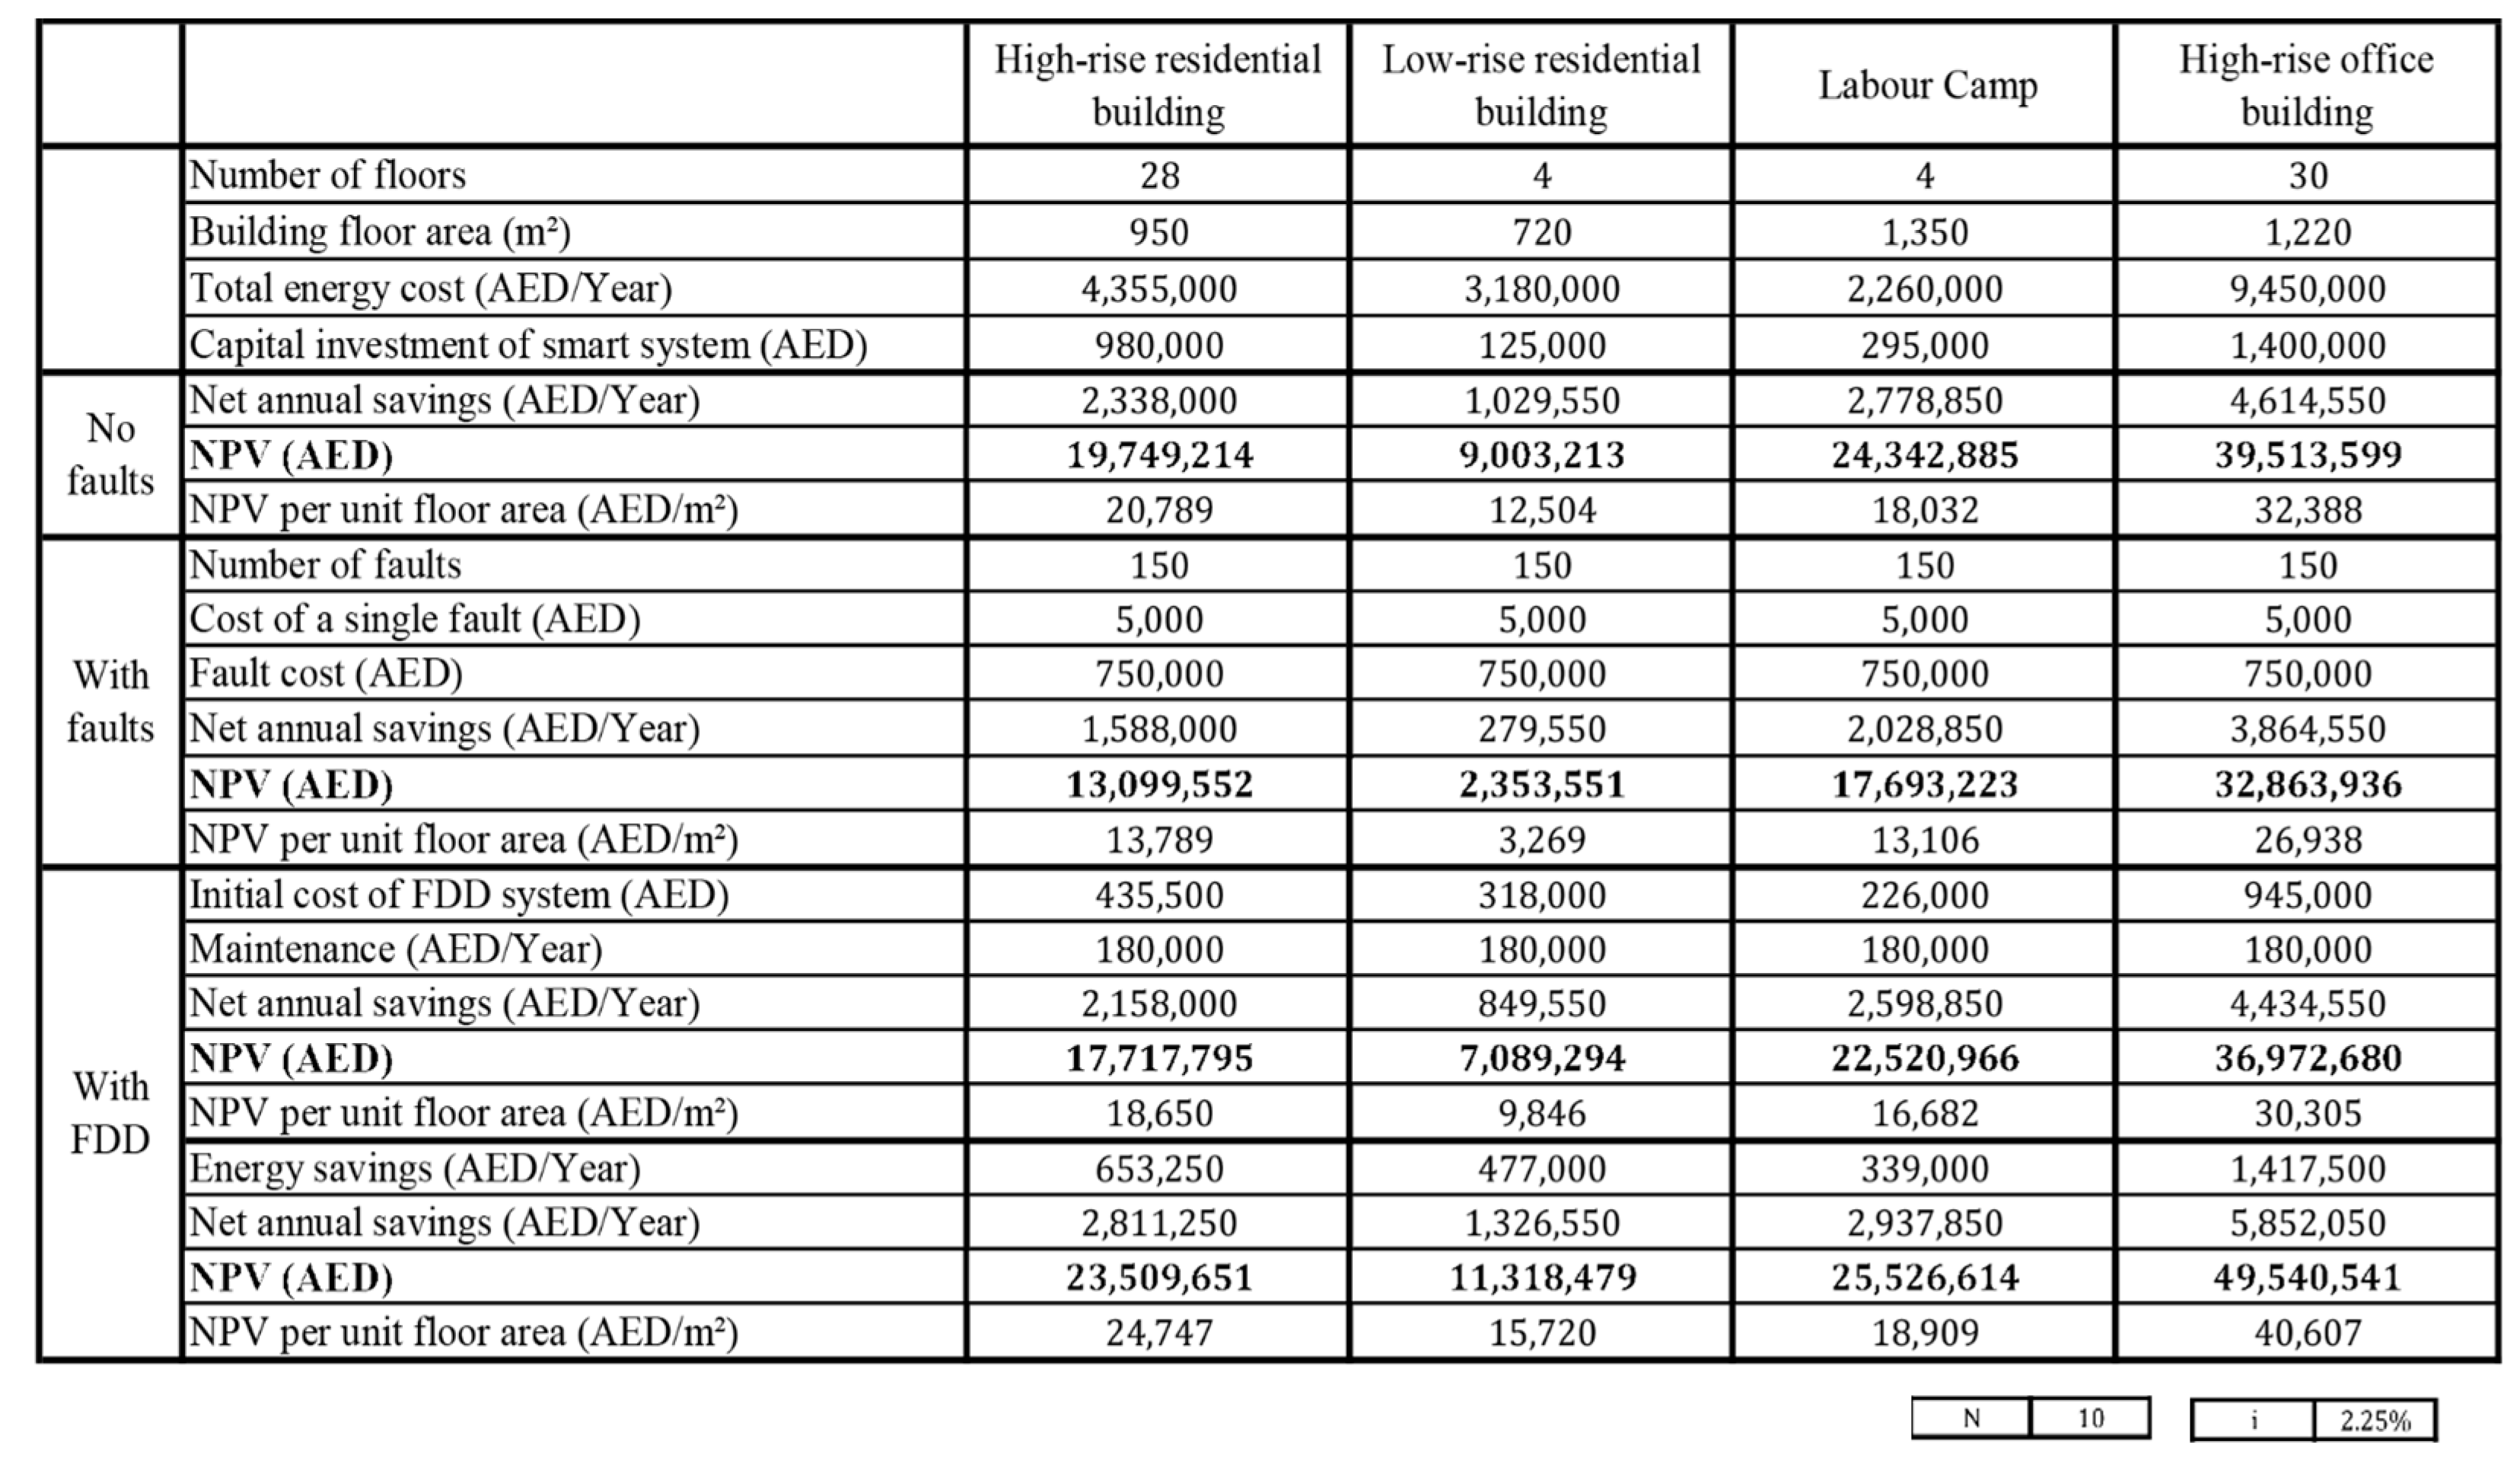
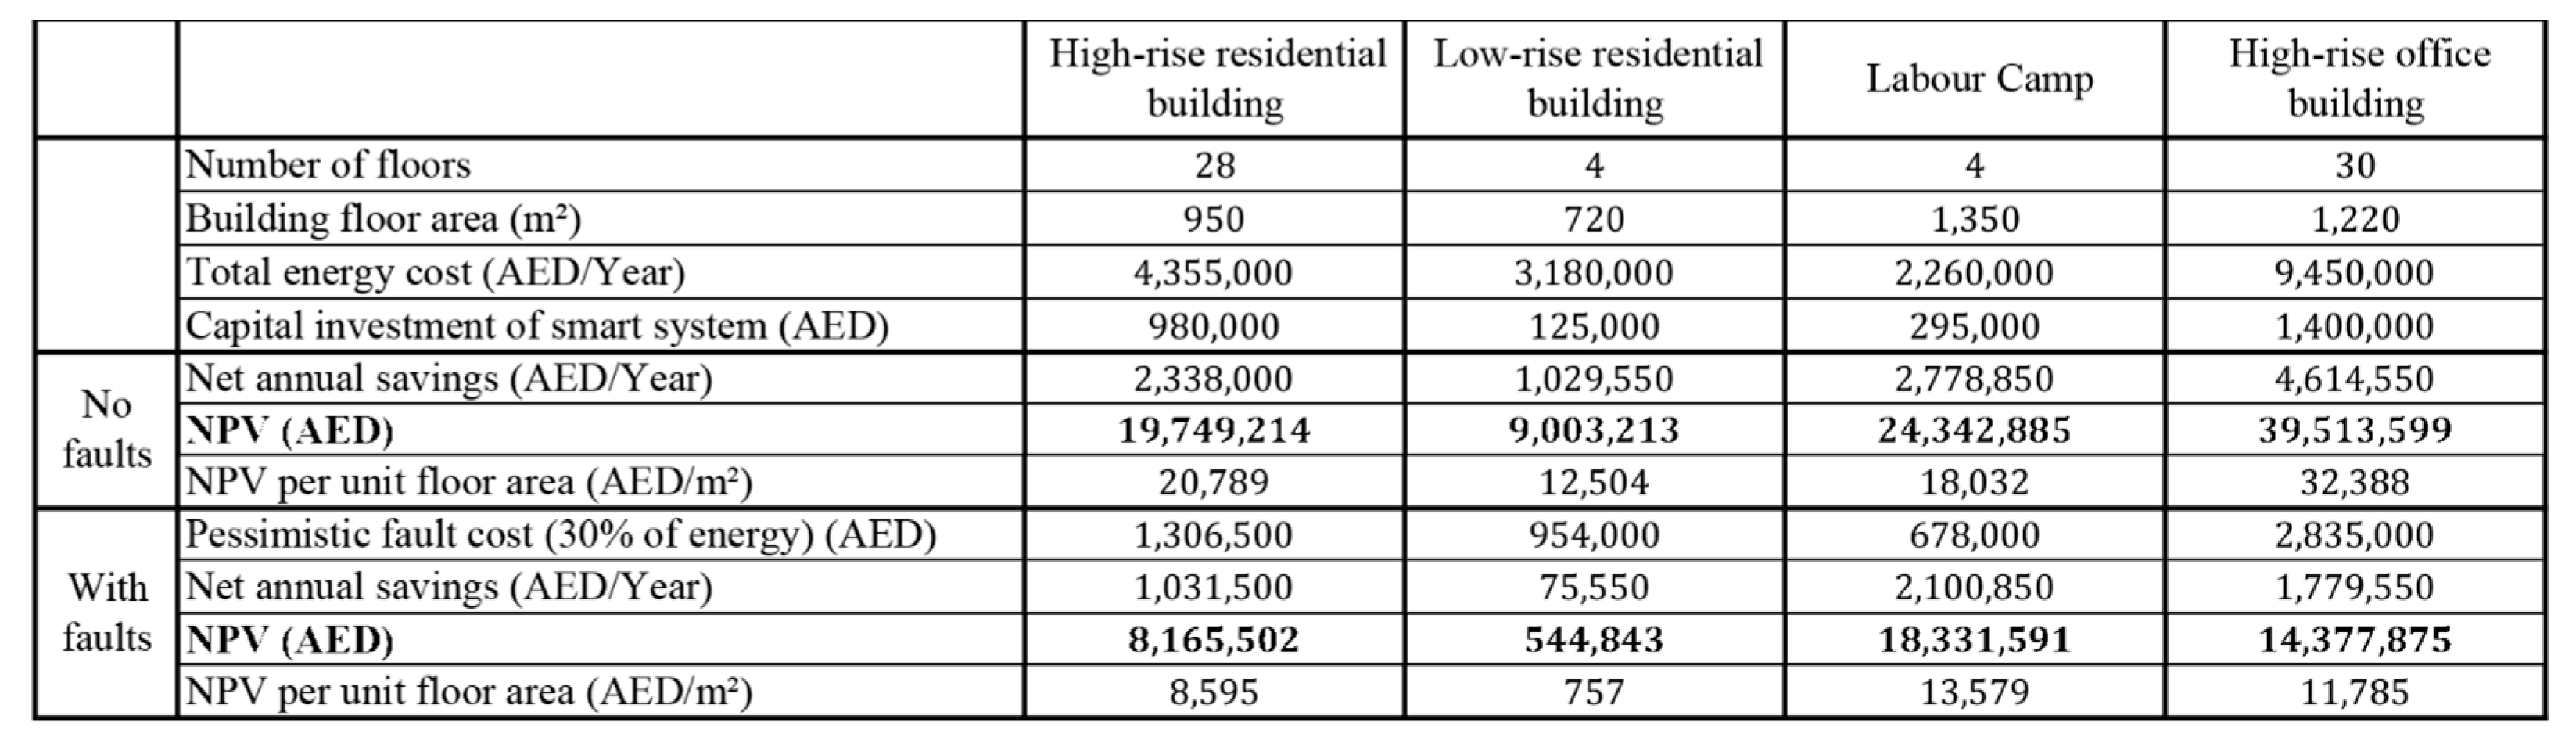
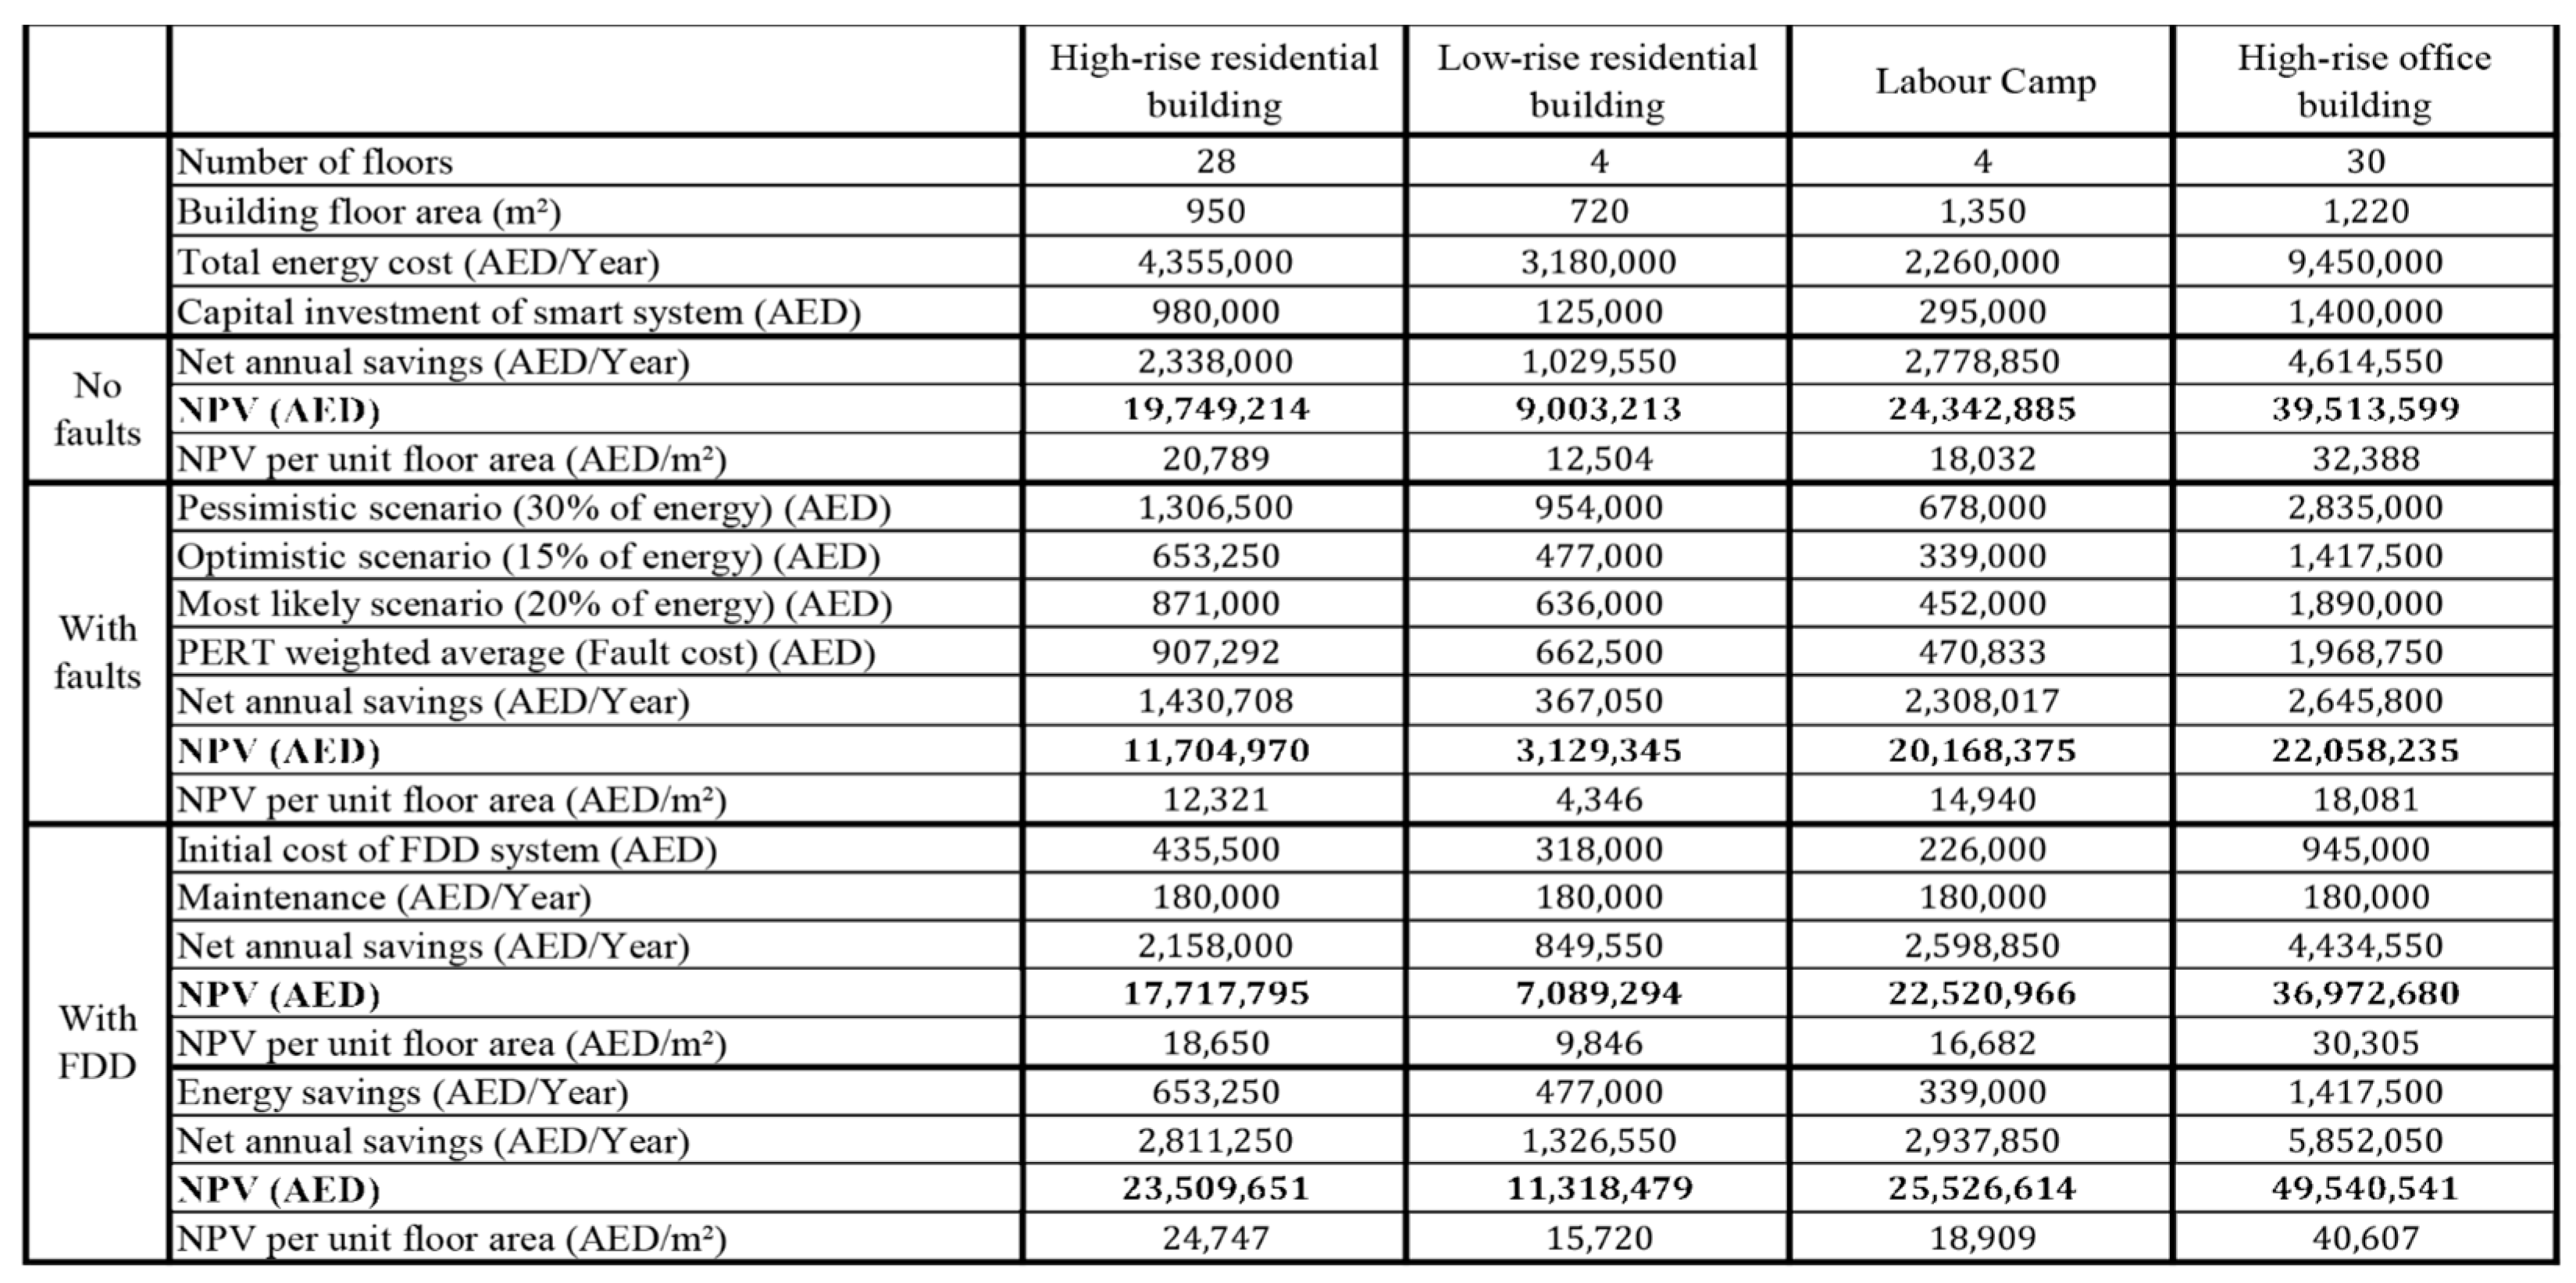
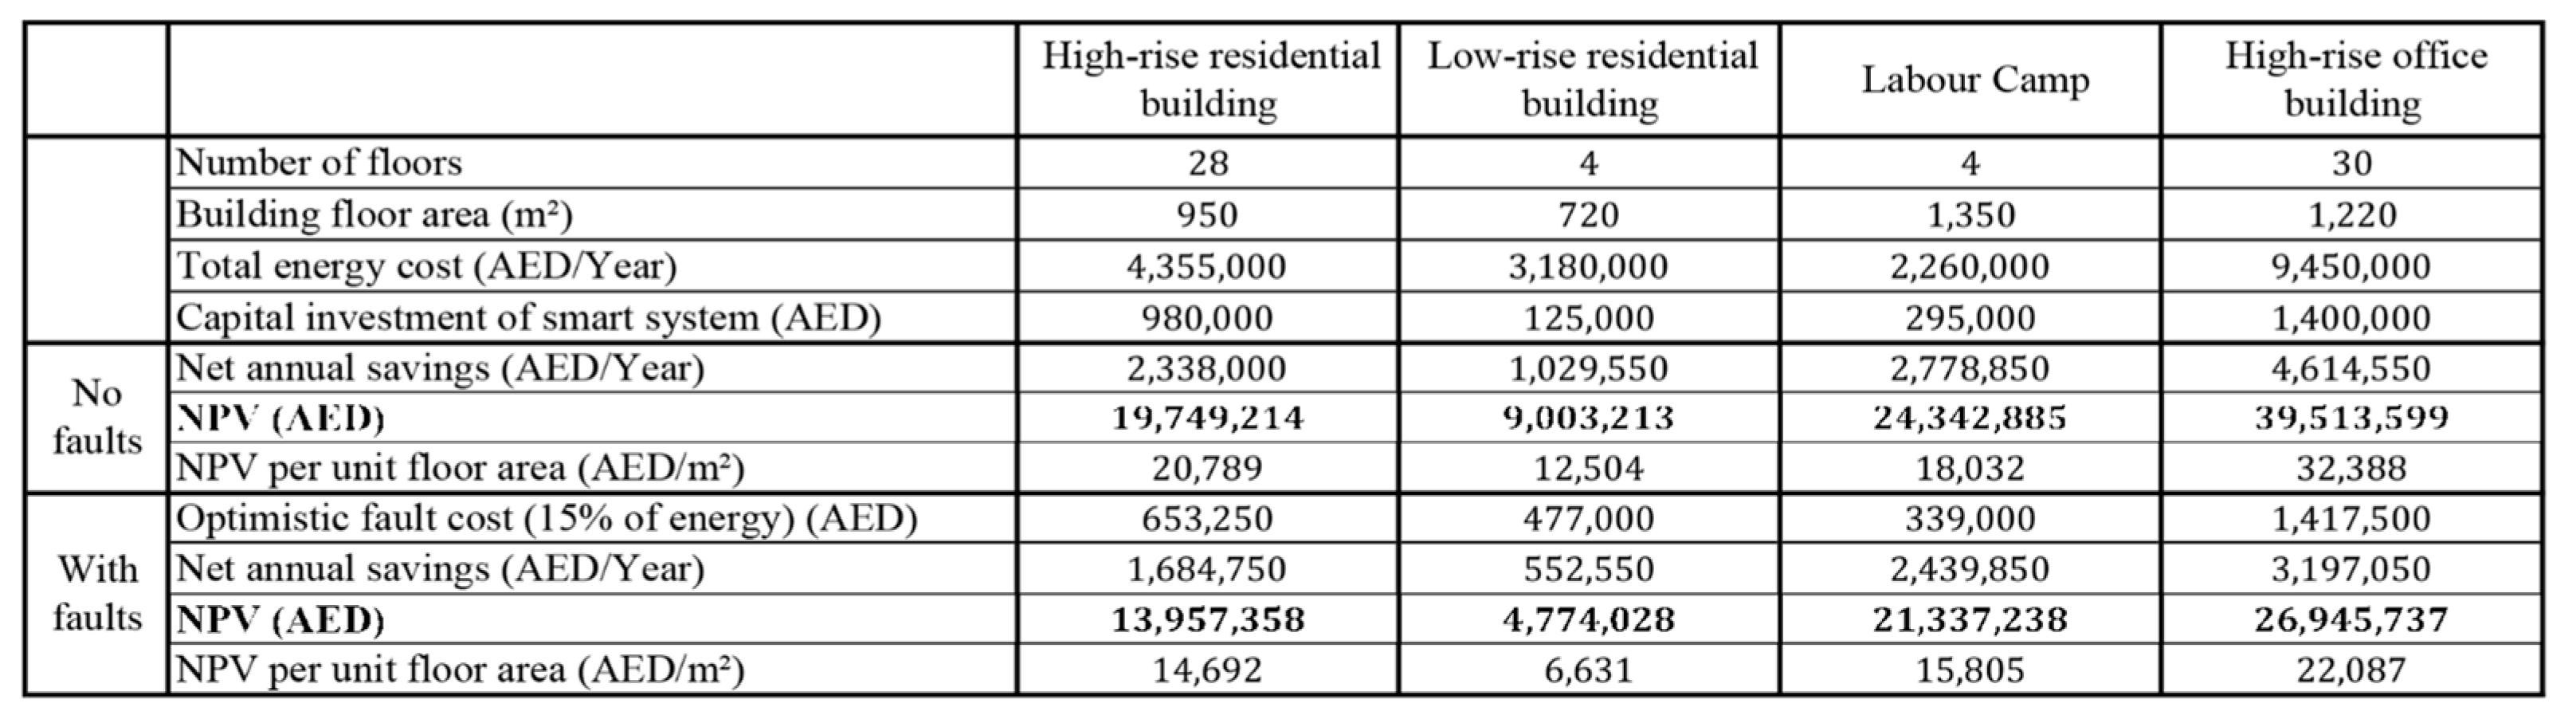
  • A pessimistic scenario (P): Fault cost = 30% waste of the total energy.
  • An optimistic scenario (O): Fault cost = 15% waste of the total energy.
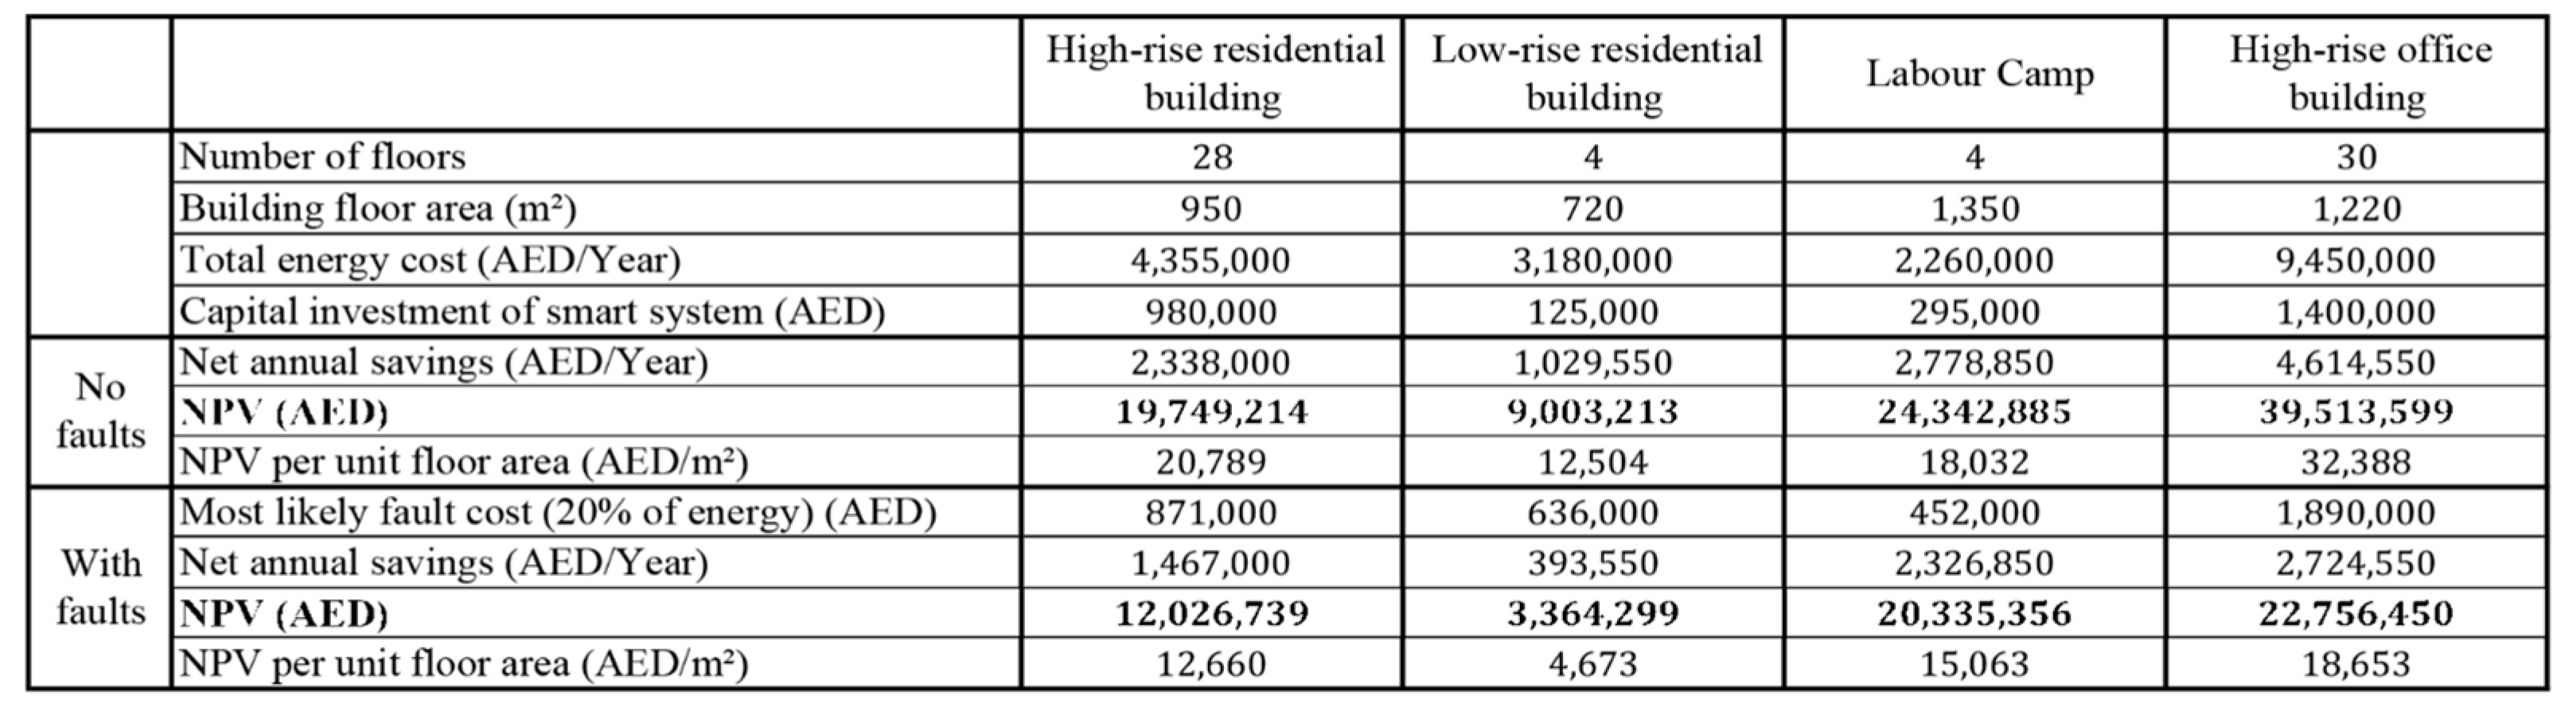
  • A most likely scenario (M): Fault cost = 20% waste of the total energy [70].
Then, those three values were used to calculate the weighted average using Equation (7) [70]:
P E R T   w e i g h t e d   a v e r a g e = O + 4 M + P 6
However, the equations used in this section to perform the calculations and to couple both sustainably and resilience are an expansion of Equations (1) and (2).
N P V w i t h   f a u l t s = A n e t , w i t h   f a u l t s ( 1 + i ) N 1 i ( 1 + i ) N C 0
A n e t , w i t h   f a u l t s = A i + A e + A w + A f A m + A s A f c
Equations (8) and (9) were used to calculate the new NPV that would result from not integrating resilience and sustainability, where A f c represents the annual fault cost. As for the last part of the analysis, Equations (10) and (11) were used to calculate the new NPV that would result from integrating resilience tools within the smart systems of sustainable building. The calculations of this part were performed twice, once without considering the potential energy saving that the resilience tools might provide (Part A) and another time considering the potential energy saving (Part B).
N P V   s , r = A n e t   s , r ( 1 + i ) N 1 i ( 1 + i ) N C 0 , s C 0 , r
A n e t   s , r = A i + A e + A w + A f A m + A s A m , r + A e , r
N P V   s , r : is the calculated NPV after coupling sustainability and resilience.
A n e t   s , r : is the net annual savings after coupling sustainability and resilience.
i : is the discount rate.
N : is the time horizon.
C 0 , s : is the initial cost of installing the smart system.
C 0 , r : is the initial cost of installing resilience tools.
A i : is the environmental incentive.
A e : is the energy cost saving.
A w : is the workers’ cost saving.
A f : is the fire insurance cost saving.
A m : is the smart system maintenance cost.
A s : is the social savings.
A m , r : is the maintenance cost of the used resilience tools.
A e , r : is the energy saving that would result from using the resilience tools.

4. Results and Analysis

The calculations used in the model will be presented in this section, and the results will be thoroughly analyzed to conclude the importance of coupling sustainability and resilience in smart buildings.

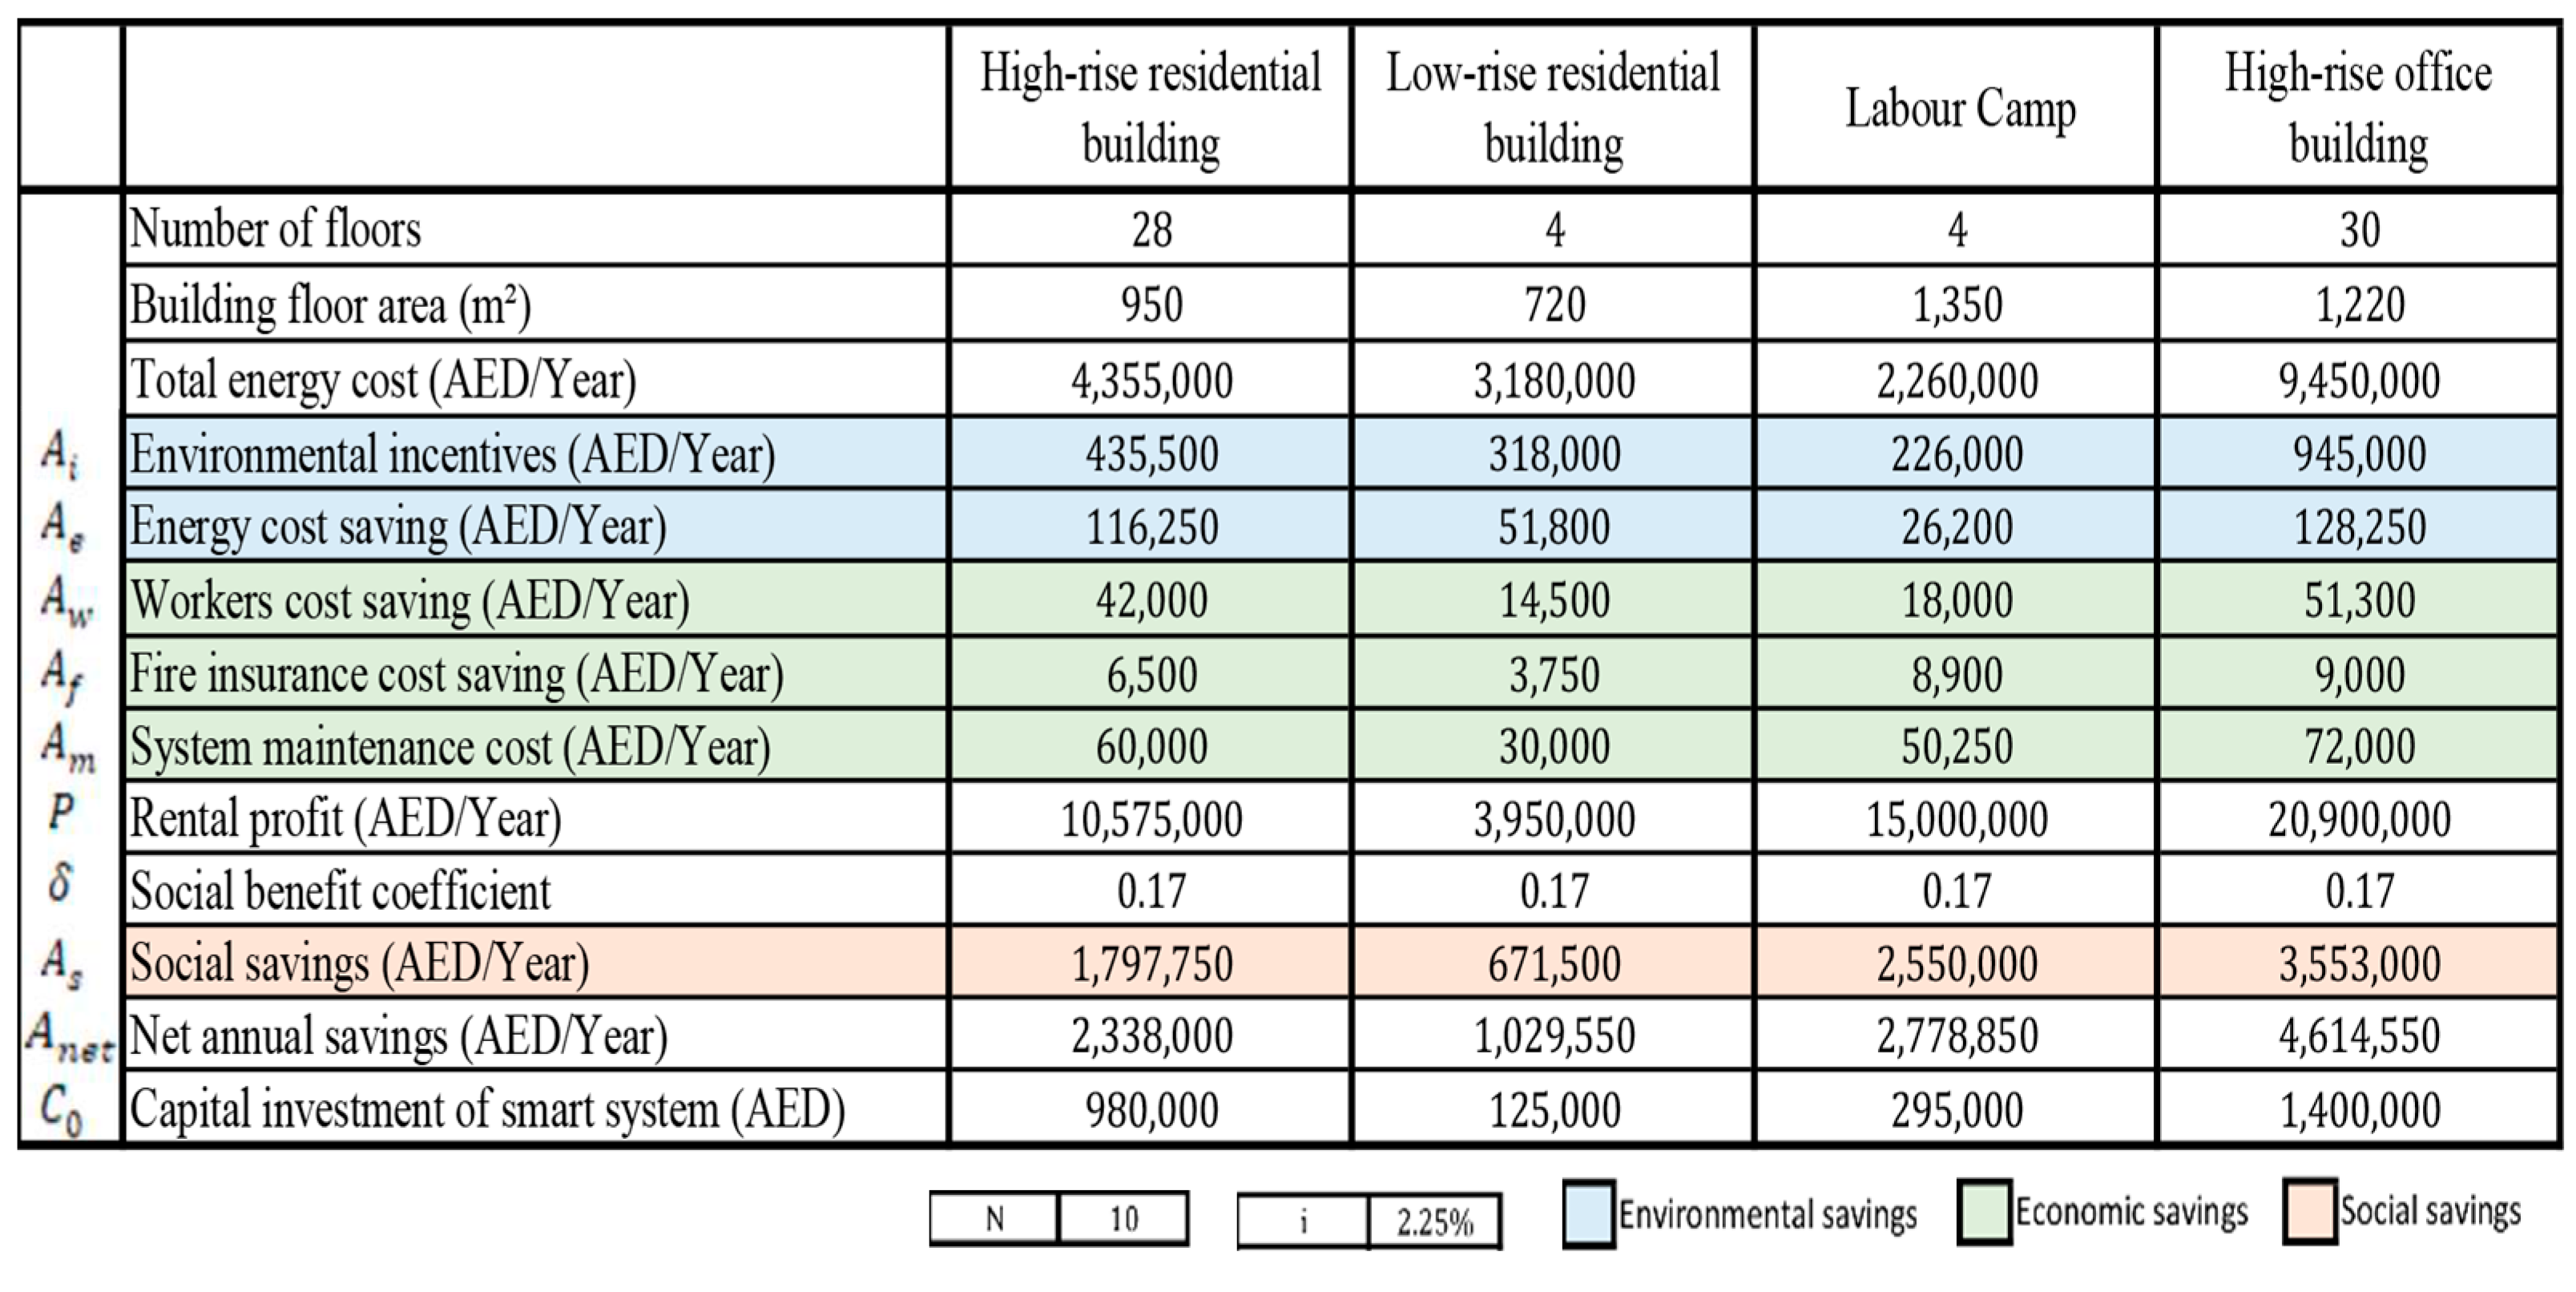
4.1. Sustainability Calculations

After formulating the model, gathering all the information needed, and quantifying the used attributes, the model was applied to four smart buildings in Dubai to test the feasibility of coupling sustainability and resilience in smart buildings. Figure 2 demonstrates the data used to perform the calculations of the model. The buildings used in this study were: a high-rise residential building, a low-rise residential building, a labor camp, and a high-rise office building. The case of the high-rise residential building will be used to clarify the steps of the calculations performed in this model, as the same calculations were applied to the other three buildings.

4.1.1. Environmental Aspect Calculations

For this part of the analysis, the total energy expenditure cost was provided alongside the energy cost savings due to using smart systems. As for the environmental incentives, a 10% reduction in energy consumption was used to account for the benefits provided by the Dubai government, resulting in savings of 435,500 AED.

4.1.2. Social Aspect Calculations

The social aspect of sustainability was the hardest to quantify, as it depends on people’s preferences to quantify some attributes that are hard to measure. As mentioned in Section 2.5.2, to quantify this aspect of sustainability, the evaluating values and the weights of the six selected indices were calculated using a survey, RII, a non-pairwise weighting method, and the equations mentioned in that section. As there are many indicators for measuring building sustainability [71], these six indices were selected based on the most cited in the literature review. First, two of the survey questions were used to obtain the evaluating vector of the six indices E = [ 0.16 ,   0.17 , 0.17 ,   0.15 ,   0.19 ,   0.17 ] , as shown in Figure 3.
For example, for the productivity index, the numbers 4, 3, 3, and 0 represent the number of people who chose the contribution level of smart systems in improving productivity to be high, relatively high, moderate, or low. Each number was multiplied by the assigned weight, and the results were summed to obtain the evaluating score.
Second, one of the survey questions, the RII method, and three non-pairwise weighting methods were used to determine the weights of the six indices, as shown in Figure 4 and Figure 5. Using the RII method allowed for identifying the direct rank of each of the six indices, while using the Rank sum, Reciprocal rank, and rank exponent methods allowed for converting the direct ranks into weights. The steps used to perform this part of the calculations were mentioned in Section 3.5.
In this study, three different methods were used to obtain the weights of the indices and the results of the reciprocal rank method, as shown in Figure 5. This is because this method has the highest weights, while rank exponent and rank sum come second and third [72], respectively. Therefore, the weight vector and the evaluating score vector, after ranking the six indices, are:
W = [ 0.41 , 0.20 , 0.14 , 0.10 , 0.08 , 0.07 ] and E = [ 0.16 , 0.19 , 0.17 , 0.17 , 0.15 , 0.17 ] , as shown in Figure 6.
Using Equations (5) and (6), the social benefit of the high-rise residential building was calculated by multiplying the social benefit coefficient (0.17) by the building’s rental profit (10,575,000 AED), resulting in a savings of 1,797,750 AED. The social savings of the other three buildings were calculated the same way.

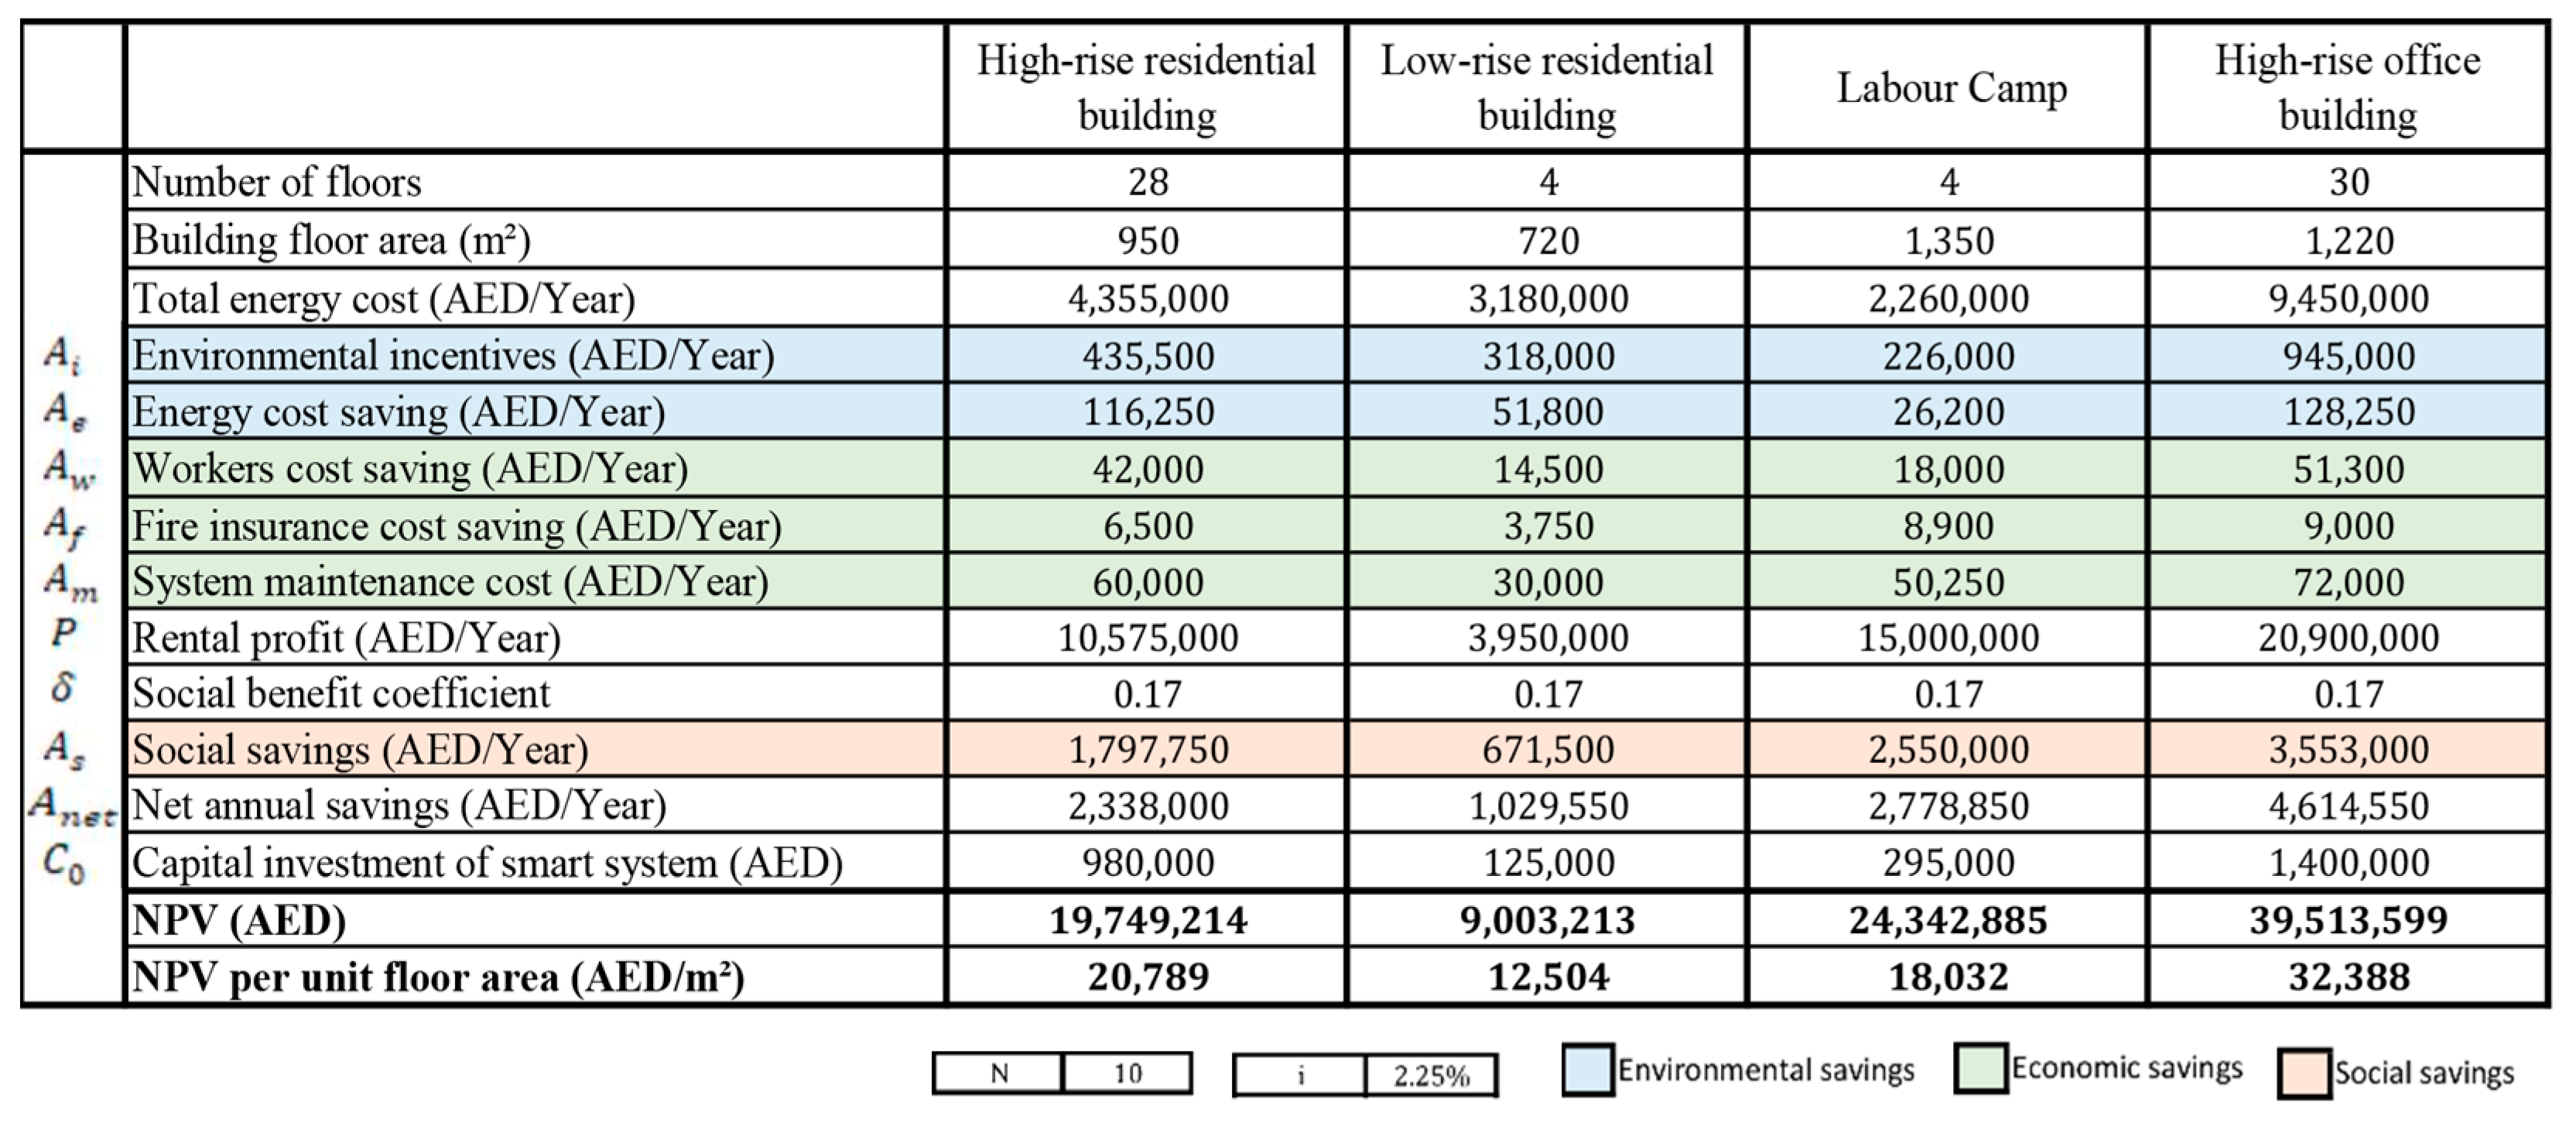
4.1.3. Economic Aspect Calculations

For the economic aspect of sustainability, all of the values required to perform its calculations were provided. Those values included the workers’ cost savings, fire insurance cost savings, and an additional maintenance cost for the smart systems, as seen in Figure 7. Thereafter, Equation (4) was used to obtain the net annual savings, while Equation (3) was used to convert these annual savings and the initial cost into a net present value.
According to Figure 7, the NPV for the four buildings seems to be positive, indicating that the smart systems are worth investing in. The high-rise office building seems to have the highest NPV, and that is due to the high floor numbers and the floor area. In addition, the labor camp has a very high NPV due to its spacious floors and the high rental profit of the building. This indicates the impact of smart systems in high-rise buildings or even low-rise buildings with a high floor area.

4.2. Resilience Calculations

After performing the calculations to obtain the NPV in the case of the smart systems working properly, Figure 8 was created to compare the results and study the importance of maintaining these systems’ resilience. Using the high-rise residential building case, the table below demonstrates the difference between the four NPVs. The first one is the NPV obtained, considering that all systems are working properly with no interruptions, and equals 19,749,214 AED. While for the second part, to achieve a more realistic NPV, a rough estimation of 150 faults yearly with a cost of 5000 AED each was assumed. Then, those two numbers were multiplied, and the result was substituted into Equation (9) to have a new NPV that is equal to 13,099,552 AED.
As for the third part of the table, a scenario where FDD tools were equipped was assumed. The initial installation cost for such systems would be around 10% of the total energy expenditure of the building, and in this case, it would be 435,500 AED. In addition, such systems might require an additional 180,000 AED yearly for maintenance. However, this part of the table consists of parts A and B. Part A considers the initial cost and maintenance cost of the added system, while Part B considers the same costs but assumes an additional benefit of a 15% savings in the total energy expenditure after implementing the FDD system. Therefore, using Equations (10) and (11), the NPV for part A is 17,717,795 AED, and for part B is 23,509,651 AED.
Figure 8 illustrates the impact of installing FDD tools on the NPV value for smart buildings. It can be concluded that having smart systems in buildings would increase the profit of the building, producing a high NPV. In the case of undetected faults, the NPV value seems to decline significantly. The best solution would be implementing FDD tools to stop that from happening. However, as mentioned before, using this method will not produce accurate results as it is not dependent on the number of floors in the building, assuming a fixed number of faults and considering a fixed cost from within the range of costs found in the literature.
Therefore, the approach used to obtain a better estimation for the fault cost considered a range of percentages that would tie up to the total energy consumption of the building, as well as the PERT method. Four values for the NPV were calculated using the three scenarios assumed by the PERT method and their weighted average.
First case: a pessimistic scenario (P) where the fault cost equals a 30% waste of the total energy of the building. Figure 9 illustrates the effect of this scenario on the NPV.
Second case: an optimistic scenario (O) where the fault cost is equal to 15% waste of the total energy of the building. Figure 10 illustrates the effect of this scenario on the NPV.
Third case: a most likely scenario (M) where the fault cost is equal to 20% waste of the total energy of the building. Figure 11 illustrates the effect of this scenario on the NPV.
Fourth case: using the three values of the previously mentioned scenarios and Equation (8) to obtain the weighted average.
Figure 12 illustrates the effect of this scenario on the NPV. Figure 13 summarizes and compares the NPV of the four cases. As can be seen, the pessimistic and the optimistic scenarios reflect the two extremes that the NPV can reach.
Using the weighted average results in a better NPV estimate that lies between the two extremes and depends on the three values. Therefore, moving forward with the calculations, the weighted average NPV was used to perform the last part of the analysis, as shown in Figure 14. Although the results of the N P V w i t h   f a u l t s using the PERT method seem to be more realistic compared to the method that uses hypothetical data, the overall conclusion remains the same. Investing in smart systems in buildings increases the profit of the building, producing a high NPV while ignoring the need to use fault detection and diagnostic tools affects the NPV negatively.
Investing in such tools could significantly reduce potential losses and might even turn them into savings. As seen in Figure 14, adding the FDD tools to the four buildings created a minimal drop in the NPV. Taking the high-rise residential building as an example, before considering the occurrence of faults, the NPV was 19,749,214 AED. In contrast, the NPV dropped to 11,704,970 AED after considering the occurrence of faults. Although investing in resilience tools might add costs (initial cost of installation and maintenance cost), the fact that having such implementation reduces the drop in the NPV to 17,717,795 AED instead of 11,704,970 AED promotes the importance of investing in resilience tools. Moreover, even if the selected time horizon was less than 10 years, the benefits of such investment would still be harvested, as the chances of failure would always be minimized due to the possibility of early fault detection.
However, if the energy savings that result from using these tools were considered, the NPV would be 23,509,651 AED, which concludes that investing in fault detection and diagnostic tools might not only reduce the potential losses but might contribute to enhance the performance of the smart systems and increase the total profit. Therefore, this study proves that implementing smart/sustainable systems in buildings would be profitable while maintaining resilience, and the functionality of these systems will guarantee such implementation’s continuous success and profitability.

5. Discussion

The findings of the environmental aspect calculations demonstrate substantial financial savings and environmental benefits linked to the adoption of intelligent systems in buildings. The analysis quantifies the total energy expenditure and the energy cost savings associated with smart technologies, highlighting the concrete advantages of incorporating sustainability measures into building operations. The implementation of intelligent systems led to a significant decrease in energy usage, resulting in savings of 435,500 AED. The results are consistent with prior research that has emphasized the possible economic and environmental benefits of smart building technologies [73,74].
Conversely, the social component of sustainability presented difficulties in measurement because it depends on personal preferences and attributes that are difficult to quantify. Nevertheless, the study utilized a systematic approach to evaluating social sustainability. This was achieved by employing a survey-based method to determine the values and weights of specific indices. The selection of these indices was meticulous, taking into account their significance in the literature. They covered crucial social factors such as productivity, comfort, and satisfaction [71]. Using this approach, the research obtained quantitative values for the chosen indicators, offering valuable insights into the perceived societal effects of smart building technologies. The utilization of survey data to measure social sustainability aligns with the methodology employed in previous studies, which highlights the significance of stakeholder involvement and perception in evaluating the social aspects of sustainability [75]. By incorporating the viewpoints of stakeholders, the study recognizes that social sustainability metrics are influenced by personal opinions and adds to a more thorough comprehension of the societal consequences of smart building initiatives. Furthermore, the results emphasize the complex and varied aspects of evaluating sustainability in the constructed environment. Environmental metrics provide measurable indicators of energy efficiency and cost savings, while social indicators offer insights into the human-centered effects of sustainable practices. Incorporating both environmental and social factors is crucial in order to attain comprehensive sustainability objectives and promote inclusive and resilient communities [67].
The high-rise office block has the highest NPV of the four buildings analyzed. Due to its larger floor area and more floors, it saves more energy and money over time. The labor camp has a high NPV due to its spacious layout and potential rental profits. Smart systems improve resource utilization and economic performance, especially in large buildings with large floor areas. Smart building technologies have economic benefits, according to previous research. Studies have shown that energy-efficient systems and automation save money and increase asset value over time [13,74]. Smart systems are scalable and applicable in diverse urban contexts, as shown by the positive NPVs across building types.
The findings emphasize the importance of economic factors in sustainability decision-making. While environmental and social factors are crucial for sustainable development, economic viability drives adoption and implementation [71,75,76,77]. This study’s positive NPVs encourage stakeholders to invest in smart building technologies as part of sustainability efforts.

6. Conclusions and Recommendations

The study’s outcome demonstrated that the application of a smart system increases the profitability of the building, hence generating a high NPV. In case some faults emerge before detection, NPV will show a steep decline. Therefore, this study shows that implementing smart technology creates sustainable structures and buildings with increased profitability, yet incorporating resilience within the building reduces possible losses due to failure and improves their financial performance. Quantifying and coupling sustainability and resilience focuses on new studies but does not widely cover buildings, more so smart ones. Therefore, it is recommended that research be conducted to widen knowledge in this field and provide more accurate information.
The proposed model was based on a cash flow analysis where the NPV was used to weigh the benefits against the costs of having smart systems in buildings. Measuring sustainability using NPV required quantifying the effects of having smart systems on the environment, society, and economy. While the environmental and economic calculations were almost straightforward, the social calculations required a special approach, and that included conducting a survey using the RII method and weighting methods. As for resilience, the resulting NPV was compared with three recalculated NPVs based on different scenarios. The first scenario assumed a certain number of faults in the smart systems of the building. The second scenario assumed that an FDD system was installed to detect and prevent failure of the smart systems. The NPV for this scenario was calculated twice, one time considering the energy savings that installing FDD tools would provide and another time ignoring them.
The findings of this study hold significant implications for various stakeholders involved in the design and construction process of intelligent buildings, including researchers, developers, investors, managers, and engineers. The contributions of this research to the body of knowledge are multifaceted and can provide a structured approach to quantifying the resilience of smart building systems, emphasizing the importance of incorporating resilience considerations into the evaluation framework. By coupling sustainability and resilience in building design and operations, stakeholders can optimize environmental, social, and economic outcomes while enhancing the resilience of built infrastructure. The research highlights the financial implications of not integrating resilience with sustainability, emphasizing the potential risks and costs associated with system failures. Overall, the findings contribute to advancing academic knowledge and practical applications in intelligent building design and management, offering actionable insights for stakeholders in various sectors.
To expand and improve this research, recommendations could include adding greenhouse gas emissions data to environmental calculations, involving more surveying experts, using more indices to quantify social sustainability, using alternative methods like AHP, adding additional costs and benefits to calculations, and considering the use of other fault detection systems with varying capital and maintenance costs. These recommendations aim to improve the performance of smart systems and enhance the overall sustainability of the environment.

Author Contributions

Conceptualization, D.A.A.Q., S.B. and M.M.; methodology D.A.A.Q., L.A., M.M. and S.B.; software. D.A.A.Q.; validation, S.B., M.M. and D.A.A.Q.; formal analysis, D.A.A.Q. and L.A.; investigation, D.A.A.Q., S.B. and M.M.; resources, D.A.A.Q., S.B., M.M. and L.A.; data curation, D.A.A.Q.; writing—original draft preparation, D.A.A.Q., S.B. and M.M.; writing—review and editing, L.A.; visualization, L.A., M.M. and S.B.; supervision, S.B. and M.M.; project administration, L.A. All authors have read and agreed to the published version of the manuscript.

Funding

This paper’s work was supported, in part, by the American University of Sharjah’s Open Access Program (OAP24-CEN-140).

Institutional Review Board Statement

Not applicable.

Informed Consent Statement

This paper represents the opinions of the author(s) and does not mean to represent the position or opinions of the American University of Sharjah.

Data Availability Statement

The data presented in this study are available on request from the corresponding author. Due to privacy restrictions, they are not publicly available.

Conflicts of Interest

The authors declare no conflicts of interest.

References

  1. Bocchini, P.; Frangopol, D.M.; Ummenhofer, T.; Zinke, T. Resilience and sustainability of civil infrastructure: Toward a unified approach. J. Infrastruct. Syst. 2014, 20, 04014004. [Google Scholar] [CrossRef]
  2. Alwaer, H.; Clements-Croome, D.J. Key performance indicators (KPIs) and priority setting in using the multi-attribute approach for assessing sustainable intelligent buildings. Build. Environ. 2010, 45, 799–807. [Google Scholar] [CrossRef]
  3. Rafiei, M.H.; Adeli, H. Sustainability in highrise building design and construction. Struct. Des. Tall Spec. Build. 2016, 25, 643–658. [Google Scholar] [CrossRef]
  4. McLellan, B.; Zhang, Q.; Farzaneh, H.; Utama, N.A.; Ishihara, K.N. Resilience, sustainability and risk management: A focus on energy. Challenges 2012, 3, 153–182. [Google Scholar] [CrossRef]
  5. Grafakos, S.; Gianoli, A.; Tsatsou, A. Towards the development of an integrated sustainability and resilience benefits assessment framework of urban green growth interventions. Sustainability 2016, 8, 461. [Google Scholar] [CrossRef]
  6. Chen, Z.; Wang, F.; Feng, Q. Cost-benefit evaluation for building intelligent systems with special consideration on intangible benefits and energy consumption. Energy Build. 2016, 128, 484–490. [Google Scholar] [CrossRef]
  7. John, G.; Clements-Croome, D.; Jeronimidis, G. Sustainable building solutions: A review of lessons from the natural world. Build. Environ. 2005, 40, 319–328. [Google Scholar] [CrossRef]
  8. Cole, R.J. Emerging trends in building environmental assessment methods. Build. Res. Inf. 1998, 26, 3–16. [Google Scholar] [CrossRef]
  9. Salvalai, G.; Sesana, M.M. Monitoring Approaches for New-Generation Energy Performance Certificates in Residential Buildings. Buildings 2022, 12, 469. [Google Scholar] [CrossRef]
  10. Sartori, T.; Drogemuller, R.; Omrani, S.; Lamari, F. A schematic framework for Life Cycle Assessment (LCA) and Green Building Rating System (GBRS). J. Build. Eng. 2021, 38, 102180. [Google Scholar] [CrossRef]
  11. Yao, F.; Liu, G.; Ji, Y.; Tong, W.; Du, X.; Li, K.; Shrestha, A.; Martek, I. Evaluating the environmental impact of construction within the industrialized building process: A monetization and building information modelling approach. Int. J. Environ. Res. Public Health 2020, 17, 8396. [Google Scholar] [CrossRef] [PubMed]
  12. Backes, J.G.; Traverso, M. Life Cycle Sustainability Assessment in the construction sector–actual application and future outlook. In E3S Web of Conferences; EDP Sciences: Les Ulis, France, 2022; Volume 349, p. 04007. [Google Scholar]
  13. Abdalla, H.; Fattah, K.; Abdallah, M.; Al-Tamimi, A. Environmental footprint and economics of a full-scale 3D-printed house. Sustainability 2021, 13, 11978. [Google Scholar] [CrossRef]
  14. Islam, H.; Bhuiyan, M.; Tushar, Q.; Navaratnam, S.; Zhang, G. Effect of Star Rating Improvement of Residential Buildings on Life Cycle Environmental Impacts and Costs. Buildings 2022, 12, 1605. [Google Scholar] [CrossRef]
  15. Ferrari, S.; Zoghi, M.; Blázquez, T.; Dall’O’, G. New Level(s) framework: Assessing the affinity between the main international Green Building Rating Systems and the european scheme. Renew. Sustain. Energy Rev. 2022, 155, 111924. [Google Scholar] [CrossRef]
  16. Remer, D.S.; Nieto, A.P. A compendium and comparison of 25 project evaluation techniques. Part 1: Net present value and rate of return methods. Int. J. Prod. Econ. 1995, 42, 79–96. [Google Scholar] [CrossRef]
  17. Gluch, P.; Baumann, H. The life cycle costing (LCC) approach: A conceptual discussion of its usefulness for environmental decision-making. Build. Environ. 2004, 39, 571–580. [Google Scholar] [CrossRef]
  18. Wong, J.K.W.; Li, H.; Wang, S.W. Intelligent building research: A review. Autom. Constr. 2005, 14, 143–159. [Google Scholar] [CrossRef]
  19. Sutter, C.; Parreño, J.C. Does the current Clean Development Mechanism (CDM) deliver its sustainable development claim? An analysis of officially registered CDM projects. Clim. Change 2007, 84, 75–90. [Google Scholar] [CrossRef]
  20. Wardekker, J.A.; de Jong, A.; Knoop, J.M.; van der Sluijs, J.P. Operationalising a resilience approach to adapting an urban delta to uncertain climate changes. Technol. Forecast. Soc. Change 2010, 77, 987–998. [Google Scholar] [CrossRef]
  21. Holling, C.S. Resilience and stability of ecological systems. Annu. Rev. Ecol. Syst. 1973, 1, 1–23. [Google Scholar] [CrossRef]
  22. Nan, C.; Sansavini, G. A quantitative method for assessing resilience of interdependent infrastructures. Reliab. Eng. Syst. Saf. 2017, 157, 35–53. [Google Scholar] [CrossRef]
  23. Bignami, D.F. Testing solutions of a multi-disaster building’s certification functional to the built environment sustainability and resilience. Int. J. Disaster Resil. Built Environ. 2017, 8, 77–97. [Google Scholar] [CrossRef]
  24. Cox, R.A.; Nielsen, S.B.; Rode, C. Coupling and quantifying resilience and sustainability in facilities management. J. Facil. Manag. 2015, 13, 314–331. [Google Scholar] [CrossRef]
  25. Nedelcu, A.-V.; Sandu, F.; Machedon-Pisu, M.; Alexandru, M.; Ogrutan, P. Wireless-based remote monitoring and control of intelligent buildings. In Proceedings of the 2009 IEEE International Workshop on Robotic and Sensors Environments, Lecco, Italy, 6–7 November 2009; pp. 47–52. [Google Scholar]
  26. Štěpán, P.; Prostejovska, Z. IoT in buildings and optimization of energy consumption. Bus. IT 2020, X, 32–41. [Google Scholar] [CrossRef]
  27. Patidar, A.; Sharma, M.; Agrawal, R.; Sangwan, K.S. Supply chain resilience and its key performance indicators: An evaluation under industry 4.0 and sustainability perspective. Manag. Environ. Qual. Int. J. 2022, 34, 962–980. [Google Scholar] [CrossRef]
  28. Huang, Y.; Shen, T. An article on green firefighting equipment in Taiwan. Sustainability 2021, 13, 12421. [Google Scholar] [CrossRef]
  29. Li, P.; Wu, J. Sustainable living with risks: Meeting the challenges. Hum. Ecol. Risk Assess. Int. J. 2019, 25, 1–10. [Google Scholar] [CrossRef]
  30. Mortula, M.; Ahmad, I.; Sadiq, R.; Beheiry, S. A Conceptual Unified Model for Assessing Improvements in Sustainability and Resilience in Water Distribution Systems; Springer eBooks: Berlin/Heidelberg, Germany, 2021. [Google Scholar] [CrossRef]
  31. Doukas, H.; Patlitzianas, K.D.; Iatropoulos, K.; Psarras, J. Intelligent building energy management system using rule sets. Build. Environ. 2007, 42, 3562–3569. [Google Scholar] [CrossRef]
  32. Wong, J.K.W.; Li, H. Application of the analytic hierarchy process (AHP) in multi-criteria analysis of the selection of intelligent building systems. Build. Environ. 2008, 43, 108–125. [Google Scholar] [CrossRef]
  33. Jin, X.H.; Zhang, G.; Zuo, J.; Lindsay, S. Sustainable high-rise design trends-Dubai’s strategy. Civ. Eng. Archit. 2013, 1, 33–41. [Google Scholar] [CrossRef]
  34. Chew, I.; Kalavally, V.; Oo, N.W.; Parkkinen, J. Design of an energy-saving controller for an intelligent LED lighting system. Energy Build. 2016, 120, 1–9. [Google Scholar] [CrossRef]
  35. Alibabaei, N.; Fung, A.; Raahemifar, K.; Moghimi, A. Effects of intelligent strategy planning models on residential HVAC system energy demand and cost during the heating and cooling seasons. Appl. Energy 2017, 185, 29–43. [Google Scholar] [CrossRef]
  36. Koumoutsos, K.; Kretsis, A.; Kokkinos, P.; Varvarigos, E.A.; Nikolopoulos, V.; Gkioxi, E.; Zafeiropoulos, A. Gathering and processing energy consumption data from public educational buildings over IPv6. Energy Sustain. Soc. 2015, 5, 1–12. [Google Scholar] [CrossRef]
  37. Reda, F.; Pasini, D.; Laitinen, A.; Vesanen, T. ICT intelligent support solutions toward the reduction of heating demand in cold and mild European climate conditions. Energy Effic. 2019, 12, 1443–1471. [Google Scholar] [CrossRef]
  38. Hofer, G.; Herzog, B.; Grim, M. Calculating life cycle cost in the early design phase to encourage energy efficient and sustainable buildings. Proc. IEECB Focus 2010, 2, 3–4. [Google Scholar]
  39. King, J.; Perry, C. Smart Buildings: Using Smart Technology to Save Energy in Existing Buildings; Amercian Council for an Energy-Efficient Economy: Washington, DC, USA, 2017. [Google Scholar]
  40. Lazarova-Molnar, S.; Shaker, H.R.; Mohamed, N. Fault detection and diagnosis for smart buildings: State of the art, trends and challenges. In Proceedings of the 2016 3rd MEC International Conference on Big Data and Smart City (ICBDSC), Muscat, Oman, 15–16 March 2016; pp. 1–7. [Google Scholar]
  41. Lazarova-Molnar, S.; Mohamed, N. A framework for collaborative cloud-based fault detection and diagnosis in smart buildings. In Proceedings of the 2017 7th International Conference on Modeling, Simulation, and Applied Optimization (ICMSAO), Sharjah, United Arab Emirates, 4–6 April 2017; pp. 1–6. [Google Scholar]
  42. Weng, T.; Agarwal, Y. From buildings to smart buildings—Sensing and actuation to improve energy efficiency. IEEE Des. Test Comput. 2012, 29, 36–44. [Google Scholar] [CrossRef]
  43. Shen, W.; Xue, H.H.; Newsham, G.; Dikel, E. Smart building monitoring and ongoing commissioning: A case study with four canadian federal government office buildings. In Proceedings of the 2017 IEEE International Conference on Systems, Man, and Cybernetics (SMC), Banff, AB, Canada, 5–8 October 2017; pp. 176–181. [Google Scholar]
  44. Tokody, D.; Papp, J.; Iantovics, L.B.; Flammini, F. Complex, resilient and smart systems. In Resilience of Cyber-Physical Systems; Springer: Cham, Switzerland, 2019; pp. 3–24. [Google Scholar]
  45. Gaonkar, P.; Bapat, J.; Das, D. A survey on QoE and energy cost optimization strategies for smart buildings. CSI Trans. ICT 2018, 6, 195–202. [Google Scholar] [CrossRef]
  46. García, O.; Chamoso, P.; Prieto, J.; Rodríguez, S.; de la Prieta, F. A serious game to reduce consumption in smart buildings. In Proceedings of the International Conference on Practical Applications of Agents and Multi-Agent Systems, Porto, Portugal, 21–23 June 2017; Springer: Cham, Switzerland, 2017; pp. 481–493. [Google Scholar]
  47. Minoli, D.; Sohraby, K.; Occhiogrosso, B. IoT considerations, requirements, and architectures for smart buildings—Energy optimization and next-generation building management systems. IEEE Internet Things J. 2017, 4, 269–283. [Google Scholar] [CrossRef]
  48. Dubai Electricity & Water Authority. Shams Dubai FAQ. Dubai Electricity & Water Authority (DEWA). 2022. Available online: https://www.dewa.gov.ae/en/consumer/solar-community/shams-dubai/shams-dubai-faq (accessed on 19 February 2021).
  49. Nguyen, T.A.; Aiello, M. Energy intelligent buildings based on user activity: A survey. Energy Build. 2013, 56, 244–257. [Google Scholar] [CrossRef]
  50. Katzev, R. The impact of energy-efficient office lighting strategies on employee satisfaction and productivity. Environ. Behav. 1992, 24, 759–778. [Google Scholar] [CrossRef]
  51. Clark, D.; Merz, S.K. Incentives for sustainable buildings in Australia—A designer’s perspective. Sinclair Kn. Merz Tech. Pap. 2003, 2, 1–7. [Google Scholar]
  52. Lützkendorf, T.; Lorenz, D. Sustainable property investment: Valuing sustainable buildings through property performance assessment. Build. Res. Inf. 2005, 33, 212–234. [Google Scholar] [CrossRef]
  53. Papagiannidis, S.; Marikyan, D. Smart offices: A productivity and well-being perspective. Int. J. Inf. Manag. 2020, 51, 102027. [Google Scholar] [CrossRef]
  54. Sihite, M.; Sule, E.T.; Azis, Y.; Kaltum, U. Gain competitive advantage through reputation. South East Asia J. Contemp. Bus. Econ. Law 2016, 10, 22–31. [Google Scholar]
  55. Yiu, C.Y. Intelligent building maintenance—A novel discipline. J. Build. Apprais. 2008, 3, 305–317. [Google Scholar] [CrossRef]
  56. Asimakopoulou, E.; Bessis, N. Buildings and crowds: Forming smart cities for more effective disaster management. In Proceedings of the 2011 Fifth International Conference on Innovative Mobile and Internet Services in Ubiquitous Computing, Seoul, Republic of Korea, 30 June–2 July 2011; pp. 229–234. [Google Scholar]
  57. Akkaya, K.; Guvenc, I.; Aygun, R.; Pala, N.; Kadri, A. IoT-based occupancy monitoring techniques for energy-efficient smart buildings. In Proceedings of the 2015 IEEE Wireless Communications and Networking Conference Workshops (WCNCW), New Orleans, LA, USA, 9–12 March 2015; pp. 58–63. [Google Scholar]
  58. Mara, P.; Brennan, R.; O’Sullivan, D.; Keane, M.; McGlinn, K.; O’Donnell, J. Pervasive knowledge-based networking for maintenance inspection in smart buildings. In Proceedings of the 6th International Workshop on Managing Ubiquitous Communications and Services, Nice, France, 2–4 September 2009; pp. 59–66. [Google Scholar]
  59. Abate, A.; Budde, C.E.; Cauchi, N.; Hoque, K.A.; Stoelinga, M. Assessment of maintenance policies for smart buildings: Application of formal methods to fault maintenance trees. In Proceedings of the European Conference of the Prognostics and Health Management Society, Utrecht, The Netherlands, 3–6 July 2018. [Google Scholar]
  60. Pătraşcu, M.; Drăgoicea, M. Integrating agents and services for control and monitoring: Managing emergencies in smart buildings. In Service Orientation in Holonic and Multi-Agent Manufacturing and Robotics; Springer: Cham, Switzerland, 2014; pp. 209–224. [Google Scholar]
  61. Murphy, K.E.; Simon, S.J. Using cost benefit analysis for enterprise resource planning project evaluation: A case for including intangibles. In Enterprise Resource Planning: Global Opportunities and Challenges; IGI Global: Hershey, PA, USA, 2002; pp. 245–266. [Google Scholar]
  62. Kneifel, J. Life-cycle carbon and cost analysis of energy efficiency measures in new commercial buildings. Energy Build. 2010, 42, 333–340. [Google Scholar] [CrossRef]
  63. Trading Economics. United Arab Emirates Interest Rate—2023 Data—2007–2022 Historical—2024 Forecast. Trading Economics|20 Million Indicators from 196 Countries. 2022. Available online: https://tradingeconomics.com/united-arab-emirates/interest-rate (accessed on 30 March 2022).
  64. Rajgor, M.; Paresh, C.; Dhruv, P.; Chirag, P.; Dhrmesh, B. RII & IMPI: Effective techniques for finding delay in construction project. Int. Res. J. Eng. Technol. 2016, 3, 1173–1177. [Google Scholar]
  65. Baraniuk, C. Smart Buildings Predict When Critical Systems Are about to Fail. New Scientist. 2017. Available online: https://www.newscientist.com/article/2118499-smart-buildings-predict-when-critical-systems-are-about-to-fail/ (accessed on 30 March 2022).
  66. Ihasalo, H. Transforming Building Automation Data into Building Performance Metrics-Design, Implementation and Evaluation of Use of a Performance Monitoring and Management System. Ph.D. Thesis, Aalto University, Espoo, Finland, 2012. [Google Scholar]
  67. Zhao, Y.; Li, T.; Zhang, X.; Zhang, C. Artificial intelligence-based fault detection and diagnosis methods for building energy systems: Advantages, challenges and the future. Renew. Sustain. Energy Rev. 2019, 109, 85–101. [Google Scholar] [CrossRef]
  68. Lin, G.; Pritoni, M.; Chen, Y.; Granderson, J. Development and implementation of fault-correction algorithms in fault detection and diagnostics tools. Energies 2020, 13, 2598. [Google Scholar] [CrossRef]
  69. Cort, K.A.; Haack, J.N.; Katipamula, S.; Nicholls, A.K. VOLTTRON™: Tech-to-Market Best-Practices Guide for Small-and Medium-Sized Commercial Buildings; No. PNNL-25405; Pacific Northwest National Lab. (PNNL): Richland, WA, USA, 2016. [Google Scholar]
  70. Wu, S.; Sun, J.-Q. Cross-level fault detection and diagnosis of building HVAC systems. Build. Environ. 2011, 46, 1558–1566. [Google Scholar] [CrossRef]
  71. Pan, W.; Zhang, Z. Benchmarking the sustainability of concrete and steel modular construction for buildings in urban development. Sustain. Cities Soc. 2023, 90, 104400. [Google Scholar] [CrossRef]
  72. Sureeyatanapas, P. Comparison of rank-based weighting methods for multi-criteria decision making. Eng. Appl. Sci. Res. 2016, 43, 376–379. [Google Scholar]
  73. Moretti, M.; Djomo, S.N.; Azadi, H.; May, K.; De Vos, K.; Van Passel, S.; Witters, N. A systematic review of environmental and economic impacts of smart grids. Renew. Sustain. Energy Rev. 2017, 68, 888–898. [Google Scholar] [CrossRef]
  74. Chen, J.; Chen, Y.; Zhou, Y.; Luo, X.; Tang, Q. Insight into adsorption of cesium ion in aqueous solution based on inorganic modified bentonite. Pol. J. Environ. Stud. 2023, 32, 1565–1580. [Google Scholar] [CrossRef]
  75. Yu, J.Q.; Dang, B.; Clements-Croome, D.; Xu, S. Sustainability Assessment Indicators and Methodology for Intelligent Buildings. Adv. Mater. Res. 2011, 368–373, 3829–3832. [Google Scholar] [CrossRef]
  76. Gadakari, T.; Mushatat, S.; Newman, R. Intelligent Buildings: Key to Achieving Total Sustainability in the Built Environment. J. Eng. Proj. Prod. Manag. 2014, 4, 2–16. [Google Scholar] [CrossRef]
  77. Wang, L.; Xue, X.; Wang, Z.; Zhang, L. A unified assessment approach for urban infrastructure sustainability and resilience. Adv. Civ. Eng. 2018, 2018, 2073968. [Google Scholar] [CrossRef]
Figure 1. Illustration of resilience capabilities: [22].
Sustainability 16 03175 g001
Figure 2. Cost and benefit analysis for four smart buildings in Dubai.
Sustainability 16 03175 g002
Figure 3. RII calculations.
Sustainability 16 03175 g003
Figure 4. The three used non-pairwise weighting methods.
Sustainability 16 03175 g004
Figure 5. Indices quantification.
Sustainability 16 03175 g005
Figure 6. Social benefit coefficient.
Sustainability 16 03175 g006
Figure 7. The results of the cost and benefit analysis.
Sustainability 16 03175 g007
Figure 8. Testing for smart systems resilience using hypothetical data.
Sustainability 16 03175 g008
Figure 9. Testing for smart systems resilience considering a pessimistic scenario.
Sustainability 16 03175 g009
Figure 10. Testing for smart systems resilience considering an optimistic scenario.
Sustainability 16 03175 g010
Figure 11. Testing for smart systems resilience considering a most likely scenario.
Sustainability 16 03175 g011
Figure 12. Testing for smart systems resilience considering PERT weighted average.
Sustainability 16 03175 g012
Figure 13. A comparison between the results of the four cases.
Sustainability 16 03175 g013
Figure 14. Testing for smart systems resilience using the PERT method.
Sustainability 16 03175 g014
Table 1. Summary of the literature about the relation between cost efficiency and different implementation.
Study TypeReferences
Cost savings due to implementing smart technologies[6] and [34,35,36,37,38,39]
Cost savings due to implementing sustainable approaches[34,35,36,37,38,39]
Cost savings due to implementing smart and resilient technologies[30] and [40,41,42,43]
Cost savings due to implementing smart technologies and sustainable approaches and maintaining their resilience[6,44]
Table 2. Summary of the literature on the quantified attributes of the environmental component.
Attribute Reference
Energy expenditure[46,47]
Environmental incentives[47,48]
Table 3. Summary of the literature on the quantified attributes of the social component.
AttributeReference
Productivity and indoor environment quality[39] and [49,50,51,52,53]
Reputation and the extra profit[6,39,54]
Services and safety[55,56]
Table 4. Summary of the literature on the quantified attributes of the economic component.
AttributeReference
Maintenance[55,57,58,59]
Fire insurance[6,60]
Services and safety[55,56]
Disclaimer/Publisher’s Note: The statements, opinions and data contained in all publications are solely those of the individual author(s) and contributor(s) and not of MDPI and/or the editor(s). MDPI and/or the editor(s) disclaim responsibility for any injury to people or property resulting from any ideas, methods, instructions or products referred to in the content.

