
In Situ Utilization of Electron-Enhanced Degradation of Azo Dyes in a Constructed Wetland–Microbial Fuel Cell Coupling System


 and
and
Abstract
:1. Introduction
2. Materials and Methods
2.1. Reactor Configuration
2.2. System Operation
2.3. Electrochemical Analysis
2.4. Other Analyses
3. Results and Discussion
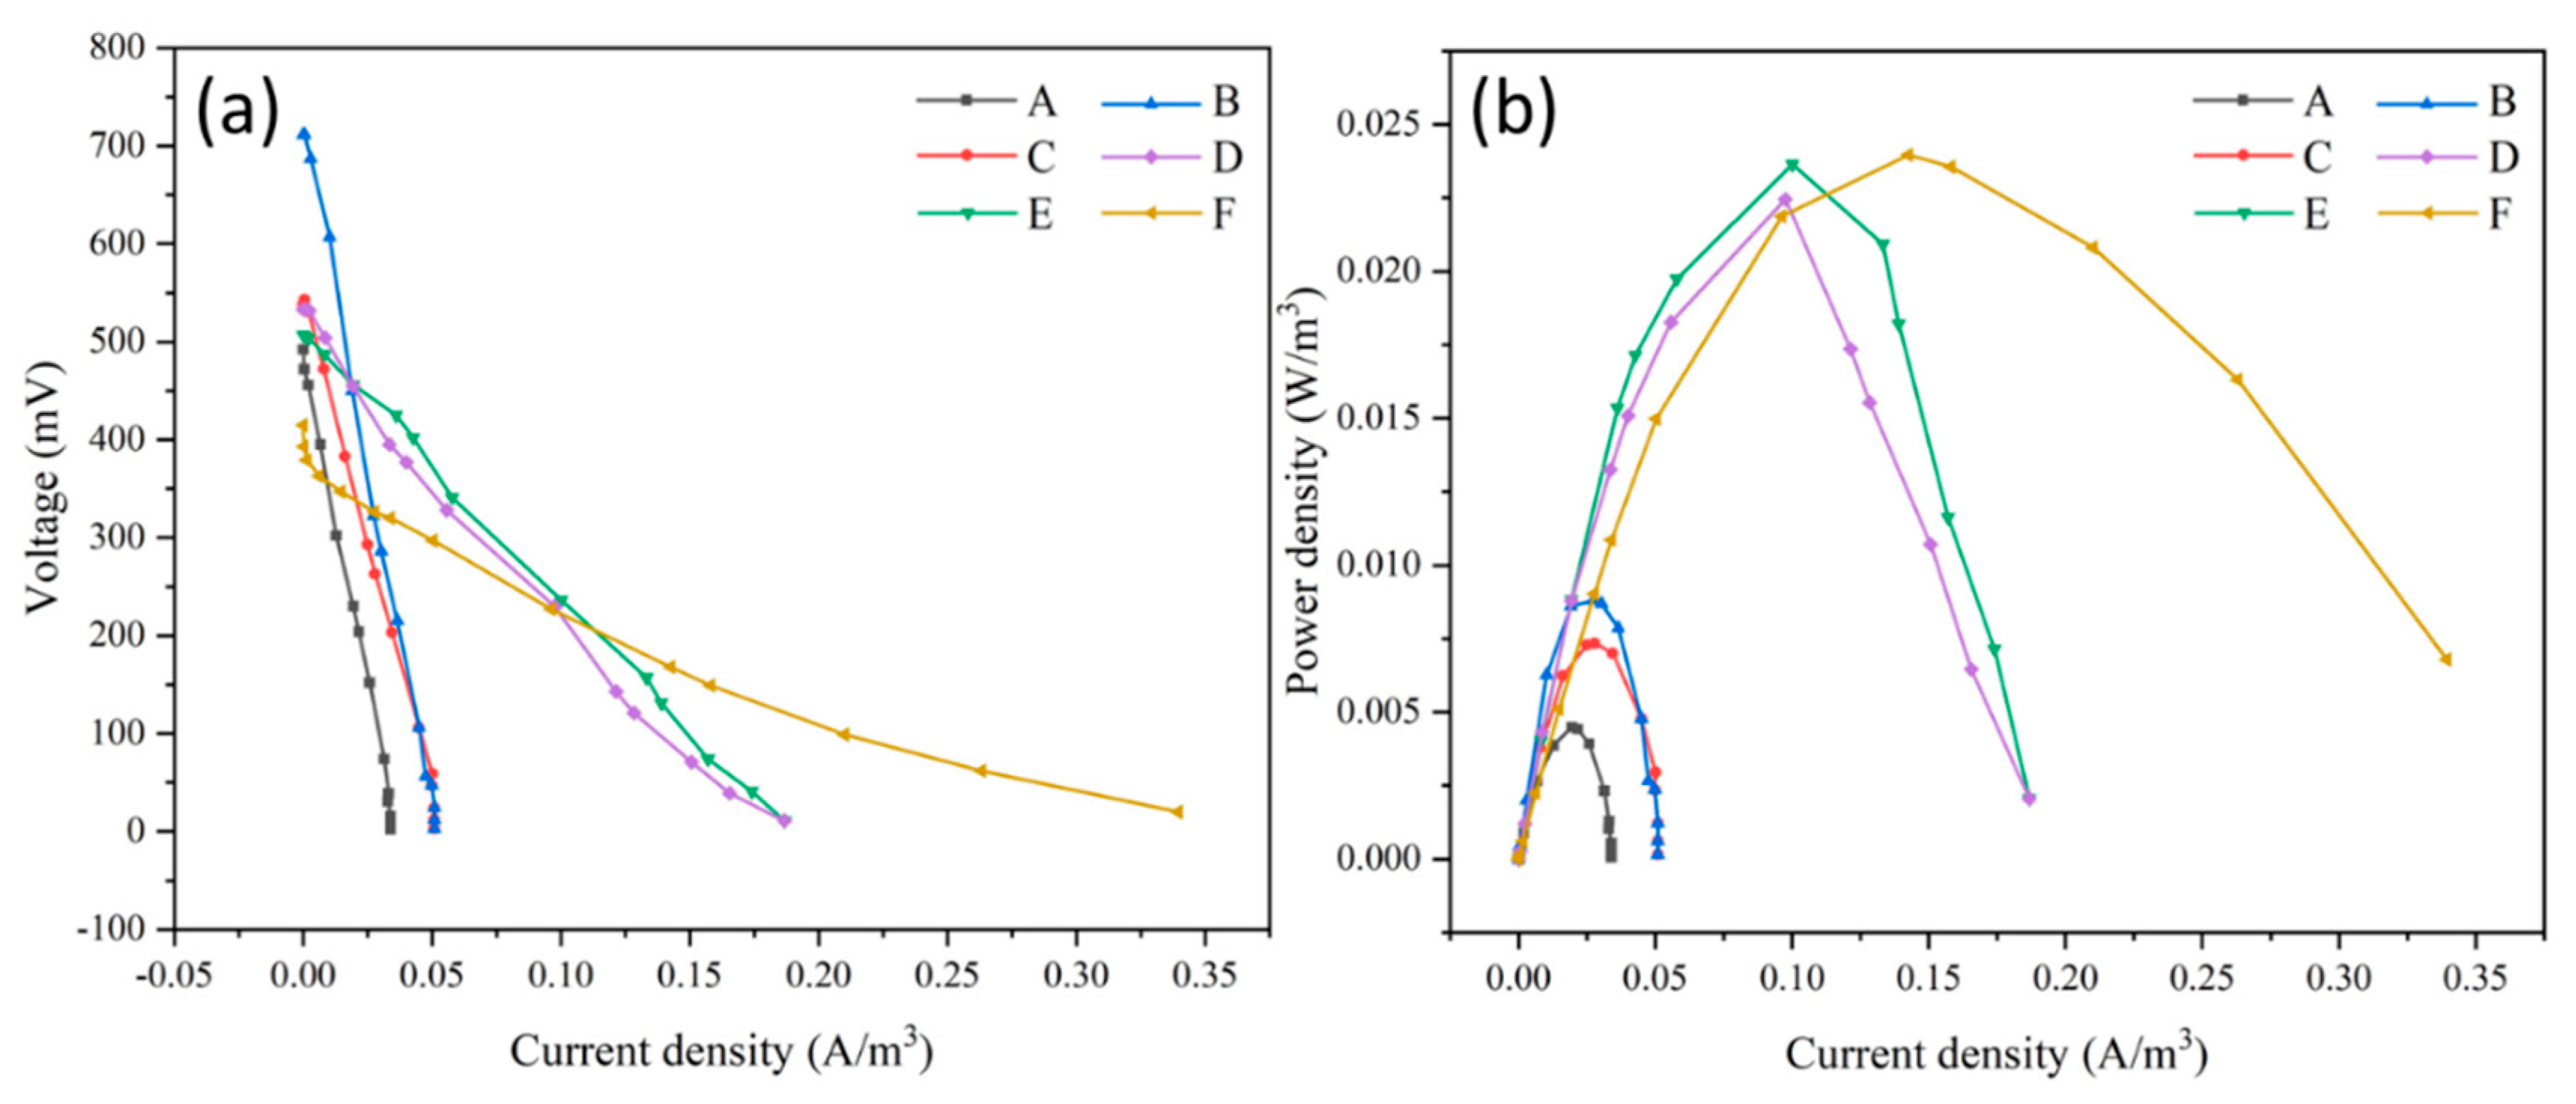
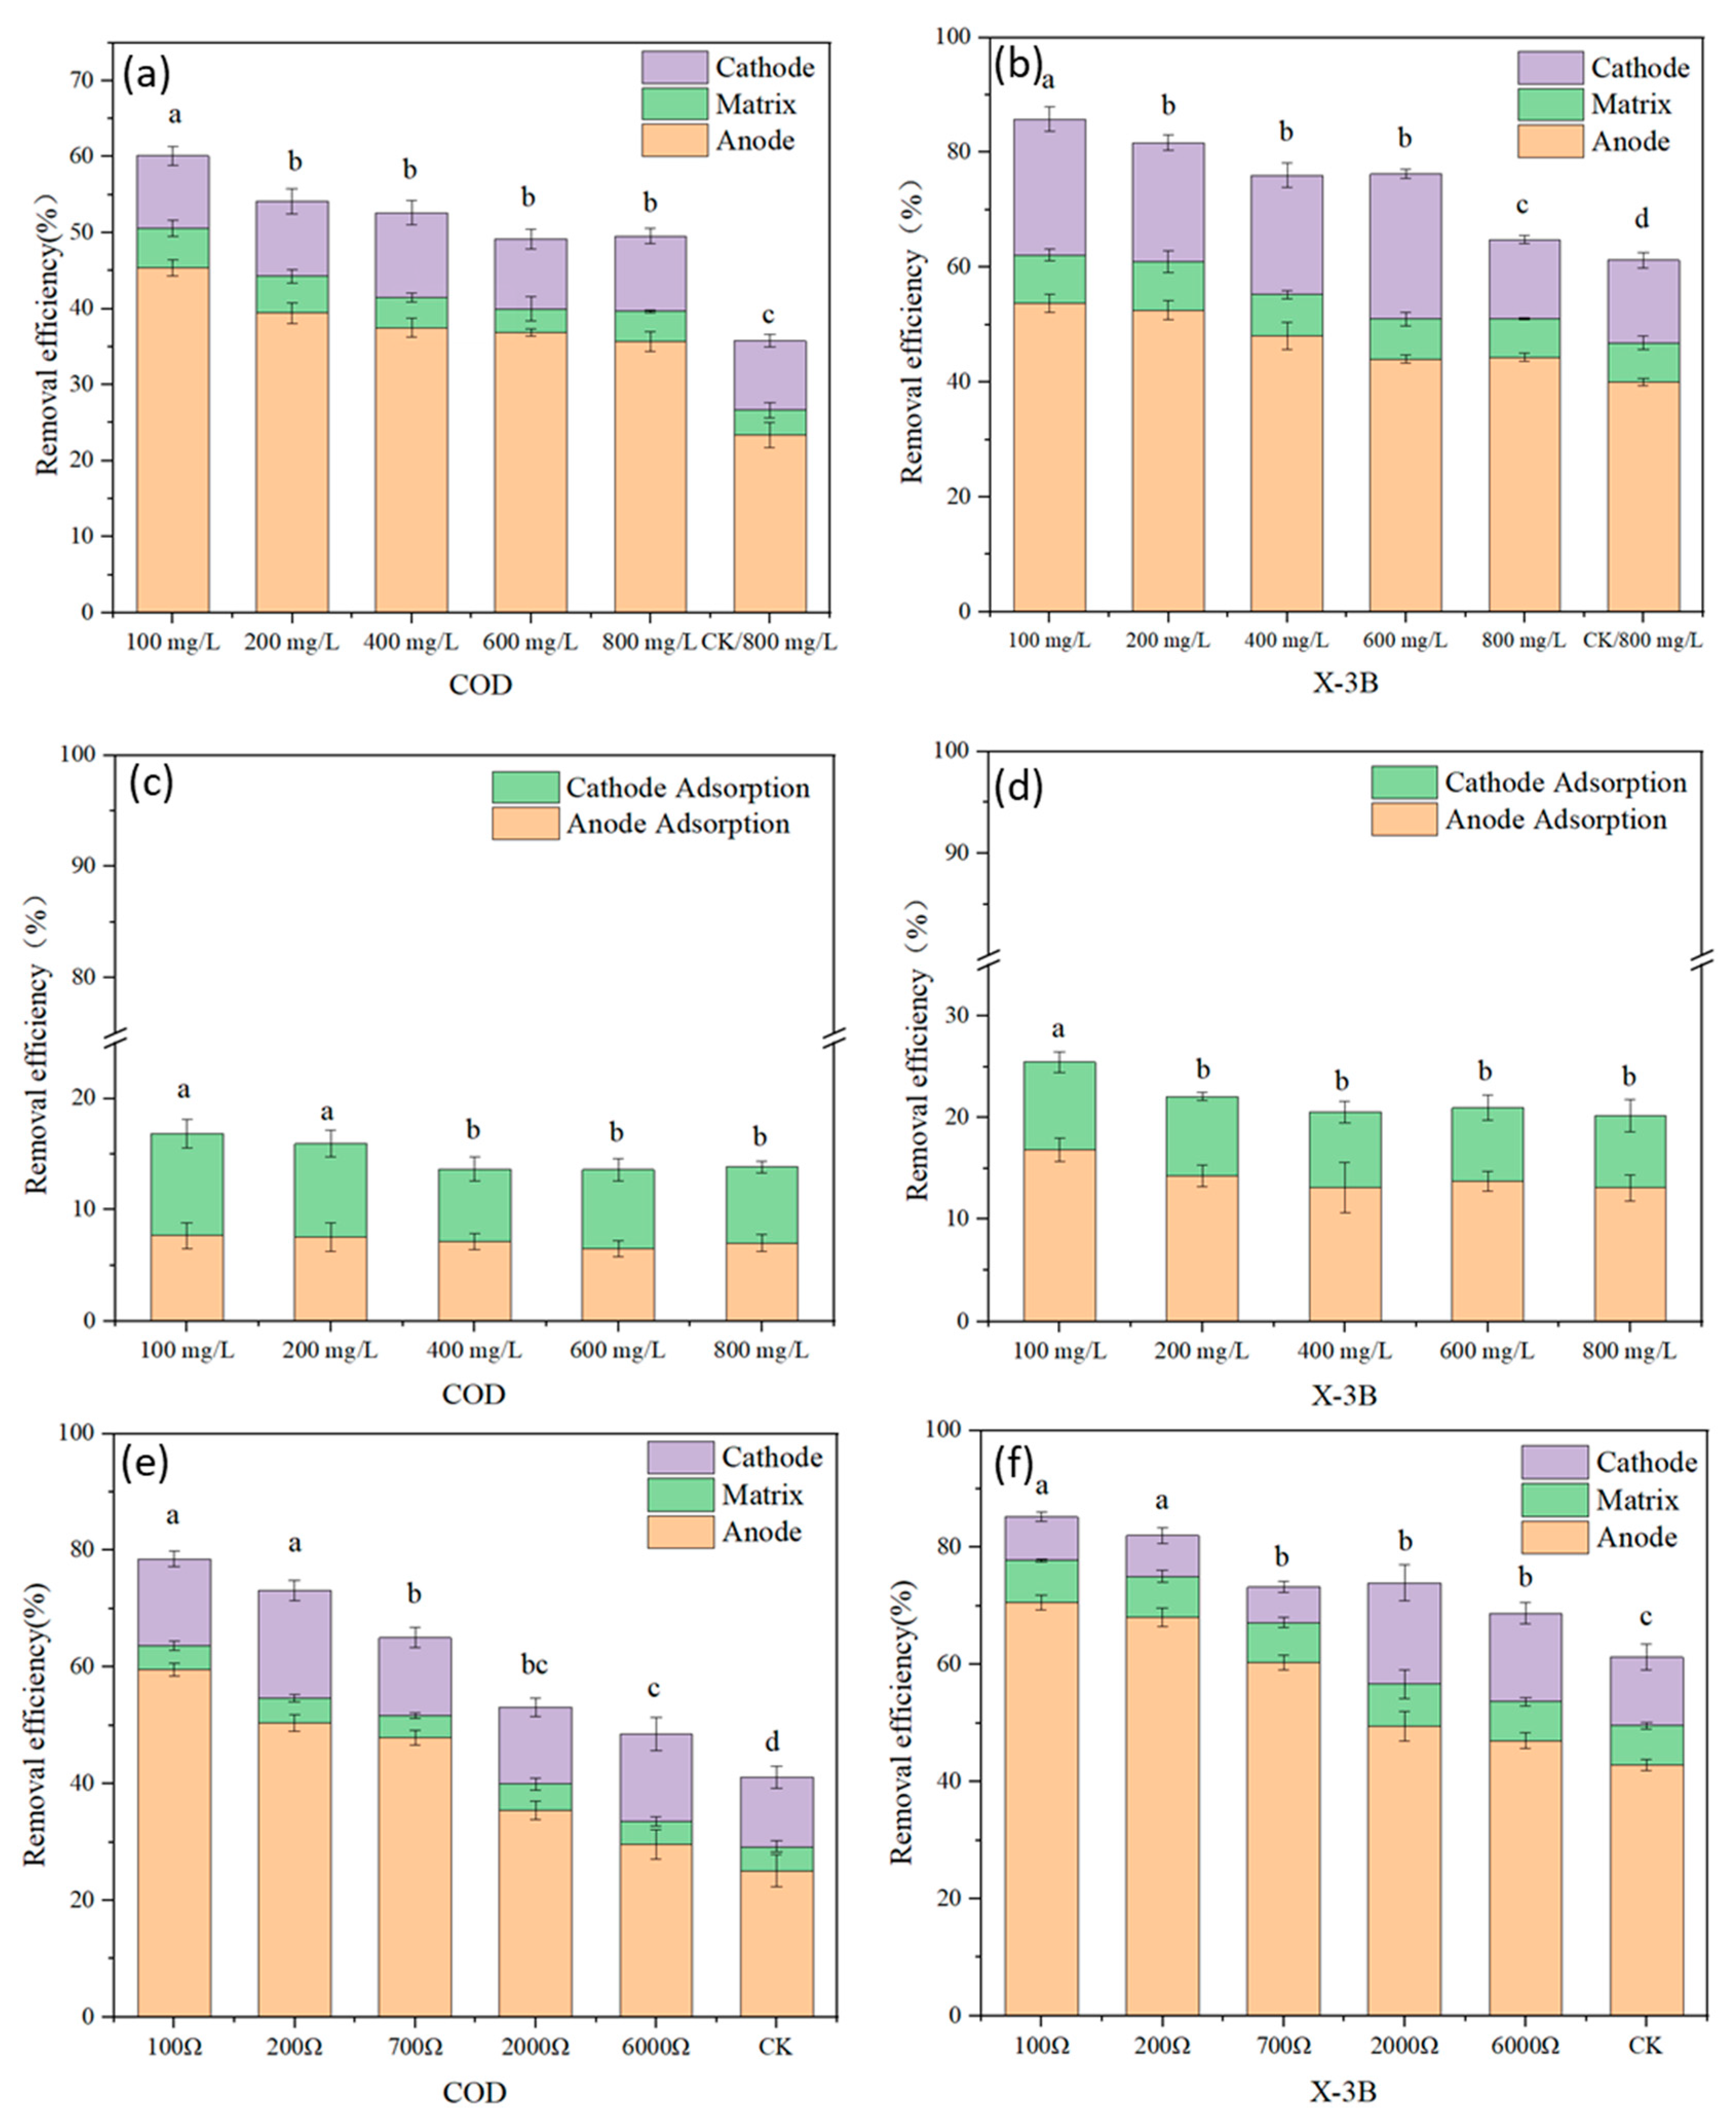
3.1. Electricity Production Performance and Removal Efficiency
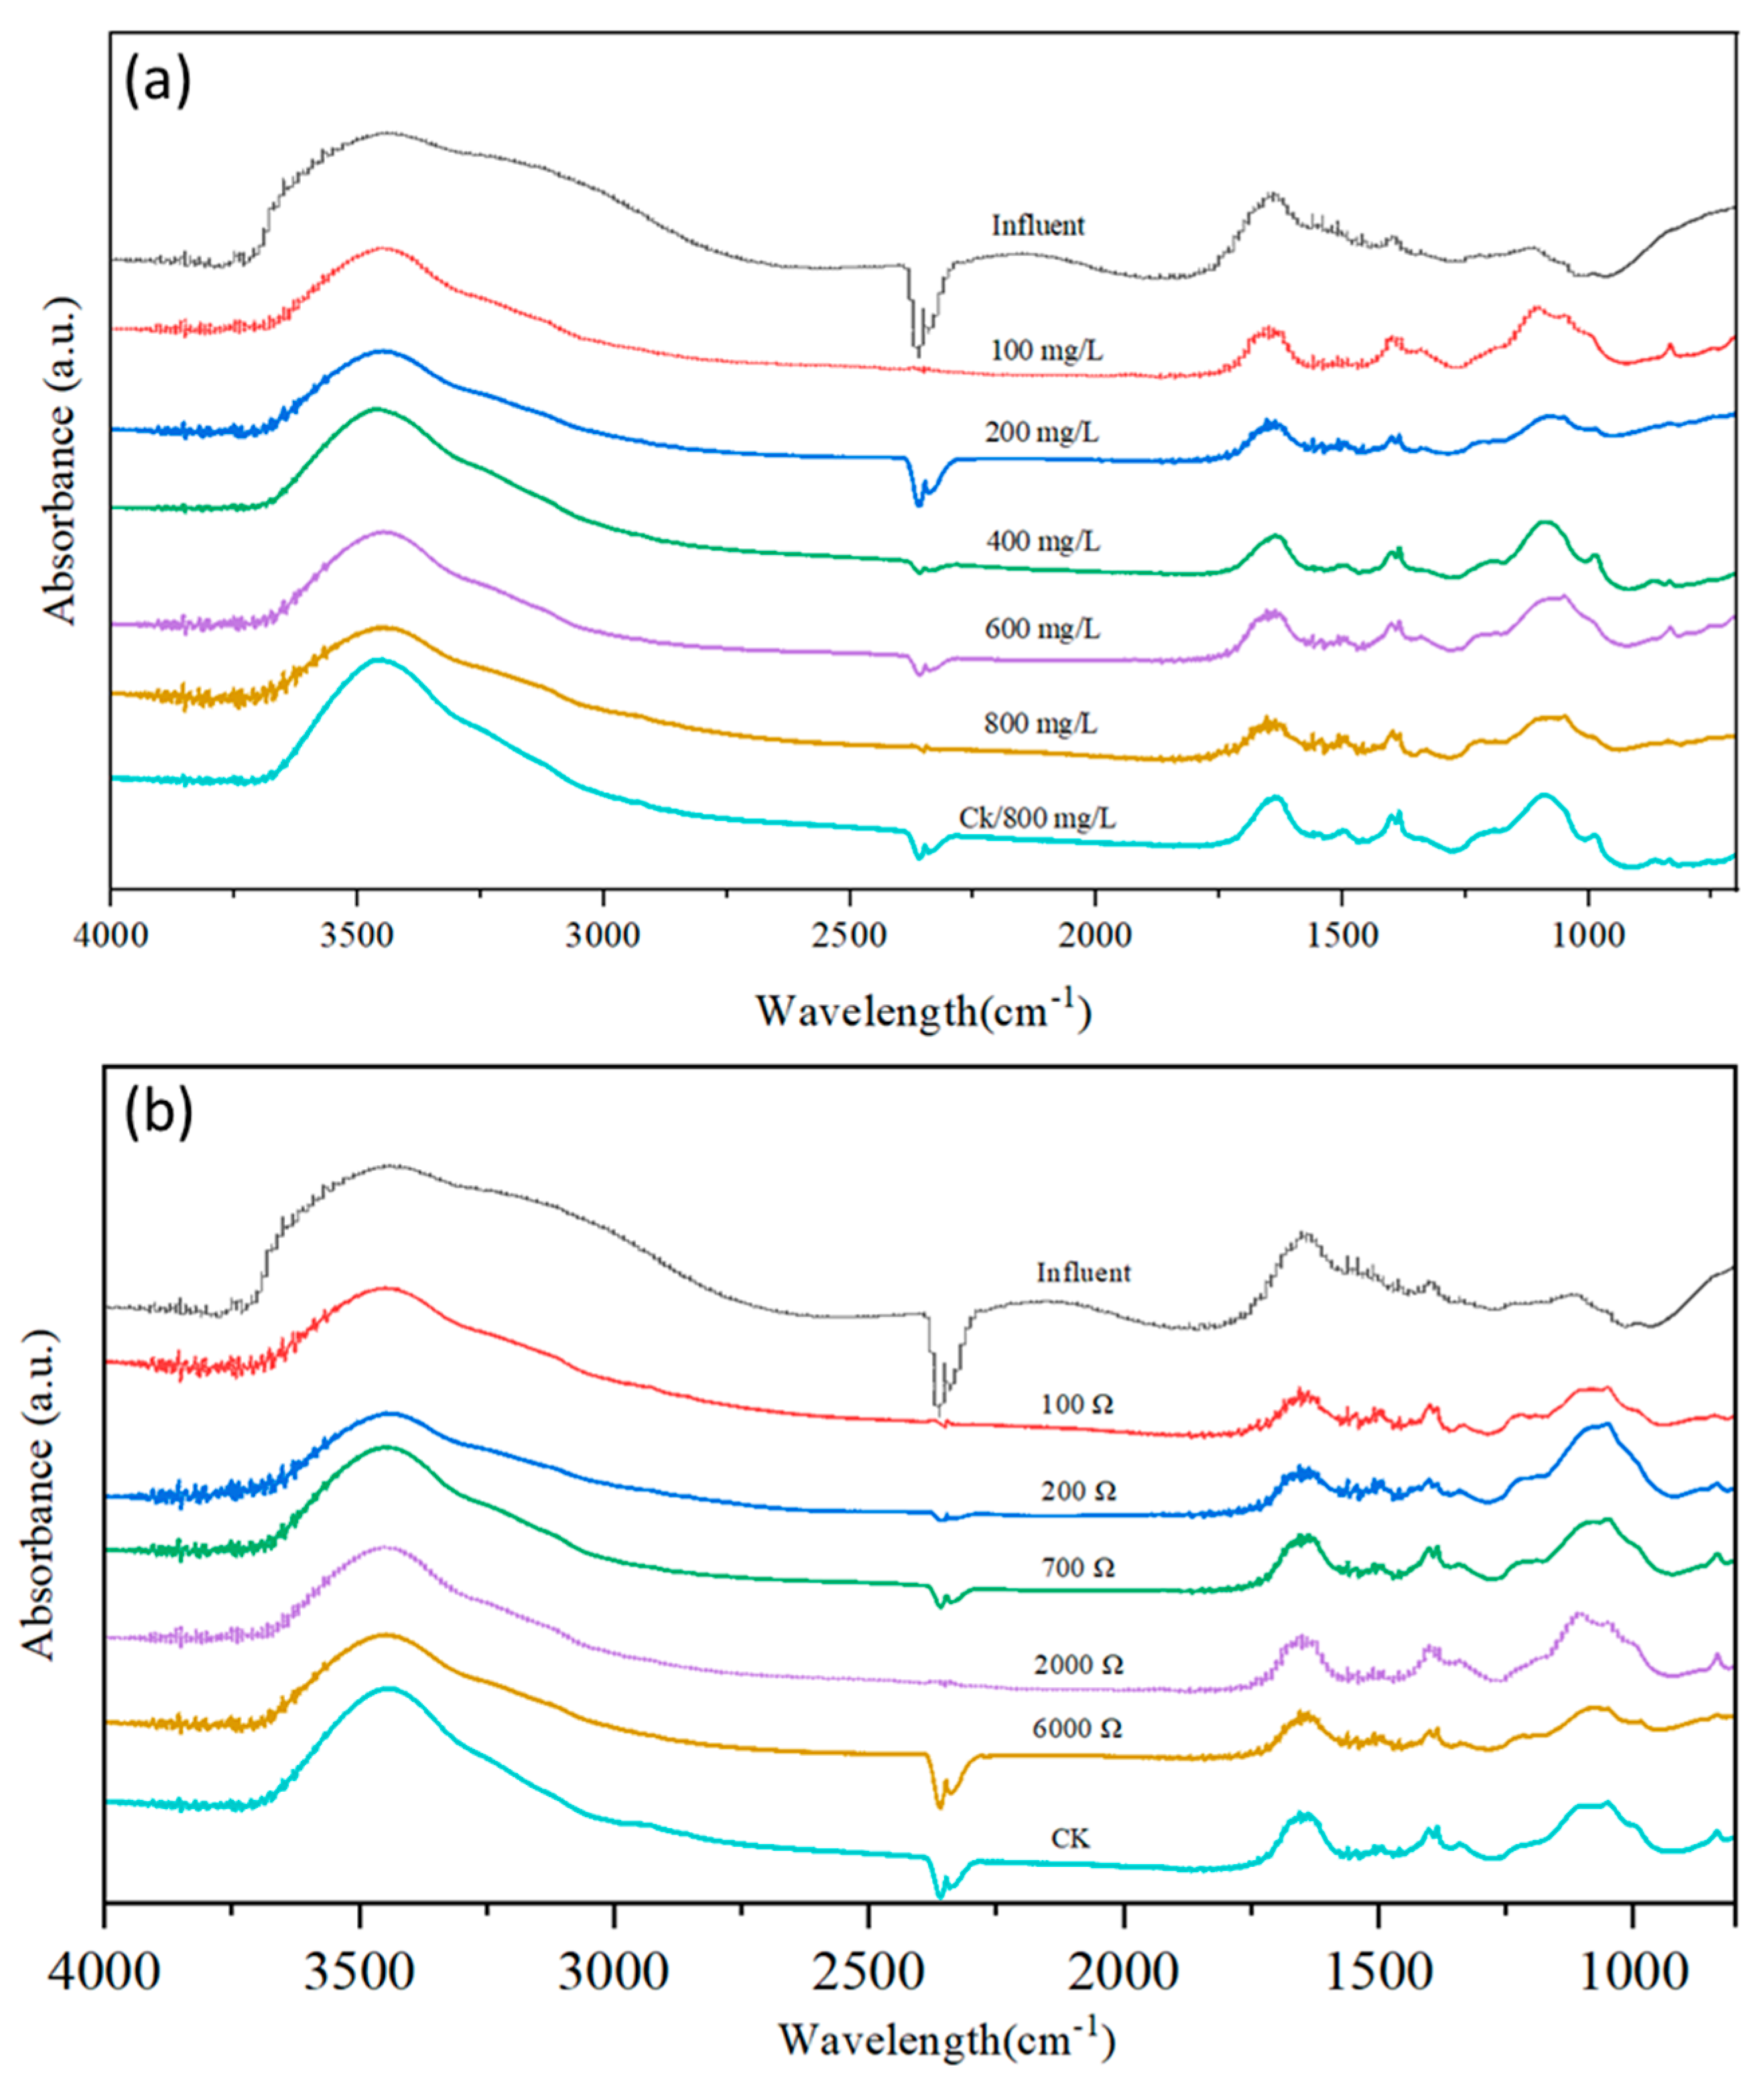
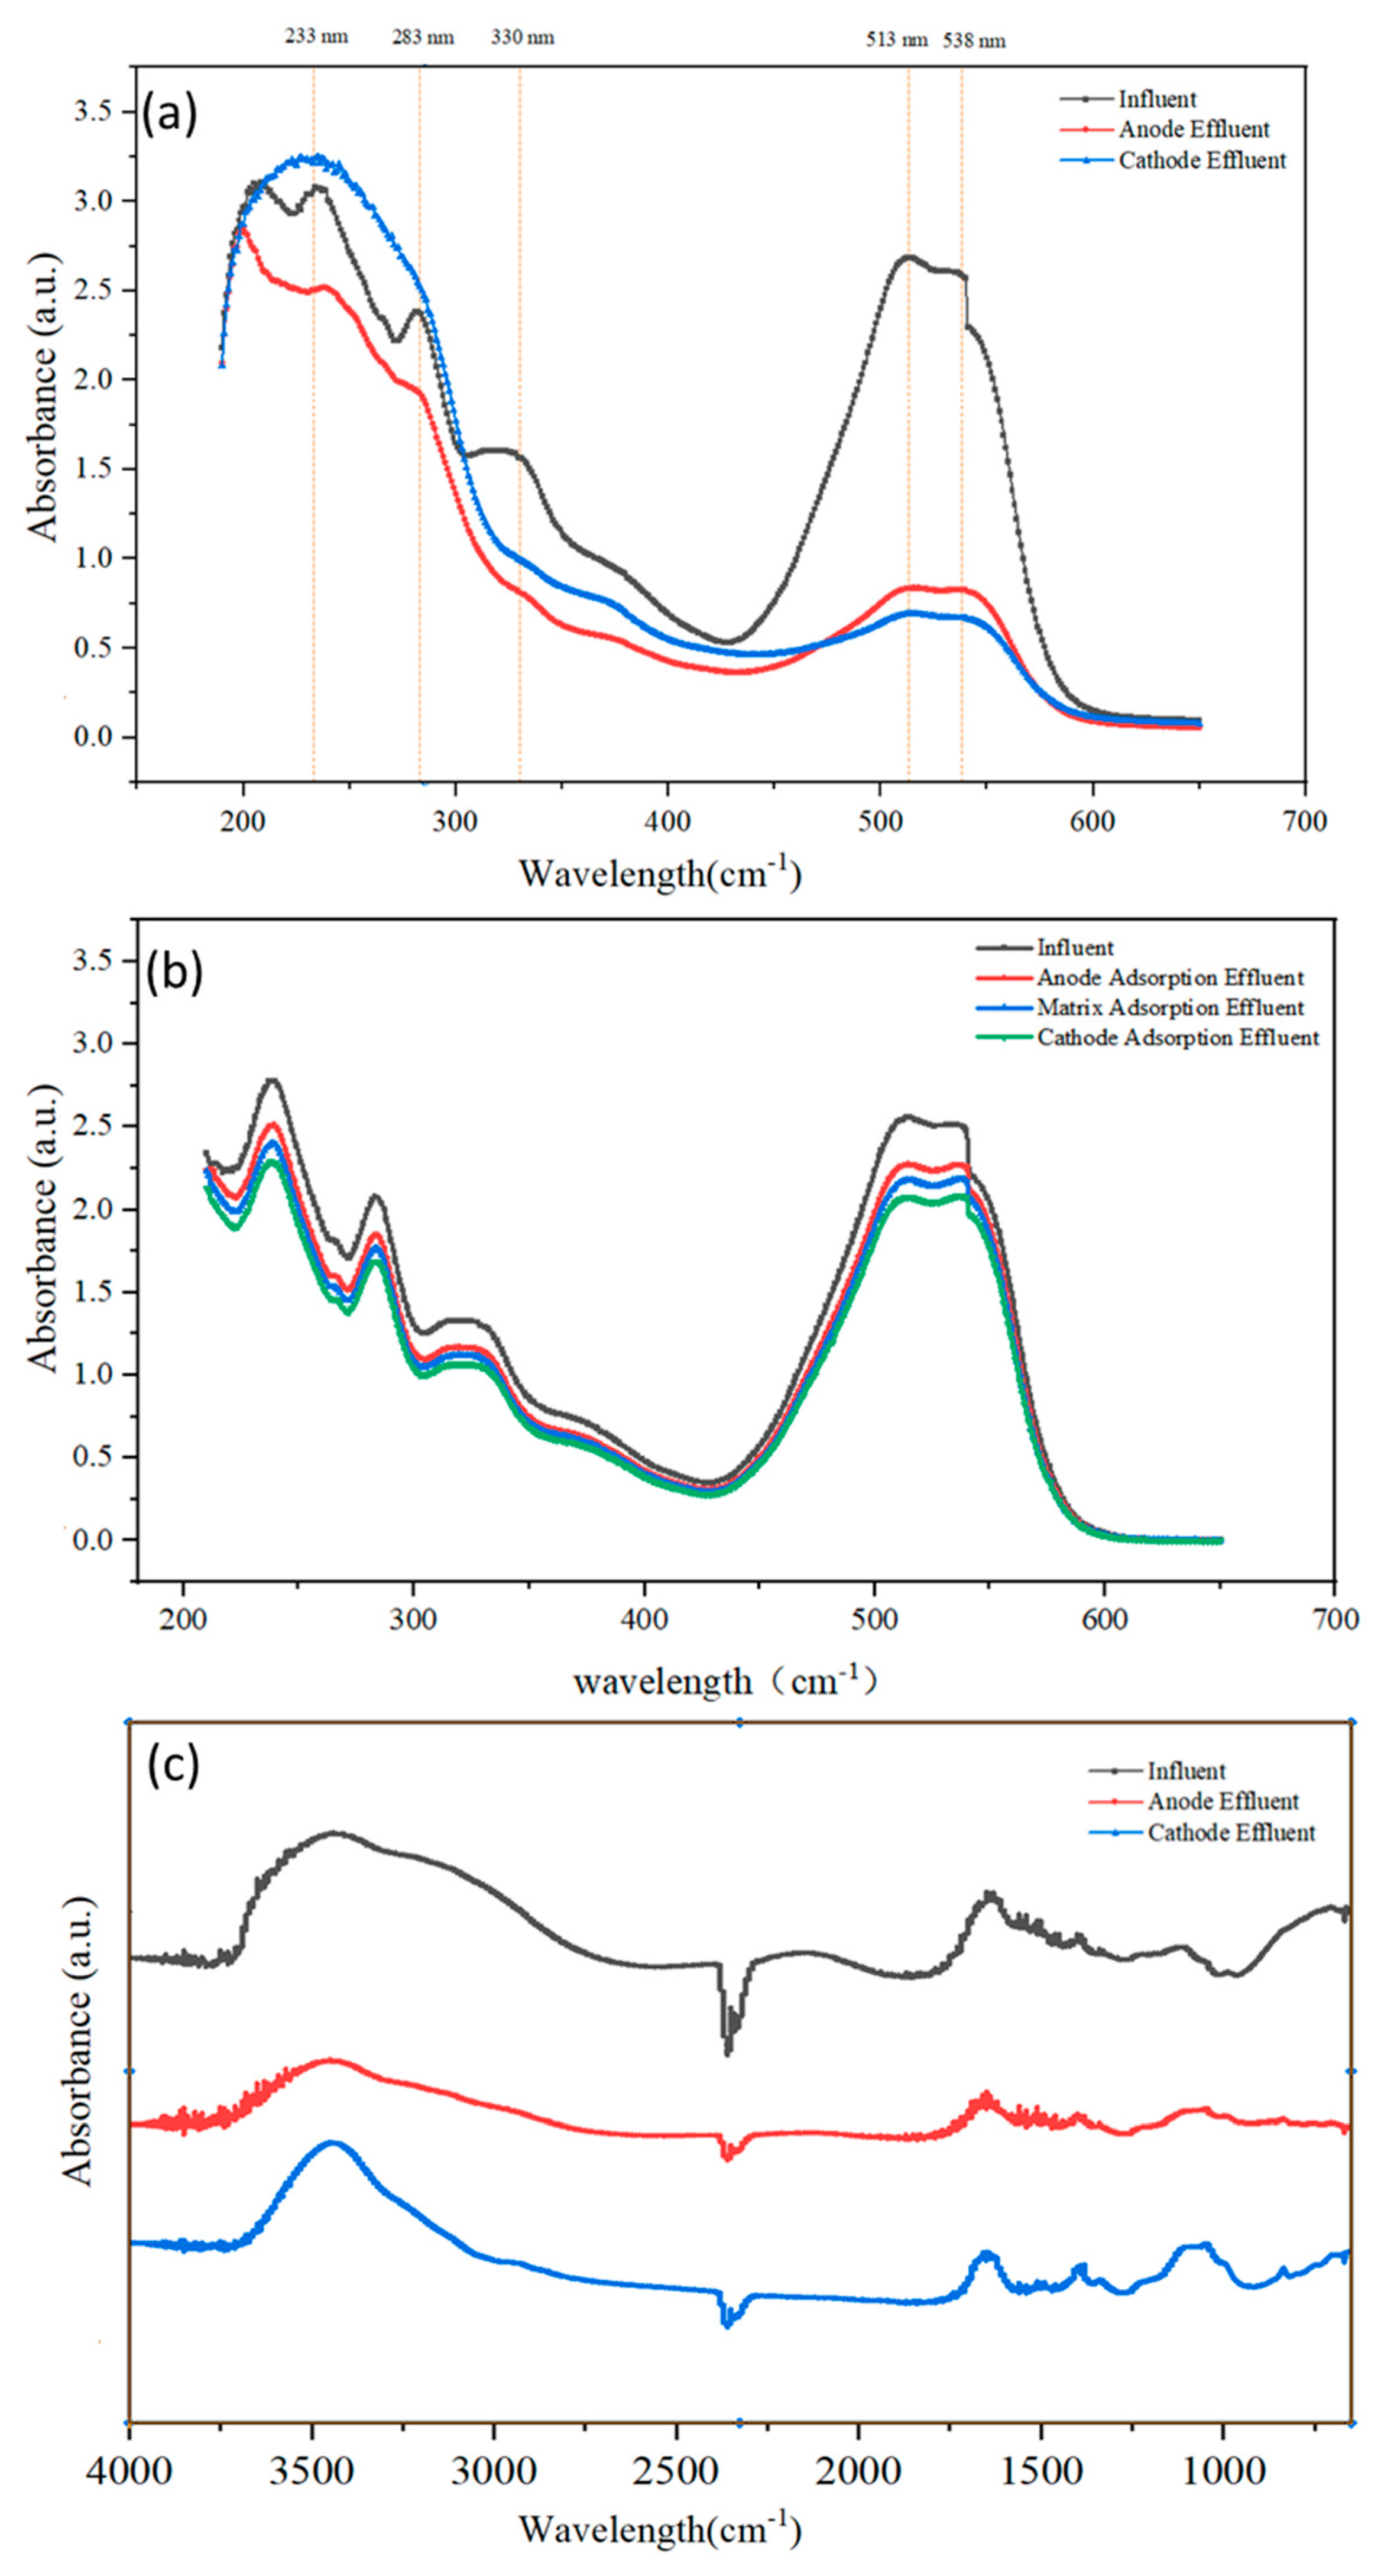
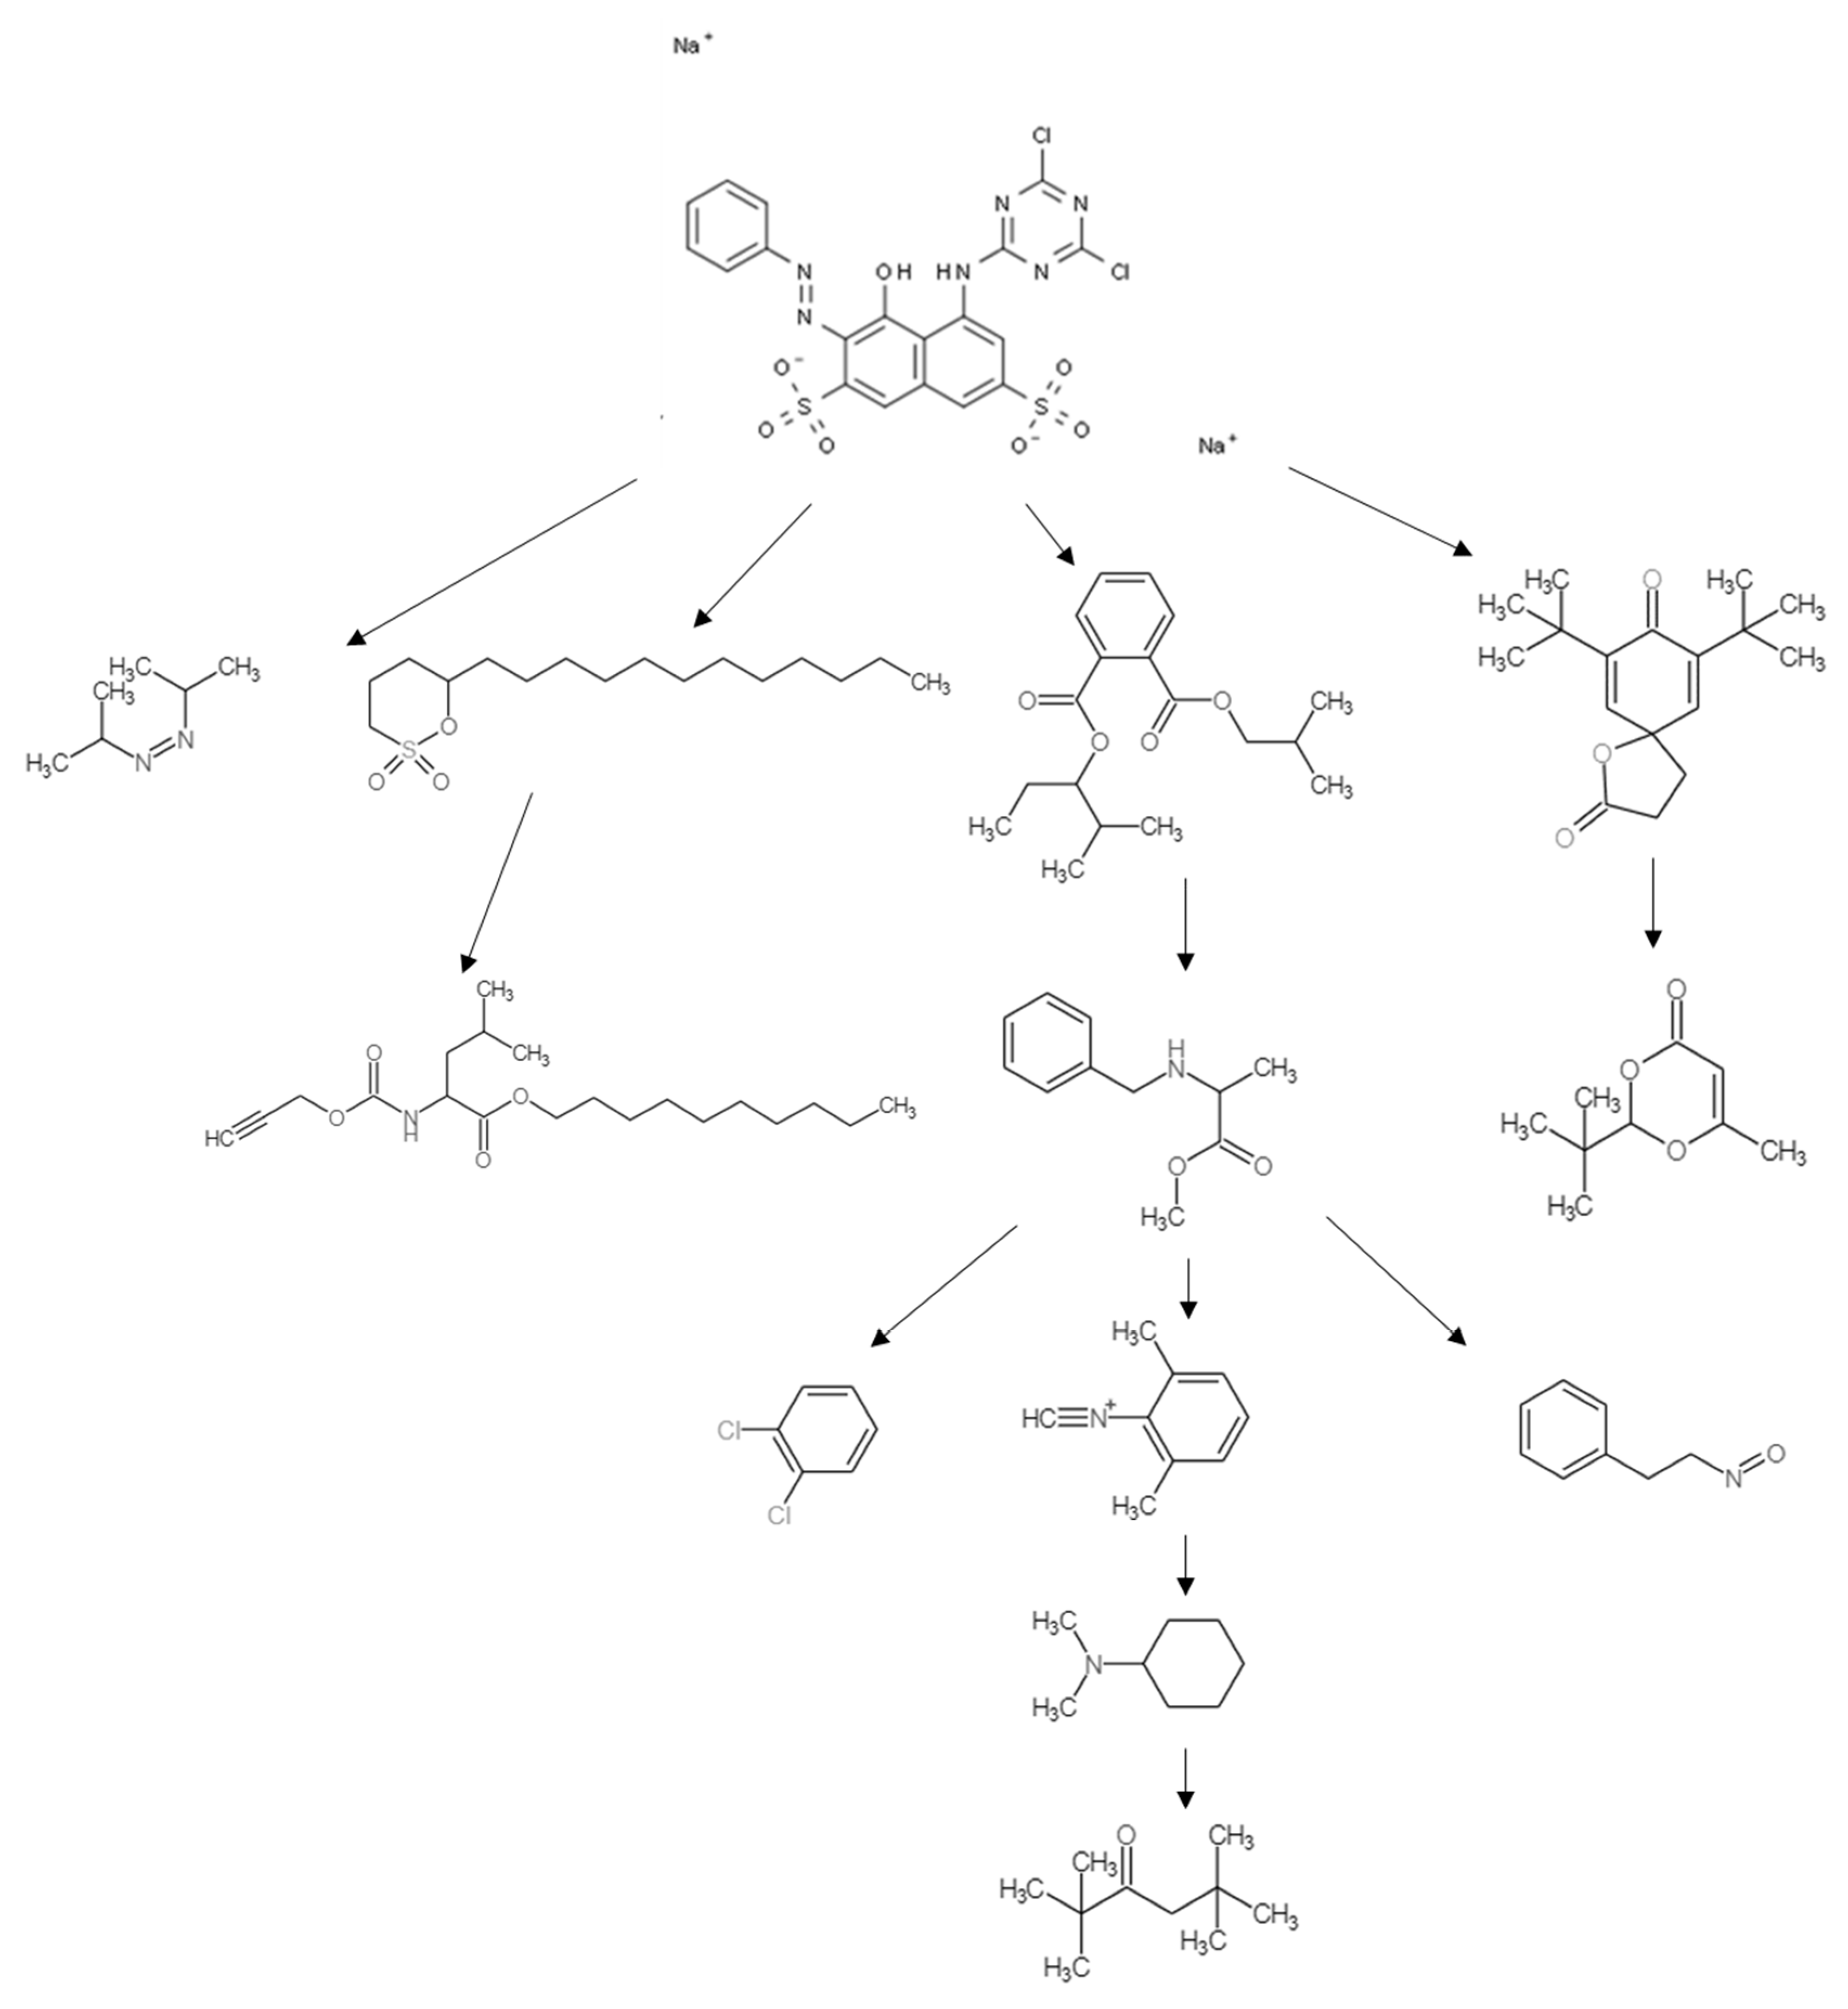
3.2. Intermediates and Degradation Pathways
3.3. Microbial Community Composition
3.4. Mechanism Analysis
4. Conclusions
Author Contributions
Funding
Data Availability Statement
Conflicts of Interest
References
- Verma, P.; Samanta, S.K. Microwave-enhanced advanced oxidation processes for the degradation of dyes in water. Environ. Chem. Lett. 2018, 16, 969–1007. [Google Scholar] [CrossRef]
- Zhang, C.; Chen, H.; Xue, G.; Liu, Y.; Chen, S.; Jia, C. A critical review of the aniline transformation fate in azo dye wastewater treatment. J. Clean. Prod. 2021, 321, 128971. [Google Scholar] [CrossRef]
- Su, L.; Fan, X.; Yin, T.; Chen, H.; Lin, X.; Yuan, C.; Fu, D. Increasing power density and dye decolorization of an X-3B-fed microbial fuel cell via TiO2 photocatalysis pretreatment. RSC Adv. 2015, 5, 83906–83913. [Google Scholar] [CrossRef]
- Cheng, G.; Zhang, Y.; Sun, L.; Wan, J.; Li, Z.; Dang, C.; Fu, J. Enhanced degradation of reactive brilliant red X-3B by photocatalysis integrated with micro-electrolysis. Environ. Sci. Pollut. Res. 2021, 28, 49899–49912. [Google Scholar] [CrossRef] [PubMed]
- Chen, L.; Jiang, L.; Gao, Y.; Pan, S.; Luan, H.; Zhang, G.; Xu, L.; Wang, M. Kinetic analysis of electron transfer process in decolorization of azo dyes by Shewanella combined with porous organic polymers in MFCs. Int. J. Hydrogen Energy 2024, 52, 1081–1091. [Google Scholar] [CrossRef]
- Meng, F.; Yu, L.; Song, B.; Zhao, Y.; Zhi, Z.; Lin, C.; Song, M. Insights into the mechanism of redox pairs and oxygen vacancies of Fe2O3@CoFe2O4 hybrids for efficient refractory organic pollutants degradation. Chemosphere 2022, 291, 133069. [Google Scholar] [CrossRef] [PubMed]
- McCorquodale-Bauer, K.; Grosshans, R.; Zvomuya, F.; Cicek, N. Critical review of phytoremediation for the removal of antibiotics and antibiotic resistance genes in wastewater. Sci. Total Environ. 2023, 870, 161876. [Google Scholar] [CrossRef]
- Varma, M.; Gupta, A.K.; Ghosal, P.S.; Majumder, A. A review on performance of constructed wetlands in tropical and cold climate: Insights of mechanism, role of influencing factors, and system modification in low temperature. Sci. Total Environ. 2021, 755, 142540. [Google Scholar] [CrossRef]
- Sethulekshmi, S.; Chakraborty, S. Textile wastewater treatment using horizontal flow constructed wetland and effect of length of flow in operation efficiency. J. Environ. Chem. Eng. 2021, 9, 106379. [Google Scholar] [CrossRef]
- Li, X.; Cheng, M.; Jiao, X.; Zhao, Z.; Zhang, Y.; Gao, X. Advances in microbial electrochemistry-enhanced constructed wetlands. World J. Microbiol. Biotechnol. 2022, 38, 239. [Google Scholar] [CrossRef]
- Xie, T.; Jing, Z.; Hu, J.; Yuan, P.; Liu, Y.; Cao, S. Degradation of nitrobenzene-containing wastewater by a microbial-fuel-cell-coupled constructed wetland. Ecol. Eng. 2018, 112, 65–71. [Google Scholar] [CrossRef]
- Yan, X.; Lee, H.-S.; Li, N.; Wang, X. The micro-niche of exoelectrogens influences bioelectricity generation in bioelectrochemical systems. Renew. Sustain. Energy Rev. 2020, 134, 110184. [Google Scholar] [CrossRef]
- Li, J.; Li, H.; Zheng, J.; Zhang, L.; Fu, Q.; Zhu, X.; Liao, Q. Response of anodic biofilm and the performance of microbial fuel cells to different discharging current densities. Bioresour. Technol. 2017, 233, 1–6. [Google Scholar] [CrossRef]
- Li, Y.; Yang, H.-Y.; Shen, J.-Y.; Mu, Y.; Yu, H.-Q. Enhancement of azo dye decolourization in a MFC-MEC coupled system. Bioresour. Technol. 2016, 202, 93–100. [Google Scholar] [CrossRef] [PubMed]
- Surti, P.; Kailasa, S.K.; Mungray, A.K. Enhancement of electrode properties using carbon dots functionalized magnetite nanoparticles for azo dye decolorization in microbial fuel cell. Chemosphere 2023, 313, 137601. [Google Scholar] [CrossRef]
- Li, R.; Li, T.; Wan, Y.; Zhang, X.; Liu, X.; Li, R.; Pu, H.; Gao, T.; Wang, X.; Zhou, Q. Efficient decolorization of azo dye wastewater with polyaniline/graphene modified anode in microbial electrochemical systems. J. Hazard. Mater. 2022, 421, 126740. [Google Scholar] [CrossRef]
- Mousavian, M.A.; Hosseini, S.; Ayati, B. Bioelectricity Generation and Decolorization of Reactive Blue 221 Using a Modified Cathode Dual-Chamber Microbial Fuel Cell. Water 2023, 15, 101. [Google Scholar] [CrossRef]
- Chaijak, P.; Rakkan, T.; Paichaid, N.; Thipraksa, J.; Michu, P.; Sangkharak, K. Exploring Potential Aspect of Microbial Fuel Cell (MFC) for Simultaneous Energy, Polyhydroxyalkanoate (PHA) Production and Textile Wastewater (TW) Treatment. J. Polym. Environ. 2024. [Google Scholar] [CrossRef]
- Piskin, E.D.; Genc, N. Multi response optimization of waste activated sludge oxidation and azo dye reduction in microbial fuel cell. Environ. Technol. 2023. [Google Scholar] [CrossRef]
- Sun, J.; Cai, B.; Zhang, Y.; Peng, Y.; Chang, K.; Ning, X.; Liu, G.; Yao, K.; Wang, Y.; Yang, Z.; et al. Regulation of biocathode microbial fuel cell performance with respect to azo dye degradation and electricity generation via the selection of anodic inoculum. Int. J. Hydrogen Energy 2016, 41, 5141–5150. [Google Scholar] [CrossRef]
- Biswas, A.; Chakraborty, S. Organics and coliform removal from low strength domestic wastewater using integrated constructed wetland-microbial fuel cell reactor with bioelectricity generation. J. Clean. Prod. 2023, 408, 137204. [Google Scholar] [CrossRef]
- Patel, D.; Bapodra, S.L.; Madamwar, D.; Desai, C. Electroactive bacterial community augmentation enhances the performance of a pilot scale constructed wetland microbial fuel cell for treatment of textile dye wastewater. Bioresour. Technol. 2021, 332, 125088. [Google Scholar] [CrossRef] [PubMed]
- Zhang, F.; Ge, Z.; Grimaud, J.; Hurst, J.; He, Z. Long-Term Performance of Liter-Scale Microbial Fuel Cells Treating Primary Effluent Installed in a Municipal Wastewater Treatment Facility. Environ. Sci. Technol. 2013, 47, 4941–4948. [Google Scholar] [CrossRef]
- Cao, X.; Wang, H.; Li, X.-q.; Fang, Z.; Li, X.-n. Enhanced degradation of azo dye by a stacked microbial fuel cell-biofilm electrode reactor coupled system. Bioresour. Technol. 2017, 227, 273–278. [Google Scholar] [CrossRef]
- Rathour, R.; Patel, D.; Shaikh, S.; Desai, C. Eco-electrogenic treatment of dyestuff wastewater using constructed wetland-microbial fuel cell system with an evaluation of electrode-enriched microbial community structures. Bioresour. Technol. 2019, 285, 121349. [Google Scholar] [CrossRef]
- Li, X.; Dai, H.; Han, T.; Guo, Z.; Li, H.; Wang, X.; Abbasi, H.N. Construction of double tube granular sludge microbial fuel cell and its characteristics and mechanism of azo dye degradation. Environ. Sci. Pollut. Res. 2022, 29, 54606–54618. [Google Scholar] [CrossRef] [PubMed]
- Thung, W.-E.; Ong, S.-A.; Ho, L.-N.; Wong, Y.-S.; Ridwan, F.; Oon, Y.-L.; Oon, Y.-S.; Lehl, H.K. A highly efficient single chambered up-flow membrane-less microbial fuel cell for treatment of azo dye Acid Orange 7-containing wastewater. Bioresour. Technol. 2015, 197, 284–288. [Google Scholar] [CrossRef]
- Sonu, K.; Sogani, M.; Syed, Z. Integrated Constructed Wetland-Microbial Fuel Cell using Biochar as Wetland Matrix: Influence on Power Generation and Textile Wastewater Treatment. Chemistryselect 2021, 6, 8323–8328. [Google Scholar] [CrossRef]
- Meng, F.; Song, M.; Chen, Y.; Wei, Y.; Song, B.; Cao, Q. Promoting adsorption of organic pollutants via tailoring surface physicochemical properties of biomass-derived carbon-attapulgite. Environ. Sci. Pollut. Res. 2021, 28, 11106–11118. [Google Scholar] [CrossRef]
- Fang, J.H.; Dong, J.Y.; Li, C.C.; Chen, H.; Wang, L.F.; Lyu, T.S.; He, H.; Liu, J. Response of microbial community composition and function to emergent plant rhizosphere of a constructed wetland in northern China. Appl. Soil Ecol. 2021, 168, 104141. [Google Scholar] [CrossRef]
- Han, Q.; Dong, W.; Wang, H.; Liu, T.; Sun, F.; Ying, Y.; Yan, X. Effects of coexisting anions on decolorization of azo dye X-3B by ferrate(VI) and a comparative study between ferrate(VI) and potassium permanganate. Sep. Purif. Technol. 2013, 108, 74–82. [Google Scholar] [CrossRef]
- Guo, G.; Li, X.; Tian, F.; Liu, T.; Yang, F.; Ding, K.; Liu, C.; Chen, J.; Wang, C. Azo dye decolorization by a halotolerant consortium under microaerophilic conditions. Chemosphere 2020, 244, 125510. [Google Scholar] [CrossRef]
- Prasad, A.S.A.; Rao, K.V.B. Aerobic biodegradation of azo dye Acid Black-24 by Bacillus halodurans. J. Environ. Biol. 2014, 35, 549–554. [Google Scholar]
- Shahi, A.; Velayudhaperumal Chellam, P.; Verma, A.; Singh, R.S. A comparative study on the performance of microbial fuel cell for the treatment of reactive orange 16 dye using mixed and pure bacterial species and its optimization using response surface methodology. Sustain. Energy Technol. Assess. 2021, 48, 101667. [Google Scholar] [CrossRef]
- Zhu, Y.; Cao, X.; Cheng, Y.; Zhu, T. Performances and structures of functional microbial communities in the mono azo dye decolorization and mineralization stages. Chemosphere 2018, 210, 1051–1060. [Google Scholar] [CrossRef] [PubMed]
- Mao, Y.P.; Tao, Y.; Shen, Z.P.; Lei, Y.M.; Wang, W.H. Degradation Mechanism of Reactive Brilliant Red X-3B by Fenton Process. Environ. Sci. Technol. 2009, 32, 67–70. [Google Scholar]
- He, Y.; Gao, J.-F.; Feng, F.-Q.; Liu, C.; Peng, Y.-Z.; Wang, S.-Y. The comparative study on the rapid decolorization of azo, anthraquinone and triphenylmethane dyes by zero-valent iron. Chem. Eng. J. 2012, 179, 8–18. [Google Scholar] [CrossRef]
- Lu, J.; Ayele, B.A.; Liu, X.; Chen, Q. Electrochemical removal of RRX-3B in residual dyeing liquid with typical engineered carbonaceous cathodes. J. Environ. Manag. 2021, 280, 111669. [Google Scholar] [CrossRef] [PubMed]
- Gao, X.; Zhang, L.; Sun, M.; Xiao, Y.; Su, J. Fast zero-order hydro-cracking reaction of X-3B over crystal Al-Fe alloys: Effect of electrochemical corrosion behaviors. Mater. Des. 2016, 109, 570–579. [Google Scholar] [CrossRef]
- Wang, Z.; Zhang, Y.; Li, K.; Sun, Z.; Wang, J. Enhanced mineralization of reactive brilliant red X-3B by UV driven photocatalytic membrane contact ozonation. J. Hazard. Mater. 2020, 391, 122194. [Google Scholar] [CrossRef]
- Ruan, X.-C.; Liu, M.-Y.; Zeng, Q.-F.; Ding, Y.-H. Degradation and decolorization of reactive red X-3B aqueous solution by ozone integrated with internal micro-electrolysis. Sep. Purif. Technol. 2010, 74, 195–201. [Google Scholar] [CrossRef]
- Cao, Z.; Zhang, J.; Zhang, J.; Zhang, H. Degradation pathway and mechanism of Reactive Brilliant Red X-3B in electro-assisted microbial system under anaerobic condition. J. Hazard. Mater. 2017, 329, 159–165. [Google Scholar] [CrossRef] [PubMed]
- Zhang, K.; Wu, X.; Wang, W.; Luo, H.; Chen, W.; Ma, D.; Mo, Y.; Chen, J.; Li, L. Effects of plant location on methane emission, bioelectricity generation, pollutant removal and related biological processes in microbial fuel cell constructed wetland. J. Water Process Eng. 2021, 43, 102283. [Google Scholar] [CrossRef]
- Oon, Y.-L.; Ong, S.-A.; Ho, L.-N.; Wong, Y.-S.; Dahalan, F.A.; Oon, Y.-S.; Lehl, H.K.; Thung, W.-E. Synergistic effect of up-flow constructed wetland and microbial fuel cell for simultaneous wastewater treatment and energy recovery. Bioresour. Technol. 2016, 203, 190–197. [Google Scholar] [CrossRef]
- Nishio, Y.; Nguyen, D.-T.; Taguchi, K. Urethane-based electrode material for microbial fuel cells. Energy Rep. 2023, 9, 66–73. [Google Scholar] [CrossRef]
- Basu, A.; Manna, S.; Kumar Sil, A. A new electro-active bacterium, Paraclostridium sp. AKS46, converts waste efficiently into electricity in microbial fuel cell. Chem. Eng. J. 2023, 475, 145626. [Google Scholar] [CrossRef]
- Guo, J.; Li, Q.; Gao, Q.; Shen, F.; Yang, Y.; Zhang, X.; Luo, H. Comparative study on the treatment of swine wastewater by VFCW-MFC and VFCW: Pollutants removal, electricity generation, microorganism community. J. Environ. Manag. 2023, 342, 118299. [Google Scholar] [CrossRef]
- Song, Y.; Li, H.; Han, Y.; Lu, C.; Hou, Y.; Zhang, Y.; Guo, J. Landfill leachate as an additional substance in the Johannesburg-Sulfur autotrophic denitrification system in the treatment of municipal wastewater with low strength and low COD/TN ratio. Bioresour. Technol. 2020, 295, 122287. [Google Scholar] [CrossRef] [PubMed]
- Zang, L.; Yang, X.-L.; Xu, H.; Deng, Y.-J.; Yue, Z.-X.; Song, H.-L. Alleviating membrane fouling by enhanced bioelectricity generation via internal reflux of sludge mixed liquor in microbial fuel cell-membrane bioreactor (MFC-MBR) coupling system. J. Membr. Sci. 2023, 673, 121495. [Google Scholar] [CrossRef]
- Guo, H.; Xie, S.; Deng, H.; Geng, X.; Wang, P.; Huang, C.; Tang, S. Electricity production and bacterial communities of microbial fuel cell supplied with oily sludge. Environ. Prog. Sustain. Energy 2020, 39, e13409. [Google Scholar] [CrossRef]
- Liu, S.-H.; Huang, W.-J.; Lin, C.-W.; Zhu, T.-J. Copper removal and microbial community analysis in a single medium sediment microbial fuel cell. J. Water Process Eng. 2021, 44, 102348. [Google Scholar] [CrossRef]
- Liu, X.; Xu, Q.; Wang, D.; Wu, Y.; Yang, Q.; Liu, Y.; Wang, Q.; Li, X.; Li, H.; Zeng, G.; et al. Unveiling the mechanisms of how cationic polyacrylamide affects short-chain fatty acids accumulation during long-term anaerobic fermentation of waste activated sludge. Water Res. 2019, 155, 142–151. [Google Scholar] [CrossRef] [PubMed]
- Amanze, C.; Zheng, X.; Anaman, R.; Wu, X.; Fosua, B.A.; Xiao, S.; Xia, M.; Ai, C.; Yu, R.; Wu, X.; et al. Effect of nickel (II) on the performance of anodic electroactive biofilms in bioelectrochemical systems. Water Res. 2022, 222, 118889. [Google Scholar] [CrossRef]
- Rago, L.; Monpart, N.; Cortes, P.; Baeza, J.A.; Guisasola, A. Performance of microbial electrolysis cells with bioanodes grown at different external resistances. Water Sci. Technol. 2016, 73, 1129–1135. [Google Scholar] [CrossRef] [PubMed]
- Ma, J.; Li, L.; Zhao, Q.; Yu, L.; Frear, C. Biomethane production from whole and extracted algae biomass: Long-term performance evaluation and Microb. community dynamics. Renew. Energy 2021, 170, 38–48. [Google Scholar] [CrossRef]
- Guo, W.; Feng, J.; Song, H.; Sun, J. Simultaneous bioelectricity generation and decolorization of methyl orange in a two-chambered microbial fuel cell and bacterial diversity. Environ. Sci. Pollut. Res. 2014, 21, 11531–11540. [Google Scholar] [CrossRef] [PubMed]
- Kook, L.; Kanyo, N.; Devenyi, F.; Bakonyi, P.; Rozsenberszki, T.; Belafi-Bako, K.; Nemestothy, N. Improvement of waste-fed bioelectrochemical system performance by selected electro-active microbes: Process evaluation and a kinetic study. Biochem. Eng. J. 2018, 137, 100–107. [Google Scholar] [CrossRef]
- Wang, J.; Song, X.; Li, Q.; Bai, H.; Zhu, C.; Weng, B.; Yan, D.; Bai, J. Bioenergy generation and degradation pathway of phenanthrene and anthracene in a constructed wetland-microbial fuel cell with an anode amended with nZVI. Water Res. 2019, 150, 340–348. [Google Scholar] [CrossRef] [PubMed]
- Gu, M.; Yin, Q.; Wang, Z.; He, K.; Wu, G. Color and nitrogen removal from synthetic dye wastewater in an integrated mesophilic hydrolysis/acidification and multiple anoxic/aerobic process. Chemosphere 2018, 212, 881–889. [Google Scholar] [CrossRef] [PubMed]
- Ravadelli, M.; da Costa, R.E.; Lobo-Recio, M.A.; Vitor Akaboci, T.R.; Bassin, J.P.; Lapolli, F.R.; Belli, T.J. Anoxic/oxic membrane bioreactor assisted by electrocoagulation for the treatment of azo-dye containing wastewater. J. Environ. Chem. Eng. 2021, 9, 105286. [Google Scholar] [CrossRef]
- Tao, M.; Jing, Z.; Tao, Z.; Luo, H.; Zuo, S.; Li, Y.-Y. Efficient nitrogen removal in microbial fuel cell-constructed wetland with corncobs addition for secondary effluent treatment. J. Clean. Prod. 2022, 332, 130108. [Google Scholar] [CrossRef]
- Meng, L.; Xie, L.; Hirose, Y.; Nishiuchi, T.; Yoshida, N. Reduced graphene oxide increases cells with enlarged outer membrane of Citrifermentans bremense and exopolysaccharides secretion. Biosens. Bioelectron. 2022, 218, 114754. [Google Scholar] [CrossRef] [PubMed]
- Chen, Y.-Y.; Yang, F.-Q.; Xu, N.; Wang, X.-Q.; Xie, P.-C.; Wang, Y.-Z.; Fang, Z.; Yong, Y.-C. Engineered cytochrome fused extracellular matrix enabled efficient extracellular electron transfer and improved performance of microbial fuel cell. Sci. Total Environ. 2022, 830, 154806. [Google Scholar] [CrossRef] [PubMed]


| Serial Number | Molecular Formula | Structural Formula |
|---|---|---|
| 1 | C17H24O3 | 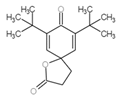 |
| 2 | C18H26O4 | 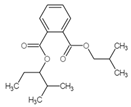 |
| 3 | C9H9NO |  |
| 4 | C11H15NO2 | 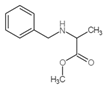 |
| 5 | C9H14O3 | 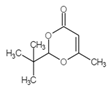 |
| 6 | C8H17N |  |
| 7 | C9H9N |  |
| 8 | C20H35NO4 |  |
| 9 | C6H4C12 |  |
| 10 | C16H32O3S | 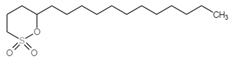 |
| 11 | C10H20O |  |
| 12 | C7H14N2 |  |
Disclaimer/Publisher’s Note: The statements, opinions and data contained in all publications are solely those of the individual author(s) and contributor(s) and not of MDPI and/or the editor(s). MDPI and/or the editor(s) disclaim responsibility for any injury to people or property resulting from any ideas, methods, instructions or products referred to in the content. |
© 2024 by the authors. Licensee MDPI, Basel, Switzerland. This article is an open access article distributed under the terms and conditions of the Creative Commons Attribution (CC BY) license (https://creativecommons.org/licenses/by/4.0/).
Share and Cite
Xie, X.; Hu, J.; Cao, X.; Zhang, S.; Sakamaki, T.; Li, X. In Situ Utilization of Electron-Enhanced Degradation of Azo Dyes in a Constructed Wetland–Microbial Fuel Cell Coupling System. Sustainability 2024, 16, 3181. https://doi.org/10.3390/su16083181
Xie X, Hu J, Cao X, Zhang S, Sakamaki T, Li X. In Situ Utilization of Electron-Enhanced Degradation of Azo Dyes in a Constructed Wetland–Microbial Fuel Cell Coupling System. Sustainability. 2024; 16(8):3181. https://doi.org/10.3390/su16083181
Chicago/Turabian StyleXie, Xiangfeng, Jijing Hu, Xian Cao, Shuai Zhang, Takashi Sakamaki, and Xianning Li. 2024. "In Situ Utilization of Electron-Enhanced Degradation of Azo Dyes in a Constructed Wetland–Microbial Fuel Cell Coupling System" Sustainability 16, no. 8: 3181. https://doi.org/10.3390/su16083181