Article

Genetic Diversity of Dominant Species Betula pendula in River Valley Forests in the Irtysh River Basin and Sustainable Conservation Measures for the Future

1
College of Life Science, Shihezi University, Shihezi 832003, China
2
Xinjiang Production and Construction Corps Key Laboratory of Oasis Town and Mountain Basin System Ecology, Shihezi 832003, China
*
Author to whom correspondence should be addressed.
These authors contributed equally to this work.
Sustainability 2024, 16(8), 3217; https://doi.org/10.3390/su16083217
Submission received: 18 February 2024 / Revised: 8 April 2024 / Accepted: 9 April 2024 / Published: 11 April 2024
(This article belongs to the Special Issue Biodiversity, Biologic Conservation and Ecological Sustainability)

Abstract

:
Biodiversity is the basis for the maintenance and functioning of ecosystems. Genetic diversity is at the heart of biodiversity, and therefore an understanding of the current state of plant genetic diversity can contribute to the future provision of sustainable ecological values and services by ecosystems. This study was conducted in the Irtysh River basin (five tributaries) with the dominant species of river valley forests, Betula pendula. Sampling points were set up at approximately 10 km intervals within each tributary using a random sampling method for genetic diversity studies based on chloroplast microsatellite molecular markers. The results indicated that (1) nine alleles were identified in 198 samples. The genetic diversity of Betula pendula was relatively rich in all tributaries (I = 0.216~0.546); genetic diversity was significantly higher in the downstream area of the basin than in the midstream and upstream areas of the basin. Genetic differentiation was at a low level in the tributaries except for the Berezek River, where genetic differentiation was high. (2) Genetic variation was mainly derived from within populations, accounting for 62% of the total genetic variation. The genetic distance was significantly positively correlated with the geographical distance (p < 0.05). The Betula pendula population structure was divided into two major groups. (3) Twelve haplotypes were identified in the basin. The dominant haplotypes in the upper tributaries were H2 and H4, while in the lower tributaries these were H1 and H3. Therefore, this paper suggests the future establishment of a germplasm resource bank for populations of the Berezek River, and the implementation of priority conservation measures for the downstream populations with higher genetic diversity, so as to realize the sustainable ecological value of the valley forests of the Betula pendula.

1. Introduction

Biological diversity (biodiversity) provides great service value and economic value for human beings, and is the material source on which human beings rely for survival. The research and conservation of biodiversity is considered a key environmental issue in the 21st century and has attracted extensive attention worldwide. Genetic diversity can reflect the extent of the potential of biological evolution and is the core of biodiversity. Plant genetic resources should be the focus of biodiversity conservation in the future [1].
The conservation of forest genetic diversity is the cornerstone of sustainable forest management [2]. As early as 1990, the Ministerial Conference on the Protection of Forests in Europe (MCPFE) discussed the importance of forest genetic resource conservation. In today’s world, with the rapid development of the social economy and global climate change, the conservation and sustainable use of forests are major challenges for forest management [3]. Forest genetic diversity and genetic resources become more important in forest protection. In Europe, it is estimated that 90% of riparian forests have been destroyed by human activities [4], and there has been growing interest in the protection and restoration of riparian ecosystems [5]. River engineering, such as river diversion, dam construction, and flood discharge timing, has significantly influenced the survival and species diversity of river basins globally [6]. Rivers are unique ecosystems that produce unique spatial patterns of biodiversity [7]; the genetic diversity of river plants plays an important role in the sustainable development of riparian ecosystems. Identifying priority conservation populations with high genetic variation is crucial for forest genetic conservation [3].
The Irtysh River is an international river flowing to the Arctic Ocean, originating on the southwestern slopes of the Altai Mountains in China. It spans 633 km, covers an area of 57,000 km2 in China, and is composed of several major tributaries, including the Kayertes River, Crane River, Burgin River, Haba River, and Berezek River. Owing to its unique geographical location and climatic conditions, the plant species found in this region belong to the European–Siberian Taiga boreal forest. During the period of May and June each year, due to the snowmelt in the mountains, the river runoff in the basin increases, resulting in river overflow and floodplain floods that last for nearly a month [8]. On the banks of its tributaries and in the lowlands there are large areas of forests called “river valley forests”. The Irtysh River valley forest is composed of poplar, willow and birch, and other important tree species, mainly distributed in the world’s four major Poplar groups and a large area of a natural Betula pendula forest.
Betula pendula (B. pendula) is the primary and most prevalent species in the river valley forests of the tributaries of the Irtysh River basin [9]. It is classified under the genus Betula in the family Betulaceae and is characterized as a monoecious tree species with wind pollination and cross pollination. This species is light-loving and thrives in acidic soils, and its distribution is extensive, covering regions such as Mongolia and Siberia in Russia, the Balkans, the Mediterranean, northern Xinjiang, and the Altai Mountains in China. This species exhibits a rapid growth rate and strong environmental adaptability, and it is an excellent pioneer species in vegetation succession and forest reconstruction after fire. B. pendula possess an exceptional amount of pollen, surpassing that of other European tree varieties [10]. The seeds bear membranous wings and hard shells that can spread over long distances [11,12]. B. pendula is considered to be the pioneer anemochorous species [13]. It has a very strong ability to spread its seeds on the wind. As a dominant tree species in river valley forests and an important forest resource for maintaining the stability of ecological species and developing forest economies in the forested areas of the Irtysh River basin, B. pendula plays a key role in the continuous provision of ecological service value in river valley forests. The assessment of genetic diversity within and among populations is necessary for the development of genetic conservation measures [14]. However, there are no studies on the genetic resources of B. pendula in the Irtysh River basin. Therefore, it is important to study the genetic diversity of B. pendula in the river valley forest of the tributaries of the Irtysh River basin, explore its genetic resources, and provide a theoretical basis for the development of policies for the protection of valley forests.
River valley forests are a specialized type of river landscape that grows in the floodplain of rivers, including a portion of the low tidal flats that can be inundated during periodic flooding [15]. The regeneration, reproduction, community composition, and species richness of river valley forests are closely related to river hydrologic processes [16]. In recent decades, climate change, the construction of water projects, and other anthropogenic disturbances have resulted in the degradation of the river valley forest in the basin [17]. Therefore, it is of paramount importance to strengthen the conservation of genetic diversity in the Irtysh River basin. In particular, research on the genetic diversity and genetic resources of dominant species is a cornerstone of the development of scientific conservation measures.
The level of plant genetic diversity not only responds to the potential for adaptive evolution, but also plays an important role in the response to environmental change [18]. A high level of genetic diversity protects against the detrimental effects of inbreeding, and also enhances the adaptive evolutionary potential and phenotypic plasticity of species [19,20]. For plants growing near rivers, genetic diversity can be affected by environmental factors from the river. Some researchers proposed that the transportation of plant propagators via flooding can increase gene flow from upstream to downstream regions [21,22]. Blanchet et al. [23] also pointed out that intraspecies genetic diversity has a downstream increase, and this phenomenon is ubiquitous in all taxa (from plants to invertebrates) and river systems. Thus, rivers play an important role in regulating biodiversity in watershed ecosystems, affecting population genetic differentiation and genetic structure [24,25]. The current status of the genetic diversity of B. pendula, as a plant growing on riverbanks, and how it changes in the riverine zone are important for the conservation of genetic resources of riverine forests and the promotion of the sustainable development of biodiversity.
River valley forests in the Irtysh River basin are an important local forest resource, playing an important role in maintaining the stability of the ecosystem and providing people’s living needs. In the face of the current degradation situation, there is a need to strengthen the sustainable use and management of genetic resources. Therefore, we studied the genetic diversity of the dominant species, B. pendula, of the valley forests in the tributaries of the Irtysh River basin based on chloroplast microsatellite molecular markers. The main objectives of this study were as follows: (1) to analyze the level of genetic diversity and the current status of genetic differentiation; (2) to investigate the geographical distribution characteristics of the genetic resources of B. pendula in the Irtysh River basin in combination with the genealogical differentiation; (3) to clarify the priority groups for conservation and the location of high-quality genetic resources of B. pendula; (4) to provide a scientific basis for conservation measures and the sustainable development of river valley forests in this basin.

2. Materials and Methods

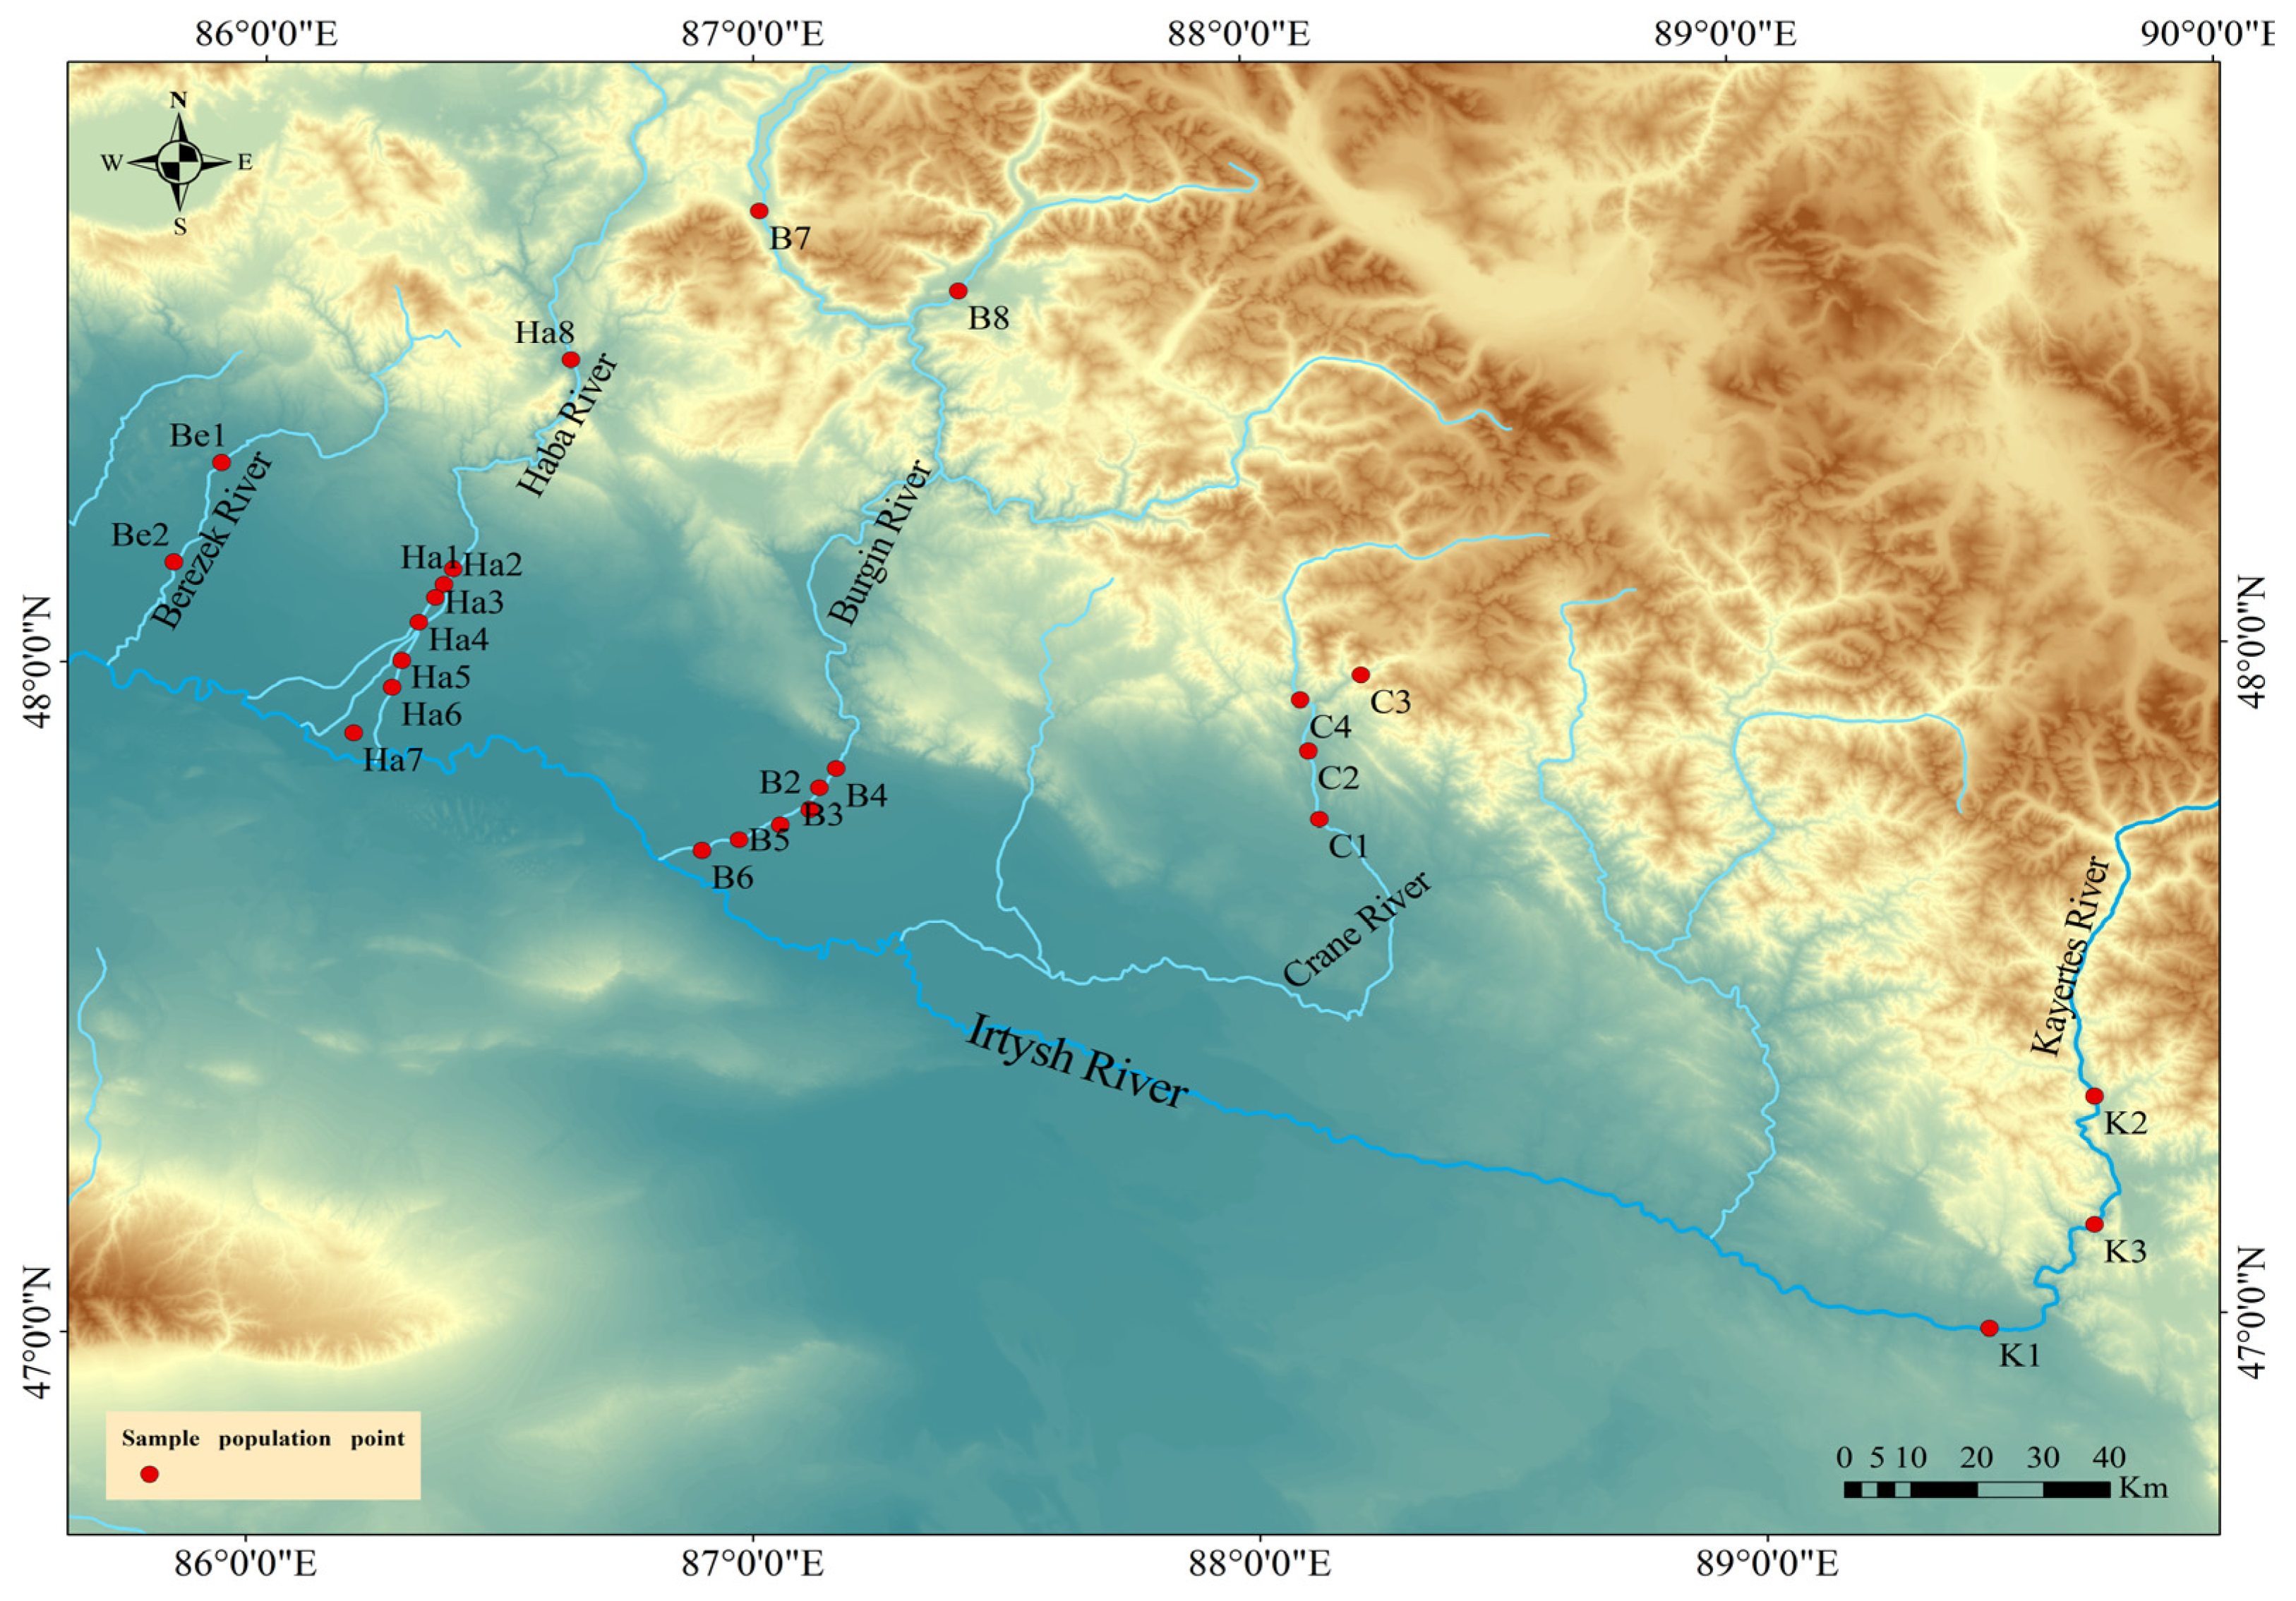
2.1. Study Area and Sampling Method

The experimental materials utilized in this study were sourced from the Irtysh River Basin (85°31′–91°04′ E and 46°50′–49°10′ N). The elevation of the basin gradually decreases from southeast to northwest, with an elevation from 4000 m to about 200 m, with an average elevation of 1790 m, and five tributaries from west to east: Berezek River, Haba River, Burgin River, Crane River, and Kayertes River. The water flow of each tributary is oriented from north to south and eventually merges into the main stream of the Irtysh River; it belongs to the mid-temperate continental climate, and the basin enjoys prevailing westerly winds.
The findings of a field survey conducted between June and October of 2022 and 2023 revealed that B. pendula was only present in the tributaries (Kayertes River, Crane River, Burgin River, Haba River, and Berezek River), with almost no presence in the mainstream region (Figure 1).
The Kayertes River is situated in the easternmost headwater tributary of the basin, with a length of 100 km and a very high concentration of B. pendula. The Crane River, which is a significant tributary of the Irtysh River, spans 265 km and passes through the national “Irtysh River Basin Birch Forest Park” in Altai City, China. The Burgin River is the largest tributary of the Irtysh River, stretching 269.6 km, and its river valley forest, dominated by B. pendula, exhibits a high timber stock. Compared to other tributaries, B. pendula does not only form pure forests but is also present in mixed conifer and broadleaf forests in this tributary. The Haba River, the second largest tributary of the Burgin River, is home to “the first birch forest in China”, which is the largest natural birch forest belt in Northwest China [26], where the greatest number of B. pendula can be found. The Berezek River, originating from the southeast slope of the Azutao Mountain in Kazakhstan, is a tributary of the lower reaches of the Irtysh River. It measures 155 km in length, with approximately 80 km of its course running through China; the water flow is slow, and alternating oases and dunes can be found along both banks. The population of B. pendula in this tributary is smaller and less abundant.
In this study, sample points were randomly selected and set up at intervals of about 10 km according to the distribution characteristics of B. pendula in each tributary. Within each sample point, sampling plants were also randomly selected. To prevent the influence of clonal sampling, a minimum of 30 m was left between sampled plants within each population. The specific sampling information is presented in Table 1.

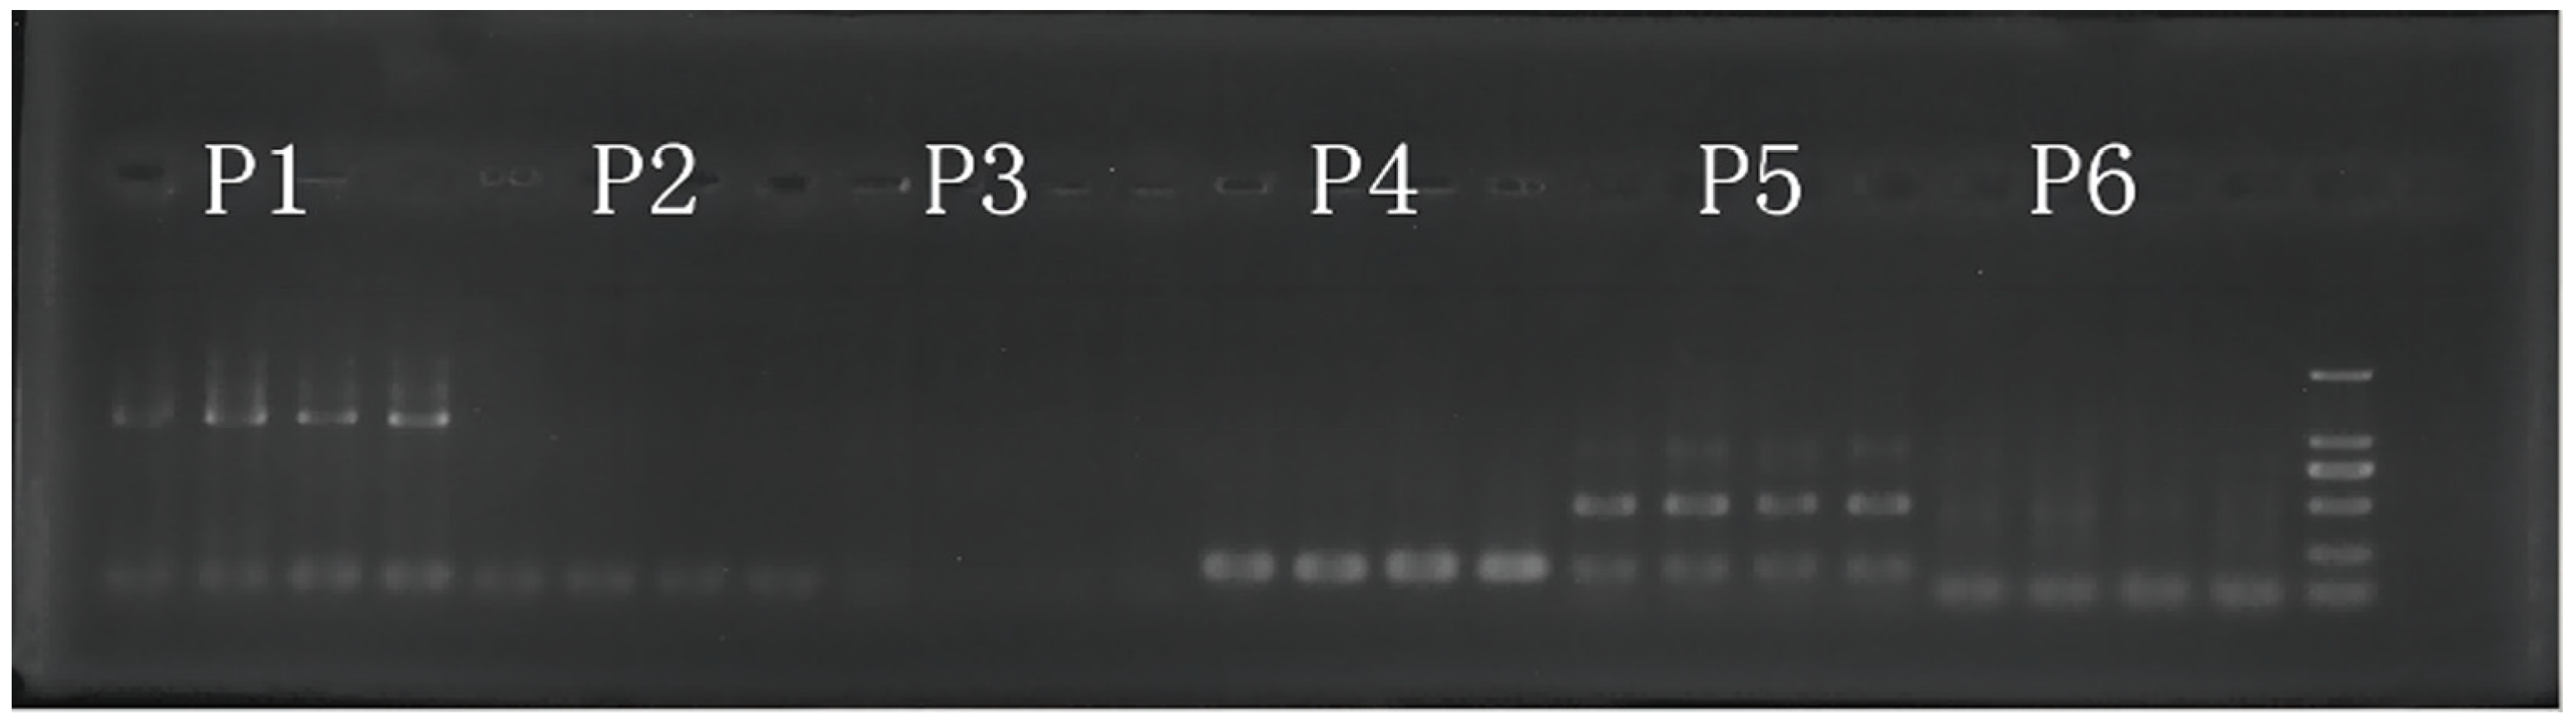
2.2. DNA Extraction and Microsatellite Analysis

Because of the presence of a significant number of secondary metabolites in birch plants, which could affect the quality of DNA extraction, the cetyltrimethylammonium bromide (CTAB) method modified by Zeng et al. [27,28] was adopted to extract DNA from the plant leaf tissues. This method is characterized by its simplicity, cost-effectiveness, and reliability, making it well suited for extracting DNA from a variety of plants with high polysaccharide content.
Chloroplast genomes are characterized by haploidy and maternal inheritance [29], and are more susceptible to random events affecting genes. Because they are maternally inherited, their transmission is limited to seed transmission [30]. Genetic variation analysis of chloroplast genomes typically exhibits a clear phylogeographic structure, making them well suited for phylogeographic analysis [31].
Our research focused on the genetic diversity of B. pendula by specifically analyzing chloroplast microsatellites. To accomplish this, we employed six chloroplast microsatellite primers designed by Thomson et al. [32] for the study of Betula (Table 2).
Screening of six pairs of microsatellite primers by capillary amplification electrophoresis showed that only four pairs of primers (P1, P2, P4, and P5) worked well (Figure 2). Admittedly, the number of primers available for this study was limited. The four primers were used for chloroplast microsatellite detection in B. pendula.
The PCR amplification system mixture was 20 μL, including 7.4 μL of ddH2O, 10 μL of PCR mix, 0.3 μL of forward primers, 0.3 μL of reverse primers, and 2 μL of DNA template. After obtaining the PCR products, formamide was mixed with the molecular weight internal standard (ROX-500) at a volume ratio of 100:1, and 15 μL of the mixture was added to the upper sample, along with 1 µL of 10-fold-diluted PCR product. Capillary electrophoresis was then performed on a 3730XL sequencer (Applied Biosystems, Carlsbad, CA, United States). The original data collected by the sequencer were subjected to fragment (plant) analysis using Genemarker 2.2. Subsequently, the position of the internal standard of molecular weight in each lane was compared with the position of the peak of each sample, and we obtained the fragment size data.

2.3. Genetic Diversity Analysis

The degree of genetic diversity can serve as a marker of the evolutionary progress of species and the distinctions between and within populations. In this study, chloroplast microsatellite amplified product base pairs (bps) were utilized to assess the genetic diversity of B. pendula. The genetic diversity, allele number (Na), effective allele number (Ne), Shannon diversity index (I), and genetic differentiation coefficient (Fst) were calculated using GenAlex v6.51b2 [33], which is compatible with Microsoft Excel 2019. Using genetic correlation analysis, the calculation of polymorphism information content (PIC) and gene flow (Nm) was accomplished using Powermarker v3.25 [34]. Shannon diversity index (I) of different reaches (upstream, midstream, and downstream) of the Irtysh River basin was analyzed using SPSS v.26 for one-way method analysis and using Least Significant Difference (LSD) method for significance-level tests (α = 0.05). Consequently, the genetic diversity of B. pendula was assessed.

2.4. Genetic Structure Analysis

Population genetic structure can be utilized to depict the spatial and temporal distribution of genetic variation, as well as to assess the degree of genetic variation present within a population. Therefore, to determine the main source of genetic diversity in B. pendula, molecular variance analysis was performed using GenAlex v6.51b2 [33]. First, the genetic distance matrix (GD) for individuals, populations, and rivers was generated using GenAlex v6.51b2, and a corresponding geographical distance matrix (GGD) was calculated based on the longitude and latitude. Subsequently, the Mantel Test was employed to detect the correlation between genetic and geographical distances, and the Permutations were set to 99 times. The p value obtained was applied to determine the significance of the correlation. Additionally, principal component analysis (PCA) was performed on 25 populations using Origin2024 [35], while phylogenetic trees were constructed for B. pendula using the UPGAM method based on genetic distance in PowerMarker v3.25 [34] to elucidate the genetic clustering of the species.
STRUCTURE v2.3.4 software was adopted to classify the group structure by determining the optimal cluster value K [36]. This software employs the maximum likelihood algorithm. It facilitates the examination of the genetic component mixture of all individuals within a population by analyzing the population genetic structure. First, the original microsatellite data were converted into an import file format compatible with STRUCTURE software v2.3.4 using DataFormater v2.7 software, which is a format conversion software for SSR molecular marker data developed by Fan et al. [37]. Subsequently, the data file was imported into STRUCTURE software, wherein the parameters “Length of burnin period” and “Number of MCMC Reps” were set to 50,000, and the remaining parameters were set to their default values. Twenty iterations were conducted for each K value (K = 1–10), and the resulting data were analyzed using Structure Harvester software (http://taylor0.biology.ucla.edu/structureHarvester/ (accessed on 12 October 2023)) [38] to determine the optimal K value and thus determine the genetic structure and population genetic mixing of B. pendula populations.

2.5. Haplotype Analysis

Haplotypes were analyzed to investigate lineage evolution and geographical distribution characteristics during the historical development of B. pendula. In this study, haplotypes were defined as a singular combination of variants of chloroplast microsatellite alleles, and haplotype types and frequencies were examined using PowerMarker v3.25 [34]. The number and frequency of haplotypes for each population were determined, and a haplotype bar accumulation map was generated using Origin software. Haplotype network diagrams were based on the relationship between quantitative differences in haplotype allelic variation [39]. In ArcGIS 10.8, haplotype types and frequencies for each population were located and interpolated, and a haplotype distribution map was created to visualize the haplotype distribution of each population. This analysis aimed to examine the haplotype differences and distribution rules of each tributary in the Irtysh River basin.

3. Results

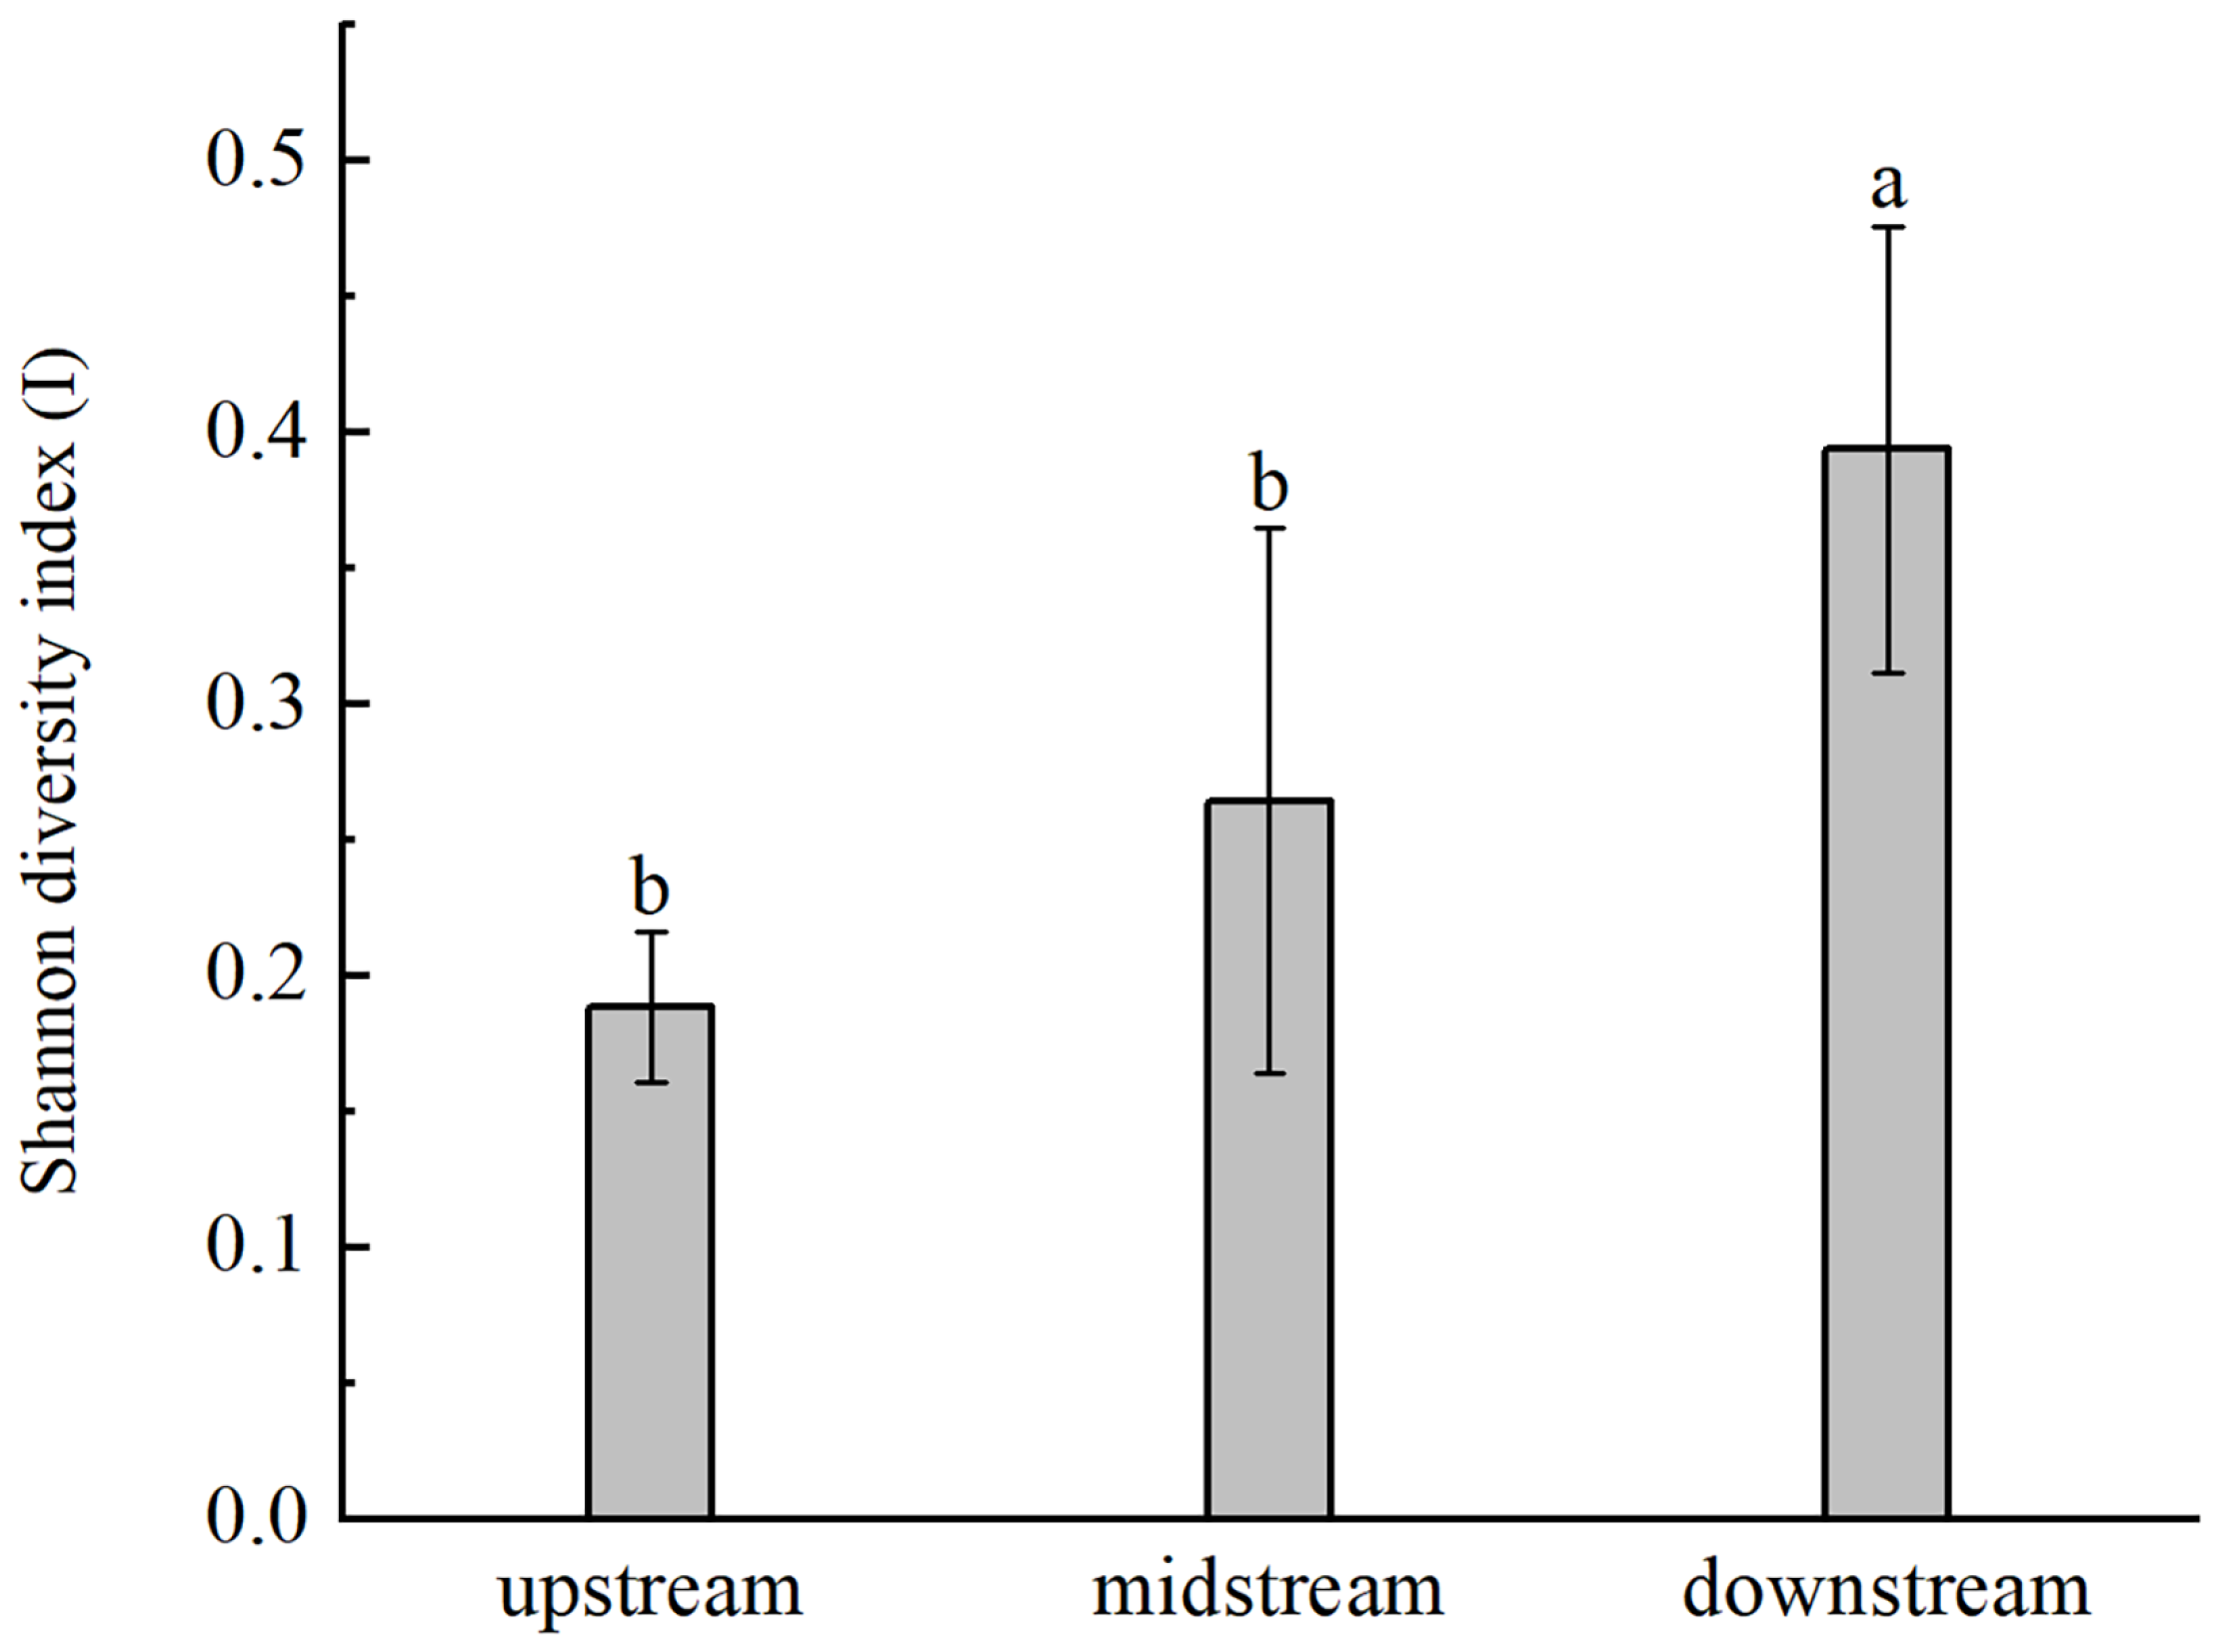
3.1. Chloroplast Microsatellite Locus Genetic Diversity

The amplification results of microsatellite primers all had obvious bands, and nine alleles were studied in 198 samples from 25 B. pendula populations using four chloroplast microsatellite primers. Specifically, two, three, three, and one allele was detected using ccmp4, ccmp5, BCMS1, and BCMS2, respectively. Shannon diversity index (I) ranged from 0 to 0.735, whereas the effective allele number (Ne) ranged from 1 to 2.025 (Table 3), and the polymorphism information content (PIC) ranged from 0 to 0.4253. Overall, BCMS1 was the most effective primer for detecting B. pendula.

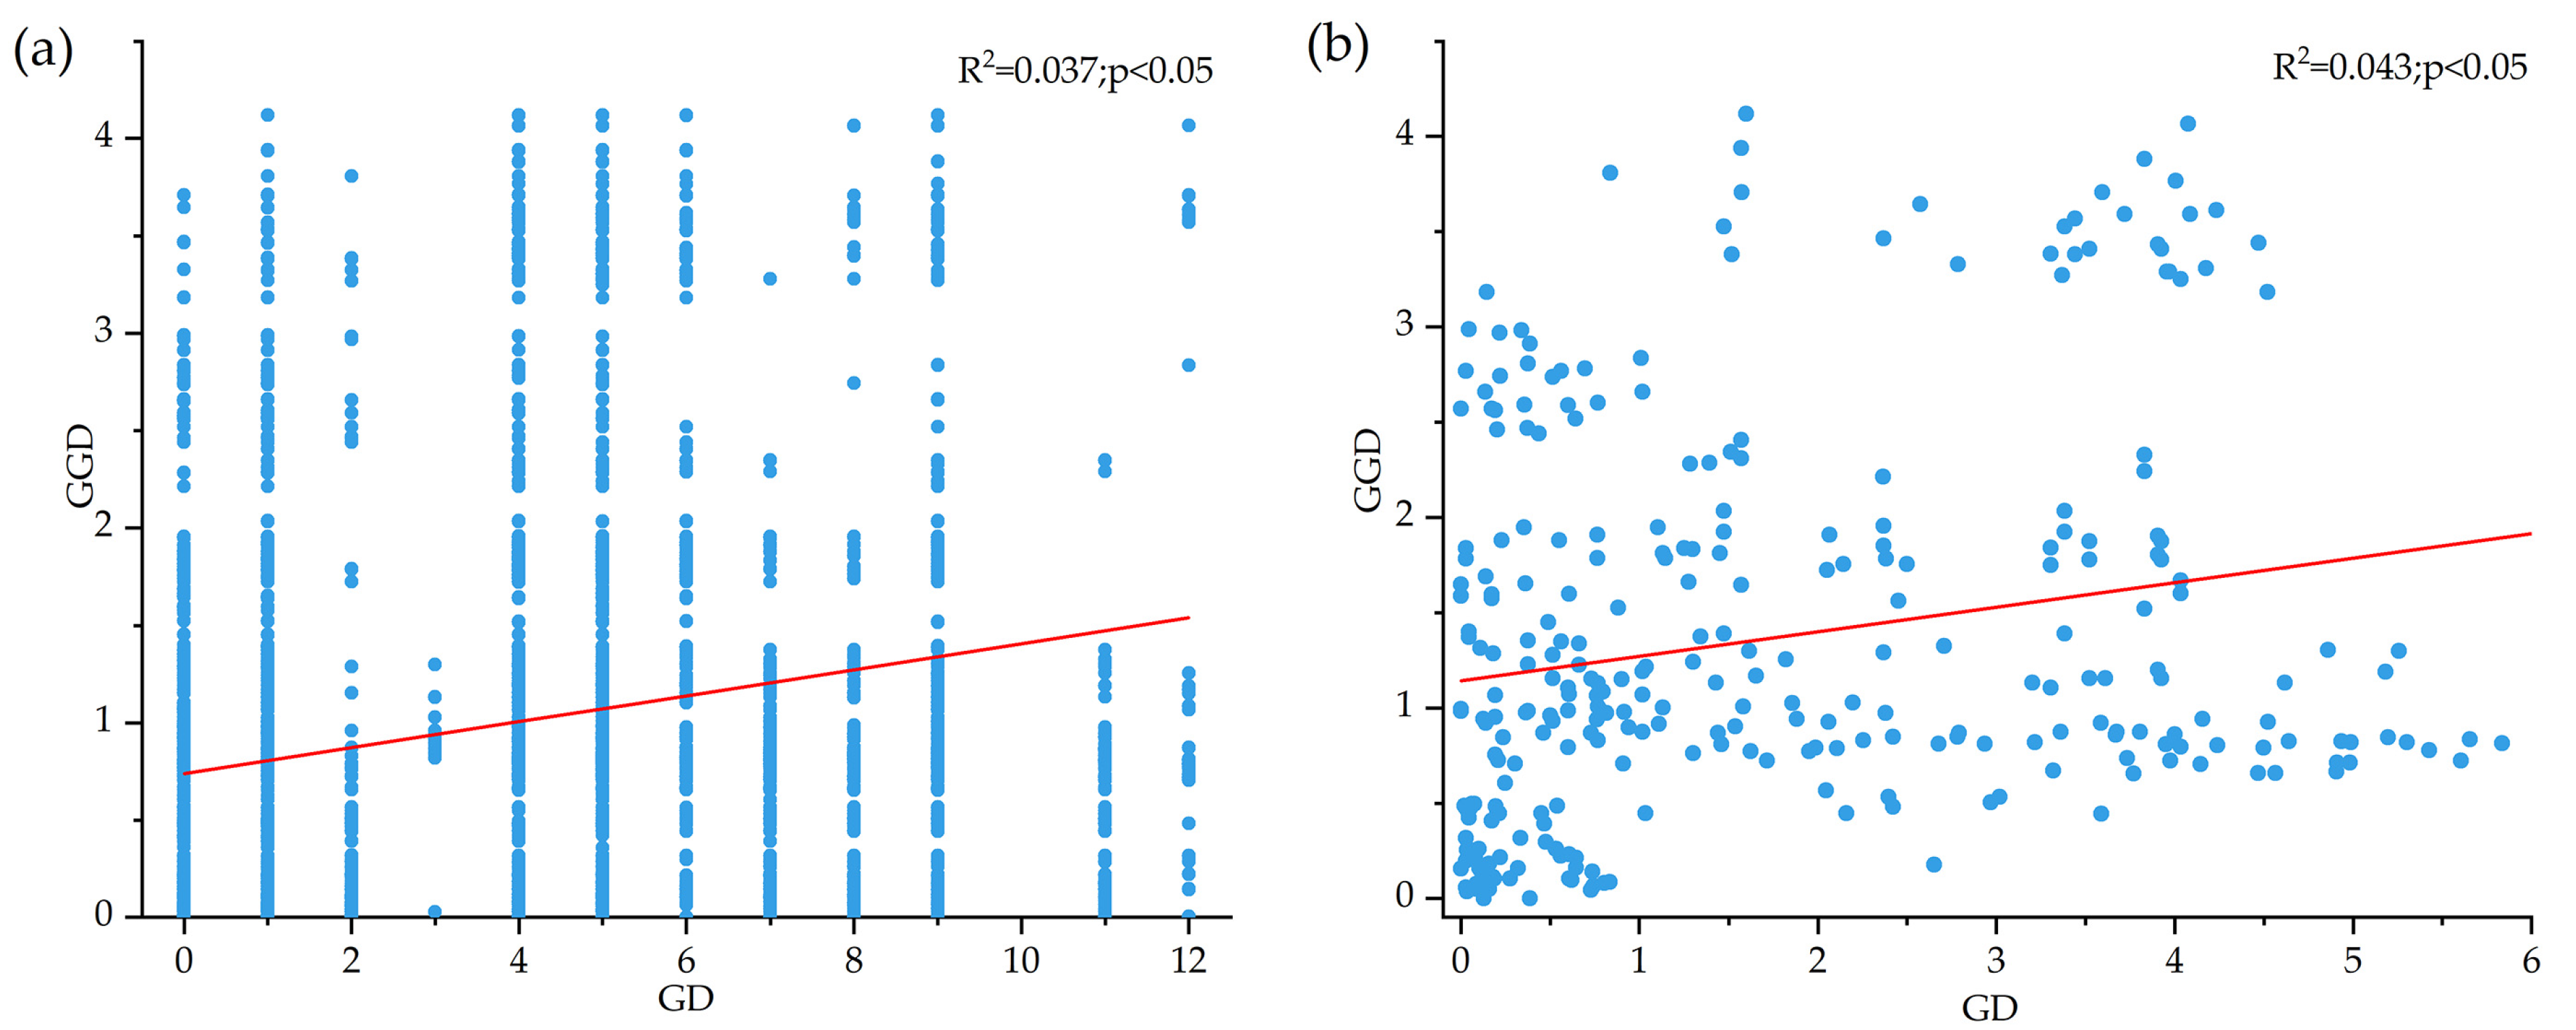
3.2. Genetic Diversity and Genetic Differentiation of B. pendula

The Shannon diversity index (I) ranged from 0.216 to 0.546 and exhibited an average value of 0.371 (Table 4). The Berezek River in the lower tributaries of the basin displayed the highest Shannon diversity index (I), followed by the Burgin River, whereas the Kayertes River in the upper tributaries exhibited the lowest diversity. The genetic diversity in the upper, middle, and lower reaches of the Irtysh River basin was compared according to the Shannon diversity I and a one-way ANOVA was conducted, which showed (Figure 3) that the lower reaches of the basin had a higher diversity, and there was a significant difference between it and the middle and upper reaches. It can be seen that the genetic diversity was higher in the lower reaches, both within the basin and among the tributaries.
The genetic differentiation coefficient (Fst) varied between 0.308 and 0.018, with an average of 0.315 (Table 4). According to the findings of Buso et al., a genetic differentiation coefficient ranging from 0 to 0.05 is considered to indicate little differentiation, between 0.05 and 0.15 to indicate medium differentiation, between 0.15 and 0.25 to indicate large differentiation, and above 0.25 to indicate very large genetic differentiation [40]. Among the tributaries studied, only the most downstream tributary, the Berezek River, displayed a high level of genetic differentiation, while the other tributaries exhibited low levels of differentiation. Consequently, the overall genetic differentiation of B. pendula in the Irtysh River Basin is low. Analysis of genetic differentiations among tributaries showed (Table 5) that genetic differentiation among tributaries was moderate to high, with the exception of three tributaries, the Kayertes River, the Crane River, and the Burgin River, which showed relatively small genetic differentiation between them. The Haba River is the closest tributary to the Berezek River, and the genetic differentiation between the two tributaries was at a low-to-medium level (Fst = 0.052). The genetic differentiation between the Berezek River and other distant tributaries was relatively high.
The gene flow (Nm) ranged from 0.563 to 13.519, and the gene flow was relatively high in each tributary, with the highest value observed in the Burgin River and the lowest in the Berezek River.

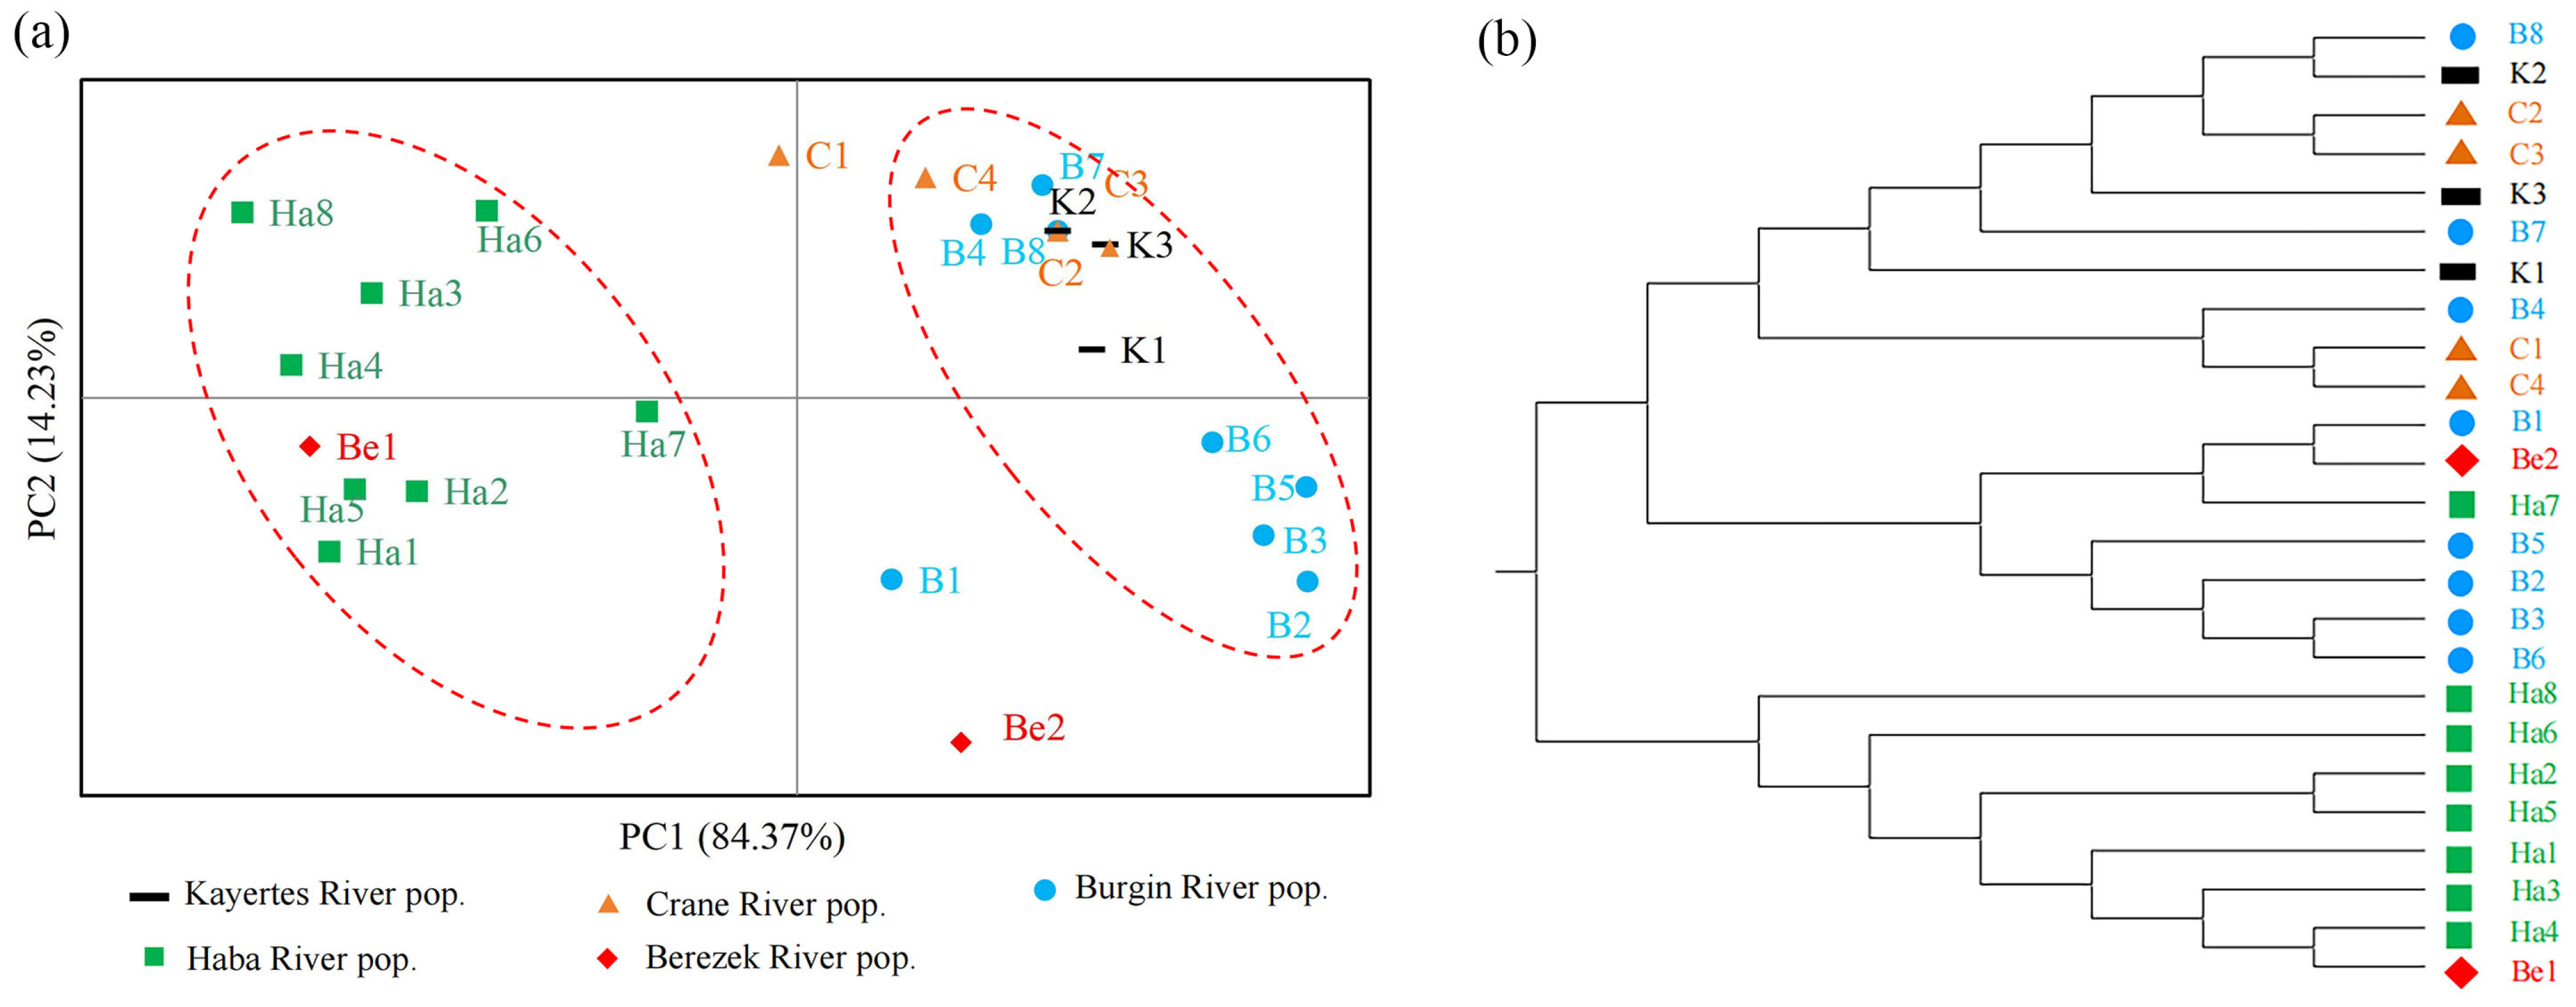
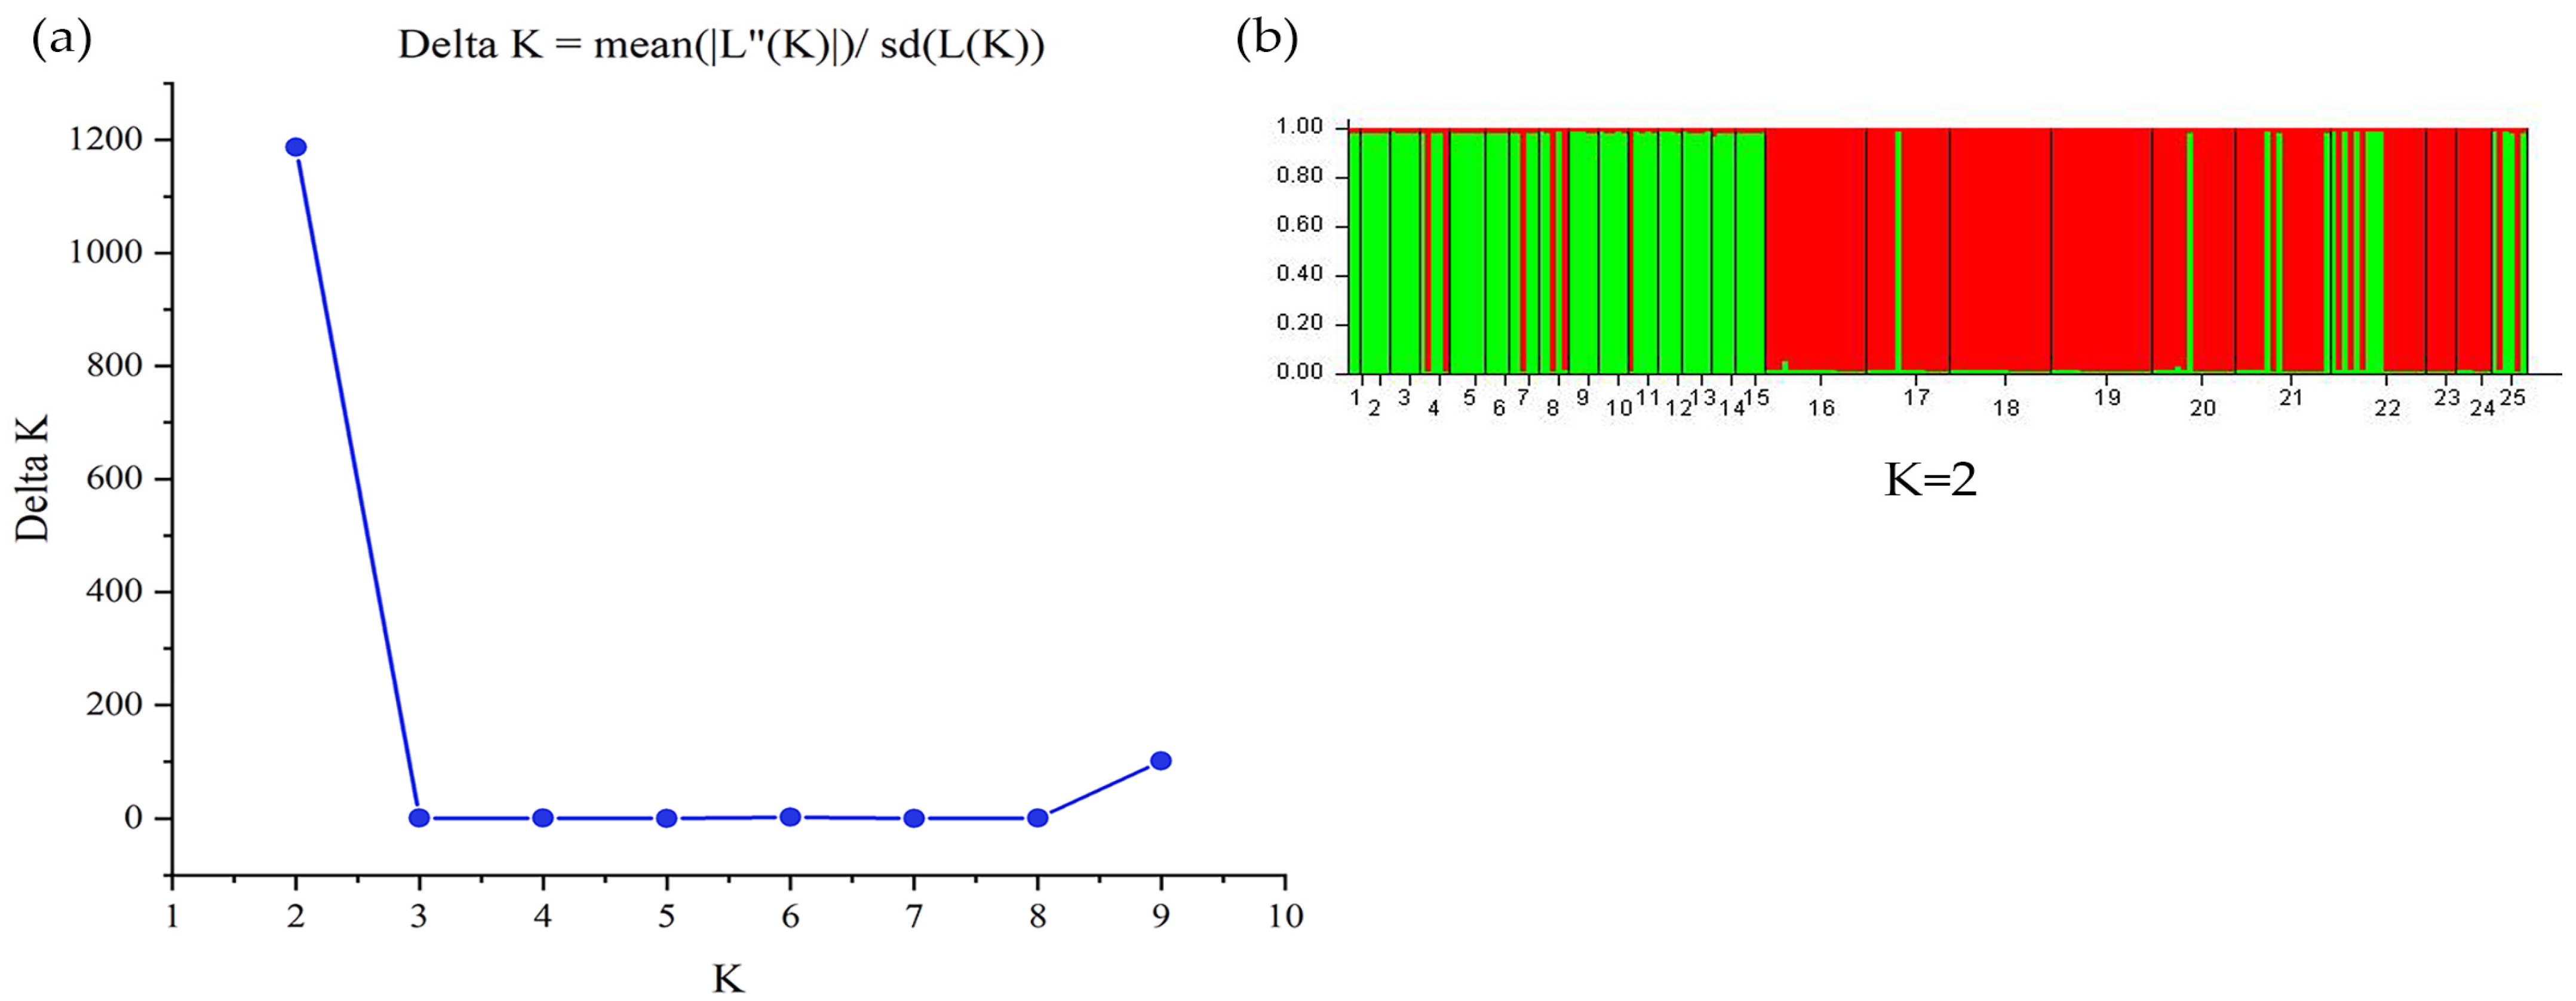
3.3. Genetic Structure of B. pendula

Molecular variance analysis indicated that the primary source of genetic variance was within the population, accounting for 69% of the total variance, while the remaining 31% of the variance was among populations (Table 6). The Mantel Test showed that individual genetic distance and geographic distance were significantly positively correlated for B. pendula (p < 0.05, R2 = 0.037), and at the population level, genetic distance and geographic distance were also significantly positively correlated (p < 0.05, R2 = 0.043) (Figure 4).
The principal component analysis (PCA) indicated that all populations were grouped into two distinct clusters (Figure 5a). On the left of the figure is the population of the Haba River tributary marked in green, and most of the individuals of population Be1 of the Berezek River are mixed in; on the right of the figure is the population of the Burgin River and other tributaries, with a high degree of mixing. The UPGAM method identified two primary classes and two groups (Figure 5b). STRUCTURE analysis demonstrated that the optimal cluster value was K = 2 (Figure 6), suggesting that the Irtysh River basin was divided into two major genetic groups: those branches located above the Burgin River (including the Burgin River) and branches situated below the Haba River (encompassing the Haba River).

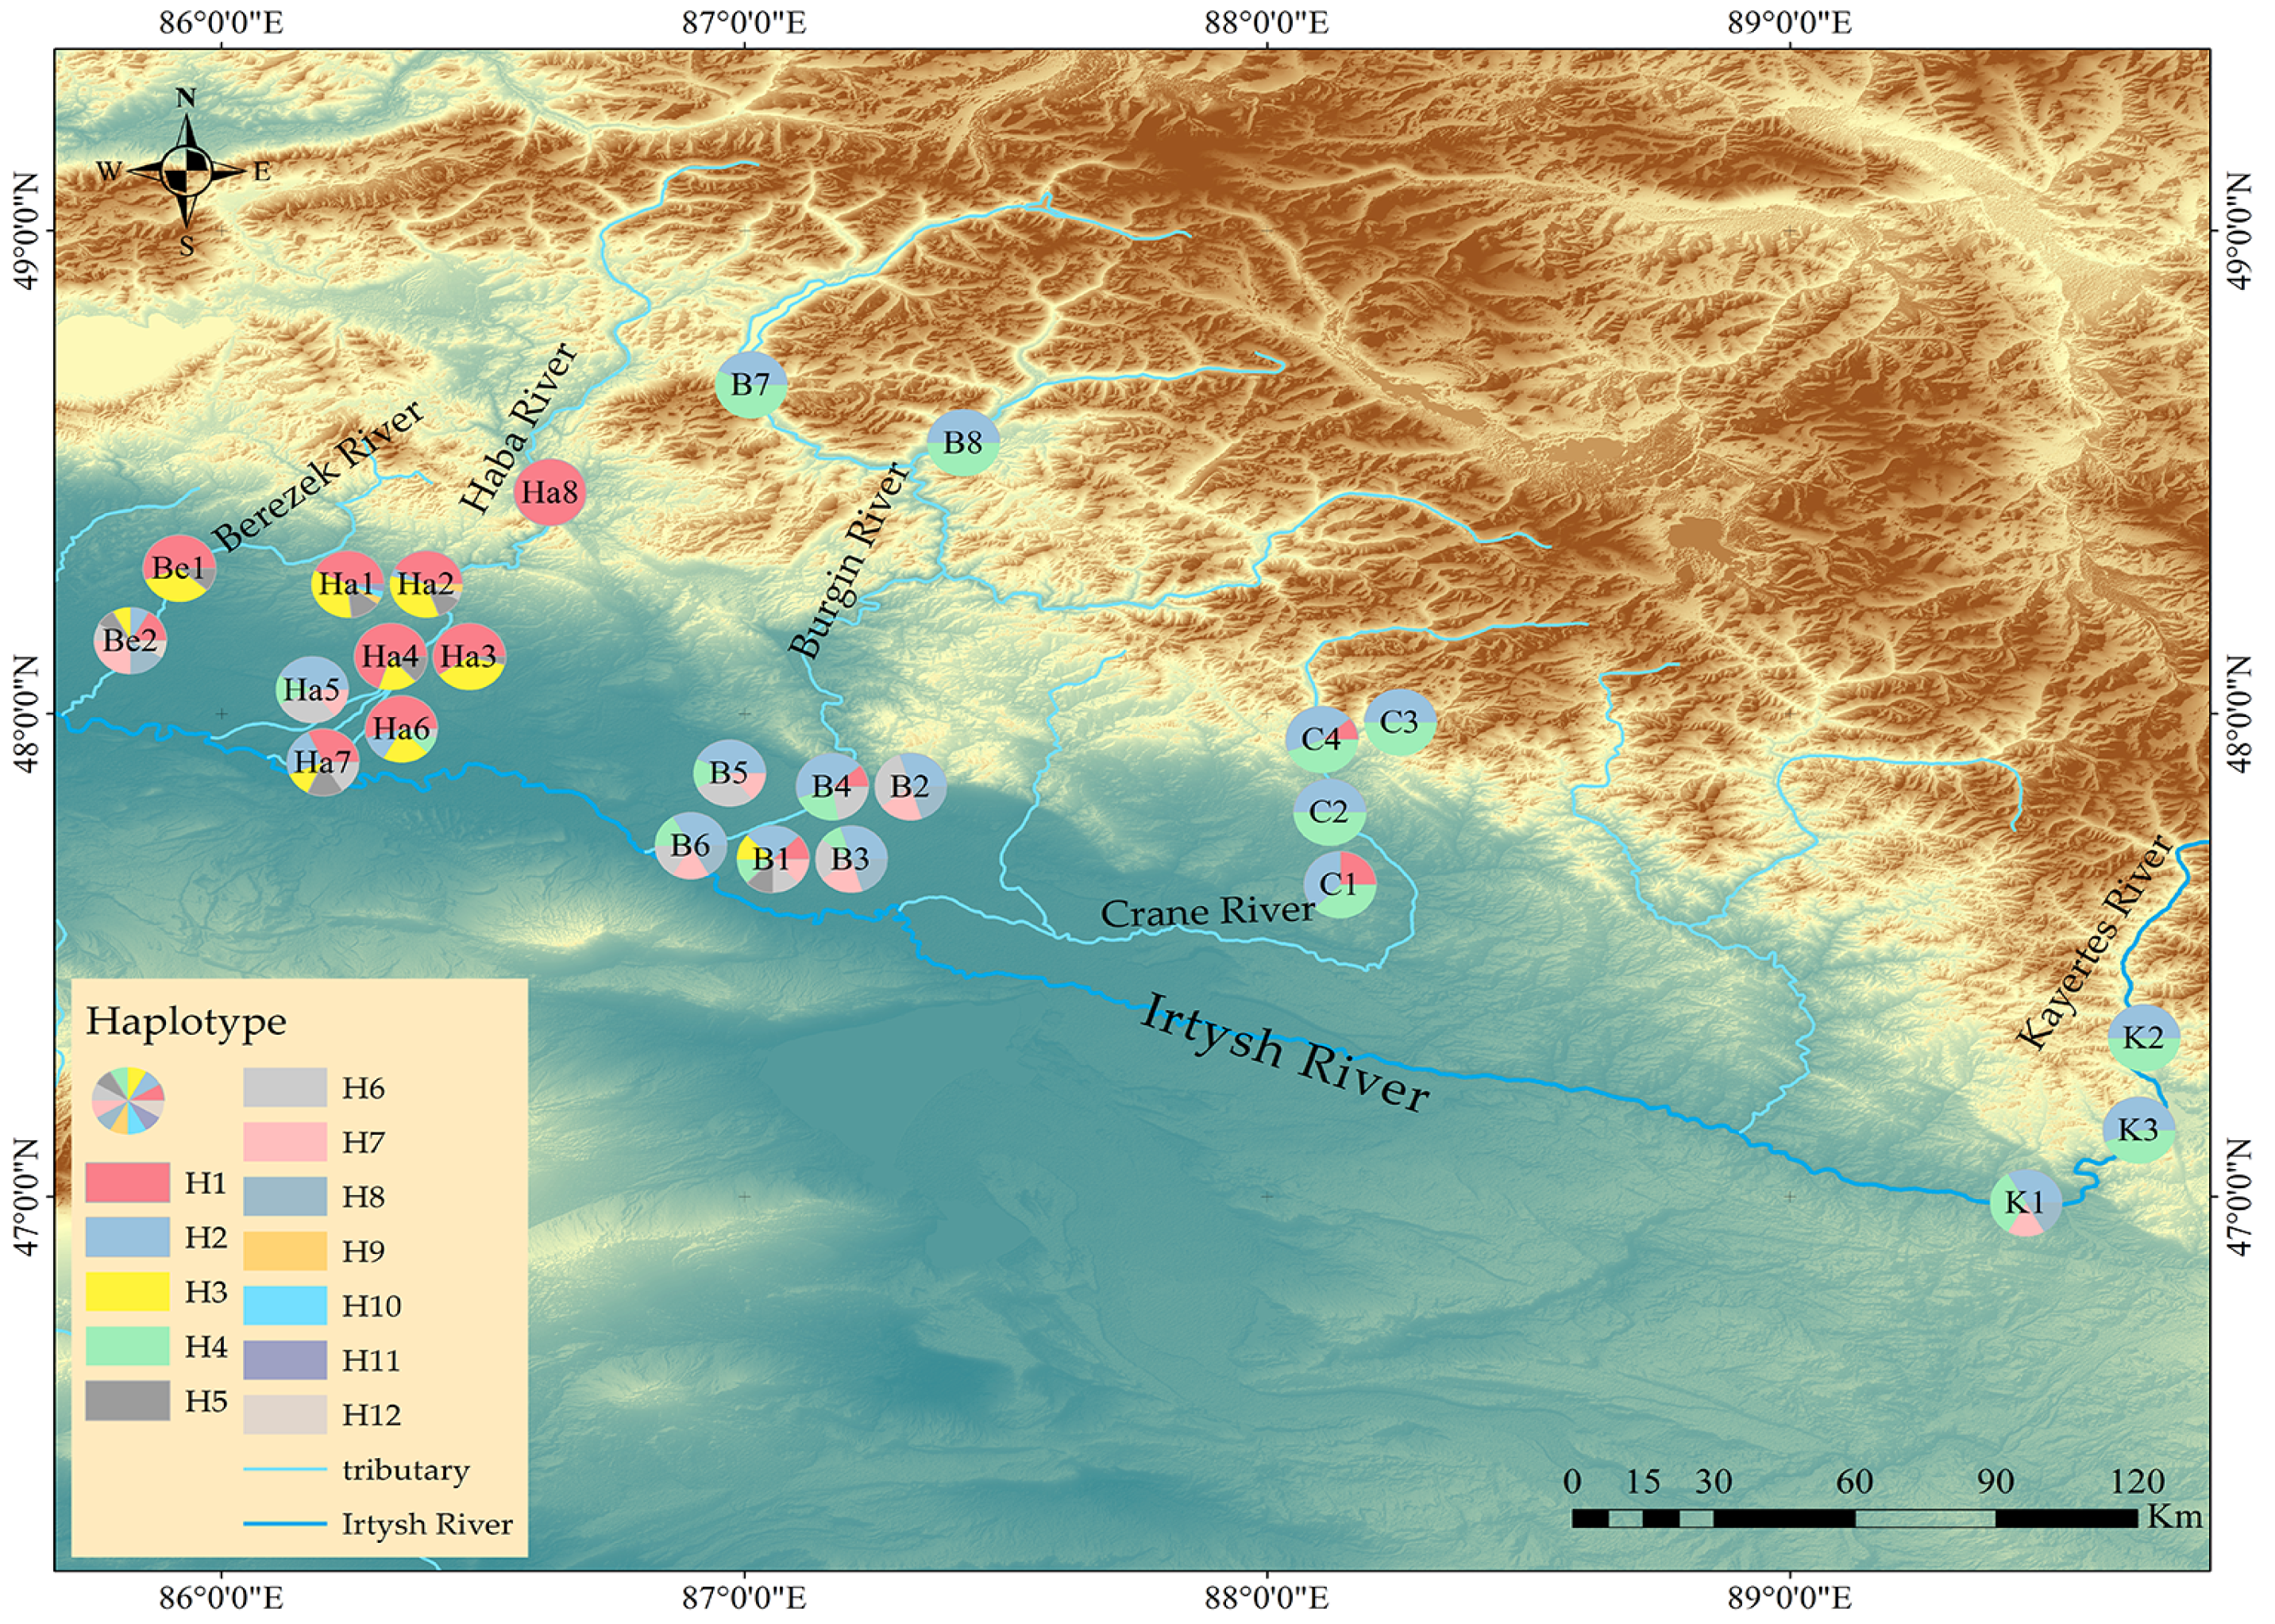
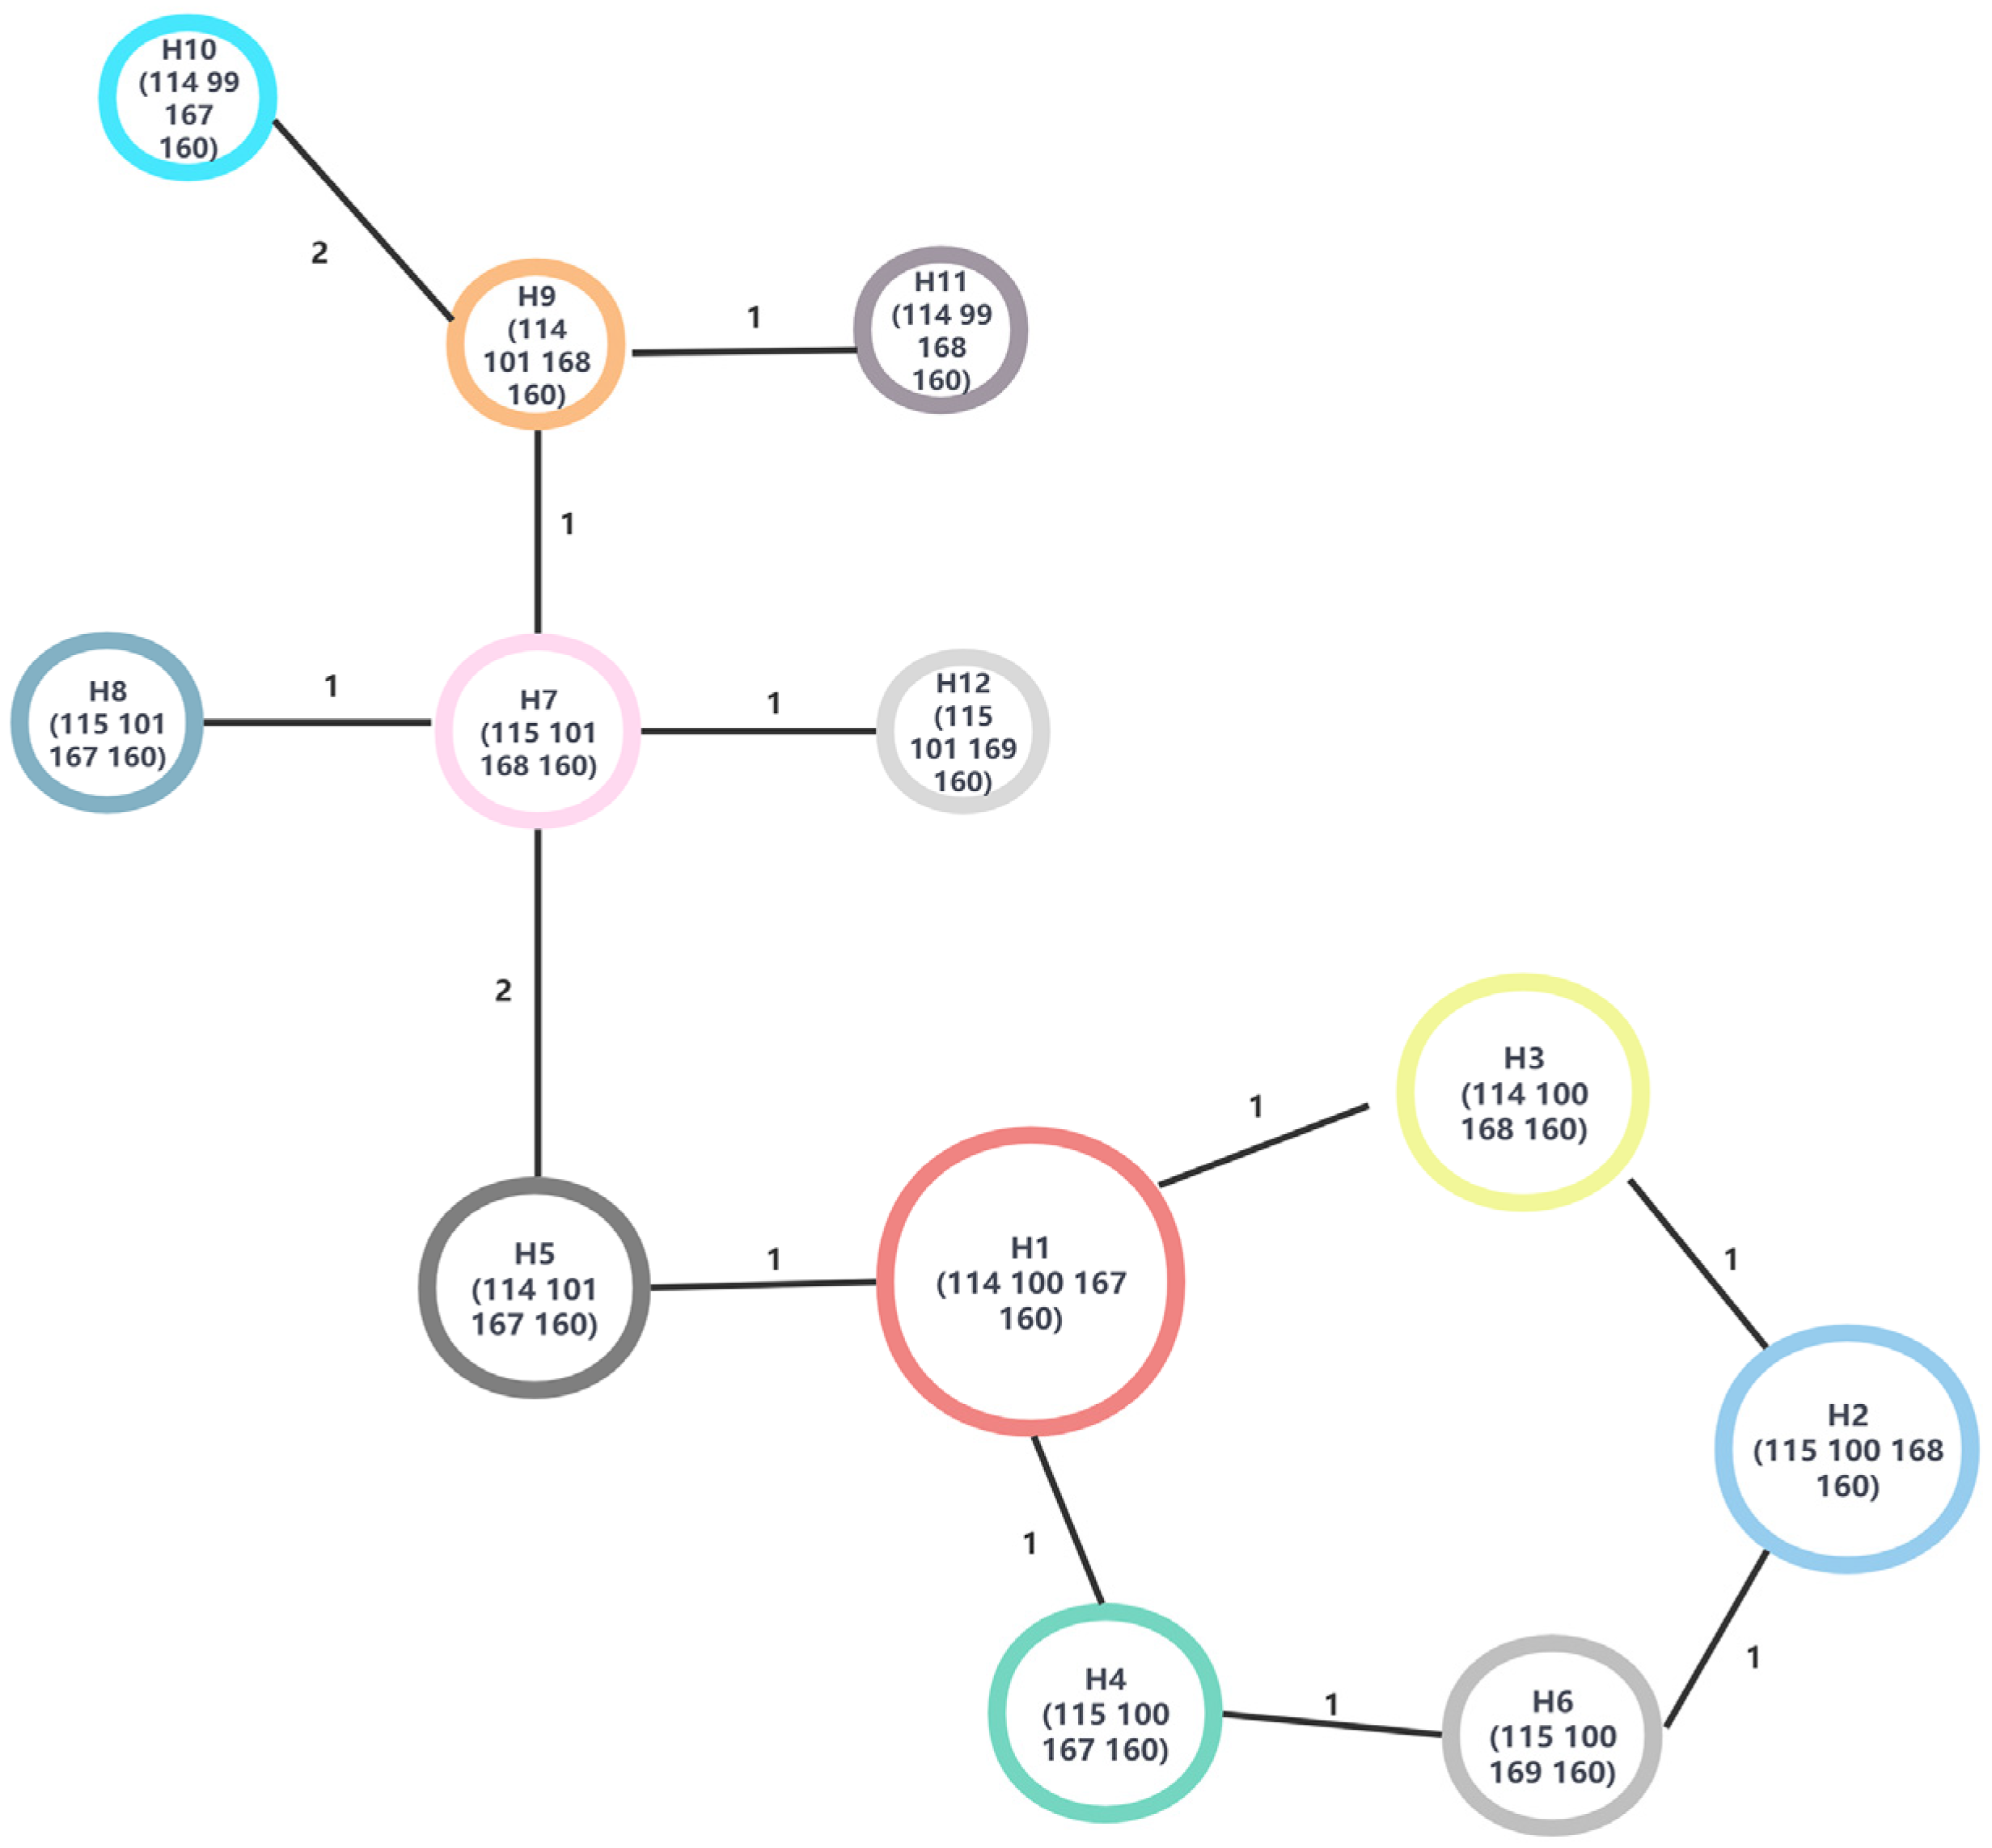
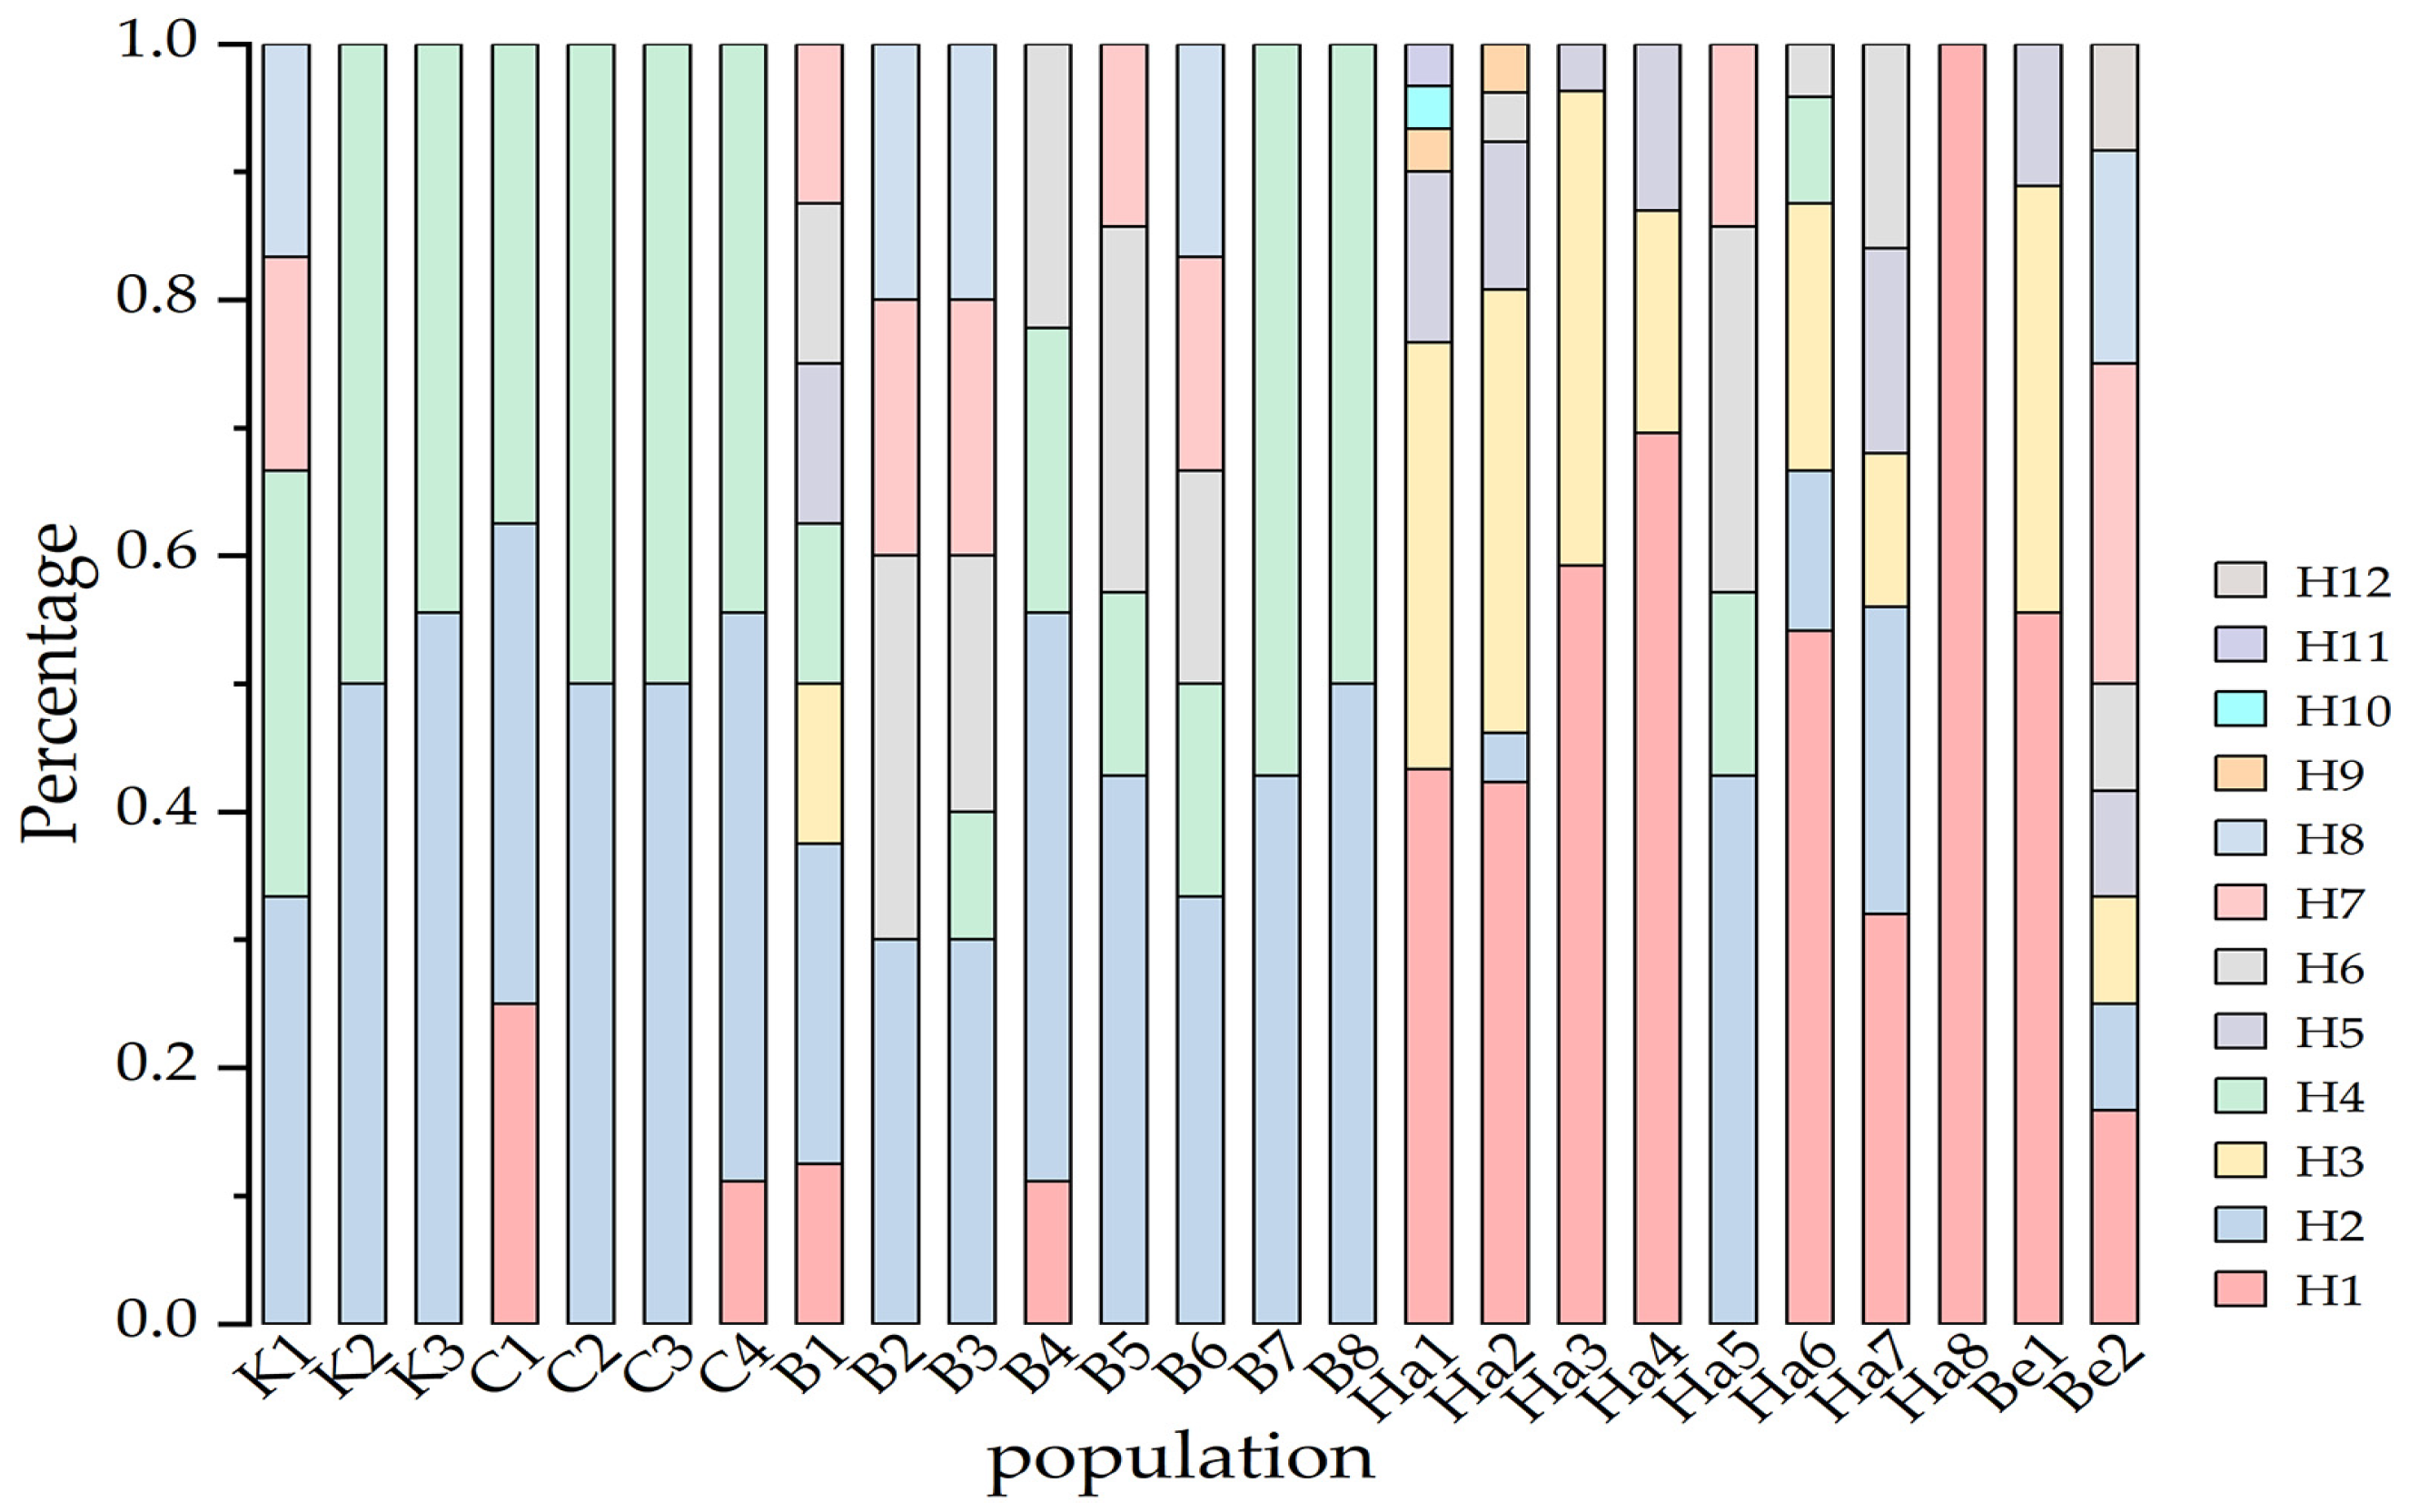
3.4. Geographical Distribution of Chloroplast Haplotype

In total, nine alleles were identified across 198 samples, which were grouped into 12 distinct haplotypes. The detailed composition of haplotypes is shown in Appendix A, Table A1. The number of haplotypes varied among the populations, with population Be2 displaying the highest diversity and possessing eight different haplotypes. Based on the haplotype frequency results for each population (Figure 7), haplotypes H2 and H4 were the most prevalent in the Kayertes River, Carne River, and Burgin River populations of B. pendula, whereas haplotypes H1 and H3 were most commonly observed in the Haba River. In contrast to other tributaries, the Berezek River had rich haplotype types and displayed a notably consistent composition. Of the 25 populations, only Ha1 from the Haba River and Be1 from the Berezek River had unique haplotypes, with two unique haplotypes, H10 and H11 for Ha1, and H12 for Be1 (Appendix A, Table A2).
The findings from the haplotype geographical distribution (Figure 8) revealed that the haplotype of B. pendula exhibited a continuous distribution pattern in the upstream and downstream regions of the Irtysh River basin. Additionally, the haplotypes in each tributary showed a low–high trend from upstream to downstream. Interestingly, although each tributary had a dominant haplotype, there was a shared haplotype among the tributaries. In this study, haplotype H1 had the highest frequency and widest distribution (Figure 7). A haplotype network web diagram (Figure 9) was drawn based on the relationship of allelic variation among haplotypes. The original haplotype of B. pendula was H1.

4. Discussion

4.1. Characteristics of High Genetic Diversity and Low Genetic Differentiation Were Observed in B. pendula of Irtysh River Basin

B. pendula is a leading broadleaf species in cold temperate zones. There is abundant genetic diversity, low genetic differentiation, and a low level of genetic structure in B. pendula populations [41,42,43,44]. Additionally, this study utilized chloroplast microsatellite analysis to show that B. pendula has relatively rich genetic diversity, with low levels of genetic differentiation, both at the tributary level and in the overall basin analysis. But, the degree of differentiation within each tributary is different. It was discovered that the gene flow (Nm) was remarkably high in both tributaries and the entire basin. Gene flow can facilitate gene exchange between different populations; when gene exchange occurred more frequently between populations, genetic diversity was less likely to decrease [45,46]. Based on these findings, we concluded that the extensive gene flow among the B. pendula populations in each tributary is an important cause of genetic diversity in the Irtysh River basin.
The size and direction of gene flow is strongly linked to how far the plant propagules spread. Notably, the reproductive system of the plant is the most crucial determinant of genetic diversity [47,48]. There are large and small years in the seed production of Betula pendula; seed production typically peaks every 2–3 years [49]. The seeds of B. pendula are small in size and light in mass, characterized by the long-distance and extensive dissemination of small seeds [43]. B. pendula seeds generally begin to spread in midsummer, when westerly winds are prevalent in the basin. The seeds of B. pendula are light and have membranous wings, which facilitate the long-distance transmission of seeds through wind between tributaries; this dissemination facilitates the possibility of genetic exchange between the west-to-east tributaries of the Irtysh River basin (the Berezek, Haba, Burgin, Crane, and Kayertes Rivers, in that order). Based on variations in the level of genetic differentiation and diversity among tributaries, this study suggested that B. pendula could conduct long-distance gene communication between tributaries by wind-borne seed dispersal. However, due to environmental factors such as limited seed dispersal distances and riverine barriers, exchange is not very extensive and there is some variation in the degree of genetic differentiation. Inside the tributaries, flooding occurs in May–June of each year, and since the formation of B. pendula river valley forests is closely related to the river, propagules settle and grow on the banks of the river and where floodwaters can reach them to form this particular vegetation. Betula seeds have high floatability and can float on water for 9–10 days, during which time some seeds can swim distances of 180–600 km [50], and generally have a higher submergence rate than wind flow rate, so inside each tributary the river also transports the seeds (lightweight, with thin film wings, and buoyant), which increases the chances of genetic exchange between populations. In conclusion, the present paper concludes that the mode of propagule dispersal has a significant impact on the genetic diversity of B. pendula.
In the Berezek River, the gene flow (Nm) was less than one, indicating minimal genetic exchange among populations in its tributaries. This level of genetic differentiation was remarkably higher than that in other tributaries. However, the genetic diversity in the Berezek River was notably higher than that in other upstream tributaries. The Berezek River is situated in the lower tributaries of the river basin with minimal drainage connections to other upstream tributaries. During the field investigations, the distribution of B. pendula in the Berezek River was very concentrated, with limited numbers and very small populations. Consequently, this study concluded that the exceptionally high genetic differentiation observed in the Berezek River population was attributed to local genetic drift resulting from the small population size, and thus requiring priority conservation.

4.2. Low Genetic Structure Level in B. pendula Population

The genetic structure of a species reflects the spatial distribution, and the study of the genetic structure can understand the degree of population evolution and the genetic links between populations [51]. In this study, we found that the genetic structure of B. pendula in the Irtysh River basin was relatively simple and was mainly divided into two major groups with obvious geographical boundaries, with the Burgin River and the Haba River as the boundaries; one group was dominated by the upstream tributaries (populations of the Kayertes, Crane, and Burgin Rivers) and the other was represented by downstream tributaries (the Haba and Berezek Rivers); and it could be seen that the genetic relationships among the tributaries were much closer, which suggests that there may be some local differentiation among the tributaries due to the geographical distance. This suggests that there may be some local differentiation between tributaries due to geographic distance. Analyzing the Mantel Test for genetic and geographic distances, this study concluded that the correlation between genetic and geographic distances of B. pendula was very weak, which was mainly due to the wide dispersal of seeds with wind and water.
The genetic structure of organisms can be affected by several factors, including natural selection, gene mutations, genetic drift, and migration. It is also closely related to the reproductive system and geographical distribution of species [51,52]. However, these factors cannot be separated from the specific biological characteristics and historical background of the plants [53]. The “distance isolation model” indicates that as geographical distance increases, genetic isolation between populations or individuals also increases [54]. However, the correlation between genetic and geographic distances in our study was not very strong. So, the low-level genetic structure of the B. pendula in the Irtysh River basin could not be separated from its geographic distribution in the basin (the formation of B. pendula river valley forests is importantly related to the flow of water), as well as the influence of the spread of propagules.
Both the mode and extent of dispersal of plant propagules affect genetic structure. Plants can rely on the dispersal of propagules, which in turn expands their distribution and discovers new habitats, and gene flow can occur based on genetic structures [55]. The more frequent the gene flow between populations caused by seed dispersal is, the more similar plant populations will be to each other [45], and the closer the genetic distance between populations is, the lower the level of the genetic structure of the species will be.
Long-distance gene flow can generally be realized with the help of seed dispersal. The seed types and characteristics of B. pendula are well suited for long-distance wind dispersal. In this study, the adjacent tributaries were genetically closer to each other and were divided into one group in terms of genetic structure. Because neighboring tributaries are closer to each other than other tributaries, they are more likely to exchange genes. The more frequently genes are exchanged between tributaries, the more similar the genetic composition is. Then, the genetic distance is closer, and ultimately the genetic structure is more clustered.

4.3. The Distribution of B. pendula Haplotype Indicates the Existence of a Refugium in the Irtysh River Basin during the Last Glacial Ice Age

Haplotypes play a crucial role in elucidating the lineage history of species, and many current studies use haplotypes to speculate on possible refuges for species. In biological terms, a refugium refers to the retreat of organisms from adverse environmental conditions to a place with a relatively suitable climate [56]. The impact of the Quaternary glacial period on the current distribution of plants was significant. This period, which occurred approximately three million years ago, was marked by drought and a cold climate, which had a considerable effect on the distribution and differentiation of plants [57]. In their review of genealogical geography studies in Northwest China, Meng et al. [58] suggested the presence of a plant refugium in the Altai–Tianshan Mountains. Studies on plant phylogeography in Northwest China have supported the aforementioned findings [59], and additional studies have indicated that there was a refugium for birch in northern Xinjiang, China, particularly in the Altai Mountains [60], during the ice age.
The spatial distribution of haplotypes within the Irtysh River basin exhibited conspicuous geographical disparities. Notably, from the downstream tributary, the Berezek River, to the other upstream tributaries, the haplotype type gradually decreased. The haplotype types were different among tributaries, but there were shared haplotypes. In the lowest tributary, the Berezek River, not only was the population small, but the most abundant haplotype species present was also characterized by its original haplotype of B. pendula. According to refugium theory, areas exhibiting high genetic diversity, ancient haplotypes, and a greater number of haplotype types were considered to be potential refugia for this species during the last glacial ice age [61]. Chen et al. [60] already found that the Altai Mountains were ice-age refuges for Betula platyphylla, and as a birch tree of the same genus as Betula platyphylla with a very close affinity, the present study suggests that the Berezek River was most likely to be the ice-age refuge of B. pendula in the Irtysh River basin. The refuge is an important germplasm repository for B. pendula. Of course, this analysis of the results is subject to continued validation by genealogical geography, such as fossilized plant pollen. This work will establish the basis for future studies on the adaptive evolution and genetic differentiation routes of B. pendula, which will allow for more effective conservation of B. pendula germplasm resources.

4.4. Protection Strategy of High-Quality Genetic Resources of B. pendula

The primary findings of this study indicated that the dominant species in the tributaries of the Irtysh River basin possessed significant genetic diversity and served as a key group species, playing a vital role in maintaining ecosystem stability and restoring degraded river valley forests. However, this species has received relatively little attention in previous studies [49,62].
Populations exhibiting greater genetic divergence have a higher capacity to adapt to environmental variations. The populations of B. pendula situated within the Berezek River can be characterized by their small size and susceptibility to gene drift and evolutionary change. These populations represent priority conservation objectives, as they possess significant evolutionary potential and may be utilized to establish germplasm banks, such as those for Be2 populations, within the Berezek River.
It was anticipated that high levels of genetic diversity could enhance the capability of a species to adapt to selection pressures. Furthermore, we propose reinforcing the conservation of the natural forest population in the Burgin River, which exhibited rich genetic diversity and the highest gene flow. This can effectively preserve the natural forest population. Finally, genetic exchange between tributaries can be promoted through artificial introductions. In particular, this would increase the genetic diversity of B. pendula and prevent the occurrence of decline between the Berezek River and other tributaries.

5. Conclusions

In this study, we analyzed the genetic diversity of B. pendula in different tributaries of the Irtysh River basin based on chloroplast microsatellite molecular markers. We clarified that the downstream tributary, the Berezek River, was the tributary with the highest genetic diversity of B. pendula in this basin. At the same time, the genetic diversity of the downstream population was the highest in the whole Irtysh River basin. The genetic structure of B. pendula in the basin was divided into two major groups with obvious structural differences, bounded by the Haba River and Burgin River. Based on the above conclusions, we also proposed some conservation measures for the forest resources of B. pendula. We suggest that the downstream tributaries and populations with higher genetic diversity should be taken as important objects of genetic resource protection, which will be more conducive to the sustainable performance of the ecological function of the B. pendula natural forests of the Irtysh River basin.

Author Contributions

Y.L. and Z.X. contributed equally to this paper, and they are joint first authors. Conceptualization, Y.L. and T.L.; methodology, Y.L., Z.X. and T.L.; software, Y.L.; validation, Y.L. and Z.X.; formal analysis, Y.L.; investigation, J.S., Y.Y., L.X. and Z.Z.; resources, J.S. and Y.Y.; data curation, Z.Z.; writing—original draft preparation, Y.L.; writing—review and editing, T.L.; visualization, Y.L. and Z.X.; supervision, T.L.; project administration, T.L.; funding acquisition, T.L. All authors have read and agreed to the published version of the manuscript.

Funding

This research was supported by the Third Xinjiang Scientific Expedition Program, grant number 2021xjkk0603. Founder: Ministry of Science and Technology. It is also supported by the Key Science and Technology Project of Xinjiang Production and Construction Corps, grant number 2022AB010, founder: Xinjiang Production and construction Corps science and Technology Bureau.

Institutional Review Board Statement

Not applicable.

Informed Consent Statement

Not applicable.

Data Availability Statement

The raw data supporting the conclusions of this article will be made available by the authors, without undue reservation.

Conflicts of Interest

All authors were employed by Xinjiang Production and Construction Corps Key Laboratory of Oasis Town and Mountain Basin System Ecology.

Appendix A

Table A1. Each haplotype constitutes a detailed information table.
HaplotypeAllele Size Combination
ccmp4ccmp5BCMS1BCMS2
H1114100167160
H2115100168160
H3114100168160
H4115100167160
H5114101167160
H6115100169160
H7115101168160
H8115101167160
H9114101168160
H1011499167160
H1111499168160
H12115101169160
Note: The first column of the table is the haplotype name, and the last four columns indicate the size of the allelic fragments that make up each haplotype, such as haplotype H1, consisting of 114, 100, 167, and 160.
Table A2. Number of haplotype species in various groups of B. pendula.
Hap.PopulationTotalFre.
K1K2K3C1C2C3C4B1B2B3B4B5B6B7B8Ha1Ha2Ha3Ha4Ha5Ha6Ha7Ha8Be1Be2
H1000200110010000131116160138552940.377
H22553644233434350100336001700.174
H3000000010000000109104053031460.136
H42543644101212450000120000470.116
H50000000100000004313004011180.081
H60000000132222000100214001210.048
H71000000122012000000100003130.035
H8100000002200200000000000290.023
H9000000000000000110000000020.0027
H10000000000000000100000000010.0025
H11000000000000000100000000010.0025
H12000000000000000000000000110.0025
No.4223223745445226633455137
Note: Hap. means haplotypes; Fre. means frequency; No. means haplotype types in each population. Unique haplotypes are shown in red in the table.

References

  1. Li, Q.; Chen, J. The primary task of watershed-scale comprehensive conservation of Yangtze River Basin: Conservation and sustainable utilization of plant genetic diversity. Biodivers. Sci. 2018, 26, 327–332. [Google Scholar] [CrossRef]
  2. Koskela, J.; Buck, A.; du Cros, E.T. Climate Change and Forest Genetic Diversity: Implications for Sustainable Forest Management in Europe; Bioversity International: Rome, Italy, 2007; p. 5. [Google Scholar]
  3. Fady, B.; Aravanopoulos, F.A.; Alizoti, P.; Mátyás, C.; von Wühlisch, G.; Westergren, M.; Belletti, P.; Cvjetkovic, B.; Ducci, F.; Huber, G. Evolution-based approach needed for the conservation and silviculture of peripheral forest tree populations. For. Ecol. Manag. 2016, 375, 66–75. [Google Scholar] [CrossRef]
  4. Hughes, F.M.; Rood, S.B. Allocation of river flows for restoration of floodplain forest ecosystems: A review of approaches and their applicability in Europe. Environ. Manag. 2003, 32, 12–33. [Google Scholar] [CrossRef] [PubMed]
  5. Hughes, F.M.R.; Colston, A.; Mountford, J.O. Restoring riparian ecosystems: The challenge of accommodating variability and designing restoration trajectories. Ecol. Soc. 2005, 10, 12. [Google Scholar] [CrossRef]
  6. Liu, L.; Wang, J.; Ma, X.; Li, M.; Guo, X.; Yin, M.; Cai, Y.; Yu, X.; Du, N.; Wang, R. Impacts of the yellow River and Qingtongxia dams on genetic diversity of Phragmites australis in Ningxia Plain, China. Aquat. Bot. 2021, 169, 103341. [Google Scholar] [CrossRef]
  7. Altermatt, F.J. Diversity in riverine metacommunities: A network perspective. Aquat. Ecol. 2013, 47, 365–377. [Google Scholar] [CrossRef]
  8. Liu, Y.; Jiang, Y.; Zhang, S.; Wang, D.; Chen, H. Application of a Linked Hydrodynamic–Groundwater Model for Accurate Groundwater Simulation in Floodplain Areas: A Case Study of Irtysh River, China. Water 2023, 15, 3059. [Google Scholar] [CrossRef]
  9. Xue, Z.-F.; Liu, T.; Wang, L.; Song, J.-H.; Chen, H.-Y.; Xu, L.; Yuan, Y. Community structure and characteristics of the plain valley forests in the main tributaries of the Ertix River Basin, China. Chin. J. Plant Ecol. 2024, 48. [Google Scholar] [CrossRef]
  10. Geburek, T.; Hiess, K.; Litschauer, R.; Milasowszky, N. Temporal pollen pattern in temperate trees: Expedience or fate? Oikos 2012, 121, 1603–1612. [Google Scholar] [CrossRef]
  11. Hynynen, J.; Niemistö, P.; Viherä-Aarnio, A.; Brunner, A.; Hein, S.; Velling, P. Silviculture of birch (Betula pendula Roth and Betula pubescens Ehrh.) in northern Europe. Forestry 2010, 83, 103–119. [Google Scholar] [CrossRef]
  12. Wagner, S.; Wälder, K.; Ribbens, E.; Zeibig, A. Directionality in fruit dispersal models for anemochorous forest trees. Ecol. Modell. 2004, 179, 487–498. [Google Scholar] [CrossRef]
  13. Czarnecka, J. Seed dispersal effectiveness in three adjacent plant communities: Xerothermic grassland, brushwood and woodland. Ann. Botan. Fenn. 2005, 42, 161–171. [Google Scholar]
  14. Belletti, P.; Ferrazzini, D.; Ducci, F.; De Rogatis, A.; Mucciarelli, M. Genetic diversity of Italian populations of Abies alba. Dendrobiology 2017, 77, 147–159. [Google Scholar] [CrossRef]
  15. Allen, J.A.; Keeland, B. A Guide to Bottomland Hardwood Restoration; US Geological Survey, Biological Resources Division and US Department of Agriculture, Southern Research Station: Asheville, NC, USA, 2001. [Google Scholar]
  16. Garssen, A.G.; Baattrup-Pedersen, A.; Voesenek, L.A.; Verhoeven, J.T.; Soons, M.B. Riparian plant community responses to increased flooding: A meta-analysis. Global Chang. Biol. 2015, 21, 2881–2890. [Google Scholar] [CrossRef] [PubMed]
  17. Zheng, S.; Zhang, J.; He, C.; Bao, E.; Duan, A.; Zeng, Y.; Sai, L. Genetic diversity of Populus laurifolia and Populus nigra along Erqis River. For. Res. 2014, 27, 295–301. [Google Scholar] [CrossRef]
  18. Raymond, L.; Plantegenest, M.; Vialatte, A. Migration and dispersal may drive to high genetic variation and significant genetic mixing: The case of two agriculturally important, continental hoverflies (Episyrphus balteatus and Sphaerophoria scripta). Mol. Ecol. 2013, 22, 5329–5339. [Google Scholar] [CrossRef] [PubMed]
  19. Gruber, K.; Schöning, C.; Otte, M.; Kinuthia, W.; Hasselmann, M. Distinct subspecies or phenotypic plasticity? Genetic and morphological differentiation of mountain honey bees in East Africa. Ecol. Evol. 2013, 3, 3204–3218. [Google Scholar] [CrossRef] [PubMed]
  20. Wernberg, T.; Coleman, M.A.; Bennett, S.; Thomsen, M.S.; Tuya, F.; Kelaher, B.P. Genetic diversity and kelp forest vulnerability to climatic stress. Sci. Rep. 2018, 8, 1851. [Google Scholar] [CrossRef] [PubMed]
  21. Lee, S.R.; Jo, Y.S.; Park, C.H.; Friedman, J.M.; Olson, M.S. Population genomic analysis suggests strong influence of river network on spatial distribution of genetic variation in invasive saltcedar across the southwestern United States. Mol. Ecol. 2018, 27, 636–646. [Google Scholar] [CrossRef] [PubMed]
  22. Sander, N.L.; Pérez-Zavala, F.; Da Silva, C.J.; Arruda, J.C.; Pulido, M.T.; Barelli, M.A.; Rossi, A.B.; Viana, A.P.; Boechat, M.S.; Bacon, C.D. Rivers shape population genetic structure in Mauritia flexuosa (Arecaceae). Ecol. Evol. 2018, 8, 6589–6598. [Google Scholar] [CrossRef]
  23. Blanchet, S.; Prunier, J.; Paz-Vinas, I.; Saint-Pé, K.; Rey, O.; Raffard, A.; Mathieu-Bégné, E.; Loot, G.; Fourtune, L.; Dubut, V. A river runs through it: The causes, consequences, and management of intraspecific diversity in river networks. Evol. Appl. 2020, 13, 1195–1213. [Google Scholar] [CrossRef] [PubMed]
  24. Wu, L.-X.; Wang, Y.-Q.; Xiao, S.-Y.; Wang, Y.-H.; Liu, J.; Gong, X.; Feng, X.-Y. Rivers have shaped the phylogeography of a narrowly distributed cycad lineage in Southwest China. Conserv. Genet. 2023, 25, 439–453. [Google Scholar] [CrossRef]
  25. Zhang, T.; Sun, H. Phylogeographic structure of Terminalia franchetii (Combretaceae) in southwest China and its implications for drainage geological history. J. Plant Res. 2011, 124, 63–73. [Google Scholar] [CrossRef]
  26. Zhou, Y.H.; Zhang, Y.; Kong, Z.C.; Yang, Z.; Yan, Q. Vegetation changes and human activities in the Betula wetland of Habahe in Xinjiang, China since 3600 cal a BP. Acta Ecol. Sin. 2023, 43, 1156–1164. [Google Scholar] [CrossRef]
  27. Wang, N.; Thomson, M.; Bodles, W.J.; Crawford, R.M.; Hunt, H.V.; Featherstone, A.W.; Pellicer, J.; Buggs, R.J. Genome sequence of dwarf birch (Betula nana) and cross-species RAD markers. Mol. Ecol. 2013, 22, 3098–3111. [Google Scholar] [CrossRef] [PubMed]
  28. Zeng, J.; Zou, Y.-P.; Bai, J.-Y.; Zheng, H.-S. Preparation of total DNA from “recalcitrant plant taxa”. Acta Bot. Sin. 2002, 44, 694–697. Available online: https://www.researchgate.net/publication/258113478_Preparation_of_Total_DNA_from_Recalcitrant_Plant_Taxa (accessed on 12 October 2023).
  29. Wills, D.M.; Hester, M.L.; Liu, A.; Burke, J.M. Chloroplast SSR polymorphisms in the Compositae and the mode of organellar inheritance in Helianthus annuus. Theor. Appl. Genet. 2005, 110, 941–947. [Google Scholar] [CrossRef]
  30. Meucci, S.; Schulte, L.; Zimmermann, H.H.; Stoof-Leichsenring, K.R.; Epp, L.; Bronken Eidesen, P.; Herzschuh, U. Holocene chloroplast genetic variation of shrubs (Alnus alnobetula, Betula nana, Salix sp.) at the siberian tundra-taiga ecotone inferred from modern chloroplast genome assembly and sedimentary ancient DNA analyses. Ecol. Evol. 2021, 11, 2173–2193. [Google Scholar] [CrossRef]
  31. Ismail, N.A.; Rafii, M.; Mahmud, T.; Hanafi, M.; Miah, G. Genetic diversity of torch ginger (Etlingera elatior) germplasm revealed by ISSR and SSR markers. Biomed Res. Int. 2019, 2019, 5904804. [Google Scholar] [CrossRef] [PubMed]
  32. Thomson, A.M.; Dick, C.W.; Dayanandan, S. A similar phylogeographical structure among sympatric North American birches (Betula) is better explained by introgression than by shared biogeographical history. J. Biogeogr. 2015, 42, 339–350. [Google Scholar] [CrossRef]
  33. Peakall, R.; Smouse, P.E. GENALEX 6: Genetic analysis in Excel. Population genetic software for teaching and research. Bioinformatics 2006, 6, 288–295. [Google Scholar] [CrossRef]
  34. Liu, K.; Muse, S.V. PowerMarker: An integrated analysis environment for genetic marker analysis. Bioinformatics 2005, 21, 2128–2129. [Google Scholar] [CrossRef]
  35. Huang, Y.; Chen, X.; Liu, C.; Han, X.; Xiao, C.; Yi, S.; Huang, D.J. Genetic analysis of 32 InDels in four ethnic minorities from Chinese Xinjiang. PLoS ONE 2021, 16, e0250206. [Google Scholar] [CrossRef] [PubMed]
  36. Pritchard, J.K.; Stephens, M.; Donnelly, P. Inference of population structure using multilocus genotype data. Genetics 2000, 155, 945–959. [Google Scholar] [CrossRef]
  37. Fan, W.; Gai, H.; Sun, X.; Yang, A.; Zhang, Z.; Ren, M. DataFormater, a software for SSR data formatting to develop population genetics analysis. Mol. Plant Breed 2016, 14, 265–270. [Google Scholar] [CrossRef]
  38. Earl, D.A.; VonHoldt, B.M. Structure Harvester: A website and program for visualizing structure output and implementing the Evanno method. Conserv. Genet. Resour. 2012, 4, 359–361. [Google Scholar] [CrossRef]
  39. Riahi, L.; Zoghlami, N.; Laucou, V.; Mliki, A.; This, P. Use of chloroplast microsatellite markers as a tool to elucidate polymorphism, classification and origin of Tunisian grapevines. Sci. Hortic. 2011, 130, 781–786. [Google Scholar] [CrossRef]
  40. Buso, G.; Rangel, P.; Ferreira, M. Analysis of genetic variability of South American wild rice populations (Oryza glumaepatula) with isozymes and RAPD markers. Mol. Ecol. Notes 1998, 7, 107–117. [Google Scholar] [CrossRef]
  41. De Dato, G.D.; Teani, A.; Mattioni, C.; Aravanopoulos, F.; Avramidou, E.V.; Stojnic, S.; Ganopoulos, I.; Belletti, P.; Ducci, F. Genetic analysis by nuSSR markers of silver Birch (Betula pendula Roth) populations in their Southern European distribution range. Front. Plant Sci. 2020, 11, 310. [Google Scholar] [CrossRef] [PubMed]
  42. Palme, A.; Su, Q.; Palsson, S.; Lascoux, M. Extensive sharing of chloroplast haplotypes among European birches indicates hybridization among Betula pendula, B. pubescens and B. nana. Mol. Ecol. 2004, 13, 167–178. [Google Scholar] [CrossRef]
  43. Maliouchenko, O.; Palmé, A.E.; Buonamici, A.; Vendramin, G.; Lascoux, M. Comparative phylogeography and population structure of European Betula species, with particular focus on B. pendula and B. pubescens. J. Biogeogr. 2007, 34, 1601–1610. [Google Scholar] [CrossRef]
  44. Tsuda, Y.; Semerikov, V.; Sebastiani, F.; Vendramin, G.G.; Lascoux, M. Multispecies genetic structure and hybridization in the Betula genus across Eurasia. Mol. Ecol. 2017, 26, 589–605. [Google Scholar] [CrossRef] [PubMed]
  45. Slatkin, M. Gene flow and the geographic structure of natural populations. Science 1987, 236, 787–792. [Google Scholar] [CrossRef]
  46. Zeng, J.; Zou, Y.; Bai, J.; Zheng, H. RAPD analysis of genetic variation in natural populations of Betula alnoides from Guangxi, China. Euphytica 2003, 134, 33–41. [Google Scholar] [CrossRef]
  47. Silvertown, J. The evolutionary maintenance of sexual reproduction: Evidence from the ecological distribution of asexual reproduction in clonal plants. Int. J. Plant Sci. 2008, 169, 157–168. [Google Scholar] [CrossRef]
  48. Wang, Y.; Xie, L.; Zhang, G.; Guo, H.; Whitt, A.A.; Chen, W.; Han, L.; Ma, C. Effects of grazing intensity on sexual and clonal reproduction in a clonal xerophytic shrub. Pak. J. Bot 2020, 52, 1737–1744. [Google Scholar] [CrossRef] [PubMed]
  49. Beck, P.; Caudullo, G.; de Rigo, D.; Tinner, W. Betula Pendula, Betula Pubescens and Other Birches in Europe: Distribution, Habitat, Usage and Threats; Publication Office of the European Union: Luxembourg, 2016; pp. 70–73. [Google Scholar]
  50. Sannikov, S.; Sannikova, N. Outline of the hydrochory theory for some coniferous species. Dokl. Biol. Sci. 2008, 418, 67. [Google Scholar] [CrossRef] [PubMed]
  51. Duminil, J.; Fineschi, S.; Hampe, A.; Jordano, P.; Salvini, D.; Vendramin, G.G.; Petit, R.J. Can population genetic structure be predicted from life-history traits? Am. Nat. 2007, 169, 662–672. [Google Scholar] [CrossRef]
  52. Xie, Y.; Li, Z.; Huang, R.; Xiao, X.; Huang, Y. Genetic diversity of Betula luminifera populations at different elevations in Wuyi Mountain and its association with ecological factors. Front. For. China 2009, 4, 90–95. [Google Scholar] [CrossRef]
  53. Loveless, M.D.; Hamrick, J.L. Ecological determinants of genetic structure in plant populations. Annu. Rev. Ecol. Syst. 1984, 15, 65–95. [Google Scholar] [CrossRef]
  54. Wright, S. Isolation by distance. Genetics 1943, 28, 114. [Google Scholar] [CrossRef]
  55. Jay, F.; Manel, S.; Alvarez, N.; Durand, E.Y.; Thuiller, W.; Holderegger, R.; Taberlet, P.; François, O.J. Forecasting changes in population genetic structure of alpine plants in response to global warming. Mol. Ecol. 2012, 21, 2354–2368. [Google Scholar] [CrossRef] [PubMed]
  56. Stewart, J.R.; Lister, A.M.; Barnes, I.; Dalén, L. Refugia revisited: Individualistic responses of species in space and time. Proc. R. Soc. B Biol. Sci. 2010, 277, 661–671. [Google Scholar] [CrossRef]
  57. Qiu, Y.-X.; Fu, C.-X.; Comes, H.P. Plant molecular phylogeography in China and adjacent regions: Tracing the genetic imprints of Quaternary climate and environmental change in the world’s most diverse temperate flora. Mol. Phylogenet. Evol. 2011, 59, 225–244. [Google Scholar] [CrossRef]
  58. Meng, H.H.; Gao, X.Y.; Huang, J.F.; Zhang, M.L. Plant phylogeography in arid Northwest China: Retrospectives and perspectives. J. Syst. Evol. 2015, 53, 33–46. [Google Scholar] [CrossRef]
  59. Zhao, Y.; Pan, B.; Zhang, M.J.P.O. Phylogeography and conservation genetics of the endangered Tugarinovia mongolica (Asteraceae) from Inner Mongolia. Northwest China 2019, 14, e0211696. [Google Scholar] [CrossRef]
  60. Chen, T.Y.; Lou, A.R. Phylogeography and paleodistribution models of a widespread birch (Betula platyphylla Suk.) across East Asia: Multiple refugia, multidirectional expansion, and heterogeneous genetic pattern. Ecol. Evol. 2019, 9, 7792–7807. [Google Scholar] [CrossRef]
  61. Li, J.; Zhang, C.; Mipam, T.D.; Zhou, Q.; Chen, S. Effects of Climatic Change on Phylogeography and Ecological Niche of the Endemic Herb Elymus breviaristatus on the Qinghai-Tibet Plateau. Plants 2023, 12, 3326. [Google Scholar] [CrossRef]
  62. Dubois, H.; Claessens, H.; Ligot, G. Towards silviculture guidelines to produce large-sized silver birch (Betula pendula Roth) logs in Western Europe. Forests 2021, 12, 599. [Google Scholar] [CrossRef]
Figure 1. Map of the distribution of populations at sampling sites. Each red point on the map represents a sampled population, and the specific locations of the populations can be compared to Table 1.
Sustainability 16 03217 g001
Figure 2. Six microsatellite primers were used for screening (partial samples). P1, P2, P3, P4, P5, P6 represented six primers, and four primers, P1 (ccmp4), P2 (ccmp5), P4 (BCMS1), and P5 (BCMS2), with better amplification results were selected for subsequent tests.
Sustainability 16 03217 g002
Figure 3. Comparison of genetic diversity among tributaries. Different letters indicate significant differences between groups (upstream, midstream, and downstream) (p < 0.05). Letters a and b indicate significant differences: significant differences between different letters, and no significant differences between the same letters.
Sustainability 16 03217 g003
Figure 4. Mantel Test correlation analysis was performed on 198 sample individuals from 25 populations in five tributaries. (a) Correlation analysis of genetic and geographic distances between individuals; (b) correlation analysis of genetic and geographic distances between populations. GD: genetic distance (genetic distance matrix generated in GenAlex software based on chloroplast microsatellite detection data), GGD: geographic distance (geographic distance matrix generated in GenAlex software based on latitude and longitude coordinates).
Sustainability 16 03217 g004
Figure 5. PCA analysis and establishment of UPGAM evolutionary trees based on genetic distance for the B. pendula. (a) is the result of the principal component analysis of B. pendula. Populations from different tributaries are distinguished by different colors of fonts and symbols. The Kayertes River is shown using black fonts and short lines, the Crane River is orange and triangular, the Burgin River is blue and round, the Haba River is green and rectangular, and the Berezek River is red and rhombus. (b) Phylogenetic tree based on Nei’s genetic distance.
Sustainability 16 03217 g005
Figure 6. Population STRUCTURE analysis of B. pendula. (a) is the relationship between cluster value K and DeltaK, K ranges from 1 to 10, and the first mutation point on the broken line, that is to say, the best cluster value, is K = 2; (b) is the bar graph of the cluster structure (K = 2) of the 25 populations, with two different colors (red and green) representing different genetic groups, and the horizontal axis is the 25 populations (1–3 are the populations from the Kayertes River, 4–7 are those from the Crane River, 8–15 are those from the Burgin River, 16–23 are those from the Haba River, 24 and 25 are populations of the Berezek River.
Sustainability 16 03217 g006
Figure 7. Stacked bar plots of haplotype frequencies in 25 populations of B. pendula. The horizontal axis is the population and the vertical axis is the frequency magnitude. The 12 haplotypes are represented in different colors; the number of colors on a column indicates the number of haplotypes present in the population.
Sustainability 16 03217 g007
Figure 8. Geographic distribution of the haplotypes of B. pendula.
Sustainability 16 03217 g008
Figure 9. Haplotype network relationship diagram. Each haplotype is represented by a circle of different size and color. The larger circle represents the higher frequency of the haplotype, and the number on the horizontal line represents the number of allelic differences between haplotypes.
Sustainability 16 03217 g009
Table 1. Material information table of B. pendula.
RiverPopulationSampleLongitude (°E)Latitude (°N)
Kayertes RiverF1289°27′46°59′
F2589°40′47°19′
F3589°40′47°8′
Crane RiverK1588°8′47°46′
K2588°7′47°52′
K3588°13′47°58′
K4588°6′47°56′
Burgin RiverB1587°3′47°45′
B2587°6′47°47′
B3587°8′47°49′
B4587°10′47°50′
B5486°58′47°44′
B6586°53′47°43′
B7487°1′48°40′
B8587°25′48°33′
Haba RiverHa11786°22′48°7′
Ha21486°23′48°8′
Ha31786°21′48°6′
Ha41786°19′48°3′
Ha51486°17′48°1′
Ha61686°16′47°58′
Ha71686°11′47°53′
Ha8586°37′48°27′
Berezek RiverBe1685°55′48°18′
Be2685°49′48°9′
Note: The first column of the table is the name of the five tributaries of the Irtysh River. The second column shows the population names selected in each tributary; the third column is the number of samples selected for each population.
Table 2. Chloroplast microsatellite primers.
CodePrimerRepeat TypePrimer Sequence (5′~3′)
P1ccmp4 *(T)115′-AATGCTGAATCGAYGACCTA-3′
5′-CCAAAATATTBGGAGGACTCT-3′
P2ccmp5 *(T)145′-TGTTCCAATATCTTCTTGTCATTT-3′
5′-AGGTTCCATCGGAACAATTAT-3′
P3ccmp7 *(A)75′-CAACATATACCACTGTCAAG-3′
5′-ACATCATTATTGTATACTCTTTC-3′
P4BCMS1 †(T)105′-GCTCTTTTCGTTAGCGGTTT-3′
5′-ATTTGAAGCGGGGATACCTT-3′
P5BCMS2 ‡(T)115′-CCGCTTCAAATTTTAATGAT-3′
5′-GATGACTTGGGTTTATGTCAA-3′
P6BCMS3 †(A)85′-CGGGCAAAACCAACAAAAT-3′
5′-GGGTTCGAATCCCTCTCTCT-3′
Note: * Thermal cycling conditions consisted of initial denaturation at 94 °C for 4 min, 35 cycles of 94 °C for 1 min, 45 °C for 1 min, 65 °C for 1 min and a final extension of 65 °C for 10 min. † Initial denaturation of 94 °C for 4 min, 35 cycles of 94 °C for 45 s, 55 °C for 45 s, 72 °C for 45 s, and a final extension of 72 °C for 1 min. ‡ Initial denaturation of 94 °C for 4 min, 35 cycles of 94 °C for 45 s, 55 °C for 45 s, 72 °C for 45 s, and a final extension of 72 °C for 1 min.
Table 3. Genetic variation in chloroplast microsatellite markers.
Parameters of PolymorphismPrimer
ccmp4ccmp5BCMS1BCMS2
allele number (Na)2331
allele loci114; 11599; 100; 101167; 168; 169160
effective number of alleles (Ne)1.2091.3402.0251.000
Shannon diversity index (I)0.1860.3050.7350.000
polymorphism information content (PIC)0.36460.22000.42530
Table 4. Genetic diversity of B. pendula in each tributary.
TributaryNNaNeIFstNm
Kayertes River121.501.2680.2160.0288.778
Crane River201.501.3250.2760.0386.279
Burgin River382.001.5700.4540.01813.519
Haba River1162.251.3240.3620.0554.255
Berezek River122.001.7160.5460.3080.563
Irtysh River basin1981.851.4400.3710.3150.544
Note: N is the number of sample individuals, Na is the number of alleles, Ne is the number of effective alleles, I is the Shannon diversity index, Fst is the genetic differentiation index, and Nm is the gene flow index.
Table 5. Genetic differentiation of B. pendula between tributaries.
KayertesCraneBurginHabaBerezek
Kayertes 0.1060.0800.0010.001
Crane0.028 0.0050.0010.001
Burgin0.0340.048 0.0010.001
Haba0.3850.2760.286 0.021
Berezek0.2250.1590.1380.052
Note: Fst values below the diagonal. Probability, p (rand ≥ data), is shown above the diagonal.
Table 6. Genetic molecular variance analysis of B. pendula in the Irtysh River basin.
Source of VarianceVariancePercentages of Variance (%)
Among Pops0.20131
Within Pops0.43769
Total0.638100
Disclaimer/Publisher’s Note: The statements, opinions and data contained in all publications are solely those of the individual author(s) and contributor(s) and not of MDPI and/or the editor(s). MDPI and/or the editor(s) disclaim responsibility for any injury to people or property resulting from any ideas, methods, instructions or products referred to in the content.

