1. Introduction
1.1. Background
Areas that are important to biodiversity conservation or those of high conservation value provide significant benefits to people. These landscapes and seascapes are essential to human wellbeing, as they provide various goods and ecosystem services, and in most cases, they are inherently resistant to external shocks and stresses, having been shaped and strengthened by long-term interactions between nature and people. The Philippines, considered one of the biodiversity hotspots in the world, housing diverse types of ecosystems and species, faces biodiversity loss and habitat degradation due to climate change, land use changes, and other anthropogenic factors. This can ultimately cause changes in the provision of ecosystem services and affect the natural capital that many people depend on. Since the 1990s, a number of protected areas have been established to safeguard areas that have biologically and ecologically unique features and characteristics; however, the need to transform protected area management (PAM) systems into a more holistic approach remains a challenge [
1]. More recently as well, the Philippines adopted the Global Biodiversity Framework, with 23 targets on safeguarding biodiversity to achieve by 2030, and this is specified in the Philippine Biodiversity Strategy and Action Plan 2015–2028 [
2]. This entails effective conservation management of at least 30% of the world’s land, inland waters, coastal areas and oceans, with emphasis on areas of particular importance to biodiversity ecosystem functioning and services [
3]. In 1993, the Philippine government, through the Palawan Council for Sustainable Development (PCSD), initiated the establishment of the Environmentally Critical Areas Network (ECAN) in Palawan, the largest island province in the Philippines. ECAN employs a graded zoning scheme designed to safeguard and regulate the management of Palawan’s remaining natural resources, both terrestrial and marine, as outlined in the Philippines Republic Act 7611 [
4]. According to this strategy, areas with natural resources requiring the highest level of protection are designated as core zones, followed by zones with progressively less stringent regulations (buffer and multiple-use zones). The initial maps delineating the ECAN zones were created in 1994 (PCSD Resolution No. 94-44).
1.2. Literature Review
Key to conservation goals is understanding and recognizing how people interact with the environment, how they depend on the environment directly and indirectly, how different externalities (e.g., land uses, institutional policy and protection zoning, etc.) come into play, and how the delivery of ecosystem services can be sustained while balancing development and conservation. The interaction between human and nature over many years have resulted to dynamic mosaics of land and sea uses called socio-ecological production landscapes and seascapes (SEPLS) which are characterized by various ecosystem types and functions [
5]. Ecosystem services (ESs) are equitable to the goods/benefits humans obtain from ecosystem functions [
6]. While there are a lot of approaches to recognizing, valuing, and capturing ESs and nature’s contribution to people (NCP), there is still a need to widely assess the suitability of the type of methodological valuation to be used for the local context in order to avoid the danger of expressing the value of natural systems solely in economic terms. Most recently, the Intergovernmental Science-Policy Platform on Biodiversity and Ecosystem Services (IPBES), through its Values Assessment Report released in 2022 [
7], highlighted how different worldviews and knowledge systems influence the ways people interact with and value nature. The report emphasized the embedding of the diverse values of nature into decision-making and as a policy instrument for transformation. Mismatched values owing to multiple resource users and trade-offs among ESs generate conflicts in natural resource management, development, and planning [
8]. Thus, it is important that a framework that incorporates local community values into the design of ecosystem-based policies be formulated. Among the possible tools for local ES management, (1) payment for ecosystem services (PES) based on an analysis of willingness to pay (WTP) and (2) mapping ES values are two major tools.
PES is widely accepted as a promising tool at the local level for enhancing or safeguarding the provision of ESs [
9]. With this policy instrument, beneficiaries pay in cash or in kind/labor for management costs. As a process of crafting a public PES scheme, contingent valuation is used to estimate the WTP, and its sum is targeted at public welfare and goes to the stakeholders/beneficiaries directly managing the ESs. Existing studies on WTP in the Philippines are limited, although these suggest that WTP is influenced by social factors. For instance, Calderon et al. [
10] found that among socio-economic variables, educational attainment affect WTP for improved ecosystem services in a watershed area. Bueno et al. [
11] found that household income, willingness to participate in the management activities, and place of residence influence WTP for water quality improvement of a freshwater lake. Similarly, but in a different geographical region other than the Philippines, age, income, and nationality were observed to significantly affect WTP for a natural park management [
12]. There is a growing body of stated preference studies advocating for a more deliberate integration of the spatial dimension into the examination of environmental preferences [
13,
14].
Value maps provide an extensive array of information valuable for policy- and decision-making and as a point of reference in stakeholder meetings. Visualization methods like mapping serve as valuable tools in environmental management. A single landscape may hold value for various reasons, resulting in intersections or focal points of values, which provide information on the actual use of resources [
15]. Participatory GIS offers a distinct method for involving civil society in decision-making by combining local knowledge with intricate spatial information [
16]. Mapping is a way of expressing ecosystem benefits within a common framework and in a way that is visual and appealing. Mapping values have been used in multiple applications for natural resource and environmental planning and management [
17]. Participatory mapping of ESs can help increase awareness of nature’s benefits, foster empowerment, and incorporate local knowledge into management decisions [
18].
1.3. Research Objectives
The attention toward the ESs concept has grown in policy and scientific communities in recent decades, and the ecosystem services framework is gaining salience as a policy-relevant research tool [
19]. While the ESs concept and its approaches are increasingly promoted through international and national policies, municipalities and local communities are still struggling with translating them into practice [
20]. There are significant challenges such as the complexity of the assessment approach, the insufficient stakeholder capacity for participation, and a lack of research that incorporates local perceptions.
In this research, mapping ecosystem services—specifically in the form of landscape values—was used as a tool to assess the delivery of ecosystem services in a broader landscape context. We aimed to identify whether there are any mismatches in the current management regime and local perception and recommend alternative management strategy based on the spatial overlaps between the perceived landscape values and existing zoning. The general objective of this study was to identify and assess the ecosystem services in Malampaya Sound Protected Landscape and Seascape (MSPLS) exploring the use of a landscape-level approach to ES valuation and landscape value mapping and create a basis for policy recommendations for decision-makers. Specifically, it aimed to:
Identify the most important or priority ESs that local people associate with Malampaya and their overlap with the existing zoning;
Determine how and why local communities perceive ecosystem services as they do through landscape value mapping;
Examine the willingness to pay (WTP) for the improvement of ESs in Malampaya and the factors affecting WTP.
2. Materials and Methods
2.1. Conceptual Framework
Recent studies have emphasized the potential of participatory mapping to assess ecosystem service provision as a platform for stakeholders [
21]. Additionally, ecosystem service concepts can facilitate participation in decision-making by explicitly explaining the role of the ecosystem in sustainable environmental management [
22]. Based on participatory approaches, national marine protected areas, for instance, can be contextualized for local communities and the environment [
23]. An ecosystem service map itself cannot completely overcome the power disparities between participants, and thus methods using maps need to be further developed [
24]. In this study, we elevated the importance of triangulation in holistic planning and PA management (as highlighted in Lukman et al., [
25], Hockings et al. [
26], and IPBES [
7] and utilized an integrative conceptual framework to contribute to the mainstreaming of ESs into policies and practices.
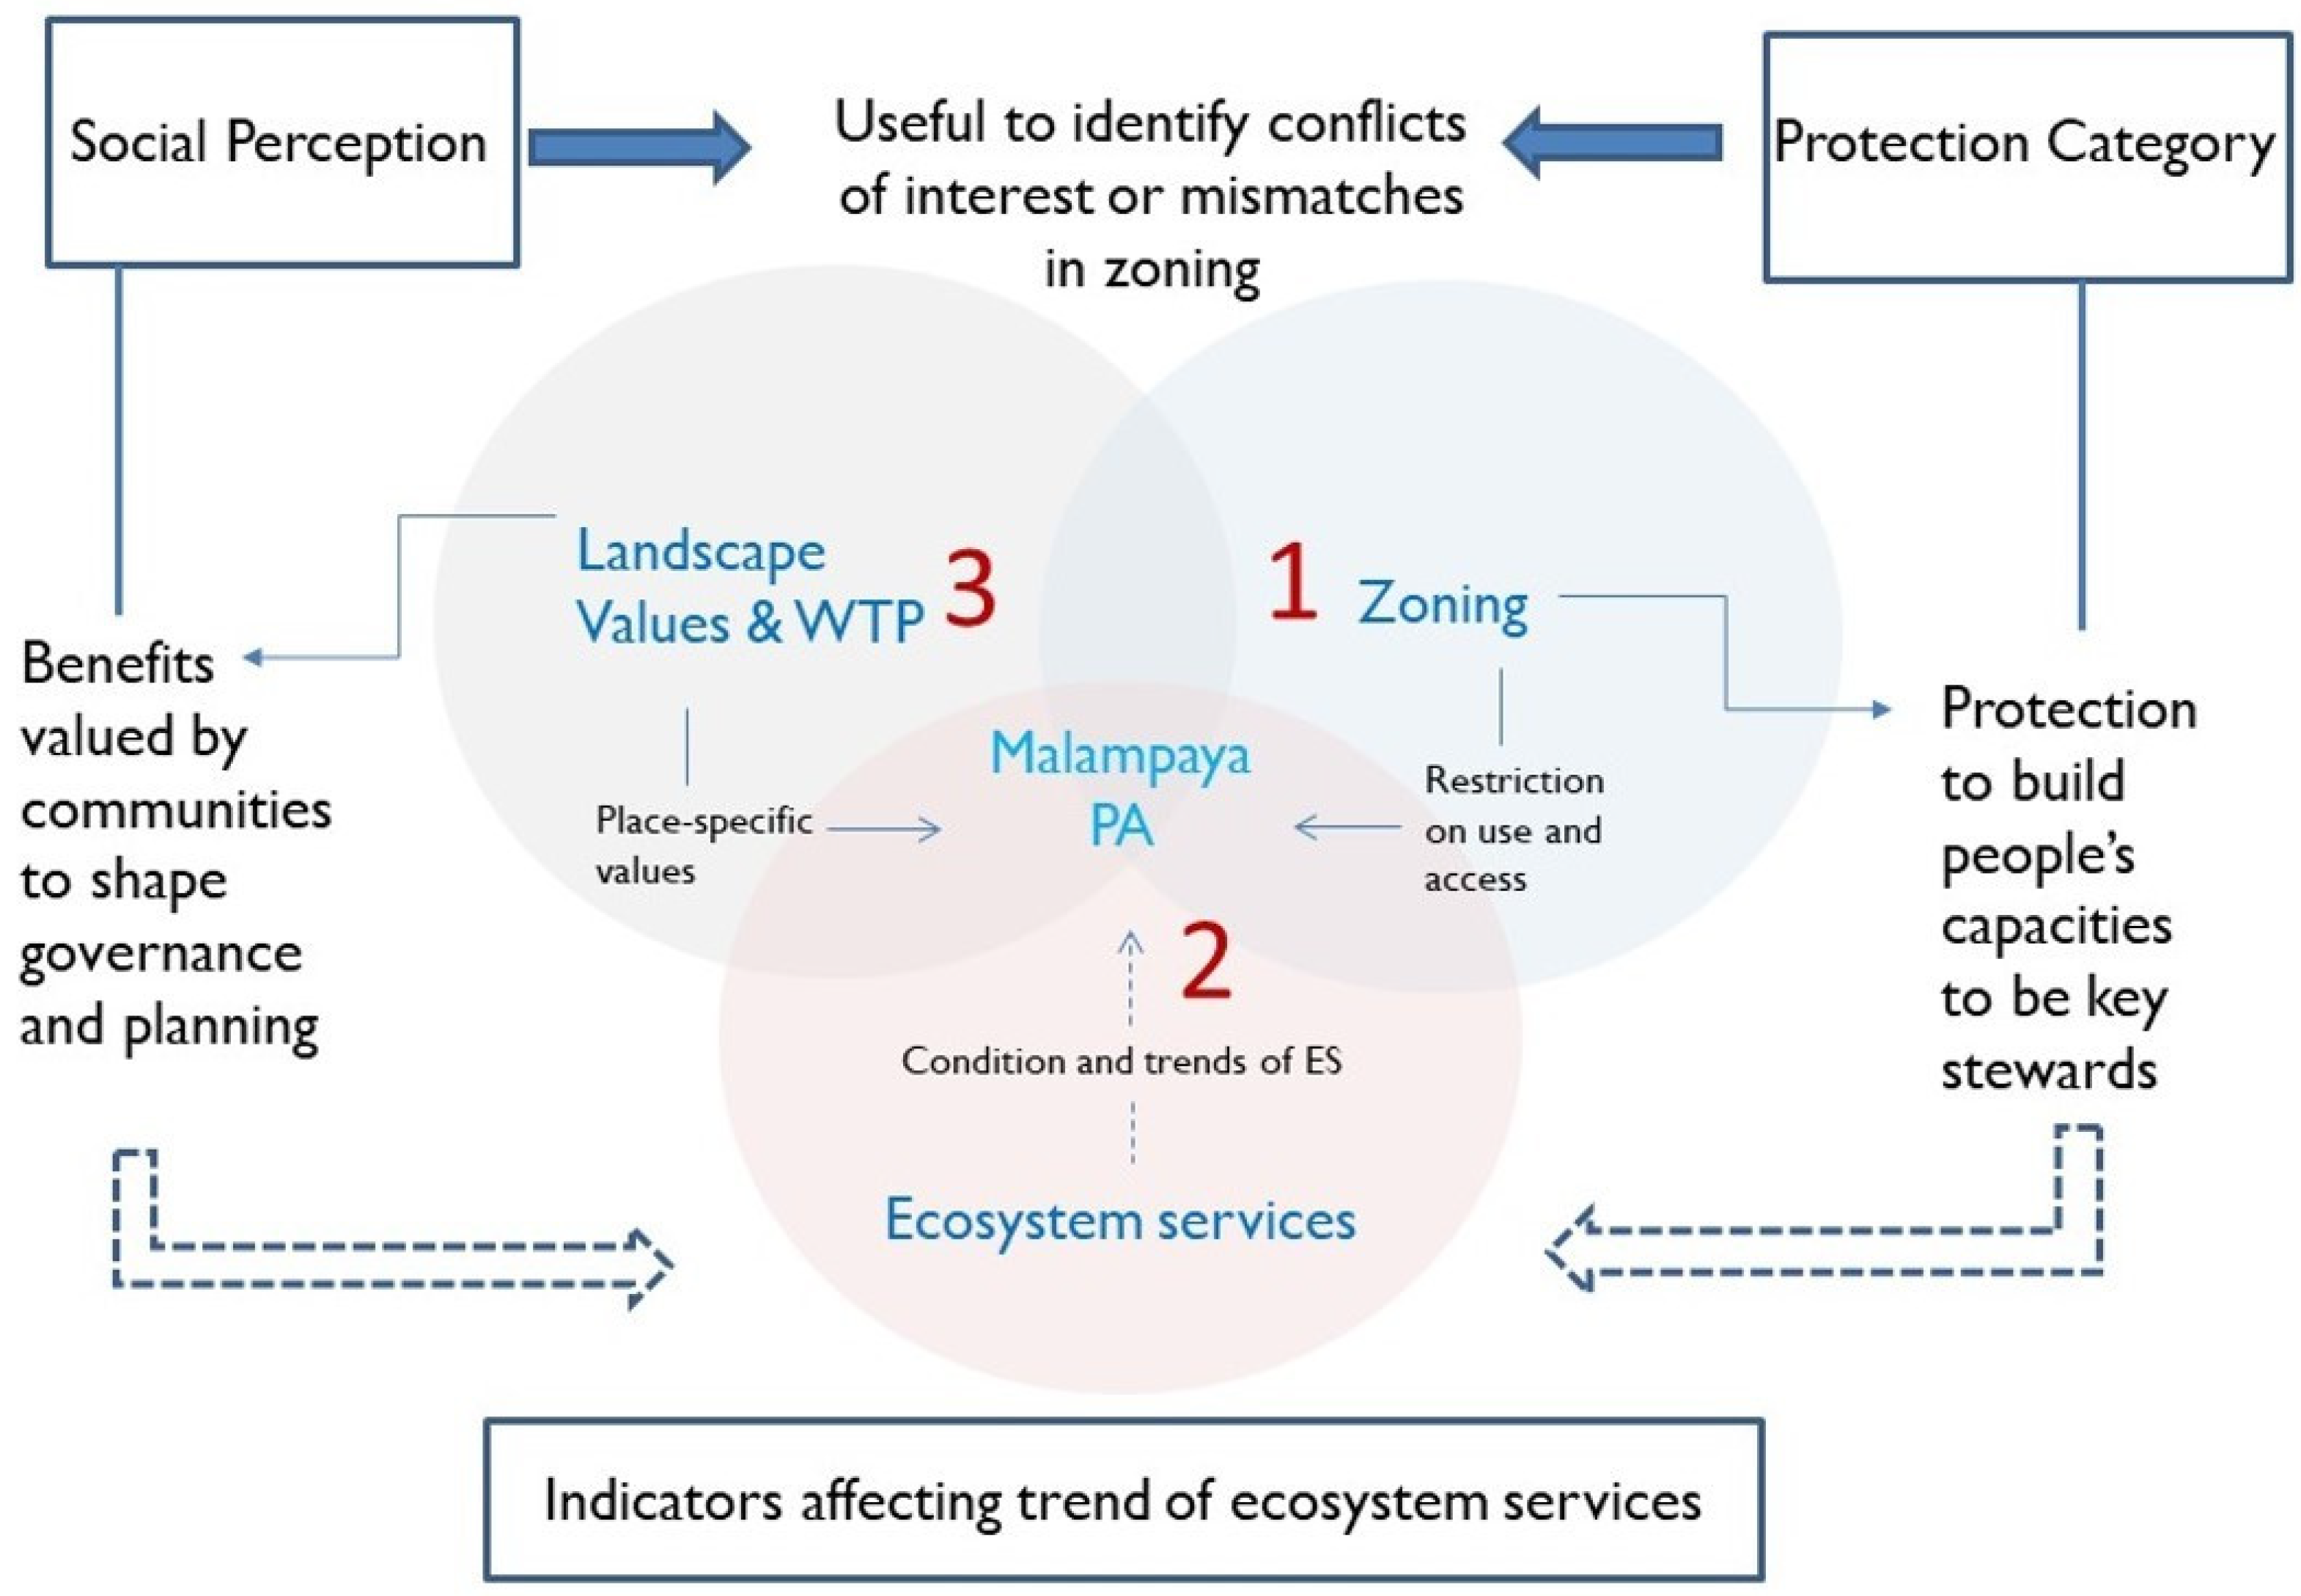
To achieve our research objectives, we proposed a three-pronged framework (
Figure 1) to ascertain the local communities’ dependence and impact on ESs and identify mismatches with MSPLS’ current management regime. We used the Millennium Ecosystem Assessment (the Millenium Ecosystem Assessment (MA) classification involves four types of ESs, which are cultural, provisioning, regulating, and supporting.) [
27] as an umbrella concept to distinguish between provisioning, regulating, cultural, and supporting services and adopted the value mapping methodology developed by Reed and Brown (2003) [
28] and Brown (2004) [
29], in which a subset of 14 landscape values were used for ES delineation/identification. To illustrate the values at the spatial level, we digitized and vectorized all the value points identified by respondents and calculated the number of points for each value in each vector cell. A rasterization of the total number of points per value based on WTP was computed, creating heat maps. WTP was measured to understand place-specific values with a high priority for the local people and identify varied socio-demographic factors influencing WTP. This could help in identifying places in the area where policymakers can target environmental improvements. Zoning policies (ECAN zones) may need to be improved or adjusted based on the result of the spatial overlaps between social perception and the protection categories, and future management can be re-aligned with local communities’ needs, reducing conflicts and increasing spatial synergy.
The specific approach to measuring WTP was contingent valuation, which is a common method for measuring ecosystem values, using a survey-based technique for the economic valuation of non-market resources [
30]. The advantage of using this is that since the price range is not given or not identified, respondents have the freedom to choose their answer. The disadvantage is the value can be very high or low, as it will depend on the respondent’s key assumption of the ecosystem value. There has been no research on WTP in MSPLS, and in future research in the area, the predetermined range for payment based on our study could be used. A description of the study site and the detailed methodology are described in the sub-sections below.
2.2. Study Area (Malampaya Sound)
Malampaya Sound is one of the richest fishing grounds in the Philippines, which was declared a protected area on 12 July 2000 as per Presidential Proclamation No. 342, signed by former President Joseph E. Estrada and as part of the Republic Act No. 7586 or the National Integrated Protected Area System of the Philippines. It is also a watershed reserve and home to wide array of endemic flora and fauna. It is located in the northwestern part of the province of Palawan and is approximately 217 km by road from Puerto Princesa City, the capital city. It dominantly belongs to the municipality of Taytay, and a portion of it is part of the municipality of San Vicente. The Sound is a 34-km elongated body of water and is divided into two sections: the Inner and the Outer Sound. The Inner Sound is brackish water, where plenty of shrimp, crabs, and snappers are caught. The Outer Sound contains seagrass beds and corals that invite plentiful fish. Malampaya in local dialect means “rich in fish”. It is a word of the Tagbanua tribe, the first inhabitants of the place.
Conflicts on resource utilization in Malampaya arose several decades ago with the advent of commercial logging and fishing activities. This fierce competition for resources persisted over the years, leading to the depletion of fisheries by the 1970s. Periodic restrictions were imposed on commercial fishing. However, officials frequently introduced conflicting policies and programs concerning commercial development and resource conservation, often lacking sufficient community involvement and support [
31]. With the establishment of the Protected Area Management Board (PAMB), some efforts were kicked off to establish a linkage between stakeholders and/or local communities through facilitated top-down public dialogues and workshops.
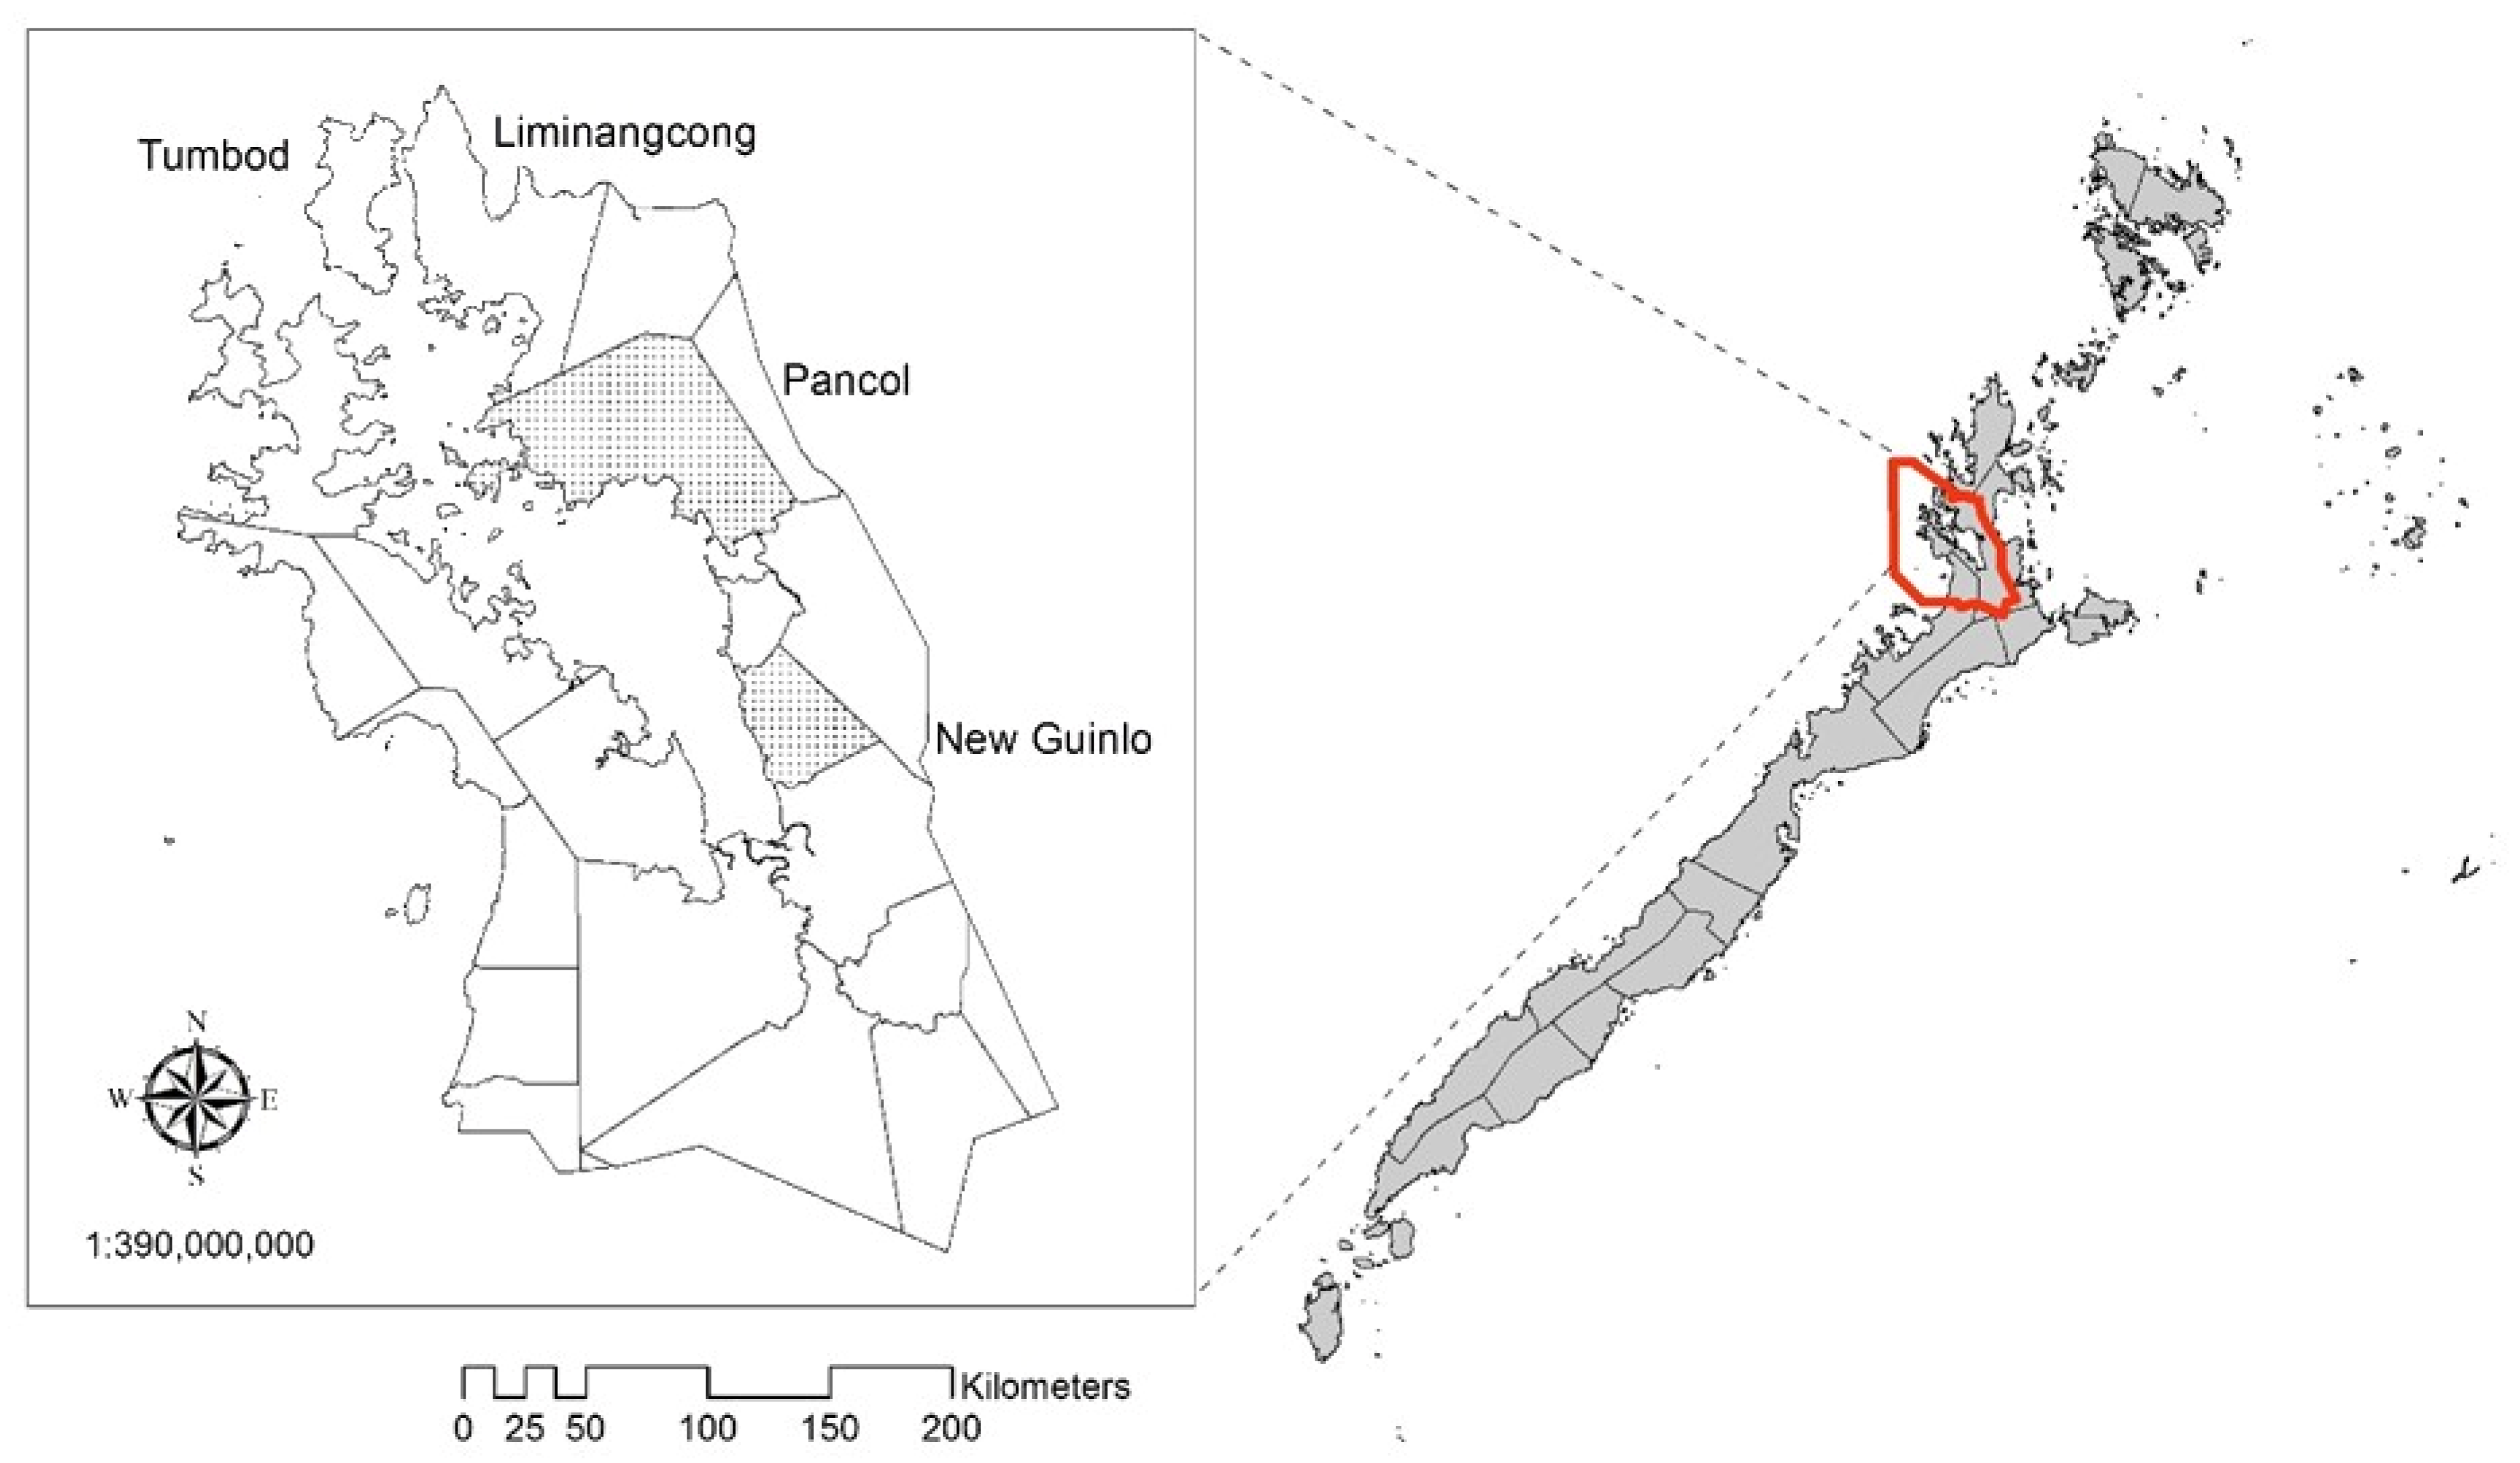
The study area comprises households from two neighboring barangays (a barangay is referred to as a small territorial and administrative district, forming the most local level of government in the Philippines.) (villages) located in Malampaya Sound. These are Barangay Pancol and Barangay New Guinlo.
Figure 2 shows a map of the study area, and the two villages of focus are shaded in notched gray.
2.3. Respondent Selection and Sampling Scheme
One-hundred fourteen (114) respondents were selected from the two barangays of Taytay in Malampaya Sound (
Figure 2, outlined in red). Based on the census list of household representatives from the Municipality Office of Taytay (National Statistics Office, Taytay, Palawan), the total household number in Pancol is 366, and the total household number in New Guinlo is 616, summing up to 982 households. Of the total number of household representatives in Pancol and New Guinlo, the percentage of male and female representatives is 28.0% and 71.9%, respectively.
The number of samples was decided considering the sample size computed at a 95% confidence interval with a 5% sampling error using Cochran’s formula [
32]. It was calculated based on statistical data from 2017 using the following formula: n = n0/(1 + n0/N), where n0 = (t2 * p * q)/d
2, t is the value of the selected alpha level (α = 0.05, critical value = 1.96), p is the possible proportion of the population that has the attribute in question (0.5), q = 1 – p, d = acceptable margin of error (0.05), and N = population size. The calculated sample size was 87, and the study’s sample size was larger than that. Employing stratified random sampling, this sample size was proportionally allocated to two barangays, and the respondents (representative household head) were selected.
In terms of the survey questionnaire, it was pretested on 17 January 2017, and the mapping method was improved in such a way that images/illustrations that described the landscape values were added to accompany the survey. The survey was carried out focusing on Brgys. Pancol and New Guinlo for the following reasons: (1) both of them are communities which represent the Inner Sound villages (Inner Malampaya Sound) that are accessible by automobile or boat (other coastal communities are difficult to access because of the poor road condition); (2) both of the villages’ main livelihood includes fishing and farming.
2.4. Landscape Values Typology
We used landscape values as operational measures of sense of place [
29] and to facilitate ES identification and determine local land uses that are in agreement with the existing zoning. The following 14 value typologies were used in the study (
Table 1) (adopted from Hashimoto et al., [
33]; and Havas, et al., [
34]). The landscape values were modified and shortlisted based on their applicability to the conditions in Malampaya Sound Protected Landscape and Seascape (MSPLS).
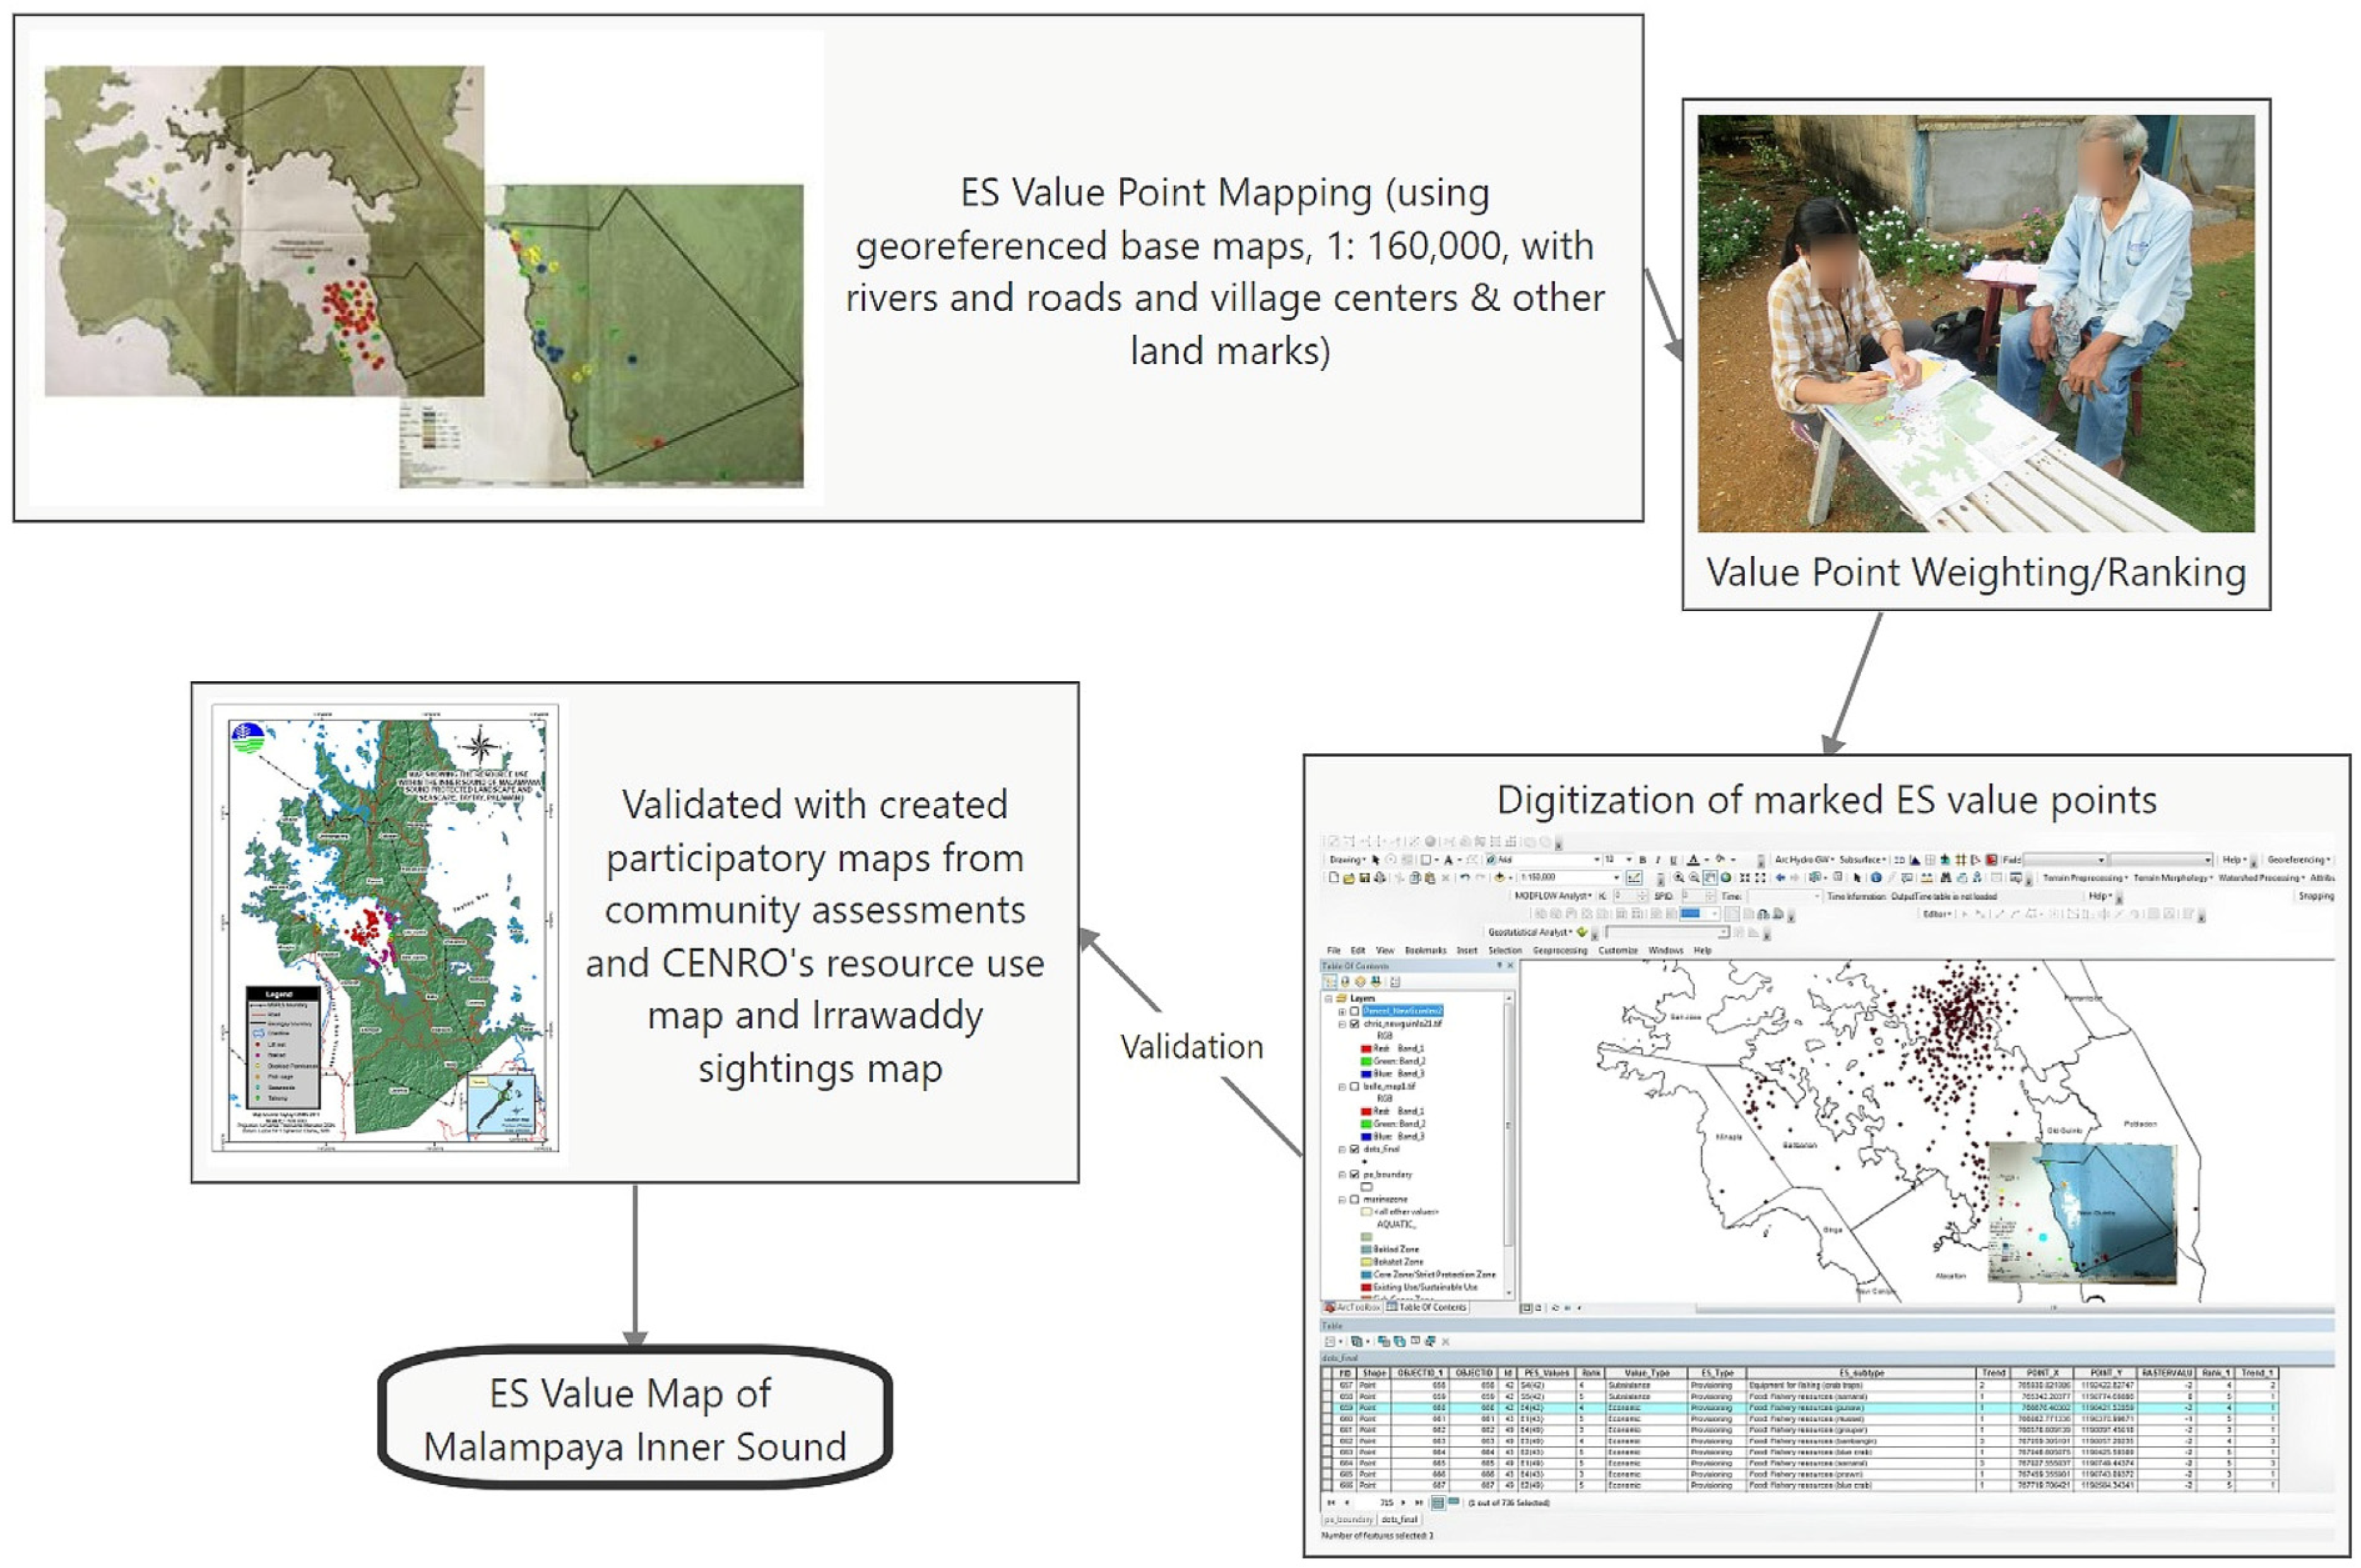
Using meta-cards and illustrations, the respondents were asked to list the benefits they receive from Malampaya and how they value these benefits. Afterwards, the respondents were requested to give weights or a rank of importance to the benefits identified. The process flow is described in
Figure 3, wherein the researcher asked the respondents to map the places where they engaged in various activities which require resources from the land/sea. The perceived landscape values were identified, marked with colored dot stickers, and ranked by the respondents in order of importance. The respondents were also asked about the trend in the ESs or the benefit provided by or generated from the specific places identified. All the location points were digitized and visualized as point features with a density surface and further overlaid with the existing zoning. The density analysis for each category and for the overall evaluation vis-à-vis the respective WTP values was configured spatially. The rank of importance of the benefits or landscape value points was used as weighting for the density analysis of each landscape value, converting the rank information into numbers from 1 (not important) to 5 (most important) to represent the weights of 1 to 5 indicated in the questionnaire. On the other hand, annual WTP maps for landscape values with high counts of marked dots/points were generated using a point density function. A kernel density surface map for all the aggregated landscape value points was generated using the Spatial Analyst tool available in ArcMap 10.4.1.
2.5. Data Analysis
All the data collected from the survey were analyzed using descriptive and summary statistics such as frequency and counts. The Chi-square statistic was used to determine significant associations between the barangays and the ES benefits perceived. As for the GIS analyses, aside from density estimation, overlap analysis was used to identify the gaps between the valued areas and the zoning areas and to generate counts of the perceived landscape value points in each ECAN zone. Using Spearman’s Rho or rank correlation coefficient, the presence of a significant correlation between the rank of and trend in benefits and/or services as grouped by barangay was measured. In addition, analysis of variance (ANOVA) and linear regression were used to analyze the respondents’ attributes and the perceived landscape values and ESs.
3. Results
3.1. Respondents’ Profile
The survey was conducted during 30 January to 10 February 2017 among persons aged 20 years older. It was conducted with the help of personnel from the Community Environment and Natural Resource Office (CENRO) of Taytay, Palawan. The total number of respondents was 114, which corresponds to 12% of the household population of the two barangays/villages of focus (Pancol and New Guinlo), National Statistics Office, Taytay, Palawan. Of the total respondents, 30 (26.3%) were male and 84 (73.7%) were female (
Table 2). The most frequent respondent age group was 41–50 years of age. A total of 48 (42.1%) were migrants and 66 (57.9%) were native. The number of respondents with immediate 0–2 family household members was 21 (18.4%); 3–4 was 39 (34.2%); 5–6 was 31 (27.2%); 7–8 was 15 (13.2%); and 9–10 was 8 (7.0%).
As for the occupation of the respondents, 59.6% of them are engaged in fishing, 28.9% are farmers, and 11.4% are non-dependent on the natural resources of Malampaya (
Table 2), which includes those working as office staff, construction workers, and salespersons at commercial establishments.
3.2. Perceived ESs and Landscape Values in MSPLS
3.2.1. Priority ESs
The ESs perceived by the respondents were characterized into different groups, such as those relating to agriculture, forestry, fishery, livestock, wildlife/bushmeat, medicinal plants, water, etc. (see
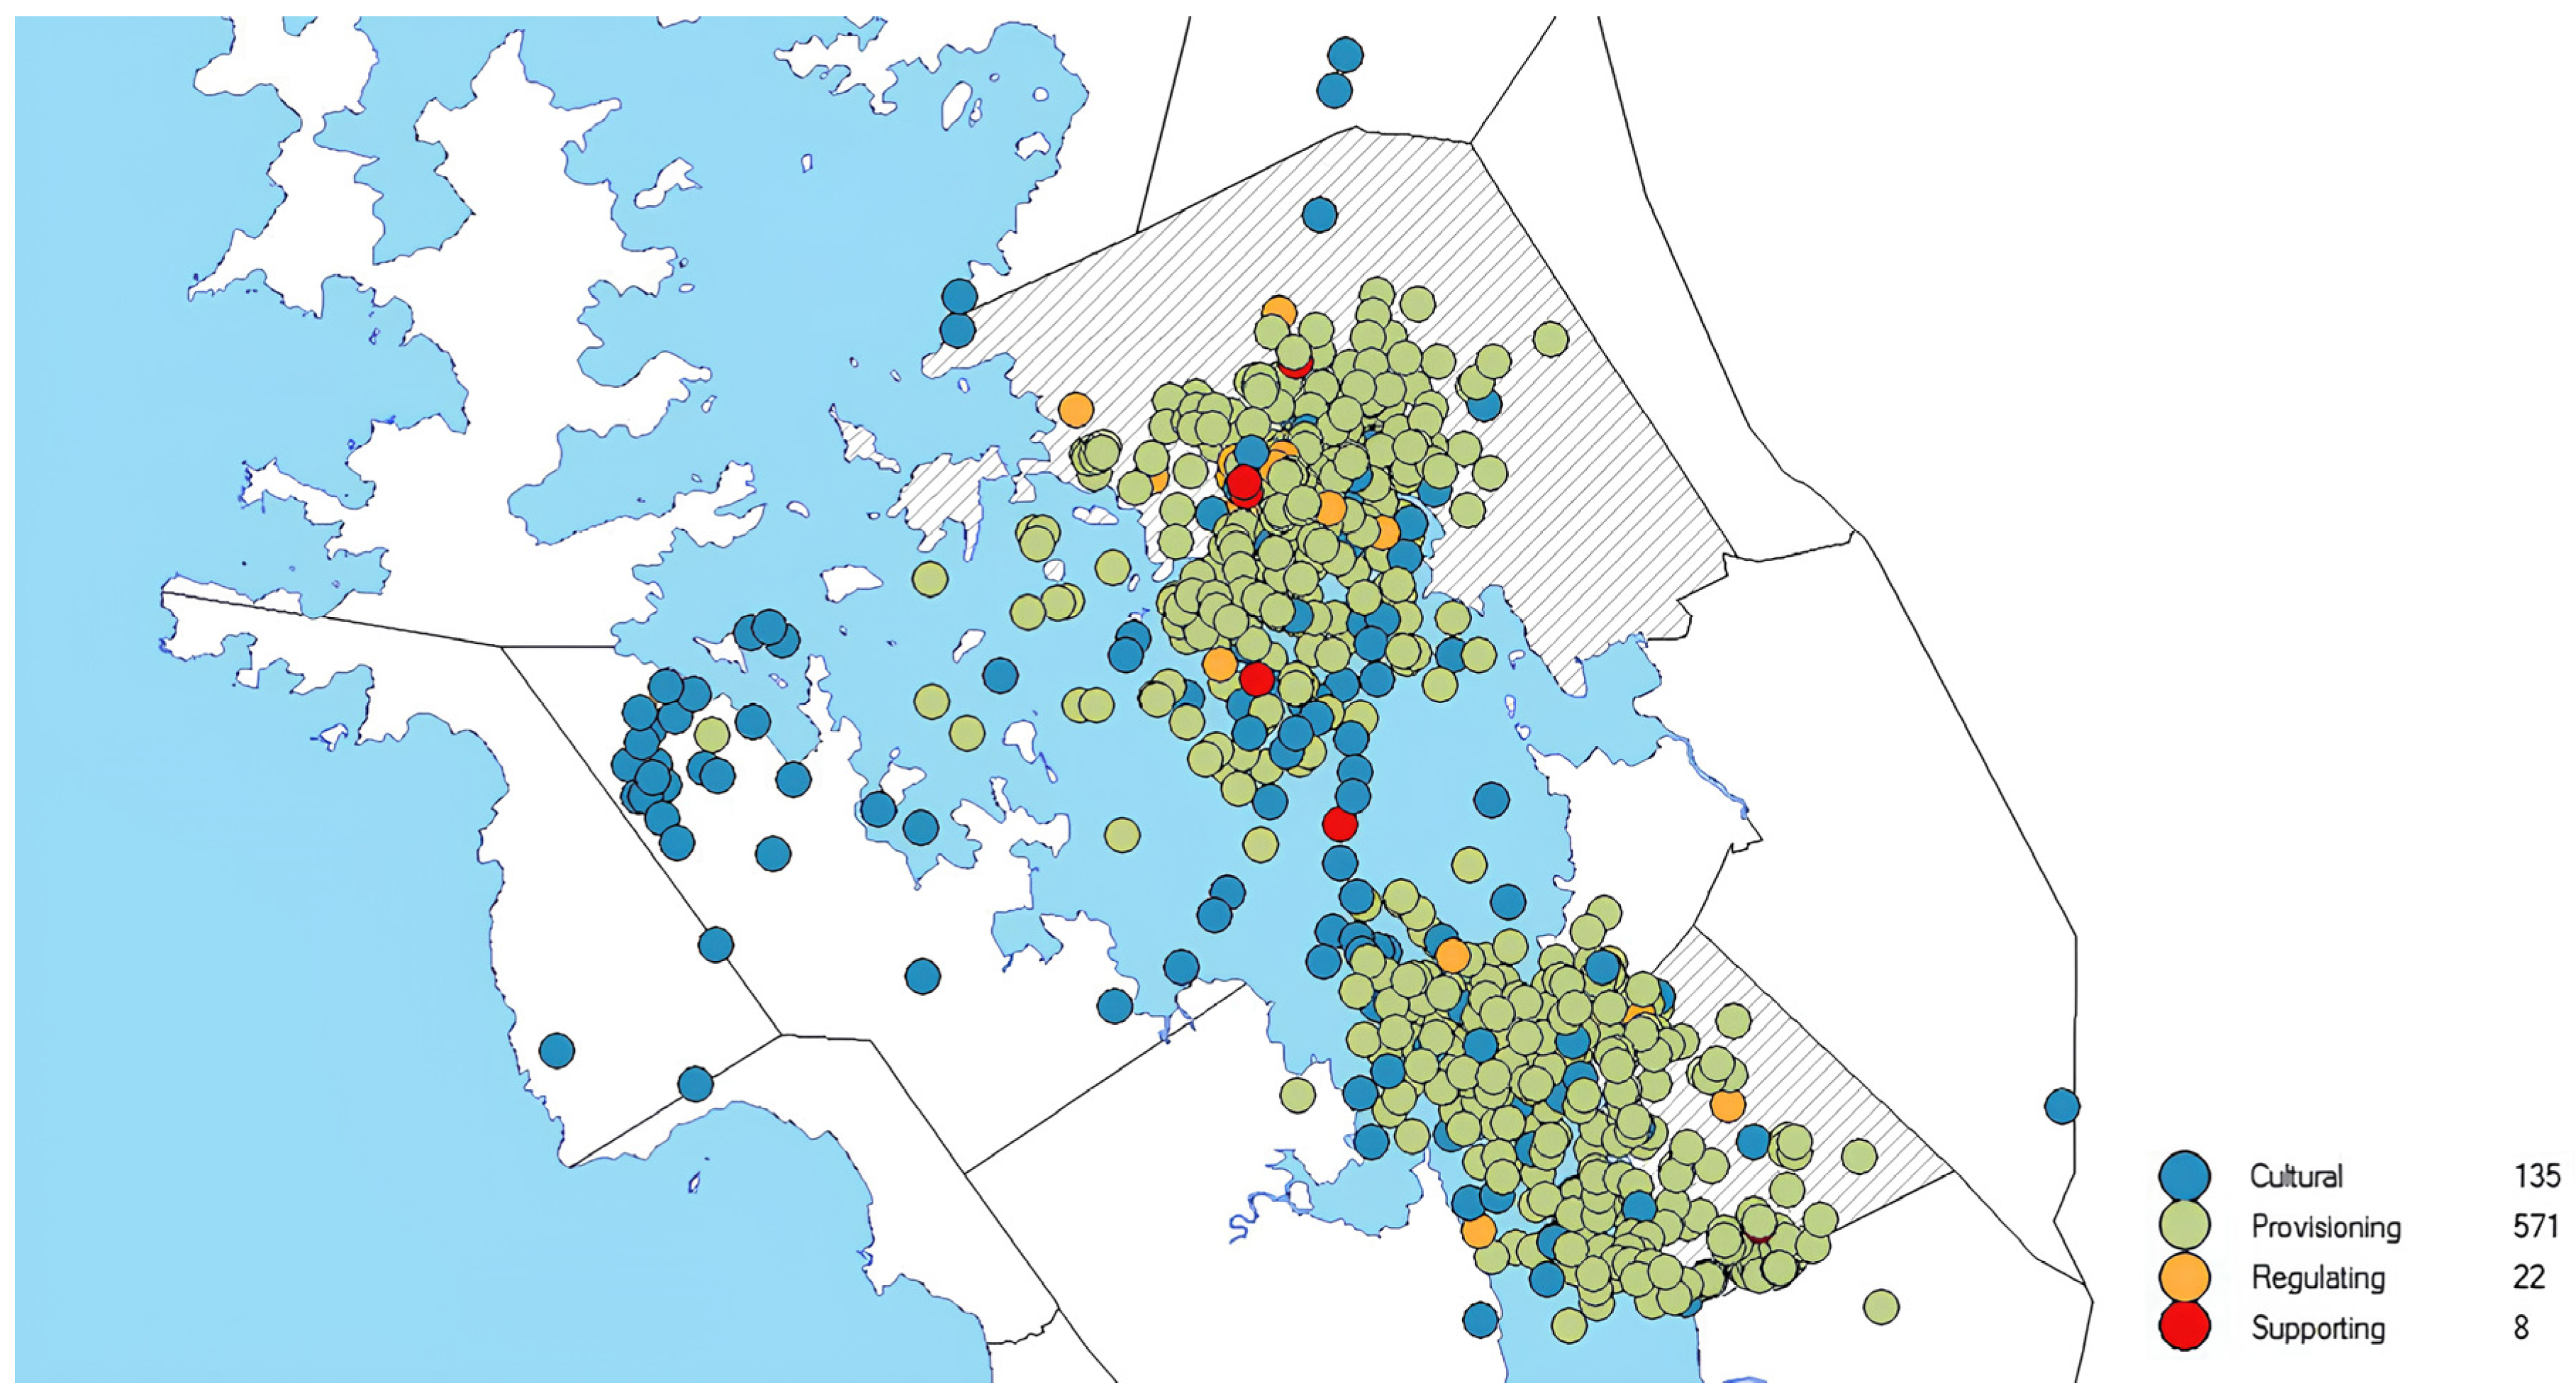
Supplementary Materials Section S1). The most important or priority ESs in MSPLS by way of community valuation were the provisioning services: fisheries, agriculture, and agroforestry. The figure below is a spatial distribution of the provisioning, regulating, cultural, and supporting services in MSPLS (
Figure 4).
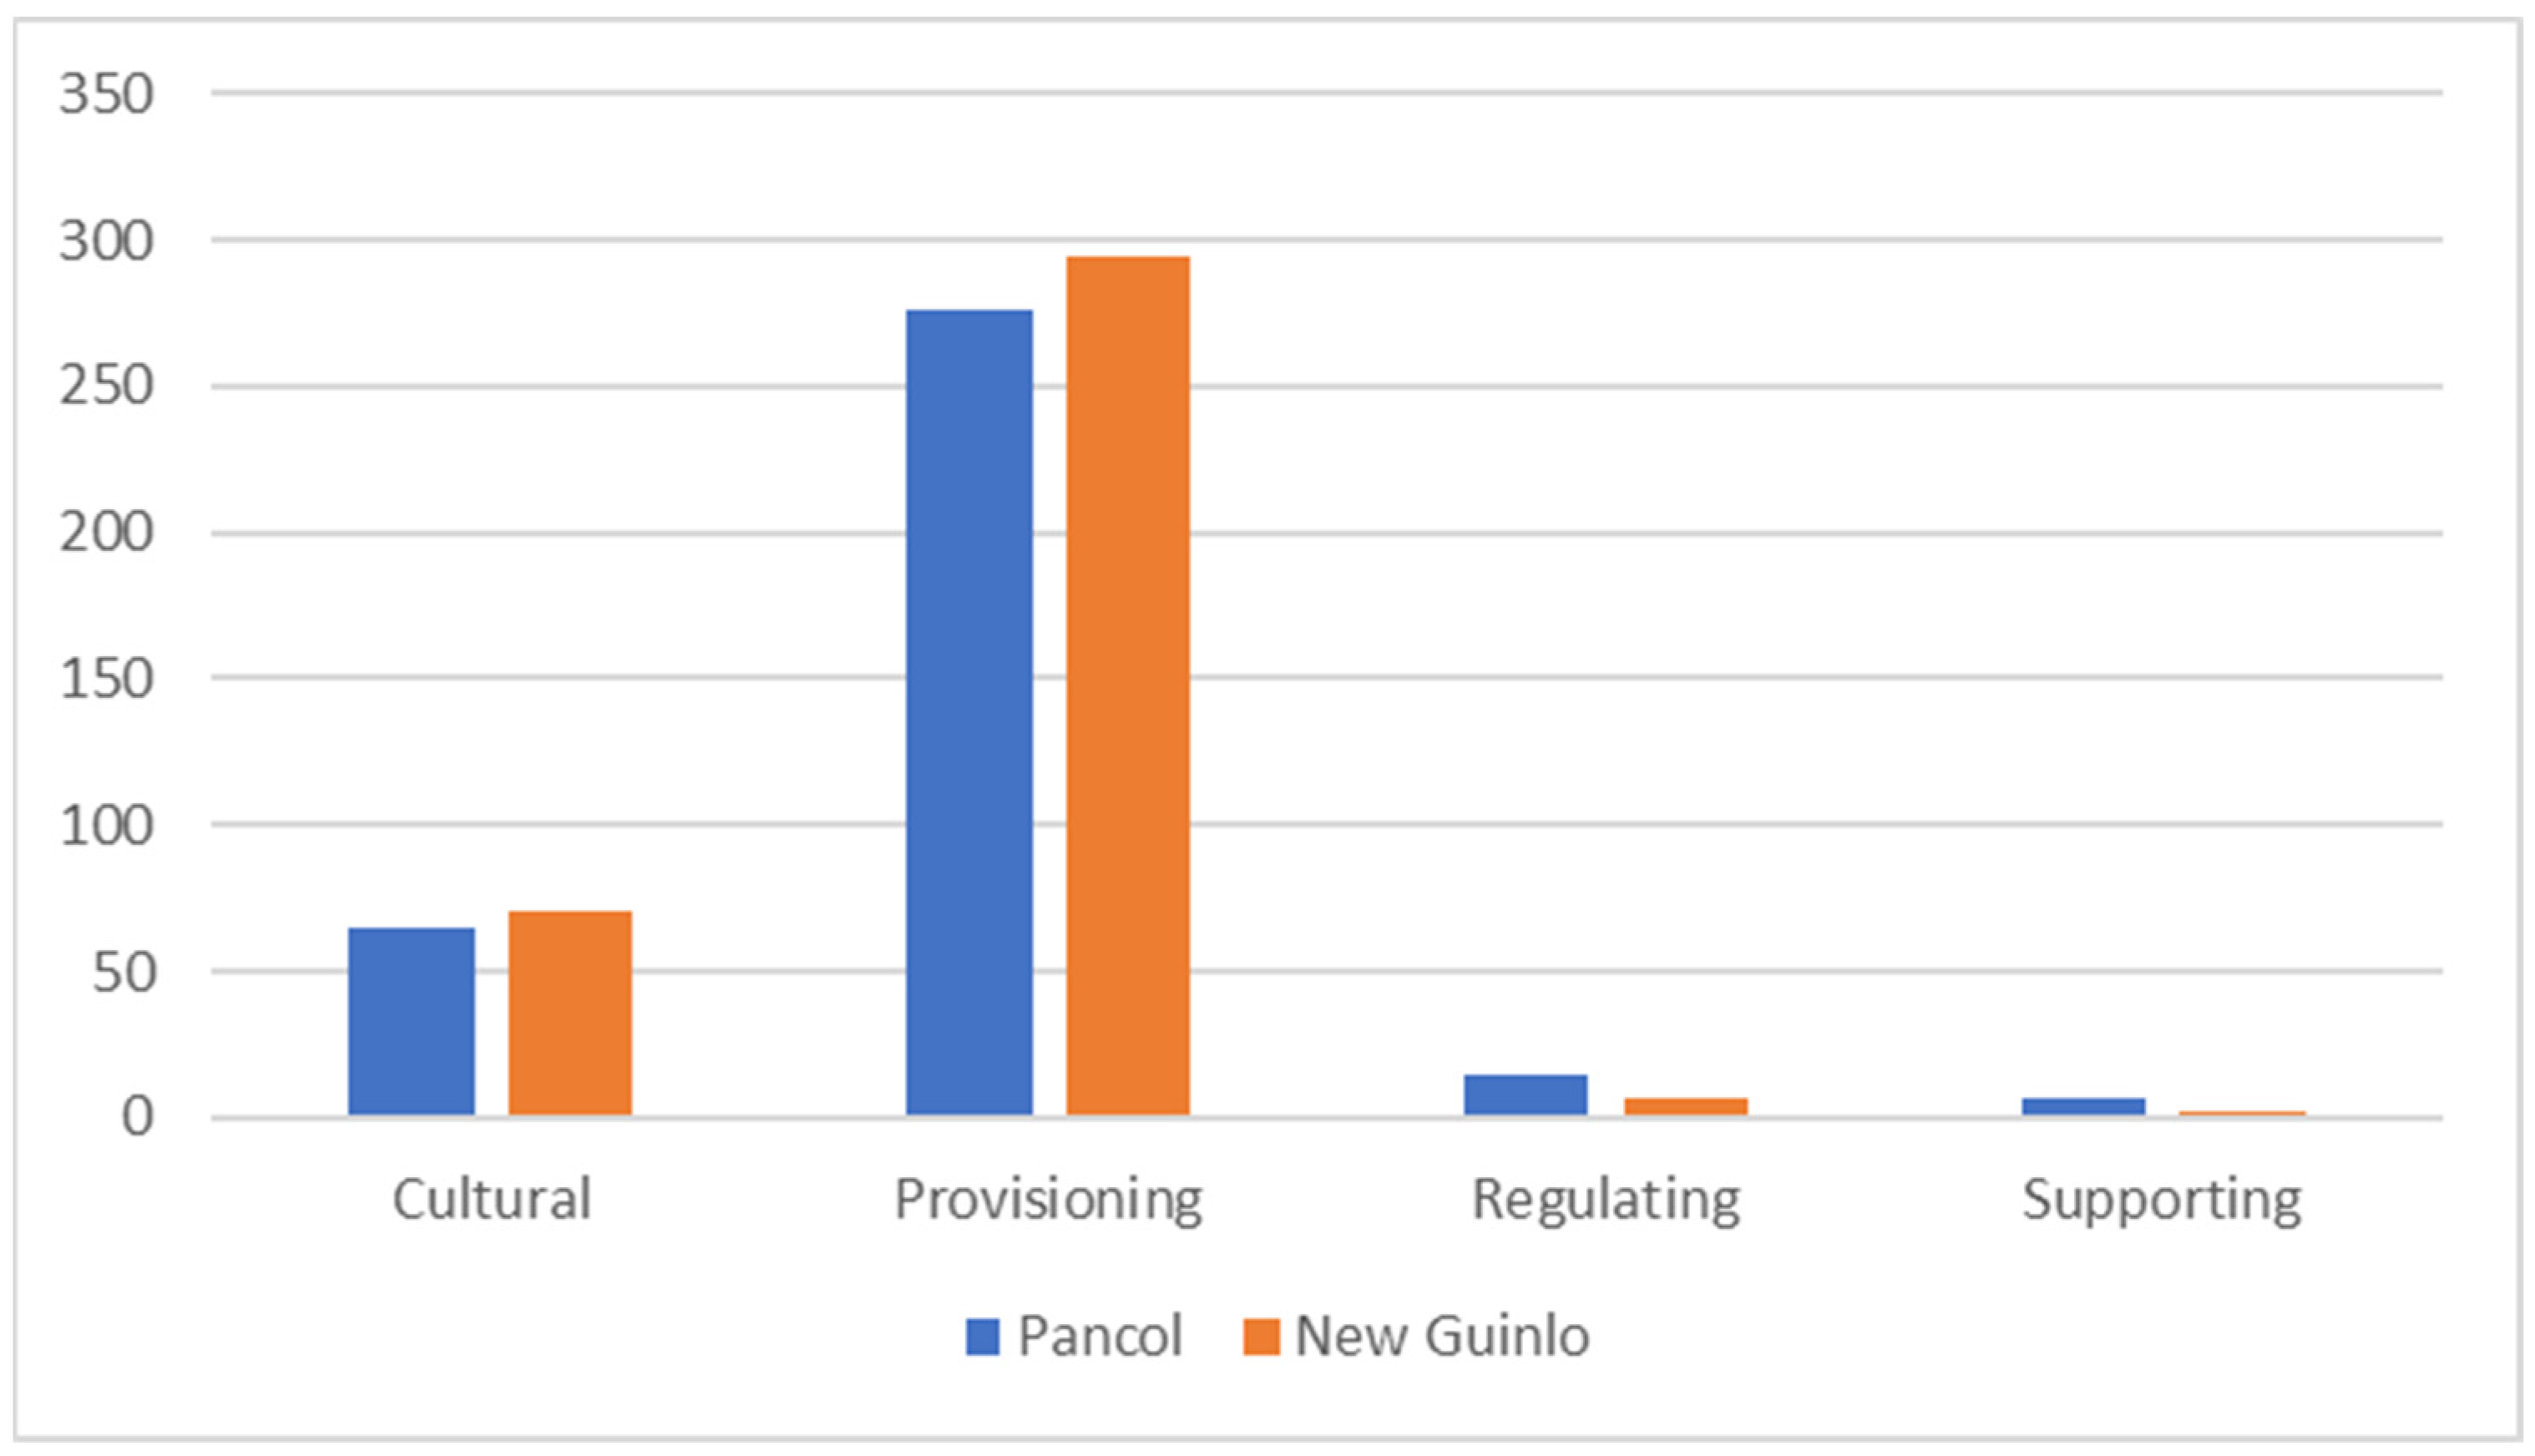
Pancol’s respondents identified 276 points (76.2%) linked to provisioning ESs, 65 points (18.0%) linked to cultural ESs, 15 points (4.1%) linked to regulating ESs, and 6 points (1.7%) to supporting ESs. New Guinlo’s respondents, on the other hand, identified 295 points (78.9%) linked to provisioning ESs, 70 points linked to cultural ESs (18.7%), 7 points linked to regulating ESs (1.9%), and 2 points linked to supporting ESs (0.5%), respectively (
Figure 5).
3.2.2. Perceived Landscape Values in MSPLS
The total number of places indicated by the dot stickers/points was 736, averaging 6 stickers per respondent. The Brgy. Pancol respondents identified a total of 362 landscape value points, while the Brgy. New Guinlo respondents identified 374 value points. The total proportion per landscape value was counted, and we found that economic landscape value had the highest frequency count (37.4%), followed by subsistence landscape (30.8%) and aesthetic landscape value (6.8%), respectively (
Figure 6).
3.3. Rank of Importance of the Perceived Landscape Values and Their Trends
The total landscape value points were validated using existing spatial data from CENRO and using Google Earth 8.0 and were mapped, making sure that the appropriate Coordinate and Projection System (WGS 1984, Luzon N51) was used consistently in the point digitization. For all the identified landscape value points, the rank or weights of importance were summed up, and based on the responses, a total of 498 location points were deemed “Very important” by the local communities.
3.4. Spatial Attributes of the Perceived Landscape Values
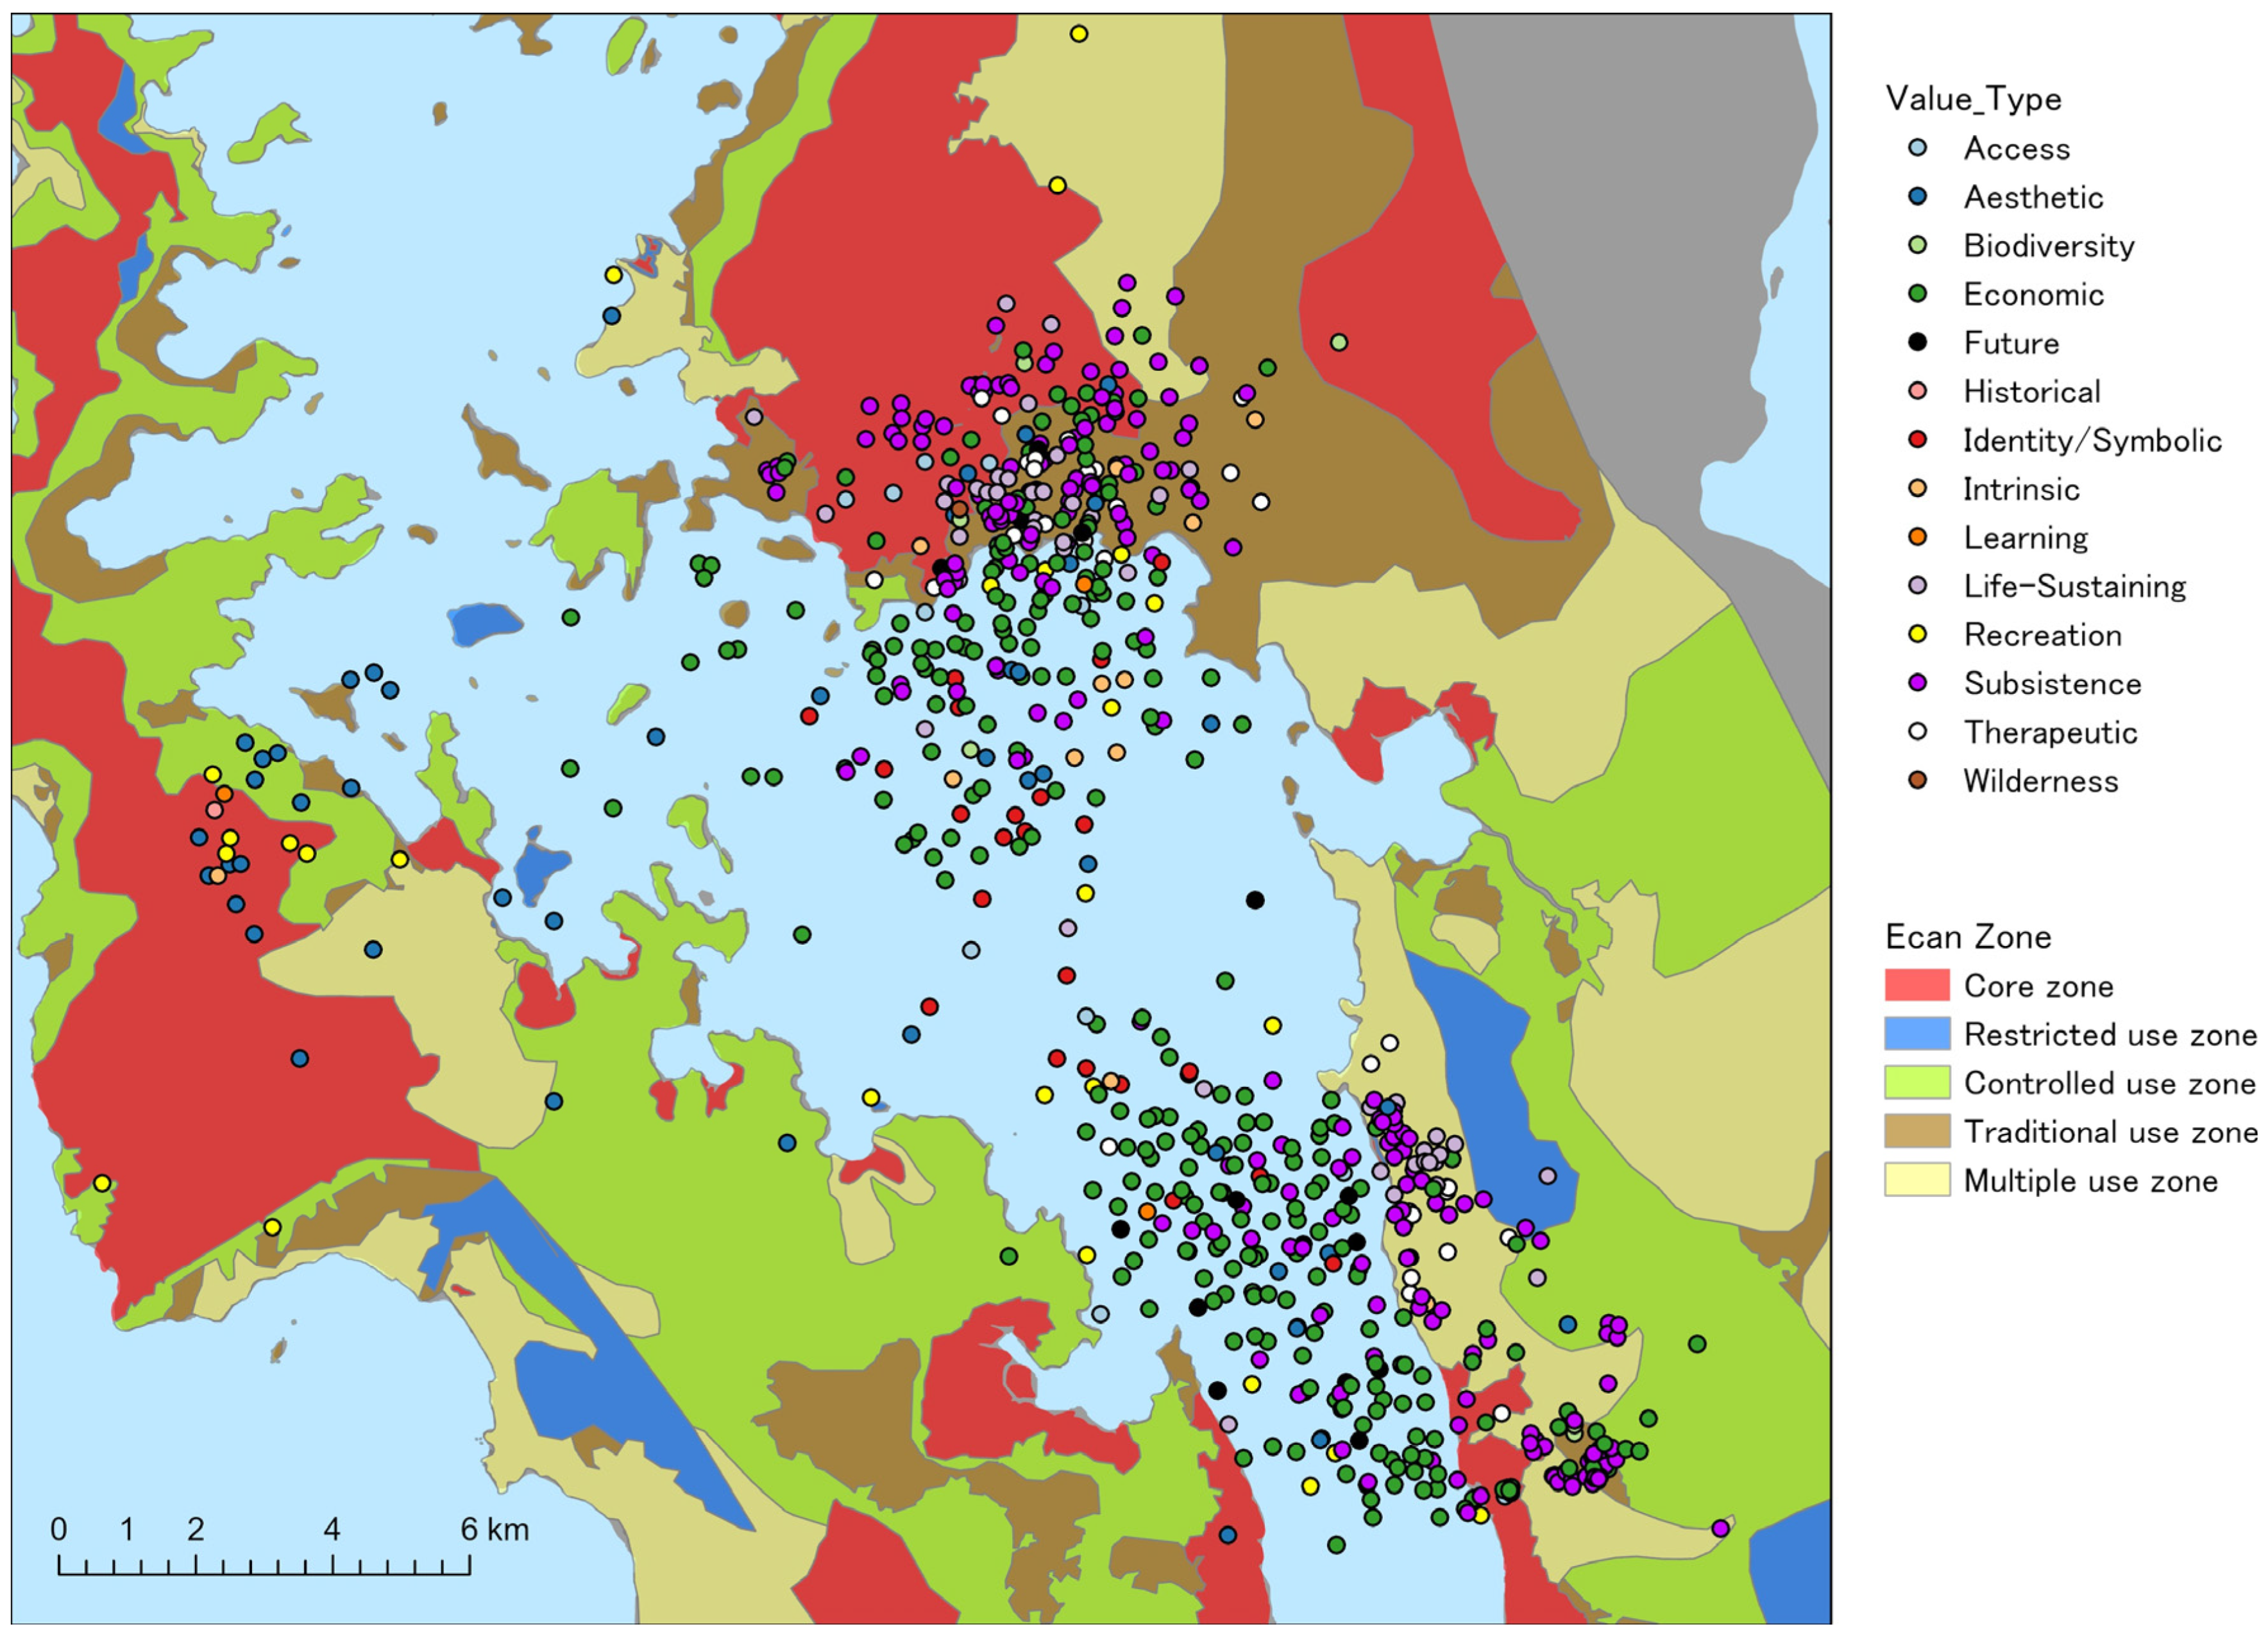
The spatial distribution of important places across the landscape was examined numerically. The total count of places on land and in the sea for each landscape value was calculated (see
Table 3). For one category (subsistence value), more than 50% of the important places were located on land. This was followed by economic and life-sustaining values. This reveals the importance of the Malampaya Sound to local residents in terms of livelihood and demonstrates that the communities’ wellbeing is linked with Malampaya. The value categories with the most sea-based (offshore) locations were economic, subsistence, and identity/symbolic. As for the overlaps or mismatches between the ECAN zoning and the perceived value points, the Count-to-Polygon command was used to generate the number of perceived landscape value points that fell into a specific zone. Out of a total of 736 points, 365 of the points recognized were located terrestrially, while 371 points were in the water/marine zones.
Figure 7 illustrates the distribution and estimated location in Malampaya Sound of the perceived landscape value points. It shows that economic value (275 points) had the highest number of points, followed by subsistence value (227 points) and then aesthetic value (49 points). This result shows the capacity of Malampaya to support an economic- and subsistence-specific bundle of ESs and also underscores the demand for ESs in Malampaya with economic, subsistence, and aesthetic values.
The map displays quantitatively the total identified value points in each zoning category (indicated in the legend). The results show that most of the identified value points in the terrestrial zones were detected in the traditional zone protection category. They also show that the core zones had 88 value points detected. As for the points within the marine zoning, most of the points were in the communal fishing ground (174 points), and none fell into the core and strict protection zones.
3.5. Weight of Importance of the Landscape Values
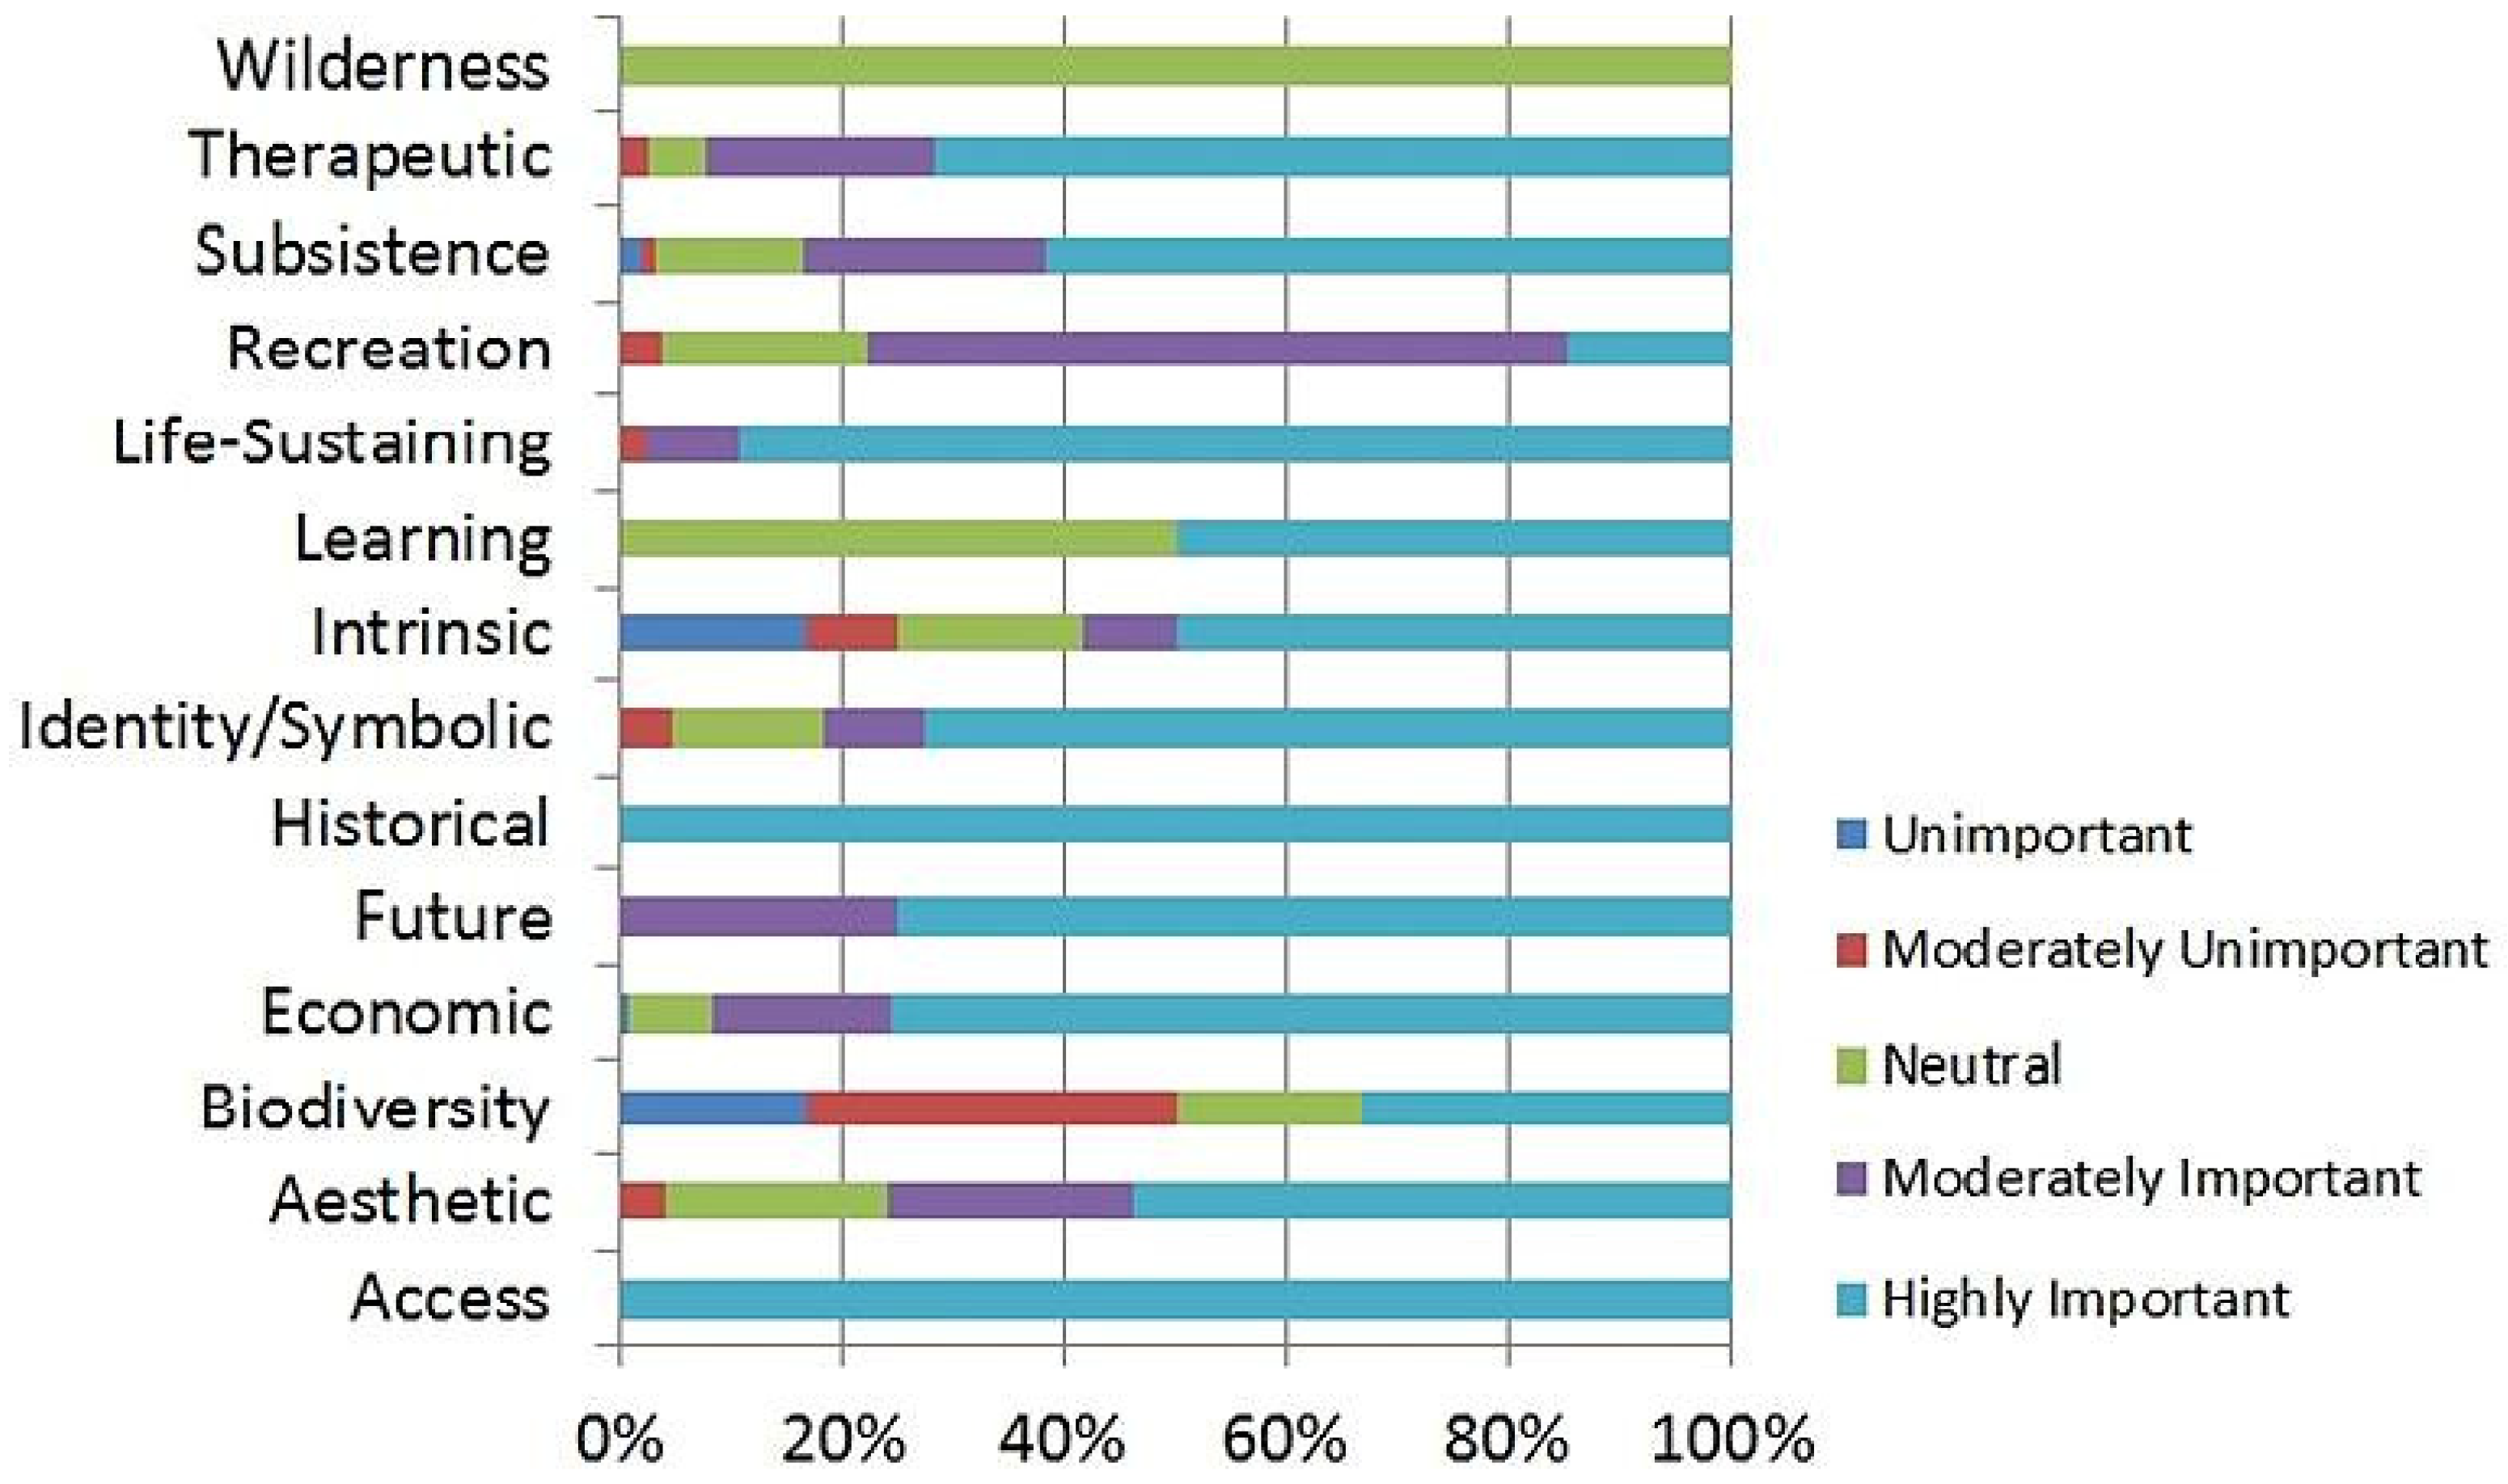
The distribution of the landscape values and their weight of importance based on the survey responses from two barangays/villages were also analyzed. In
Figure 8 below, the top three landscape typologies with the largest proportions, respectively, of respondents perceiving the places as highly important were (1) economic value, with 275 location points; (2) subsistence value, with 227 points; and (3) aesthetic value, with 50 value points. The historical value and the wilderness value, although rated highly important, only had one location point each. Furthermore, the geographical distribution of the important places across the landscape was examined, and we found that the greatest number of places identified were for economic value (37.4%) and the lowest were for historical value (0.14%) and wilderness value (0.14%).
3.6. Relationship between Place of Residence and Landscape Values’ Weight of Importance and Trends in ESs
According to the Spearman’s Rho rank order correlation results, the relationship between rank and trend (in both Pancol’s and New Guinlo’s respondents’ aggregated landscape values) is significant at a 10% level of significance. The relationship is weak and is inversely related. Comparing the two barangays, Pancol shows significant correlation at a 10% level of significance. The relationship is weak and is inversely related. On the other hand, New Guinlo does not signify any relationship between the respondents’ perceived landscape values’ rank of importance and trend (
Table 4).
3.7. Willingness to Pay (WTP): Importance, Trends, and Individual Attributes of Respondents
To have an understanding of how the respondents subjectively assigned WTP to the ecosystem services, we analyzed the socio-economic attributes of each respondent (
Table 5). Five types of landscape values were found to have a high association with socio-economic attributes, which were age, gender, and nativeness. Detailed results are provided in the
Supplementary Materials Section S2. As an example, we found that aesthetic value was found to be more important to older respondents based on the count of the value points. As for the trend in places with aesthetic value, female respondents tended to think that the aesthetic value of such landscape places was diminishing. Moreover, it was found that male respondents tended to perceive economic value more highly than female respondents. In terms of recreation value, non-native respondents perceived it more highly than native respondents. For the trend in places with recreation value, non-native respondents, compared to native respondents, perceived that recreation value is increasing. For subsistence value, male respondents perceived its importance more highly than female respondents did. Lastly, places associated with therapeutic value were perceived as important mostly by younger respondents, and they perceived this trend to be increasing.
In terms of the identified ESs, socio-economic attributes, and WTP, three ES types were found to have an association with the respondents’ socio-economic attributes. These are cultural, provisioning, and supportive ESs. For the cultural ES, female respondents perceived its importance more than male respondents did. The count of the value points signifies that non-native respondents tended to recognize the rank of importance of cultural ESs more highly than native respondents. As for WTP for cultural services, natives may tend to pay more than non-natives.
In
Table 6 below on the relationship between ES type and WTP, the results indicate that male respondents perceived the importance of provisioning services as higher than female respondents did based on the count of the value points under each ES type and their rank of importance. However, we found that female respondents tended to have a higher WTP for provisioning services than male respondents. For the supporting ESs, there was no correlation between the socio-demographic attributes and WTP, but the count of the value points showed that older respondents recognized the supporting ESs more highly.
3.8. Annual Potential PES Revenue Based on WTP
The respondents were asked about their willingness to pay to improve or enhance the quality of ecosystem services without any predetermined choices or options for payment. Based on the findings of the survey, the WTP statistics were calculated, and they are shown in the table below:
Table 7 indicates the descriptive measures of the WTP of the community. The average mean WTP was almost PHP 95.00 or USD 2.00, while the maximum WTP was PHP 3000.00.
3.9. Relationship between Willingness to Pay (WTP) to Enhance the ESs’ Benefits in Malampaya and Respondents’ Income
The relationship between WTP and the income of the respondents was analyzed using correlation analysis, and the study found that WTP and Pancol’s respondents’ income had a significant relationship at a 10% level of confidence (
Table 8). However, the relationship was weak and inversely related. Other than that, there appeared to be no significant relationship at a 5% level of significance between WTP and New Guinlo’s respondents’ income, as well as between WTP and respondents’ income regardless of barangay and income.
3.10. Opportunities for Payment for Ecosystem Services (PES)
Payment for ecosystem services is an economic tool that gives positive conditional incentives for the provision of ecosystem services which has been widely used in terrestrial conservation [
35]. A PES approach can also be applied by way of user fees or membership fees as another possible instrument for managing ESs. Based on the results indicated in
Section 3.8, the estimated mean willingness to pay accounts for:
The above result translates into a potential annual revenue for payment for ecosystem services which, if collected, could amount to PHP 532,000 (from an estimated 5600 households in MSPLS) or approximately USD 10,600 (average PHP-USD conversion rate, June 2017. In current USD currency, this is equivalent to approximately USD9600 (March 2024)). Generally, the respondents were open to paying for the improvement of the ESs’ benefits in MSPLS. As per the findings of the contingent valuation, the estimated PES one household family was willing to disburse could amount to PHP 95.00 or USD 2.00 annually. This potential financial resource, if pooled from all the households in Malampaya, could be used to implement viable development and conservation goals and projects for MSPLS.
3.11. ES Heat Maps Based on WTP
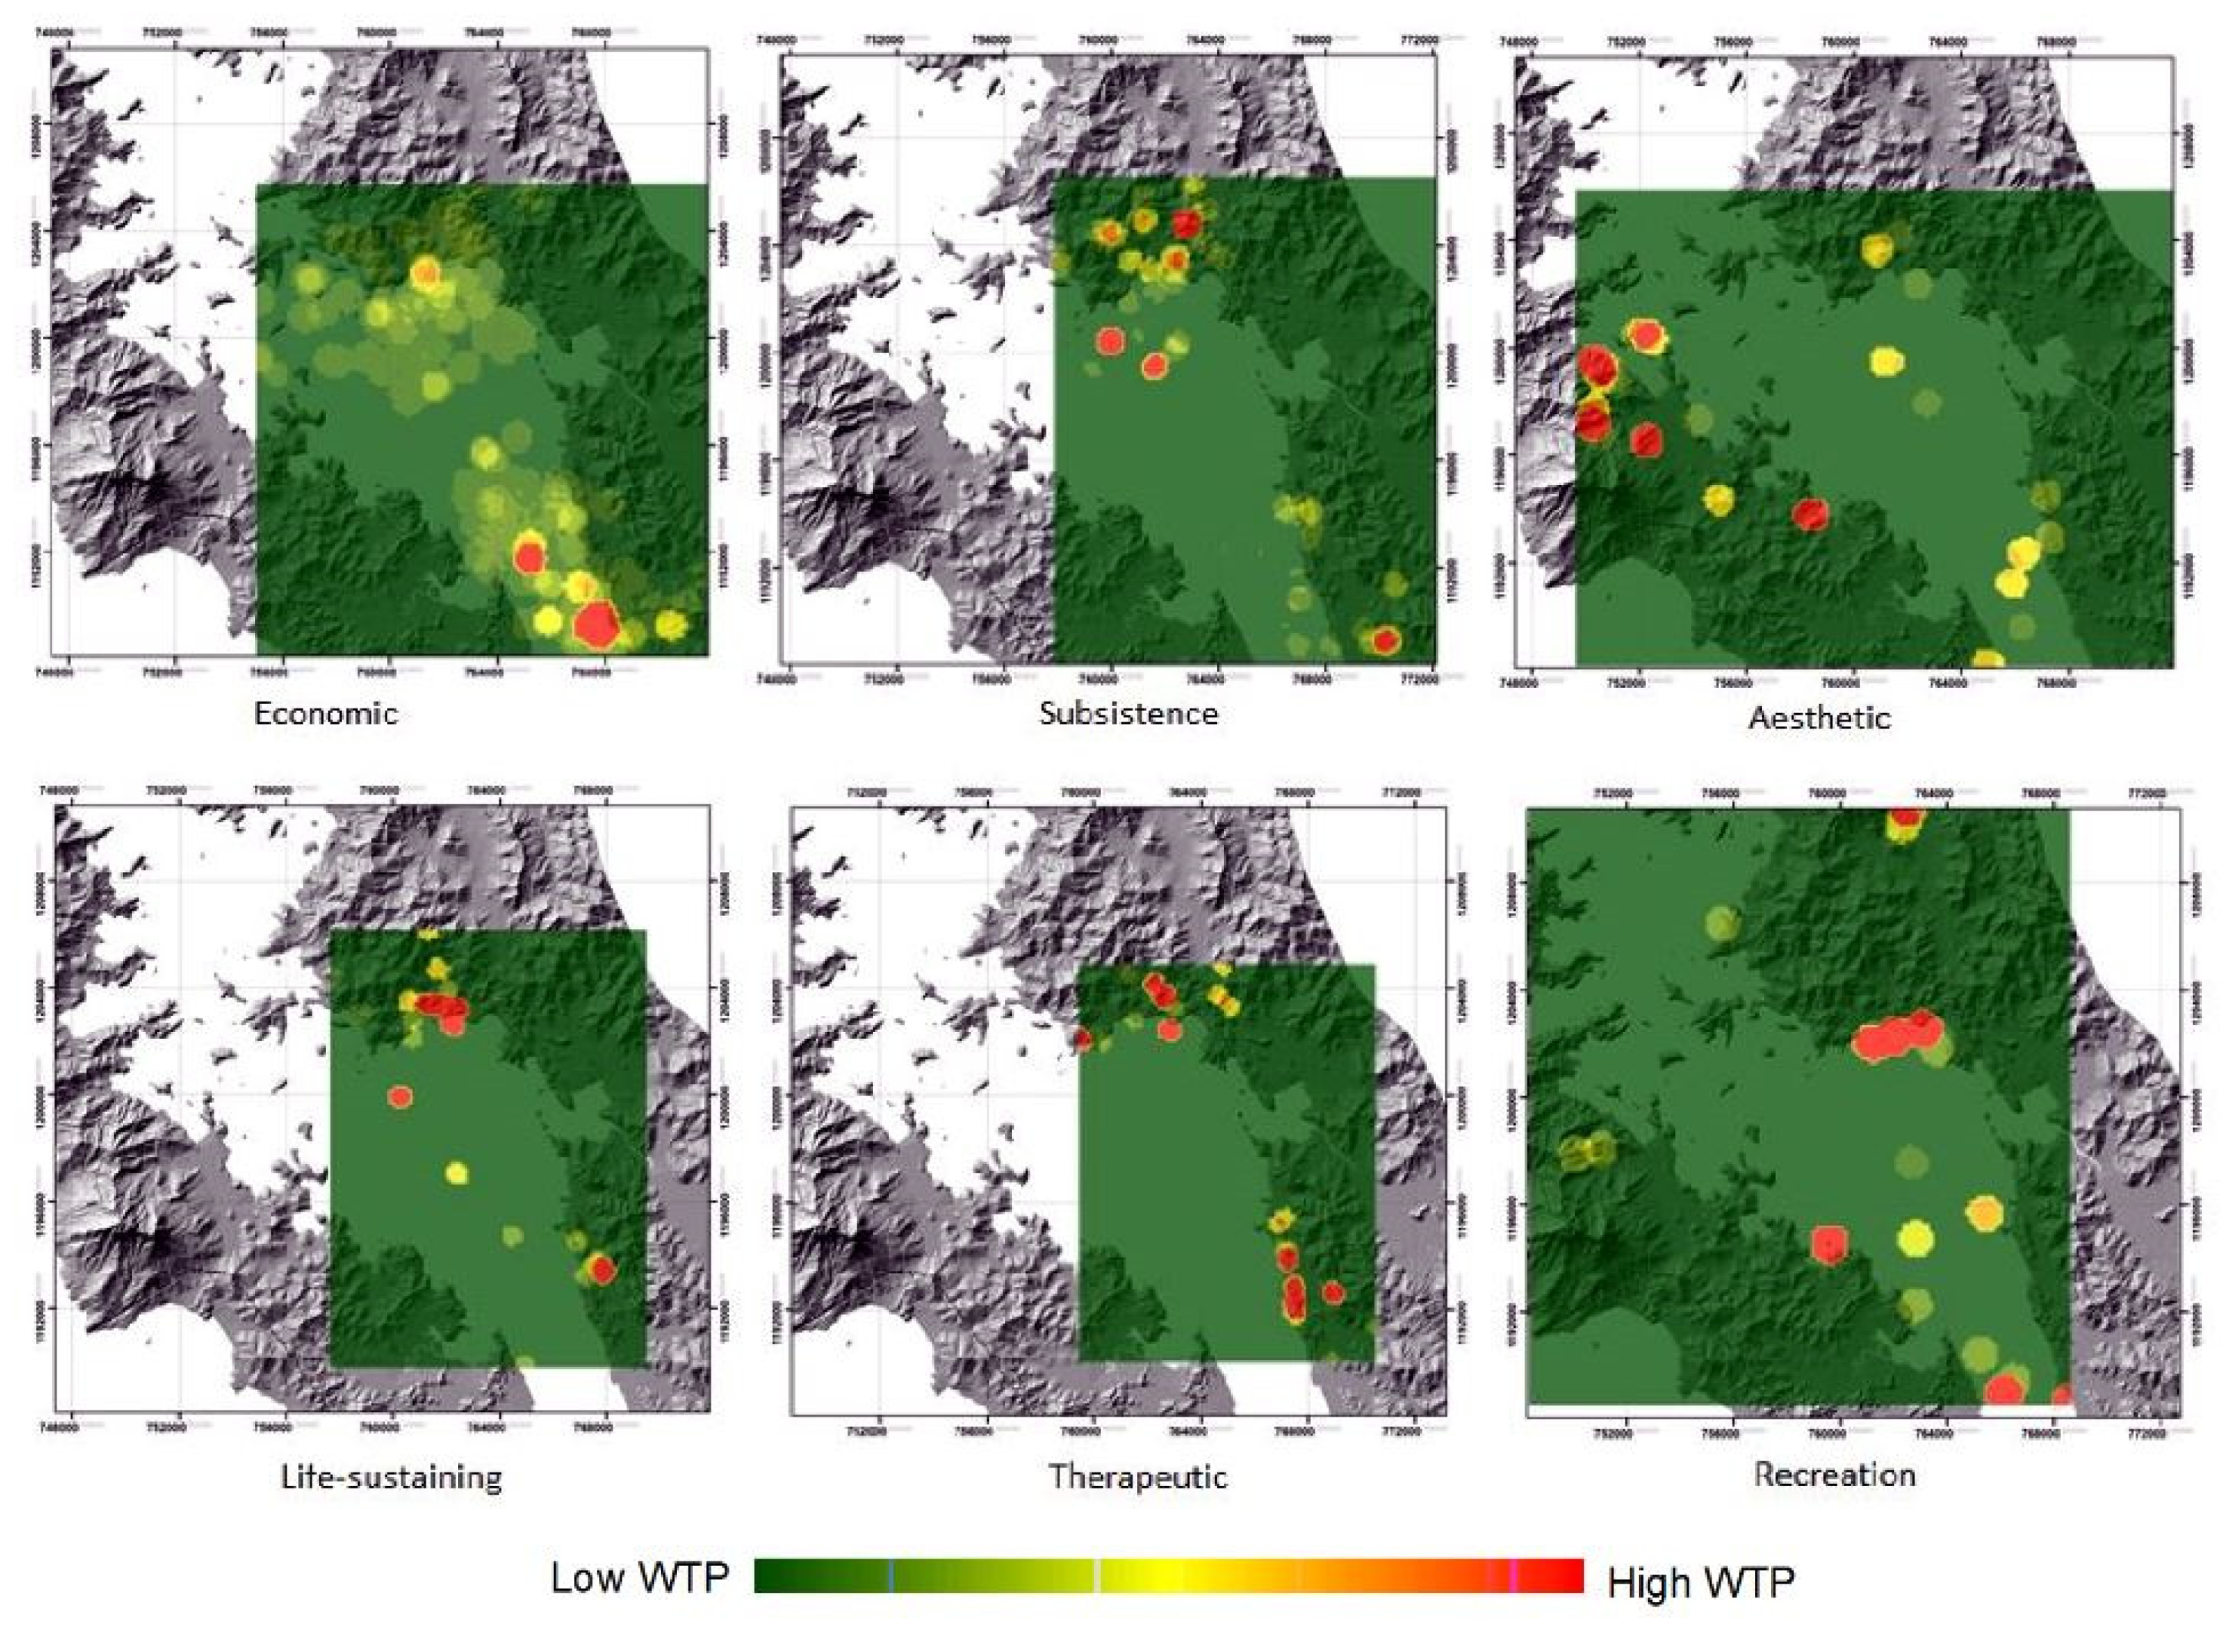
There were six landscape values identified in Malampaya which dominantly received high recognition from the local communities, and these are the following: (1) economic; (2) subsistence; (3) aesthetic; (4) life-sustaining; (5) therapeutic; and (6) recreation, respectively. Through point density estimation and using WTP as the predictor value, heat maps were generated.
Figure 9 shows the “hotspot” locations based on the WTP values assigned by the respondents, which are illustrated on heat maps. These are the predictive surfaces of each of the six landscape values, assuming that the underlying factors that contribute to the supply and distribution of the ESs do not change. It can be observed that the landscape value points were less sparsely distributed, indicating that some areas in Malampaya contain multiple ESs. The heat maps also show that the closer the value point is to the coastline, the higher the WTP allocation is.
4. Discussion
The local communities in MSPLS identified several ESs in their localities based on the Millenium Ecosystem Assessment (MA) classification. In general, the respondents’ direct and indirect relationships with the ESs, based on the landscape value point typology, varied depending on gender, age, and residency origin (nativeness). It was observed that, in terms of the ECAN terrestrial zoning, the highest number of landscape value points was detected to be in the traditional use zones, multiple-use zones, and core zones, respectively. In the ECAN marine zoning, the highest number was found in the communal fishing grounds, indicating the presence of traditional resource use in the communal fishing grounds. The result of a spatial overlap between the value points and the terrestrial zoning suggests some mismatches between local resource use and terrestrial zoning policy (i.e., economic value points detected in the terrestrial core zoning). Hence, raising awareness of environmental conservation in Pancol and New Guinlo, especially for those who depend on agriculture, forestry, and fishery in the area where development is restricted, should be implemented. These findings are similar to those of a study on ECAN zoning and critical habitats in Palawan that recommended the integration of data such as local community resource use to contribute to improving environmental management strategy [
36]. Our results, however, provided in-depth information on the relationship between the local perception of landscape values and people’s attributes in a protected area that previously was an open access area. The influencing factors of the relationship between landscape value recognition and individual attributes, as well as its implications for PA management, are presented as follows:
4.1. Socio-Economic Factors Influencing Landscape Values’ Importance and Trends
In the Results section, we found that male respondents tended to perceive landscape locations associated with economic and subsistence values, which are categorized as provisioning services. Possible reasons for this result might be male respondents are engaged in livelihood and economic activities such as fishing more frequently than female respondents. As Yang et al. [
37], in reviewing the research on perceptions of ESs, found that a large number of papers detected the gendered nature of food production and preparation, we also found the gender differences in local perceptions of ESs were related to food production.
On the other hand, the female respondents tended to recognize the importance of cultural services and may have also thought that the aesthetic value in Malampaya is decreasing. It was also observed that the female respondents tended to have a higher WTP for provisioning services than the male respondents. This suggests differences between genders since the results show that the female respondents tended to recognize non-material contributions and were concerned about the decline in landscape values and its possible impact on wellbeing. This concern might be associated with and reflected in a high WTP for another ES (i.e., provisioning). The result is consistent with the result of Shen et al. [
38], who showed the female WTP was higher than that of the male respondents in terms of ocean ecosystem services, including fish production. However, as Obeng and Aguilar [
39] found in their nationwide survey in the United States, the male population might have a higher WTP for forest watershed conservation. The relationships between WTP value and gender might be different depending on the target ES types.
The non-native respondents tended to recognize the importance of cultural services, such as those with recreation value, whereas the native respondents tended to have a higher WTP than the non-native respondents. It might be that non-native and native respondents both recognize the importance of cultural services, but they differ in their perceptions of trends (i.e., recreation value). Natives tended to think that the recreation value of Malampaya is decreasing, and this may suggest a high WTP for native respondents owing to their place attachment and their probably richer knowledge and experience of the past. In addition to place attachment, native residents tend to have place identity [
40]. The higher WTP values of the native respondents might be related to their place attachment and identity. Demirović et al. [
41] identified that native residents tended to show more concern about the environmental impacts of the tourism industry. The tendency that they found for native residents is aligned with that in our findings.
Some studies underline the differences in the demand for and valuation of ESs between young and old people and their personal histories or experiences during childhood in terms of interaction with nature [
42,
43]. Similarly, we observed a positive correlation between the high importance of aesthetic value and age, as well as that of supporting ESs and age. This relationship might be due to their subjective perception of and living history in Malampaya given that they have had longer direct and indirect interactions with the PA environment. For instance, in a study by Li and Ando [
44], it was found that people who participated in outdoor activities or grew up near grasslands during their childhood see a higher value in grassland restoration than people who did not.
Finally, landscape in Malampaya with therapeutic value was recognized by the younger respondents more as an important value. In addition, although not strongly correlated with rank of importance, the results show that they tended to think that the positive status/trend of these landscapes with therapeutic value (e.g., medicinal plants) is increasing. This subjective valuation and expectation may be related to the younger respondents’ greater access to more knowledge sources than that of the older respondents, such as mass media, etc.
4.2. WTP as Potential PES and Implications for PA Zoning Policy
In the review of Dang et al. [
45] on ES assessment and policy integration in Southeast Asian countries, it appears that the Philippines has insufficient land use policy planning-related research. For Malampaya to sustain its supply of ESs, it is important that its local communities understand and are engaged in the mapping of multiple ESs across the landscape and not only for a single ES for which demand is high. In
Figure 9, we illustrated the key landscape values perceived by the local communities and associated them with ESs. These were attributed to WTP, serving as an example of how human perception and recognition of place can be integrated into PA management. If PA zone setting and management are aligned with local perceptions and needs, negative attitudes toward PAs, as observed in existing studies (e.g., Amin et al., 2015) [
46], can be decreased, and more effective implementation of PAs can be achieved based on collaborations between various stakeholders. Furthermore, as suggested by González-García et al. [
47], who showed the efficacy of ES mapping for solving the spatial gaps between demand and supply, the regional ecosystem service maps generated by our research can be applicable to PA management to sustain ES supply considering ES demand.
Also, in this study, we found that the landscape values focusing on ESs were less sparsely distributed and created a pattern of WTP hotspots in Malampaya. WTP is found to be influenced by a number of factors, such as gender, age and nativeness. Based on the spatial distribution of the ESs and their values, landscape functional zoning can be developed [
48]. The detected spatial patterns of the WTP values and hotspots need to be considered in PA zoning policies.
In the future, with the potential annual PES (estimated USD 10,600 in total or PHP 95 per household) in Malampaya, PA managers can consider increasing efforts toward ES awareness among residents and visitors and promote conservation goals and targets for the PA. This can support effective conservation planning and landscape-level management, including re-evaluation and/or updating of the current ECAN zones. Research on WTP was conducted in this study to develop PES schemes. If the local needs are reflected in the selection of target ESs, it will be an acceptable scheme, as demonstrated in existing case studies [
49,
50]. Our findings can be the basis for crafting PES schemes in the survey site, and the schemes can have synergistic relationships with the PA zoning policies based on local perceptions.
5. Conclusions
Our study identified the value points of the ESs in Malampaya and predicted areas of richness and areas of decline. From the locations of the 736 value points digitized, different aspects of ES supply and generation were captured, including spatial distribution and scale. In Malampaya, it seems that provisioning services with economic and subsistence values tend to be ranked highly. This high demand and dependency on provisioning services will affect the supply of ESs in the long run, and thus the management of provisioning services is a critical factor in Malampaya. To safeguard the integrity and resilience of the PA as a socio-ecological production landscape and seascape, measures that allow for the recovery and regeneration with the involvement of local communities should be considered. Alongside this, decision-makers and managers can take into account the potential to create alternative livelihood and employment options, as well as make people more aware of the importance of Malampaya for their own wellbeing through public involvement planning and consultation processes.
The study also presented a methodological development involving landscape value point mapping, undertaken with the participation of the local communities. The results of this participatory mapping process are crucial in determining resource use management conflicts between resource managers (i.e., governments) and local users/beneficiaries. The key results on the overlap between the landscape value points and the zoning policy can be the basis for ascertaining the importance of some terrestrial/marine zones in MSPLS and for inclusive PA management. The study also indicated that the traditional zones have a high concentration of landscape value points, which suggests that residents in the area have long utilized the traditional zones. Additionally, it was found that compared with the terrestrial/land zones, marine zones had more value points that are declining. This implies that fishery resources, as the main provisioning service in MSPLS, is threatened as a result of pressures from population growth and in-migration. Developing sustainable approaches and the diversification of livelihood activities (e.g., the enhancement of the communal fishing ground, developing ecotourism development areas and visitor education/demonstration sites, etc.) should be considered. There was also an observed importance of the multiple-use zones given the relatively high value perception from the communities, and therefore increasing efforts into strategic resource planning and management should be concentrated on these zones.
The results our study generated on WTP confirms that local communities are willing to contribute in monetary form towards improving the ESs in Malampaya, and this reveals the potential of Malampaya to implement a sustainable financing strategy for conservation. The institution of such approaches could be funded by potential PES revenue and aimed annually at advancing both environmental conservation and poverty alleviation goals.
We conclude that mapping landscape values using our three-pronged framework can be used to assess the comprehension of local people of ecosystem services, their significance, and trends in MSPLS. Here, since we were able to spatially identify several ESs that are important to the local communities and hold diverse values, we demonstrate that the output of this research (value maps) can aid in crafting policies that are based on a comprehensive understanding of not only the ecological significance of different areas but also of the community’s demand for ESs.
6. Recommendations
Perceived landscape values and ES recognition are influenced by local people’s socio-economic attributes, and thus the social perception of ESs should be incorporated into the updating of the ECAN zoning. Spatial integration analysis with other indicators such as stressor data layers can be further conducted. This was outside the scope of our paper but is a future research area which can supplement the outcomes of the value mapping.
Through our findings, we confirm that regulating and supporting ecosystem services were not recognized well by the respondents, and therefore increasing their awareness and understanding among local residents in Malampaya is crucial since they are vital to the community’s livelihood, wellbeing, and survival. Future research could focus on land use changes according to the dimension of regulating and supporting ecosystem services and how these land use changes would be reflected in Malampaya’s ecological functions and natural capital over time. Methods such as stakeholder workshops incorporating mental models and future-thinking approaches can be used for these processes.
Supplementary Materials
The following supporting information can be downloaded at:
https://www.mdpi.com/article/10.3390/su16083210/s1, Table S1. Overview of perceived ESs in Malampaya Sound; Figure S1. Correlation between count of landscape value points (aesthetic value) and age; Figure S2. ANOVA of count of landscape value points (economic value) and gender; Figure S3. ANOVA of count of landscape value points (cultural value) and gender; Figure S4. ANOVA of count of provisioning ESs and gender; Figure S5. Correlation between count of supporting ESs and age; Figure S6. ANOVA of trend in landscape value points (aesthetic value) and gender; Figure S7. ANOVA of rank of landscape value points (recreation value) and nativeness; Figure S8. ANOVA of trend in landscape value points (recreation value) and nativeness; Figure S9. ANOVA of rank of landscape value points (subsistence value) and gender; Figure S10. Correlation of trend in landscape value points (therapeutic value) and age; Figure S11. ANOVA of rank of cultural ESs and nativeness; Figure S12. ANOVA of WTP for cultural ESs and nativeness; Figure S13. ANOVA of rank of provisioning ESs and gender; Figure S14. ANOVA of WTP for provisioning ESs and gender; Figure S15. Example of a base map used in landscape values mapping with colored dot stickers.
Author Contributions
Conceptualization, C.U. and O.S.; methodology, C.U., O.S. and K.I.; formal analysis, C.U.; fieldwork, C.U.; data curation, C.U.; writing—original draft preparation, C.U.; writing—review and editing, C.U., O.S. and K.I.; supervision, O.S. All authors have read and agreed to the published version of the manuscript.
Funding
This study was supported by the International Satoyama Initiative (ISI) Program at the United Nations University Institute for the Advanced Study of Sustainability (UNU-IAS).
Institutional Review Board Statement
Not applicable.
Informed Consent Statement
Not applicable.
Data Availability Statement
The data that support the findings of this study are available on request from the corresponding author.
Acknowledgments
The Protected Area Management Board (PAMB) of Malampaya Sound Protected Landscape and Seascape, the Municipal Government of Taytay, Palawan, the Palawan Council for Sustainable Development Staff (PCSDS) DMO-North, and the Community Environment and Natural Resources Office (CENRO) Taytay-Department of Environment and Natural Resources are acknowledged for their institutional and coordination support in the conduct of the field survey. The authors would also like to acknowledge Karen Burdeos for her advice on the statistical analysis, Ernie Urriza for his valuable input on the data point digitization, and Alvin Gestiada for his technical assistance with the GIS analysis.
Conflicts of Interest
The authors declare no conflicts of interest.
References
- Mallari, N.A.D.; Collar, N.J.; McGowan, P.J.K.; Marsden, S.J. Philippine protected areas are not meeting the biodiversity coverage and management effectiveness requirements of Aichi Target 11. Ambio 2016, 45, 313. [Google Scholar] [CrossRef] [PubMed]
- Department of Environment and Natural Resources–Biodiversity Management Bureau (BMB). Philippine Biodiversity Strategy and Action Plan 2015–2028 Bringing Resilience to Filipino Communities. 2016. Available online: https://www.cbd.int/doc/world/ph/ph-nbsap-v3-en.pdf (accessed on 16 January 2024).
- CBD. Nations Adopt Four Goals, 23 Targets for 2030 in Landmark UN Biodiversity Agreement. Secretariat of the Convention on Biological Diversity, Montreal. 2022. Available online: https://www.cbd.int/article/cop15-cbd-press-release-final-19dec2022 (accessed on 16 January 2024).
- PCSD. Mainstreaming the Environmentally Critical Areas Network (ECAN) into the Local Land Use Planning System of the Local Government Units (LGU): Framework and Methods; Palawan Council for Sustainable Development: Puerto Princesa City, Philipinnes, 2016.
- Saito, O.; Subramanian, S.M.; Hashimoto, S.; Takeuchi, K. Introduction: Socio-Ecological Production Landscapes and Seascapes. In Managing Socio-Ecological Production Landscapes and Seascapes for Sustainable Communities in Asia; Science for Sustainable Societies; Saito, O., Subramanian, S., Hashimoto, S., Takeuchi, K., Eds.; Springer: Singapore, 2020. [Google Scholar] [CrossRef]
- de Groot, R.S.; Alkemade, R.; Braat, L.; Hein, L.; Willemen, L. Challenges in integrating the concept of ecosystem services and values in landscape planning, management and decision making. Ecol. Complex. 2010, 7, 260–272. [Google Scholar] [CrossRef]
- IPBES. Summary for Policymakers of the Methodological Assessment Report on the Diverse Values and Valuation of Nature of the Intergovernmental Science-Policy Platform on Biodiversity and Ecosystem Services; Pascual, U., Balvanera, P., Christie, M., Baptiste, B., González-Jiménez, D., Anderson, C.B., Athayde, S., Barton, D.N., Chaplin-Kramer, R., Jacobs, S., et al., Eds.; IPBES Secretariat: Bonn, Germany, 2022. [Google Scholar] [CrossRef]
- King, E.; Cavender-Bares, J.; Balvanera, P.; Mwampamba, T.H.; Polasky, S. Trade-offs in ecosystem services and varying stakeholder preferences: Evaluating conflicts, obstacles, and opportunities. Ecol. Soc. 2015, 20, 25. [Google Scholar] [CrossRef]
- van de Sand, I. Payments for ecosystem services in the context of adaptation to climate change. Ecol. Soc. 2012, 18, 17–39. [Google Scholar] [CrossRef]
- Calderon, M.M.; Anit, K.P.A.; Palao, L.K.M.; Lasco, R.D. Households’ willingness to pay for improved watershed services of the Layawan Watershed in Oroquieta City, Philippines. J. Sustain. Dev. 2013, 6, 1. [Google Scholar] [CrossRef]
- Bueno, E.A.; Ancog, R.; Obalan, E.; Cero, A.D.; Simon, A.N.; Malvecino-Macalintal, M.R.; Bactong, M.; Lunar, J.; Buena, G.R.; Sugui, L. Measuring households’ willingness to pay for water quality restoration of a natural urban lake in the Philippines. Environ. Process. 2016, 3, 875–894. [Google Scholar] [CrossRef]
- Platania, M.; Rizzo, M. Willingness to pay for protected areas: A case of Etna Park. Ecol. Indic. 2018, 93, 201–206. [Google Scholar] [CrossRef]
- de Valck, J.; Rolfe, J. Spatial heterogeneity in stated preference valuation: Status, challenges and road ahead. Int. Rev. Environ. Resour. Econ. 2018, 11, 355–422. [Google Scholar] [CrossRef]
- Glenk, K.; Johnston, R.J.; Meyerhoff, J.; Sagebiel, J. Spatial dimensions of stated preference valuation in environmental and resource economics: Methods, trends and challenges. Environ. Resour. Econ. 2020, 75, 215–242. [Google Scholar] [CrossRef]
- Stephenson, J. The Cultural Values Model: An integrated approach to values in landscapes. Landsc. Urban Plan. 2008, 84, 127–139. [Google Scholar] [CrossRef]
- Sieber, R. Public participation geographic information systems: A literature review and framework. Ann. Assoc. Am. Geogr. 2006, 96, 491–507. [Google Scholar] [CrossRef]
- Brown, G.; Kyttä, M. Key issues and research priorities for public participation GIS (PPGIS): A synthesis based on empirical research. Appl. Geogr. 2014, 46, 122–136. [Google Scholar] [CrossRef]
- Fagerholm, N.; Käyhkö, N.; Ndumbaro, F.; Khamis, M. Community stakeholders’ knowledge in landscape assessments—Mapping indicators for landscape services. Ecol. Indic. 2012, 18, 421–433. [Google Scholar] [CrossRef]
- Daily, G.C. Management objectives for the protection of ecosystem services. Environ. Sci. Policy 2000, 3, 333–339. [Google Scholar] [CrossRef]
- Schubert, P.; Ekelund, N.G.; Beery, T.H.; Wamsler, C.; Jönsson, K.I.; Roth, A.; Stålhammar, S.; Bramryd, T.; Johansson, M.; Palo, T. Implementation of the ecosystem services approach in Swedish municipal planning. J. Environ. Policy Plan. 2018, 20, 298–312. [Google Scholar] [CrossRef]
- Burdon, D.; Potts, T.; McKinley, E.; Lew, S.; Shilland, R.; Gormley, K.; Thomson, S.; Forster, R. Expanding the role of participatory mapping to assess ecosystem service provision in local coastal environments. Ecosyst. Serv. 2019, 39, 101009. [Google Scholar] [CrossRef]
- Hinson, C.; O’Keeffe, J.; Mijic, A.; Bryden, J.; Van Grootveld, J.; Collins, A.M. Using natural capital and ecosystem services to facilitate participatory environmental decision making: Results from a systematic map. People Nat. 2022, 4, 652–668. [Google Scholar] [CrossRef]
- Sagoe, A.A.; Aheto, D.W.; Okyere, I.; Adade, R.; Odoi, J. Community participation in assessment of fisheries related ecosystem services towards the establishment of marine protected area in the Greater Cape Three Points area in Ghana. Mar. Policy 2021, 124, 104336. [Google Scholar] [CrossRef]
- Akbar, A.; Flacke, J.; Martinez, J.; van Maarseveen, M.F. The role of participatory village maps in strengthening public participation practice. ISPRS Int. J. Geo-Inform. 2021, 10, 512. [Google Scholar] [CrossRef]
- Lukman, K.M.; Uchiyama, Y.; Quevedo, J.M.D.; Harding, D.; Kohsaka, R. Land use changes assessment using a triangulated framework: Perception interviews, land-use/land cover observation, and spatial planning analysis in Tanjung Batu and Derawan Island, Indonesia. Hum. Ecol. 2021, 49, 551–564. [Google Scholar] [CrossRef]
- Hockings, M.; Leverington, F.; Cook, C. Protected area management effectiveness. In Protected Area Governance and Management; ANU Press: Canberra, Australia, 2015; pp. 889–928. [Google Scholar]
- Millennium Ecosystem Assessment. Ecosystems and Human Well-Being: Synthesis; Island Press: Washington, DC, USA, 2005. [Google Scholar]
- Reed, P.; Brown, G. Values suitability analysis: A methodology for identifying and integrating public perceptions of ecosystem values in forest planning. J. Environ. Plan. Manag. 2003, 46, 643–658. [Google Scholar] [CrossRef]
- Brown, G. Mapping Spatial Attributes in Survey Research for Natural Resource Management: Methods and Applications. Soc. Nat. Resour. 2004, 18, 17–39. [Google Scholar] [CrossRef]
- Castaño-Isaza, J.; Newball, R.; Roach, B.; Lau, W.W. Valuing beaches to develop payment for ecosystem services schemes in Colombia’s Seaflower marine protected area. Ecosyst. Serv. 2015, 11, 22–31. [Google Scholar] [CrossRef]
- Pilien, J.; Walpole, P. Moving from open access extraction to new participatory levels of accountable management: Malampaya Sound, Palawan, the Philippines. In Natural Resource Conflict Management Case Studies: An Analysis of Power, Participation and Protected Areas; Castro, A.P., Nielsen, E., Eds.; FAO: Rome, Italy, 2003; pp. 251–268. [Google Scholar]
- Bartlett, J.E.; Kotrlik, J.W.; Higgins, C.C. Organizational research: Determining appropriate sample size in survey research. Inf. Technol. Learn. Perform. J. 2001, 19, 43–50. [Google Scholar]
- Hashimoto, S.; Nakamura, S.; Saito, O.; Kohsaka, R.; Kamiyama, C.; Tomiyoshi, M.; Kishioka, T. Mapping and characterizing ecosystem services of social–ecological production landscapes: Case study of Noto, Japan. Sustain. Sci. 2015, 10, 257–273. [Google Scholar] [CrossRef]
- Havas, J.; Saito, O.; Hanaki, K.; Tanaka, T. Perceived landscape values in the Ogasawara Islands. Ecosyst. Serv. 2016, 18, 130–140. [Google Scholar] [CrossRef]
- Bladon, A.J.; Short, K.M.; Mohammed, E.Y.; Milner-Gulland, E.J. Payments for ecosystem services in developing world fisheries. Fish Fish. 2016, 17, 839–859. [Google Scholar] [CrossRef]
- Supsup, C.E.; Asis, A.A.; Eslava, M.R.R.; Domingo, J.P.S.; Amarga, A.K.S.; Carestia, U.V., Jr.; Cantil, J.A.; Marjorie, D.; Acosta-Lagrada, L.S. Revisiting environmental management zones toward conserving globally important species in western Philippines. J. Nat. Conserv. 2023, 73, 126415. [Google Scholar] [CrossRef]
- Yang, Y.E.; Passarelli, S.; Lovell, R.J.; Ringler, C. Gendered perspectives of ecosystem services: A systematic review. Ecosyst. Serv. 2018, 31, 58–67. [Google Scholar] [CrossRef]
- Shen, Z.; Wakita, K.; Oishi, T.; Yagi, N.; Kurokura, H.; Blasiak, R.; Furuya, K. Willingness to pay for ecosystem services of open oceans by choice-based conjoint analysis: A case study of Japanese residents. Ocean. Coast. Manag. 2015, 103, 1–8. [Google Scholar] [CrossRef]
- Obeng, E.A.; Aguilar, F.X. Value orientation and payment for ecosystem services: Perceived detrimental consequences lead to willingness-to-pay for ecosystem services. J. Environ. Manag. 2018, 206, 458–471. [Google Scholar] [CrossRef] [PubMed]
- Hernández, B.; Hidalgo, M.C.; Salazar-Laplace, M.E.; Hess, S. Place attachment and place identity in natives and non-natives. J. Environ. Psychol. 2007, 27, 310–319. [Google Scholar] [CrossRef]
- Demirović, D.; Radovanović, M.; Petrović, M.D.; Cimbaljević, M.; Vuksanović, N.; Vuković, D.B. Environmental and community stability of a mountain destination: An analysis of residents’ perception. Sustainability 2017, 10, 70. [Google Scholar] [CrossRef]
- Broom, C. Exploring the relations between childhood experiences in nature and young adults’ environmental attitudes and behaviours. Aust. J. Environ. Educ. 2017, 33, 34–47. [Google Scholar] [CrossRef]
- Sato, M.; Ushimaru, A.; Minamoto, T. Effect of different personal histories on valuation for forest ecosystem services in urban areas: A case study of Mt. Rokko, Kobe, Japan. Urban For. Urban Green. 2017, 28, 110–117. [Google Scholar] [CrossRef]
- Li, L.; Ando, A.W. Early Exposure to Nature and Willingness to Pay for It: The Value of Tallgrass Prairie Grassland Restoration. Land Econ. 2023, 99, 509–527. [Google Scholar] [CrossRef]
- Dang, A.N.; Jackson, B.M.; Benavidez, R.; Tomscha, S.A. Review of ecosystem service assessments: Pathways for policy integration in Southeast Asia. Ecosyst. Serv. 2021, 49, 101266. [Google Scholar] [CrossRef]
- Amin, A.; Zaehringer, J.G.; Schwilch, G.; Koné, I. People, protected areas and ecosystem services: A qualitative and quantitative analysis of local people’s perception and preferences in Côte d’Ivoire. Nat. Resour. Forum 2015, 39, 97–109. [Google Scholar] [CrossRef]
- González-García, A.; Palomo, I.; González, J.A.; García-Díez, V.; García-Llorente, M.; Montes, C. Biodiversity and ecosystem services mapping: Can it reconcile urban and protected area planning? Sci. Total Environ. 2022, 803, 150048. [Google Scholar] [CrossRef]
- Liu, Y.; Li, T.; Zhao, W.; Wang, S.; Fu, B. Landscape functional zoning at a county level based on ecosystem services bundle: Methods comparison and management indication. J. Environ. Manag. 2019, 249, 109315. [Google Scholar] [CrossRef]
- Aguilar, F.X.; Obeng, E.A.; Cai, Z. Water quality improvements elicit consistent willingness-to-pay for the enhancement of forested watershed ecosystem services. Ecosyst. Serv. 2018, 30, 158–171. [Google Scholar] [CrossRef]
- Jo, J.H.; Lee, C.B.; Cho, H.J.; Lee, J. Estimation of citizens’ willingness to pay for the implementation of payment for local Forest ecosystem services: The case of taxes and donations. Sustainability 2021, 13, 6186. [Google Scholar] [CrossRef]
Figure 1.
Conceptual framework of the study (Source: authors).
Figure 1.
Conceptual framework of the study (Source: authors).
Figure 2.
Administrative map of Taytay and location of the study site (Source: authors).
Figure 2.
Administrative map of Taytay and location of the study site (Source: authors).
Figure 3.
Process flow for landscape value point mapping (Source: authors).
Figure 3.
Process flow for landscape value point mapping (Source: authors).
Figure 4.
Type of perceived ESs in Malampaya based on MEA classification.
Figure 4.
Type of perceived ESs in Malampaya based on MEA classification.
Figure 5.
Distribution of mapped landscape points based on ES type and grouped by barangay.
Figure 5.
Distribution of mapped landscape points based on ES type and grouped by barangay.
Figure 6.
Distribution of perceived landscape values identified by respondents.
Figure 6.
Distribution of perceived landscape values identified by respondents.
Figure 7.
Location of the identified landscape value points in Malampaya overlaid with the terrestrial ECAN zones.
Figure 7.
Location of the identified landscape value points in Malampaya overlaid with the terrestrial ECAN zones.
Figure 8.
Weight of importance of perceived landscape value typologies.
Figure 8.
Weight of importance of perceived landscape value typologies.
Figure 9.
Density hotspot maps of six landscape typologies based on WTP for enhancement of ecosystem services in MSPLS. Note: Kernel density surfaces were automatically generated with a 500 m search radius.
Figure 9.
Density hotspot maps of six landscape typologies based on WTP for enhancement of ecosystem services in MSPLS. Note: Kernel density surfaces were automatically generated with a 500 m search radius.
Table 1.
Typology of values of ESs used in the study.
Table 1.
Typology of values of ESs used in the study.
| Typology | Definition |
|---|
| Access | Places valued mainly because people can have free access to the benefits and services of the area. |
| Aesthetic | Places valued because of their beautiful scenery. |
| Biodiversity | Places valued for the presence of biodiversity and/or a wide array of different forms of life. |
| Economic | Places valued because of their components which are related to commercial use and profitability. |
| Future | Places valued for their characteristics and/or importance that can be passed on to or used by future generations for their wellbeing. |
| Historical | Places valued because they are areas of natural and human history. |
| Identity/Symbolic | Places valued for their important symbolic features that play a role in the identity of the place itself and the community. |
| Intrinsic | Places valued for their intangible unique characteristics, with which people have developed a highly personal and meaningful relationship over time. |
| Learning | Places valued because of the learning one can gain from nature. |
| Life-Sustaining | Places valued for benefits that are fundamental and life-supporting and without which people would cease to survive. |
| Recreation | Places valued because they provide recreational areas. |
| Subsistence | Places valued for their landscapes and/or seascapes and the components of them people use to survive or to make a self-sufficient living. |
| Therapeutic | Places valued for their medicinal properties and characteristics that support health and wellbeing. |
| Wilderness | Places valued because they offer primitive, unconfined types of recreation and serve as areas for scientific exploration and spiritual inspiration. |
Table 2.
Socio-demographic characteristics of the respondents.
Table 2.
Socio-demographic characteristics of the respondents.
| Socio-Demographics | Data Collected |
|---|
| Age (years) | Average respondent’s age: 46 |
| Gender | Female: 73.7%; Male: 26.3% |
| Residence length (years) | Average: 37.3 years; Highest: 83 years; Lowest: 2 years |
| Status of residence | Native: 57.9%; Migrant: 42.1% |
| Income dependent on nature | Fishing: 68 (59.6%); Farming: 33 (28.9%); Others: 13 (11.4%) |
Table 3.
Count of perceived landscape value points in Malampaya Sound under each ECAN zone (both terrestrial and marine zoning).
Table 3.
Count of perceived landscape value points in Malampaya Sound under each ECAN zone (both terrestrial and marine zoning).
| Summary of Value Mapping and Allocation |
|---|
| | | Total | Core | Restricted | Controlled | Traditional | Multiple-Use |
|---|
| ZONES | On land | 365 | 88 | 3 | 27 | 152 | 95 | | |
| In the sea | | Baklad
Zone | Bokatot
Zone | Core/Strict
Protection | Communal Fishing Ground | Fish Cage Zone | Navigational
Zone | Tourism
Devt.
Zone |
| 371 | 140 | 14 | 0 | 174 | 15 | 28 | None |
Table 4.
Relationship between weight of importance of landscape values and their trends in two places of residence, Pancol and New Guinlo.
Table 4.
Relationship between weight of importance of landscape values and their trends in two places of residence, Pancol and New Guinlo.
| Trend in ES | Rank of ES | Correlation Coefficient | Significance Value (p-Value) | Remarks |
|---|
| Trend (all) | Rank (all) | −0.068 | 0.064 | Relationship is significant at a 10% level of significance; relationship is weak, inversely related |
| Trend (Pancol) | Rank (Pancol) | −0.098 | 0.062 | Relationship is significant at 10% level of significance; relationship is weak, inversely related |
Trend (New
Guinlo) | Rank (New
Guinlo) | −0.037 | 0.478 | Not significant at 5% level of significance |
Table 5.
Analysis result of respondents’ attributes and subjective valuation.
Table 5.
Analysis result of respondents’ attributes and subjective valuation.
| | Count of Value Point | Rank | Trend | WTP |
|---|
| Aesthetic | Age (+) | | Male > female | |
| Economic | Male > female | | | |
| Recreation | | Non-native > native | Non-native > native | |
| Subsistence | | Male > female | | |
| Therapeutic | | Age (−) | Age (−) | |
Table 6.
Analysis result of perceived ESs and subjective valuation.
Table 6.
Analysis result of perceived ESs and subjective valuation.
| | Count of Value Point | Rank | Trend | WTP |
|---|
| Cultural | Female > male | Non-native > native | | Native > non-native |
| Provisioning | Male > female | Male > female | | Female > male |
| Supporting | Age (+) | | | |
Table 7.
Willingness to pay statistics as per answers of the randomly selected respondents when asked how much they were willing to pay, in a year, to improve ESs in Malampaya.
Table 7.
Willingness to pay statistics as per answers of the randomly selected respondents when asked how much they were willing to pay, in a year, to improve ESs in Malampaya.
| | Minimum | Maximum | Mean | Std. Deviation |
|---|
| WTP | 0.00 | 3000.00
(PHP 3000) | 94.91
(PHP 95) | 266.75
(PHP 267) |
Table 8.
Relationship between WTP and income of the respondents.
Table 8.
Relationship between WTP and income of the respondents.
| WTP | Income | Correlation Coefficient | Significance Value (p-Value) | Remarks |
|---|
| WTP (all) | Income (all) | −0.128 | 0.176 | Not significant at 5% level of significance |
| WTP (Pancol) | Income (Pancol) | −0.229 | 0.099 | Relationship is significant at a 10% level of significance; relationship is weak, inversely related |
WTP (New
Guinlo) | Income (New
Guinlo) | −0.040 | 0.759 | Not significant at 5% level of significance |
| Disclaimer/Publisher’s Note: The statements, opinions and data contained in all publications are solely those of the individual author(s) and contributor(s) and not of MDPI and/or the editor(s). MDPI and/or the editor(s) disclaim responsibility for any injury to people or property resulting from any ideas, methods, instructions or products referred to in the content. |
© 2024 by the authors. Licensee MDPI, Basel, Switzerland. This article is an open access article distributed under the terms and conditions of the Creative Commons Attribution (CC BY) license (https://creativecommons.org/licenses/by/4.0/).


