Article

Combining Soil Immobilization and Dressing Techniques for Sustaining the Health of Metal-Contaminated Arable Soils

1
Department of Biological Environment, Kangwon National University, Chuncheon 24341, Republic of Korea
2
Department of Agronomy, Kansas State University, Manhattan, KS 66506, USA
3
Department of Smart Agro-Industry, Gyeongsang National University, Jinju 52725, Republic of Korea
4
Korea Environment Institute, Sejong 30147, Republic of Korea
5
Department of Biological Environmental Chemistry, Chungnam National University, Daejeon 34134, Republic of Korea
*
Author to whom correspondence should be addressed.
Sustainability 2024, 16(8), 3227; https://doi.org/10.3390/su16083227
Submission received: 20 February 2024 / Revised: 31 March 2024 / Accepted: 10 April 2024 / Published: 12 April 2024

Abstract

:
The combination of lime immobilization of metals and soil dressing has been a prevalent practice in Korea for remediating metal-contaminated arable soils. However, there have been limited reports on whether this method effectively sustains soil health after remediation, particularly in arable soils. This study undertook a comparative assessment of the soil health index (SHI) across metal-contaminated arable lands, arable soils remediated with lime immobilization and soil dressing, and uncontaminated soils. A total 389 soil samples were collected from these sites and analyzed for nineteen indicators encompassing physical, chemical, and biological properties. To assess soil health, these indicators were screened using principal component analysis, yielding five minimum data set (MDS) indicators: total nitrogen, clay content, dehydrogenase activity, bacterial colony-forming units, and available phosphorus. Among these MDS indicators, total nitrogen exhibited the highest value as the principal component contributing to soil health assessment. Scores of the MDS indicators exhibited significant correlation with those of total data set indicators, affirming the appropriateness of the soil health assessment adopted in this study. The SHI of the remediated arable soils (0.48) surpassed those of the contaminated soils (0.47) and were statistically comparable to those of the uncontaminated forest (0.51) and upland (0.51) soils. The health of the contaminated soils demonstrated a high dependence on soil properties rather than metal concentrations. These findings underscore the robustness of the combined immobilization and soil dressing method for sustaining the health of contaminated arable soils post-remediation.

1. Introduction

The contamination of arable soils with heavy metals poses a serious threat to both crop productivity and human health [1,2]. One of the primary sources of heavy metals is the solid wastes and wastewater discharged from closed and/or abandoned mines [3]. Therefore, numerous physical, chemical, and biological remediation methods have been employed to address metal-contaminated soils [4,5,6]. However, the majority of these methods have primarily focused on reducing metal concentrations, often overlooking the resilience of soil health post-remediation. In many instances, soil remediation technologies are recognized for potentially exerting adverse effects on soil quality and crop productivity [7,8,9,10,11]. Moreover, many of these methods are deemed impractical to a significant extent due to economical and time constraints when considering their implementation in arable soils.
The soil washing method effectively has reduced total metal levels in contaminated soils, such as decreasing Pb levels from 650 mg kg−1 to 62 mg kg−1 [9]. However, crop yields grown in the washed soil have shown a substantial decrease due to unfavorable soil texture disturbance and reductions in available water content, organic matter, and total nitrogen [8,9,10]. The electrokinetic method, when applied to Cd-contaminated soils, led to a decrease in soil pH, consequently inhibiting root elongation and seed germination of Sorghum bicolor var. saccharatum (sweet sorghum), Lepidium sativum (garden cress), and Sinapis alba (white mustard) [7].
When selecting a suitable method for remediating metal-contaminated soil, particularly in agricultural practices, it is crucial to not only lower heavy metal levels below legal standards but also to preserve soil health and sustain crop productivity. Consequently, there is a growing interest in minimizing the adverse effects of soil remediation on soil health.
For these reasons, the in situ metal immobilization technique using lime has been widely adopted for remediating arable soils contaminated with heavy metals [8,12,13]. This method involves increasing the soil pH through the application of lime, which helps reduce the phytoavailability of heavy metals by promoting deprotonation and precipitation processes [12,14]. The in situ immobilization technique is frequently combined with other soil remediation methods, such as soil dressing, in which a layer of an uncontaminated soil or amendment (e.g., manure, fertilizer, compost, peat) is applied to the surface of land. This integrated approach can effectively isolate the contaminated soil below the rhizosphere while concurrently diminishing the availability of heavy metals in the surface soil [15,16,17,18].
The effects of combining immobilization and soil dressing techniques on soil properties and functions have been subject to controversy regarding whether they are beneficial or detrimental [13,16,19,20,21]. For instance, pH increases caused by lime application increased the cation exchange capacity of soils [22]. Liming might reduce the phytoavailability of soil essential micronutrients [23]. Soil dressing can disturb soil physical and chemical properties, depending on the cover soil used, thus reducing crop productivity [16,21] and diversity of the soil biotic community [24,25]. However, integrating multiple remediation methods aims to enhance the effectiveness of soil remediation efforts in lowering pollutant levels and minimizing potential risks associated with heavy-metal contamination in agricultural environments [20,26,27].
Soil health is a holistic concept that encompasses not only chemical, physical, and biological properties of soil but also soil functions that are connected to soil ecosystem services [28,29,30]. As noted, the adoption of soil remediation methods alters specific soil properties, and these changes are often utilized as indicators for evaluating soil health [31,32,33,34]. However, the evaluation of soil health based on a limited number of soil properties with different units has sparked controversy regarding the ability of these properties to accurately represent overall soil health status. Therefore, several researchers have proposed a scoring system for soil health assessment aiming to incorporate as many principal variables as possible [32,35,36,37].
Soil sampling and analysis to assess health are widely conducted on soils ranging from individual plots to regional or national scales. However, selecting pertinent soil parameters and interpreting measurements are not straightforward due to the complexity and site-specific nature of soils [38]. Consequently, when evaluating the effects of remedial methods on soil health, the assessment tools may necessitate comprehensive studies that encompass various soil types and properties. Hence, evaluating the status of soil health while considering the implications of soil remediation methods is essential for determining the compatibility of such methods in sustaining soil health. However, there has been limited research that considers this specific concern.
This study aimed to test an appropriateness of the soil health assessment protocol adopted in this study on samples that were collected from soils under various land uses. Additionally, it sought to evaluate the soil health status of arable lands previously contaminated with heavy metals from abandoned mines and remediated using a combined method involving lime immobilization and soil dressing. Furthermore, this study compared the soil health of the remediated soil with that of uncontaminated soils obtained from arable uplands, forests, and urban parks.

2. Materials and Methods

2.1. Soil Samples and Remediation

Agricultural sites across various provinces of the Republic of Korea were chosen for soil sampling. Specifically, the soils came from Gangwon Province (Chuncheon City and Jeongseon County), North-Chungcheong Province (Danyang County and Jecheon City), Gyeonggi Province (Dongducheon City, Paju City, and Pocheon City), and North-Gyeongsang Province (Yeongdeok County). These sites were contaminated due to previous mining for arsenic (As), cadmium (Cd), copper (Cu), lead (Pb), zinc (Zn), or a combination thereof, as detailed in Table 1 and Figure 1. A total of 389 soil samples were collected for soil health assessment, comprising 9 samples from contaminated arable soils (CA), 80 samples from remediated arable soils (RA), 100 samples from uncontaminated agricultural sites (AG), 100 samples from uncontaminated forests (FO), and 100 samples from uncontaminated urban parks (UP). All soil samples were taken prior to crop cultivation, adhering to the national soil monitoring protocol established by Rural Development Administration, Republic of Korea.
All soil samples that were collected from CA, RA, AG, FO, and UP sites were obtained randomly using auger at depths ranging from 0 to 15 cm, with triplicates for analyses of soil properties including metal concentrations. Composite samples were prepared by combining and homogenizing five individual samples at each sampling site. Soil contamination by heavy metals was judged based on levels exceeding at least one metal concentration beyond the threshold danger level (TDL) or the corrective action level (CAL) (refer to Figure 1), as designated in the Korea Soil Environment Conservation Act (SECA) [39].
The contaminated arable (CA) sites underwent in situ treatment with 5% lime. Then, uncontaminated sandy loam soil was placed on top of the lime-treated soils up to 30~50 cm in thickness. The soil was then thoroughly mixed using a tractor. This protocol has been widely accepted in Korea for remediating metal-contaminated arable lands near abandoned mine sites [40]. From the remediated arable (RA) fields, eighty soil samples were collected at depths of 0~15 cm for analyses of soil properties, metal concentration, and soil health using the same sampling method as described for CA.
To compare the soil health of contaminated (CA) and remediated arable (RA) soils with that of uncontaminated soil, a total 300 of uncontaminated soil samples were collected, with 100 samples from three land use categories, including agricultural uplands (AG), forests (FO), and urban park (UP), that were sampled using the same sampling method as described for CA. The collected soil samples were placed in plastic bags, transported to the laboratory, and stored in cold storage at 4 °C. Fresh soil samples were used to determine soil biological properties, such as respiration, enzyme activities, and microbial colony-forming units (CFU). Aliquots of soil samples were air-dried and ground to pass through a 2 mm sieve for chemical analysis. Additionally, soil cores were sampled from each site at a 0~25 cm depth to determine soil bulk density, porosity, and water-stable aggregates.

2.2. Total Data Set (TDS) for Soil Health Assessment

Seventeen indicators (Table 1) were analyzed as a total data set (TDS) for soil health assessment, following the methodology outlined by Lehmann et al. [29]. The soil indicators were selected with a focus on their importance with respect to soil health and its ecosystem functions and services [29]. Also, these indicators were chosen considering national soil databases for sustainable and efficient soil health management.
Total heavy metal concentrations in all soil samples were determined using ICP-OES (iCAP 6000 Series, Thermo Scientific, Cambridge, UK) following aqua regia digestion of the soil in a trace metal digestion system (SMA 20A, C. Gerhardt UK Ltd., Königswinter, Germany) [12]. Specifically, soil was digested with aqua regia at 105 °C for 2 h using a commercial trace metal digestion system, and the suspension was subsequently diluted with 0.5 M HNO3. According to this procedure, samples were filtered through Whatman no. 42 filter papers before determination of total heavy metal concentrations using ICP-OES. Other soil chemical and physical properties were analyzed according to protocols of the National Institute of Agricultural Science and Technology [41]. For the biological properties of the soils, soil respiration was analyzed using the Oxitop soil respiration measurement system (WTW, Weilheim in Oberbayern, Germany) [42]. Dehydrogenase (DHA) assays were performed using soluble tetrazolium salt (TTC) [43]. Activities of β-glucosidase (GLU), phosphatase (PHA), and arylsulfatase (ARS) were assessed following procedures adapted from Tabatabai and Bremner [44,45] and Eivazi and Tabatabai [46]. Urease activity (URE) was determined using the buffered method described by Kandeler and Gerber [47]. Colony-forming units (CFUs) of soil bacteria were determined with serial dilution and plating on tryptic soy agar (TSA) [48].

2.3. Minimum Data Set (MDS) for Soil Health Assessment

The minimum data sets (MDS) for soil health indicators were screened from seventeen soil variables (Table 1 and Table 2) using principal component analysis (PCA). In PCA, principal components (PCs) with eigenvalues greater than 1 and those explaining at least 5% of the total variation of the dataset were identified as MDS. For each PC, only highly loaded indicators, with loading values greater than 10% of the highest weighted loading, were retained as important soil health indicators, following the methodology of Andrews et al. [35]. In cases where multiple indicators were retained within a single PC, indicator redundancy was assessed using Pearson’s correlation analysis [35].
Each indicator within the MDS was scored using the non-linear standardized scoring system, which was normalized using a long-term national soil database (Figure 2). The y-axis represents soil health scores ranging from 0 to 1, while the x-axis depicts the measured values of the corresponding indicator. The non-linear scoring systems for soil health indicators were grouped into “more is better”, “optimum is best”, and “less is better” functions, following the approaches proposed by Rinot et al. [36] and Sintim et al. [37]. To verify how effectively the selected soil health indicators (MDS) represented the total dataset (TDS), all other soil property variables were also transformed and scored using the same non-linear scoring function as described above.
After calculating the scores for each soil health indicator of MDS, the integrated soil health index (SHI) was calculated with following equation:
SHI   = i = 1 n S i × w i
where Si represents score of soil health indicator, w i is weight factor of i indicator, and n is number of the soil health indicator in the MDS. Once transformed, a weight factor ( w i ) for each indicator was estimated based on the results of the PCA. These weights were derived by calculating the variation of each respective PC (%) divided by the total percentage of variation of all PCs with eigenvectors greater than 1. A higher SHI score defines better soil health.

2.4. Data Treatment and Statistics

All data in the tables and figures are mean values with standard deviations. Statistical significances were determined at p < 0.05 with ANOVA using SAS 9.3 software (SAS for Windows v. 9.3, SAS Institute Inc., Cary, NC, USA). The curve fitting for non-linear standardized scoring system was generated with CurveExpert Professional 1.6.10 software (CurveExpert Pro-fessional v1.6.10, Hyams Development, Madison, AL, USA).

3. Results and Discussion

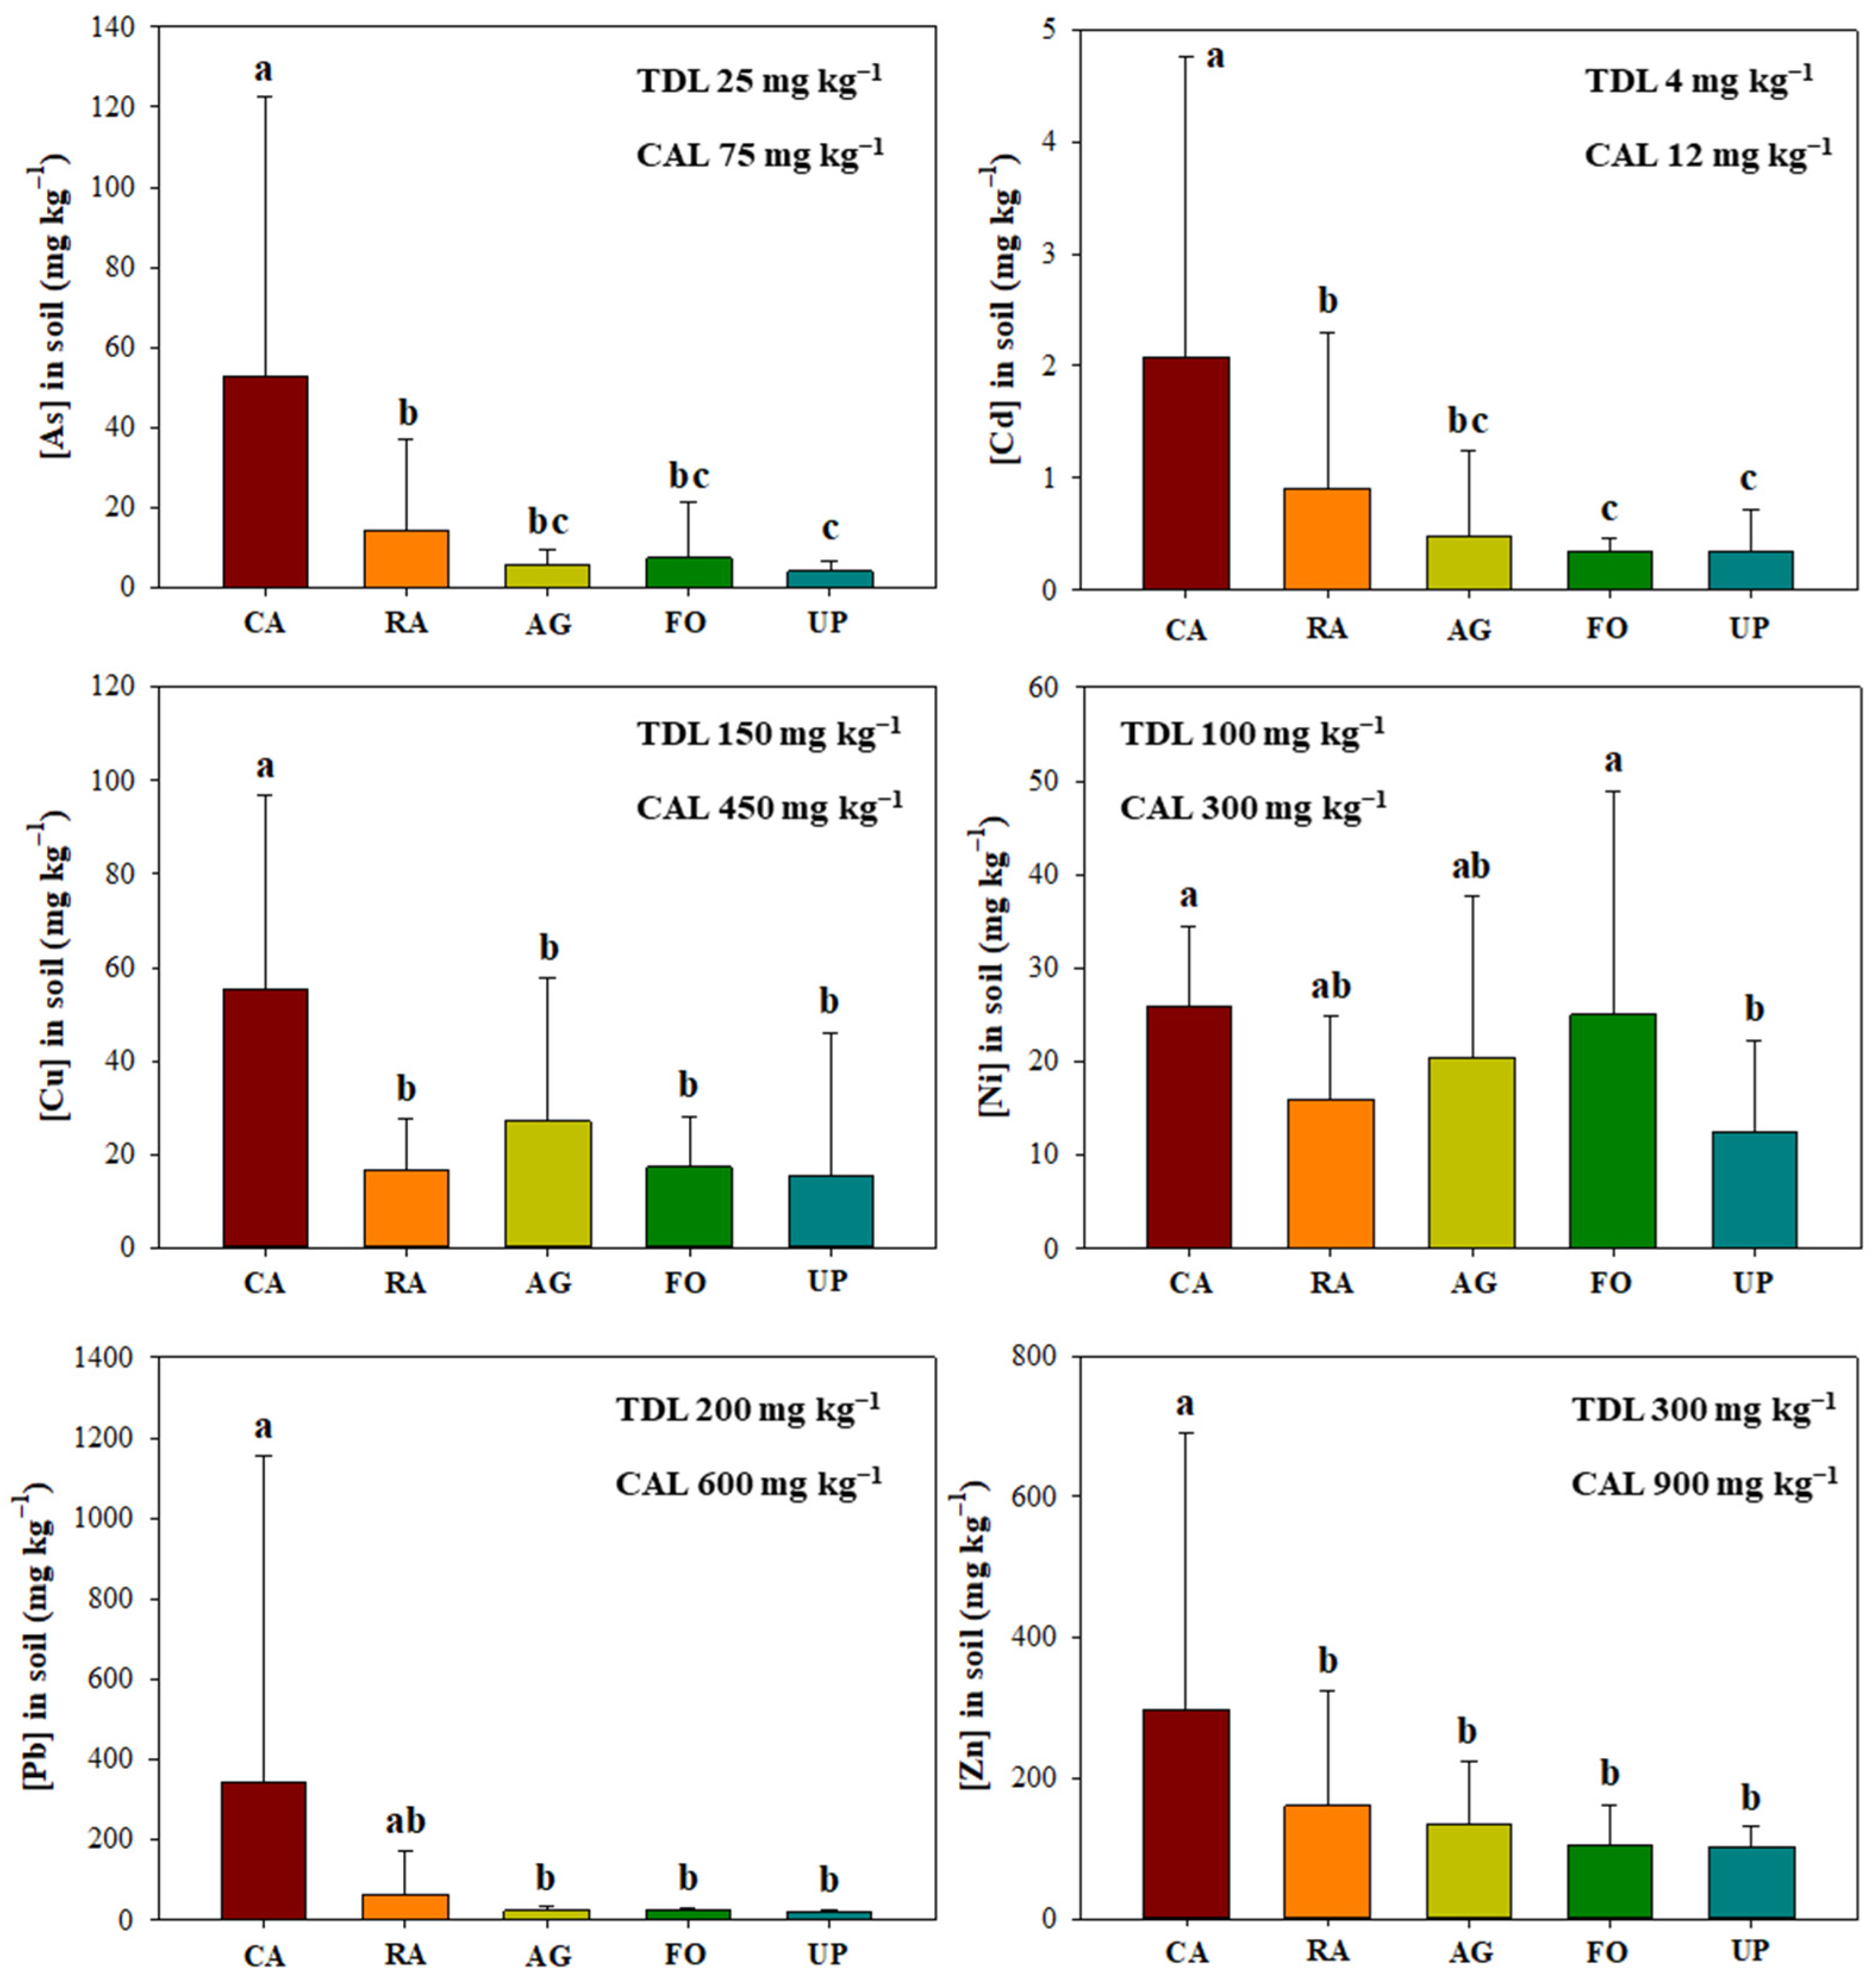
3.1. Heavy Metals in Soil

Figure 1 shows the average concentrations of six heavy metals in soil samples taken from the contaminated arable (CA) soils, the remediated arable (RA) soils, and the uncontaminated forests (FO), agricultural uplands (AG) and urban parks (UP). Concentrations of As, Pb, and Zn in CA soils exceeded those of the threshold danger level (TDL), indicating contamination. However, concentrations of other metals in all samples remained below TDL.
The average concentrations of heavy metals in RA soil samples were lower than those in CA soils; however, there was no significant difference (p > 0.05). Furthermore, metal concentrations in RA soil fell below the TDL, as stipulated in the SECA guideline [39]. This suggests that the combination of lime immobilization of metals and soil dressing reduced heavy metal concentrations, demonstrating compatibility and efficacy in remediation. Concentrations of As, Cd, Pb, and Zn in RA samples, representing major metal contaminants in CA soils, remained significantly higher (p < 0.05) than those in the uncontaminated soils (FO, AG, and UP). While the application of the combined lime and soil dressing methods lowered metal levels in soils, limited information is available regarding how these methods alter soil health.

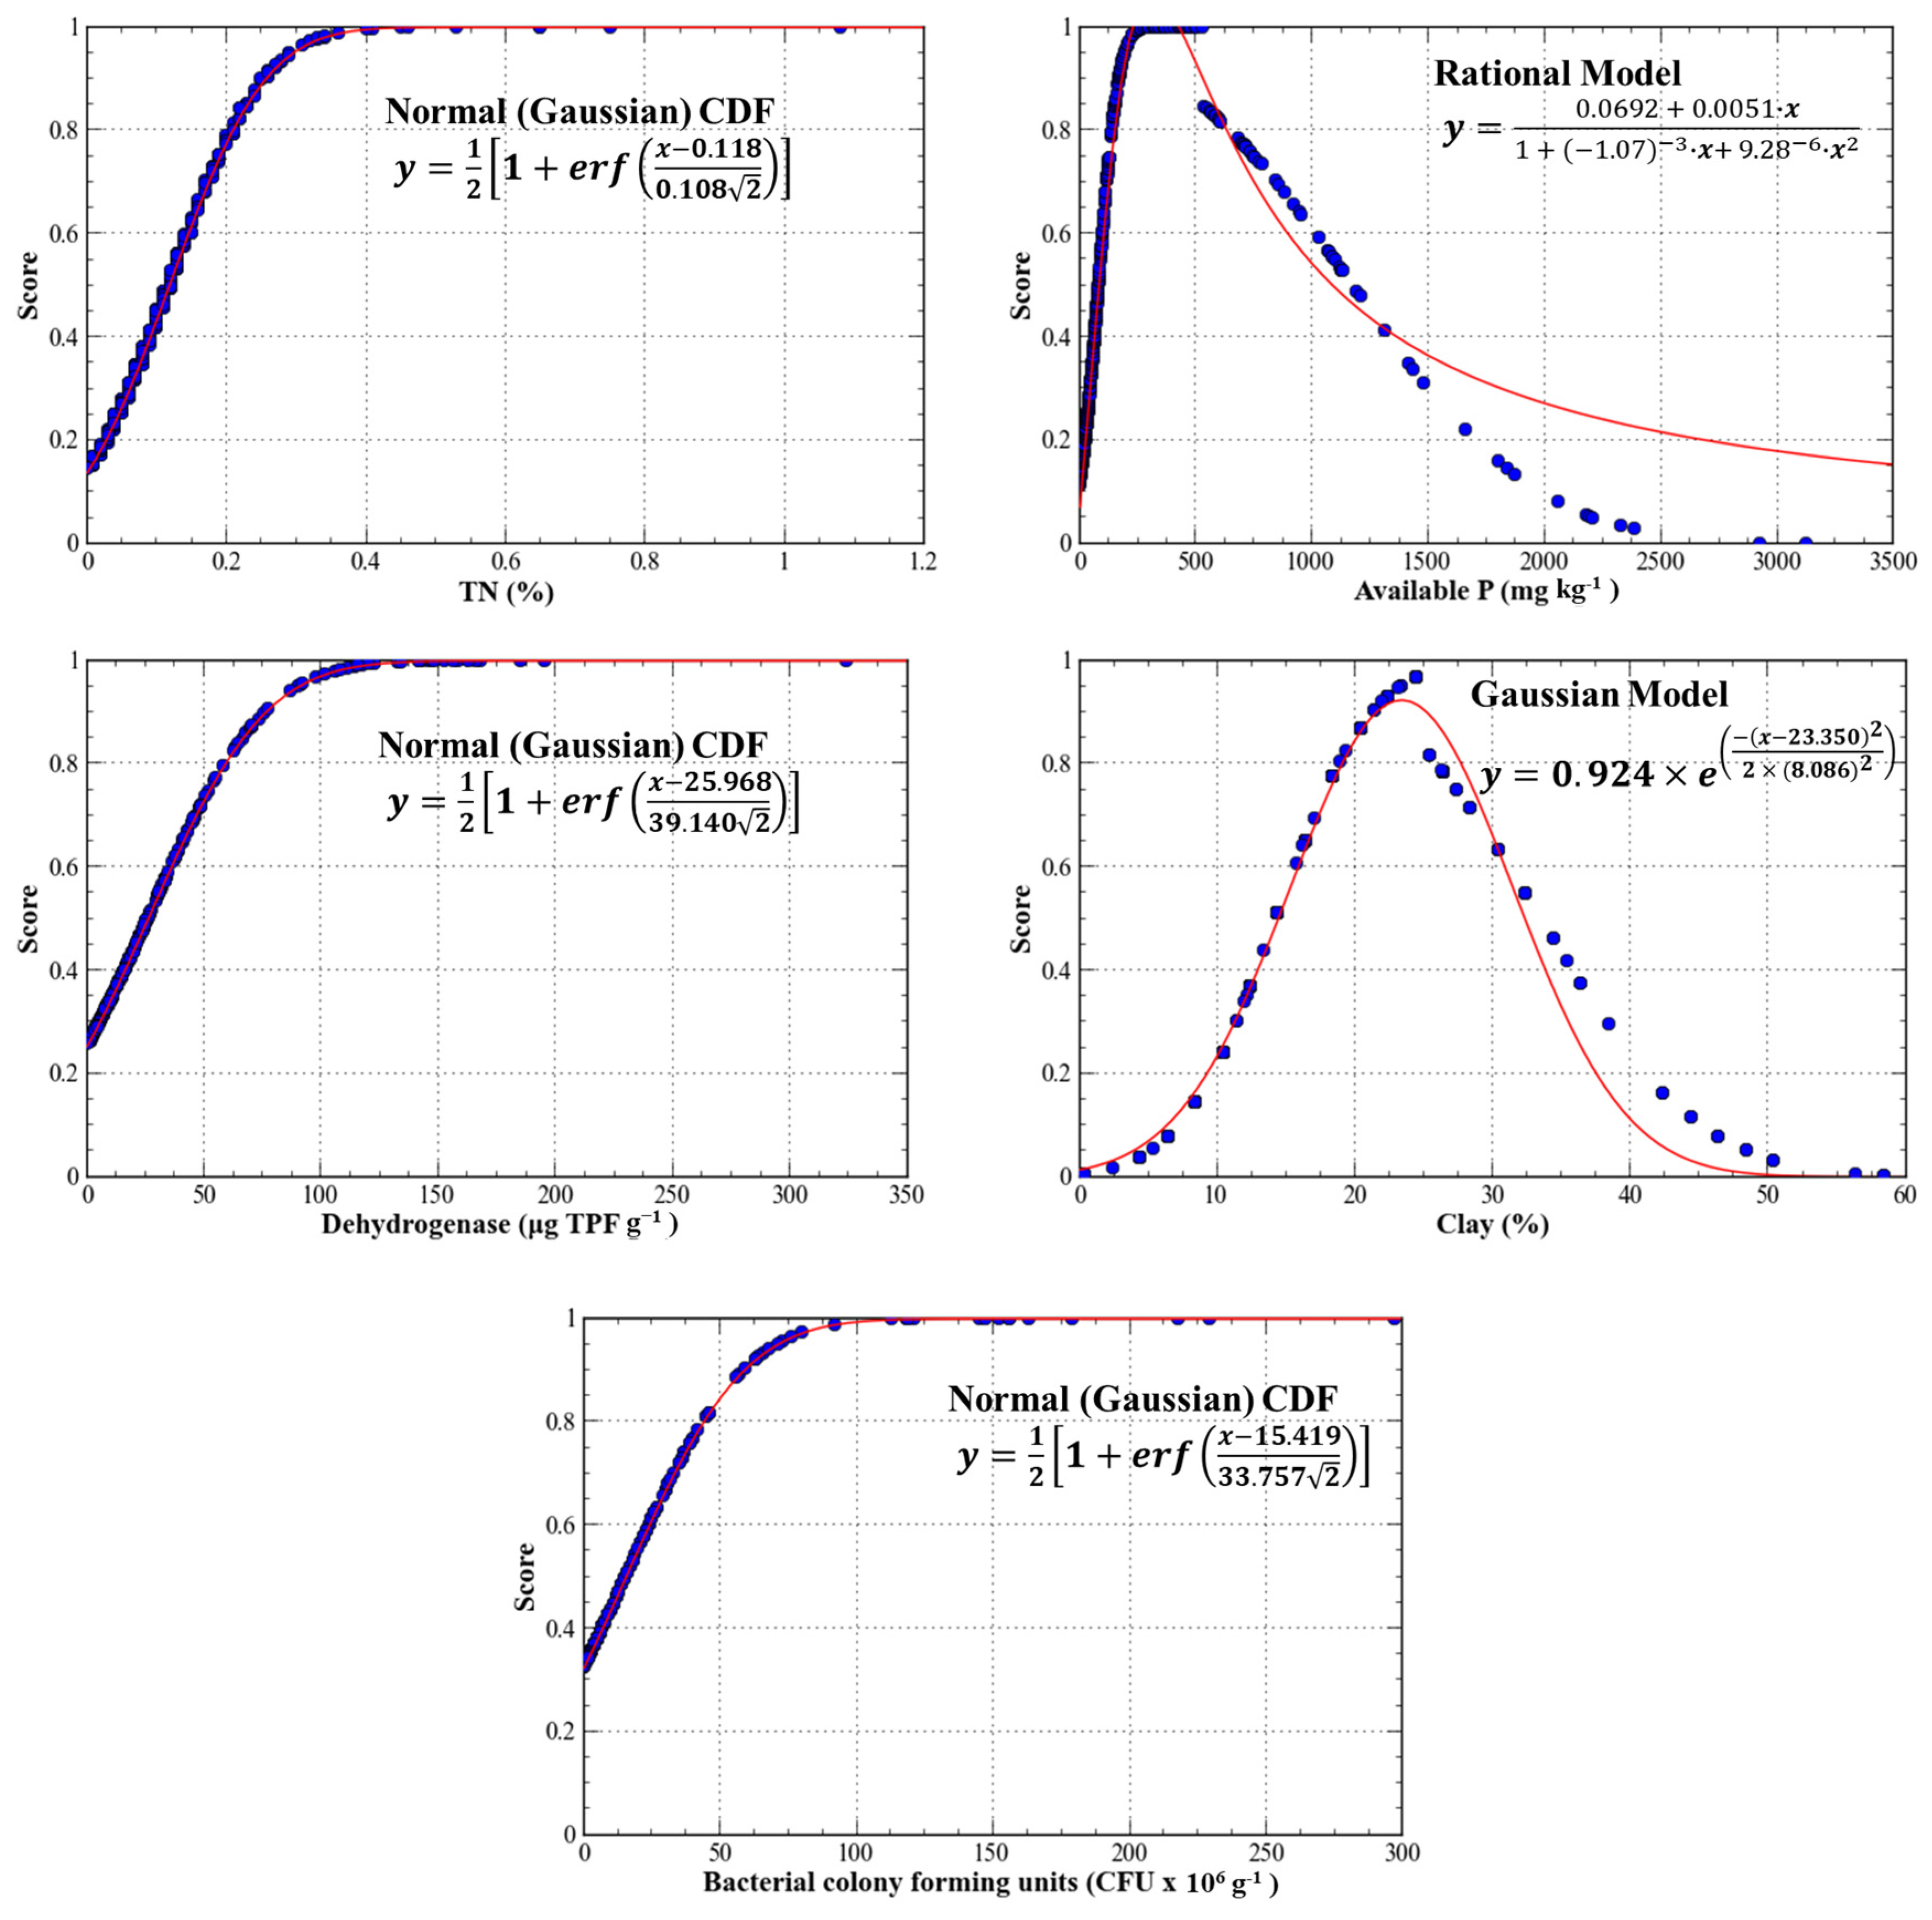
3.2. Total Data Set for Soil Health Assessment

The average values of nineteen soil physical, chemical, and biological properties are presented in Table 1. These parameters, constituting the total data set (TDS), were used to screen the minimum data set (MDS) that was utilized to assess soil health. Values for chemical indicators, such as pH, EC, organic matter, and exchangeable cations, of AG and FO soils fell within a range comparable to national, representative soil samples [49,50,51].
The RA soil exhibited higher pH and EC values compared to other soils, which was attributed to lime application; however, there were no significant differences (p > 0.05). This trend is consistent with findings reported by Li et al. [52]. In addition, the use of the dressing soil for remediation resulted in the RA soil having the highest clay content and the lowest organic matter content and water-stable aggregate ratio compared to the other uncontaminated three soil samples.
Heavy metals are known to potentially have a negative impact on soil biological properties, including soil respiration and soil enzyme activities [53,54,55]. Though the biological properties of RA soil and some types of soils showed no significant differences (p > 0.05), the average values of respiration and enzyme activities in RA soils were lower than those in other soils. Particularly, the average dehydrogenase (DHA) activities in CA and RA soil were lower than those of the uncontaminated soils by 54~71% and 52~70%, respectively. Dehydrogenase activity is widely used to estimate microbial oxidative activities [56] and is considered a more suitable indicator for the effects of heavy metals on soil microbial properties than other soil parameters [57,58]. For example, Dotaniya and Pipalde [59] observed that increasing the level of soil Pb (up to 300 mg kg−1 soil) inhibited 54% of DHA of the soils.
In contrast, the CFU of soil bacteria and ARS activities in RA soil showed higher values than those in other soils. This increase might be attributed to a rise in soil pH due to lime application. Bååth and Arnebrant [60] observed that the number of culturable bacteria was up to 5.1 times higher in higher pH soils. Additionally, ARS activities in soils were significantly correlated with soil pH [61]. Aponte et al. [53] reported that heavy metal contamination reduced ARS activities in soils, but this negative effect was mitigated by an increase in soil pH.
Chemical and physical properties of the RA soil appeared to be influenced by those of the dressing soil. As a result, individual chemical and physical properties of the RA soil were either higher or lower than those of the CA soil. These fluctuations did not clearly reveal any change in soil health. However, the ratios of soil biological properties for RA/CA were generally higher than 1, suggesting soil biological activities appeared to be improved. This underscores the need for a holistic evaluation of soil health using key parameters, such as MDS, rather than relying on all of the nineteen parameters.

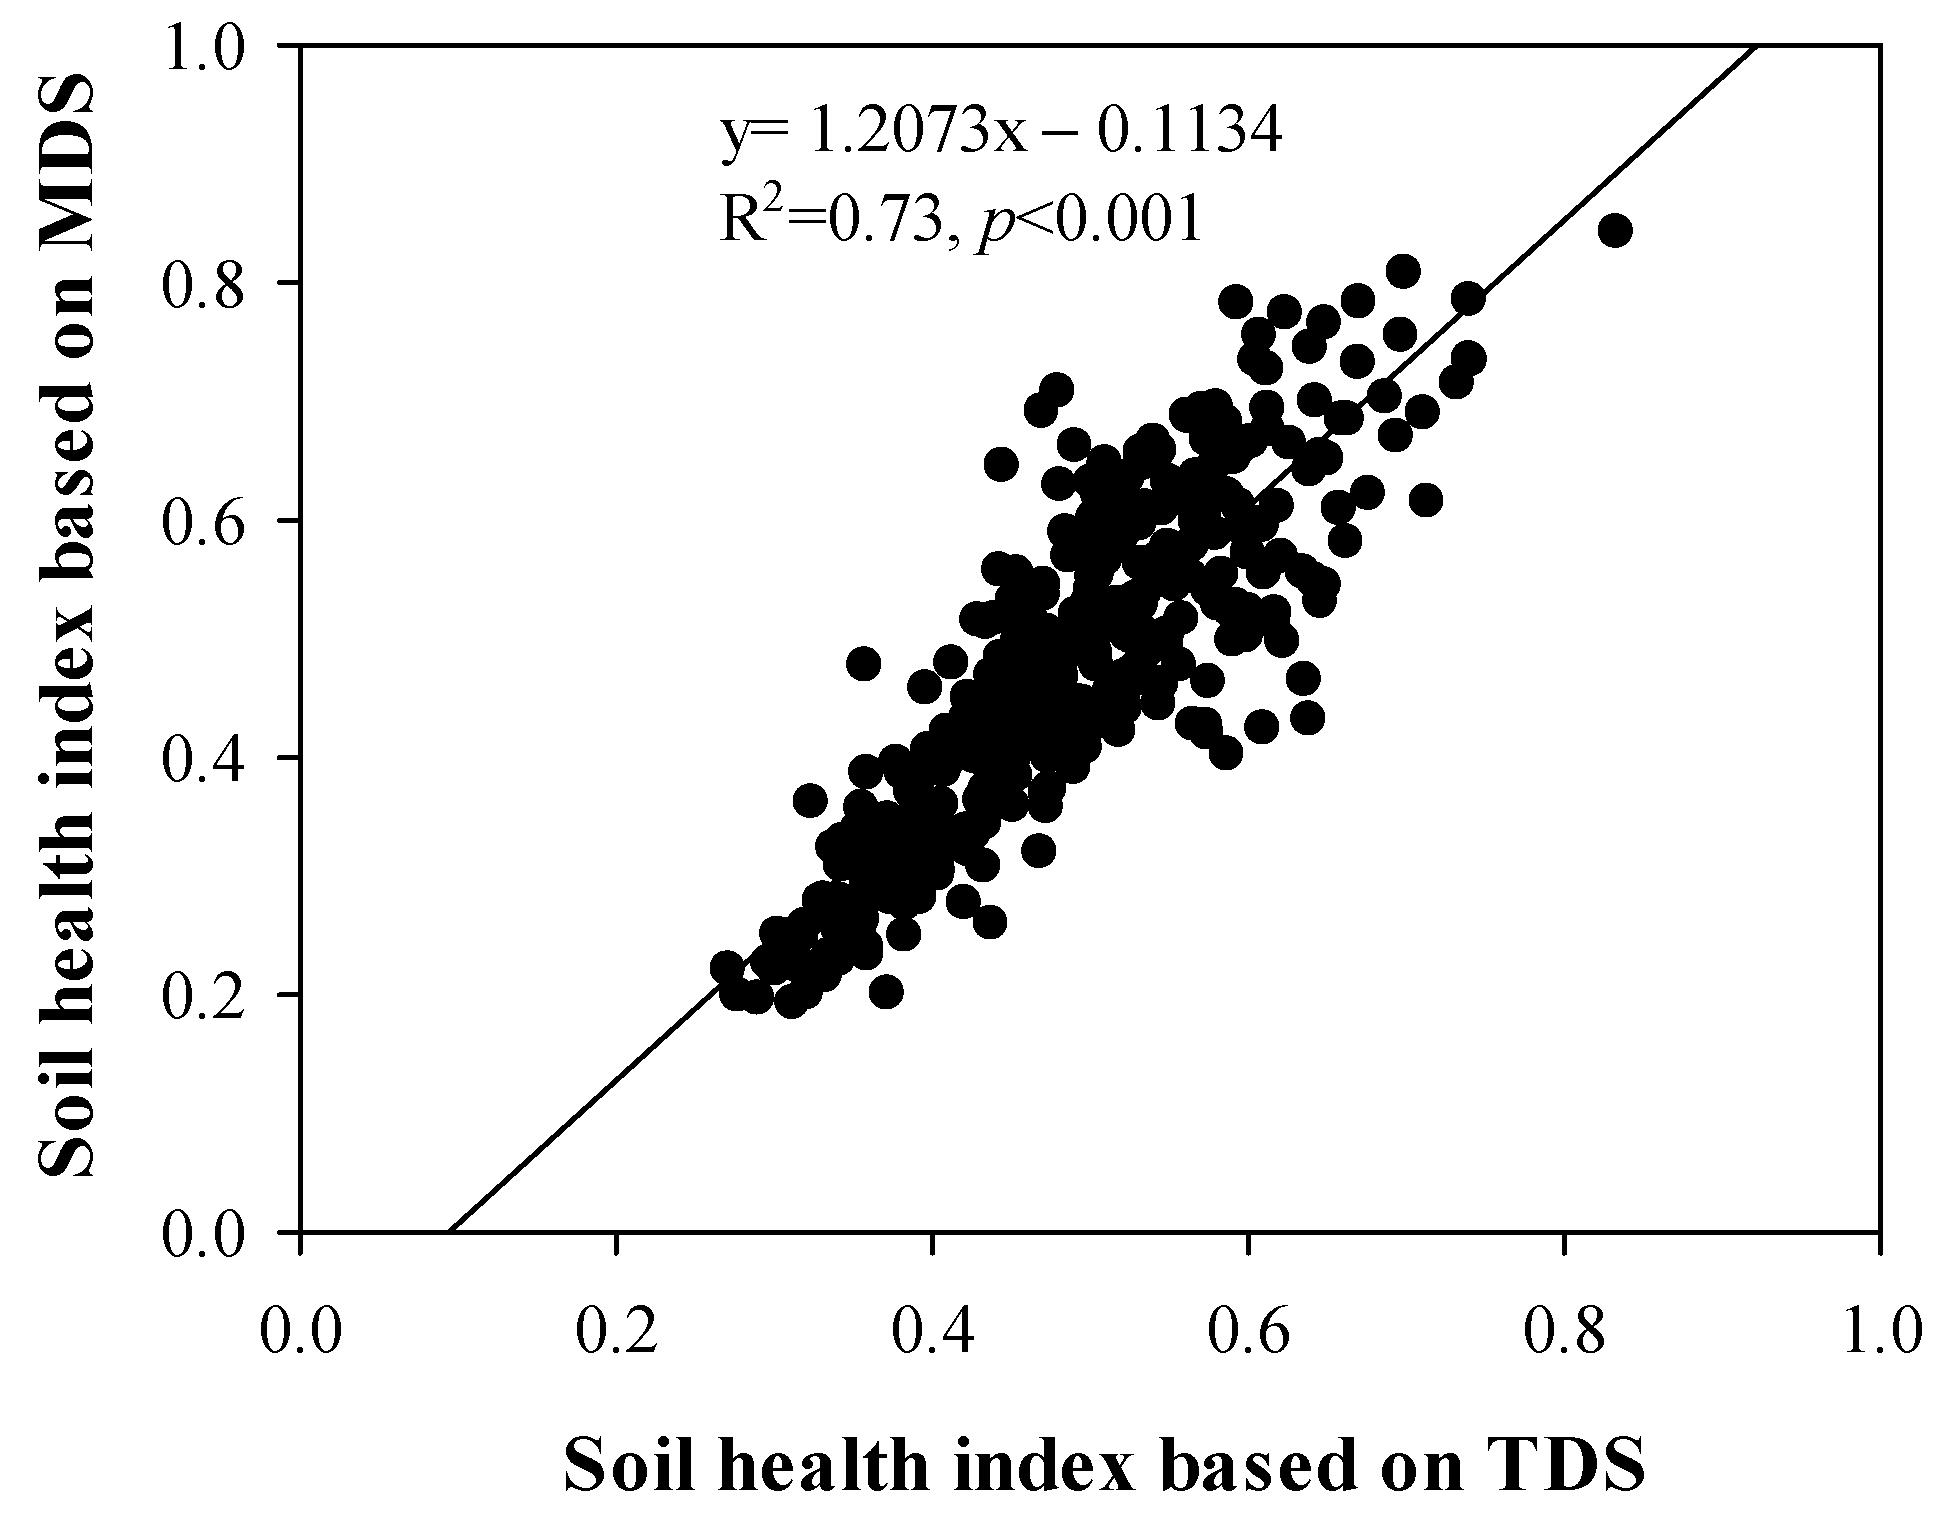
3.3. Selection of the Minimum Data Set (MDS)

The soil health assessment process using the TDS could significantly increase labor, time, and the cost of laboratory analysis [62]. For effective soil health assessment, it is essential to screen the minimum data set (MDS) to configure soil health indicators [30]. Principal component analysis (PCA) coupled with correlation analysis, as a data reduction technique, is widely accepted for screening minimum data sets (MDS) from all measured soil properties [63].
Table 2 shows the first five principal components (PCs) with eigenvalues greater than 1.0 and cumulatively expressing 61% of the total variation based on the PCA. The respective contributions of PC1, PC2, PC3, PC4, and PC5 were 26.8%, 10.5%, 9.5%, 7.7%, and 6.4%. Total nitrogen (TN) exhibited the highest loading value under PC1. Loading values of organic matter, bulk density, porosity, soil respiration, and PHA were within 10% of the TN loading value. Total nitrogen showed significant correlation with these variables (Table 3), leading to the selection of TN as the only indicator among PC1 indicators.
From PC2, clay content and water-stable aggregates (WSA, %) emerged as potential candidates for MDS, but clay content was ultimately considered as the sole soil health indicator due to its significant correlation with WSA (Table 3). In PC3, the loadings were dominated by DHA and ARS, with ARS’s loading being within 10% of that of DHA. Given the higher correlation between DHA and ARS (Table 3), DHA was retained as the most important indicator for PC3. Available P in PC4 was selected for the MDS because it had the highest loading value, and no other indicator was within 10% of the loading value of available P. The CFU of soil bacteria had the highest loading value under PC5; thus, it was selected as the soil health indicator for the MDS.
Based on PCA and correlation analysis, the minimum data set (MDS) for soil health assessment was screened to include total nitrogen, clay content, DHA, available P, and CFU of soil bacteria. These parameters encompassed the physical, chemical, and biological properties of the soil. Previous research by Dengiz [64], Datta et al. [65], and Dubey et al. [66] indicated that the MDS should represent the overall properties of the soil and be relevant for testing soil management options, including remediation, to determine whether they recover soil health or not.
Based on the PCA results, each PC explained a certain percentage of the variations in the total data set (TDS). This percentage provided the weighting factor when the variance from each PC was divided by the cumulative variance (60.785% in this case; Table 2), which was derived from PCs with eigenvalues greater than 1 [67]. The weighting factors for the variables in PC1 (total nitrogen), PC2 (clay content), PC3 (DHA), PC4 (available P), and PC5 (CFU of soil bacteria) were 0.44, 0.17, 0.16, 0.13, and 0.10, respectively. These weighting factors were used to calculate the SHI (Equation (1)).

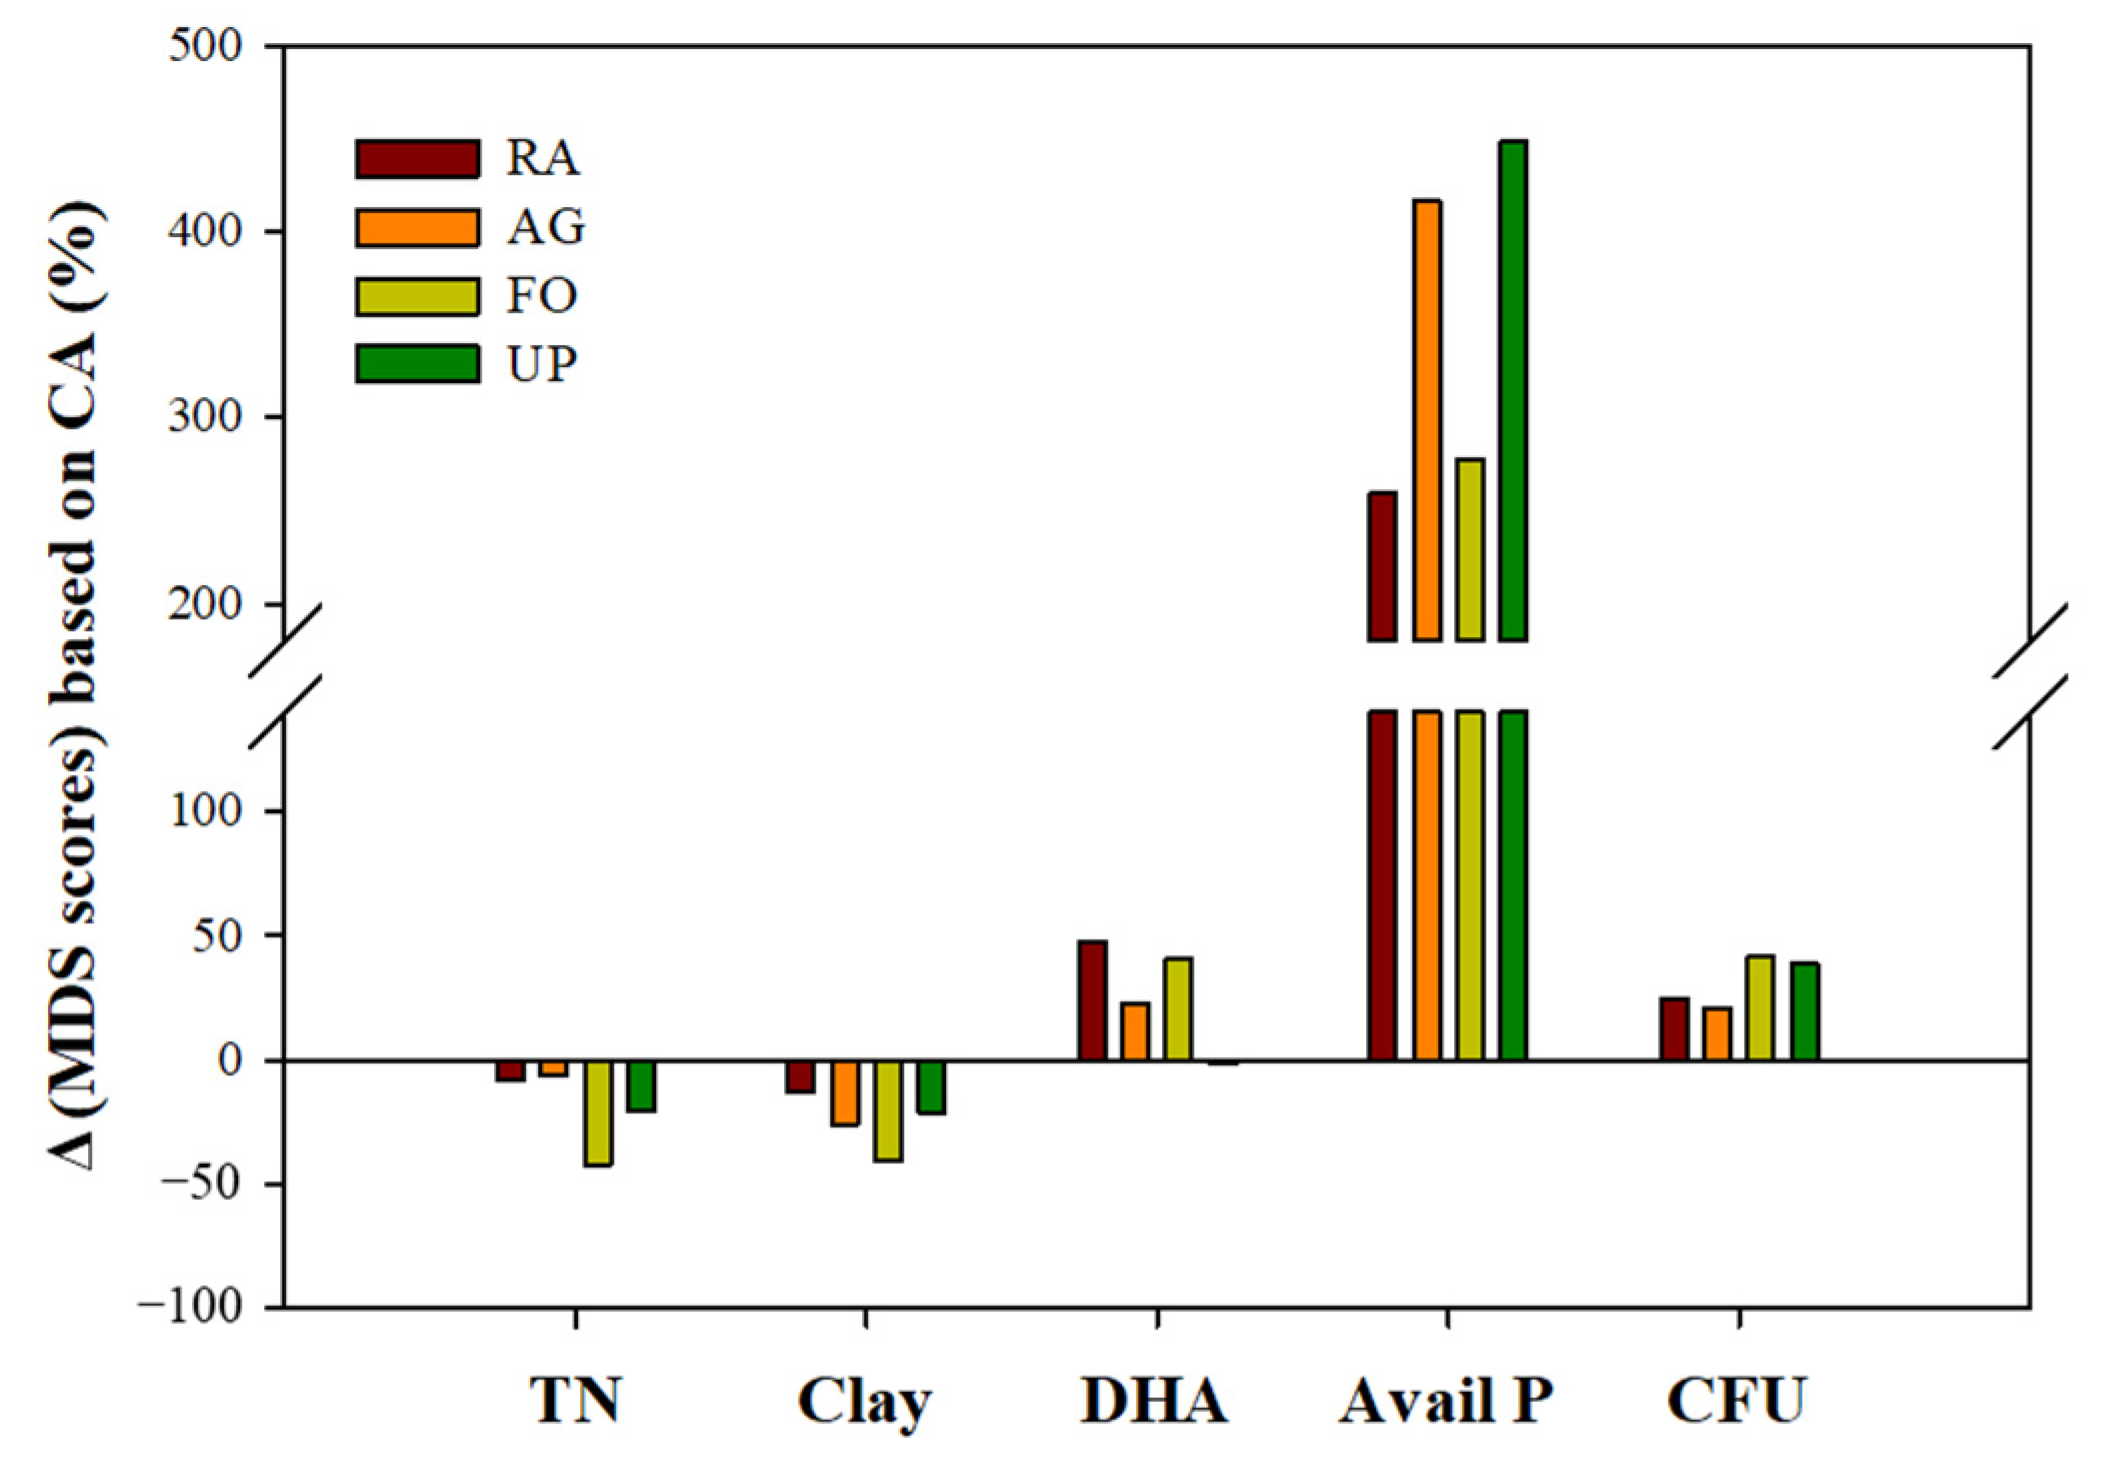
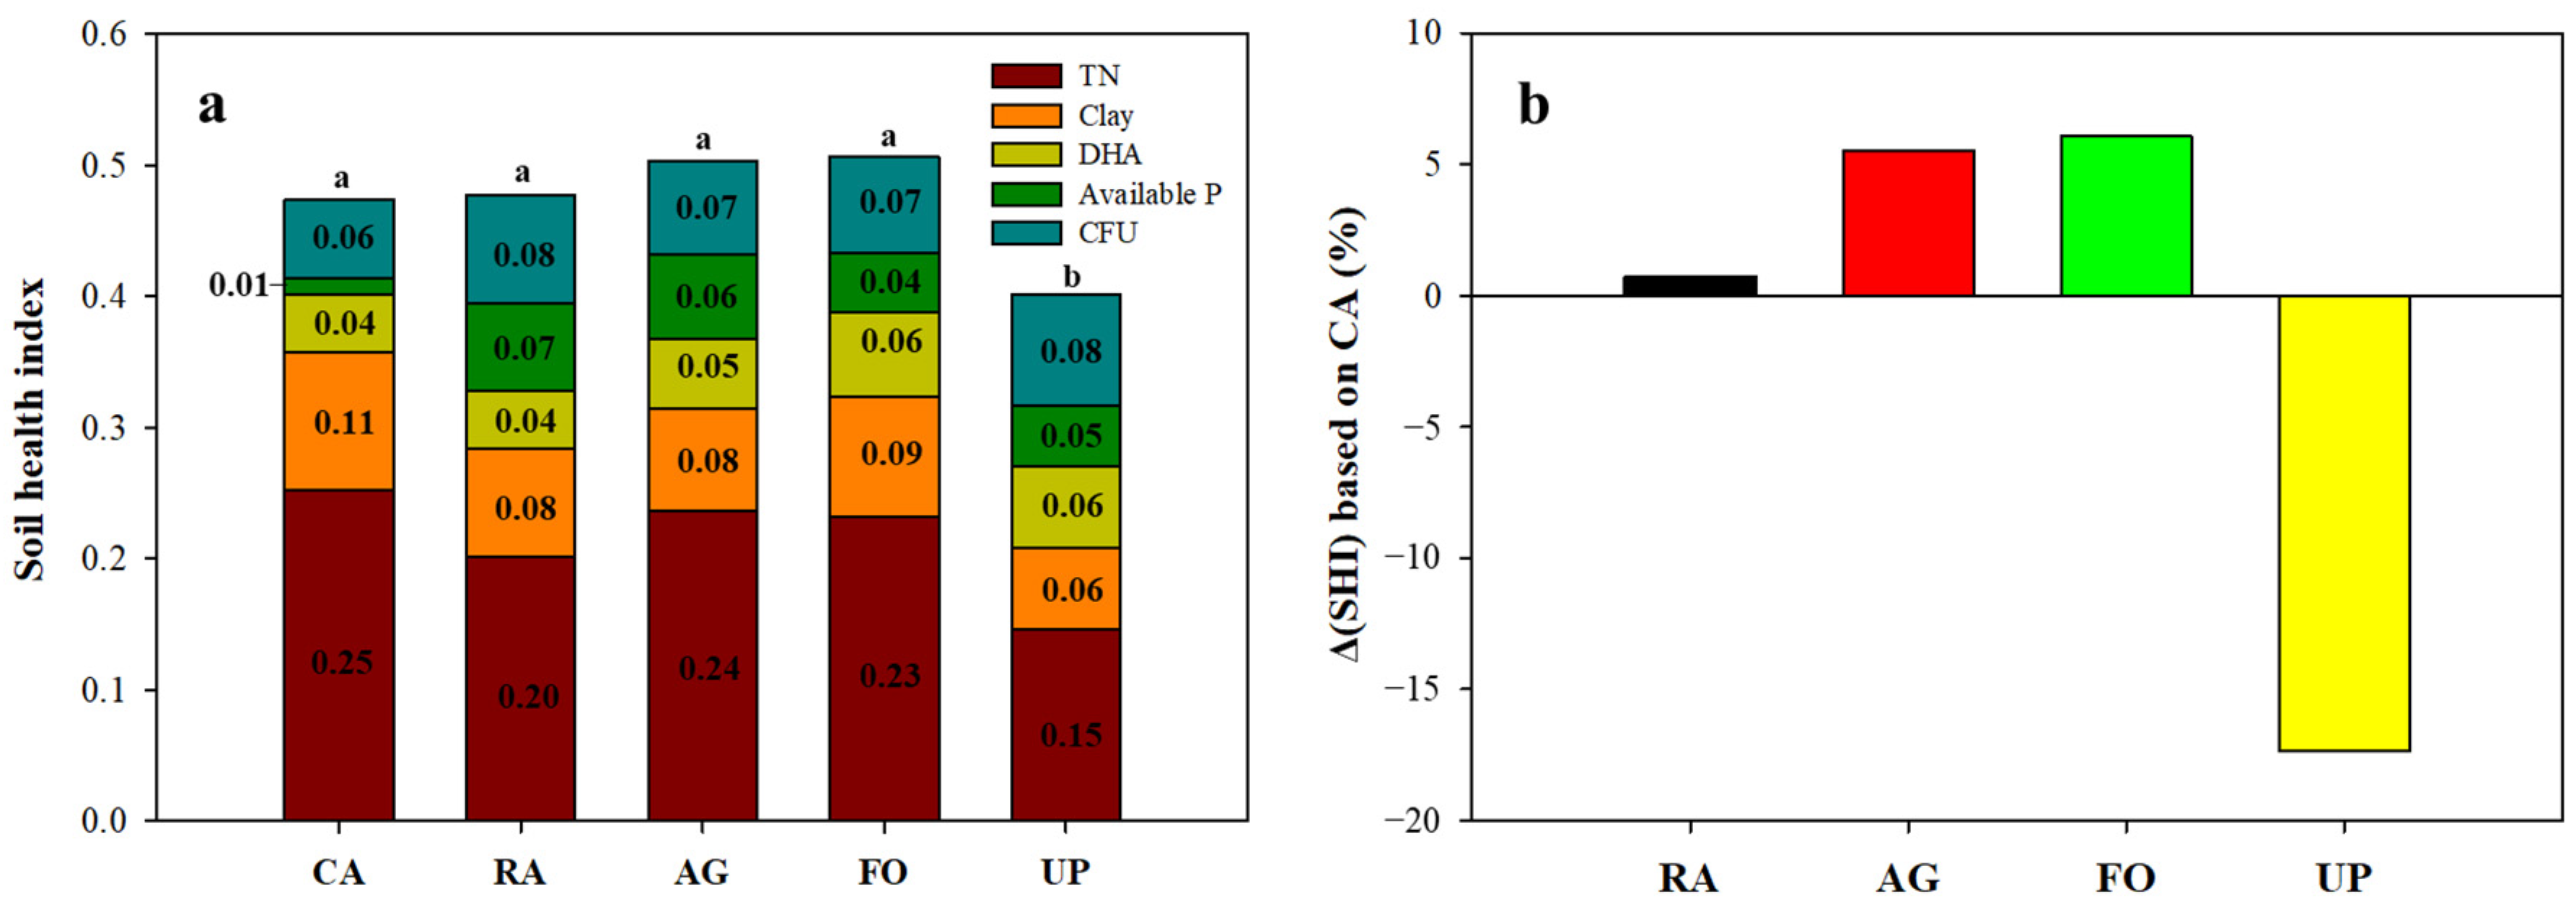
3.4. Scores of Soil Health Index (SHI)

The selected five soil health indicators (MDS) were transformed into dimensionless scores, ranging from 0 to 1, using a non-linear scoring function (Figure 2). In this study, we adopted the “more is better” and “optimum is best” groups to score the soil health indicators, a methodology suggested by other studies [36,37,68,69,70]. The “more is better” group included TN, DHA, and CFU, while the “optimum is best” group comprised clay content and available P.
In an attempt to validate the suitability of using the MDS for soil health assessment, scores of five MDS indicators and nineteen indicators (TDS: Table 1) were calculated and correlated (Figure 3). A highly significant correlation was observed between the scores of MDS and TDS, with a slope of 1.20 (R2 = 0.73). This result supports the fact that MDS indicators reasonably represent TDS indicators in soil health assessment.
Figure 4 illustrates changes in MDS scores, without incorporating the weighting factors, expressed as score ratios (%) of MDS in uncontaminated soils (RA, AG, FO, and UP) compared to those in contaminated soil (CA). These ratios depict the increase (positive value) or decrease (negative value) in MDS indicator scores relative to the contaminated soil. Scores for CFU, DHA, and available P indicators in uncontaminated soils increased compared to those in contaminated soil, with substantial increases observed in the available P score ratios (Figure 4). Conversely, score ratios for TN and clay indicators decreased. It is important to note that changes in MDS scores do not necessary reflect changes in soil health, as MDS scores were calculated using models (Figure 2) before incorporating weighting factors obtained from PCA analysis. Since each MDS indicator contributes differently to soil health (Equation (1)), soil health should be evaluated holistically based on the SHI (Equation (1)).
Soil health index (SHI) was calculated using Equation (1) with scores and weighting factors of MDS indicators. Figure 5a displays SHI values of five soils by summing SHI values of the five MDS indicators. As expected from the weighting factors in the SHI calculation (Equation (1)), TN made the largest contribution to the SHI. The relative contributions of TN to the SHI value for CA, RA, AG, FO, and UP soils were 53%, 42%, 47%, 46%, and 36%, respectively (Figure 5a). The relative contributions of clay, DHA, available P, and bacterial CFU were smaller than those of TN in the five soils.
Figure 5b illustrates changes in the SHI (∆SHI) of the uncontaminated soil (RA, AG, FO, and UP soils) expressed as a percentage ratio (%) over the SHI of the contaminated soil (CA) using mean values of each soil. The ∆SHIs of RA/CA, AG/CA, and FO/CA soils were approximately 1%, 7%, and 8%, respectively, indicating that the soil health of the uncontaminated soil was superior to that of the contaminated soil, albeit not substantially. Kim et al. [20] reported changes in soil health of metal contaminated soil before and after the application of five metal stabilizers, including acid mine drainage sludge, coal mine drainage sludge, steel slag, lime, and cement. Consequently, the SHIs of all stabilized soils became ‘bad’ or ‘very bad’ while the contaminated soil was evaluated as ‘normal’ due to the soil disturbance caused by the application of stabilizers. For this reason, they suggested that the stabilized soil of contaminated soil should be combined with soil dressing techniques. From this study, it was demonstrated that the combined lime immobilization of metal and soil dressing method had no adverse impacts on soil health.
The mean SHI value with the application of weighting factors of RA was 0.48. This value was similar to those of CA (0.47), FO (0.51), and AG (0.51) soils and higher than that of UP soil (Figure 5a,b). The lower SHI value of UP soil could be attributed to lower TN and clay content (Table 1).
When the MDS indicators and other chemical indicators (organic matter and CEC) were classified into two or three groups based on their levels, the changes in the SHI (∆SHI) of RA over CA soil were highly dependent on the scoring functions for individual soil indicators (Table 4). For example, ∆SHI values of TN, DHA, CFU, organic matter, and CEC, which are categorized as “more is better”, revealed relatively high positive values when these soil levels were high but had negative or relatively low positive values when these soil levels were low. Similarly, ∆SHI values of clay and available P, categorized as “optimum is best”, were positive when these soil levels were optimum. These results indicate that even if soils are contaminated, remedial methods can have a positive impact on soil health if soil conditions are appropriate, whereas degraded soils with poor properties are challenging to enhance soil health.
However, the SHIs of the uncontaminated soils were not drastically higher than those of the CA soils because soil properties of CA soils were likely similar to those of RA, AG, and FO soils, despite the CA soil having a higher level of heavy metal concentrations. Heavy metal contamination of soil and the relevant remediation process generally exhibit adverse impacts on soil health by altering soil properties, qualities, and functions [13,16,21,58,71,72]. The SHI values of RA soil were similar to those of FO and AG soils (Figure 5b), even though the average concentrations of As, Cd, Pb, and Zn in RA soil were higher than FO and AG soils (Figure 1). Furthermore, when compared with CA soil, RA soil showed higher scores for bacterial CFU and available P, lower scores for TN and clay, and a similar score for DHA. Consequently, the SHI value of RA was slightly higher than that of CA but that difference was not significant.
The ∆SHI of UP/CA was about −17%, revealing that the soil health of CA soil was higher than that of UP soil. This could be attributable to the poor values of properties governing soil fertility and health in UP soil, such as CEC, OM, clay content, bulk density, and total nitrogen (Table 1).
These results indicate that soil health was more reliant on soil properties (TDS) than types and concentrations of heavy metals. The SHI of RA soil was similar to those of AG and FO soils, demonstrating that the combined methods of lime immobilization of metals and soil dressing do not negatively affect soil health and might sustain soil health. The results suggest that effect of different dressing soils incorporated into soils with various levels of heavy metal contamination warrants further study.

4. Conclusions

To restore soil health of contaminated soil, the remediation method should lower the level of contaminants while minimizing disturbance to soil health. Particularly in arable soils, sustaining soil health after remediation is crucial to ensure sustainable and healthy crop production. Soil health assessment in this research was done in steps, including soil property analyses as the total data set (TDS), selection of a minimum data set (MDS), and the use of weighting factors from PCA analysis to develop a holistic soil health index (SHI). Among nineteen indicators in the TDS, five indicators, namely, TN, clay content, dehydrogenase activity, available P content, and soil bacterial CFU, were selected as the MDS. Scores of MDS indicators were significantly correlated with those of TDS, supporting the appropriateness of the soil health assessment protocol adopted in this study. The SHI of the uncontaminated soils, such as RA, AG, and FO soil, was higher than that of CA soil, and SHI values of RA soil fell within ranges for those of AG and FO soils. The SHI of UP soil was lowest among soils used in this study. The results demonstrated that the soil health of the contaminated soil was more dependent upon the soil properties than metal concentration. The application of the combined methods of lime immobilization of metals and soil dressing resulted in the soil health of the remediated contaminated soil being similar to that of the uncontaminated soil. For a sustainable implication of the combined method in sustaining soil health in metal-contaminated arable soil, further research on the effects of crop cultivation under various soil practices and environmental conditions is essential.

Author Contributions

Conceptualization, H.S.K. and J.E.Y.; methodology, J.-H.Y. and K.-R.K.; software, S.S.J.; validation, S.S.J., Y.D.L. and M.B.K.; formal analysis, C.-G.L. and B.-J.P.; investigation, Y.D.L., C.-G.L. and B.-J.P.; writing—original draft preparation, J.-H.Y., S.C.K. and K.-R.K.; writing—review and editing, M.B.K., J.E.Y., Y.-H.P. and H.S.K.; visualization, J.-H.Y.; supervision, H.S.K.; project administration, S.C.K.; funding acquisition, Y.-H.P. All authors have read and agreed to the published version of the manuscript.

Funding

This research was funded by Korea Ministry of the Environment (Grant No. 2020002480005) and the Korea Ministry of Environment, with the strategic EcoSSSoil Project, Korea Environmental Industry and Technology Institute, Korea (Grant No. 2019002820004). In addition, this study was supported by 2021 Research Grant from Kangwon National University (520210036) and was partly supported by Kansas State University Organized Research Fund No. 381041.

Institutional Review Board Statement

Not applicable.

Informed Consent Statement

Not applicable.

Data Availability Statement

Data are available on request from the corresponding author.

Conflicts of Interest

The authors declare no conflicts of interest.

References

  1. Adriano, D.C. Trace Elements in Terrestrial Environments: Biogeochemistry, Bioavailability and Risks of Metals, 2nd ed.; Springer: New York, NY, USA, 2001; pp. 1–796. [Google Scholar]
  2. Srivastava, V.; Sarkar, A.; Singh, S.; Singh, P.; de Araujo, A.S.F.; Singh, R.P. Agroecological responses of heavy metal pollution with special emphasis on soil health and plant performances. Front. Environ. Sci. 2017, 5, 64. [Google Scholar] [CrossRef]
  3. Lee, S.W.; Lee, B.T.; Kim, J.Y.; Kim, K.W.; Lee, J.S. Human risk assessment for heavy metals and As contamination in the abandoned metal mine areas, Korea. Environ. Monit. Assess. 2006, 119, 233–244. [Google Scholar] [CrossRef] [PubMed]
  4. Dhaliwal, S.S.; Singh, J.; Taneja, P.K.; Mandal, A. Remediation techniques for removal of heavy metals from the soil contaminated through different sources: A review. Environ. Sci. Pollut. Res. 2020, 27, 1319–1333. [Google Scholar] [CrossRef] [PubMed]
  5. Kim, Y.H.; Oh, S.J.; Kum, D.; Shin, M.; Kim, D.; Lee, S.S. Efficiency of heavy metal stabilizers in various soils. Korean J. Environ. Agric. 2021, 40, 231–238, (In Korean, with English abstract). [Google Scholar] [CrossRef]
  6. Rasafi, T.E.; Nouri, M.; Haddioui, A. Metals in mine wastes: Environmental pollution and soil remediation approaches—A review. Geos. Eng. 2017, 24, 157–172. [Google Scholar] [CrossRef]
  7. Giannis, A.; Gidarakos, E.; Skouta, A. Transport of cadmium and assessment of phytotoxicity after electrokinetic remediation. J. Environ. Manag. 2008, 86, 535–544. [Google Scholar] [CrossRef] [PubMed]
  8. Gong, Y.; Zhao, D.; Wang, Q. An overview of field-scale studies on remediation of soil contaminated with heavy metals and metalloids: Technical progress over the last decade. Water Res. 2018, 147, 440–460. [Google Scholar] [CrossRef] [PubMed]
  9. Yi, Y.M.; Sung, K. Influence of washing treatment on the qualities of heavy metal-contaminated soil. Ecol. Eng. 2015, 81, 89–92. [Google Scholar] [CrossRef]
  10. Wang, Q.Y.; Zhou, D.M.; Cang, L.; Sun, T.R. Application of bioassays to evaluate a copper contaminated soil before and after a pilot-scale electrokinetic remediation. Environ. Pollut. 2009, 157, 410–416. [Google Scholar] [CrossRef] [PubMed]
  11. Zupanc, V.; Kastelec, D.; Lestan, D.; Grcman, H. Soil physical characteristics after EDTA washing and amendment with inorganic and organic additives. Environ. Pollut. 2014, 186, 56–62. [Google Scholar] [CrossRef] [PubMed]
  12. Kim, K.R.; Kim, J.G.; Park, J.S.; Kim, M.S.; Owens, G.; Youn, G.H.; Lee, J.S. Immobilizer-assisted management of metal-contaminated agricultural soils for safer food production. J. Environ. Manag. 2012, 102, 88–95. [Google Scholar] [CrossRef] [PubMed]
  13. Lwin, C.S.; Seo, B.H.; Kim, H.U.; Owens, G.; Kim, K.R. Application of soil amendments to contaminated soils for heavy metal immobilization and improved soil quality-a critical review. Soil Sci. Plant Nutr. 2018, 64, 156–167. [Google Scholar] [CrossRef]
  14. Kim, H.S.; Kim, K.R.; Kim, H.J.; Yoon, J.H.; Yang, J.E.; Ok, Y.S.; Owens, G.; Kim, K.H. Effect of biochar on heavy metal immobilization and uptake by lettuce (Lactuca sativa L.) in agricultural soil. Environ. Earth Sci. 2015; 74, 1249–1259. [Google Scholar]
  15. Awa, S.H.; Hadibarata, T. Removal of heavy metals in contaminated soil by phytoremediation mechanism: A review. Water Air Soil Pollut. 2020, 231, 47. [Google Scholar] [CrossRef]
  16. Liu, L.; Li, W.; Song, W.; Guo, M. Remediation techniques for heavy metal-contaminated soils: Principles and applicability. Sci. Total Environ. 2018, 633, 206–219. [Google Scholar] [CrossRef] [PubMed]
  17. RoyChowdhury, A.; Datta, R.; Sarkar, D. Heavy metal pollution and remediation. In Green Chemistry; Török, B., Dransfield, T., Eds.; Elsevier: Amsterdam, The Netherlands, 2018; Chapter 3.10; pp. 359–373. [Google Scholar] [CrossRef]
  18. Yun, S.W.; Park, C.G.; Jeon, J.H.; Darnault, C.J.G.; Baveye, P.C.; Yu, C. Dissolution behavior of As and Cd in submerged paddy soil after treatment with stabilizing agents. Geoderma 2016, 270, 10–20. [Google Scholar] [CrossRef]
  19. Ma, Y.; Dong, B.; He, X.; Shi, Y.; Xu, M.; He, X.; Du, X.; Li, F. Quicklime-induced changes of soil properties: Implications for enhanced remediation of volatile chlorinated hydrocarbon contaminated soils via mechanical soil aeration. Chemosphere 2017, 173, 435–443. [Google Scholar] [CrossRef] [PubMed]
  20. Kim, S.; Choi, J.; Jeong, S.W. Changes in the health of metal-contaminated soil before and after stabilization and solidification. Environ. Pollut. 2023, 331, 121929. [Google Scholar] [CrossRef] [PubMed]
  21. Yuvaraj, A.; Thangaraj, R.; Karmegam, N.; Ravindran, B.; Chang, S.W.; Awasthi, M.K.; Kannan, S. Activation of biochar through exoenzymes prompted by earthworms for vermibiochar production: A viable resource recovery option for heavy metal contaminated soils and water. Chemosphere 2021, 278, 130458. [Google Scholar] [CrossRef] [PubMed]
  22. Bolan, N.S.; Adriano, D.C.; Mani, P.A.; Duraisamy, A. Immobilization and phytoavailability of cadmium in variable charge soils. II. Effect of lime addition. Plant Soil 2003, 251, 187–198. [Google Scholar] [CrossRef]
  23. EPA. The Use of Soil Amendments for Remediation, Revitalization, and Reuse (EPA 542-R-07-013); Environmental Protection Agency: Washington, DC, USA, 2007. [Google Scholar]
  24. Kumar, M.; Bolan, N.S.; Hoang, S.A.; Sawarkar, A.D.; Jasemizad, T.; Gao, B.; Keerthanan, S.; Padhye, L.P.; Singh, L.; Kumar, S.; et al. Remediation of soils and sediments polluted with polycyclic aromatic hydrocarbons: To immobilize, mobilize, or degrade? J. Hazard. Mater. 2021, 420, 126534. [Google Scholar] [CrossRef] [PubMed]
  25. Kwak, J.I.; Nam, S.H.; Kim, S.W.; Bajagain, R.; Jeong, S.W.; An, Y.J. Changes in soil properties after remediation influence the performance and survival of soil algae and earthworm. Ecotoxicol. Environ. Saf. 2019, 174, 189–196. [Google Scholar] [CrossRef] [PubMed]
  26. Lee, S.H.; Lee, J.H.; Jung, W.C.; Park, M.; Kim, M.S.; Lee, S.J.; Park, H. Changes in soil health with remediation of petroleum hydrocarbon contaminated soils using two different remediation technologies. Sustainability 2020, 12, 10078. [Google Scholar] [CrossRef]
  27. Lee, S.H.; Kim, S.O.; Lee, S.W.; Kim, M.S.; Park, H. Application of soil washing and thermal desorption for sustainable remediation and reuse of remediated soil. Sustainability 2021, 13, 12523. [Google Scholar] [CrossRef]
  28. Honeycutt, C.W.; Morgan, C.L.S.; Elias, P.; Doane, M.; Mesko, J.; Myers, R.; Odom, L.; Moebius-Clune, B.; Nichols, R. Soil health: Model programs in the USA. Front. Agric. Sci. Eng. 2020, 7, 356–361. [Google Scholar] [CrossRef]
  29. Lehmann, J.; Bossio, D.A.; Kögel-Knabner, I.; Rillig, M.C. The concept and future prospects of soil health. Nat. Rev. Earth Environ. 2020, 1, 544–553. [Google Scholar] [CrossRef] [PubMed]
  30. Xue, R.; Wang, C.; Liu, M.; Zhang, D.; Li, K.; Li, N. A new method for soil health assessment based on analytic hierarchy process and meta-analysis. Sci. Total Environ. 2019, 650, 2771–2777. [Google Scholar] [CrossRef] [PubMed]
  31. Buzzard, V.; Gil-Loaiza, J.; Grachet, N.G.; Talkington, H.; Youngerman, C.; Tfaily, M.M.; Meredith, L.K. Green infrastructure influences soil health: Biological divergence one year after installation. Sci. Total Environ. 2021, 801, 149644. [Google Scholar] [CrossRef] [PubMed]
  32. Karlen, D.L.; Ditzler, C.A.; Andrews, S.S. Soil quality: Why and how? Geoderma 2003, 114, 145–156. [Google Scholar] [CrossRef]
  33. Williams, H.; Colombi, T.; Keller, T. The influence of soil management on soil health: An on-farm study in southern Sweden. Geoderma 2020, 360, 114010. [Google Scholar] [CrossRef]
  34. Wulanningtyas, H.S.; Gong, Y.; Li, P.; Sakagami, N.; Nishiwaki, J.; Komatsuzaki, M. A cover crop and no-tillage system for enhancing soil health by increasing soil organic matter in soybean cultivation. Soil Tillage Res. 2021, 205, 104749. [Google Scholar] [CrossRef]
  35. Andrews, S.S.; Mitchell, J.P.; Mancinelli, R.; Karlen, D.L.; Hartz, T.K.; Horwath, W.R.; Pettygrove, G.S.; Scow, K.M.; Munk, D.S. On-farm assessment of soil quality in California’s Central Valley. Agron. J. 2001, 94, 12–23. [Google Scholar]
  36. Rinot, O.; Levy, G.J.; Steinberger, Y.; Svoray, T.; Eshel, G. Soil health assessment: A critical review of current methodologies and a proposed new approach. Sci. Total Environ. 2019, 648, 1484–1491. [Google Scholar] [CrossRef] [PubMed]
  37. Sintim, H.Y.; Bandopadhyay, S.; English, M.E.; Bary, A.I.; DeBruyn, J.M.; Schaeffer, S.M.; Miles, C.A.; Reganold, J.P.; Flury, M. Impacts of biodegradable plastic mulches on soil health. Agric. Ecosyst. Environ. 2019, 273, 36–49. [Google Scholar] [CrossRef]
  38. Bünemann, E.K.; Bongiorno, G.; Bai, Z.; Creamer, R.E.; De Deyn, G.; de Goede, R.; Fleskens, V.; Geissen, T.W.; Kuyper, P.; Mäder, M.; et al. Soil quality—A critical review. Soil Biol. Biochem. 2018, 120, 105–125. [Google Scholar] [CrossRef]
  39. Ministry of Environment. Soil Environment Conservation Act; Ministry of Environment: Sejong, Republic of Korea, 2019. [Google Scholar]
  40. Lee, S.H.; Ji, W.; Yang, H.J.; Kang, S.Y.; Jang, D.M. Reclamation of mine-degraded agricultural soils from metal mining: Lessons from 4 years of monitoring activity in Korea. Environ. Earth Sci. 2017, 76, 720. [Google Scholar] [CrossRef]
  41. NIAST (National Institute of Agricultural Science and Technology). Method of Soil and Plant Analysis; RDA: Suwon, Republic of Korea, 2000. (In Korean) [Google Scholar]
  42. Hong, Y.K.; Yoon, D.H.; Kim, J.W.; Chae, M.J.; Ko, B.K.; Kim, S.C. Ecological risk assessment of heavy metal-contaminated soil using the triad approach. J. Soils Sediments 2021, 21, 2732–2743. [Google Scholar] [CrossRef]
  43. Turan, V. Confident performance of chitosan and pistachio shell biochar on reducing Ni bioavailability in soil and plant plus improved the soil enzymatic activities, antioxidant defense system and nutritional quality of lettuce. Ecotoxicol. Environ. Saf. 2019, 183, 109594. [Google Scholar] [CrossRef] [PubMed]
  44. Tabatabai, M.A.; Bremner, J.M. Use of p-nitrophenyl phosphate for assay of soil phosphatase activity. Soil Biol. Biochem. 1969, 1, 301–307. [Google Scholar] [CrossRef]
  45. Tabatabai, M.A.; Bremner, J.M. Arylsulfatase activivty of soil. Soil Sci. Soc. Am. J. 1970, 34, 225–229. [Google Scholar] [CrossRef]
  46. Eivazi, F.; Tabatabai, M. Factors affecting glucosidase and galactosidase activities in soils. Soil Biol. Biochem. 1990, 22, 891–897. [Google Scholar] [CrossRef]
  47. Kandeler, E.; Gerber, H. Short-term assay of soil urease activity using colorimetric determination of ammonium. Biol. Fertil. Soils 1988, 6, 68–72. [Google Scholar] [CrossRef]
  48. Yi, Y.M.; Park, S.; Munster, C.; Kim, G.; Sung, K. Changes in ecological properties of petroleum oil-contaminated soil after low-temperature thermal desorption treatment. Water Air Soil Pollut. 2016, 227, 108. [Google Scholar] [CrossRef]
  49. Kang, S.S.; Roh, A.S.; Choi, S.C.; Kim, Y.S.; Kim, H.J.; Choi, M.T.; Ahn, B.K.; Kim, H.W.; Kim, H.K.; Park, J.H.; et al. Status and Changes in Chemical Properties of Paddy Soil in Korea. Korean J. Soil Sci. Fertil. 2012, 45, 968–972, (In Korean, with English abstract). [Google Scholar] [CrossRef]
  50. Kim, Y.H.; Kong, M.S.; Lee, E.J.; Lee, T.G.; Jung, G.B. Status and Changes in Chemical Properties of Upland Soil from 2001 to 2017 in Korea. Korean J. Environ. Agric. 2019, 38, 213–218, (In Korean, with English Abstract). [Google Scholar] [CrossRef]
  51. NIFoS (National Institute of Forest Science). Evaluation of the Forest Soil Properties Using Plant Response Methodology; National Institute of Forest Science: Seoul, Republic of Korea, 2018. (In Korean) [Google Scholar]
  52. Li, H.; Xu, H.; Zhou, S.; Yu, Y.; Li, H.; Zhou, C.; Chen, Y.; Li, Y.; Wang, M.; Wang, G. Distribution and transformation of lead in rice plants grown in contaminated soil amended with biochar and lime. Ecotoxicol. Environ. Saf. 2018, 165, 589–596. [Google Scholar] [CrossRef] [PubMed]
  53. Aponte, H.; Meli, P.; Butler, B.; Paolini, J.; Matus, F.; Merino, C.; Cornejo, P.; Kuzyakov, Y. Meta-analysis of heavy metal effects on soil enzyme activities. Sci. Total Environ. 2020, 737, 139744. [Google Scholar] [CrossRef] [PubMed]
  54. Pan, J.; Yu, L. Effects of Cd or/and Pb on soil enzyme activities and microbial community structure. Ecol. Eng. 2011, 37, 1889–1894. [Google Scholar] [CrossRef]
  55. Zhao, H.; Wu, L.; Zhu, S.; Sun, H.; Xu, C.; Fu, J.; Ning, T. Sensitivities of physical and chemical attributes of soil quality to different tillage management. Agronomy 2022, 12, 1153. [Google Scholar] [CrossRef]
  56. Tan, X.; Liu, Y.; Yan, K.; Wang, Z.; Lu, G.; He, Y.; He, W. Differences in the response of soil dehydrogenase activity to Cd contamination are determined by the different substrates used for its determination. Chemosphere 2017, 169, 324–332. [Google Scholar] [CrossRef] [PubMed]
  57. Garau, G.; Castaldi, P.; Santona, L.; Deiana, P.; Melis, P. Influence of red mud, zeolite and lime on heavy metal immobilization, culturable heterotrophic microbial populations and enzyme activities in a contaminated soil. Geoderma 2007, 142, 47–57. [Google Scholar] [CrossRef]
  58. Oliveira, A.; Pampulha, M.E. Effects of long-term heavy metal contamination on soil microbial characteristics. J. Biosci. Sci. Bioeng. 2006, 102, 157–161. [Google Scholar] [CrossRef] [PubMed]
  59. Dotaniya, M.L.; Pipalde, J.S. Soil enzymatic activities as influenced by lead and nickel concentrations in a Vertisol of Central India. Bull. Environ. Contam. Toxicol. 2018, 101, 380–385. [Google Scholar] [CrossRef] [PubMed]
  60. Bååth, E.; Arnebrant, K. Growth rate and response of bacterial communities to pH in limed and ash treated forest soils. Soil Biol. Biochem. 1994, 26, 995–1001. [Google Scholar] [CrossRef]
  61. Deng, S.P.; Tabatabai, M.A. Effect of tillage and residue management on enzyme activities in soils: III. Phosphatases and arylsulfatase. Biol. Fertil. Soils 1997, 24, 141–146. [Google Scholar] [CrossRef]
  62. Chang, T.; Feng, G.; Paul, V.; Adeli, A.; Brooks, J.P.; Jenkins, J.N. Soil health assessment for different tillage and cropping systems to determine sustainable management practices in a humid region. Soil Tillage Res. 2023, 233, 105796. [Google Scholar] [CrossRef]
  63. Yu, P.; Liu, S.; Zhang, L.; Li, Q.; Zhou, D. Selecting the minimum data set and quantitative soil quality indexing of alkaline soils under different land uses in northeastern China. Sci. Total Environ. 2018, 616–617, 564–571. [Google Scholar] [CrossRef] [PubMed]
  64. Dengiz, O. Soil quality index for paddy fields based on standard scoring functions and weight allocation method. Arch. Agron. Soil Sci. 2019, 66, 301–315. [Google Scholar] [CrossRef]
  65. Datta, A.; Gujre, N.; Gupta, D.; Agnihorti, R.; Mitra, S. Application of enzymes as a diagnostic tool for soils as affected by municipal solid wastes. J. Environ. Manag. 2021, 286, 112169. [Google Scholar] [CrossRef] [PubMed]
  66. Dubey, R.K.; Dubey, P.K.; Abhilash, P.C. Sustainable soil amendments for improving the soil quality, yield and nutrient content of Brassica juncea (L.) grown in different agroecological zones of eastern Uttar Pradesh, India. Soil Tillage Res. 2019, 195, 104418. [Google Scholar] [CrossRef]
  67. Vasu, D.; Singh, S.K.; Ray, S.K.; Duraisami, V.P.; Tiwary, P.; Chandran, P.; Nimkar, A.M.; Anantwar, S.G. Soil quality index (SQI) as a tool to evaluate crop productivity in semi-arid Deccan plateau, India. Geoderma 2016, 282, 70–79. [Google Scholar] [CrossRef]
  68. Juhos, K.; Czigány, S.; Madarász, B.; Ladányi, M. Interpretation of soil quality indicators for land suitability assessment—A multivariate approach for Central European arable soils. Ecol. Indic. 2019, 99, 261–272. [Google Scholar] [CrossRef]
  69. Lim, J.Y.; Bhuiyan, M.S.I.; Lee, S.B.; Lee, J.G.; Kim, P.J. Agricultural nitrogen and phosphorus balances of Korea and Japan: Highest nutrient surplus among OECD member countries. Environ. Pollut. 2021, 286, 117353. [Google Scholar] [CrossRef] [PubMed]
  70. Wu, C.; Liu, G.; Huang, C.; Liu, Q. Soil quality assessment in Yellow River Delta: Establishing a minimum data set and fuzzy logic model. Geoderma 2019, 334, 82–89. [Google Scholar] [CrossRef]
  71. Chae, Y.; Cui, R.; Kim, S.W.; An, G.; Jeong, S.W.; An, Y.J. Exoenzyme activity in contaminated soils before and after soil washing: ß-glucosidase activity as a biological indicator of soil health. Ecotoxicol. Environ. Saf. 2017, 135, 368–374. [Google Scholar] [CrossRef] [PubMed]
  72. Wu, J.; Zhou, Q.; Huang, R.; Wu, K.; Li, Z. Contrasting impacts of mobilisation and immobilisation amendments on soil health and heavy metal transfer to food chain. Ecotoxicol. Environ. Saf. 2021, 209, 111836. [Google Scholar] [CrossRef] [PubMed]
Figure 1. Means and standard deviations of heavy metal concentrations in soil samples collected from contaminated arable land (CA), remediated arable land (RA), and uncontaminated reference sites, which included forests (FO), agricultural upland (AG), and urban parks (UP). The threshold of danger level (TDL) and corrective action level (CAL) of each metal listed by the Korea Soil Environment Conservation Act are included. Different letters above bars indicate significant differences at p < 0.05 among different soil types.
Sustainability 16 03227 g001
Figure 2. The non-linear scoring function curves of the selected five soil health indicators: total nitrogen (TN), clay content, dehydrogenase activity, available P, and bacterial CFU. Lines and circles are fitted model curves and measured soil data, respectively.
Sustainability 16 03227 g002
Figure 3. Correlation of soil health indices between those estimated from the minimum data set (MDS) and total data set (TDS).
Sustainability 16 03227 g003
Figure 4. Changes in score ratios of the minimum data set (MDS) indicators of four uncontaminated soils, including remediated arable land (RA), uncontaminated forests (FO), agricultural upland (AG), and urban parks (UP); score ratios in uncontaminated soil samples.
Sustainability 16 03227 g004
Figure 5. (a) Scores of the overall soil health indices and relative contributions of five minimum data set indicators to soil health for five soil types (refer to Figure 1). The same letter above a bar indicates a non-significant difference (p > 0.05). (b) Changes of the soil health indices of remediated arable land (RA), agricultural upland (AG), forests (FO), and urban parks (UP), when their indices were divided by those of the contaminated soil (CA).
Sustainability 16 03227 g005
Table 1. Physical, chemical, and biological properties of soil samples collected from contaminated arable land (CA), remediated arable land (RA), uncontaminated agricultural upland (AG), uncontaminated forests (FO), and uncontaminated urban parks (UP). The same letters in a row represent a non-significant difference at p < 0.05.
PropertiesSoil Samples
CARAAGFOUP
pH6.3 ± 0.8 a6.6 ± 0.8 a6.2 ± 0.9 a5.6 ± 1.0 b6.2 ± 1.3 a
EC (dS m−1)0.5 ± 0.2 a0.6 ± 0.9 a0.5 ± 0.3 a0.5 ± 0.3 a0.4 ± 0.4 a
CEC (cmolc kg−1)18.3 ± 3.5 a12.2 ± 3.6 b11.9 ± 4.6 b13.3 ± 5.3 b9.0 ± 3.9 c
OM (g kg−1)44.0 ± 33.4 ab19.7 ± 15.0 c35.8 ± 17.3 b46.8 ± 29.6 a25.3 ± 13.8 c
Available P (mg kg−1)2062.5 ± 779.4 a267.1 ± 316.2 c487.6 ± 636.2 b104.3 ± 159.5 c96.2 ± 117.9 c
TN (%)0.14 ± 0.03 a0.11 ± 0.09 ab0.14 ± 0.13 a0.14 ± 0.12 a0.07 ± 0.07 b
BD (g cm−3)1.34 ± 0.09 b1.30 ± 0.20 b1.35 ± 0.16 b1.23 ± 0.23 c1.46 ± 0.17 a
Porosity (%)49.27 ± 3.3 b50.8 ± 7.4 ab49.3 ± 6.2 b53.5 ± 8.7 a45.2 ± 6.6 c
Water-stable aggregate (%)33.0 ± 5.6 b22.7 ± 13.4 c40.3 ± 20.6 b55.2 ± 22.6 a42.4 ± 22.0 b
Soil respiration (CO2 mg−1 kg−1 day−1)110.2 ± 58.5 a45.5 ± 26.9 c56.1 ± 31.4 bc71.0 ± 54.4 b57.2 ± 38.7 bc
Arylsulfatase (μmol PNP h−1 g−1)7.3 ± 3.9 a12.7 ± 22.5 a8.6 ± 9.0 a14.1 ± 17.9 a8.8 ± 11.9 a
Dehydrogenase (μg TPF g−1)10.6 ± 6.8 b11.2 ± 22.3 b23.3 ± 35.6 ab36.9 ± 50.0 a30.9 ± 38.6 ab
β-Glucosidase (μmol PNP h−1 g−1)2.7 ± 1.2 ab2.1 ± 2.4 b2.9 ± 1.9 ab3.5 ± 2.9 a2.3 ± 2.7 ab
Phosphatase (μmol PNP h−1 g−1)9.4 ± 4.0 c10.3 ± 6.3 c14.2 ± 7.5 b18.7 ± 7.6 a11.5 ± 7.4 bc
Urease (μg N g−1 2 h−1)81.8 ± 56.3 b78.2 ± 91.4 b121.4 ± 115.0 ab138.2 ± 96.3 a91.9 ± 106.7 ab
Bacterial colony-forming units (CFU × 106 g−1)1.9 ± 0.5 b23.2 ± 50.2 a9.9 ± 21.2 ab12.5 ± 28.2 ab18.9 ± 33.1 ab
Clay (%)18.2 ± 4.9 b25.3 ± 12.7 a16.1 ± 8.1 bc17.2 ± 7.2 b12.7 ± 5.4 c
Silt and sand contents are not included in this table. CEC: Cation exchange capacity; OM: Organic matter; TN: Total nitrogen; BD: Bulk density; PNP: p-nitrophenol; TPF: Triphenylformazan.
Table 2. Results of principal component analysis (PCA) of soil properties for screening five principal components (PC).
Principal ComponentPC 1PC 2PC 3PC 4PC 5
Eigenvalue4.5561.7811.6121.3021.083
Percent26.79810.4789.4797.6566.373
Cumulative percent26.79837.27646.75654.41260.785
Eigenvectors
pH−0.1060.4240.4850.1990.394
EC0.3070.2150.0080.207−0.072
CEC 0.5400.4450.2270.1760.097
OM0.696−0.223−0.1000.3280.091
Available P0.2020.269−0.2650.7000.053
TN0.7020.005−0.0230.295−0.001
BD−0.692−0.2820.4890.305−0.164
Porosity0.6970.275−0.485−0.3000.169
Water-stable aggregate0.346−0.635−0.221−0.0100.267
Soil respiration0.639−0.0730.3500.1800.018
Arylsulfatase0.5470.0560.497−0.2320.112
Dehydrogenase0.426−0.2780.551−0.207−0.071
β-Glucosidase0.5590.0010.068−0.143−0.167
Phosphatase0.659−0.262−0.082−0.098−0.127
Urease0.625−0.1490.177−0.070−0.194
Bacterial colony-forming units−0.1280.0470.074−0.2490.753
Clay0.1060.7060.034−0.308−0.331
CEC: Cation exchange capacity; OM: Organic matter; TN: Total nitrogen; BD: Bulk density.
Table 3. Correlation matrix among the highly weighted variables with high factor loading from the principal component analysis.
PC1 VariablesTNOMBDPorositySRPHA
Total nitrogen (TN)1-----
Organic matter (OM)0.516 **1----
Bulk density (BD)−0.364 **−0.345 **1---
Porosity0.368 **0.351 **−0.996 **1--
Soil respiration (SR)0.405 **0.436 **−0.234 **0.242 **1-
Phosphatase (PHA)0.416 **0.489 **−0.355 **0.362 **0.342 **1
PC2 VariablesClayWSA
Clay1-
Water-stable aggregate (WSA)−0.358 **1
PC3 VariablesDHAARS
Dehydrogenase (DHA)1-
Arylsulfatase (ARS)0.424 **1
** p < 0.01.
Table 4. Soil health indices of the minimum data sets and other chemical indicators for remediated soil (RA) and contaminated soil (CA) when soil health indicators were classified into groups based on their levels.
Soil Health Indicators and GroupingSoil Health Index (SHI)Δ(SHI) Based on CA (%)
RACA
MDS
indicator
TN § (%)>0.15 0.6440.52223.4
<0.150.4230.451−6.2
Clay (%)>240.4760.4740.3
12~240.5160.4856.5
<120.3820.406−5.9
Dehydrogenase
(μg TPF g−1)
>150.5890.51015.5
<150.4530.457−1.0
Available P (mg kg−1)>3000.6090.48226.3
50~3000.5500.41931.2
<500.453ND -
Bacterial colony-forming units (CFU × 106 g−1)>1.60.4800.4663.0
<1.60.4730.493−3.9
Other chemical indicatorsOM (g kg−1)>300.5650.48416.7
15~300.5460.48113.5
<150.3950.406−2.8
CEC (cmolc kg−1)>150.5260.49327.7
<150.4660.41213.1
ND: not detectable. Classification levels were based on the national average or high-medium-low levels [49,50,51]. Percentages of SHI ratios of RA soil over CA soil. § TN: Total nitrogen; TPF: Triphenylformazan; OM: Organic matter; CEC: Cation exchange capacity.
Disclaimer/Publisher’s Note: The statements, opinions and data contained in all publications are solely those of the individual author(s) and contributor(s) and not of MDPI and/or the editor(s). MDPI and/or the editor(s) disclaim responsibility for any injury to people or property resulting from any ideas, methods, instructions or products referred to in the content.

