Abstract
This article presents the impact of vehicle traffic intensity and the closure of access roads for wheeled vehicles to selected schools in Warsaw at selected hours of the day on changes in air quality. This study focused primarily on analyses related to the pollutant typical of road traffic, i.e., nitrogen dioxide, but also took into account PM10 and PM2.5 concentrations, which are some of the key factors determining the quality of atmospheric air, the sustainability of human beings, and sustainable development. Some kinds of relationships were found between vehicle traffic intensity and air pollutant concentrations, in particular—nitrogen dioxide. Analyses of the pollutant concentrations in the periods before and after the introduction of restrictions on vehicle traffic on working days indicate that, in the case of two of the schools during the morning traffic rush hours, significantly lower NO2 concentrations were observed in the period after the introduction of road traffic restrictions, compared with the period before they were introduced. NO2 concentrations during the morning peak hours (on working days) after introducing restrictions were more than 30% lower than the concentrations recorded during the same hours in the period before introducing restrictions.
1. Introduction
Air quality is one of the most important challenges currently facing the authorities and citizens of many countries, in terms of the sustainability of human beings and sustainable development. The annual reports of the European Environment Agency, “Air quality in Europe”, indicate that, Poland, for instance, is a leading nation in terms of concentrations in the air of particulate matters (PM) and benzo(a)pyrene (BaP). The report from 2021 [1] indicates that among all European Union member states, Poland has the highest concentrations of very fine dust (the so-called PM2.5 fraction, i.e., an aerosol with an aerodynamic particle equivalent diameter not exceeding 2.5 μm) and the highest concentrations of polycyclic aromatic hydrocarbons benzo(a)pyrene, and in the case of PM10, the third highest concentration of this pollutant is recorded in Poland, after Bulgaria and Greece. In the case of pollutants coming from road traffic, in particular nitrogen dioxide (NO2), Poland ranks 19th among EU countries in terms of the highest concentrations of this pollutant. It should also be noted that the constantly growing number of vehicles in many countries contributes to increasing NO2 emissions, which has been observed for many years [2].
The main sources of air pollution emissions in many countries include the combustion of fuels in the so-called municipal and domestic sectors (mainly in households) and fuel combustion in the transport sector (primarily in road transport). The greatest issue related to road transport concerns primarily large urban centers and areas located close to busy communication routes. Recent decades have brought an extremely dynamic increase in the role of transport in almost every area of social and economic life. Road transport has particularly significant tasks in this respect. Working on the scale of the European Union, road transport, compared with all other types of transport, currently (according to data from 2020) contributes 53% of freight transport and almost 81% of passenger transport (in both cases, these shares are the highest since at least 1995) [3]. In addition to the undeniably positive role that transport has played and continues to play in supporting the world’s economic development and sustainable development, one cannot ignore the fact that it is also a source of a number of problems and nuisances, both for the natural environment and society [4,5,6,7]. Harrison et al. [8] presents the results of an analysis of approximately 11 million real-world data points to estimate the impact of road traffic on concentrations in several large cities. The results confirm that road traffic remains the dominant source of nitrogen dioxide and a significant source of fine particulate matter in many European cities.
The emission of air pollutants and noise emission are the two most important threats resulting from road transport activities. In many large cities, road transport is a significant and sometimes dominant source of pollutant emissions, which is an important cause of poor air quality. Additionally, taking into account the constantly growing number of city inhabitants, this problem is becoming one of the key social problems. The increasing motorization rate should also be taken into account. In Poland, for example, this amounts (according to data from 2020) to 664 passenger cars per 1000 inhabitants, which is the highest among Eastern European countries and noticeably exceeds the average for the European Union (560 passenger cars per 1000 inhabitants). Air pollution is among the most important risk factors determining premature deaths and living with disabilities. According to the “Air quality in Europe” report [1], it is estimated that almost 42,000 people die prematurely every year due to poor air quality (according to data for 2019), compared with over 360,000 premature deaths in the entire European Union. Due to the proven negative impact of pollutants on the environment and human health, many countries have introduced or are introducing legal regulations specifying permissible concentrations (or goals to be achieved within a specific time) regarding selected atmospheric air pollutants. In the European Union, regulations on air quality are contained in two directives [9,10].
To improve air quality, actions are being implemented, such as promoting the use of public transport, building bypasses, improving traffic, regulating vehicle speeds on streets, and creating low emission zones (LEZ). LEZs are areas to which access by road vehicles is restricted, usually due to their emission class. There are over 230 LEZs in Europe [11,12]. Since in urban areas road traffic is one of the important sources of PMs and the main source of NO2 [13,14,15], the implementation of LEZs may be one of the measures to reduce road traffic-related pollution and improve air quality in cities [16]. Many studies have been conducted to assess the effects of LEZ implementation using monitoring data [17,18,19,20,21]. Their results indicate a lower NO2 reduction than PM10 [22], because NO2 emissions in real driving conditions did not significantly improve when comparing Euro 4 to Euro 6 [23,24].
Reducing PM concentrations in the air may involve, for example, preventing their deposition on the roadside by sweeping or washing the road surface. There are not many studies in the literature on the impact of street sweeping on air quality [25,26]. The study presented in ref. [27] showed that, after sweeping, more particles with smaller diameters appear in the air [27]. Kryłów et al. [28] estimated, based on experiments conducted in Krakow, that street sweeping and washing resulted in an average reduction in PM10 and PM2.5 concentrations, which lasted for up to three days, from 17.3% for PM10 and from 15.4% for PM2.5. In ref. [29], it was stated that the intensive street cleaning process may contribute to an increase in the air concentrations of PM10 and, to a lesser degree, PM2.5 for up to 3 h. Sheng-Lun et al. [30] stated that street washing was less effective on the road section without a drainage ditch since the road dust would be resuspended while the road surface was drying and that the most effective operation mode was “sweeping before washing”.
Other ways of reducing pollution from road vehicles included a reduction in the use of studded tires and the use of salt or sand for traction control [31]. In turn, ref. [32] stated that these particles can be deposited, filtered, and significantly reduced if there is a vegetative surface nearby, thus eliminating some of these particles and reducing their harmful trace. Preliminary results collected by the authors suggested that the amount of tree cover does result in some degree of air quality improvement and could be used to develop national clean air strategies to reduce pollutant emissions. The positive impact of parks on reducing PM10 and PM2.5 concentrations was also indicated in ref. [33]. In ref. [34], the authors proposed a method that when NO2 levels exceeded a certain threshold on defined streets, a strategy of changing the cycle time of the traffic lights was triggered, which reduced the traffic congestion by turning the traffic lights green. Another form of minimizing the impact of road transport on air quality is the introduction of its reorganization, resulting in decreased pollutant emissions to the air. In ref. [35], the consequences of narrowing the street cross-section were analyzed by eliminating one lane, reducing the maximum speed by 20 km/h, and allowing only passenger and delivery vehicles on streets meeting at least the Euro 4 standard [36] or higher.
Opportunities to examine the impact of road traffic on air quality come alongside various types of social or political events that change or reduce its intensity—for example, in [37], the Democratic National Convention in the USA resulted in short-term reductions in traffic volume on a major highway, with some evidence for relative increases in the use of auxiliary roads near exits of this highway. A great “occasion” was also the COVID-19 pandemic, during which road traffic intensity decreased significantly in many cities. In one study [38], the changes in air quality as a result of traffic restrictions during COVID-19 in Spain and the United States were analyzed. It appears that the NO2 concentration decreased by approx. 50%, while O3 concentration increased by approx. 40%. Analyses for Italy [39] demonstrated that as a result of reduced vehicle traffic, the NO2 concentration decreased, but the O3 concentration increased. Similar analyses for Poland can be found in ref. [40].
Another aspect related to changes in moving around a city is the reduction of street traffic (or even closing certain streets) in order to increase the safety of pedestrians, especially children. An example of this is the “School Streets” campaign carried out in London [41,42]. The potential benefits of introducing this type of solution can be found in ref. [43]. The issues of parents’ perception of road safety and, therefore, the choice of an adequate method of getting to schools were analyzed in ref. [44], where the authors examined the relationship between the perception of road traffic risks, getting to school, and the features of the built environment. Meanwhile, a study [45] found that ensuring children can safely walk to and from school can reduce the number of vehicles around school, reduce safety concerns, and will likely increase opportunities for independent mobility in childhood.
The aim of the article is to examine the intensity of wheeled vehicle traffic near schools (in particular, related to bringing children to and from school by car) and the impact of closing access roads for wheeled vehicles to selected schools in Warsaw at selected hours of the day on changes in air quality. Street closures near schools were chosen because it is part of the city authorities’ campaign to encourage primary school students to be more physically active, and thus to discourage parents from bringing their children to and from school by car (and, as a result, also on the sustainable development of society). The second reason for closing the streets was to increase safety for pedestrians. This study focused primarily on analyses related to the pollutant typical of road traffic, i.e., nitrogen dioxide, but also took into account PM10 and PM2.5 concentrations, which are two of the key factors determining the quality of atmospheric air.
2. Materials and Methods
2.1. Location of Measurement Sites
Research on the impact of vehicle traffic (in particular, the closure of roads for vehicles) on the air quality near schools (more precisely, the concentrations of selected air pollutants) was carried out in three locations in Warsaw:
- at the Primary School No. 381 (PS381) at 1 Drzymały Street;
- at the Primary School No. 375 (PS375) at 10 Abrahama Street;
- at the Primary School No. 204 (PS204) at 17/21 Bajkowa Street.
For the locations at PS381 and PS375, measurements were taken from 22 August 2022 to 30 September 2022, and for the locations at PS204—from 16 September 2022 to 15 October 2022.
Measurements of air pollution mass concentrations were divided into three periods (this procedure concerned PS381 and PS375):
- the end of August 2022—when significantly lower traffic intensity in the school area was expected due to the holiday period (in Poland, the school year starts on 1 September);
- the first half of September 2022—when relatively higher traffic intensity was expected due to the beginning of the school year, before introducing changes in the traffic organization at schools;
- second half of September 2022—during the school year, but after introducing changes in traffic organization, i.e., limiting road traffic during the morning rush hour, i.e., 7:30–8:30 a.m. (in Poland, school lessons start at 8:00 a.m.).
In the case of measurements carried out with PS204, the measurements of pollutants’ mass concentrations were made in the second half of September 2022 and in the first half of October 2022—when there was high traffic intensity due to the school year and no changes were planned to be introduced in the traffic organization near school. In addition, vehicle traffic intensity measurements were made on selected days.
The following illustrations show school locations (Figure 1), approximate locations of measuring devices (Figure 2), and photographs of devices installed (Figure 3).
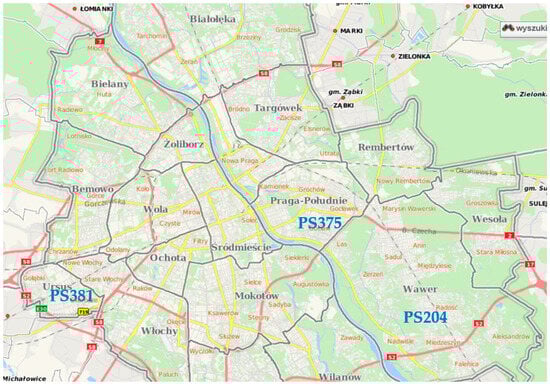
Figure 1.
Location of schools: PS381, PS375, PS204 (source: https://um.warszawa.pl).
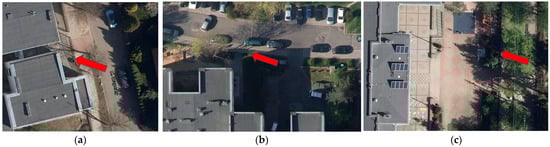
Figure 2.
Location of the measuring device (marked with red arrows) at: (a) PS381, (b) PS375, (c) PS204.
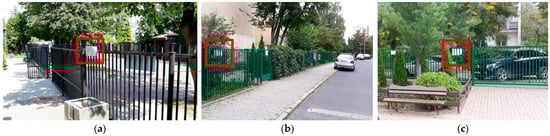
Figure 3.
Measuring devices (marked with red rectangles) at: (a) PS381, (b) PS375, (c) PS204.
The PS381 school was located at 1 Drzymały Street in the southwestern part of Warsaw. The area is dominated by low single-family buildings with lots of greenery. The nearest communication routes with intense traffic are Aleje Jerozolimskie (approx. 650 m in a straight line) and the S2 expressway (approx. 800 m in a straight line). The street at the main entrance to the school, where the measuring device was installed, is two-way. It serves mainly as access to the school and to a gated community located in the proximity of the school.
PS375 was located at 10 Abrahama Street in the eastern part of the city. The area is dominated by multi-family buildings (in the form of multi-story apartment blocks). The nearest communication route with quite intense traffic, including public transport traffic, is Abrahama Street (approx. 30 m in a straight line). On the other side of this street from the school, there is a recreation area. The street located at the main entrance to the school, in the place where the measuring device was installed, is in fact “dead-end”, and therefore serves only as an access road to the school and the adjacent kindergarten.
The last school (PS204) was located at 17/21 Bajkowa Street in the south-eastern part of the city. The area is dominated by low single-family buildings with a lot of greenery. The nearest main communication route with heavier traffic, including public transport vehicles, is Patriotów Street (approx. 450 m in a straight line). Bajkowa Street, the main entrance to the school, was the place where the measuring device was installed, and is a through, one-way street, so it is used by both vehicles transporting and picking up children to school, as well as vehicles whose traffic is related to other travel purposes rather than getting to school.
2.2. Measurements of Air Pollution Mass Concentrations and Vehicle Traffic Intensity
For each location, measuring devices were used that continuously measure PM10, PM2.5, and nitrogen dioxide mass concentrations in the air (Figure 3). In order to measure pollutant concentrations, air was taken in by the measuring devices from the bottom (on the underside of the gray boxes shown in Figure 3). This took place at a height above ground level, at which children, especially younger ones, breathe. Raw measurements were taken by the monitoring devices every 10 s, and then 1 min arithmetic averages were determined (the sum of concentrations divided by the number of measurements in a given minute). On the basis of 1 min averages, 15 min arithmetic averages were determined (the sum of concentrations divided by the number of measurements in a given quarter of an hour). Quarters were defined as minute ranges <0, 15), <15, 30), <30, 45), <45, 60) of individual hours. Python was used as the main tool for determining averages, determining correlations, and other mathematical operations.
To measure PMs’ mass concentrations, the measuring devices used optical sensors, the accuracy of which was verified during several years of comparative measurements with measuring instruments used at the reference station. Nitrogen dioxide concentration measurements were performed using new Alphasense sensors purchased especially for this purpose, calibrated by the manufacturer. The use of this type of sensor allowed for continuous measurements. Descriptions of the measuring devices, of used sensors, and the method of verification and improving their accuracy can be found in refs. [46,47,48].
Based on the results of pollutant mass concentration measurements, a comparison was made of the air quality in the considered measurement periods. The analyses took into account daily and weekly concentrations of particular pollutants, with particular emphasis on differences in measurement results between the following:
- Holiday period (i.e., between 22 August 2022 and 31 August 2022);
- The initial period of the school year when car traffic near schools could flow without restrictions (i.e., between 1 September 2022 and 15 September 2022);
- During the school year, specific restrictions on car traffic were introduced at Drzymały and Abrahama streets on working days during the morning peak hours (between 7:30 a.m. and 9:30 a.m.) (i.e., between 16 September 2022 and 30 September 2022).
The analyses focused on PM10, PM2.5, and NO2 concentrations in the air. The analyses were complemented by presenting the relationship between the pollutant mass concentrations and the vehicle traffic intensity, which was measured on selected days during the considered measurement period in the morning and afternoon traffic peaks. The measurements of vehicle traffic intensity were performed on selected days between 7:30 a.m. and 9:30 a.m. and 1:00 p.m. and 3:30 p.m. by the Municipal Roads Authority of the Capital City of Warsaw and made available for the purpose of conducting appropriate analyses. Data on vehicle traffic intensity (exact hours and minutes of vehicle entry) were collected manually by specially delegated persons from the Municipal Roads Authority of the Capital City of Warsaw, who stood at the entrance of the streets leading to schools. The numbers of vehicles were added manually by these people at each quarter of an hour during which the measurements were taken. Quarters were defined as minutes ranges <0, 15), <15, 30), <30, 45), <45, 60) of individual hours. The action of blocking traffic on the streets leading to schools was supported by the City Guard of Warsaw.
3. Results
The volume of vehicle traffic during the morning peak (summed number of entering and leaving vehicles) on selected days at all schools is shown in Figure 4, and in Figure 5—the volume of vehicles during the afternoon traffic peak.
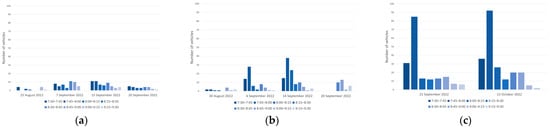
Figure 4.
Number of vehicles traveling to schools in 15 min periods on selected days during the morning traffic peaks at (a) PS381, (b) PS375, (c) PS204.
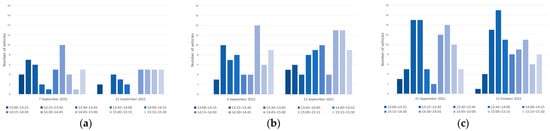
Figure 5.
Number of vehicles traveling to schools in 15 min periods on selected days during the afternoon traffic peaks at (a) PS381, (b) PS375, (c) PS204.
Figure 6 and Figure 7 present traffic intensity and average concentrations of the analyzed air pollutants for the morning (between 7:30 a.m. and 9:30 a.m.) and afternoon (between 1:00 p.m. and 3:30 p.m.) peaks, respectively, for the days on which traffic intensity measurements were carried out.
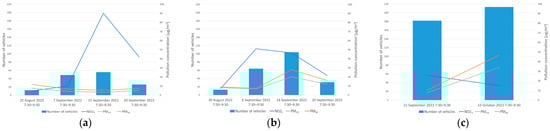
Figure 6.
Average PM10, PM2.5, and NO2 concentrations and number of vehicles in the morning traffic peaks (between 7:30 a.m. and 9:30 a.m.) on the analyzed days at (a) PS381, (b) PS375, (c) PS204.
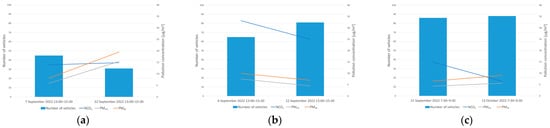
Figure 7.
Average PM10, PM2.5, and NO2 concentrations and number of vehicles in the afternoon traffic peaks (between 1:00 p.m. and 3:30 p.m.) on the analyzed days at (a) PS381, (b) PS375, (c) PS204.
The analysis of the vehicle traffic data indicates that the number of vehicles traveling (entering and leaving) Drzymały Street (PS381) was relatively small. Nevertheless, a clear difference can be noticed between the traffic intensity measured during the two-hour morning traffic peak on 25 August (i.e., during the summer holidays) and the situation when the school year was already in progress, i.e., on 7 and 15 September (when there were no traffic restrictions) and 20 September (on this date, vehicle traffic was prohibited, except for vehicles belonging to local residents). This difference was approximately 4–5 times (depending on the day) and was most likely the result of the appearance of additional vehicles that transported children to and from school. It should be noted, however, that on 20 September (i.e., at the time when restrictions on car traffic were already in force), the total number of vehicles that drove along the street during the morning traffic rush was slightly more than twice as high compared with the holiday period, and at the same time, about two times lower compared with the period of the school year before the restrictions were introduced. Vehicle traffic intensity during the traffic ban, i.e., 7:30–8:30 (not applicable to residents) was 1.5–2.3 times lower on 20 September compared with the same period during the school year without restrictions. During the afternoon peak period, although there were some differences in the distribution of traffic intensity in individual time intervals and, generally, slightly lower total traffic intensity on 22 September compared with the situation on 7 September, they were not as significant as the differences during the morning peak.
Generally, during the analyzed period, the measured concentrations of pollutants in the vicinity of PS381 remained at a relatively low level, although some exceptions were observed. Slightly higher PMs concentrations (compared with other days on which traffic intensity measurements were carried out) were observed in the morning peak on 25 August. The concentrations of NO2, typical of traffic emissions, were the lowest on 25 August compared with all the other measurement periods in which traffic intensity measurements were made. They ranged from approx. 3 μg/m3 to approx. 6 μg/m3 (with an average value for the entire morning traffic peak of 5.0 μg/m3), while on other days, they ranged from a dozen to even clearly over 100 μg/m3. Average values for the morning peak were 36.3 μg/m3 on 7 September and 45.6 μg/m3 on 20 September. On 15 September, NO2 concentrations in some 15 min intervals significantly exceeded 100 μg/m3, reaching 135 μg/m3 (with the average for the entire morning peak being 92.2 μg/m3), which in such short time intervals should be considered as quite high concentrations.
In the case of PS375, the data showed that the number of entering and leaving vehicles was relatively small (although the traffic intensity was slightly higher than in the case of Drzymały Street). However, the nature of the changes was similar, i.e., relatively large differences were visible between the traffic intensity measured during the two-hour morning traffic peak on 30 August (summer vacation) and during the situation when the school year was already in progress, i.e., on 6 and 14 September (when there were no restrictions on vehicle traffic) and on 20 September (when the traffic ban was introduced on part of Abrahama Street near the school). In the hourly interval between 7:30 a.m. and 9:30 a.m. (i.e., during the morning traffic rush), the total vehicle traffic during the holiday period was negligible. On 6 and 14 September, the traffic intensity during the morning peak increased significantly and, depending on the day, was 5 to 8 times higher compared with the number of vehicles moving in this part of Abrahama Street on 30 August. The introduction of a vehicle traffic ban between 7:30 a.m. and 8:30 a.m. resulted, on the one hand, in zero traffic in this hourly interval and a much smaller total number of vehicles throughout the morning rush period (2–3 times lower traffic intensity compared with the period in the school year before the restrictions were introduced); however, it should be noted that, between 8:30 a.m. and 9:30 a.m., vehicle traffic on 20 September was 1.6–2.2 times higher than in the same time period on 6 and 14 September. Although the traffic intensity measurements after the introduction of the traffic ban in the morning peak were carried out once, it can be assumed that this ban could have influenced the change in the behavior of people taking children to PS375 and, as a result, shifted the peak traffic intensity from the period between 7:30 a.m. and 8:30 a.m. to the period between 8:30 a.m. and 9:30 a.m. In this case, some differences in the distribution of traffic intensity in particular time intervals of the afternoon peak are also visible. However, as in the case of the PS381, they are not large. In turn, unlike the situation at Drzymały Street, in the case of Abrahama Street, slightly lower total traffic intensity was observed on 6 September, and slightly higher on 22 September.
During the afternoon, traffic peak measurements were made twice, but no measurements were taken during the holidays. The total number of vehicles entering and leaving the street beside the school in the afternoon traffic peak on 6 September was 65, and on 22 September—81. This situation was different from the situation observed at Drzymały Street. It can therefore be concluded that with such a small number of vehicles, a certain randomness occurred, which caused the traffic intensity on 22 September at Drzymały Street to be lower than in previous days, while the traffic intensity at Abrahama Street was higher.
Generally, during the analyzed period, the measured PM concentrations in the vicinity of PS375 remained at a relatively low level. Slightly higher PM10 and PM2.5 concentrations during the morning traffic rush were recorded mainly on 14 September. The concentrations of NO2 on 30 August were the lowest compared with all other measurement periods in which traffic intensity measurements were made. They ranged from approx. 2 μg/m3 to approx. 12 μg/m3 (with the average value for the entire morning traffic peak at less than 6.5 μg/m3), while on other days, they ranged from a dozen or so up to several dozen μg/m3. The average values for the morning peak on school days were clearly higher and amounted to 52.6 μg/m3 on 6 September and 44.5 μg/m3 on 14 September. In turn, on 20 September, NO2 concentrations decreased again, reaching the average for the entire morning peak period at the level of 21.1 μg/m3. In the afternoon peaks, the NO2 concentration ranged from 10.7 μg/m3 to 48.5 μg/m3 (with average values for the entire peak of 31.7 μg/m3 on 6 September and 24.7 μg/m3 on 22 September), which should be considered values at an acceptable level, well within the limits permitted by law.
Traffic intensity measurements near PS204 were made only during the selected two days. Bajkowa Street is a so-called through street. It is characterized by a significantly higher intensity of vehicle traffic compared with the other streets, Drzymały and Abrahama streets, in which the total number of vehicles moving on these streets in 15 min time intervals during the morning and afternoon traffic peaks ranged from several to a dozen or so vehicles (maximum of less than 40 in one 15 min time interval during the commute to school from Abrahama Street). In the case of Bajkowa Street, the traffic intensity, especially during the morning peak, reached almost 100 vehicles within 15 min. In total, during the 2 h morning peak (7:30–9:30), the traffic volume reached 200 vehicles. In the case of Bajkowa Street, the traffic distribution between 15 min periods was also more even than in the case of the other two locations.
In the case of traffic intensity distributions on both measurement days, no significant differences were observed between the situation on 21 September and 13 October. The total number of vehicles identified in the morning traffic peak on 21 September was 182, and on 13 October it was almost 1.2 times higher but with a very similar distribution between individual 15 min time intervals. Measurements, which were collected on the same days during the afternoon traffic peak, indicate much lower total traffic intensity in the entire hourly interval between 1:00 p.m. and 3:30 p.m., amounting to 86 and 88 vehicles on 21 September and 13 October, respectively.
The concentrations of PM10 and PM2.5 remained at relatively low levels, i.e., several μg/m3, although on 13 October, in the morning peak, significantly higher values were recorded, reaching approximately 50 μg/m3. NO2 concentrations also remained at low levels, not exceeding 30 μg/m3.
4. Discussion
In the following discussion and analysis of the results of air pollution measurements, the global situation relating to pollution on a national scale was also taken into account.
A period with maximum temperatures during the day—over 30 °C—and relatively high PM concentrations occurred in Poland in August, including in the last days of this month. In the beginning of September, circulation and air exchange changed with air flowing mainly from northern directions, which was also accompanied by more frequent convective rainfall. As a result, in quite a large area of Poland, the concentrations of pollutants in the air decreased significantly (as shown in Figure 8), compared with those prevailing in the final days of August during the period of relatively high air temperatures. In the case of nitrogen dioxide, concentrations across the board were more comparable in the analyzed periods (Figure 9).
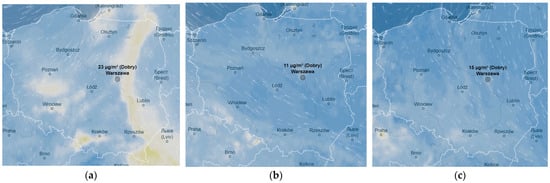
Figure 8.
Approximate distribution of PM10 concentration in Poland at 7:00 a.m. on (a) 25 August, (b) 7 September, (c) 22 September 2022. Source: https://www.ventusky.com.
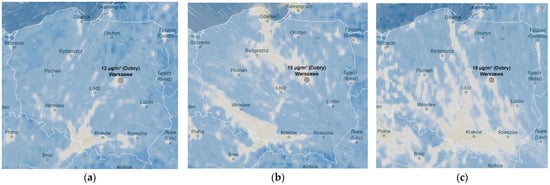
Figure 9.
Approximate distribution of NO2 concentration in Poland at 7:00 a.m. on (a) 25 August, (b) 7 September, (c) 22 September 2022. Source: https://www.ventusky.com.
4.1. Discussion of the Measurement Results Collected at PS381
The analysis of the air quality situation at PS381 indicates that the concentration of pollutants in the analyzed period, both in terms of the nitrogen dioxide characteristic of road traffic and PMs, was subject to some fluctuations, which is visible both on an hourly basis (Figure 10a), and a daily (Figure 10b). The changes in the daily averaged concentrations were more visible in the case of NO2, and the concentrations of both PM fractions were rather stable during the analyzed measurement period. PM10 concentrations during most of the measurement period reached values of several μg/m3 per day, occasionally exceeding 10 μg/m3 and reaching a maximum of almost 16 μg/m3. In the case of PM2.5, the concentrations were also at the level of several μg/m3, reaching a maximum of 13 μg/m3. It should also be emphasized that the maximum concentrations of PMs in most cases did not coincide with traffic peak hours; therefore, it can be assumed that in the case of this location, road traffic connected with access to PS381 did not influence the increased PMs’ concentrations.
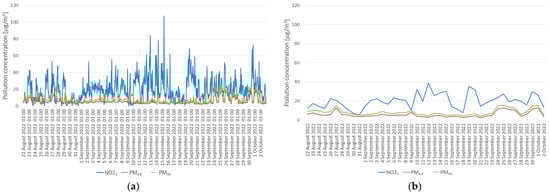
Figure 10.
Average PM10, PM2.5, and NO2 concentrations in the period 22 August till 2 October 2022 at PS381: (a) hourly averages, (b) daily averages.
In the last week of the holidays, the average concentrations of all the analyzed pollutants at the measurement point located at PS381 remained at higher levels than in the following two weeks. Starting from 12 September, concentrations began to increase again, reaching higher values in the following weeks. The observed situation, in particular in the case of NO2, may be a result of the increased traffic intensity after the beginning of the school year. This situation generally concerned the entire road and street network of the city, as well as the neighborhood of PS381.
Figure 11 shows the averaged concentrations of air pollutants for individual hours of the day in the analyzed period during school holidays (a) and during the school year (b). In order to limit the impact of school holidays (when the changes in traffic intensity, related emissions, and therefore concentrations of pollutants in the air are different) on the overall observed phenomenon, these drawings were prepared solely on the basis of data from working days.
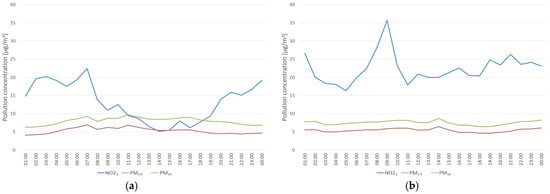
Figure 11.
Average PM10, PM2.5, and NO2 concentrations at PS381 for individual hours on working days in the period: (a) 22 to 31 August 2022 (i.e., holiday period), (b) 1 to 30 September 2022 (i.e., the duration of the school year).
During the holidays, the changes in NO2 concentrations are less noticeable during peak traffic periods and off-peak periods (at least in the place where the pollutant concentrations were measured), although in the morning, the maximum concentration was observed at 7:00 a.m.; however, in the evening and night periods, NO2 concentrations were higher than during the day, i.e., between 9:00 a.m. and 7:00 p.m. During the school year, the typical relationship, i.e., increased NO2 concentrations during traffic rush hours, was more pronounced. Relatively high concentrations are particularly visible between 7:00 a.m. and 10:00 a.m., with the highest value falling about 9:00 a.m. The situation in the afternoon peak is not so clear, although between 2:00 and 4:00 p.m., a gradual increase in NO2 concentration is visible.
Due to the requirements of this analysis, from 16 September, between 7:30 a.m. and 8:30 a.m., Drzymały Street was closed to car traffic on school days. It is true that attention should be paid to the already mentioned slightly higher concentrations of air pollutants (including, in particular, NO2) in the second half of September compared with the first half of the month; however, in the morning hours, this tendency was clearly different and, on average, higher concentrations were recorded, especially between 8:00 a.m. and 10:00 a.m. The largest differences, in favor of the period 16 to 30 September, were observed between 8:00 a.m. and 9:00 a.m., i.e., during the morning traffic rush. Details about the daily averages of pollutant concentrations for individual hours in the period 1 to 15 September and 16 to 30 September are presented in Figure 12.
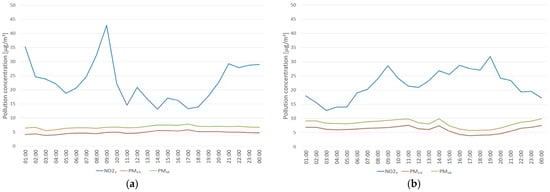
Figure 12.
Average PM10, PM2.5, and NO2 concentrations at PS381 for individual hours on working days in the period: (a) 1 to 15 September 2022 (before the introduction of the traffic ban between 7:30 a.m. and 8:30 a.m.), (b) 16 to 30 September 2022 (after the introduction of the traffic ban from 7:30 a.m. to 8:30 a.m.).
The same scale of the vertical axis has been retained in the charts, thanks to which, a clear flattening of the curve representing the course of NO2 concentrations during the morning traffic rush hours in the period between 16 and 30 September is visible. Although the highest concentration is still recorded in the morning, it is 33% lower than at the same time of the day between 1 September and 15 September (taking into account only measurement results from working days). In the case of PM concentrations, no fundamental and significant differences in the daily changes in concentrations were visible.
Analyzing the changes in average pollutant concentrations in the periods before and after the introduction of vehicle traffic restrictions, it can be seen that NO2 concentrations were slightly higher in the first half of September than in the second part of the month. Moreover, during the morning traffic rush hours, significantly lower NO2 concentrations were observed in the period after the introduction of road traffic restrictions, compared with the period before they were introduced. It can also be noted that despite the street being closed, the background concentration of all pollutants remained high. This could have been influenced by the influx of pollutants from other emission sources in the area. PS381 is located in a city district with a large number of streets, so even closing one of them to vehicle traffic may not result in a significant drop in pollutant concentrations but only in their “smoothing”.
4.2. Discussion of the Measurement Results Collected at PS375
An analysis of the air quality situation at PS375 (Abrahama Street) indicates that the concentration of pollutants in the analyzed period, both in terms of the nitrogen dioxide characteristic of road traffic, as well as PM pollution, was subject to certain fluctuations (Figure 13), which is visible both on (a) an hourly basis and (b) a daily basis. These changes were of a slightly different nature compared with the location at PS381, but, as in that case, the concentrations of PM10 and PM2.5 remained relatively stable and, in most cases, rather low. The daily concentrations of PM2.5 mostly reached values of several μg/m3, reaching maximum concentrations slightly exceeding 20 μg/m3. However, the maximum PM concentrations did not coincide with traffic peak hours; therefore, it can be assumed that in this location, road traffic related to access to PS375 did not influence the increased PM concentrations, although in the case of this location, the measurement results may be influenced by traffic road on Abrahama Street, located parallel to and in close proximity to the access street to the school. In most cases, daily NO2 concentrations did not exceed 30 μg/m3, reaching a maximum value of just over 60 μg/m3.
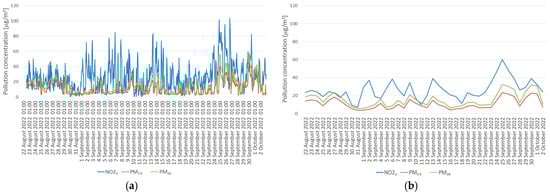
Figure 13.
Average PM10, PM2.5, and NO2 concentrations in the period 22 August to 2 October 2022 at PS375: (a) hourly averages, (b) daily averages.
In the case of the analyzed location, similarly to the location at Drzymały Street, the concentrations of PMs remained at a higher level in the last days of the summer holidays (from 22 to 29 August), compared with the first days of the school year (especially in the first week, i.e., from 1 to 8 September). Similar changes were observed in the case of NO2 concentrations, but here, the differences between the last days of the holidays and the first week of the school year were not significant, and a clear increase in these concentrations was also visible later in the month.
In the last week of the holidays, the average concentrations of the analyzed pollutants at PS375 remained at higher levels than in the following week. In the case of concentrations, they remained at a low level until the last week of September, when they began to increase significantly (this may have been related to the drop in air temperature and the first emissions of pollutants from municipal and domestic sources). A similar situation was observed in the measurements from the referential monitoring station at Bajkowa Street; in this case, the concentrations of PM10 and PM2.5, despite increases in the last week of September compared with the earlier part of the month, still remained lower than in the last days of August. In turn, NO2 concentrations, after a slight decrease in the second week of measurements, began to increase again, reaching higher values in the following weeks. In this case, the observed situation can also be attributed to the increased traffic intensity after the beginning of the school year. This situation concerned both the entire city and the neighborhood of PS375.
The analysis of the averaged concentrations in particular hours of the day in the analyzed period indicated the existence of some significant dependencies, although these were slightly different than in the case of the location at Drzymały Street. In this case, an increase in concentration, especially NO2, was also observed during the morning traffic rush, although the maximum concentration at this time fell at 10:00 a.m. (in the case of Drzymały Street, it was 9:00 a.m.). After this time, there was a visible decrease in concentration (also visible during the afternoon peak period related to traffic at the school) and the concentration increased again from 3:00 p.m. until 9:00 p.m.
Figure 14 shows the averaged concentrations for individual hours of the day in the analyzed period falling during (a) the school holidays and during (b) the school year. In order to limit the impact of school holidays (when the changes in traffic intensity, related emissions, and therefore concentrations of pollutants in the air are different) on the overall observed phenomenon, these drawings were prepared solely on the basis of data from working days.
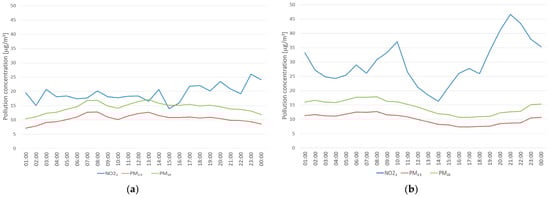
Figure 14.
Average PM10, PM2.5, and NO2 concentrations at PS375 for individual hours on working days in the period: (a) 22 to 31 August 2022 (i.e., holiday period), (b) 1 to 30 September 2022 (i.e., the duration of the school year).
It is worth paying attention to the averaged concentrations for individual hours of the day during the holiday period (i.e., from 22 to 30 August 2022) and during the school year (i.e., from 1 to 30 September 2022). During the holidays in this location, the changes in average NO2 concentrations during the peak and off-peak periods were generally not observed, and the lack of such a dependence is visible to a greater extent than in the case of the results of measurements carried out at PS381. Average concentrations remained at the level of 15–25 μg/m3, with slightly higher values in the afternoon and at night. However, during the school year, the typical relationship is clearly visible, i.e., clearly increased NO2 concentrations during traffic peak hours. Relatively high concentrations were particularly visible between 8:00 a.m. and 11:00 a.m. with the highest value fell at 10:00 a.m. During the afternoon peak associated with picking up children from school, as in the case of PS381, no increased concentrations were observed, although these began to increase from 2:00 p.m., with a slight decrease between 5:00 p.m. and 6:00 p.m.; they then increase until 9:00 p.m.
From 16 September between 7:30 a.m. and 8:30 a.m., Abrahama Street was completely closed to car traffic on school days. Starting from the second week of September, NO2 concentrations began to increase compared with significantly lower concentrations at the turn of August and September, as well as to the concentrations observed in the week between 22 and 26 August. Moreover, in this location, NO2 concentrations in the second half of the month were slightly higher than in the first half of September, although the differences were not significant. However, in the morning hours, this trend was clearly different, and average higher concentrations were recorded in the first half of September, especially between 8:00 a.m. and 10:00 a.m. The largest differences, in favor of the period 16 till 30 September, i.e., after the introduction of the traffic ban, were observed between 8:00 a.m. and 9:00 a.m., i.e., during the morning traffic rush. Details about the daily averages of pollutant concentrations for individual hours in the period 1 to 15 September and 16 to 30 September are presented in Figure 15.
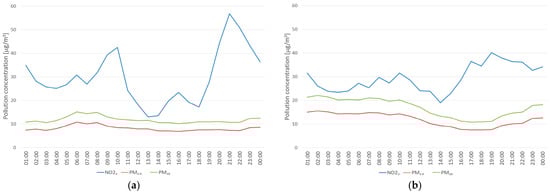
Figure 15.
Average PM10, PM2.5, and NO2 concentrations at PS375 for individual hours on working days in the period: (a) 1 to 15 September 2022 (before the introduction of the traffic ban between 7:30 a.m. and 8:30 a.m.), (b) 16 to 30 September 2022 (after the introduction of the traffic ban from 7:30 a.m. to 8:30 a.m.).
The same scale of the vertical axis has been maintained, owing to which, a clear flattening of the curve representing the course of NO2 concentrations during the morning traffic peak hours in the period between 16 September and 30 September is visible. Although the highest concentration is still recorded in the morning, it is almost 31% lower than at the same time of day in the period between 1 September and 15 September (taking into account only the measurement results from working days). In the case of PM concentrations, there are no fundamental and significant differences in the daily changes in concentrations.
4.3. Discussion of the Measurement Results Collected at PS204
In the case of the location at PS204 (Bajkowa Street), measurements were carried out only during the school year, i.e., from 16 September to 15 October 2022. Therefore, there were no measurements carried out during the holiday period. In the case of this location, there were no restrictions on vehicle traffic during the morning traffic rush, as was the case at PS381 and PS375.
An analysis of the air quality situation at PS204 indicates that pollutant concentrations in the analyzed period were changed, both hourly and daily—Figure 16. In this case, however, these fluctuations were of a clearly different nature compared with both other locations in which measurements were carried out. The changes were more diverse and, unlike the situation in the other locations, they concerned the concentrations of both PM fractions to a greater extent than NO2. At least several days with significantly increased concentrations are visible. Daily concentrations of PM10 were usually at a level of several μg/m3 or more, reaching a maximum of almost 36 μg/m3. Daily concentrations of PM2.5 were also relatively higher than in the other two locations, reaching values of several μg/m3, but reaching higher levels more often than in the other locations. In the case of Bajkowa Street, increases in PM concentrations are also visible during peak traffic periods. They are not as clear as in the case of NO2 but are much more visible than in the case of the locations at Drzymały and Abrahama streets. In the case of small communication routes with very low traffic intensities, the relationship between the number of vehicles and pollutant emissions (and therefore their concentrations in the air) is usually not visible. However, in the case of larger streets, especially city streets, which carry not only local traffic but also traffic related to daily commuting to and returning to places of work and study, the relationship between traffic intensity and PM concentrations at the road is much more clear. This is the case with Bajkowa Street, which is still not a particularly busy street, but the noticeably higher vehicle traffic intensity causes visible changes in PM10 and PM2.5 concentrations as the number of cars driving on this street changes. Daily NO2 concentrations in this location are not significantly different from the other two locations, and are even in lower value ranges, reaching a maximum of 28 μg/m3.
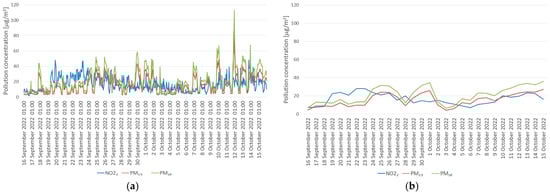
Figure 16.
Average PM10, PM2.5, and NO2 concentrations in the period from 16 September to 15 October 2022 at PS204: (a) hourly averages, (b) daily averages.
In individual weeks of measurements (on working days), differences in concentrations are also visible, with relatively lower concentrations of all analyzed pollutants in the first and third week of measurements, and higher concentrations in the second and fourth week. As mentioned earlier, the nature of the changes in the average concentrations on a daily basis indicates the existence of a relationship between concentrations and road traffic intensity, while the changes in the average concentrations on a weekly basis is probably a reflection of the meteorological situation.
By analyzing the averaged concentrations in each hour of the day in the analyzed period, it is also possible to observe certain important dependencies, i.e., relatively high concentrations of all pollutants at night, their decrease (especially PM10 and PM2.5) in the early morning hours (until 5:00 a.m.), and then their increasing concentrations, especially visible in the case of NO2 during the morning traffic peak, between 7:00 a.m. and 8:00 a.m. (but also noticeable in the case of PM concentrations). After 9:00 a.m., concentrations begin to decrease until 1:00 p.m., remaining at a similar level until 6:00 p.m., after which, they start to increase again (except for NO2, whose concentrations start to increase from 2:00 p.m.). Figure 17 shows the average concentrations for individual hours of the day on all working days of the analyzed period, where higher concentrations can be observed between 7:00 a.m. and 10:00 a.m., and then an increasing trend after 2:00 p.m.
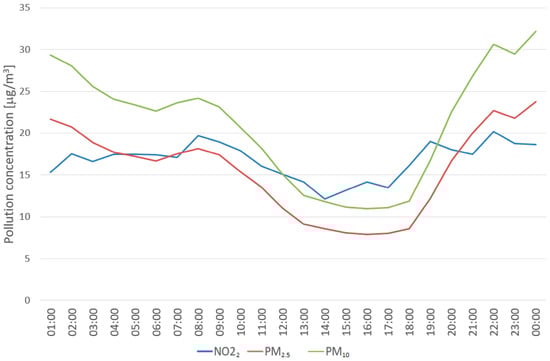
Figure 17.
Average PM10, PM2.5, and NO2 concentrations for individual hours of working days for the period 16 September till 15 October 2022 at PS204.
In the case of measurements carried out at PS204, it was only possible to analyze the existing situation, as no changes were made to the organization of vehicle traffic in this location. Generally, however, the changes in pollutant concentrations indicate the existence of a relationship between changes in traffic intensity and changes in air pollutant concentrations.
Conducting this type of research, in addition to the participation of scientists, also required the involvement of the city authorities. And in this case, there was a strong commitment. Warsaw creates and supports a number of activities aimed at sustainable development and the health and well-being of the city’s inhabitants. In this case, the ability to measure pollutant concentrations and determine whether closing access roads has an impact on improving air quality resulted from the city’s campaign to improve road traffic safety in the area of primary schools. The action was similar to the “School Streets” campaign carried out in London [41]. This study showed, first of all, the scale of vehicle traffic, mainly transporting children to and from schools. To a lesser extent, it was possible to assess the extent to which this influences the improvement of air quality. In addition to local sources, which in this case were vehicles, the air quality was also influenced by the global situation throughout the city (and even outside it). For example, in the last days of August, with the inflow of air from the east, the air masses were characterized by much higher concentrations of PMs and conditions were created for generally higher concentrations of pollutants than in the first half of September. Similarly, in the second half of September, meteorological conditions (lower average wind speed, prevailing circulation from the west and south) favored increasing concentrations of PM pollution, in contrast to the situation that occurred in the first half of the month (higher average wind speed, gusts exceeding even 10 m/s, and air inflow from the north).
In order to clearly draw any conclusions, multiple measurements are needed, with closed road traffic, in similar meteorological conditions, and those related to the macro-scale level of air pollution. However, the research conducted was of a pilot nature, and the city is planning to introduce traffic bans permanently and to extend this action to other schools.
5. Conclusions
Based on the measurements of air pollutant concentrations (nitrogen dioxide, PM10, and PM2.5) and the measurements of vehicle traffic intensity moving along the considered communication routes, it can be concluded that there are certain relationships between vehicle traffic intensity and air pollutant concentrations. This applies, in particular, to nitrogen dioxide. However, weather conditions may have had a significant impact on these relationships. The sources of pollution should also be remembered. All three locations were located in a relatively large city, so air quality was influenced by local emission sources. It seems that the potential impact of traffic sources on NO2 concentrations could have been similar in all locations (the smallest at PS204). Local emission sources influencing PM concentrations were more diverse. The vicinities of PS381 and PS204 are districts where many houses are heated using fossil fuels, while in PS375 heating is predominantly from the municipal heating network.
The analysis of air pollution concentration from the entire period indicated that higher concentrations were recorded in the morning hours, i.e., 6:00 a.m.–10:00 a.m., and in the afternoon (a period of increasing concentrations extended over time from 2:00 p.m. to 7:00 p.m.), and such a relationship was clearly observed during the current school year. During the holiday period, concentrations, in particular nitrogen dioxide typical of traffic emissions, were lower during the day than at night and generally low during periods typical of traffic peaks.
The collected data allow for the development of a hypothesis indicating the justification for introducing traffic restrictions (including bans) during the morning traffic rush (i.e., between 7:30 a.m. and 8:30 a.m.) at schools. These changes, at least in the locations where measurements were carried out, resulted in a reduction in the concentrations of air pollutants characteristic of road traffic (i.e., nitrogen dioxide concentrations).
Analyses of the average pollutant concentrations in the periods before and after the introduction of restrictions on vehicle traffic on working days from 7:30 a.m. to 8:30 a.m. indicate that, in the case of Drzymały Street, NO2 concentrations remained stable in the first half of September and were at slightly higher levels than in the second part of the month. Moreover, during the morning traffic rush hours, significantly lower NO2 concentrations were observed in the period after the introduction of road traffic restrictions, compared with the period before they were introduced. The NO2 concentration during the morning peak hours (on working days) in the second half of September was 33% lower than the concentration recorded during the same hours in the first half of the month. In turn, in the case of Abrahama Street, the situation was slightly different, i.e., the concentrations of pollutants in the second half of September were higher compared with the situation observed in the first half of the month (this applies to both NO2 and both PMs fractions). Nevertheless, during the morning peak hours, the concentrations, of nitrogen dioxide (characteristic of road traffic) in particular, turned out to be significantly lower after the introduction of restrictions, and in the second half of September, they were 31% lower than the concentration recorded in the same hours in the first half of the month.
Author Contributions
Conceptualization, A.B. and M.R.; methodology, A.B. and M.R.; validation, A.B. and M.R.; formal analysis, A.B.; investigation, A.B. and M.R.; resources, M.R.; data curation, M.R.; writing—original draft preparation, A.B.; writing—review and editing, A.B. and M.R.; visualization, A.B. and M.R.; supervision, A.B.; project administration, A.B.; funding acquisition, A.B. All authors have read and agreed to the published version of the manuscript.
Funding
The measurements used in the above article were carried out on behalf of and financed by the Municipal Roads Authority of the Capital City of Warsaw (Agreement No.: ZDM/UM/DSK/12/2022 of 22 August 2022).
Institutional Review Board Statement
Not applicable.
Informed Consent Statement
Not applicable.
Data Availability Statement
Dataset available on request from the authors.
Conflicts of Interest
The authors declare no conflict of interest.
References
- European Environment Agency. European Environment Agency Report. In Air Quality in Europe—2021 Report; No. 15/2021; European Environment Agency: Copenhagen, Denmark, 2021. [Google Scholar]
- European Environment Agency. Air Pollutant Emissions Data Viewer (Gothenburg Protocol, LRTAP Convention) 1990–2020. Available online: https://www.eea.europa.eu/data-and-maps/dashboards/air-pollutant-emissions-data-viewer-4 (accessed on 1 April 2024).
- European Commission, Directorate-General for Mobility and Transport. EU Transport in Figures: Statistical Pocketbook 2022; Publications Office of the European Union: Luxembourg, 2022. [Google Scholar] [CrossRef]
- Amato, F.; Cassee, F.R.; Denier van der Gon, H.A.C.; Gehrig, R.; Gustafsson, M.; Hafner, W.; Harrison, R.M.; Jozwicka, M.; Kelly, F.J.; Moreno, T.; et al. Urban air quality: The challenge of traffic non-exhaust emissions. J. Hazard. Mater. 2014, 275, 31–36. [Google Scholar] [CrossRef] [PubMed]
- Grange, S.K.; Lewis, A.C.; Moller, S.J.; Carslaw, D.C. Lower vehicular primary emissions of NO2 in Europe than assumed in policy projections. Nat. Geosci. 2017, 10, 914–918. [Google Scholar] [CrossRef]
- Pant, P.; Harrison, R.M. Estimation of the contribution of road traffic emissions to particulate matter concentrations from field measurements: A review. Atmos. Environ. 2013, 77, 78–97. [Google Scholar] [CrossRef]
- Yin, J.; Cumberland, S.A.; Harrison, R.M.; Allan, J.; Young, D.; Williams, P.; Coe, H. Receptor modelling of fine particles in southern England using CMB including comparison with AMS-PMF factors. Atmos. Chem. Phys. 2015, 15, 2139–2158. [Google Scholar] [CrossRef]
- Harrison, R.; Van Vu, T.; Jafar, H.; Shi, Z. More mileage in reducing urban air pollution from road traffic. Environ. Int. 2021, 149, 106329. [Google Scholar] [CrossRef] [PubMed]
- Directive 2008/50/EC of the European Parliament and of the Council of 21 May 2008 on ambient air quality and cleaner air for Europe. Off. J. Eur. Union 2008, L152/1.
- Directive 2004/107/EC of the European Parliament and of the Council of 15 December 2004 relating to arsenic, cadmium, mercury, nickel and polycyclic aromatic hydrocarbons in ambient air. Off. J. Eur. Union 2004, L23/3.
- Holman, C.; Harrison, R.; Querol, X. Review of the efficacy of low emission zones to improve urban air quality in European cities. Atmos. Environ. 2015, 111, 161–169. [Google Scholar] [CrossRef]
- Nunes da Silva, F.; Lajas Custódio, R.A.; Martins, H. Low Emission Zone: Lisbon’s Experience. J. Traffic Logist. Eng. 2014, 2, 133–139. [Google Scholar] [CrossRef][Green Version]
- Belis, C.A.; Karagulian, F.; Larsen, B.R.; Hopke, P.K. Critical review and meta-analysis of ambient particulate matter source apportionment using receptor models in Europe. Atmos. Environ. 2013, 69, 94–108. [Google Scholar] [CrossRef]
- Degraeuwe, B.; Thunis, P.; Clappier, A.; Weiss, M.; Lefebvre, W.; Janssen, S.; Vranckx, S. Impact of passenger car NOX emissions on urban NO2 pollution—Scenario analysis for 8 European cities. Atmos. Environ. 2017, 171, 330–337. [Google Scholar] [CrossRef]
- Viana, M.; Kuhlbusch, T.A.J.; Querol, X.; Alastuey, A.; Harrison, R.M.; Hopke, P.K.; Winiwarter, W.; Vallius, M.; Szidat, S.; Prévôt, A.S.H.; et al. Source apportionment of particulate matter in Europe: A review of methods and results. J. Aerosol Sci. 2008, 39, 827–849. [Google Scholar] [CrossRef]
- Sadler. Low Emission Zones in Europe; Final Report for ADEME; Sadler Consultants: Emmendingen, Germany, 2011. [Google Scholar]
- Löschau, G.; Wiedensohler, A.; Birmili, W.; Rasch, F.; Spindler, G.; Müller, K.; Wolf, U.; Hausmann, A.; Böttger, M.; Bastian, S.; et al. Messtechnische Begleitung der Einführung der Umweltzone in der Stadt Leipzig, Teil 4: Immissionssituation von 2010 bis 2014 und Wirkung der Umweltzone; Landesamt für Umwelt, Landwirtschaft und Geologie: Dresden, Germany, 2015. [Google Scholar]
- Malina, C.; Scheffler, F. The impact of Low Emission Zones on particulate matter concentration and public health. Transport. Res. Pol. 2015, 77, 372–385. [Google Scholar]
- Panteliadis, P.; Strak, M.; Hoek, G.; Weijers, E.; van der Zee, S.; Dijkema, M. Implementation of a low emission zone and evaluation of effects on air quality by long-term monitoring. Atmos. Environ. 2014, 86, 113–119. [Google Scholar] [CrossRef]
- Santos, F.M.; Gómez-Losada, Á.; Pires, J.C.M. Impact of the implementation of Lisbon low emission zone on air quality. J. Hazard. Mater. 2019, 365, 632–641. [Google Scholar] [CrossRef] [PubMed]
- Tartakovsky, D.; Kordova-Biezuner, L.; Berlin, E.; Broday, D.M. Air quality impacts of the low emission zone policy in Haifa. Atmos. Environ. 2020, 232, 117472. [Google Scholar] [CrossRef]
- Jiang, W.; Boltze, M.; Groer, S.; Scheuvens, D. Impacts of low emission zones in Germany on air pollution levels. Transp. Res. Proc. 2017, 25, 3370–3382. [Google Scholar] [CrossRef]
- Anenberg, S.C.; Miller, J.; Minjares, R.; Du, L.; Henze, D.K.; Lacey, F.; Malley, C.S.; Emberson, L.; Franco, V.; Klimont, Z.; et al. Impacts and mitigation of excess diesel-related NOx emissions in 11 major vehicle markets. Nature 2017, 545, 467. [Google Scholar] [PubMed]
- Lutz, M. Successes and challenges of twenty years air quality management in Berlin, Germany. In Air Quality in Cities. A Global Challenge; Querol, X., Ed.; Fundación Gas Natural Fenosa: Barcelona, Spain, 2018; Available online: http://www.fundacionnaturgy.org/en/product/libro-la-calidad-del-aire-las-ciudades-reto-mundial/ (accessed on 1 April 2024).
- Amato, F.; Nava, S.; Lucarelli, F.; Querol, X.; Alastuey, A.; Baldasano, J.M.; Pandolfi, M. A comprehensive assessment of PM emissions from paved roads: Realworld Emission Factors and intense street cleaning trials. Sci. Total Environ. 2010, 408, 4309–4318. [Google Scholar] [CrossRef]
- AIRUSE. The Scientific Basis of Street Cleaning Activities as Road Dust Mitigation Measure; LIFE 11 ENV/ES/584; European Commission: Brussels, Belgium, 2013. [Google Scholar]
- Kantamaneni, R.; Adams, G.; Bamesberger, L.; Allwine, E.; Westberg, H.; Lamb, B.; Claiborn, C. The measurement of roadway PM10 emission rates using atmospheric tracer ratio techniques. Atmos. Environ. 1996, 30, 4209–4223. [Google Scholar] [CrossRef]
- Kryłów, M.; Generowicz, A. Impact of Street Sweeping and Washing on the PM10 and PM2.5 Concentrations in Cracow (Poland). Rocz. Ochr. Sr. 2019, 21, 691–711. [Google Scholar]
- Bogacki, M.; Oleniacz, R.; Rzeszutek, M.; Szulecka, A.; Mazur, M. The impact of street cleaning on particulate matter air concentrations: A case study of a street canyon in Krakow (Poland). E3S Web Conf. 2018, 45, 9. [Google Scholar] [CrossRef]
- Lin, S.L.; Deng, Y.; Lin, M.Y.; Huang, S.W. Do the Street Sweeping and Washing Work for Reducing the Near-ground Levels of Fine Particulate Matter and Related Pollutants? Aerosol Air Qual. Res. 2023, 23, 220338. [Google Scholar] [CrossRef]
- Stojiljkovic, A.; Kauhaniemi, M.; Kukkonen, J.; Kupiainen, K.; Karppinen, A.; Denby, B.R.; Kousa, A.; Niemi, J.V.; Ketzel, M. The impact of measures to reduce ambient air PM10 concentrations originating from road dust, evaluated for a street canyon in Helsinki. Atmos. Chem. Phys. 2019, 19, 11199–11212. [Google Scholar] [CrossRef]
- Sierra-Porta, D.; Solano-Correa, Y.T.; Tarazona-Alvarado, M.; de Villavicencio, L.A.N. Linking PM10 and PM2.5 Pollution Concentration through Tree Coverage in Urban Areas. Clean—Soil Air Water 2023, 51, 2200222. [Google Scholar] [CrossRef]
- Qu, H.; Lu, X.; Liu, L.; Ye, Y. Effects of traffic and urban parks on PM10 and PM2.5 mass concentrations. Energy Sources Part A Recovery Util. Environ. Eff. 2023, 45, 5635–5647. [Google Scholar] [CrossRef]
- Munir, S.; Luo, Z.; Dixon, T.; Manla, G.; Francis, D.; Chen, H.; Liu, Y. The impact of smart traffic interventions on roadside air quality employing machine learning approaches. Transp. Res. Part D Transp. Environ. 2022, 110, 103408. [Google Scholar] [CrossRef]
- Bogacki, M.; Oleniacz, R.; Rzeszutek, M.; Bździuch, P.; Szulecka, A.; Gorzelnik, T. Assessing the Impact of Road Trac Reorganization on Air Quality: A Street Canyon Case Study. Atmosphere 2020, 11, 695. [Google Scholar] [CrossRef]
- Directive 98/69/EC of the European Parliament and of the Council of 13 October 1998 Relating to Measures to be Taken against Air Pollution by Emissions from Motor Vehicles and Amending Council Directive 70/220/EEC. Off. J. Eur. Union 1998, L350.
- Levy, J.I.; Baxter, L.K.; Clougherty, J. The air quality impacts of road closures associated with the 2004 Democratic National Convention in Boston. Environ. Health 2006, 5, 16. [Google Scholar] [CrossRef][Green Version]
- Xu, S.; He, H.; Yang, M.; Wu, C.; Zhu, X.; Peng, Z.; Sasaki, Y.; Doi, K.; Shimojo, S. To what extent the traffic restriction policies can improve its air quality? An inspiration from COVID-19. Stoch. Environ. Res. Risk Assess. 2023, 37, 1479–1495. [Google Scholar] [CrossRef] [PubMed]
- Gualtieri, G.; Brilli, L.; Carotenuto, F.; Vagnoli, C.; Zaldei, A.; Gioli, B. Quantifying road traffic impact on air quality in urban areas: A COVID-19-induced lockdown analysis in Italy. Environ. Poll. 2020, 267, 115682. [Google Scholar] [CrossRef]
- Rogulski, M.; Badyda, A. Air Pollution Observations in Selected Locations in Poland during the Lockdown Related to COVID-19. Atmosphere 2021, 12, 806. [Google Scholar] [CrossRef]
- Thomas, A.; Furlong, J.; Aldred, R. Equity in temporary street closures: The case of London’s Covid-19 ‘School Streets’ schemes. Transp. Res. Part D Transp. Environ. 2022, 110, 103402. [Google Scholar] [CrossRef]
- Rothman, L.; Cloutier, M.-S.; Manaugh, K.; Howard, A.; Macpherson, A.; Macarthur, C. Pedestrian Risk and Social Equity: The Spatial Distribution of Roadway Environment Features in Toronto, Canada. In Proceedings of the Transportation Research Board 97th Annual Meeting. Injury Prevention, Washington, DC, USA, 7–11 January 2018; pp. 49–50. Available online: https://trid.trb.org/view/1496681 (accessed on 1 April 2024).
- Thomas, A. Making School Streets Healthier: Learning from Temporary And emergency Closures. March 2022. Available online: https://crossriverpartnership.org/wp-content/uploads/2022/03/Making-School-Streets-Healthier-UoW-CRP.pdf (accessed on 1 April 2024).
- Rothman, L.; Buliung, R.; To, T.; Macarthur, C.; Macpherson, A.; Howard, A. Associations between parents perception of traffic danger, the built environment and walking to school. J. Trans. Health 2015, 2, 327–335. [Google Scholar] [CrossRef]
- Buliung, R.N.; Larsen, K.; Faulkner, G.; Ross, T. Children’s independent mobility in the City of Toronto. Canada Travel Behav. Soc. 2017, 9, 58–69. [Google Scholar] [CrossRef]
- Rogulski, M.; Badyda, A.; Gayer, A.; Reis, J. Improving the Quality of Measurements Made by Alphasense NO2 Non-Reference Sensors Using the Mathematical Methods. Sensors 2022, 22, 3619. [Google Scholar] [CrossRef] [PubMed]
- Rogulski, M.; Badyda, A. Investigation of Low-Cost and Optical Particulate Matter Sensors for Ambient Monitoring. Atmosphere 2020, 11, 1040. [Google Scholar] [CrossRef]
- Owczarek, T.; Rogulski, M.; Czechowski, P.O. Assessment of the Equivalence of Low-Cost Sensors with the Reference Method in Measuring PM10 Concentration Using Selected Correction Functions. Sustainability 2020, 12, 5368. [Google Scholar] [CrossRef]


Disclaimer/Publisher’s Note: The statements, opinions and data contained in all publications are solely those of the individual author(s) and contributor(s) and not of MDPI and/or the editor(s). MDPI and/or the editor(s) disclaim responsibility for any injury to people or property resulting from any ideas, methods, instructions or products referred to in the content. |
© 2024 by the authors. Licensee MDPI, Basel, Switzerland. This article is an open access article distributed under the terms and conditions of the Creative Commons Attribution (CC BY) license (https://creativecommons.org/licenses/by/4.0/).