Article

Rural Industrial Integration and New Urbanization in China: Coupling Coordination, Spatial–Temporal Differentiation, and Driving Factors

1
School of Environmental Science and Engineering, Tiangong University, Tianjin 300387, China
2
Department of Law and Political Science, North China Electric Power University, Baoding 071003, China
*
Author to whom correspondence should be addressed.
Sustainability 2024, 16(8), 3235; https://doi.org/10.3390/su16083235
Submission received: 12 February 2024 / Revised: 22 March 2024 / Accepted: 9 April 2024 / Published: 12 April 2024

Abstract

:
Understanding the coupling coordination status between rural industrial integration (RII) and new urbanization (NU) is critical for the Chinese government to optimize policies that promote the synergetic and sustainable development of RII and NU. Based on constructing evaluation index systems, this paper uses the entropy value method, coupling coordination degree model, exploratory spatial analysis method, gravity center model, and geographical detector model to reveal the characteristics of the spatial–temporal differentiation of the coupling coordination and its driving factors in China. The results show that: (1) The regional differences in the coupling coordination degree between RII and NU are obvious, and the coupling coordination degree of China’s three economic regions are all in an increasing trend, but the mean values in the central and western regions are always below the national average. (2) The coupling coordination degree has significant spatial agglomeration characteristics, but the regional differences are gradually decreasing. The whole country is still dominated by the low–low agglomeration, and the provinces with the high–high agglomeration are mainly located in the eastern region. (3) The gravity center of the coupling coordination degree has moved in both the east–west and north–south directions from 2011 to 2021, but the movement trend in the north–south direction is more obvious. (4) The economic development level, industrial structure, transportation conditions, government support capacity, financial support level, and agricultural mechanization level are important factors driving the spatial–temporal variation, and their interactions will enhance the differentiation. The results can provide a theoretical basis and decision-making reference for relevant government departments in China to promote the sustainable development of RII and NU.

1. Introduction

Industrial integration theory was first introduced by Rosenberg [1] in 1963, RII can create more job opportunities, improve farmers’ income, and advance high-quality agricultural development [2,3]. In rural areas, RII is transforming rural industries [4]. Based on the characteristics of economic and social development and their respective agricultural production traditions, countries around the world have created distinctive RII models. In the 1990s, Naratomi Imamura first put forward the concept of “six industries” based on Japan’s rural development [5,6]. On the basis of learning from Japan’s experience, Korea has carried out the explorations of six industrialization [7]. In the United States, the development of digital technology has greatly promoted RII [8]. Fully drawing on the successful experience of developed countries, the Chinese government vigorously extends the agricultural industry chains. Since the No.1 Central Document of the Central Government first proposed to promote the integrated development of primary, secondary, and tertiary industries in rural areas in 2015, the Chinese central government has made strategic deployment for this many times [9]. In order to speed up the integration within the agricultural industry, many regions in China have integrated planting, breeding, and animal husbandry and developed new industry models [10].
Urbanization is an important driving force for a country or region to achieve modernization [11]. As a new stage of urbanization, NU is an important strategy to promote China’s economic transformation and upgrade [12]. In recent years, China has vigorously promoted NU and has clearly proposed an NU strategy described as “people-oriented and quality-oriented”. The 20th National Congress of the Communist Party of China further emphasized that China must promote the NU centered on people and accelerate the urbanization of the agricultural transfer population. Since entering the new century, China’s urbanization rate has increased from 36.22% in 2000 to 65.22% in 2022 [13].
RII and NU are China’s major plans, and the symbiosis and synergy between them is an inevitable choice to crack the dilemma of unbalanced urban–rural development and realize urban–rural co-prosperity. The Guidance on Promoting the Integrated Development of Rural Industries released by the General Office of the State Council in 2015, proposed that RII and NU must be combined. In this context, analyzing the coupling and interactive relation between RII and NU and revealing the spatiotemporal differentiation characteristics of coupling coordination development and their driving factors are of great value for China to deeply implement their rural revitalization strategy and achieve high-quality economic and social development.
At present, the study on the relationship between RII and NU has obtained some achievements. Some scholars have explored the impact of RII on urbanization: the optimization and upgrading of the industrial structure will give birth to new cities, which will further propel the urbanization process [14,15]. The growth of the employed population in the secondary and tertiary industries can promote urbanization [16,17,18]. Zhang et al. [19] pointed out that RII can effectively alleviate or even solve the problem of unbalanced urban–rural development, and thus enhance the urbanization level. Through industrial planning, construction of industrial parks, and population aggregation, RII promotes farmers’ employment and industry–city integration [20]. Through the establishment of small towns and large-scale industrial parks, RII can promote local rural residents’ urbanization [21].
Some scholars have analyzed the role of urbanization in RII; Michael et al. [22] pointed out that the improvement of technical level and innovation ability can promote industrial upgrading and economic urbanization links to industrial prosperity [13]. Chen et al. [23] believed that the rural revitalization strategy combines agricultural resources with urban industrial systems to create diversified industrial development models. Moir [24] pointed out that in the primary stage, urbanization is more closely related to the secondary industry, while in the advanced stage, it is more closely related to the tertiary industry. Fang et al. [25] found that rural urbanization can effectively enhance the level of industrial agglomeration, creating a good economic environment for RII.
To sum up, although significant achievements have been made in the relationship between RII and NU in recent years, there are still research gaps to be filled. First, the existing literature only analyzed the one-way positive or negative effects between RII and NU; there are few studies on the two-way synergistic relationship between them. Secondly, research on the coupling coordination degree between RII and NU is weak, and there is no discussion on its spatial–temporal differentiation characteristics.
RII and NU mutually promote and complement each other; with a close internal correlation, their coupling is an important method to promote the coordinated development of RII and NU. Against this backdrop, the study analyzes the interactive relation between RII and NU and explores the spatiotemporal differentiation characteristics and driving factors of the coupling coordination between RII and NU. The research results can provide a theoretical basis and decision-making reference for the sustainable and synergetic development of RII and NU.

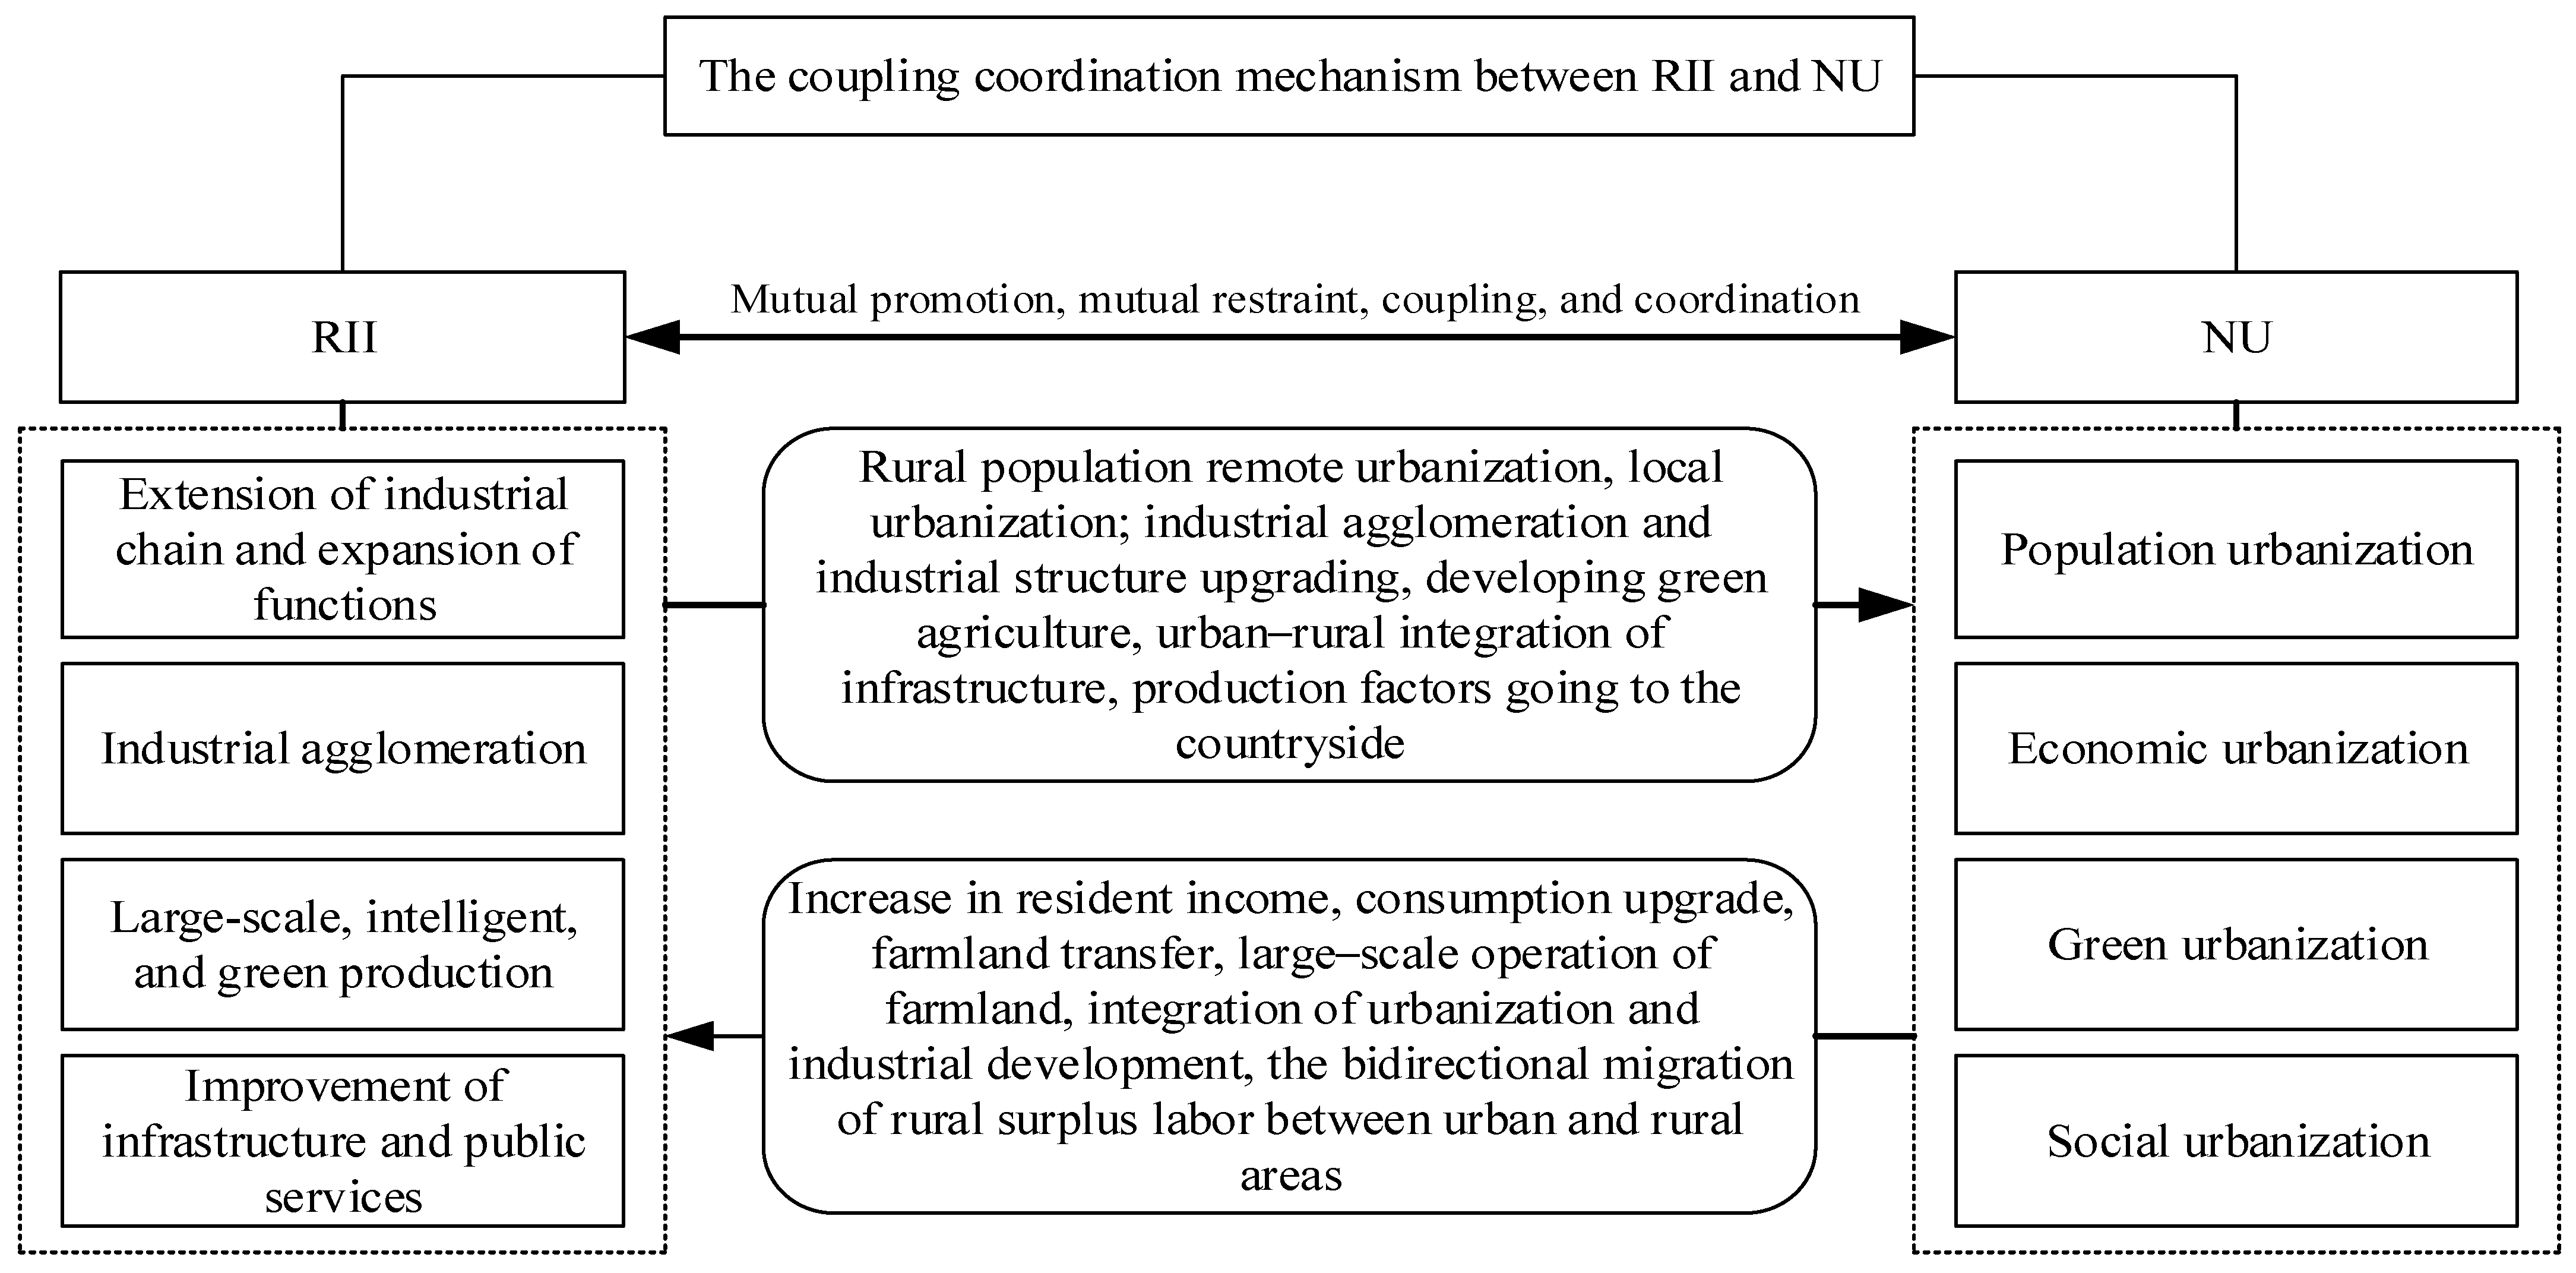
2. The Coupling Coordination Mechanism between RII and NU

Originating from physics, coupling is a phenomenon through which two or more systems or forms of motion affect each other through different interactions [26,27]. Due to involving various system components, these interactions are complicated and change over time [28]. RII and NU interact due to the exchange and communication of material, energy, and information between them (Figure 1).

2.1. The Influence of RII on NU

Firstly, RII propels population urbanization. Focusing on large-scale, mechanized production, RII greatly improves the production efficiency of modern agriculture, which will make large numbers of surplus rural workers move to urban areas, thereby promoting the remote urbanization of the rural population. In the process of RII, with the continuous improvement of agricultural industrialization, agricultural product processing, preservation, transportation, sales, and other links gradually gather to agricultural industrial parks. Agricultural industrial parks, which do not exist in isolation, will bring the population in surrounding areas together and further improve their infrastructure and public service facilities. As a result, small towns are born, which will inevitably promote farmers’ local urbanization [29].
Secondly, RII boosts economic urbanization. RII continues to explore various types of integration methods, such as extending the agricultural industry chains, expanding the multiple functions of agriculture, and developing new forms of agriculture. In this process, advanced management experience and science and technology continue to penetrate rural areas, which can improve the allocation efficiency of production factors and resources and promote the optimization and upgrading of the industrial structure.
Thirdly, RII promotes the construction of green urbanization. RII attaches great importance to green development. On the one hand, it adjusts and optimizes the structure of agricultural planting and breeding, developing green agriculture; on the other hand, it strengthens the protection and utilization of agricultural resources, the governance of agricultural non-point source pollution, and the protection and restoration of agricultural ecology. This not only improves the level of green development in agriculture and rural areas but also provides a good ecological foundation for urbanization, especially for the development of small towns. In addition, with the continuous expansion of the multiple functions of agriculture, green industries such as sightseeing tourism, farming experience, leisure, and health care have transformed the ecological advantages of rural areas into economic advantages, creating conditions for urban residents to enjoy a good ecological environment.
Finally, RII promotes social urbanization. Social urbanization is the process of completing urban infrastructure and integrating urban–rural development [29]. RII focuses on strengthening the construction of rural water, electricity, roads, communication, and other infrastructure, and the overall planning and construction of rural logistics facilities, which greatly promote the integrated layout and overall supply of urban and rural infrastructure. RII promotes the full coverage of basic financial services in rural areas, guides various scientific and technological personnel and graduates from colleges and universities to start businesses in rural areas, and encourages researchers to work part-time in rural areas. These support measures can effectively promote the circulation of urban and rural factors and narrow the gap between urban and rural development.

2.2. The Influence of NU on RII

The process of urbanization is accompanied by industrialization. In this process, on the one hand, the rural population continues to be urbanized; on the other hand, the workforce continues to shift from the primary industry sector to the secondary and tertiary industry sectors, which enhances the income of the transferred workforce. According to Maslow’s hierarchy of needs theory, the increase in income will promote the upgrading of residents’ consumption and the demand for high-income elasticity products such as fine processed agricultural products, agricultural sightseeing tourism, and farming experience will continue to increase. This will promote the optimization and upgrading of agricultural industrial structure from the perspective of product demand, and further promote RII.
In the process of urbanization, a large number of rural laborers flow to cities, and the transfer of agricultural land becomes increasingly common, which makes the large-scale operation of farmland gradually come into fashion. The large-scale operation of farmland has two effects on RII: it helps to break the dependence between farmers and land, freeing up more labor from the land to engage in the secondary and tertiary industries, and providing low-cost labor for RII; on the other hand, it will enable localities to develop characteristic advanced industries closely related to local “specialty products”, which will not only promote the formation of a sound agricultural product supply and sales network but also further extend agricultural industry chains [30].
Combined with industrial development, urbanization plans secondary and tertiary industries around county towns, key townships, and central villages, thereby forming a group of small towns characterized by agricultural product deep processing, sales, logistics, and leisure agriculture, which can effectively promote RII.
In the process of urbanization, the bidirectional migration of rural surplus labor between urban and rural areas has promoted the dissemination and exchange of factors in rural areas. This is conducive to establishing a market and benefit-oriented mechanism for agricultural development and promoting the advancement of rural industry structure and RII. Farmers who have moved back from cities are more willing to invest in new agriculture and agricultural service industries [31].

3. Research Methodology and Data Sources

3.1. Evaluation Index System

RII mainly includes three approaches: extending the agricultural industry chain, expanding agricultural functions, and integrating agricultural service industries. Its main goal is to promote the development of agriculture and rural areas and increase farmers’ income. The connotation of NU is rich, covering multiple dimensions such as population, economy, society, and ecology, including multiple effects such as the improvement of people’s livelihood, economic development, social equity, and the ecological environment. Based on the above considerations, following the principles of scientificity, systematicity, representativeness, comparability, and practical feasibility and drawing on the relevant research literature [21,32,33,34,35], this paper comprehensively uses theoretical analysis and Delphi methods to construct an evaluation index system for RII and NU. The former includes four aspects: the extension of agricultural industry chains, the expansion of agricultural multi-function, the development of the agricultural service industry, and the benefits of industrial integration; meanwhile, the latter includes four aspects: population urbanization, economic urbanization, social urbanization, and ecological urbanization (Table 1).

3.2. Research Methodology

3.2.1. Coupling Coordination Model

The coupling degree reflects the degree of interaction between different systems, while the coupling coordination reflects the degree of coordinated development between systems, and is a measure of the process of system development from disorder to order. The paper defines the coupling coordination between RII and NU as a state of harmonious coexistence and mutual benefit, formed by the interaction and mutual promotion between the two systems. Drawing from relevant studies on coupling coordination models [36,37], the calculation formula for the coupling coordination degree between RII and NU is as follows:
C = U 1 U 2 ( U 1 + U 2 2 ) 2
D = C × T
T = α U 1 + β U 2
U 1 = m j = 1 w j U 1 r i j U 1
U 2 = m j = 1 w j U 2 r i j U 2
where C is the coupling degree; D is the coupling coordination degree; T is the comprehensive coordination index of two systems, which reflects the contribution of the two systems to coupling coordination degree; U 1 and U 2 are the comprehensive indices of RII and NU, respectively; w j U 1 and w j U 2 are the weights of the indices in the evaluation index system of RII and NU, respectively. To avoid the influence of subjective elements, the paper uses the entropy value method to determine the index weight based on referring to the relevant literature [38]. r i j U 1 and r i j U 2 are the standardized values of indices in the evaluation index system of RII and NU, respectively; the paper uses the range standardization method to standardize the data of each index [39]. α and β are undetermined parameters, and their values depend on the importance of RII and NU in the coupling system, setting α + β = 1 . Based on the suggestions of experts in the fields of regional economy and rural development, referring to the research literature [36,37], this paper suggests that the importance of RII and NU to the coupling coordination between them is the same on the whole, so α and β are both set to 0.5.

3.2.2. Exploratory Spatial Analysis Method

As a basic spatial statistical method, exploratory spatial analysis utilizes spatial autocorrelation to analyze the spatial clustering and heterogeneity of observed values. This method mainly includes global spatial autocorrelation analysis and local spatial autocorrelation analysis and is widely used in various industries.
Global spatial autocorrelation analysis reflects the overall characteristics of the spatial correlation of observed variables within the study area and is used to quantitatively describe the degree of overall spatial correlation and difference of a phenomenon. The paper uses the global Moran’s I index proposed by Moran to measure global spatial autocorrelation. The calculation formula is as follows:
M o r a n s   I = n n i = 1 n j = 1 w i j ( x i x ¯ ) ( x j x ¯ ) ( n i = 1 n j = 1 w i j ) n i = 1 ( x i x ¯ ) 2
where n is the number of regions, x i and x j are the observed values of the variable, x ¯ is the average value, and w i j is the spatial weight between study regions. If regions i and j are adjacent, then w i j = 1 , otherwise, w i j = 0 .
The local spatial autocorrelation analysis can effectively identify the differential spatial correlation and the spatial difference that may occur at the micro level, which cannot be reflected in the global spatial autocorrelation analysis. The paper uses Local Moran’s I for measurement. The calculation formula is as follows:
M o r a n s   I i = ( x i x ¯ ) m 0 n j = 1 , j i w i j ( x j x ¯ )
m 0 = n i = 1 ( x i x ¯ ) 2 n
The meanings of x i ,   x j ,   x ¯ ,   n ,   and   w i j are consistent with those in Formula (6).
The local spatial autocorrelation analysis divides the data into four quadrants in the Moran scatter diagram: HH, HL, LL, and LH. HH (LL) denotes spatial homogeneity, and HL (LH) denotes spatial heterogeneity [40].

3.2.3. Gravity Center Model

The gravity center refers to the position where a certain attribute value in the study area reaches equilibrium on the spatial plane [41]. The change in the gravity center can reflect the spatial distribution differences and their trajectories for the coupling coordination degree between RII and NU in the study area. The geographical location of each province is represented by latitude and longitude; according to Formulas (9) and (10), the paper can calculate the gravity center of the coupling coordination degree between RII and NU.
X t = n i = 1 C t i x i n i = 1 C t i
Y t = n i = 1 C t i y i n i = 1 C t i
where X t and Y t represent the latitude and longitude coordinates of the gravity center of the coupling coordination degree in year t , respectively; C t i represents the coupling coordination degree of province i in year t ; x i and y i represent the latitude and longitude coordinates of province i ; and n denotes the total number of provinces.
Assuming D is the migration distance of the gravity center, the calculation formula is as follows:
D = C × ( X x + 1 X t ) 2 + ( Y x + 1 Y t ) 2
where ( X x + 1 , Y x + 1 ) represents the latitude and longitude coordinates in year t + 1 , ( X t , Y t ) represents the latitude and longitude coordinates in year t , and C is a constant representing the coefficient for converting coordinates of the Earth’s surface into the plane distance, whose value is 111.111.

3.2.4. Geographical Detector

First proposed by Wang et al. [42], a geographical detector is a spatial analysis technology that analyzes the relation between geographic phenomena and their potential influencing factors. The tool’s core idea is grounded on the basis of the assumption that if one variable has a significant effect on a dependent variable, then the two variables will present a similar spatial distribution. In this study, the factor detector and interaction detector are applied to analyze the driving force for the spatial differences of the coupling coordination degree between RII and NU. The q is used to measure the interpretation power of a single factor; the calculation formula for q is as follows:
q = 1 ( N σ 2 ) 1 L h = 1 N h σ h 2
where h = 1 , , L represents the hierarchy of the explained variable or explanatory variable; σ h 2 and σ 2   represent the variance of the explained variable in a hierarchy h and the entire study area, respectively; N h   and   N represent the number of elements in a hierarchy h and the entire study area, respectively; q represents the factor’s interpretation power, which ranges from 0 to 1. If the hierarchy is generated by the explanatory variable, the larger the q value, the stronger the explanatory power of the explanatory variable on the explained variable [42].
The geographical detector can also conduct interactive detection to analyze whether the interpretation power of the interaction of different factors on the spatial distribution of the coupling coordination degree is enhanced or weakened. It also examines whether these factors are independent in explaining this spatial distribution. The types of factor interactions and their judgment criteria can refer to the relevant literature by Wang et al. [42].

3.3. Data Sources

The paper is mainly based on research at the provincial level in China, with 31 provinces, autonomous regions, and municipalities from 2011 to 2021 as the analysis unit (excluding Hong Kong, Macao, and Taiwan). The study utilizes various data sources, including “China Statistical Yearbook” (2012–2022), “China Industry Statistical Yearbook” (2012–2022), “China Rural Statistical Yearbook” (2012–2022), “Statistical Yearbook of the Chinese Investment Field” (2019–2022), “Statistical Yearbook of the Chinese Investment in Fixed Assets” (2012–2018), “Almanac of China’s Finance and Banking” (2012–2022), “China Labour Statistical Yearbook” (2012–2022), “Yearbook of China’s Insurance” (2012–2022), “China Population and Employment Statistical Yearbook” (2012–2022), and “China Health Statistics Yearbook” (2012–2022).

4. Empirical Analysis

4.1. Analysis of the Differences in Coupling Coordination Degree

On the basis of the above model construction and data collection, the paper uses the entropy method to calculate the weight of each evaluation index; then, it uses the coupling coordination degree model to calculate the coupling coordination degree between RII and NU for 31 provinces, autonomous regions, and municipalities from 2011 to 2021. The calculation results show that regional differences are significant.

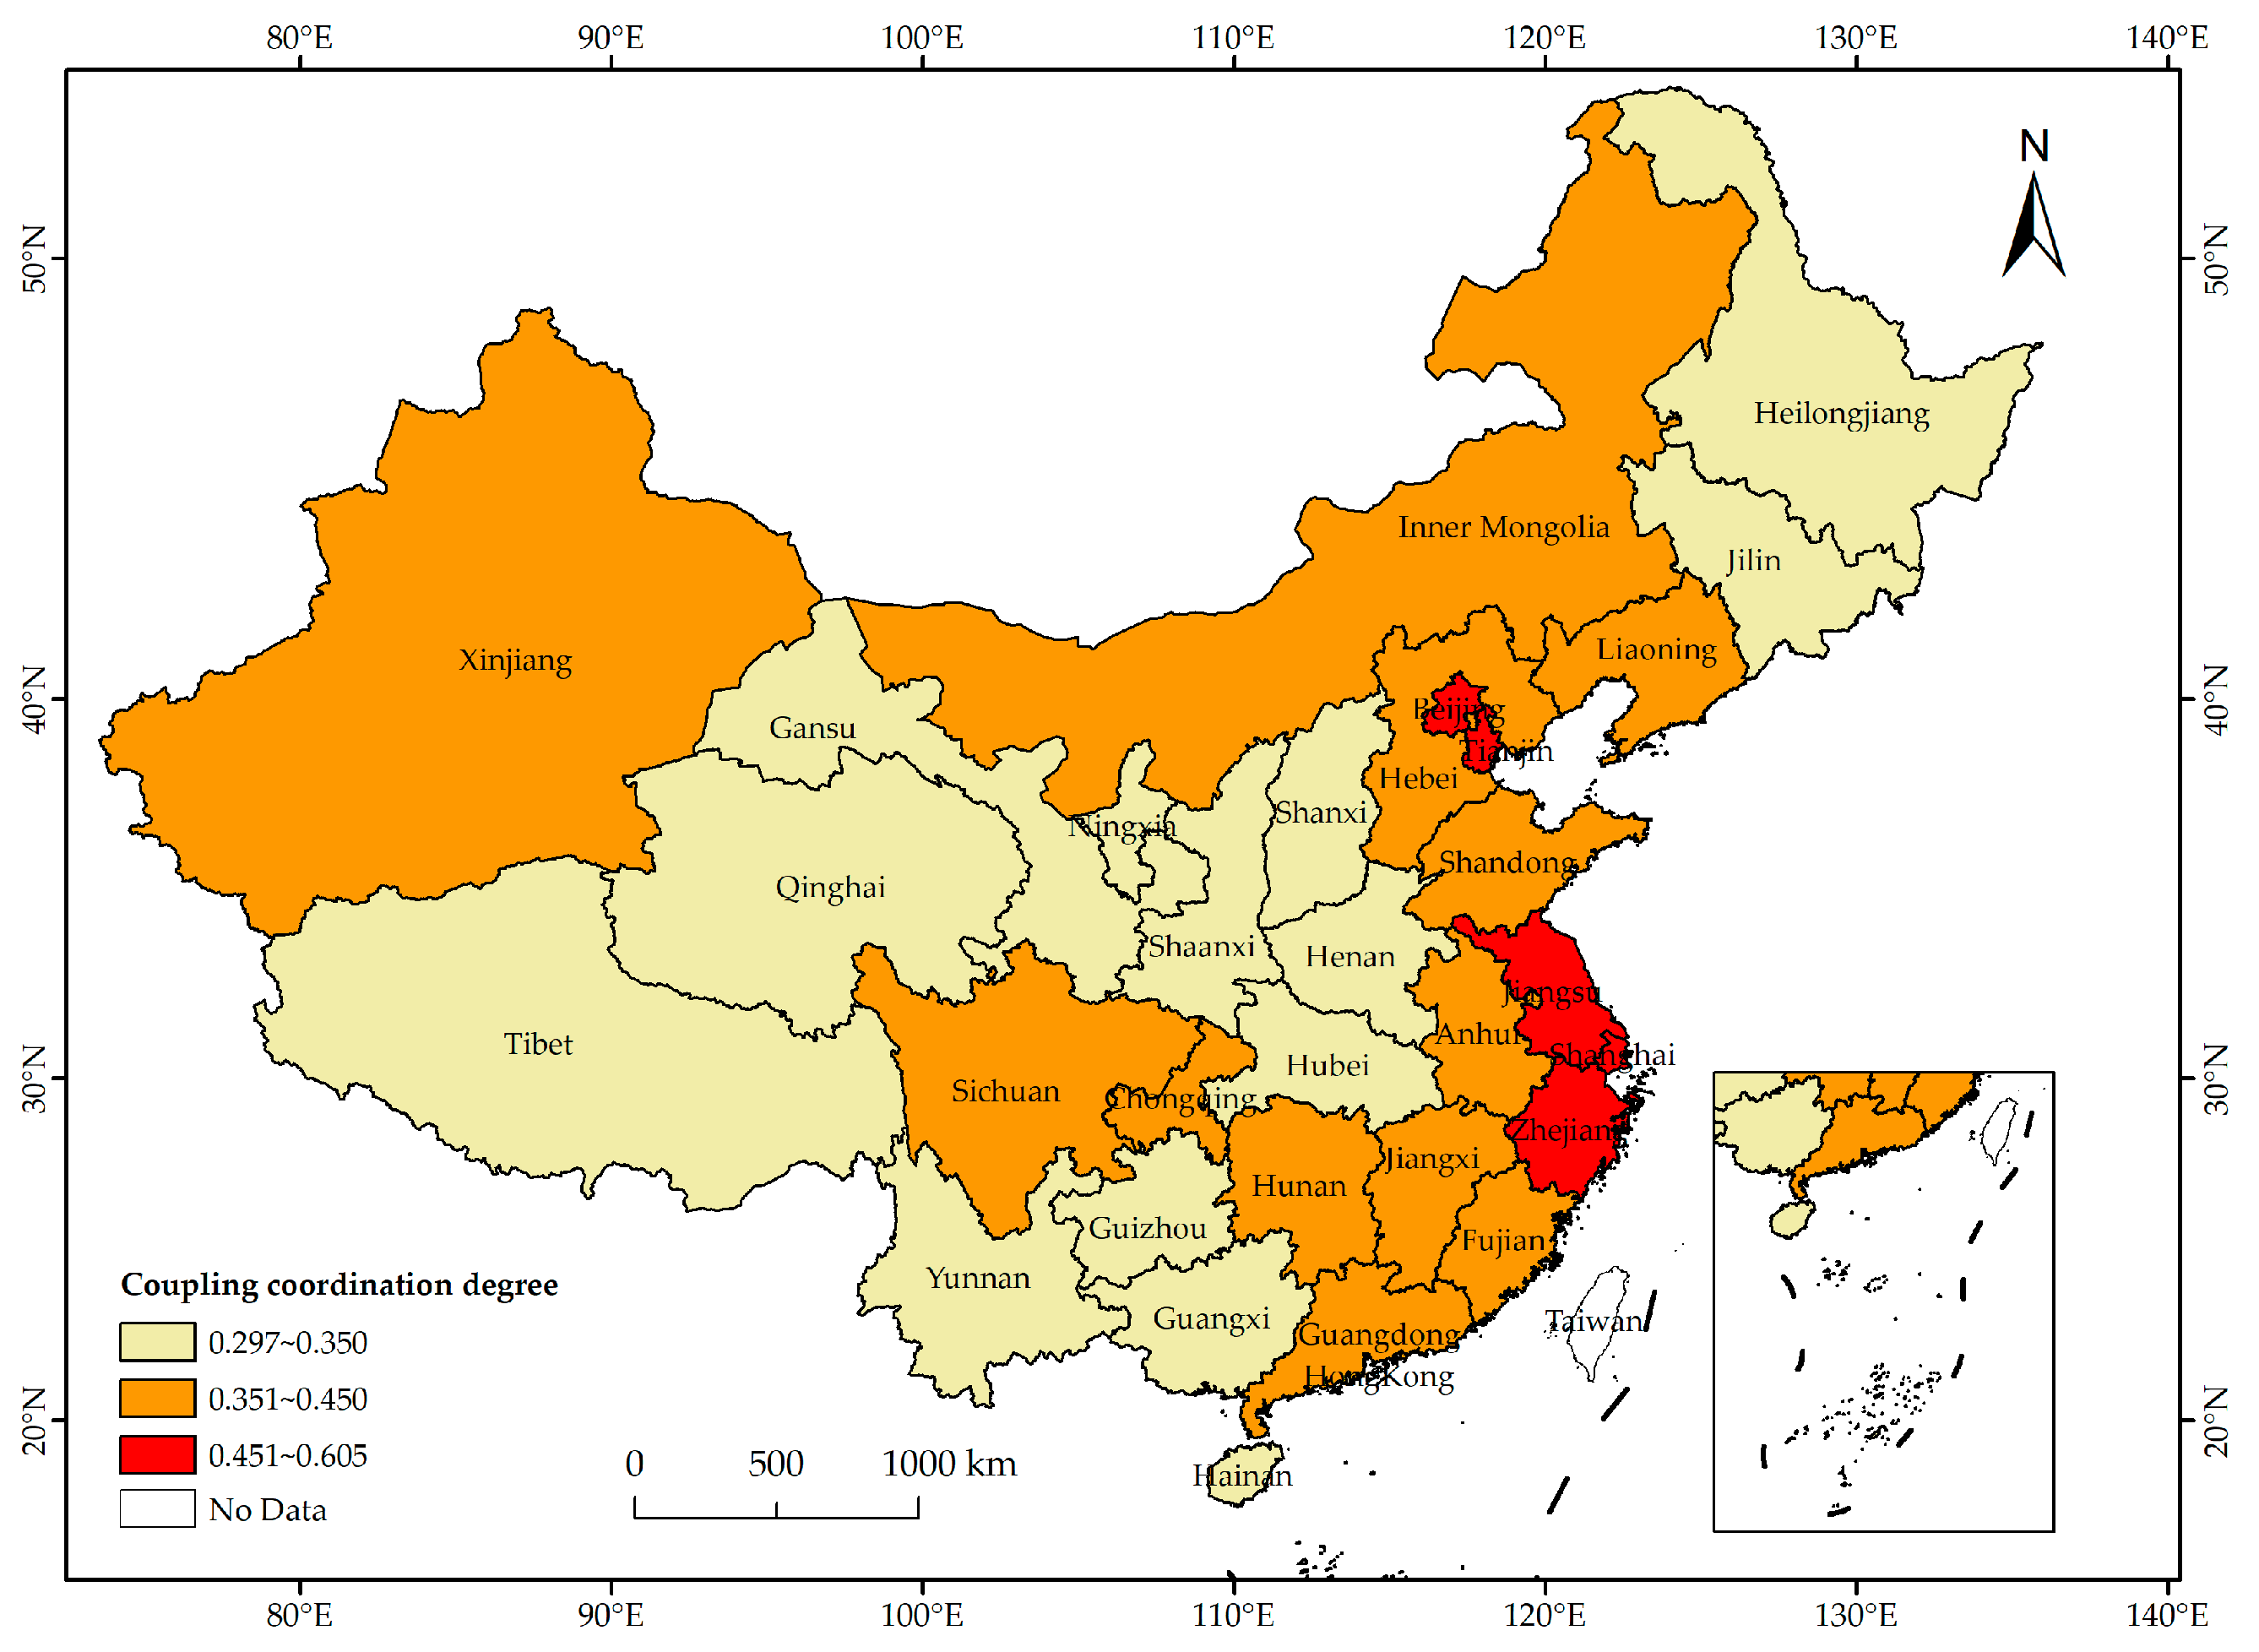
4.1.1. Inter-Provincial Differences Analysis

Based on the average coupling coordination degree between RII and NU for 31 provinces (autonomous regions and municipalities) from 2011 to 2021, with the help of ArcGIS 10.2 spatial analysis technology, the paper divides them into three groups: high coupling coordination, moderate coupling coordination, and low coupling coordination (Figure 2).
The high coupling coordination group includes five provinces: Shanghai, Beijing, Zhejiang, Jiangsu, and Tianjin; the moderate coupling coordination group includes 12 provinces: Xinjiang, Sichuan, Hunan, Inner Mongolia, Anhui, Jiangxi, Hebei, Liaoning, Chongqing, Shandong, Fujian, and Guangdong; the low coupling coordination group includes 14 provinces: Qinghai, Xizang, Guangxi, Guizhou, Yunnan, Gansu, Hainan, Heilongjiang, Ningxia, Shaanxi, Henan, Shanxi, Jilin, and Hubei. The spatial distribution echoes the research on RII [9,10] and NU [43].
Overall, the coupling coordination degree of most eastern provinces is higher. Except for Chongqing, the top 10 provinces in terms of the coupling coordination degree are all eastern provinces. The main reason may be that the eastern regions are economically well developed, and a solid economic foundation can effectively support the coordinated development of RII and NU. For example, the economic and social development in Shanghai is at a higher level, its average value of the NU index ranks first in China from 2011 to 2021. Although its agriculture accounts for a relatively low proportion, Shanghai focuses on the RII, and its average value of the RII index ranks second in China from 2011 to 2021. The agriculture development mode in the mid-west provinces is still extensive, its RII is still in the beginning stage, and the quality of its NU is not high, so its coupling coordination development level is naturally relatively low.

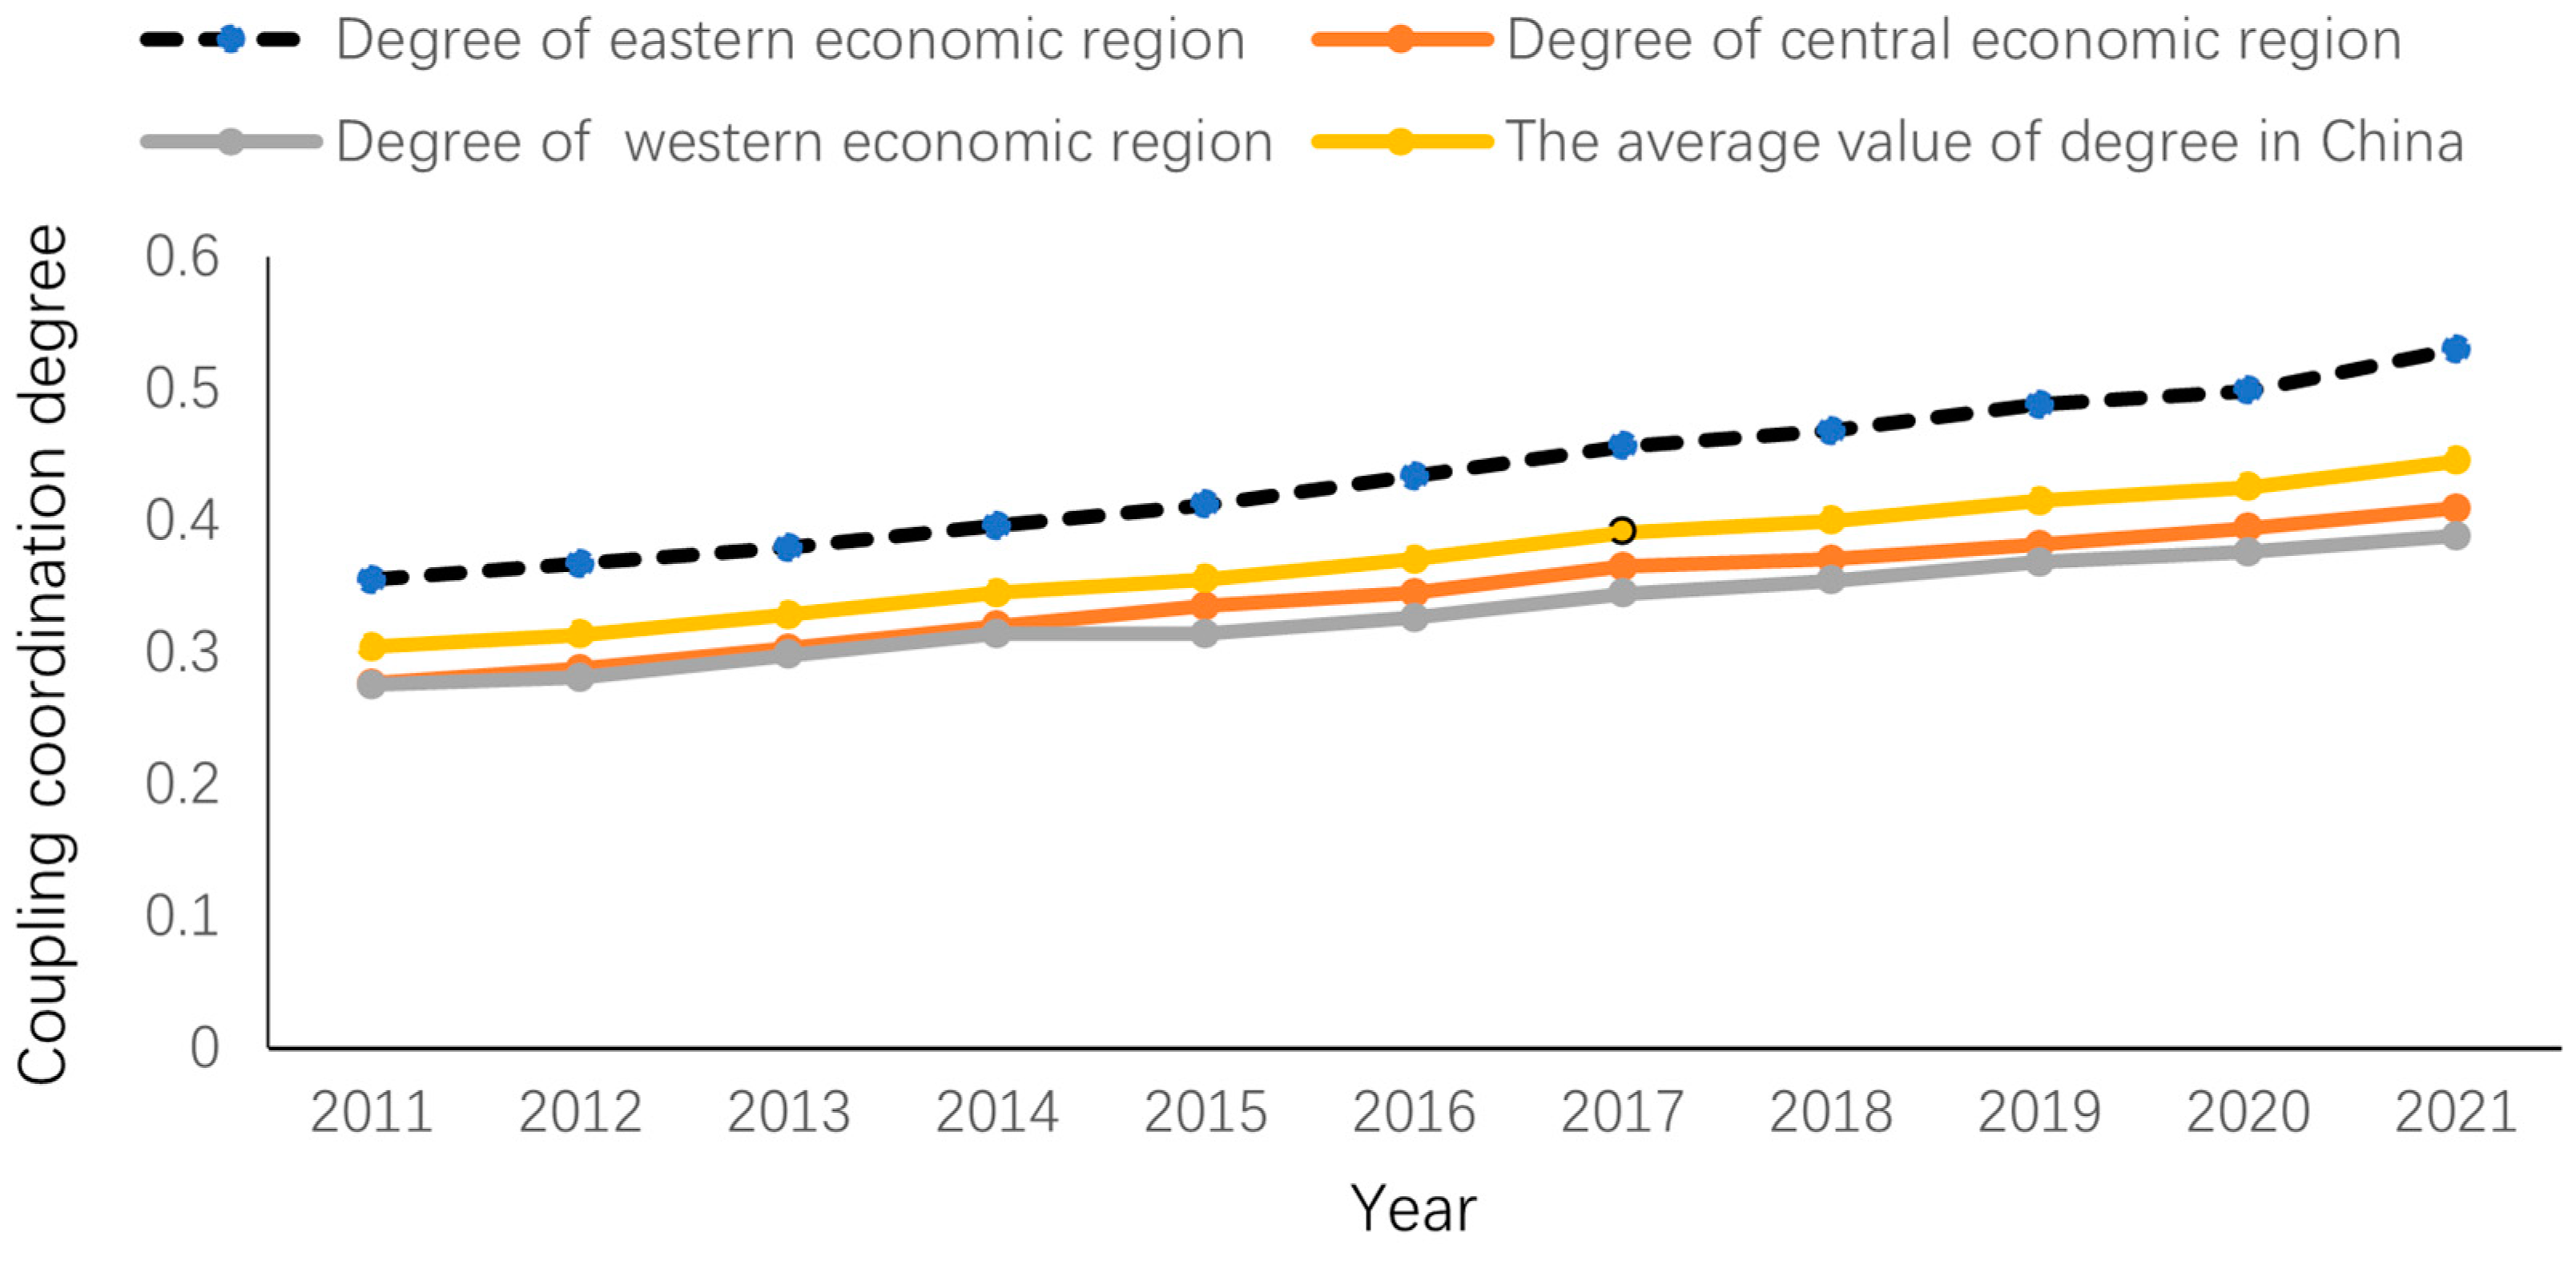
4.1.2. Analysis of the Differences among the Three Economic Regions

To analyze the regional distribution characteristics of the coupling coordination between RII and NU in China, based on the division of the three economic regions by the National Bureau of Statistics, this paper groups the relevant data of the three economic regions and takes their averages year by year. In order to facilitate comparative analysis, with reference to the average nationwide value, the paper has created a dynamic change diagram for the coupling coordination degree in the three economic regions (Figure 3).
From a temporal evolution perspective, the coupling coordination degree between RII and NU in the eastern and central economic regions has consistently improved from 2011 to 2021. During this period, with the exception of 2015, the coupling coordination degree of the western economic region also increased year by year. The primary reason may be that in recent years, China has placed a high emphasis on NU and the work related to “agriculture, rural areas, and farmers”, viewing them as crucial strategies for promoting high-quality development. Since 2012, the Chinese central government has issued several policies on RII and NU. The implementation of these policy documents has greatly promoted the implementation of the RII and NU strategies, and their coupling coordination degree has been continuously improved.
Compared with the central and western economic regions, the coupling coordination degree of the eastern economic region is higher, and the gap between the eastern region and the central and western regions is on the rise. From 2011 to 2021, the coupling coordination degree of the central and western regions has always been below the average value in China. The central region has always been higher than the western region, but the gap is small. The coupling coordination degree of the eastern region has always been higher than the national average. The main reason for these regional differences may be that the eastern region has a high level of economic development, relatively developed secondary and tertiary industries, and an early start of agricultural industrialization, which has strong capabilities and conditions for promoting the coordinated development of RII and NU. In comparison, the central region has a relatively low level of agricultural modernization, an underdeveloped industrial foundation, and a lower urbanization rate. The western region, constrained by natural environmental factors, transportation conditions, and other limitations, experiences lower levels of agricultural industrialization and urbanization, resulting in low coupling coordination.

4.2. Spatial–Temporal Differentiation Analysis

4.2.1. Global Spatial Autocorrelation Analysis

The paper uses the global Moran’s I index to analyze the spatial correlation and spatial difference characteristics of the coupling coordination degree between RII and NU in China at the overall level. The results show that the global Moran’s I index values from 2011 to 2021 are all greater than 0, and all pass the significance test at the 1% level (Table 2). The above calculation results show that the coupling coordination degree between RII and NU in China exhibits significant spatial autocorrelation, displaying distinct spatial clustering characteristics. High-value provinces are usually surrounded by high-value provinces, while low-value provinces tend to be surrounded by similar low-value regions. In addition, the positive spatial correlation exhibits a trend of increasing first and then decreasing, which indicates that from 2011 to 2015, the spatial agglomeration characteristics of the coupling coordination degree between RII and NU in China have been continuously strengthened, reaching the maximum in 2015. After 2016, the overall spatial agglomeration level declined.

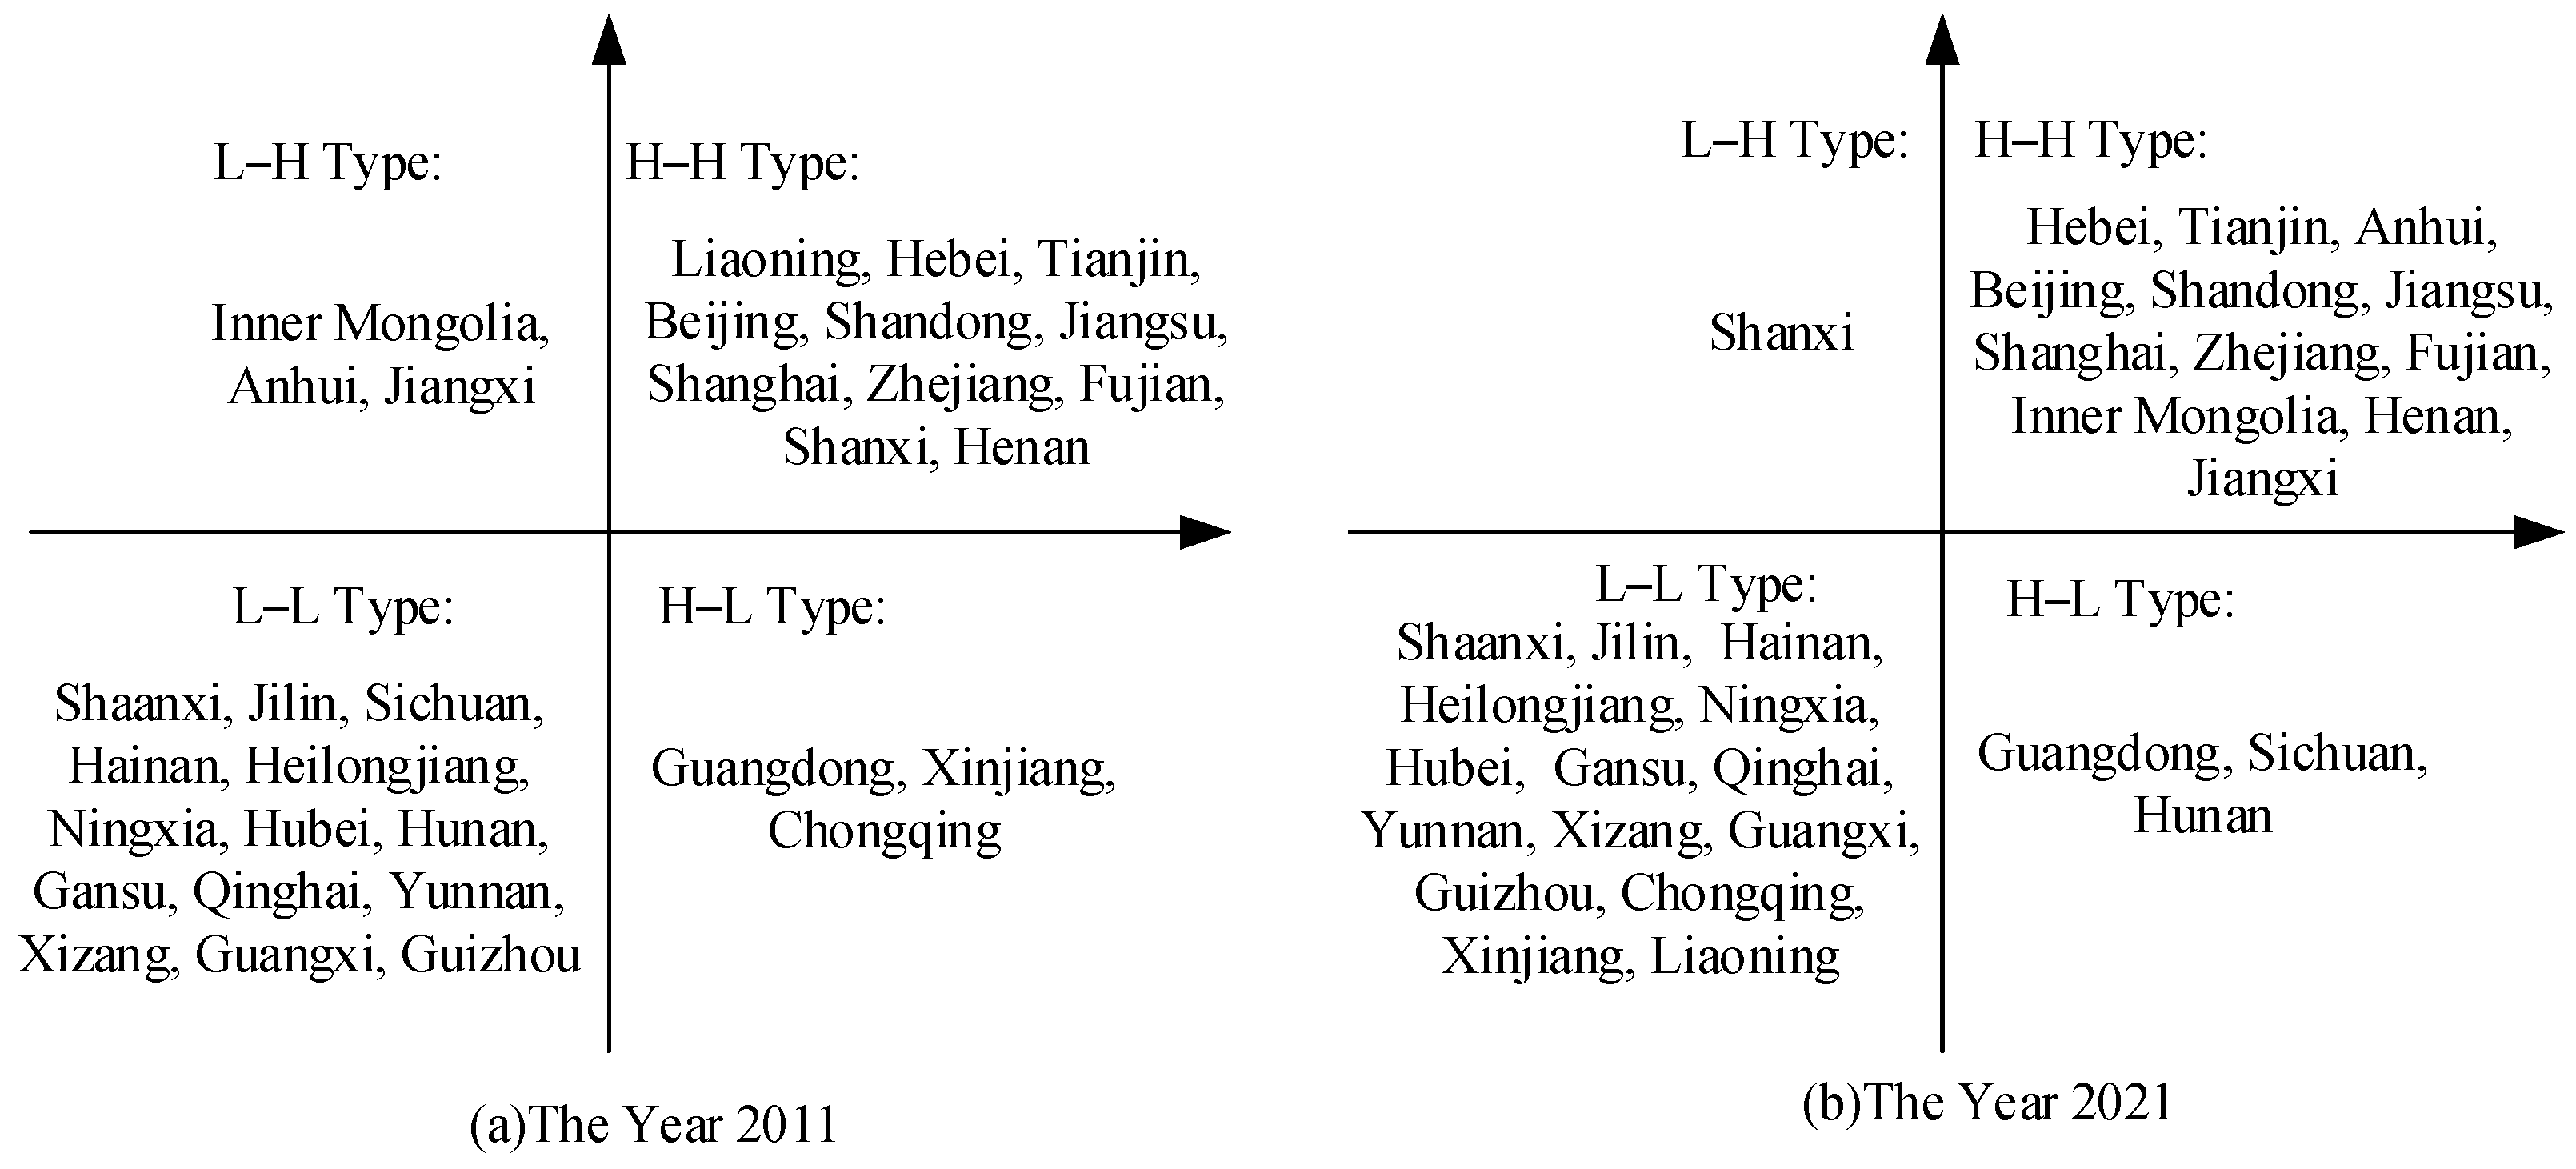
4.2.2. Local Spatial Autocorrelation Analysis

The aforementioned global spatial autocorrelation analysis unveils the global spatial layout pattern, whereas identifying local spatial distribution characteristics requires the use of local spatial autocorrelation analysis. Based on the data of 2011 and 2021, we use a Moran scatter plot to analyze the heterogeneity characteristics of local space (Figure 4). Taking the standardized value of the coupling coordination degree as the horizontal axis and the lagged value of the standardized value of the coupling coordination degree as the vertical axis, we divide the flat space into four basic quadrant units, with different units corresponding to different types of local spatial agglomeration. The majority of provinces are located in the first or third quadrant. Compared to 2011, there is not much change in 2021, with most provinces displaying characteristics of high–high or low–low clustering. The coupling coordination between RII and NU in China has resulted in a stable “layered solidification” pattern.
(1) High–High Quadrant. The provinces located in this quadrant have a higher coupling coordination degree, with little spatial disparity. In 2011, there were 11 provinces in this quadrant; in 2021, Anhui, Inner Mongolia, and Jiangxi replaced Shanxi and Liaoning, bringing the number of provinces in this quadrant to 12. Most of these provinces are located on the eastern coast, and both their economic foundation and agricultural modernization levels are in the leading position in the country. They have achieved remarkable results in promoting RII and NU, forming a mutual promotion effect among neighboring areas.
(2) Low–High Quadrant. The provinces in this quadrant have a lower coupling coordination degree, while their neighboring provinces have a higher one, leading to significant spatial disparities and the formation of a “low–high hollow” area in China’s coupling coordination degree. In 2011, there were three provinces in this quadrant; compared to the surrounding regions, their coupling coordination degree was notably lower. This could be primarily attributed to the siphoning effect of the surrounding regions on these three provinces. In 2021, Shanxi replaced Inner Mongolia, Anhui, and Jiangxi, leaving only one province in this quadrant. This indicates that as China has paid more and more attention to regional coordinated development in recent years, especially by vigorously implementing the targeted poverty alleviation strategy and long-term assistance mechanism for underdeveloped areas, the urbanization and agricultural modernization levels of central and western provinces have continued to improve, and their coupling coordination degree between RII and NU has significantly increased, thereby allowing their escape from the “low–high hollow” zone.
(3) Low–Low Quadrant. The provinces located in this quadrant and their surrounding provinces have a lower coupling coordination degree, with little spatial disparity. In 2011, there were 14 provinces in this quadrant, accounting for 45.16% of the 31 provinces. The number of provinces in this quadrant increased to 15 in 2021, which indicates that the coupling coordination between RII and NU in China is still dominated by low–low aggregation. Sichuan and Hunan shifted from the low–low quadrant in 2011 to the high–low quadrant in 2021, while Chongqing and Xinjiang shifted from the high–low quadrant in 2011 to the low–low quadrant in 2021. In terms of geographical distribution, provinces in this quadrant are predominantly situated in the northwest, southwest, and northeast regions, and their coupling coordination degrees lag significantly behind those of the eastern coastal areas.
(4) High–Low Quadrant. The provinces in this quadrant have higher coupling coordination degrees, while their neighboring provinces have lower ones, leading to significant spatial disparities. In 2011, there were three provinces in this quadrant; in 2021, there were still three provinces in this quadrant, namely Sichuan, Hunan, and Guangdong, becoming a high-value isolated area in Southwest, South-central, and South China, respectively. The three provinces have relatively high levels of RII and NU, which provide a prerequisite for the coordinated development between them. However, the coupling coordination degree of their neighboring provinces is mostly low. To some extent, this indicates that these provinces are not powerful enough to drive the surrounding regions effectively, nor have they formed an effect of adjacent diffusion with neighboring provinces; on the contrary, the “Matthew’s effect” is pronounced.

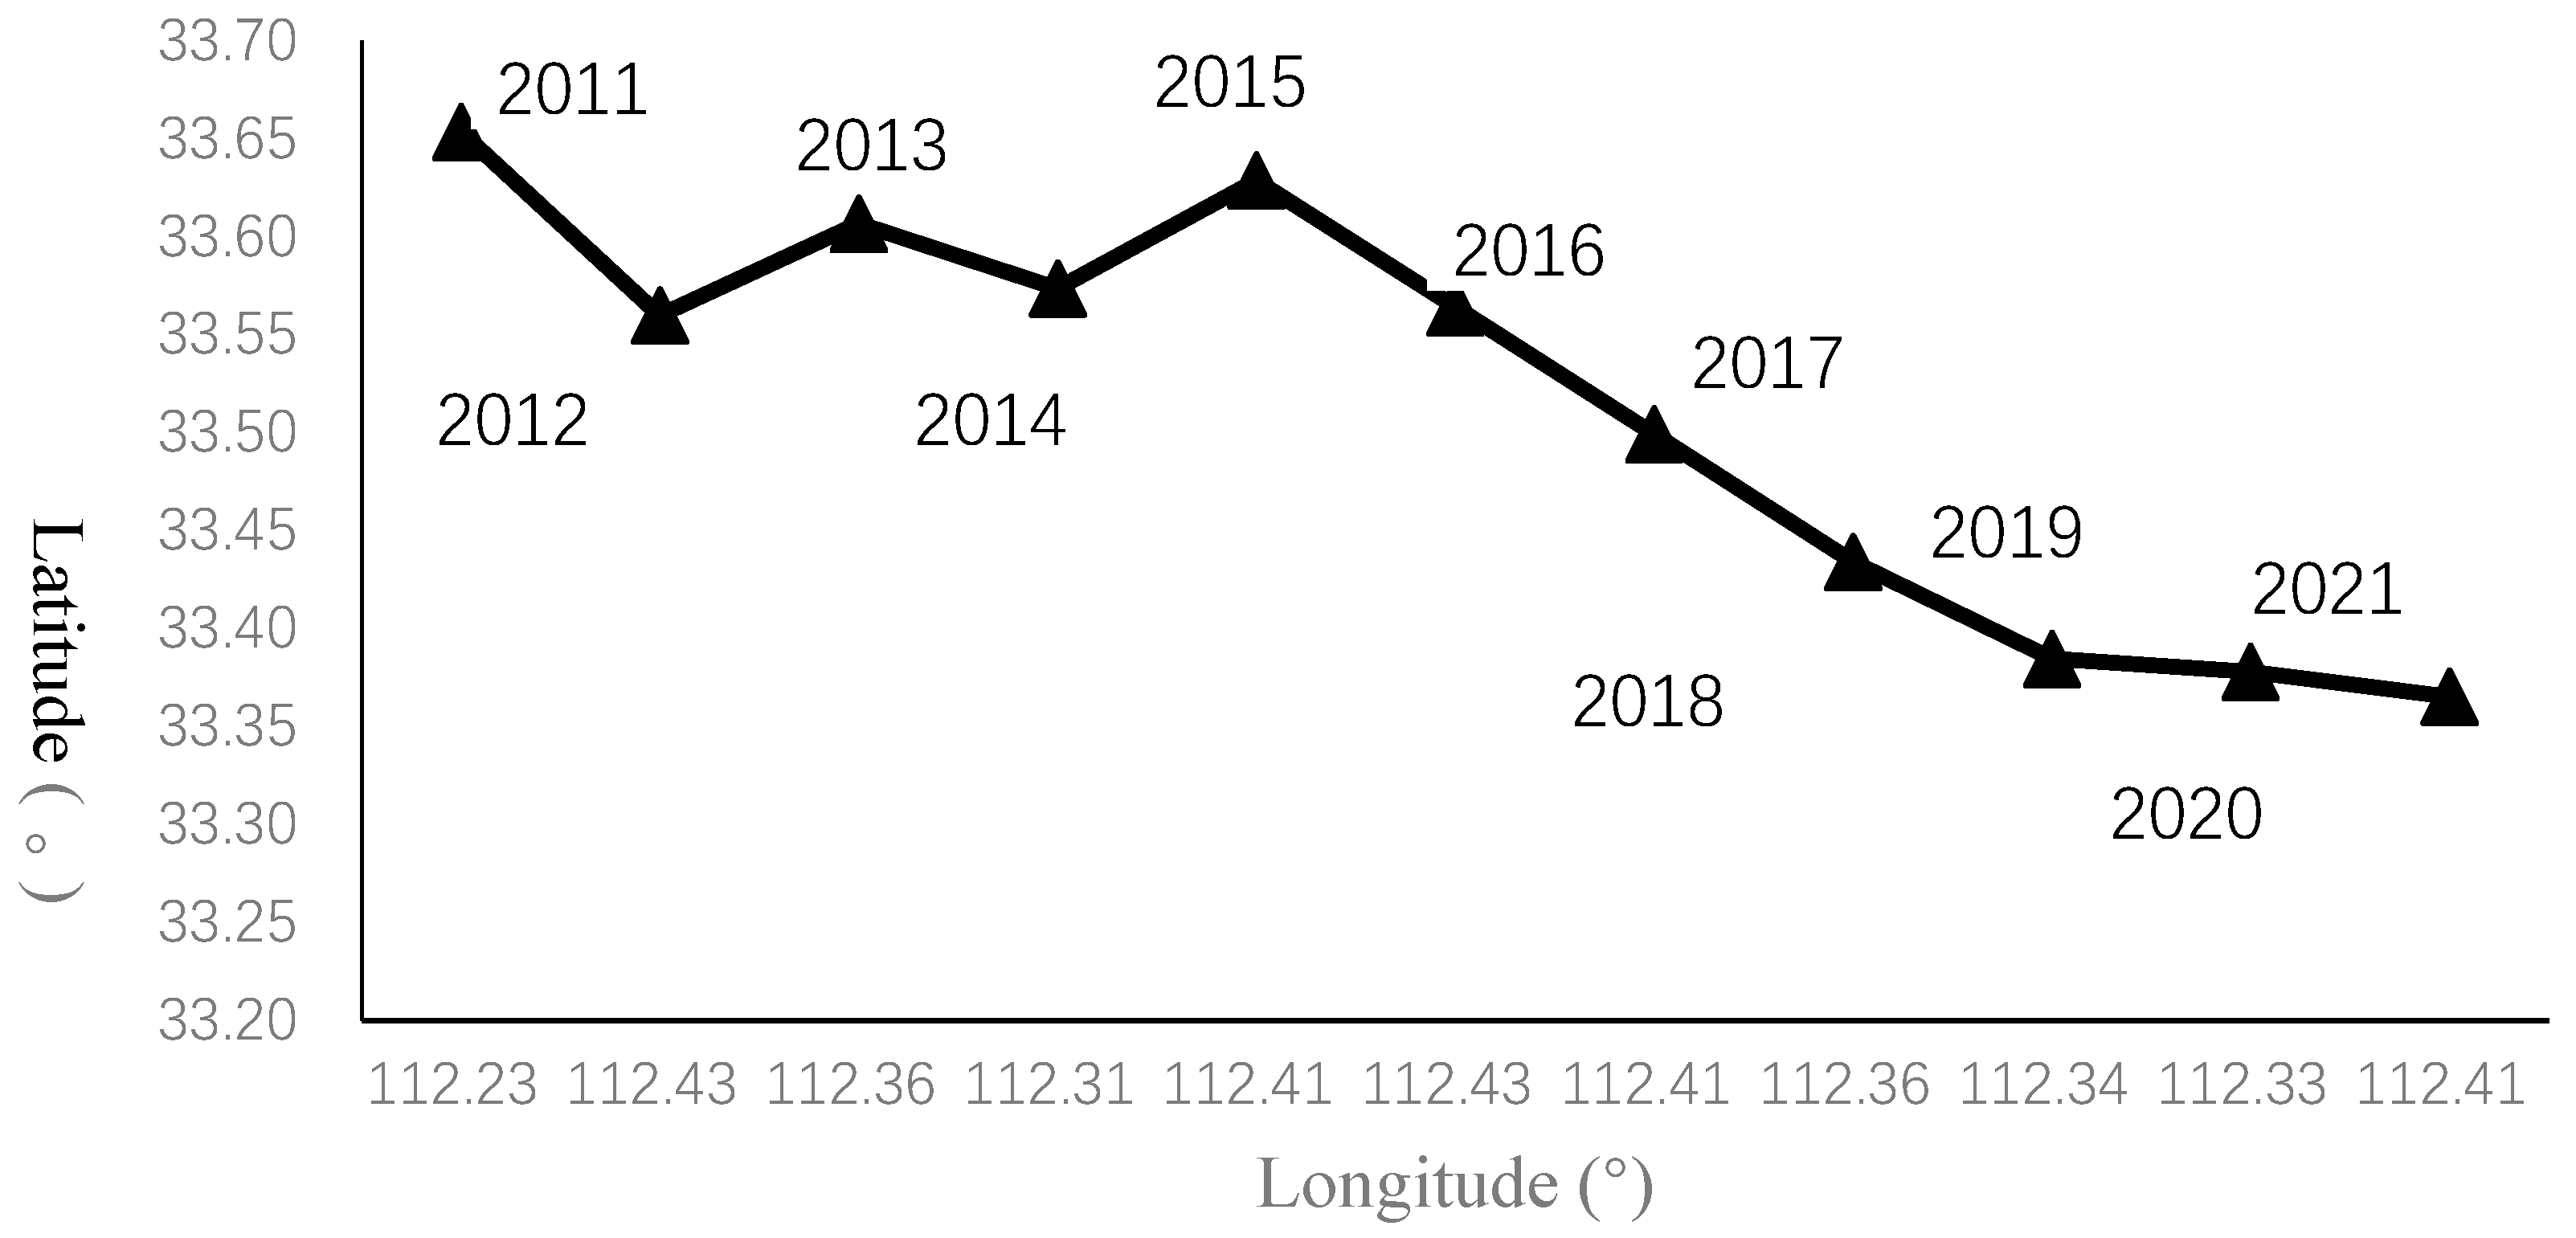
4.3. Gravity Center Migration Analysis

Based on calculating the gravity center of the coupling coordination degree, using Formulas (9) and (10), we have produced a migration trajectory map (Figure 5).
In 2011, the gravity center of the coupling coordination degree in China was located in the center of the Nanzhao County, Henan Province. From 2011 to 2016, the gravity center moved towards the southeast, northwest, southwest, northeast and southeast directions year by year. From 2016 to 2020, the gravity center constantly moved towards the southwest, and from 2020 to 2021, it moved towards the southeast, reaching the southeast of the Nanzhao County, Henan Province. From 2011 to 2021, the gravity center moved towards the southeast three times, towards the northwest once, towards the northeast once, and towards the southwest five times, with an overall direction towards the southeast, showing that the influence of the southeast of China on the coupling coordination degree has been increasing.
The gravity center of the coupling coordination degree has moved in both the longitudinal and latitudinal directions (Table 3). However, the displacement in the latitudinal direction is notably greater than that in the longitudinal direction, indicating a more pronounced trend in the north–south direction. The widening disparity in coupling coordination primarily occurs in the north–south direction. In terms of the moving distance of the gravity center, the distances moved in 2011–2012, 2012–2013, 2014–2015, and 2020–2021 are relatively far, accounting for 26.09%, 9.93%, 13.47%, and 9.88% of the total moving distance, respectively.

4.4. Analysis of Driving Factors

The coupling coordination between RII and NU is a complex dynamic process that requires various human, material, and financial inputs. It should be based on a reasonable industrial structure and safeguarded by improving agricultural production efficiency. In addition, external factors such as government support and foreign market stimulation are also essential. For the above considerations, based on correlative references, we take the coupling coordination degree as the explained variable and select explanatory variables from the aspects of economic development level, human capital, industrial structure, transportation conditions, government support capacity, the degree of opening up to the outside world, financial support level, and agricultural mechanization level. Among them, the level of economic development is measured by per capita GDP( x 1 ) and regional GDP index( x 2 ); human capital is represented by the proportion of students in colleges and universities to the resident population of the province ( x 3 ); industrial structure is represented by the proportion of the total output value of the secondary and tertiary industries to GDP( x 4 ); transportation conditions are measured by the road network density ( x 5 ); the government support capacity is measured by the proportion of government fiscal expenditure to GDP( x 6 ); the degree of opening up to the outside world is represented by the proportion of total import and export values of each province to GDP( x 7 ); the financial support level is measured by the proportion of financial institution loan balance to GDP ( x 8 ); the agricultural mechanization level is measured by the total power of agricultural machinery per unit of sown area( x 9 ). A geographical detector is used to analyze the driving factors and their interactions that influence the coupling coordination degree.

4.4.1. Identification Analysis of Driving Factors

Using 2011 and 2021 as the study years, we take the aforementioned nine variables as detection factors and obtain the q value using the geographical detector (Table 4). Except for x 2 , x 3 , and x 7 , the explanatory power of the other factors has passed the significance test at 5% or 1% level.
The proportion of government fiscal expenditure to GDP( x 6 ) and the proportion of financial institution loan balance to GDP( x 8 ) are the dominant factors affecting the coupling coordination degree, with their q values both above 0.4. The proportion of the total output value of the secondary and tertiary industries to GDP( x 4 ), per capita GDP( x 1 ), and the total power of agricultural machinery per unit of sown area( x 9 ) are also key driving factors, with their q values ranging from 0.3 to 0.4 on average. The influence of transportation line density ( x 5 ) is relatively weak, with q values below 0.3.
Over time, the impact of each significant factor has undergone some changes. The q value of x 6 rose from 0.437 in 2011 to 0.464 in 2021, showing that the government’s guidance and support are pivotal for the coordinated development of RII and NU in China. Especially against the backdrop of the current economic slowdown in China, the government can foster the coordinated development of RII and NU through improving infrastructure and the introduction of more market entities, utilizing fiscal guidance and other strategies.
The q value of x 8 rose from 0.406 in 2011 to 0.459 in 2021. This suggests that as China has placed greater emphasis on RII and NU recently, the country’s financial support for these two areas has been consistently enhanced. Both RII and NU necessitate substantial investment, making financial support crucial. Consequently, the influence of financial support on coupling coordination degree is bound to grow.
The q value of x 4 rose from 0.378 in 2011 to 0.437 in 2021, suggesting that the optimization and upgrading of the industrial structure have an increasing impact on coupling coordination. The primary reason may be that on the one hand, the development of the secondary and tertiary industries serves as the bedrock for RII because developed secondary and tertiary industries are important conditions for RII to achieve high-quality development; on the other hand, the development of the secondary and tertiary industries can provide robust financial support for urbanization, draw more individuals to work and live in urban areas, promote the integrated development of urban and rural areas, and thus improve the overall level of urbanization.
The q value of x 1 has risen from 0.351 in 2011 to 0.414 in 2021, suggesting that the impact of economic development on the coupling coordination between RII and NU is becoming more pronounced. The main reason may be that the market mechanism in economically developed regions is more ideal and its role is more fully played; RII and NU have stronger endogenous motivation, making it more possible to achieve coupling coordination between the two.
The q value of x 9 has increased from 0.269 in 2011 to 0.401 in 2021, indicating that the increasing agricultural mechanization degree has an increasing impact on coupling coordination. The main reason may be that the agricultural mechanization degree will improve agricultural labor productivity and land resource utilization, thereby enhancing RII. On the other hand, it is conducive to freeing up rural surplus labor from the land, thus providing sufficient labor for NU. Moreover, in recent years, as the scale of land circulation has been expanding, the construction of high-standard basic farmlands has been continuously promoted, and the conditions for farmers’ urbanization have been increasingly relaxed in China; the boosting effect of agricultural mechanization on RII and NU has also continuously been released and improved.
The q value of x 5 has increased from 0.18 in 2011 to 0.283 in 2021, which indicates that the influence of transportation line density on the coupling coordination degree is improved. The main reason may be that the transportation line density reflects the convenience of transportation. With the continuous advancement of the urban–rural coordinated development strategy in recent years, various production factors have been circulating more frequently between urban and rural areas. The improvement of transportation conditions can effectively reduce the circulation cost of production factors, improve the efficiency of production factor allocation, and thus enhance the coupling coordination degree.

4.4.2. Interaction Detection Analysis

To further analyze the impact of interactions among different driving factors on coupling coordination degree, taking 2011 and 2021 as research samples, we select the top five factors in terms of q value for analysis. The detection results (Table 5) indicate that the driving factors are not independent of each other but closely related. The q values resulting from the interactions between driving factors are greater than those of a single factor. The types of interaction results are nonlinear enhancement and dual-factor enhancement, suggesting that the coupling coordination between RII and NU in China is the outcome of multiple factors acting together.
The interactions between x 6 , x 8 , and other factors have relatively large impacts, which once again demonstrates that strong government promotion and financial support are crucial for coupling coordination. The interactions between x 4 and other factors also have relatively large impacts, which indicates that developed secondary and tertiary industries are the prerequisite for the extension of rural industrial chains and the expansion of agricultural functions, as well as the economic foundation for NU. A reasonable industrial structure can significantly accelerate the coupling coordination development between RII and NU. Compared to 2011, the interaction values of each driving factor have increased in 2021, indicating that to improve the coupling coordination degree between RII and NU in China, comprehensive measures must be taken from multiple aspects.

5. Conclusions and Discussion

5.1. Conclusions

By constructing the evaluation index system, a coupling coordination degree model is introduced to measure the coupling coordination level between RII and NU in China from 2011 to 2021, an exploratory spatial analysis method and a gravity center model are used to explore the characteristics of the spatial–temporal differentiation of the coupling coordination degree, and a geographical detector model is used to identify the main driving factors and their interactions that affect the spatial–temporal variation of the coupling coordination degree. The conclusions are as follows:
Firstly, the regional differences in the coupling coordination degree between RII and NU in China are significant, with the highest level in the eastern region, followed by the central region, and the lowest level in the western region. From the temporal evolution perspective, from 2011 to 2021, the coupling coordination degree between RII and NU in the eastern and central economic regions has been continuously improving year by year, except for 2015; this has also increased year by year in the western economic region. Compared with the central and western economic regions, the coupling coordination degree of the eastern economic region is higher, and the gap between the eastern region and the central and western regions is on the rise.
Secondly, the results of the global spatial autocorrelation analysis show that the coupling coordination degree exhibits significant spatial autocorrelation, with distinct spatial clustering characteristics. The positive spatial correlation exhibits a trend of increasing first and then decreasing. The analysis of local spatial autocorrelation reveals that the majority of provinces are located in the first or third quadrant. Compared to 2011, there is not much change in 2021, with most provinces displaying characteristics of high–high or low–low clustering. The coupling coordination has resulted in a stable “layered solidification” pattern.
Thirdly, in 2011, the gravity center of the coupling coordination degree was located in the center of the Nanzhao County, Henan Province. From 2011 to 2021, the gravity center moved towards the southeast three times, towards the northwest once, towards the northeast once, and towards the southwest five times, moving predominantly southeastward. The influence of the southeastern regions of China on the coupling coordination degree has been increasing. The gravity center of the coupling coordination degree has moved in both the longitudinal and latitudinal directions. However, the displacement in the latitudinal direction is notably greater than that in the longitudinal direction, indicating a more pronounced trend in the north–south direction.
Fourthly, according to the results of the geographical detector analysis, economic development level, industrial structure, transportation conditions, government support capacity, financial support level, and agricultural mechanization level are significant driving factors behind the spatiotemporal variation of coupling coordination. The interaction between these key driving factors is characterized by nonlinear enhancement and dual-factor enhancement.

5.2. Discussion

The above research conclusions have the following implications for relevant policy practice in China and some developing countries.
(1) The significance of the coupling coordination development between RII and NU must be highly considered. While implementing existing relevant policies, the government should strengthen the top-level design and effectively guide the direction for coupling coordination. The coupling coordination between RII and NU must overcome the limitations of “seeing the trees but not the forest”, define specific target tasks, roadmaps and time schedules, and perfect relevant monitoring, evaluation mechanisms, and government performance assessment mechanisms. From the above analysis, it can be seen that the industrial structure, financial support, social services, and infrastructure development are key driving factors for coupling coordination. Therefore, it is important to strengthen the design and supply of relevant policies, such as land use policies, financial support policies, strategic emerging industry cultivation policies, social service policies, etc.
(2) The government should attach importance to building a regional cooperation platform and improving regional linkage mechanisms. The coupling coordination between RII and NU in China generally exhibits significant spatial correlation. Therefore, we should strengthen regional cooperation and linkage. The developed eastern provinces should actively create demonstration areas and continuously strengthen assistance to provinces with low coupling coordination. The central and western regions should actively learn from developed areas and continuously improve policy mechanisms to promote coupling coordination. Moreover, the government should focus on building regional cooperation and sharing platforms in agricultural science and technology innovation, agricultural finance and insurance, agricultural brand incubation, rural industry talents, and urban agglomeration construction to achieve mutual benefit.
(3) There is a mutually reinforcing and mutually restrictive interactive relationship between RII and NU, and the government should lay stress on the positive interaction between RII and NU. On the one hand, we should promote the optimization and upgrade of regional industrial structure through RII, promote the free flow of production factors between urban and rural areas, and facilitate the local urbanization of farmers; on the other hand, we should persist in promoting the development of characteristic small towns and industrial parks, advance the integration of urban and rural infrastructure and public services, and offer space and opportunities for RII to grow.
Compared with previous studies, the paper’s innovations are as follows: Firstly, the article comprehensively analyzes the interactive relation between RII and NU and constructs a theoretical model of their interactive mechanism, which offers theoretical guidance for their efficient interaction, mutual promotion, and synergetic development. Secondly, the study reveals the spatial–temporal differentiation characteristics of the coupling coordination degree between RII and NU in China and its driving factors, offering decision-making references for the design and innovation of relevant policies in China and other developing countries.
Although the study obtains some valuable conclusions, there are still some limitations. Firstly, due to the limited availability of data, the evaluation index system in this article does not cover indices such as policy support, public satisfaction, public happiness levels, etc. The evaluation index system should be further improved in the future. Secondly, there are many methods for determining the index weight, but this article only uses the entropy method. In the future, a combination of subjective and objective weighting methods can be considered to improve the objectivity and accuracy of the weight. Thirdly, the selection of driving factors needs to be optimized; factors such as the impact of the COVID-19 pandemic have not been considered, and the driving factor system should be further supplemented and improved in the future. Finally, this study conducts research only at the provincial level; in the future, we can conduct research at smaller scales, such as prefectural-level cities, counties, and townships, enhancing the practicality of the research results.

Author Contributions

All authors contributed equally to this work. Specifically, Y.W. developed the original idea for the study, designed the methodology, and drafted the manuscript, which was revised by Y.T. and X.S. All authors have read and agreed to the published version of the manuscript.

Funding

This research was funded by the National Social Science Foundation of China: research on policy coordination of rural governance and targeted poverty alleviation in rural revitalization in China, grant number (18BZZ077).

Institutional Review Board Statement

Not applicable.

Informed Consent Statement

Not applicable.

Data Availability Statement

The data presented in this study are available on request from the corresponding author.

Conflicts of Interest

The authors declare no conflicts of interest.

References

  1. Rosenberg, N. Technological Change in the Machine Tool Industry, 1840–1910. J. Econ. Hist. 1963, 23, 414–443. [Google Scholar] [CrossRef]
  2. Zhang, H.; Wu, D. The Impact of Transport Infrastructure on Rural Industrial Integration: Spatial Spillover Effects and Spatio-Temporal Heterogeneity. Sustainability 2022, 11, 1116. [Google Scholar] [CrossRef]
  3. Su, Y.; You, Y.; Wang, Z. Convergence Development of Primary, Secondary and Tertiary Industries: Theoretical Discussion, Situation Analysis and Suggestions. China Soft Sci. 2016, 308, 17–28. [Google Scholar]
  4. Lai, Y.; Yang, H.; Qiu, F.; Dang, Z.; Luo, Y. Can Rural Industrial Integration Alleviate Agricultural Non-Point Source Pollution? Evidence from Rural China. Agriculture 2023, 13, 1389. [Google Scholar] [CrossRef]
  5. Imamura, N. The Development Logic of East Asian Agriculture: A Comparison of China, Korea, Taiwan and Japan; The Association of Agriculture, Forestry and Fishing Village Culture: Tokyo, Japan, 1994. [Google Scholar]
  6. Park, J.; Lee, S. Smart Village Projects in Korea: Rural Tourism, 6th Industrialization, and Smart Farming. In Smart Villages in the EU and Beyond; Emerald Publishing Limited: Bingley, UK, 2019. [Google Scholar]
  7. Lee, H.; Kim, K. Determinants of Farmers’ Participation and Performance in Tertiary Industrialization Activities. Agric. Econ. Res. 2017, 58, 1–24. [Google Scholar]
  8. Runck, B.; Joglekar, A.; Silverstein, K.; Chan-Kang, C.; Pardey, P.G.; Wilgenbusch, J.C. Digital Agriculture Platforms: Driving Data—Enabled Agricultural Innovation in A World Fraught with Privacy and Security Concerns. Agron. J. 2022, 114, 2635–2643. [Google Scholar] [CrossRef]
  9. Wang, R.; Shi, J.; Hao, D.; Liu, W. Spatial–Temporal Characteristics and Driving Mechanisms of Rural Industrial Integration in China. Agriculture 2023, 13, 747. [Google Scholar] [CrossRef]
  10. Hao, H.; Liu, C.; Xin, L. Measurement and Dynamic Trend Research on the Development Level of Rural Industry Integration in China. Agriculture 2023, 13, 2245. [Google Scholar] [CrossRef]
  11. Liu, T.; Qi, Y.; Cao, G.; Liu, H. Spatial Patterns, Driving Forces, and Urbanization Effects of China’s Internal Migration: County Level Analysis Based on the 2000 and 2010 Censuses. Geogr. Sci. 2015, 25, 236–256. [Google Scholar] [CrossRef]
  12. Ma, L.; Cheng, W.; Qi, J. Coordinated Evaluation and Development Model of Oasis Urbanization from the Perspective of New Urbanization: A Case Study in Shandan County of Hexi Corridor, China. Sustain. Cities Soc. 2018, 39, 78–92. [Google Scholar] [CrossRef]
  13. Li, G.; Zhang, X. The Spatial–Temporal Characteristics and Driving Forces of the Coupled and Coordinated Development between New Urbanization and Rural Revitalization. Sustainability 2023, 15, 16487. [Google Scholar] [CrossRef]
  14. Murata, Y. Rural-urban Interdependence and Industrialization. J. Dev. Econ. 2002, 68, 1–34. [Google Scholar] [CrossRef]
  15. Hermelin, B. The Urbanization and Suburbanization of the Service Economy: Producer Services and Specialization in Stockholm. Geogr. Ann. 2007, 89, 59–74. [Google Scholar] [CrossRef]
  16. Pandy, S. Nature and Determinants of Urbanization in A Developing Economy: The Case of India. Econ. Dev. Cult. Change 1997, 25, 265–278. [Google Scholar] [CrossRef]
  17. Davis, J.; Henderson, J. Evidence on the Political Economy of the Urbanization Process. J. Urban Econ. 2003, 53, 98–125. [Google Scholar] [CrossRef]
  18. Moomaw, R.; Shatter, A. Urbanization and Economic Development: A Bias toward Large Cities? J. Urban Econ. 1996, 40, 13–37. [Google Scholar] [CrossRef] [PubMed]
  19. Zhang, D.; Fan, W.; Chen, J. The Synergistic Effect of Agricultural Industry Integration, Green Urbanization and Balanced Development between Urban and Rural Areas: Empirical Analysis Based on Linear and Non-linear Relations. Chongqing Soc. Sci. 2021, 5, 53–69. (In Chinese) [Google Scholar]
  20. Li, X.; Ran, G. How Does the Rural Industrial Convergence Development Affect the Urban–rural Income Gap?—Based on the Dual Perspective of Rural Economic Growth and Urbanization. J. Agrotech. Econ. 2019, 8, 17–28. [Google Scholar]
  21. Zhang, Y.; Liu, Y. The Impact of Rural Industrial Integration on Agricultural Carbon Emissions: Evidence from China Provinces Data. Sustainability 2024, 16, 680. [Google Scholar] [CrossRef]
  22. Michaels, G.; Rauch, F.; Redding, S.J. Urbanization and Structural Transformation. Q. J. Econ. 2012, 127, 535–586. [Google Scholar] [CrossRef]
  23. Chen, M.; Zhou, Y.; Huang, X.; Ye, C. The Integration of New-type Urbanization and Rural Revitalization Strategies in China: Origin, Reality and Future Trends. Land 2021, 10, 207. [Google Scholar] [CrossRef]
  24. Moir, H. Relationships between Urbanization Levels and the Industrial Structure of the Labor Force. Econ. Dev. Cult. Chang. 1976, 25, 123–135. [Google Scholar] [CrossRef]
  25. Fang, J.; Huang, P. Analysis of Rural Urbanization and Innovative Mode of Industrial Agglomeration. Theory Reform 2007, 5, 93–95. (In Chinese) [Google Scholar]
  26. Li, Y.; Li, Y.; Zhou, Y.; Shi, Y.; Zhu, X. Investigation of A Coupling Model of Coordination between Urbanization and the Environment. J. Environ. Manag. 2012, 15, 127–133. [Google Scholar] [CrossRef] [PubMed]
  27. Cong, H.; Zou, D. The Research on the Mechanism and Spatial–temporal Differentiation of the Coupling Coordination Development based on Industrial Cluster Agglomeration. Cluster Comput. 2017, 20, 195–213. [Google Scholar] [CrossRef]
  28. Tang, Z. An Integrated Approach to Evaluating the Coupling Coordination between Tourism and the Environment. Tour. Manag. 2015, 46, 11–19. [Google Scholar] [CrossRef]
  29. Li, X.; Zhao, M. Analysis of Promoting Local Urbanization through Rural Industrial Integration. Agric. Econ. 2017, 11, 83–85. (In Chinese) [Google Scholar]
  30. Zeng, L.; Chen, S.; Fu, Z. Impact of Large-scale Land Management on Rural Industrial Integrated Development and Mechanism. Resour. Sci. 2022, 44, 1560–1576. (In Chinese) [Google Scholar] [CrossRef]
  31. Brauw, A.; Rozelle, S. Household Investment through Migration in Rural China. Dep. Econ. Work. 2003, 21, 621–626. [Google Scholar]
  32. Zhang, Y.; Zhou, Y. Digital Inclusive Finance, Traditional Financial Competition and Rural Industrial Integration. Agric. Technol. Econ. 2021, 317, 68–82. [Google Scholar]
  33. Li, Y.; Zhang, R.; Liu, B. The Measure Research of Evaluation Index System and Model on Regional Township Process. Syst. Sci. Compr. Stud. Agric. 2006, 22, 161–164. [Google Scholar]
  34. Wang, X.; Yao, W.; Luo, Q.; Yun, J. Spatial Relationship between Ecosystem Health and Urbanization in Coastal Mountain City, Qingdao, China. Ecol. Inform. 2024, 79, 102458. [Google Scholar] [CrossRef]
  35. Sun, X.; Zhang, Z. Coupling and Coordination Level of the Population, Land, Economy, Ecology and Society in the Process of Urbanization: Measurement and Spatial Differentiation. Sustainability 2021, 13, 3171. [Google Scholar] [CrossRef]
  36. Liu, S.; Wu, P. Coupling Coordination Analysis of Urbanization and Energy Eco-efficiency: A Case Study on the Yangtze River Delta Urban Agglomeration. Environ. Sci. Pollut. Res. 2023, 30, 63975–63990. [Google Scholar] [CrossRef] [PubMed]
  37. Liu, R.; Zhang, J.; Cai, S.; Yu, Y.; Mao, Y. Study on Coupling Coordination Relationship between New Urbanization and Urban Residents’ Quality of Life in Urban Agglomeration of Middle Reaches of Yangtze River. Resour. Environ. Yangtze Basin 2023, 32, 1349–1364. (In Chinese) [Google Scholar]
  38. Chen, D.; Zhong, L.; Fan, J.; Yu, H.; Yang, D.; Zeng, Y. Function Evaluation and Structure Analysis of Qinghai-Tibet Plateau National Park Cluster. Acta Geogr. Sin. 2022, 77, 196–213. (In Chinese) [Google Scholar]
  39. Chi, G.; Qi, F.; Zhang, N. The City’s Ecosystem Evaluation Model based on Optimal Combination Weights and Its Application. Oper. Res. Manag. Sci. 2012, 21, 183–191. (In Chinese) [Google Scholar]
  40. Bi, T.; Zhang, M. Research on Spatiotemporal Changes and Control Strategy of Carbon Emission in Shenyang. Sustainability 2023, 15, 12172. [Google Scholar] [CrossRef]
  41. Wu, H. Evolvement and Comparative Analysis of Population Gravity Center and Economic Gravity Center in Qinhuangdao City based on GIS. Adv. Mater. Res. 2014, 955–959, 3819–3823. [Google Scholar]
  42. Wang, J.; Li, X.; Christakos, G.; Liao, Y.; Zhang, T.; Gu, X.; Zheng, X. Geographical Detectors-based Health Risk Assessment and Its Application in the Neural Tube Defects Study of the Heshun Region, China. Int. J. Geogr. Inf. Sci. 2010, 24, 107–127. [Google Scholar] [CrossRef]
  43. He, B.; Du, X.; Lu, Y.; Chen, Q.; Lan, R. An Improved Approach for Measuring the Coupling Relationship between New Type Urbanization and Low Carbon Development in China. Ecol. Indic. 2024, 158, 111383. [Google Scholar] [CrossRef]
Figure 1. Mechanism of coupling coordination between RII and NU.
Sustainability 16 03235 g001
Figure 2. The spatial distribution map of coupling coordination degree between RII and NU.
Sustainability 16 03235 g002
Figure 3. The coupling coordination degree between RII and NU in the three economic regions.
Sustainability 16 03235 g003
Figure 4. Moran scatter plot.
Sustainability 16 03235 g004
Figure 5. The migration trajectory of the gravity center from 2011 to 2021.
Sustainability 16 03235 g005
Table 1. Evaluation index system.
Target LayerCriterion LayerIndex LayerDirectionWeight
RIIThe extension of agricultural industry chainsRatio of agricultural product processing revenue to total agricultural output value+0.064
Ratio of fixed assets investment in agricultural product processing industry to fixed assets investment in agriculture+0.303
Number of professional farmers’ cooperatives per ten thousand people in rural areas+0.025
The expansion of agricultural multi-functionRatio of annual operating income from leisure agriculture to total agricultural output+0.084
Number of significant agricultural cultural heritage+0.074
Proportion of Taobao villages to administrative villages+0.259
The development of agricultural service industryProportion of added value of service industry to the added value of agriculture, forestry, animal husbandry, and fishery industries+0.011
Annual growth rate of agricultural loans+0.054
Ratio of agricultural premium income to the added value of the primary industry+0.067
The benefits of industrial integrationGrowth rate of per capita disposable income of rural residents+0.006
Proportion of rural residents’ wage and property income in total income+0.007
Ratio of disposable income between rural and urban residents+0.001
Added value of the primary industry per labor+0.016
Added value of primary industry per unit of farmland+0.029
NUPopulation urbanizationPercentage of urban population at the end of the year+0.012
Proportion of employed population in the secondary and tertiary industries+0.01
Population density of cities and towns+0.039
Economic urbanizationPer capita GDP+0.055
Per capita disposable income of urban residents+0.028
Proportion of the output value of the secondary and tertiary industries in GDP+0.001
Per capita public budget revenue+0.105
Economic density+0.56
Social urbanizationUrban registered unemployment rate-0.01
Number of doctors per 10,000 people+0.017
Number of hospital beds per 10,000 people+0.015
Number of books in public libraries per 100 people+0.088
Proportion of social security and employment expenditure in fiscal expenditure+0.017
Per capita built-up area+0.019
Ecological urbanizationPercentage of greenery coverage in urban+0.002
Per capita park green space area for urban residents+0.011
Urban sewage treatment rate+0.007
Treatment rate of domestic waste+0.004
Table 2. Global Moran’s I index.
Year M o r a n s   I z Value p Value
20110.3925.4280.000
20120.3805.2780.000
20130.4055.6210.000
20140.4045.6300.000
20150.4496.2270.000
20160.39755.5560.000
20170.3975.5530.000
20180.3845.3760.000
20190.3514.9290.000
20200.3534.9500.000
20210.32824.6090.000
Table 3. The gravity center of the coupling coordination degree.
YearCoordinates of Starting PointCoordinates of Terminal PointMoving DirectionMoving Distance (km)
2011–2012(112.23° E, 33.65° N)(112.43° E, 33.56° N)Southeast24.441
2012–2013(112.43° E, 33.56° N)(112.36° E, 33.60° N)Northwest9.300
2013–2014(112.36° E, 33.60° N)(112.31° E, 33.57° N)Southwest6.588
2014–2015(112.31° E, 33.57° N)(112.41° E, 33.63° N)Northeast12.620
2015–2016(112.41° E, 33.63° N)(112.43° E, 33.56° N)Southeast7.415
2016–2017(112.43° E, 33.56° N)(112.41° E, 33.50° N)Southwest7.354
2017–2018(112.41° E, 33.50° N)(112.37° E, 33.43° N)Southwest8.916
2018–2019(112.37° E, 33.43° N)(112.34° E, 33.38° N)Southwest6.170
2019–2020(112.34° E, 33.38° N)(112.33° E, 33.37° N)Southwest1.625
2020–2021(112.33° E, 33.37° N)(112.41° E, 33.36° N)Southeast9.257
Table 4. Factor detection results.
Driving Factors q in 2011 q in 2021 Mean   q
Per capita GDP ( x 1 )0.351 **0.414 ***0.382
Regional GDP index ( x 2 )0.1030.1130.108
Proportion of students in colleges and universities to the resident population of the province ( x 3 )0.1000.1070.104
Proportion of total output value of the secondary and tertiary industries to GDP ( x 4 )0.378 **0.437 ***0.407
Transportation line density ( x 5 )0.180 **0.283 **0.232
Proportion of government fiscal expenditure to GDP ( x 6 )0.437 ***0.464 ***0.451
Proportion of total import and export value of each province to GDP ( x 7 )0.1300.0090.069
Proportion of financial institution loan balance to GDP ( x 8 )0.406 ***0.459 ***0.433
Total power of agricultural machinery per unit of sown area ( x 9 )0.269 **0.401 ***0.335
Note: ** and *** represent significant levels at 5% and 1%, respectively.
Table 5. Interaction detection results.
Factor InteractionsYear 2011Year 2021
q Category q Category
x 1 x 4 0.386DE0.856NE
x 1 x 6 0.817NE0.896NE
x 1 x 8 0.803NE0.879NE
x 1 x 9 0.370DE0.434DE
x 4 x 6 0.836NE0.910NE
x 4 x 8 0.804NE0.902NE
x 4 x 9 0.386DE0.840NE
x 6 x 8 0.862NE0.926NE
x 6 x 9 0.735NE0.870NE
x 8 x 9 0.417DE0.464DE
Note: DE represents dual-factor enhancement, and NE represents nonlinear enhancement.
Disclaimer/Publisher’s Note: The statements, opinions and data contained in all publications are solely those of the individual author(s) and contributor(s) and not of MDPI and/or the editor(s). MDPI and/or the editor(s) disclaim responsibility for any injury to people or property resulting from any ideas, methods, instructions or products referred to in the content.

