
Analysis of the Interaction between Humans and Autonomous Vehicles Equipped with External Human–Machine Interfaces: The Effect of an Experimental Reward Mechanism on Pedestrian Crossing Behavior in a Virtual Environment
 , , , and
Abstract
:1. Introduction
2. Method
2.1. Participants
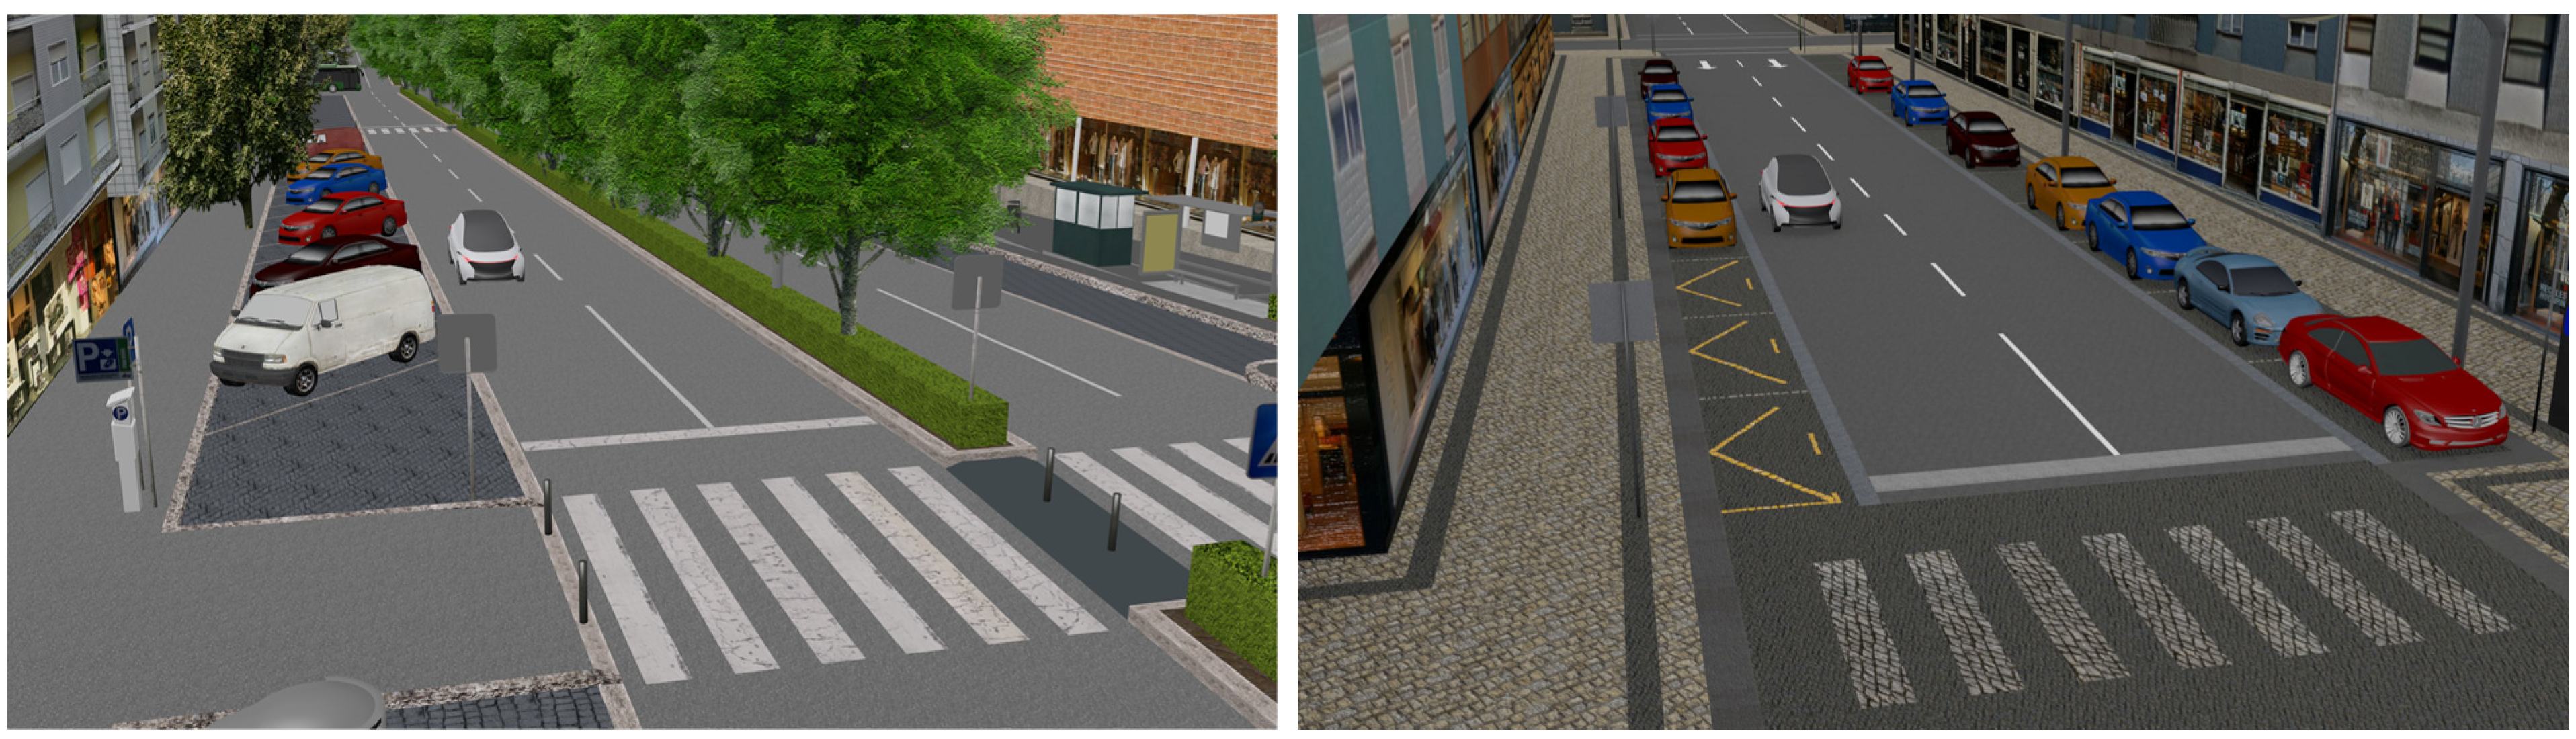
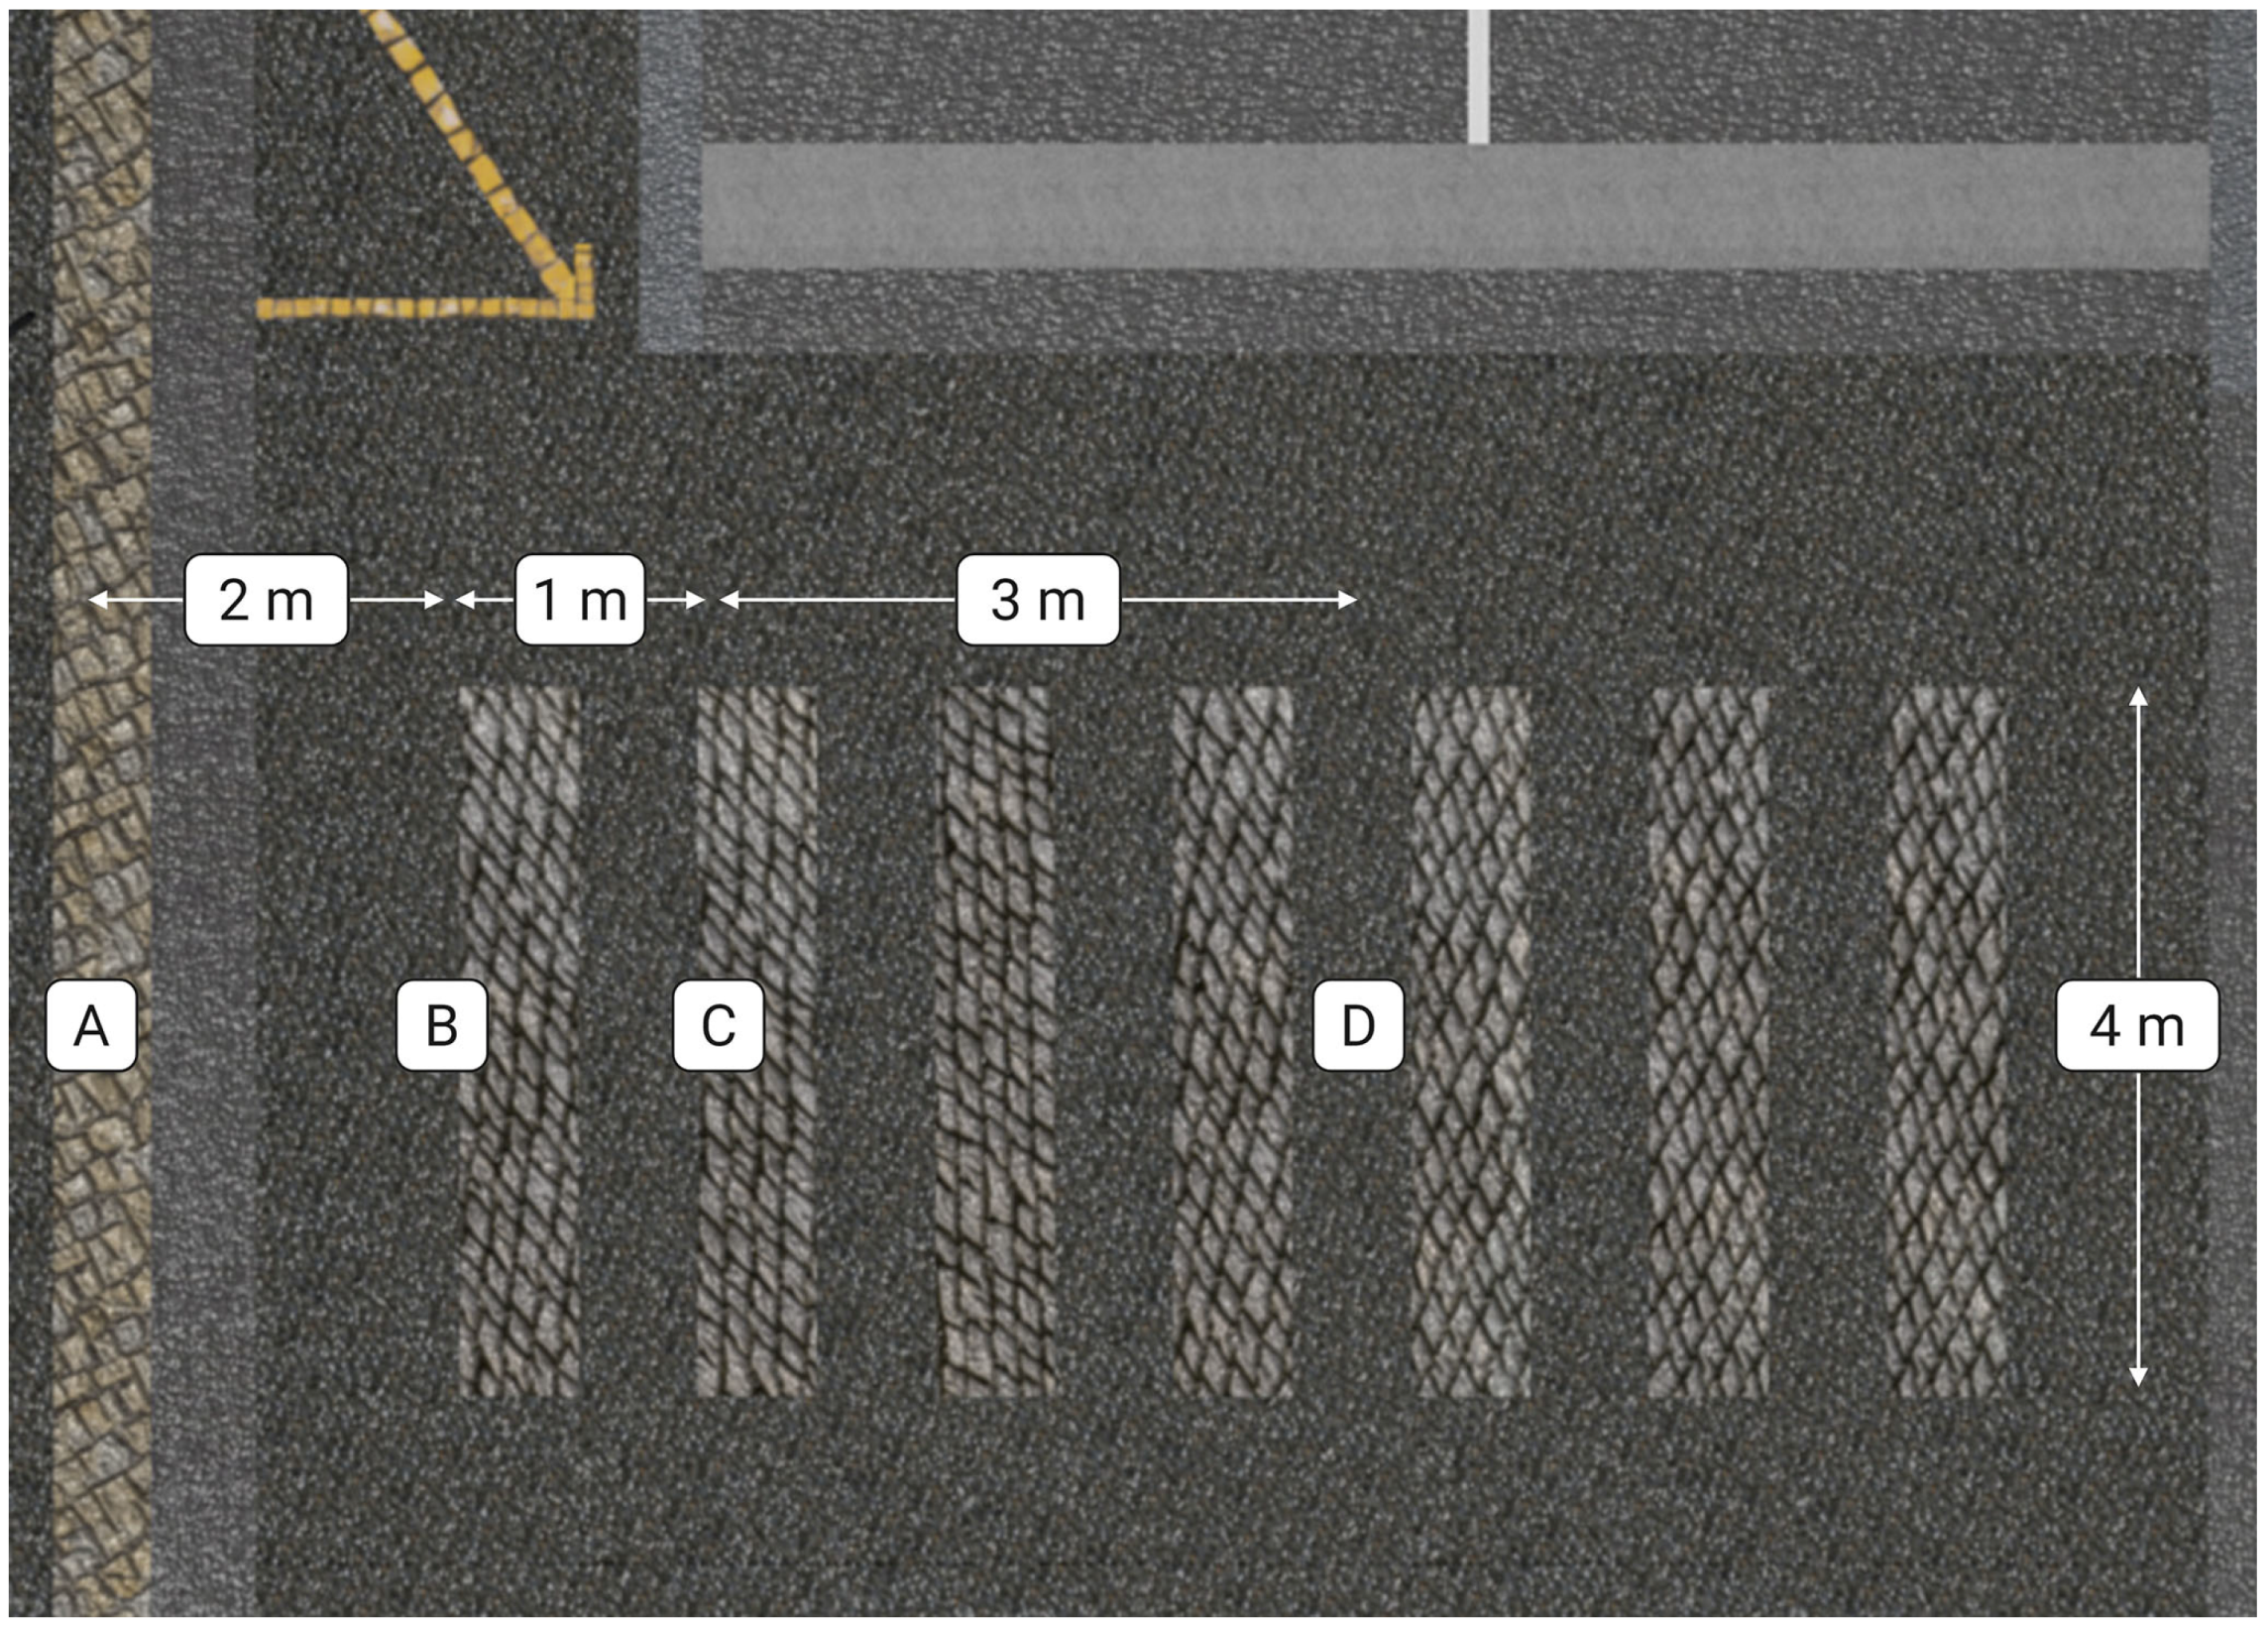
2.2. Simulator Setup and Virtual Environment
2.3. Experimental Design
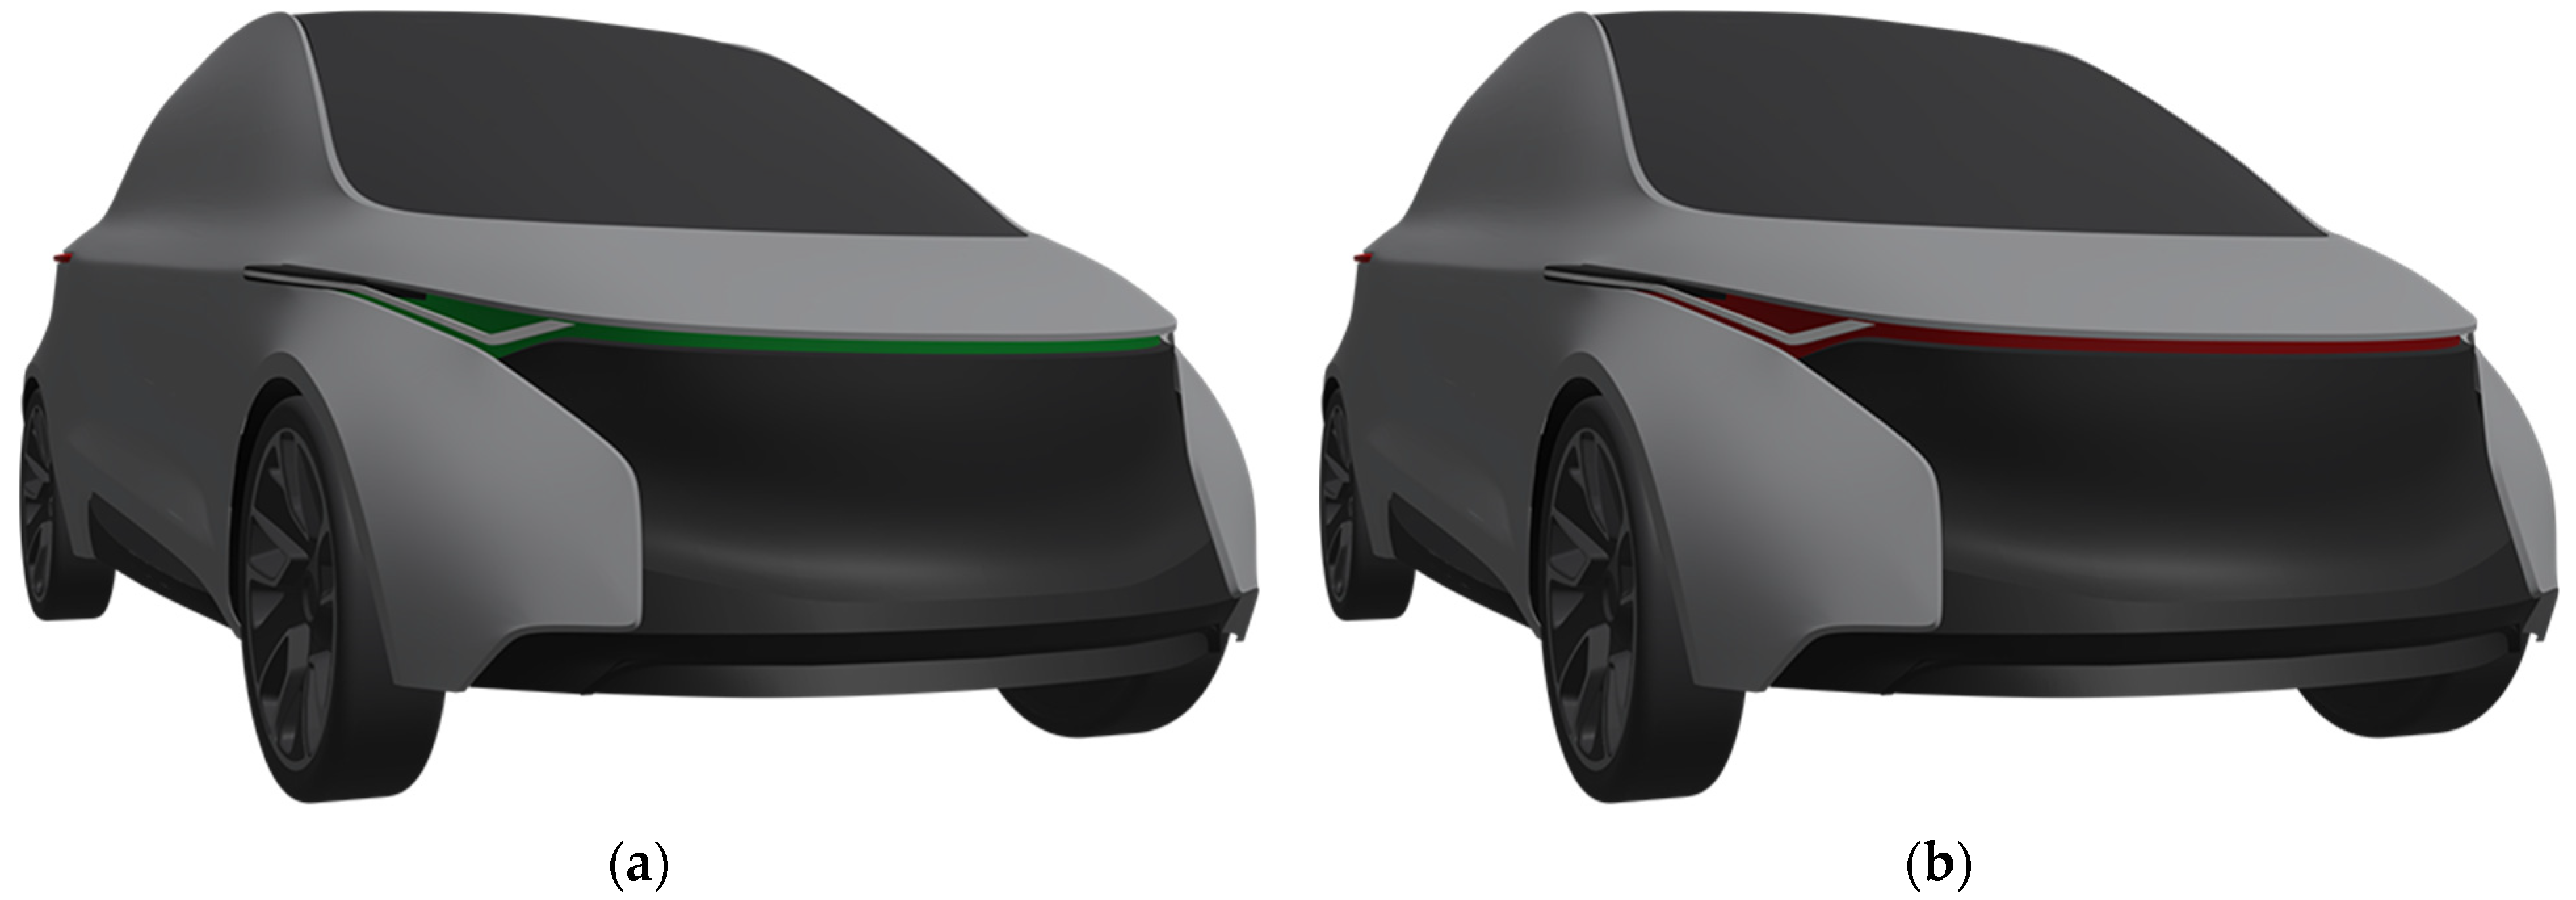
2.3.1. eHMI Design and Messages
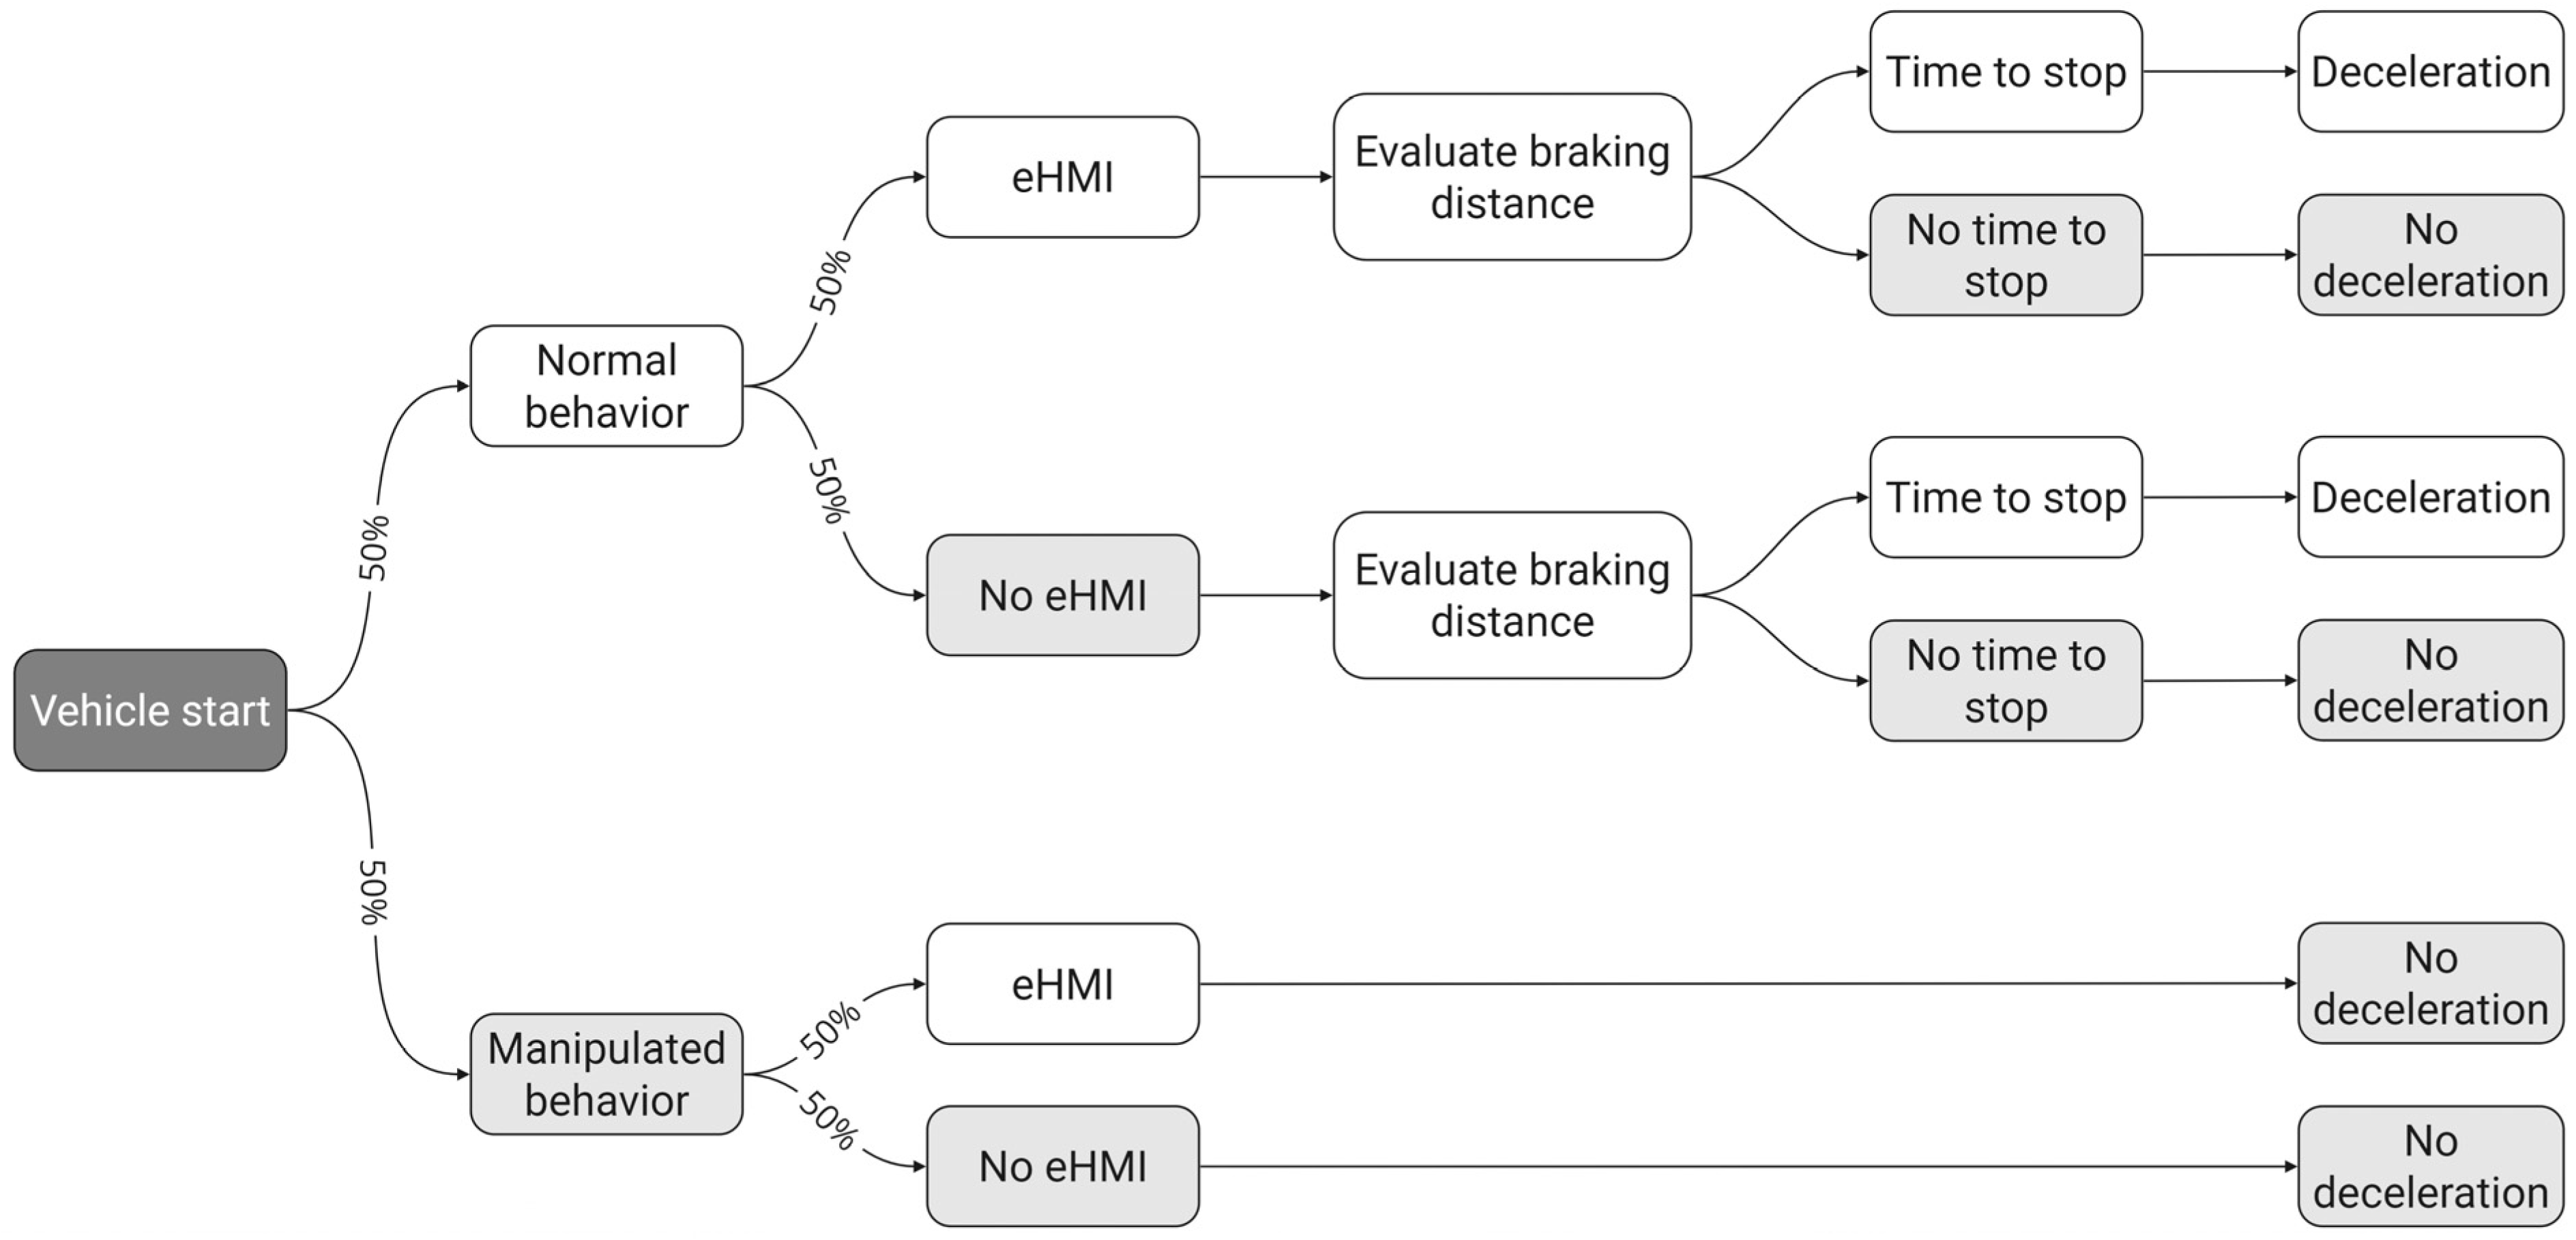
2.3.2. Vehicle Behavior
2.4. Experimental Procedure
2.4.1. Questionnaires
2.5. Statistical Analysis
3. Results
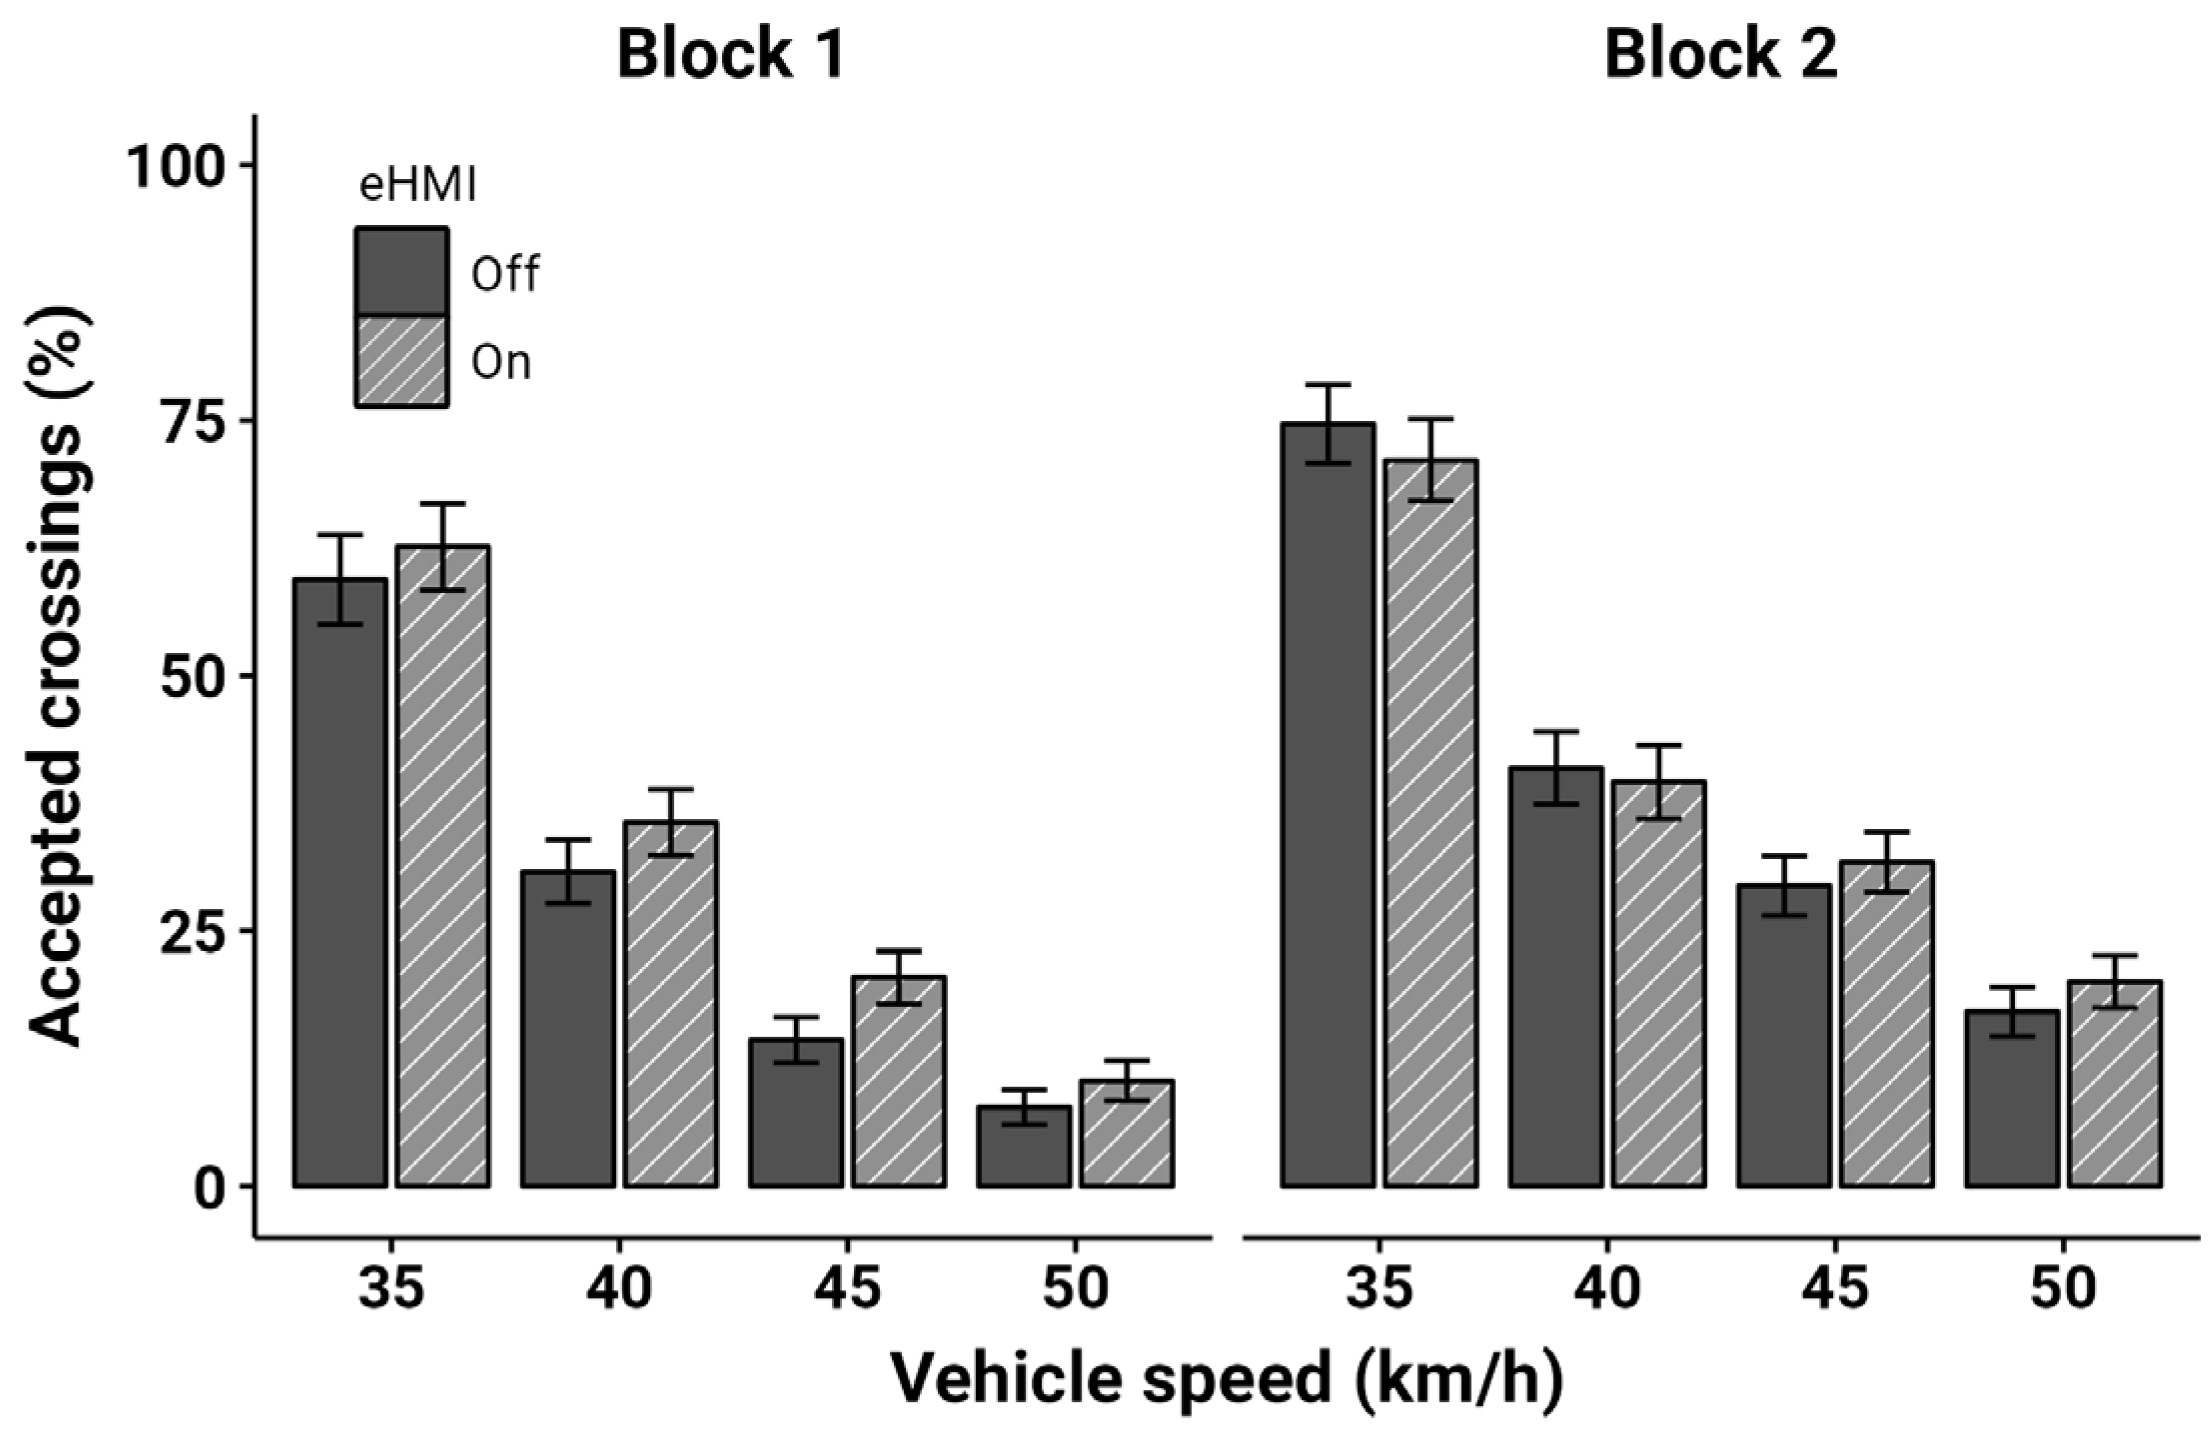
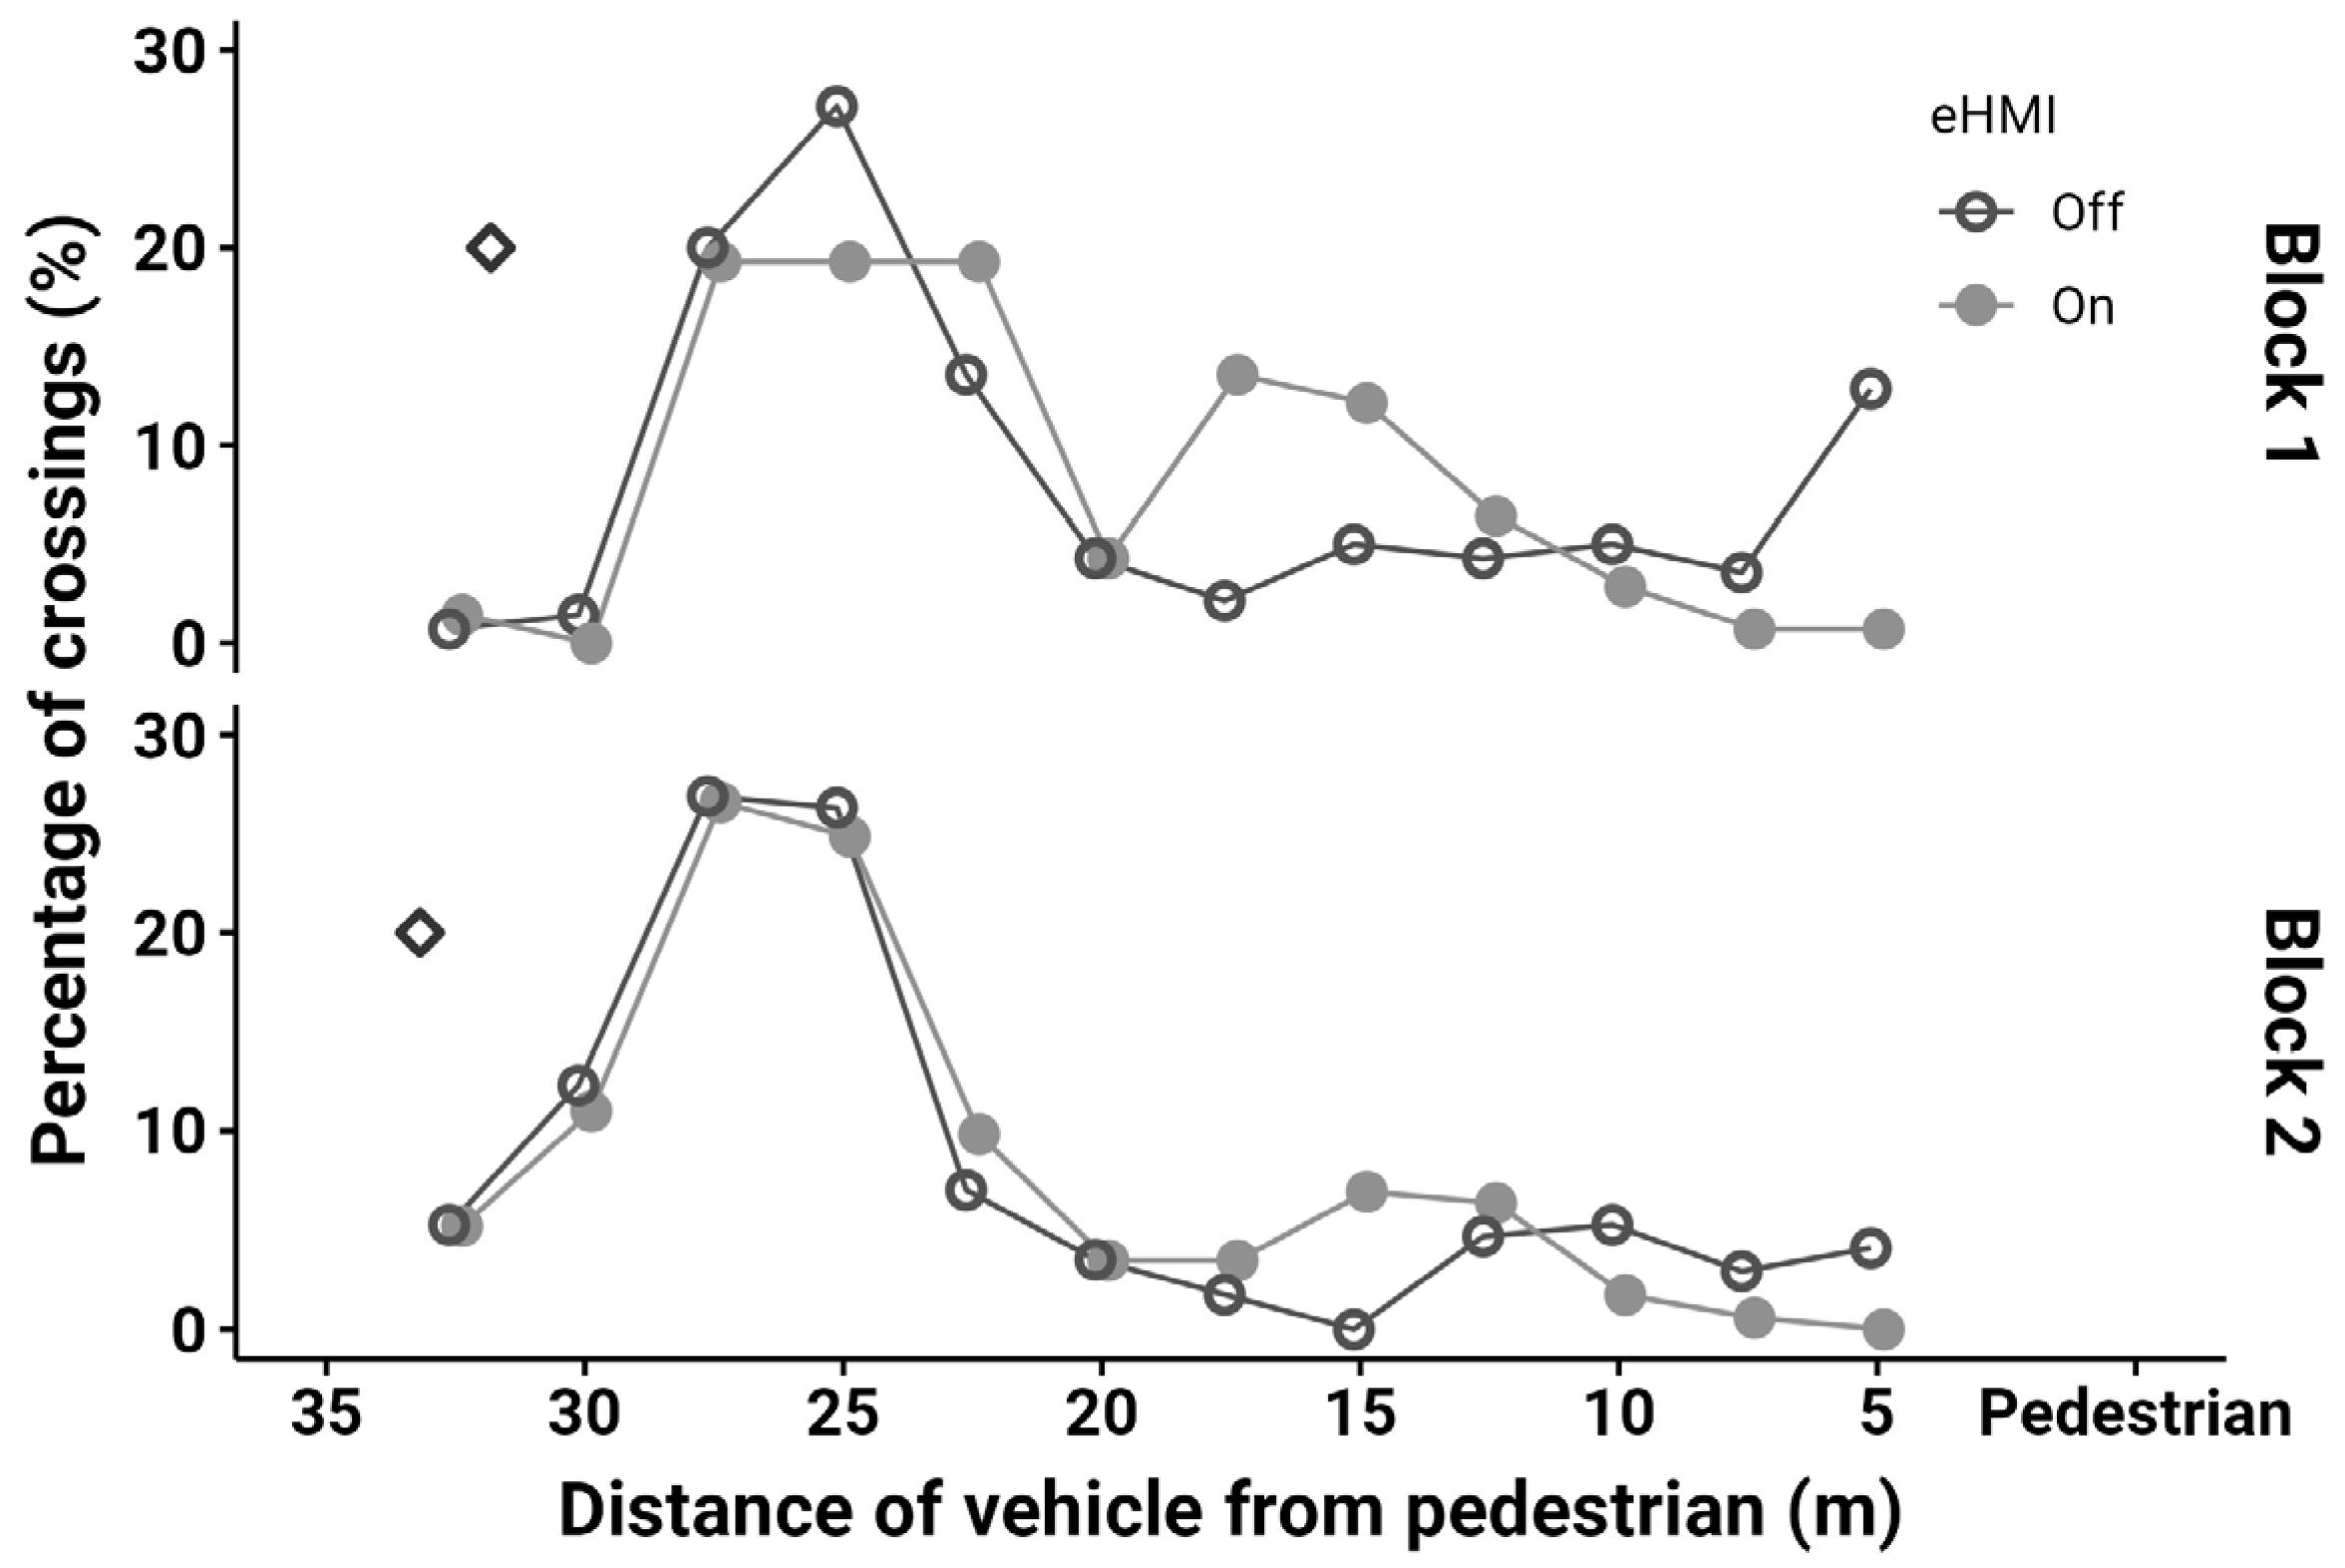
3.1. Accepted Crossings
3.1.1. Non-Decelerating Trials
3.1.2. Decelerating Trials
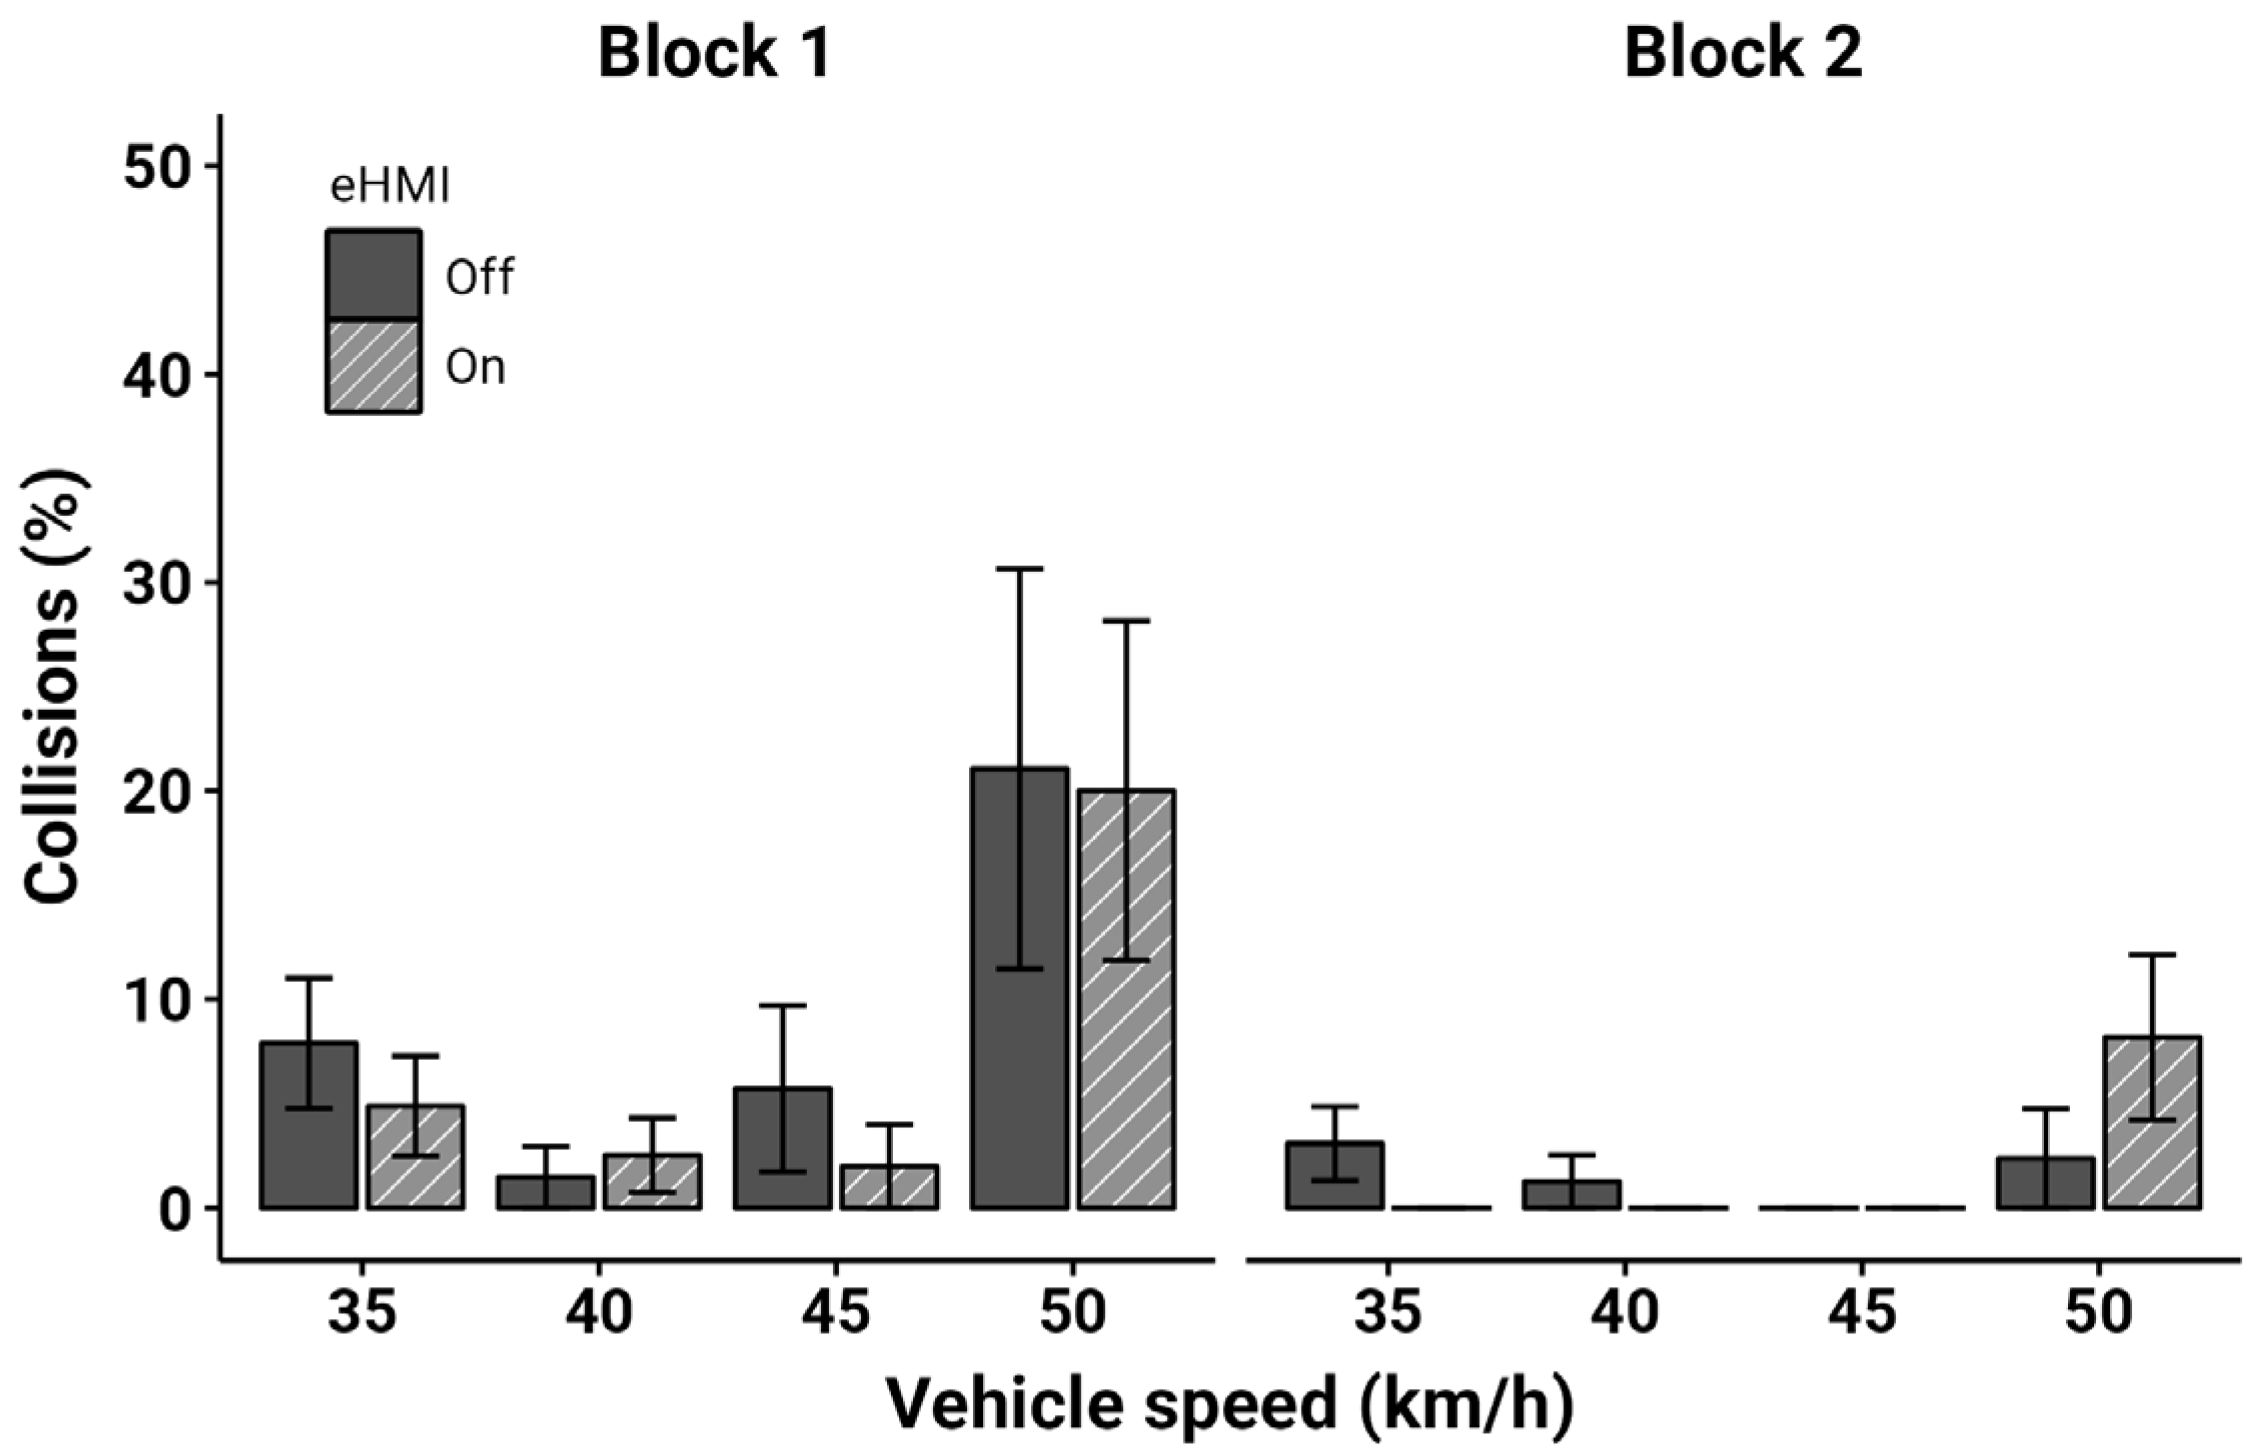
3.2. Collisions
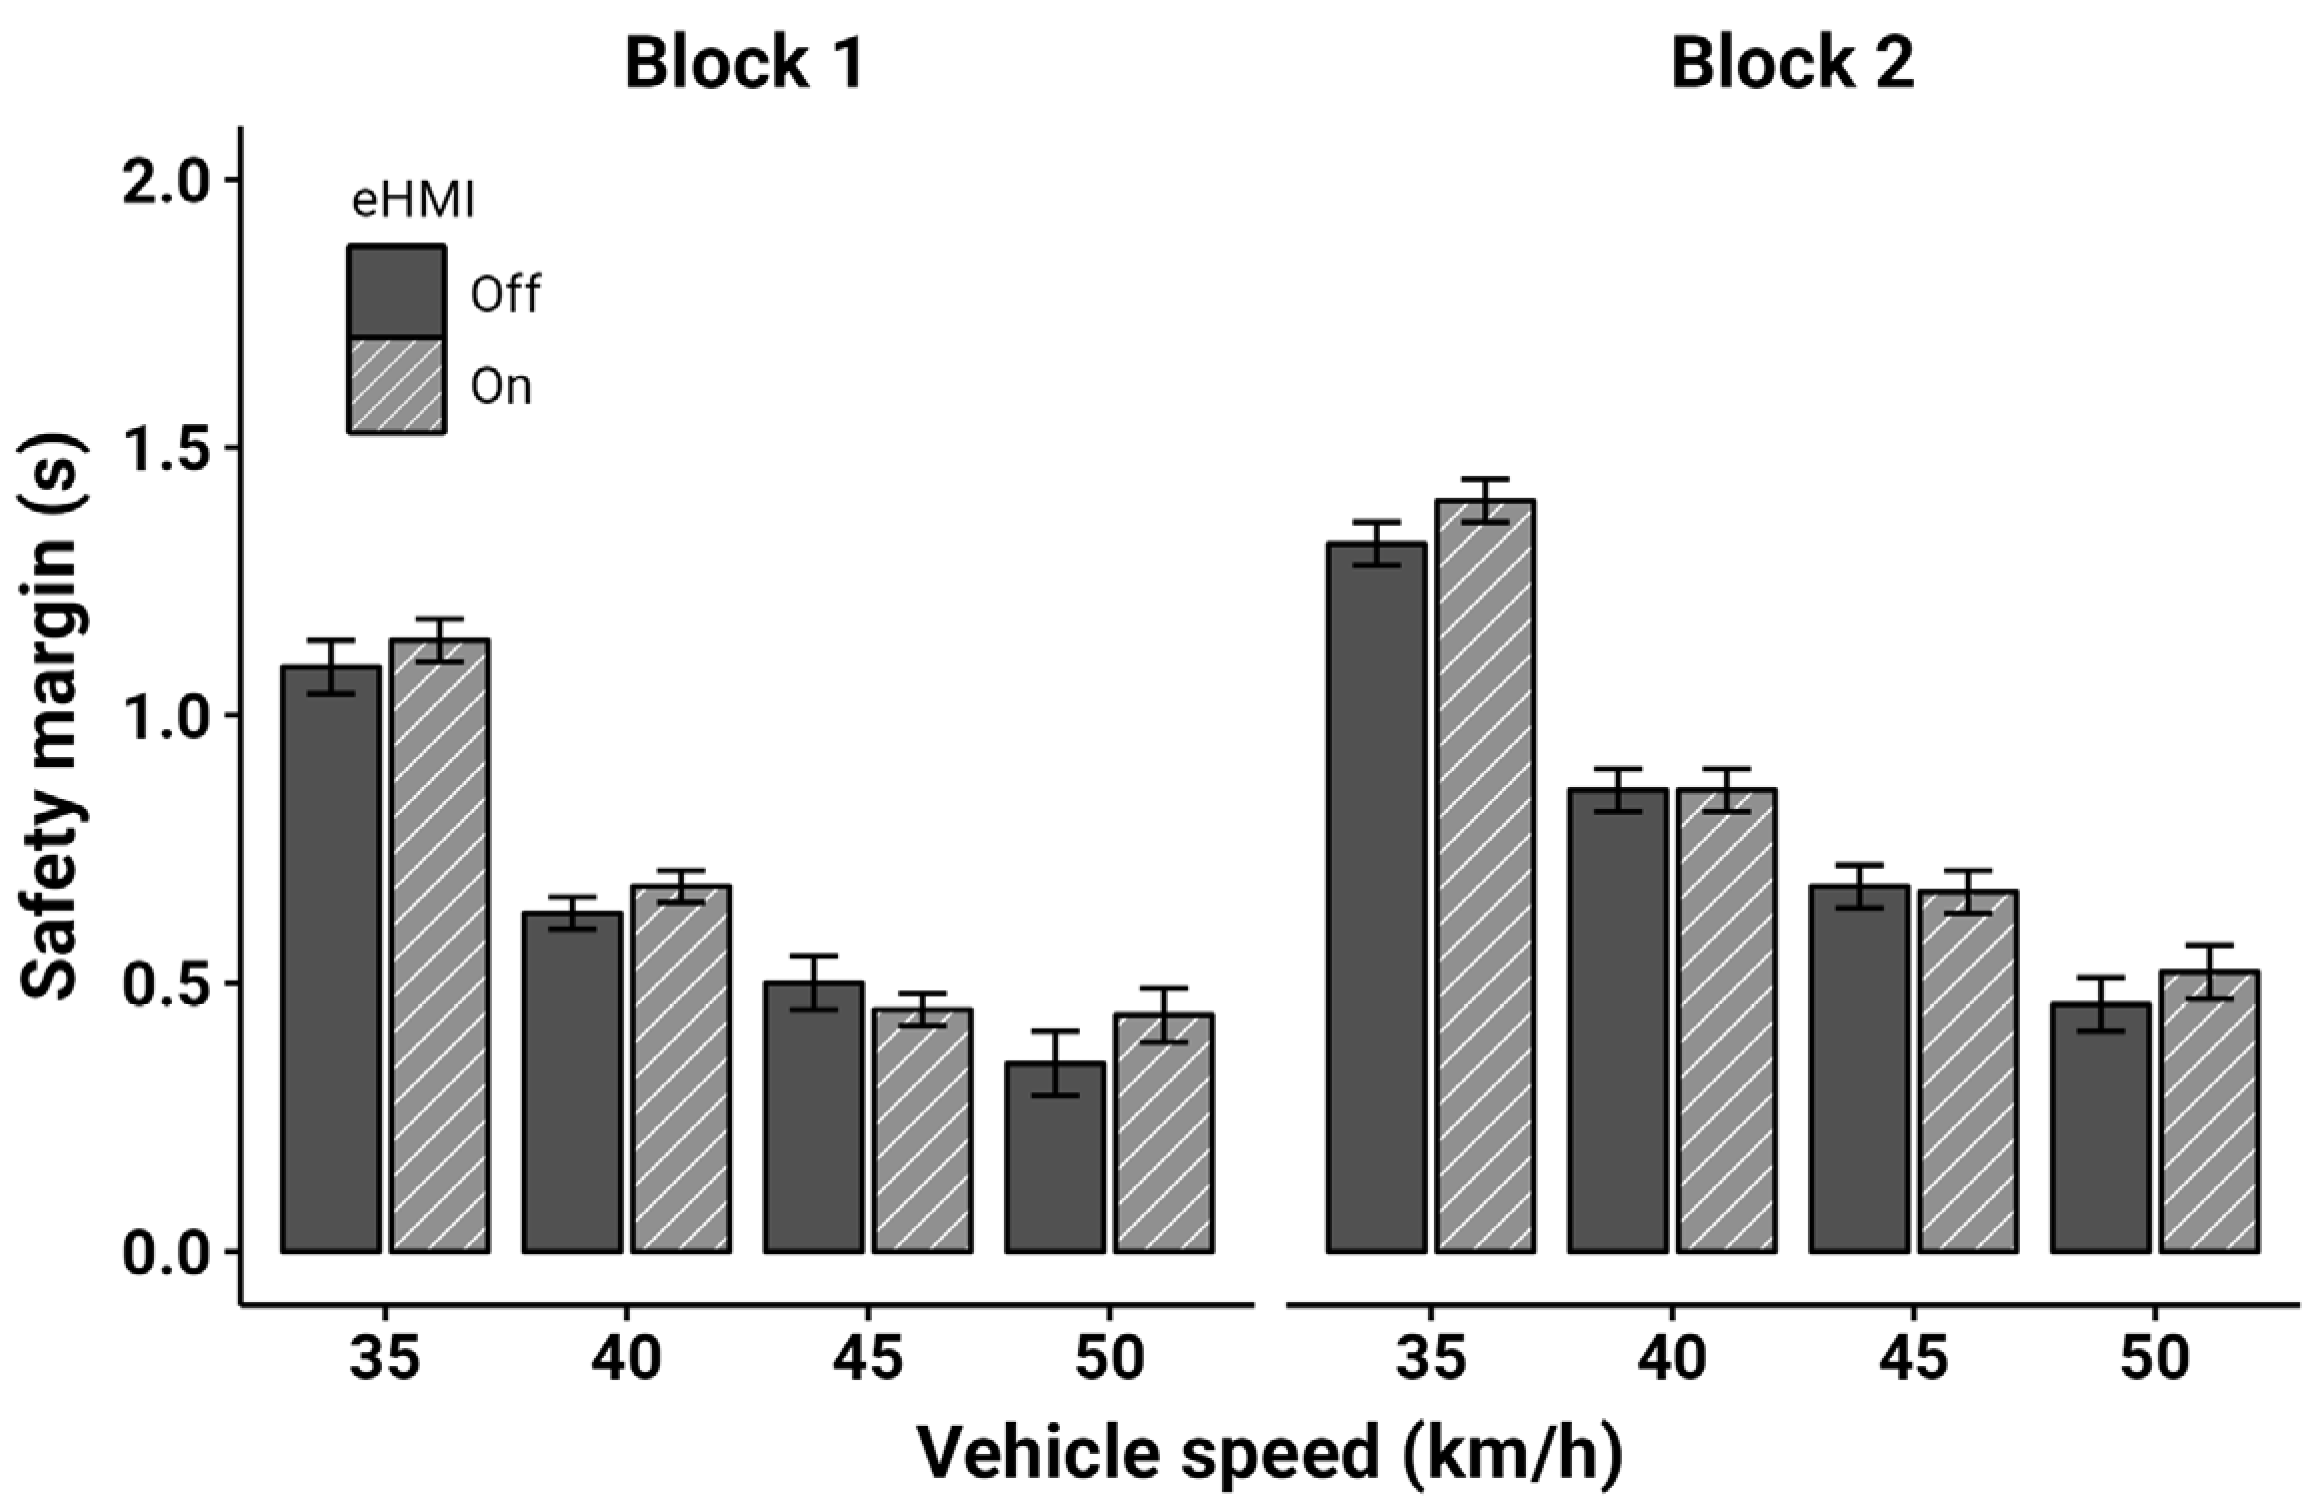
3.3. Safety Margin
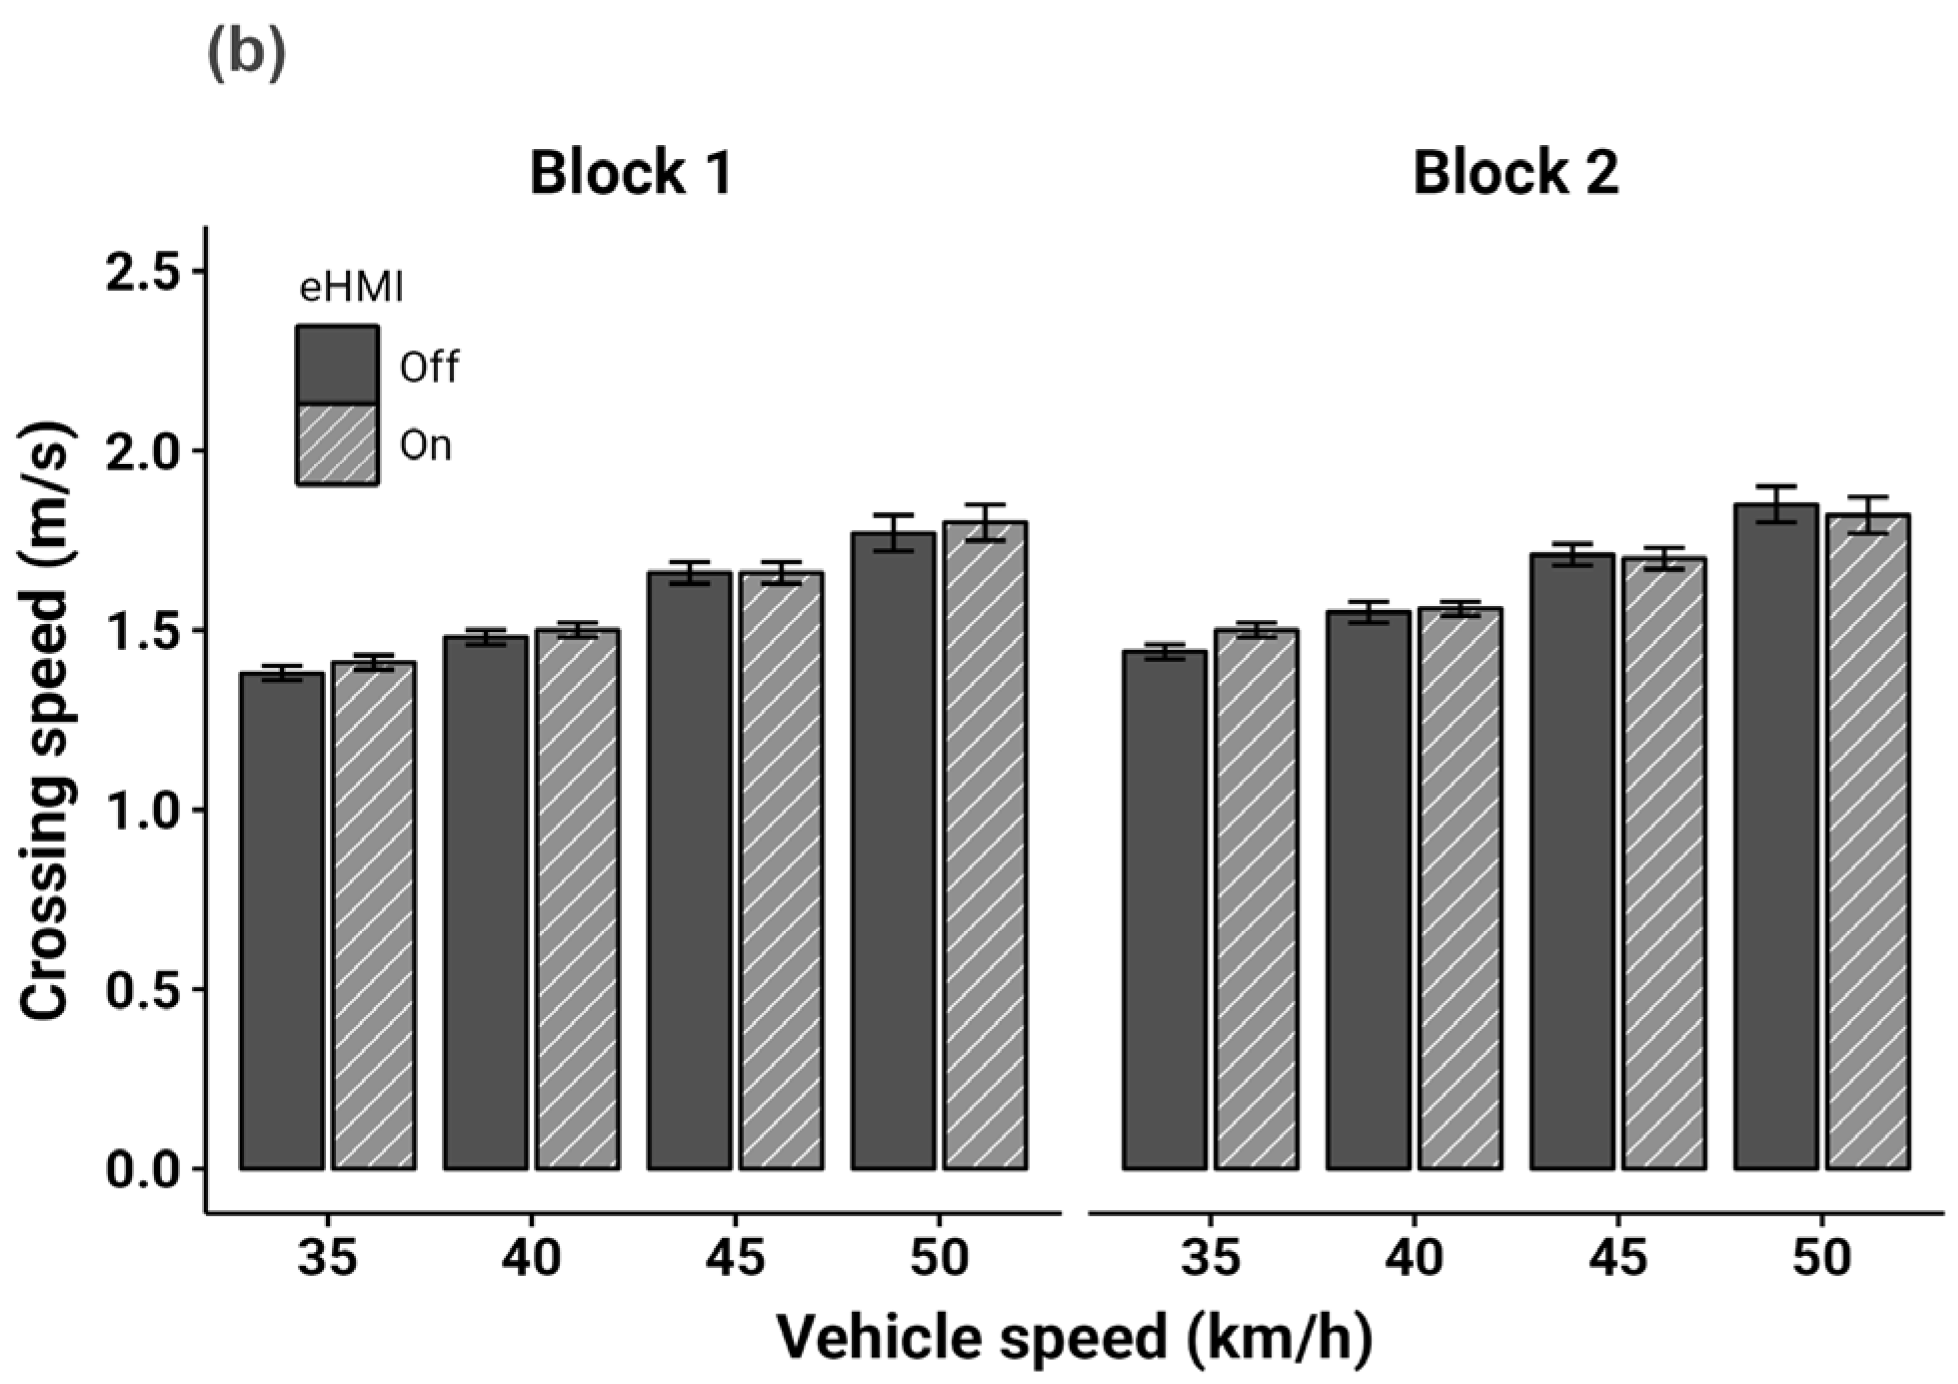
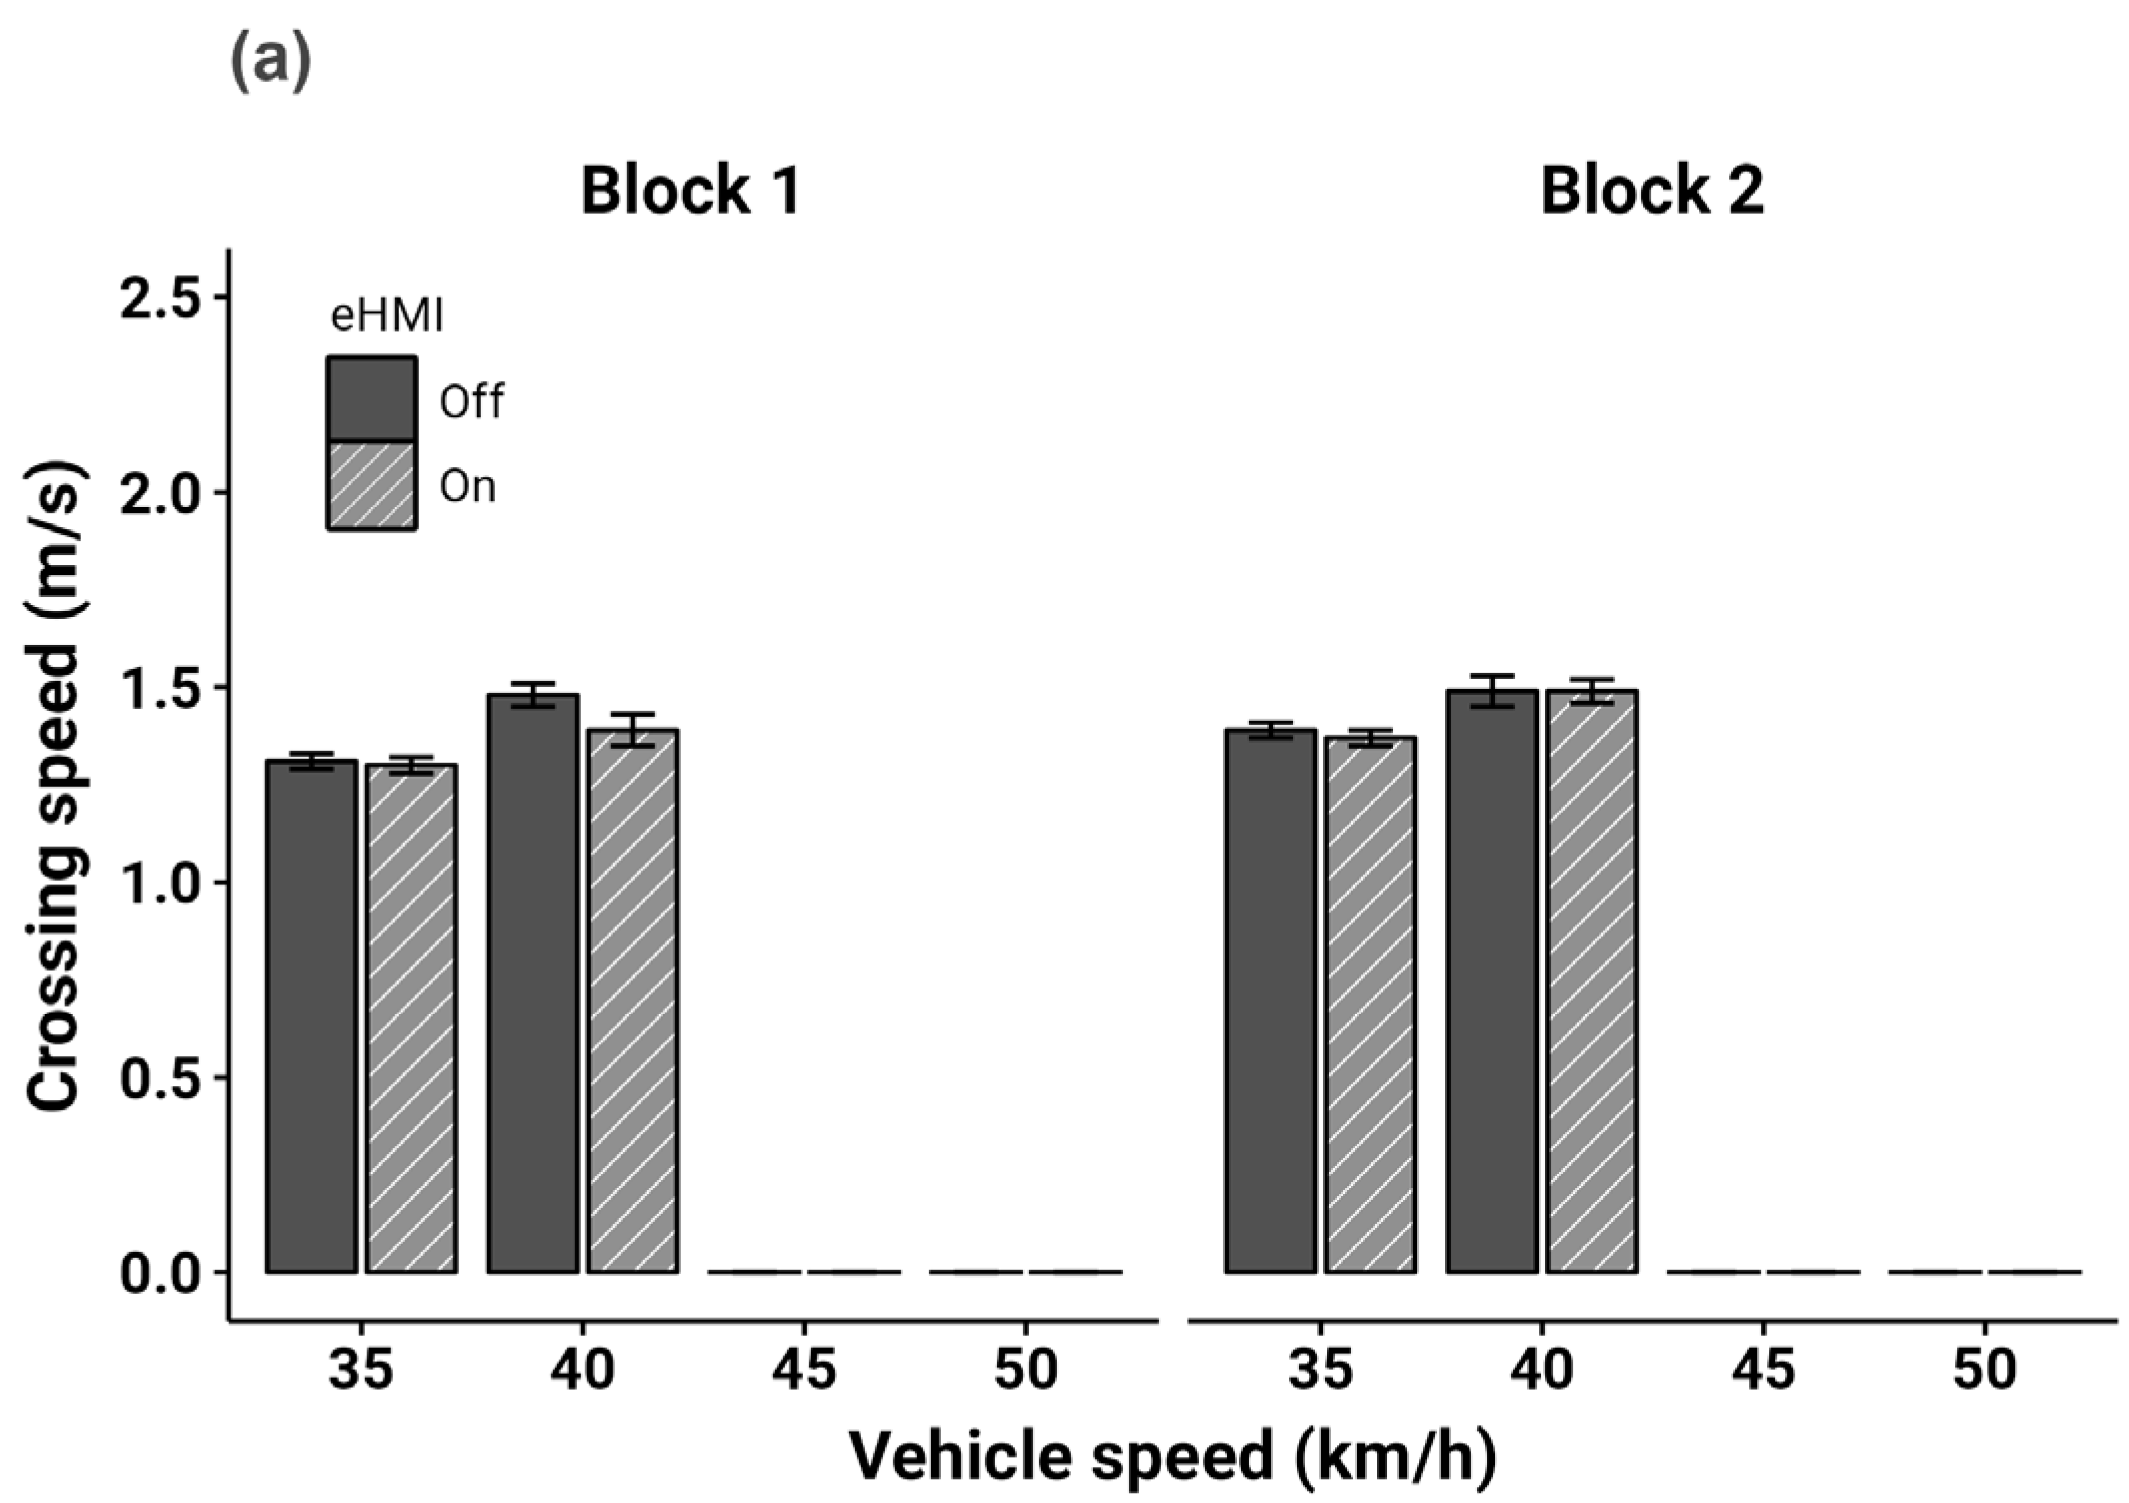
3.4. Crossing Speed
3.5. Questionnaires
3.5.1. First Questionnaire
3.5.2. Second Questionnaire
3.5.3. Simulation Sickness Questionnaire
4. General Discussion and Conclusions
4.1. Vehicle Interaction with and without eHMIs
4.2. Street Crossing with and without an Incentive
4.3. Factors That Contributed to Behavioral Change
4.4. Conclusions
Author Contributions
Funding
Institutional Review Board Statement
Informed Consent Statement
Data Availability Statement
Conflicts of Interest
References
- Bazilinskyy, P.; Dodou, D.; de Winter, J. Survey on EHMI Concepts: The Effect of Text, Color, and Perspective. Transp. Res. Part F Traffic Psychol. Behav. 2019, 67, 175–194. [Google Scholar] [CrossRef]
- Dey, D.; Habibovic, A.; Löcken, A.; Wintersberger, P.; Pfleging, B.; Riener, A.; Martens, M.; Terken, J. Taming the EHMI Jungle: A Classification Taxonomy to Guide, Compare, and Assess the Design Principles of Automated Vehicles’ External Human-Machine Interfaces. Transp. Res. Interdiscip. Perspect. 2020, 7, 100174. [Google Scholar] [CrossRef]
- Rouchitsas, A.; Alm, H. External Human-Machine Interfaces for Autonomous Vehicle-to-Pedestrian Communication: A Review of Empirical Work. Front. Psychol. 2019, 10, 2757. [Google Scholar] [CrossRef] [PubMed]
- Dey, D.; Matviienko, A.; Berger, M.; Martens, M.; Pfleging, B.; Terken, J. Communicating the Intention of an Automated Vehicle to Pedestrians: The Contributions of EHMI and Vehicle Behavior. IT Inf. Technol. 2021, 63, 123–141. [Google Scholar] [CrossRef]
- Faas, S.M.; Baumann, M. Light-Based External Human Machine Interface: Color Evaluation for Self-Driving Vehicle and Pedestrian Interaction. Proc. Hum. Factors Ergon. Soc. Annu. Meet. 2019, 63, 1232–1236. [Google Scholar] [CrossRef]
- Lee, Y.M.; Madigan, R.; Uzondu, C.; Garcia, J.; Romano, R.; Markkula, G.; Merat, N. Learning to Interpret Novel EHMI: The Effect of Vehicle Kinematics and EHMI Familiarity on Pedestrian’ Crossing Behavior. J. Safety Res. 2022, 80, 270–280. [Google Scholar] [CrossRef] [PubMed]
- Li, Y.; Dikmen, M.; Hussein, T.G.; Wang, Y.; Burns, C. To Cross or Not to Cross: Urgency-Based External Warning Displays on Autonomous Vehicles to Improve Pedestrian Crossing Safety. In Proceedings of the 10th International Conference on Automotive User Interfaces and Interactive Vehicular Applications; Association for Computing Machinery, Inc.: New York, NY, USA, 2018; pp. 188–197. [Google Scholar]
- Kaleefathullah, A.A.; Merat, N.; Lee, Y.M.; Eisma, Y.B.; Madigan, R.; Garcia, J.; Winter, J. External Human–Machine Interfaces Can Be Misleading: An Examination of Trust Development and Misuse in a CAVE-Based Pedestrian Simulation Environment. Hum. Factors 2020, 64, 1070–1085. [Google Scholar] [CrossRef]
- de Winter, J.; Dodou, D. External Human–Machine Interfaces: Gimmick or Necessity? Transp. Res. Interdiscip. Perspect. 2022, 15, 100643. [Google Scholar] [CrossRef]
- Faas, S.M.; Mathis, L.A.; Baumann, M. External HMI for Self-Driving Vehicles: Which Information Shall Be Displayed? Transp. Res. Part F Traffic Psychol. Behav. 2020, 68, 171–186. [Google Scholar] [CrossRef]
- Othersen, I.; Conti-Kufner, A.S.; Dietrich, A.; Maruhn, P.; Bengler, K. Designing for Automated Vehicle and Pedestrian Communication: Perspectives on EHMIs from Older and Younger Persons. In Proceedings of the Human Factors and Ergonomics Society Europe Chapter 2018 Annual Conference, Berlin, Germany, 2018; pp. 135–148. Available online: https://www.hfes-europe.org/technology-ageing-society (accessed on 20 February 2024).
- Schieben, A.; Wilbrink, M.; Kettwich, C.; Madigan, R.; Louw, T.; Merat, N. Designing the Interaction of Automated Vehicles with Other Traffic Participants: Design Considerations Based on Human Needs and Expectations. Cogn. Technol. Work 2019, 21, 69–85. [Google Scholar] [CrossRef]
- Ackermann, C.; Beggiato, M.; Bluhm, L.F.; Löw, A.; Krems, J.F. Deceleration Parameters and Their Applicability as Informal Communication Signal between Pedestrians and Automated Vehicles. Transp. Res. Part F Traffic Psychol. Behav. 2019, 62, 757–768. [Google Scholar] [CrossRef]
- Deb, S.; Strawderman, L.J.; Carruth, D.W. Investigating Pedestrian Suggestions for External Features on Fully Autonomous Vehicles: A Virtual Reality Experiment. Transp. Res. Part F Traffic Psychol. Behav. 2018, 59, 135–149. [Google Scholar] [CrossRef]
- Ackermann, C.; Beggiato, M.; Schubert, S.; Krems, J.F. An Experimental Study to Investigate Design and Assessment Criteria: What Is Important for Communication between Pedestrians and Automated Vehicles? Appl. Ergon. 2019, 75, 272–282. [Google Scholar] [CrossRef] [PubMed]
- Chang, C.M.; Toda, K.; Igarashi, T.; Miyata, M.; Kobayashi, Y. A Video-Based Study Comparing Communication Modalities between an Autonomous Car and a Pedestrian. In Adjunct Proceedings—10th International ACM Conference on Automotive User Interfaces and Interactive Vehicular Applications, AutomotiveUI 2018; Association for Computing Machinery, Inc.: New York, NY, USA, 2018; pp. 104–109. [Google Scholar]
- Dey, D.; Holländer, K.; Berger, M.; Eggen, B.; Martens, M.; Pfleging, B.; Terken, J. Distance-Dependent EHMIs for the Interaction between Automated Vehicles and Pedestrians. In Proceedings—12th International ACM Conference on Automotive User Interfaces and Interactive Vehicular Applications, AutomotiveUI 2020; Association for Computing Machinery, Inc.: New York, NY, USA, 2020; pp. 192–204. [Google Scholar] [CrossRef]
- Lee, Y.M.; Madigan, R.; Garcia, J.; Tomlinson, A.; Solernou, A.; Romano, R.; Markkula, G.; Merat, N.; Uttley, J. Understanding the Messages Conveyed by Automated Vehicles. In Proceedings—11th International ACM Conference on Automotive User Interfaces and Interactive Vehicular Applications, AutomotiveUI 2019; Association for Computing Machinery, Inc.: New York, NY, USA, 2019; pp. 134–143. [Google Scholar]
- Razmi Rad, S.; Homem de Almeida Correia, G.; Hagenzieker, M. Pedestrians’ Road Crossing Behaviour in Front of Automated Vehicles: Results from a Pedestrian Simulation Experiment Using Agent-Based Modelling. Transp. Res. Part F Traffic Psychol. Behav. 2020, 69, 101–119. [Google Scholar] [CrossRef]
- Bindschädel, J.; Weimann, P.; Kiesel, A. Using EHMI, Acoustic Signal, and Pitch Motion to Communicate the Intention of Automated Vehicles to Pedestrians: A Wizard of Oz Study. Transp. Res. Part F Traffic Psychol. Behav. 2023, 97, 59–72. [Google Scholar] [CrossRef]
- Clamann, M.; Aubert, M.; Cummings, M.L. Evaluation of Vehicle-to-Pedestrian Communication Displays for Autonomous Vehicles. In Proceedings of the Transportation Research Board 96th Annual Meeting, Washington, DC, USA, 8–12 January 2017. [Google Scholar]
- Habibovic, A.; Lundgren, V.M.; Andersson, J.; Klingegård, M.; Lagström, T.; Sirkka, A.; Fagerlönn, J.; Edgren, C.; Fredriksson, R.; Krupenia, S.; et al. Communicating Intent of Automated Vehicles to Pedestrians. Front. Psychol. 2018, 9, 1336. [Google Scholar] [CrossRef] [PubMed]
- Hensch, A.C.; Neumann, I.; Beggiato, M.; Halama, J.; Krems, J.F. How Should Automated Vehicles Communicate? Effects of a Light-Based Communication Approach in a Wizard-of-Oz Study. In Proceedings of the AHFE 2019 International Conference on Human Factors in Transportation, Washington, DC, USA, 24–28 July 2019; Springer: Berlin/Heidelberg, Germany, 2020; Volume 964, pp. 79–91. [Google Scholar]
- Matthews, M.; Chowdhary, G.; Kieson, E. Intent Communication between Autonomous Vehicles and Pedestrians. arXiv 2017, arXiv:1708.07123. [Google Scholar]
- Moore, D.; Currano, R.; Shanks, M.; Sirkin, D. Defense against the Dark Cars: Design Principles for Griefing of Autonomous Vehicles. ACM/IEEE Int. Conf. Human-Robot Interact. 2020, 201–209. [Google Scholar] [CrossRef]
- Böckle, M.P.; Klingegard, M.; Habibovic, A.; Bout, M. SAV2P—Exploring the Impact of an Interface for Shared Automated Vehicles on Pedestrians’ Experience. In Proceedings of the 9th International Conference on Automotive User Interfaces and Interactive Vehicular Applications Adjunct; Association for Computing Machinery, Inc.: New York, NY, USA, 2017; pp. 136–140. [Google Scholar]
- Chang, C.M.; Toda, K.; Sakamoto, D.; Igarashi, T. Eyes on a Car: An Interface Design for Communication between an Autonomous Car and a Pedestrian. In Proceedings of the 9th International Conference on Automotive User Interfaces and Interactive Vehicular Applications; Association for Computing Machinery, Inc.: New York, NY, USA, 2017; pp. 65–73. [Google Scholar]
- de Clercq, K.; Dietrich, A.; Núñez Velasco, J.P.; de Winter, J.; Happee, R. External Human-Machine Interfaces on Automated Vehicles: Effects on Pedestrian Crossing Decisions. Hum. Factors 2019, 61, 1353–1370. [Google Scholar] [CrossRef] [PubMed]
- Feldstein, I.; Dietrich, A.; Milinkovic, S.; Bengler, K. A Pedestrian Simulator for Urban Crossing Scenarios. In IFAC-PapersOnLine; Elsevier B.V.: Amsterdam, The Netherlands, 2016; Volume 49, pp. 239–244. [Google Scholar]
- Holländer, K.; Colley, A.; Mai, C.; Häkkilä, J.; Alt, F.; Pfleging, B. Investigating the Influence of External Car Displays on Pedestrians’ Crossing Behavior in Virtual Reality. In Proceedings of the 21st International Conference on Human-Computer Interaction with Mobile Devices and Services 2019; Association for Computing Machinery, Inc.: New York, NY, USA, 2019. [Google Scholar] [CrossRef]
- Kooijman, L.; Happee, R.; de Winter, J.C.F. How Do EHMIs Affect Pedestrians’ Crossing Behavior? A Study Using a Head-Mounted Display Combined with a Motion Suit. Information 2019, 10, 386. [Google Scholar] [CrossRef]
- Lee, Y.M.; Uttley, J.; Solernou, A.; Giles, O.; Romano, R.; Markkula, G.; Merat, N. Investigating Pedestrians’ Crossing Behaviour During Car Deceleration Using Wireless Head Mounted Display: An Application Towards the Evaluation of EHMI of Automated Vehicles. In Proceedings of the Tenth International Driving Symposium on Human Factors in Driving Assessment, Training and Vehicle Design; University of Iowa: Iowa City, IA, USA, 2020; pp. 252–258. Available online: https://trid.trb.org/view/1683269 (accessed on 20 February 2024).
- Löcken, A.; Golling, C.; Riener, A. How Should Automated Vehicles Interact with Pedestrians? A Comparative Analysis of Interaction Concepts in Virtual Reality. In Proceedings of the 11th International Conference on Automotive User Interfaces and Interactive Vehicular Applications AutomotiveUI 2019; Association for Computing Machinery, Inc.: New York, NY, USA, 2019; pp. 262–274. [Google Scholar] [CrossRef]
- Banducci, S.E.; Ward, N.; Gaspar, J.G.; Schab, K.R.; Crowell, J.A.; Kaczmarski, H.; Kramer, A.F. The Effects of Cell Phone and Text Message Conversations on Simulated Street Crossing. Hum. Factors 2016, 58, 150–162. [Google Scholar] [CrossRef]
- Corbett, M.R.; Morrongiello, B.A. Examining How Different Measurement Approaches Impact Safety Outcomes in Child Pedestrian Research: Implications for Research and Prevention. Accid. Anal. Prev. 2017, 106, 297–304. [Google Scholar] [CrossRef] [PubMed]
- Dommes, A.; Cavallo, V.; Dubuisson, J.B.; Tournier, I.; Vienne, F. Crossing a Two-Way Street: Comparison of Young and Old Pedestrians. J. Safety Res. 2014, 50, 27–34. [Google Scholar] [CrossRef]
- Jiang, Y.; O’neal, E.E.; Yon, J.P.; Franzen, L.; Rahimian, P.; Plumert, J.M.; Kearney, J.K. Acting Together: Joint Pedestrian Road Crossing in an Immersive Virtual Environment. ACM Trans. Appl. Percept. 2018, 15, 1–13. [Google Scholar] [CrossRef]
- Lobjois, R.; Benguigui, N.; Cavallo, V. The Effects of Age and Traffic Density on Street-Crossing Behavior. Accid. Anal. Prev. 2013, 53, 166–175. [Google Scholar] [CrossRef]
- Lobjois, R.; Cavallo, V. The Effects of Aging on Street-Crossing Behavior: From Estimation to Actual Crossing. Accid. Anal. Prev. 2009, 41, 259–267. [Google Scholar] [CrossRef]
- Morrongiello, B.A.; Corbett, M.; Milanovic, M.; Pyne, S.; Vierich, R. Innovations in Using Virtual Reality to Study How Children Cross Streets in Traffic: Evidence for Evasive Action Skills. Inj. Prev. 2015, 21, 266–270. [Google Scholar] [CrossRef] [PubMed]
- O’Neal, E.E.; Jiang, Y.; Franzen, L.J.; Rahimian, P.; Yon, J.P.; Kearney, J.K.; Plumert, J.M. Changes in Perception-Action Tuning over Long Time Scales: How Children and Adults Perceive and Act on Dynamic Affordances When Crossing Roads. J. Exp. Psychol. Hum. Percept. Perform. 2018, 44, 18–26. [Google Scholar] [CrossRef] [PubMed]
- Pala, P.; Cavallo, V.; Dang, N.T.; Granié, M.A.; Schneider, S.; Maruhn, P.; Bengler, K. Analysis of Street-Crossing Behavior: Comparing a CAVE Simulator and a Head-Mounted Display among Younger and Older Adults. Accid. Anal. Prev. 2021, 152, 106004. [Google Scholar] [CrossRef]
- Rahimian, P.; O’Neal, E.E.; Yon, J.P.; Franzen, L.; Jiang, Y.; Plumert, J.M.; Kearney, J.K. Using a Virtual Environment to Study the Impact of Sending Traffic Alerts to Texting Pedestrians. In Proceedings of the 2016 IEEE Virtual Reality (VR), Greenville, SC, USA, 19–23 March 2016; IEEE Computer Society. Volume 2016, pp. 141–149. [Google Scholar]
- Schwebel, D.C.; Stavrinos, D.; Byington, K.W.; Davis, T.; O’Neal, E.E.; De Jong, D. Distraction and Pedestrian Safety: How Talking on the Phone, Texting, and Listening to Music Impact Crossing the Street. Accid. Anal. Prev. 2012, 45, 266–271. [Google Scholar] [CrossRef]
- Simpson, G.; Johnston, L.; Richardson, M. An Investigation of Road Crossing in a Virtual Environment. Accid. Anal. Prev. 2003, 35, 787–796. [Google Scholar] [CrossRef]
- Soares, F.; Silva, E.; Pereira, F.; Silva, C.; Sousa, E.; Freitas, E. To Cross or Not to Cross: Impact of Visual and Auditory Cues on Pedestrians’ Crossing Decision-Making. Transp. Res. Part F Traffic Psychol. Behav. 2021, 82, 202–220. [Google Scholar] [CrossRef]
- Zito, G.A.; Cazzoli, D.; Scheffler, L.; Jäger, M.; Müri, R.M.; Mosimann, U.P.; Nyffeler, T.; Mast, F.W.; Nef, T. Street Crossing Behavior in Younger and Older Pedestrians: An Eye- and Head-Tracking Study. BMC Geriatr. 2015, 15, 176. [Google Scholar] [CrossRef] [PubMed]
- Schneider, S.; Ratter, M.; Bengler, K. Pedestrian Behavior in Virtual Reality: Effects of Gamification and Distraction. In Proceedings of the Road Safety and Simulation Conference 2019, Iowa City, IA, USA, 14–17 October 2019. [Google Scholar]
- Das, S.; Manski, C.F.; Manuszak, M.D. Walk or Wait? An Empirical Analysis of Street Crossing Decisions. J. Appl. Econom. 2005, 20, 529–548. [Google Scholar] [CrossRef]
- Deterding, S.; Dixon, D.; Khaled, R.; Nacke, L. From Game Design Elements to Gamefulness: Defining “Gamification”. In Proceedings of the 15th International Academic MindTrek Conference: Envisioning Future Media Environments, New York, NY, USA, 28–30 September 2011; pp. 9–15. [Google Scholar] [CrossRef]
- Hamari, J.; Koivisto, J.; Sarsa, H. Does Gamification Work?—A Literature Review of Empirical Studies on Gamification. Proc. Annu. Hawaii Int. Conf. Syst. Sci. 2014, 3025–3034. [Google Scholar] [CrossRef]
- Sailer, M.; Hense, J.U.; Mayr, S.K.; Mandl, H. How Gamification Motivates: An Experimental Study of the Effects of Specific Game Design Elements on Psychological Need Satisfaction. Comput. Human Behav. 2017, 69, 371–380. [Google Scholar] [CrossRef]
- Khan, N.; Muhammad, K.; Hussain, T.; Nasir, M.; Munsif, M.; Imran, A.S.; Sajjad, M. An Adaptive Game-Based Learning Strategy for Children Road Safety Education and Practice in Virtual Space. Sensors 2021, 21, 3661. [Google Scholar] [CrossRef] [PubMed]
- Charron, C.; Festoc, A.; Guéguen, N. Do Child Pedestrians Deliberately Take Risks When They Are in a Hurry? An Experimental Study on a Simulator. Transp. Res. Part F Traffic Psychol. Behav. 2012, 15, 635–643. [Google Scholar] [CrossRef]
- SAE Taxonomy and Definitions for Terms Related to Driving Automation Systems for On-Road Motor Vehicles 2021.
- Soares, F.; Silva, E.; Pereira, F.; Silva, C.; Sousa, E.; Freitas, E. The Influence of Noise Emitted by Vehicles on Pedestrian Crossing Decision-Making: A Study in a Virtual Environment. Appl. Sci. 2020, 10, 2913. [Google Scholar] [CrossRef]
- Rodríguez Palmeiro, A.; van der Kint, S.; Vissers, L.; Farah, H.; de Winter, J.C.F.; Hagenzieker, M. Interaction between Pedestrians and Automated Vehicles: A Wizard of Oz Experiment. Transp. Res. Part F Traffic Psychol. Behav. 2018, 58, 1005–1020. [Google Scholar] [CrossRef]
- Kennedy, R.S.; Lane, N.E.; Berbaum, K.S.; Lilienthal, M.G. Simulator Sickness Questionnaire: An Enhanced Method for Quantifying Simulator Sickness. Int. J. Aviat. Psychol. 1993, 3, 203–220. [Google Scholar] [CrossRef]
- Jiang, J.; Nguyen, T. Linear and Generalized Linear Mixed Models and Their Applications, 2nd ed.; Springer Series in Statistics; Springer: New York, NY, USA, 2021; ISBN 978-1-0716-1281-1. [Google Scholar]
- Deb, S.; Carruth, D.W.; Sween, R.; Strawderman, L.; Garrison, T.M. Efficacy of Virtual Reality in Pedestrian Safety Research. Appl. Ergon. 2017, 65, 449–460. [Google Scholar] [CrossRef] [PubMed]
- Holland, C.; Hill, R. Gender Differences in Factors Predicting Unsafe Crossing Decisions in Adult Pedestrians across the Lifespan: A Simulation Study. Accid. Anal. Prev. 2010, 42, 1097–1106. [Google Scholar] [CrossRef] [PubMed]
- Lobjois, R.; Cavallo, V. Age-Related Differences in Street-Crossing Decisions: The Effects of Vehicle Speed and Time Constraints on Gap Selection in an Estimation Task. Accid. Anal. Prev. 2007, 39, 934–943. [Google Scholar] [CrossRef] [PubMed]
- Cartenì, A. The Acceptability Value of Autonomous Vehicles: A Quantitative Analysis of the Willingness to Pay for Shared Autonomous Vehicles (SAVs) Mobility Services. Transp. Res. Interdiscip. Perspect. 2020, 8, 100224. [Google Scholar] [CrossRef]
- Cascetta, E.; Cartenì, A.; Di Francesco, L. Do Autonomous Vehicles Drive like Humans? A Turing Approach and an Application to SAE Automation Level 2 Cars. Transp. Res. Part C Emerg. Technol. 2022, 134, 103499. [Google Scholar] [CrossRef]


| Question | Possible Answer | |
|---|---|---|
| 1 | Your sex | Female; male |
| 2 | Your age | Secondary education; bachelor’s degree; master’s degree; doctor’s degree |
| 3 | Your education level | Not at all familiar = 1 to extremely familiar = 5 |
| 4 | How familiar are you with the concept of autonomous vehicles? | Strongly disagree = 1 to strongly agree = 5 |
| 5 | Imagine a scenario where autonomous vehicles coexist with conventional vehicles on the road. Now, as a pedestrian, please indicate your level of agreement with each of the following statements. | |
| (a) | I feel comfortable to cross the road in front of a vehicle which is in autonomous mode. | |
| (b) | I expect the autonomous vehicles to be better at identifying me than a human driver. |
| Question | Possible Answer | |
|---|---|---|
| A | As a pedestrian, how important do you believe it is for autonomous vehicles to be easily distinguishable from conventional human-driven vehicles? | Not important = 1 to extremely important = 5 |
| B | As a pedestrian, how significant do you think it is for autonomous vehicles to visually communicate their intentions (such as about to yield or not stopping) to pedestrians? | Not important = 1 to extremely important = 5 |
| C | What was the most crucial factor you considered when deciding whether to cross the road or not as a pedestrian? | Open answer |
| Predictors | Coefficient | Std. Error | p-Value |
|---|---|---|---|
| Fixed effects | |||
| Intercept | 1.669 * | 0.841 | 0.047 |
| Block = 1 | – a | – a | – a |
| Block = 2 | 1.080 ** | 0.358 | 0.003 |
| Speed = 35 | – a | – a | – a |
| Speed = 40 | −2.158 *** | 0.177 | <0.001 |
| Speed = 45 | −3.599 *** | 0.194 | <0.001 |
| Speed = 50 | −4.833 *** | 0.222 | <0.001 |
| eHMI = Off | – a | – a | – a |
| eHMI = On | 0.239 * | 0.109 | 0.028 |
| Familiarity = 1 | – a | – a | – a |
| Familiarity = 2 | −0.756 | 0.957 | 0.429 |
| Familiarity = 3 | −3.601 * | 1.549 | 0.020 |
| Random effects | |||
| σ2id | 4.84 | ||
| σ2slope | 3.34 | ||
| Correlation | −0.26 | ||
| Observations | 3300 | ||
| Groups | 31 | ||
| R2 | 0.739 | ||
| RMSE | 0.314 | ||
| AIC | 2329.9 | ||
| BIC | 2397.0 | ||
| ICC | 0.624 |
| Predictors | Coefficient | Std. Error | p-Value |
|---|---|---|---|
| Fixed effects | |||
| Intercept | −10.802 *** | 2.844 | <0.001 |
| Block = 1 | – a | – a | – a |
| Block = 2 | −12.477 ** | 4.578 | 0.006 |
| Speed = 35 | – a | – a | – a |
| Speed = 40 | 0.294 | 1.396 | 0.833 |
| Speed = 45 | 4.258 * | 1.805 | 0.018 |
| Speed = 50 | 12.957 *** | 3.762 | <0.001 |
| eHMI = Off | – a | – a | – a |
| eHMI = On | −0.038 | 0.748 | 0.960 |
| Random effects | |||
| σ2id | 81.56 | ||
| σ2slope | 376.66 | ||
| Correlation | −0.26 | ||
| Observations | 1016 | ||
| Groups | 30 | ||
| R2 | 0.989 | ||
| RMSE | 0.081 | ||
| AIC | 148.7 | ||
| BIC | 193.0 | ||
| ICC | 0.987 |
| Predictors | Coefficient | Std. Error | p-Value |
|---|---|---|---|
| Fixed effects | |||
| Intercept | 2.315 *** | 0.373 | <0.001 |
| Block = 1 | – a | – a | – a |
| Block = 2 | 0.272 *** | 0.038 | <0.001 |
| Speed = 35 | – a | – a | – a |
| Speed = 40 | −0.475 *** | 0.014 | <0.001 |
| Speed = 45 | −0.828 *** | 0.016 | <0.001 |
| Speed = 50 | −1.095 *** | 0.021 | <0.001 |
| eHMI = Off | – a | – a | – a |
| eHMI = On | 0.042 *** | 0.011 | <0.001 |
| Age | −0.041 ** | 0.012 | 0.002 |
| Random effects | |||
| σ2id | 0.08 | ||
| σ2slope | 0.03 | ||
| Correlation | 0.36 | ||
| Observations | 975 | ||
| Groups | 29 | ||
| R2 | 0.904 | ||
| RMSE | 0.171 | ||
| AIC | −394.8 | ||
| BIC | −341.1 | ||
| ICC | 0.790 |
| Predictors | Coefficient | Std. Error | p-Value |
|---|---|---|---|
| Fixed effects | |||
| Intercept | 1.378 *** | 0.027 | <0.001 |
| Block = 1 | – a | – a | – a |
| Block = 2 | 0.076 *** | 0.020 | <0.001 |
| Speed = 35 | – a | – a | – a |
| Speed = 40 | 0.066 *** | 0.008 | <0.001 |
| Speed = 45 | 0.175 *** | 0.012 | <0.001 |
| Speed = 50 | 0.280 *** | 0.014 | <0.001 |
| eHMI = Off | – a | – a | – a |
| eHMI = On | 0.013 | 0.009 | 0.125 |
| Yield = No | – a | – a | – a |
| Yield = Yes | −0.077 *** | 0.011 | <0.001 |
| eHMI = Off × Yield = No | – a, b | – a, b | – a, b |
| eHMI = On × Yield = Yes | −0.028 * | 0.014 | 0.040 |
| Random effects | |||
| σ2id | 0.02 | ||
| σ2slope | 0.01 | ||
| Correlation | 0.13 | ||
| Observations | 1632 | ||
| Groups | 31 | ||
| R2 | 0.708 | ||
| RMSE | 0.132 | ||
| AIC | −1664.1 | ||
| BIC | −1599.3 | ||
| ICC | 0.611 |
| Group | Contrast | Coefficient | Std. Error | p-Value |
|---|---|---|---|---|
| Yield = No | eHMI = Off | – a | – a | – a |
| eHMI = On | −0.013 | 0.009 | 0.750 | |
| Yield = Yes | eHMI = Off | – a | – a | – a |
| eHMI = On | 0.015 | 0.011 | 0.942 | |
| eHMI = Off | Yield = No | – a | – a | – a |
| Yield = Yes | 0.077 *** | 0.011 | <0.001 | |
| eHMI = On | Yield = No | – a | – a | – a |
| Yield = Yes | 0.106 *** | 0.011 | <0.001 |
Disclaimer/Publisher’s Note: The statements, opinions and data contained in all publications are solely those of the individual author(s) and contributor(s) and not of MDPI and/or the editor(s). MDPI and/or the editor(s) disclaim responsibility for any injury to people or property resulting from any ideas, methods, instructions or products referred to in the content. |
© 2024 by the authors. Licensee MDPI, Basel, Switzerland. This article is an open access article distributed under the terms and conditions of the Creative Commons Attribution (CC BY) license (https://creativecommons.org/licenses/by/4.0/).
Share and Cite
Almeida, R.; Sousa, E.; Machado, D.; Pereira, F.; Faria, S.; Freitas, E. Analysis of the Interaction between Humans and Autonomous Vehicles Equipped with External Human–Machine Interfaces: The Effect of an Experimental Reward Mechanism on Pedestrian Crossing Behavior in a Virtual Environment. Sustainability 2024, 16, 3236. https://doi.org/10.3390/su16083236
Almeida R, Sousa E, Machado D, Pereira F, Faria S, Freitas E. Analysis of the Interaction between Humans and Autonomous Vehicles Equipped with External Human–Machine Interfaces: The Effect of an Experimental Reward Mechanism on Pedestrian Crossing Behavior in a Virtual Environment. Sustainability. 2024; 16(8):3236. https://doi.org/10.3390/su16083236
Chicago/Turabian StyleAlmeida, Raul, Emanuel Sousa, Dário Machado, Frederico Pereira, Susana Faria, and Elisabete Freitas. 2024. "Analysis of the Interaction between Humans and Autonomous Vehicles Equipped with External Human–Machine Interfaces: The Effect of an Experimental Reward Mechanism on Pedestrian Crossing Behavior in a Virtual Environment" Sustainability 16, no. 8: 3236. https://doi.org/10.3390/su16083236