
Spatiotemporal Variability of Convective Events in Romania Based on METAR Data


Abstract
:1. Introduction
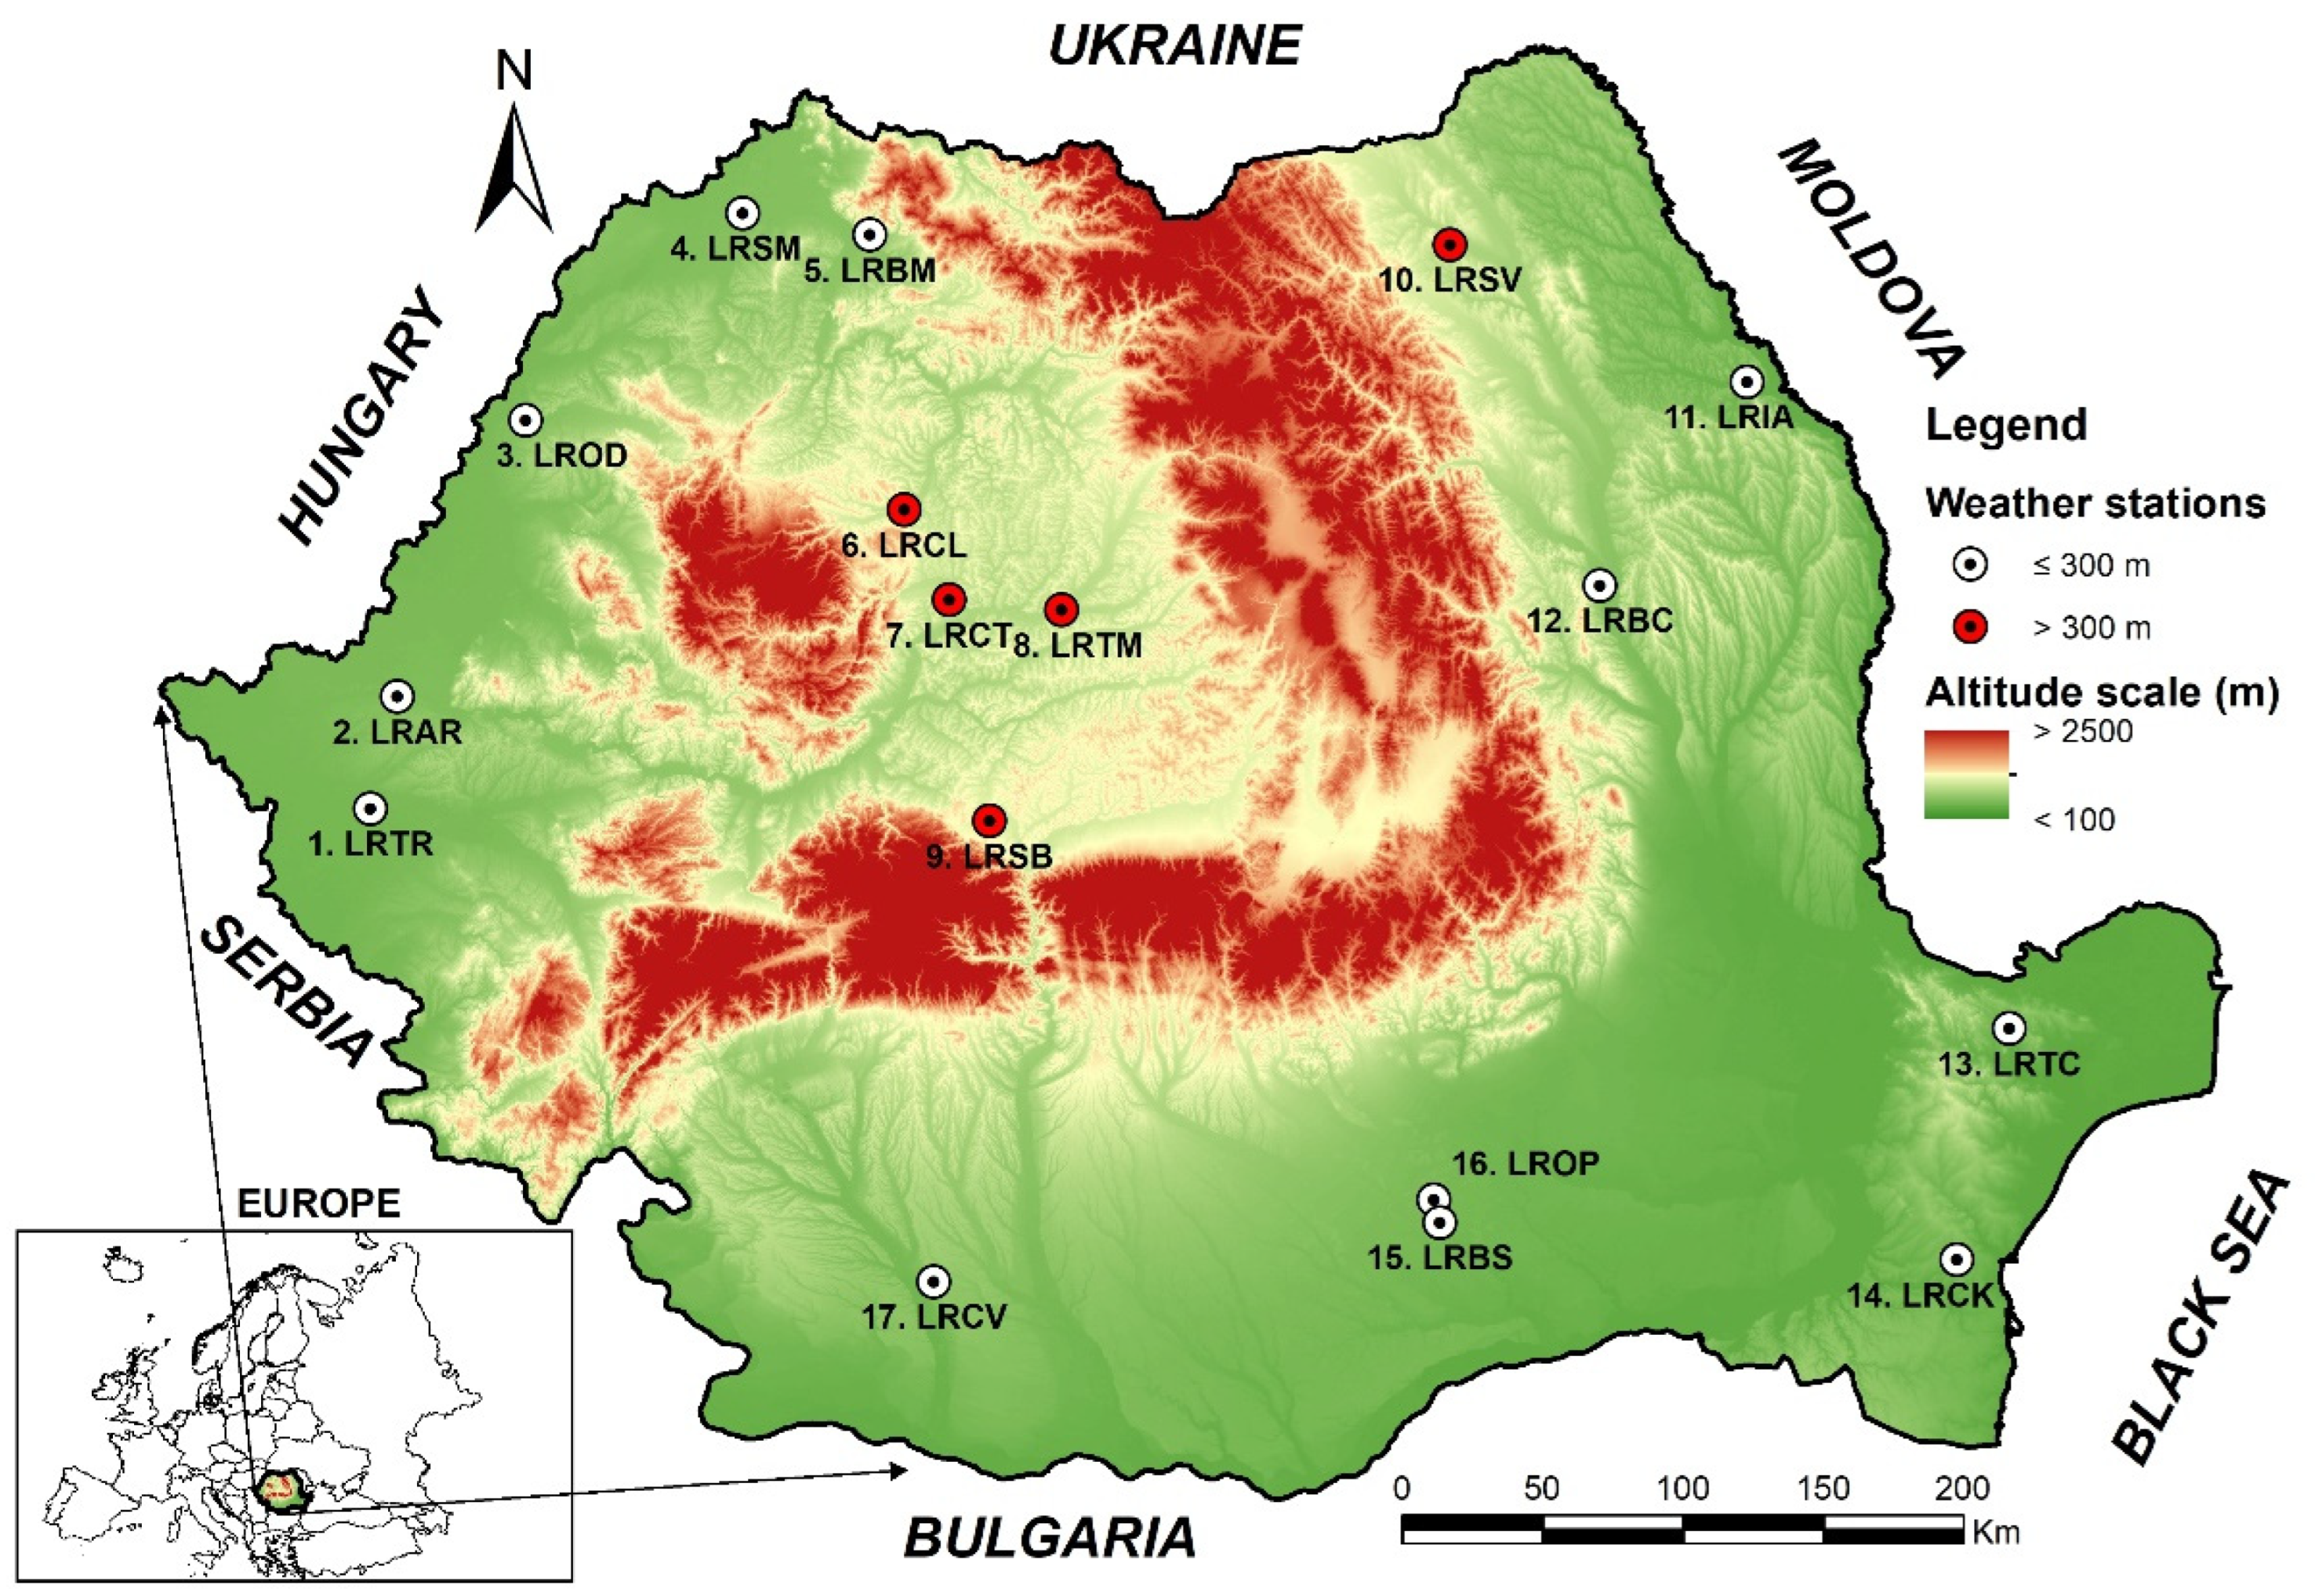
2. Data and Methods
3. Results and Discussions
3.1. Eleven-Year Climatology of METAR Variables Related to Convective Events
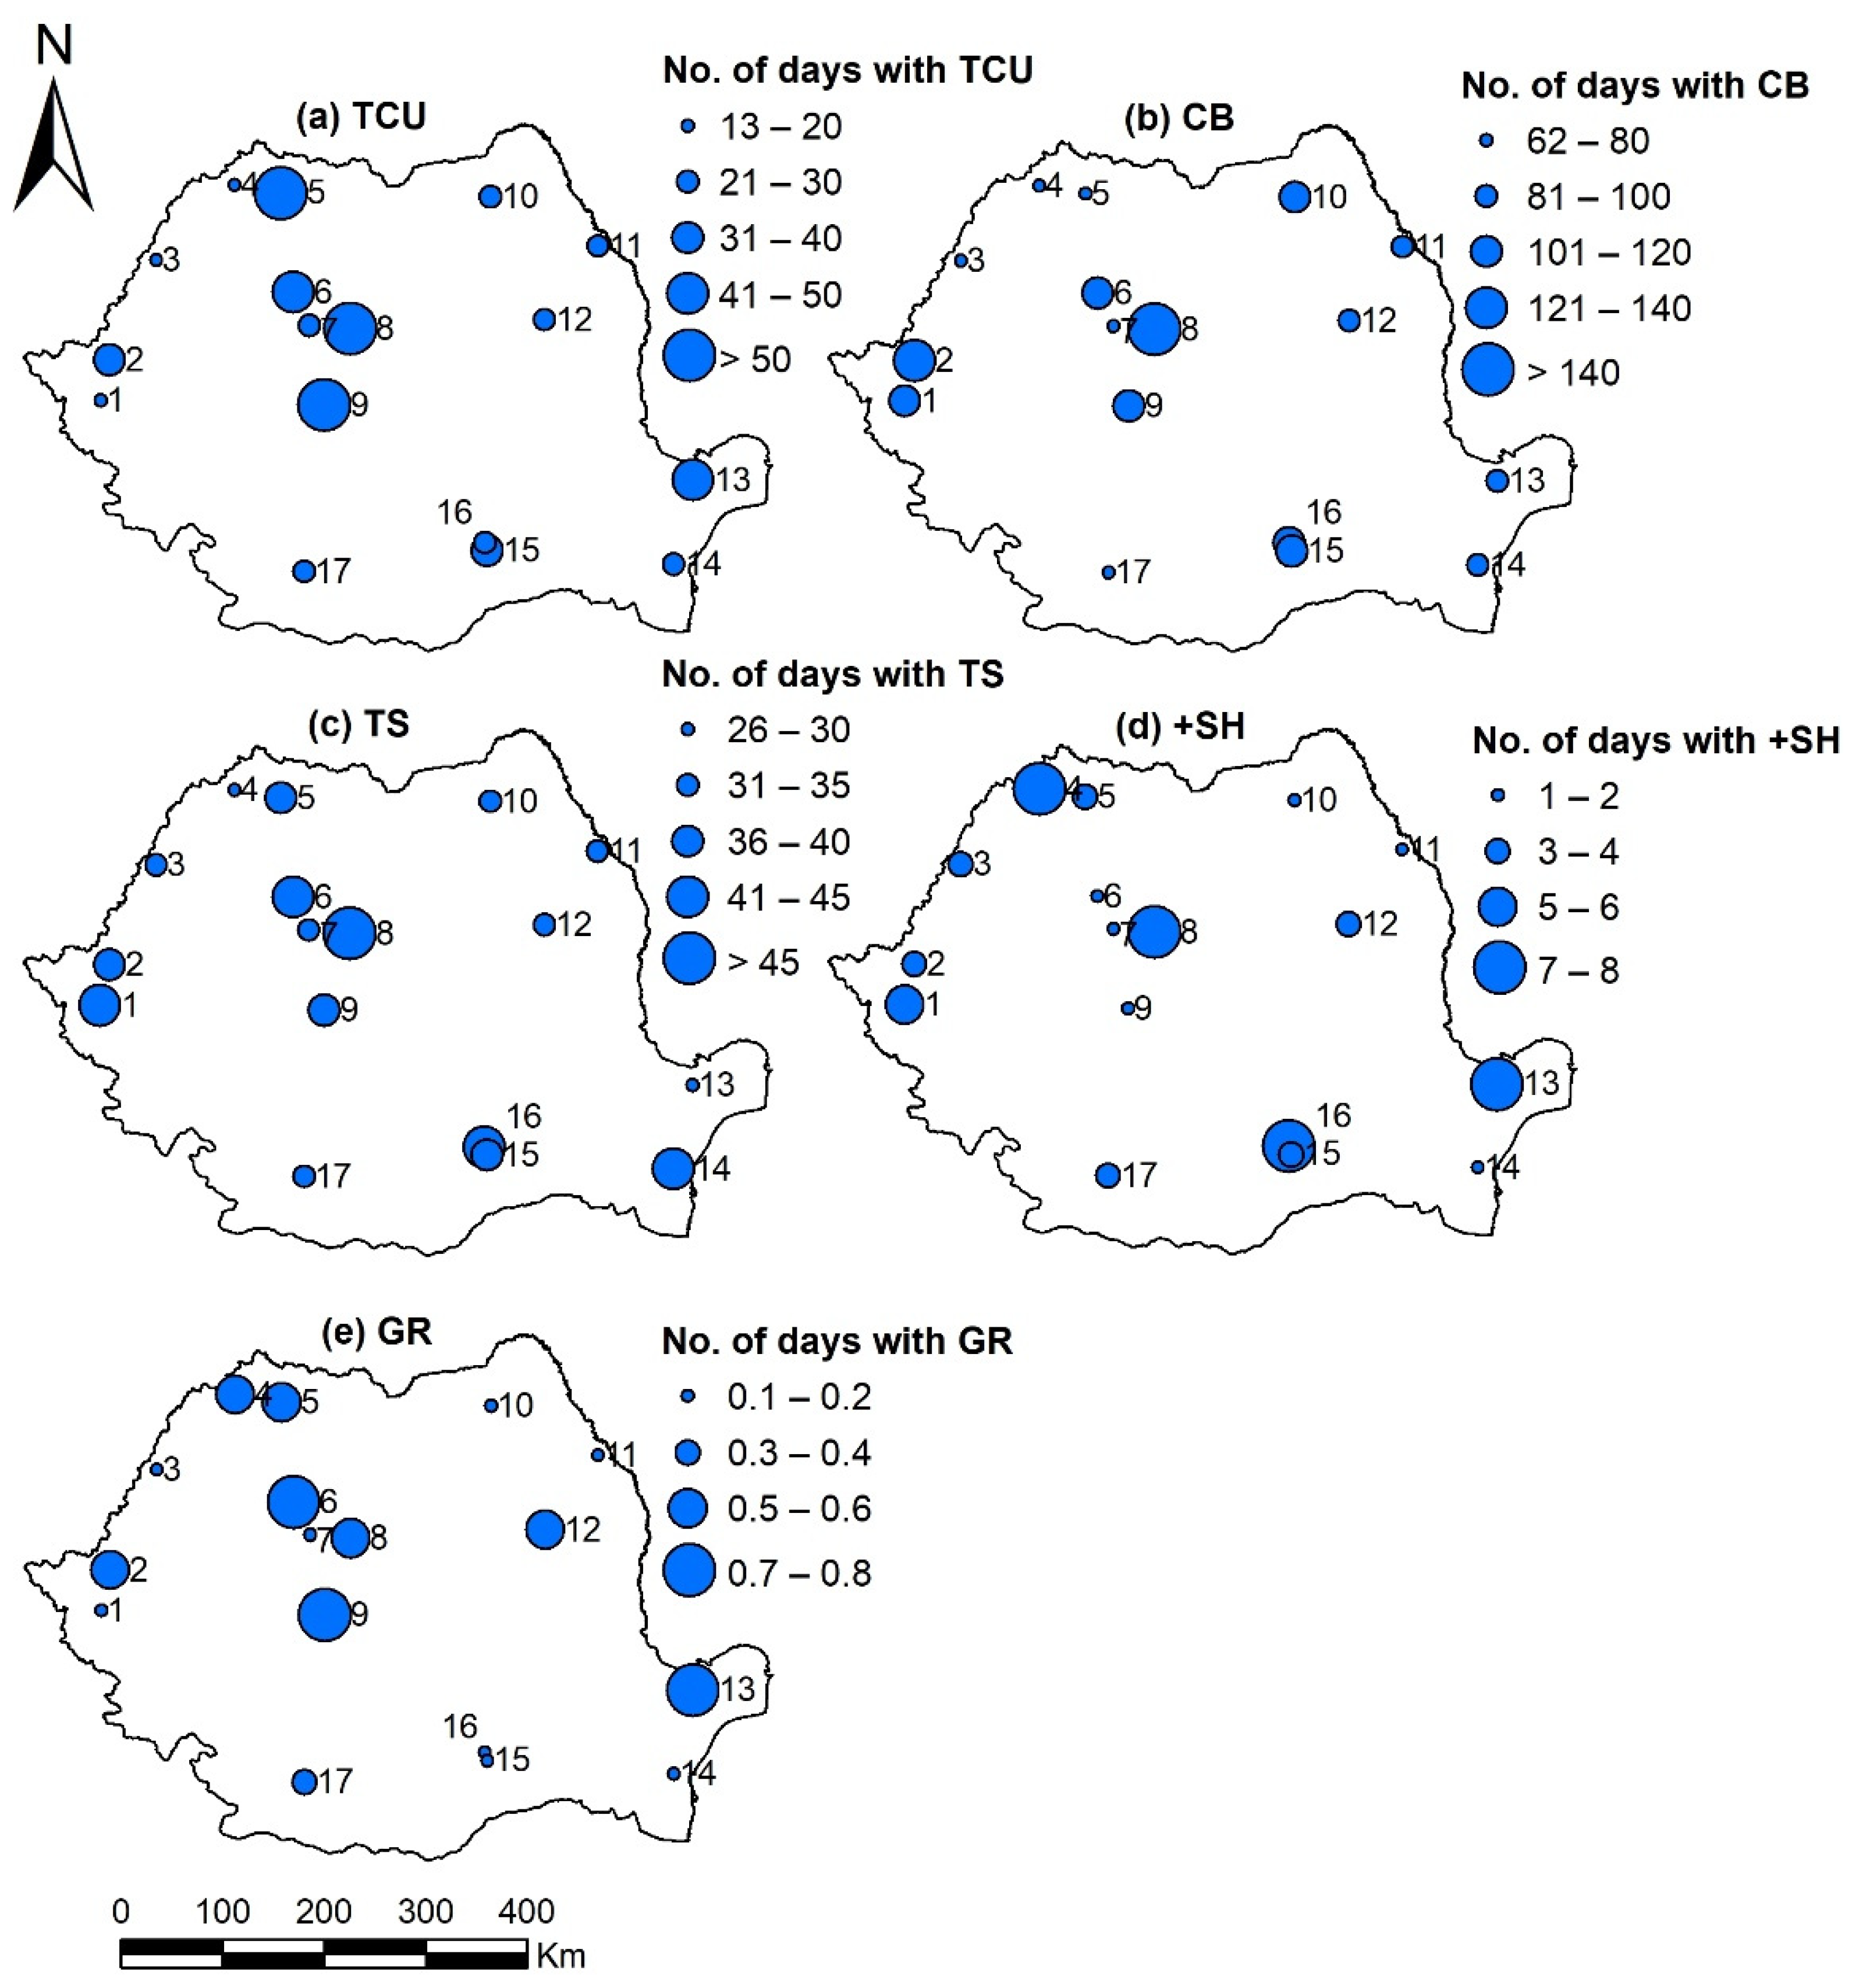
3.1.1. Annual Distribution of Convective-Related Variables
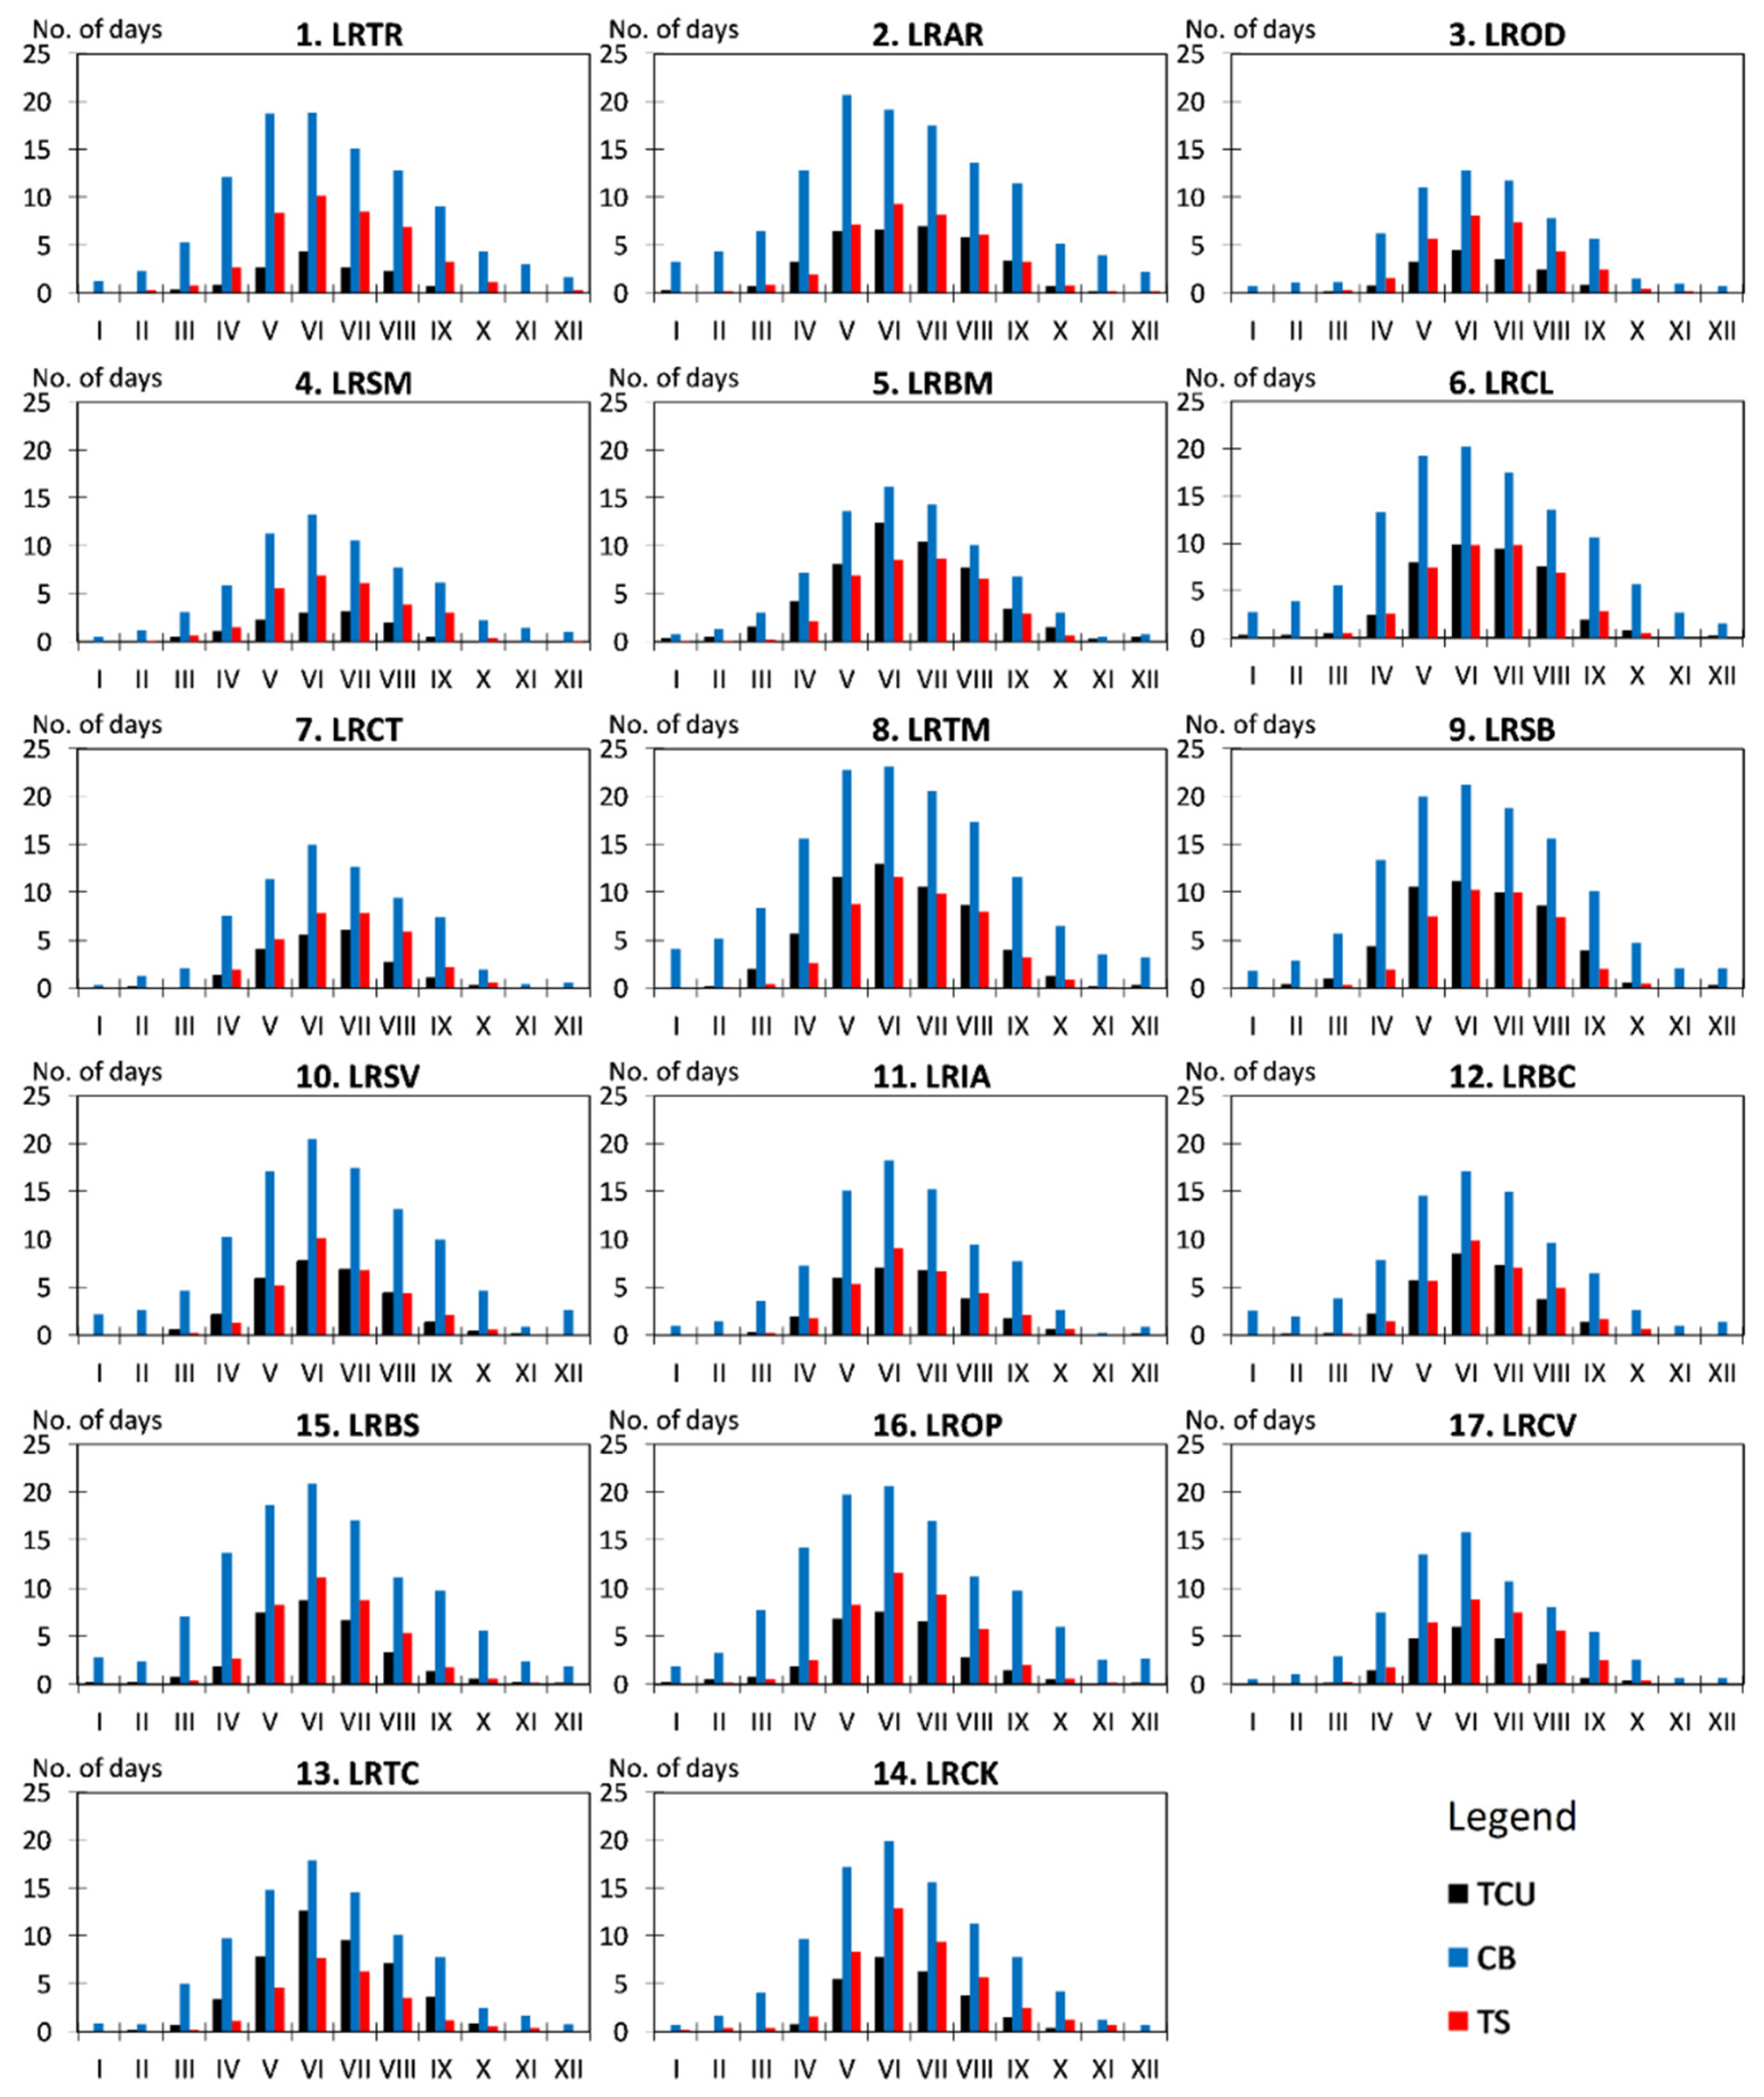
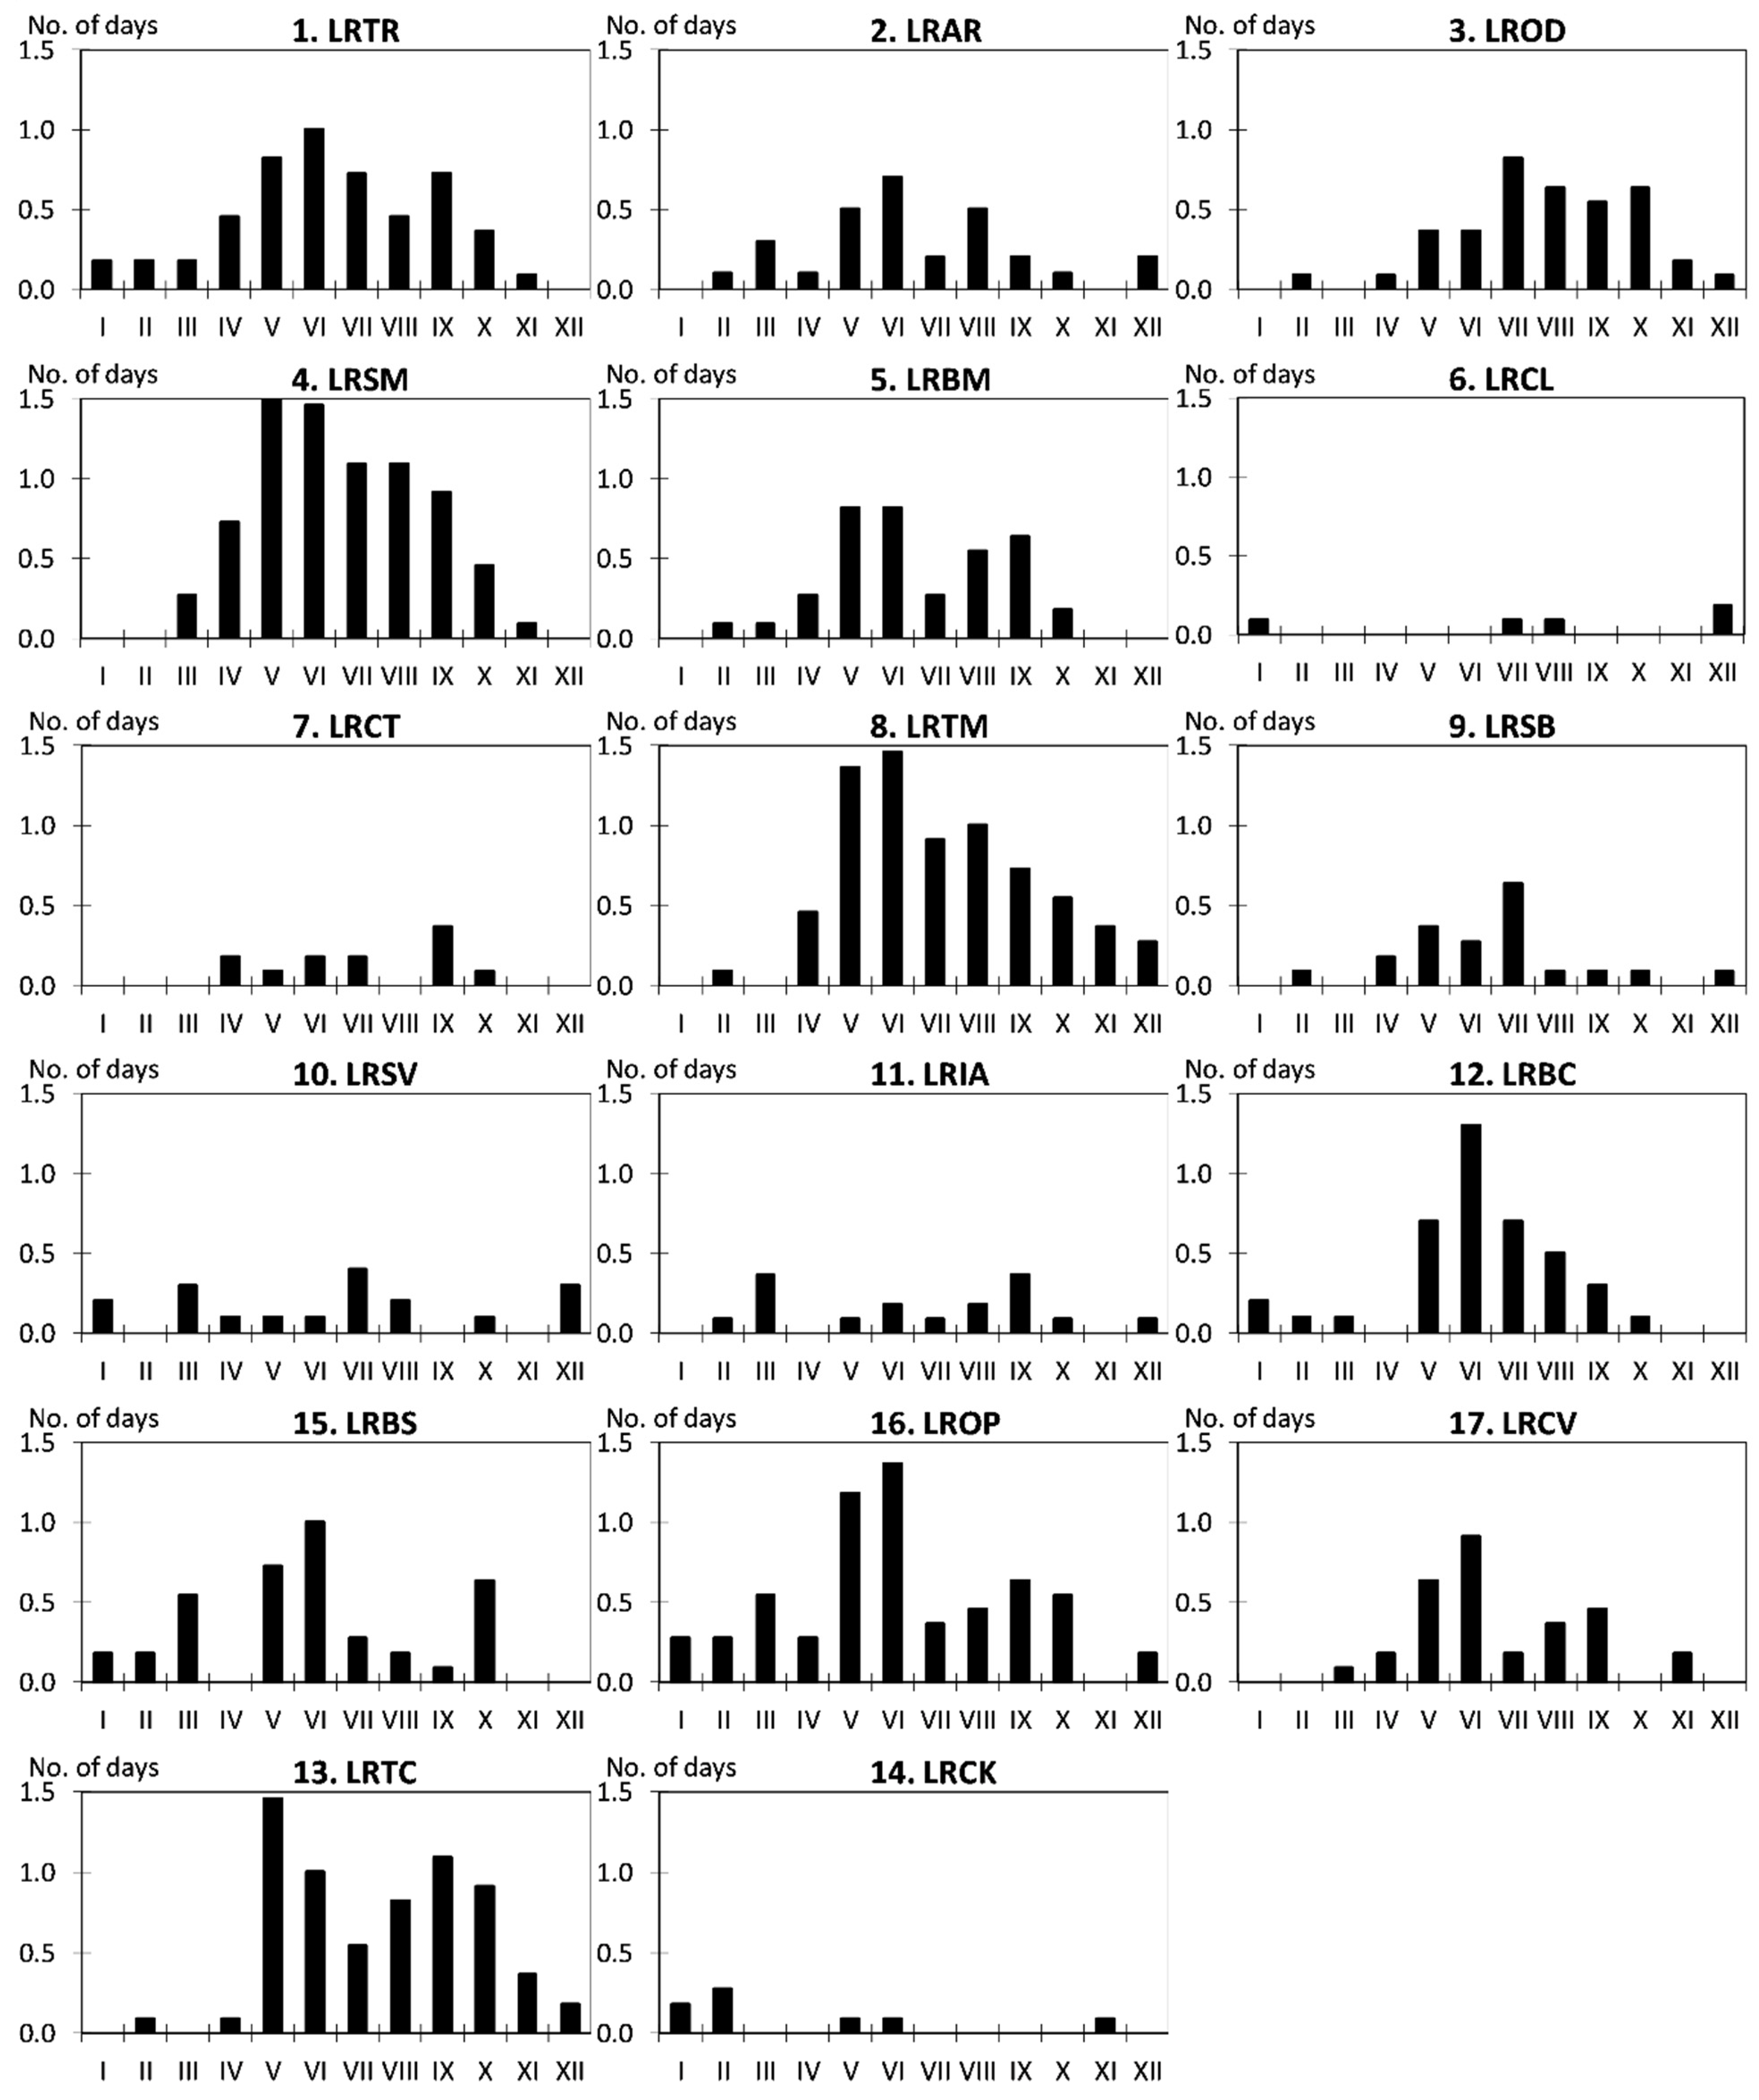
3.1.2. Monthly Distribution of Convective-Related Variables
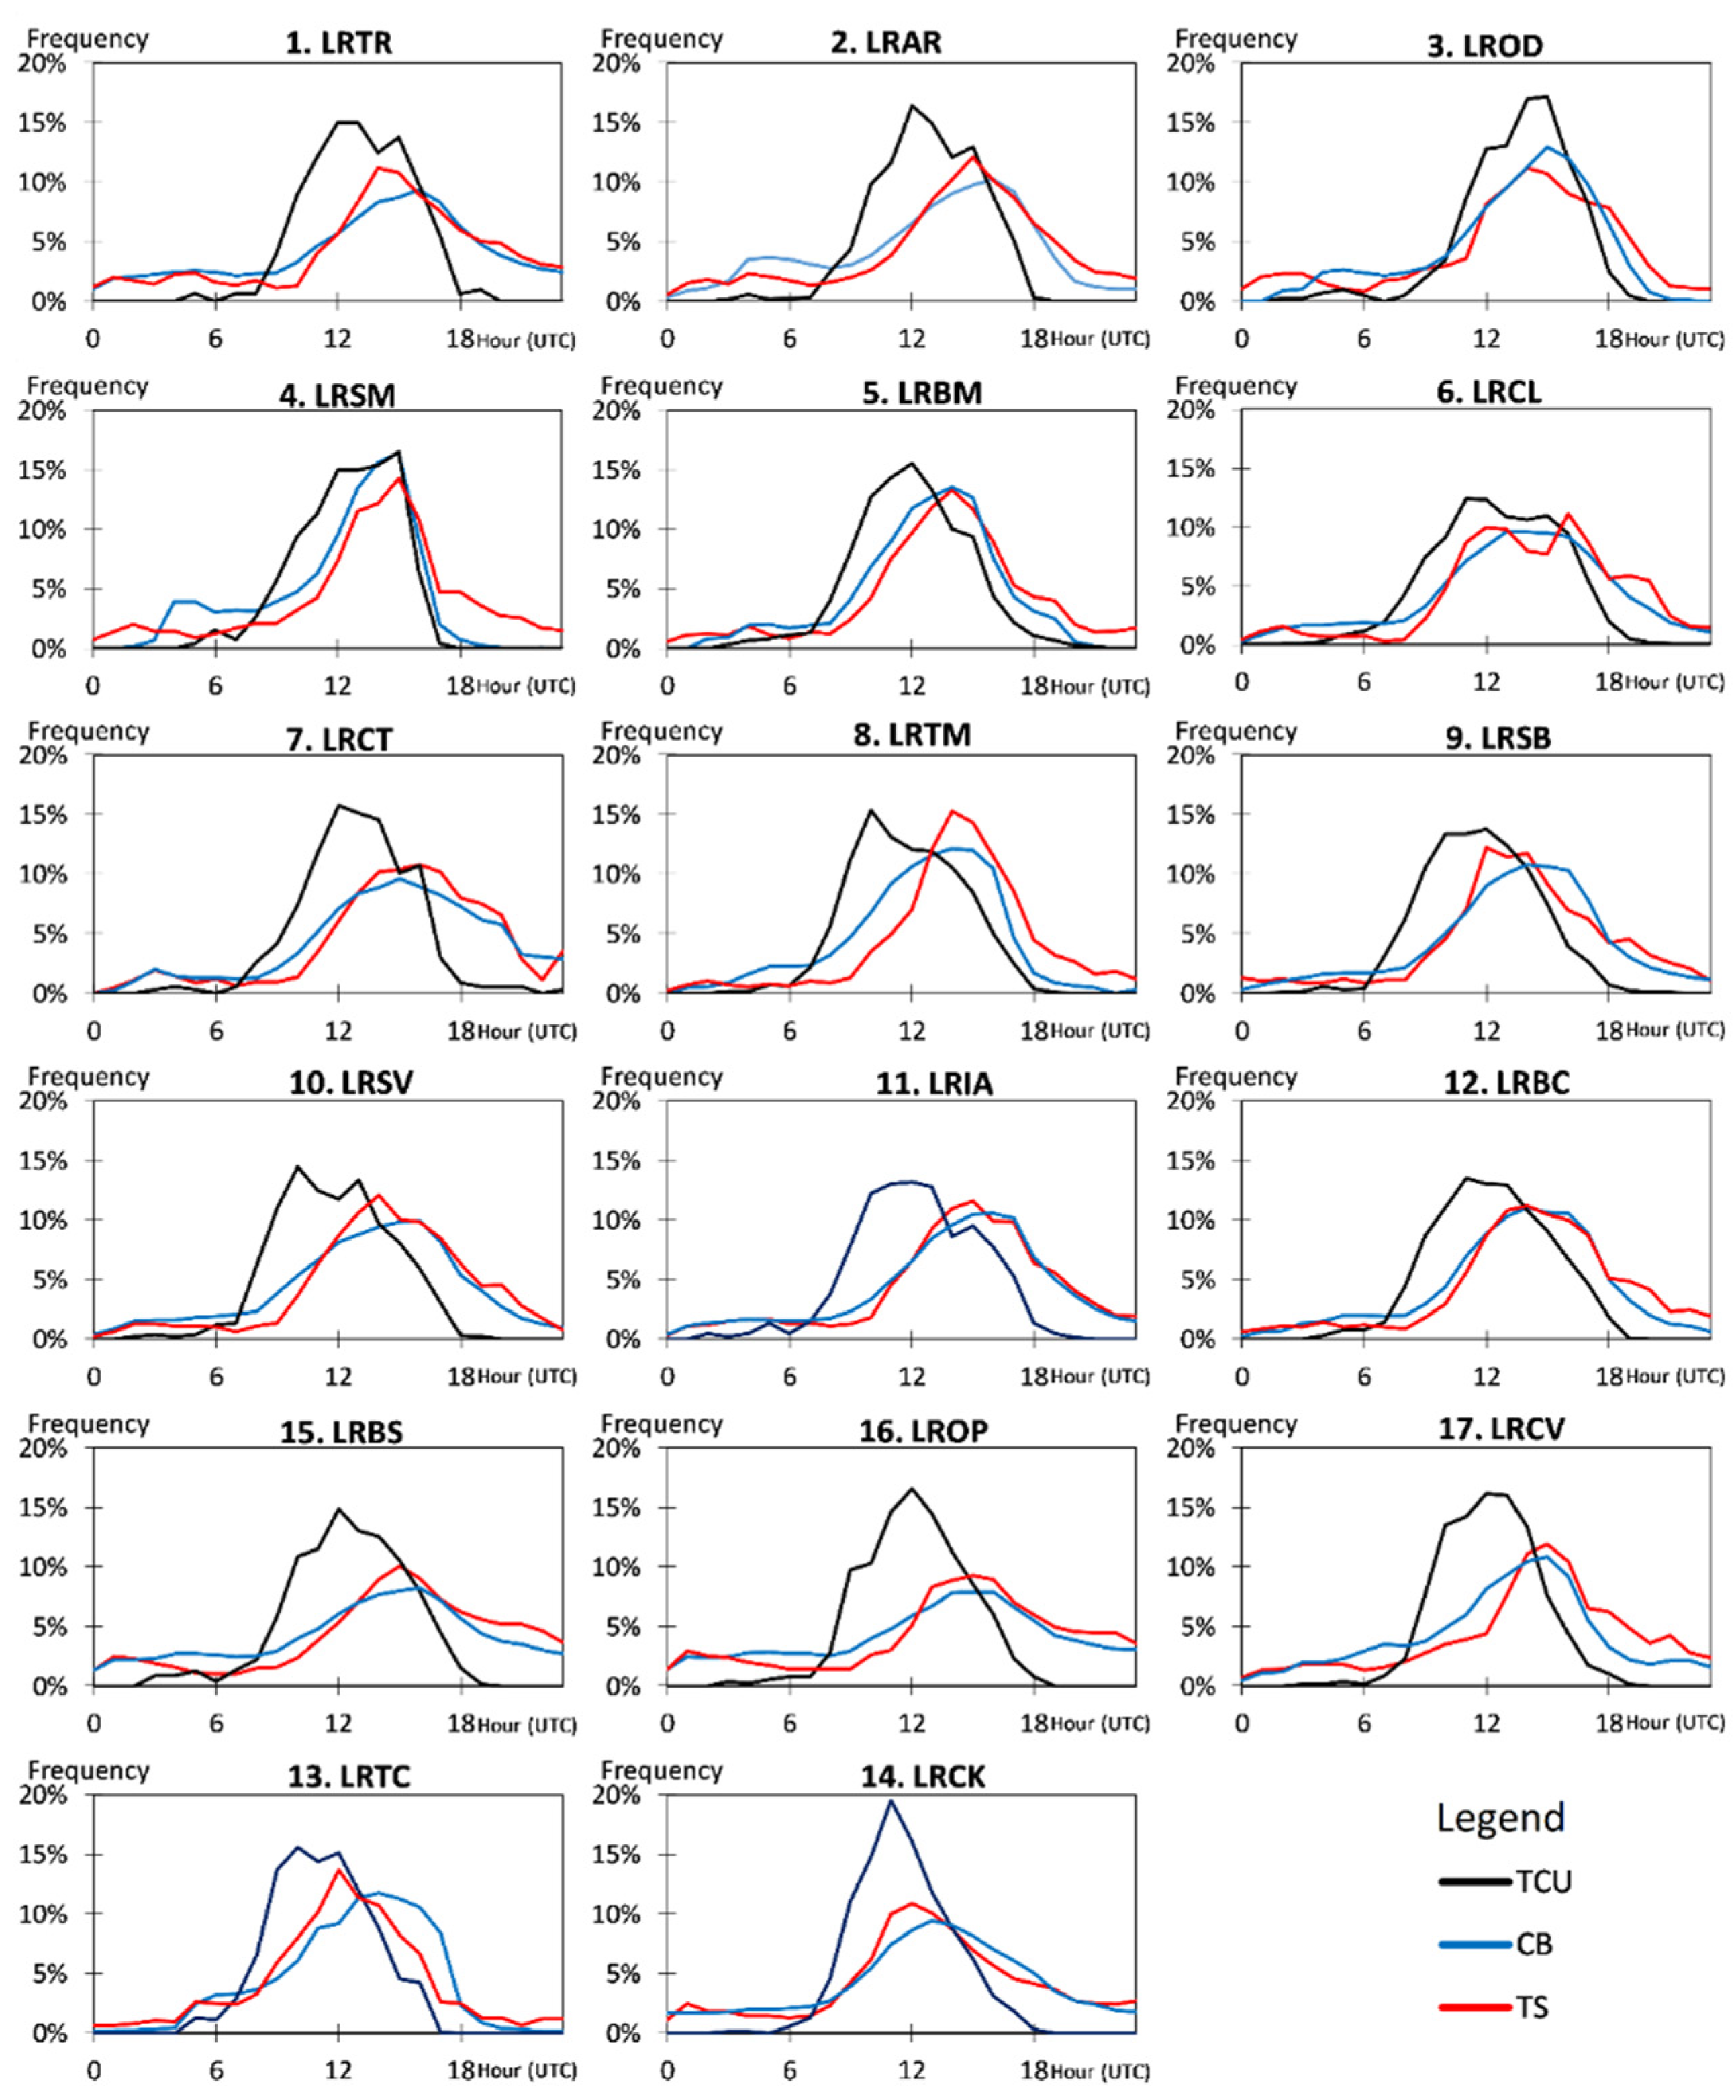
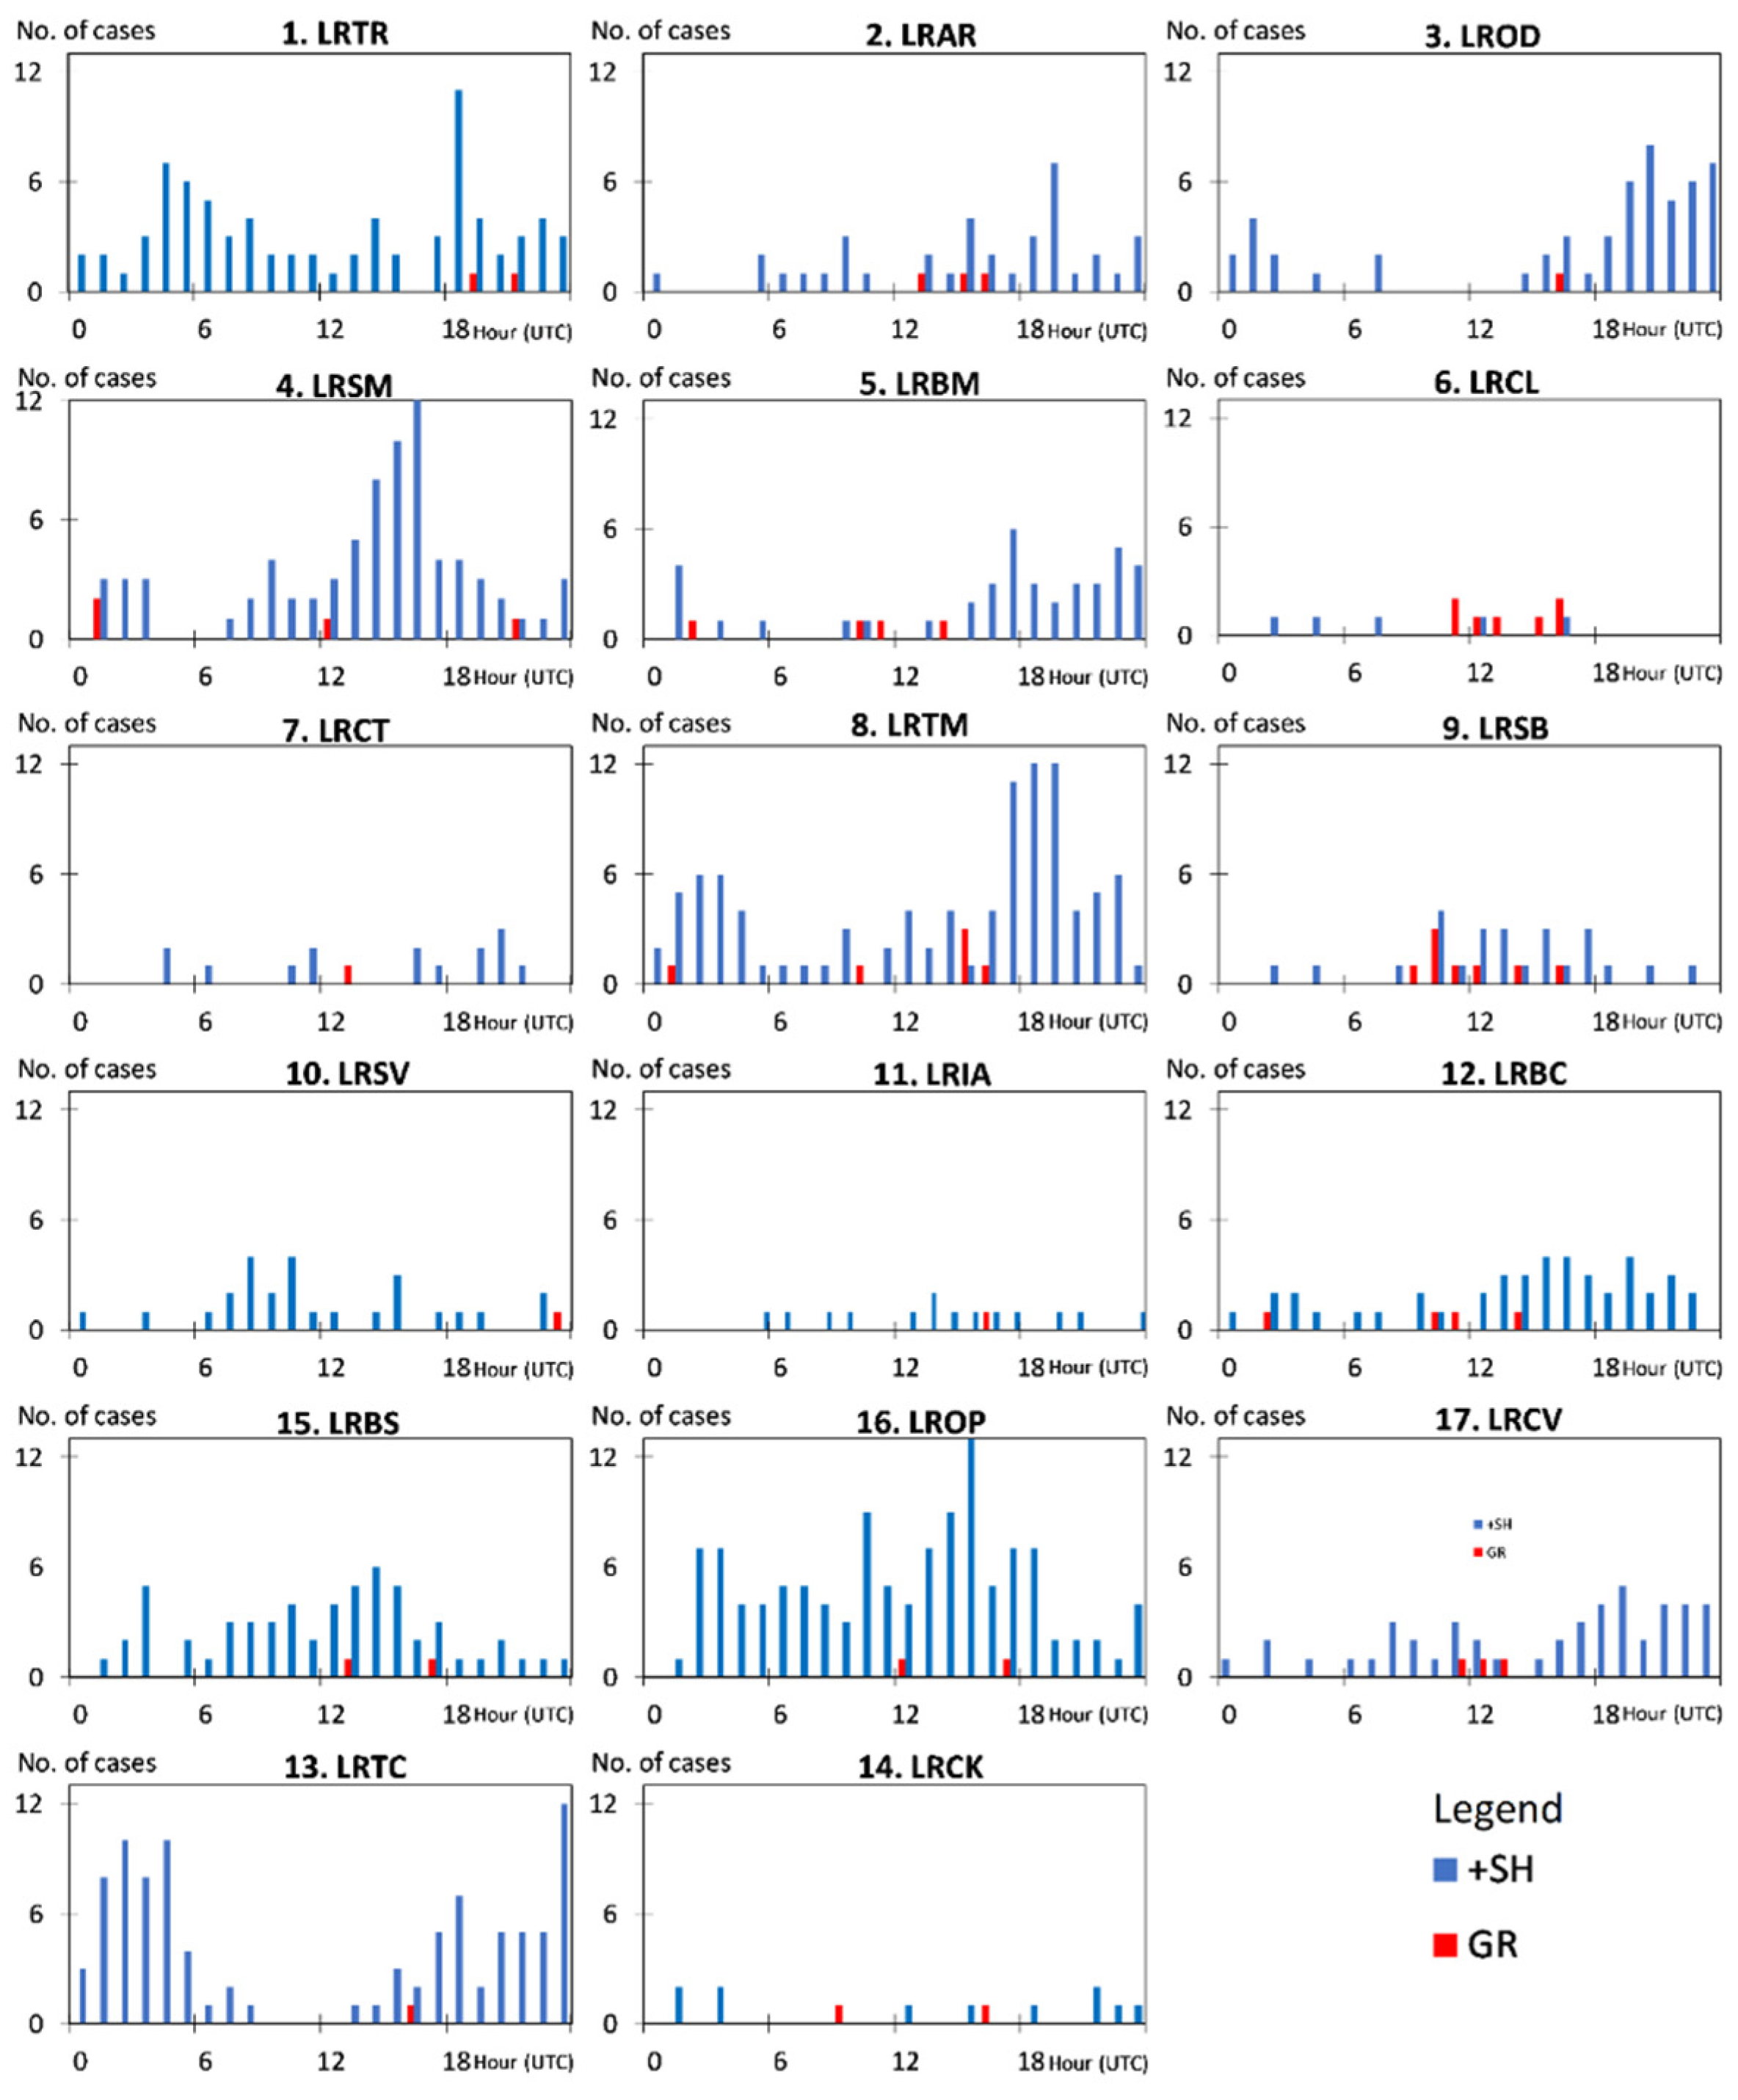
3.1.3. Hourly Distribution of Convective-Related Variables
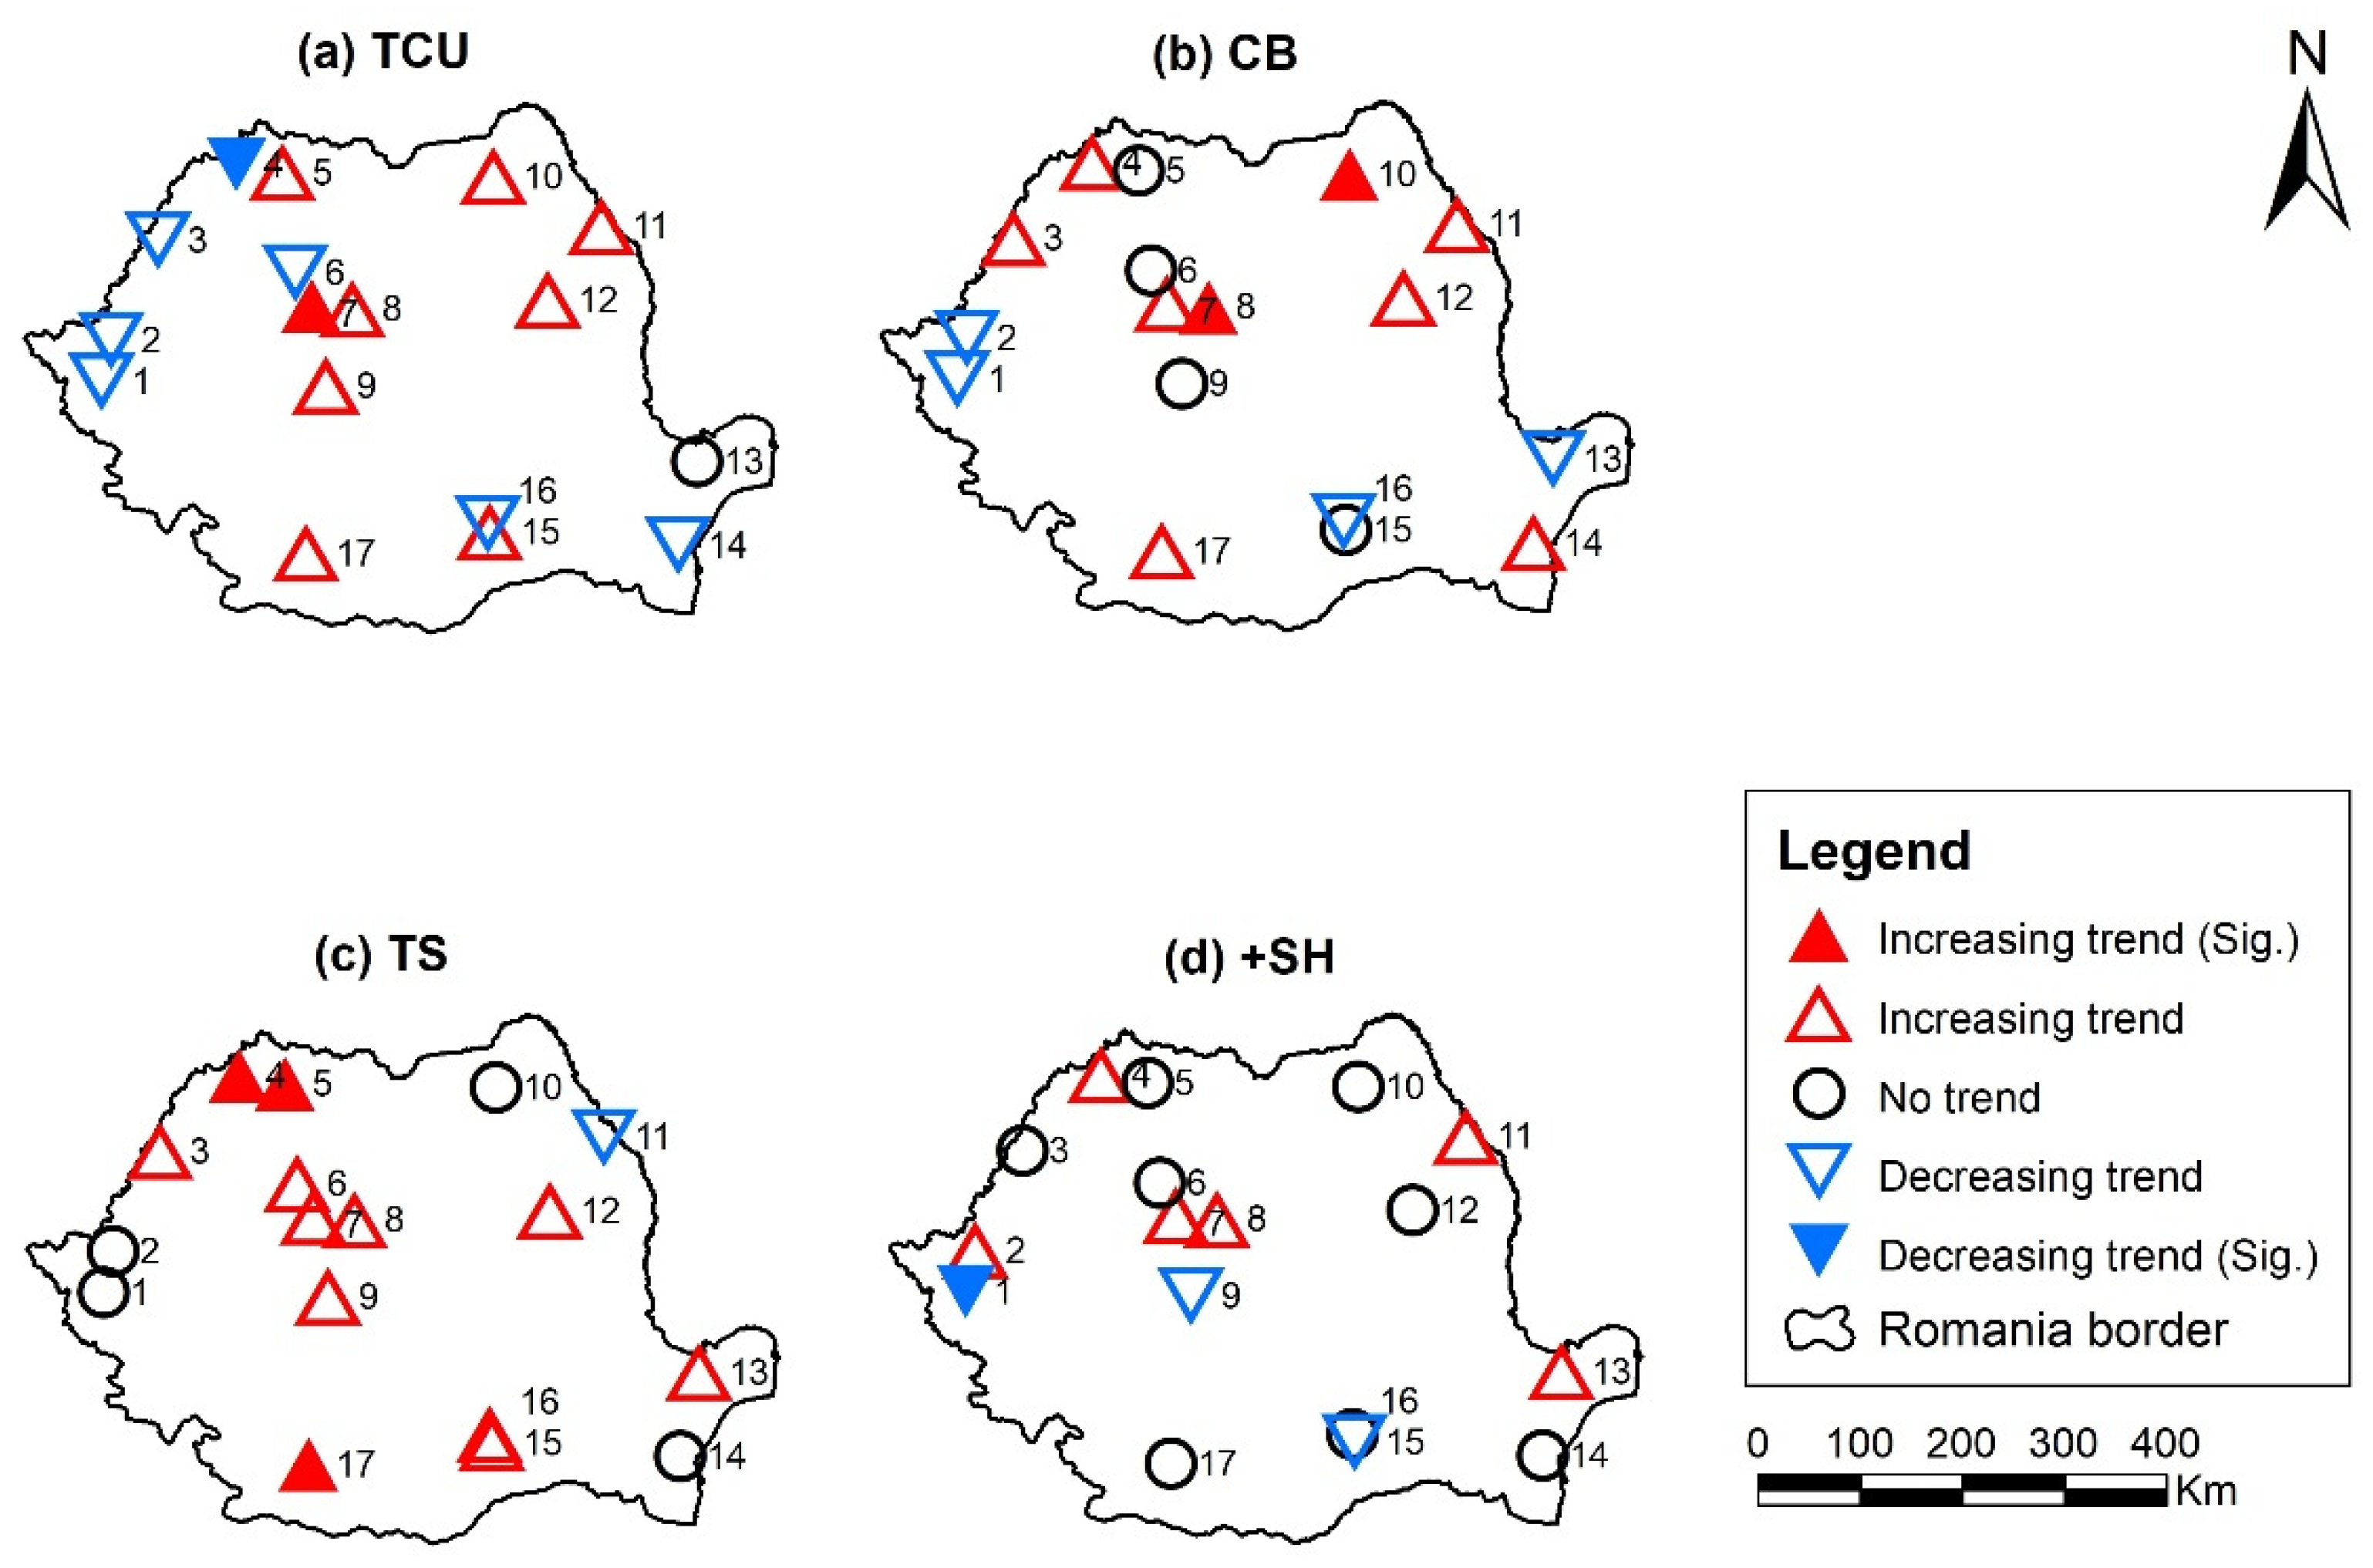
3.2. Trends in METAR Variables Related to Convective Events
4. Conclusions
Author Contributions
Funding
Institutional Review Board Statement
Informed Consent Statement
Data Availability Statement
Acknowledgments
Conflicts of Interest
References
- Tang, J.; Xu, L.; Yao, R.; Ou, X.; Long, Q.; Wang, X. Characteristics of Environmental Parameters of Compound and Single Type Severe Convection in Hunan. Atmosphere 2022, 13, 1870. [Google Scholar] [CrossRef]
- Guijo-Rubio, D.; Casanova-Mateo, C.; Sanz-Justo, J.; Gutiérrez, P.A.; Cornejo-Bueno, S.; Hervás, C.; Salcedo-Sanz, S. Ordinal Regression Algorithms for the Analysis of Convective Situations over Madrid-Barajas Airport. Atmos. Res. 2020, 236, 104798. [Google Scholar] [CrossRef]
- Henken, C.C.; Schmeits, M.J.; Deneke, H.; Roebeling, R.A. Using MSG-SEVIRI Cloud Physical Properties and Weather Radar Observations for the Detection of Cb/TCu Clouds. J. Appl. Meteorol. Climatol. 2011, 50, 1587–1600. [Google Scholar] [CrossRef]
- Lin, J.; Qian, T.; Bechtold, P.; Grell, G.; Zhang, G.J.; Zhu, P.; Freitas, S.R.; Barnes, H.; Han, J. Atmospheric Convection. Atmos. Ocean. 2022, 60, 422–476. [Google Scholar] [CrossRef]
- Seeley, J.T.; Romps, D.M. The effect of global warming on severe thunderstorms in the United States. J. Clim. 2015, 28, 2443–2458. [Google Scholar] [CrossRef]
- Rädler, A.; Groenemeijer, P.; Faust, E.; Sausen, R.; Púčik, T. Frequency of severe thunderstorms across Europe expected to increase in the 21st century due to rising instability. NPJ Clim. Atmos. Sci. 2019, 2, 30. [Google Scholar] [CrossRef]
- Taszarek, M.; Allen, J.T.; Brooks, H.E.; Pilguj, N.; Czernecki, B. Differing Trends in United States and European Severe Thunderstorm Environments in a Warming Climate. Bull. Am. Meteorol. Soc. 2021, 102, E296–E322. [Google Scholar] [CrossRef]
- Dowdy, A.J. Climatology of Thunderstorms, Convective Rainfall and Dry Lightning Environments in Australia. Clim. Dyn. 2020, 54, 3041–3052. [Google Scholar] [CrossRef]
- Burcea, S.; Cica, R.; Bojariu, R. Hail Climatology and Trends in Romania: 1961–2014. Mon. Weather. Rev. 2016, 144, 4289–4299. [Google Scholar] [CrossRef]
- Chernokulsky, A.V.; Eliseev, A.V.; Kozlov, F.A.; Korshunova, N.N.; Kurgansky, M.V.; Mokhov, I.I.; Semenov, V.A.; Shvets’, N.V.; Shikhov, A.N.; Yarinich, Y.I. Atmospheric Severe Convective Events in Russia: Changes Observed from Different Data. Russ. Meteorol. Hydrol. 2022, 47, 343–354. [Google Scholar] [CrossRef]
- Raihan, M.L.; Onitsuka, K.; Basu, M.; Shimizu, N.; Hoshino, S. Rapid Emergence and Increasing Risks of Hailstorms: A Potential Threat to Sustainable Agriculture in Northern Bangladesh. Sustainability 2020, 12, 5011. [Google Scholar] [CrossRef]
- Firouzabadi, M.; Mirzaei, M.; Mohebalhojeh, A.R. The Climatology of Severe Convective Storms in Tehran. Atmos. Res. 2019, 221, 34–45. [Google Scholar] [CrossRef]
- Sun, J.; Chai, J.; Leng, L.; Xu, G. Analysis of Lightning and Precipitation Activities in Three Severe Convective Events Based on Doppler Radar and Microwave Radiometer over the Central China Region. Atmosphere 2019, 10, 298. [Google Scholar] [CrossRef]
- Chernokulsky, A.V.; Bulygina, O.N.; Mokhov, I.I. Recent Variations of Cloudiness over Russia from Surface Daytime Observations. Environ. Res. Lett. 2011, 6, 035202. [Google Scholar] [CrossRef]
- Taszarek, M.; Allen, J.; Púčik, T.; Groenemeijer, P.; Czernecki, B.; Kolendowicz, L.; Lagouvardos, K.; Kotroni, V.; Schulz, W. A Climatology of Thunderstorms across Europe from a Synthesis of Multiple Data Sources. J. Clim. 2019, 32, 1813–1837. [Google Scholar] [CrossRef]
- Molnar, P.; Fatichi, S.; Gaál, L.; Szolgay, J.; Burlando, P. Storm type effects on super Clausius–Clapeyron scaling of intense rainstorm properties with air temperature. Hydrol. Earth Syst. Sci. 2015, 19, 1753–1766. [Google Scholar] [CrossRef]
- Manea, A.; Birsan, M.V.; Tudorache, G.; Cărbunaru, F. Changes in the Type of Precipitation and Associated Cloud Types in Eastern Romania (1961–2008). Atmos. Res. 2016, 169, 357–365. [Google Scholar] [CrossRef]
- Mohr, S.; Kunz, M. Recent trends and variabilities of convective parameters relevant for hail events in Germany and Europe. Atmos. Res. 2013, 123, 211–228. [Google Scholar] [CrossRef]
- Llasat, M.C.; del Moral, A.; Cortès, M.; Rigo, T. Convective Precipitation Trends in the Spanish Mediterranean Region. Atmos. Res. 2021, 257, 105581. [Google Scholar] [CrossRef]
- Ivanova, A.R.; Skriptunova, E.N. Variations in Some Climatological Characteristics at the Aerodromes of the Russian Federation in 2001–2015. Russ. Meteorol. Hydrol. 2018, 43, 302–312. [Google Scholar] [CrossRef]
- Kapsch, M.L.; Kunz, M.; Vitolo, R.; Economou, T. Long-term trends of hail-related weather types in an ensemble of regional climate models using a Bayesian approach. J. Geophys. Res. 2012, 117, D15107. [Google Scholar] [CrossRef]
- Púčik, T.; Groenemeijer, P.; Rädler, A.T.; Tijssen, L.; Nikulin, G.; Prein, A.F.; van Meijgaard, E.; Fealy, R.; Jacob, D.; Teichmann, C. Future Changes in European Severe Convection Environments in a Regional Climate Model Ensemble. J. Clim. 2017, 30, 6771–6794. [Google Scholar] [CrossRef]
- Carbunaru, D.V.; Sasu, M.; Burcea, S.; Bell, A. Detection of Hail through the Three-Body Scattering Signatures and Its Effects on Radar Algorithms Observed in Romania. Atmósfera 2014, 27, 21–34. [Google Scholar] [CrossRef]
- Antonescu, B.; Bell, A. Tornadoes in Romania. Mon. Weather Rev. 2015, 143, 689–701. [Google Scholar] [CrossRef]
- Andrei, S.; Andrei, M.D.; Huştiu, M.; Cheval, S.; Antonescu, B. Tornadoes in Romania—From Forecasting and Warning to Understanding Public’s Response and Expectations. Atmosphere 2020, 11, 966. [Google Scholar] [CrossRef]
- Yesubabu, V.; Islam, S.; Sikka, D.R.; Kaginalkar, A.; Kashid, S.; Srivastava, A.K. Impact of Variational Assimilation Technique on Simulation of a Heavy Rainfall Event over Pune, India. Nat. Hazards 2014, 71, 639–658. [Google Scholar] [CrossRef]
- Igri, P.M.; Tanessong, R.S.; Vondou, D.A.; Mkankam, F.K.; Panda, J. Added-Value of 3DVAR Data Assimilation in the Simulation of Heavy Rainfall Events Over West and Central Africa. Pure Appl. Geophys. 2015, 172, 2751–2776. [Google Scholar] [CrossRef]
- Wan, Z.; Liu, X.; Xu, C. Multi-Source Observations and High-Resolution Numerical Model Applied on the Analysis of a Severe Convective Weather Affecting the Airport. Meteorol. Appl. 2021, 28, e2012. [Google Scholar] [CrossRef]
- Oo, K.T.; Oo, K.L. Analysis of the Most Common Aviation Weather Hazard and Its Key Mechanisms over the Yangon Flight Information Region. Adv. Meteorol. 2022, 2022, 5356563. [Google Scholar] [CrossRef]
- Yavuz, V.; Lupo, A.R.; Fox, N.I.; Deniz, A. Meso-Scale Comparison of Non-Sea-Effect and Sea-Effect Snowfalls, and Development of Prediction Algorithm for Megacity Istanbul Airports in Turkey. Atmosphere 2022, 13, 657. [Google Scholar] [CrossRef]
- Dogra, G.; Dewan, A.; Sahany, S. Understanding Atmospheric Convection Using Large Eddy Simulation. Fluids 2023, 8, 51. [Google Scholar] [CrossRef]
- Paraschivescu, M.; Rambu, N.; Stefan, S. Atmospheric Circulations Associated to the Interannual Variability of Cumulonimbus Cloud Frequency in the Southern Part of Romania. Int. J. Climatol. 2012, 32, 920–928. [Google Scholar] [CrossRef]
- Dumitrescu, A.; Cheval, S.; Guijarro, J.A. Homogenization of a Combined Hourly Air Temperature Dataset over Romania. Int. J. Climatol. 2020, 40, 2599–2608. [Google Scholar] [CrossRef]
- Jelić, D.; Telišman Prtenjak, M.; Malečić, B.; Belušić Vozila, A.; Megyeri, O.A.; Renko, T. A New Approach for the Analysis of Deep Convective Events: Thunderstorm Intensity Index. Atmosphere 2021, 12, 908. [Google Scholar] [CrossRef]
- Yeh, N.-C.; Chuang, Y.-C.; Peng, H.-S.; Chen, C.-Y. Application of AIRS Soundings to Afternoon Convection Forecasting and Nowcasting at Airports. Atmosphere 2022, 13, 61. [Google Scholar] [CrossRef]
- ICAO. Technical Specifications Related to Meteorological Observations and Reports: Appendix 3. Annex 3 to the Convention on International Civil Aviation: Meteorological Service for International Air Navigation, 17th ed.; International Civil Aviation Organization: Montreal, QC, Canada, 2010. [Google Scholar]
- World Meteorological Organization (WMO). WMO-No. 782 Aerodrome Reports and Forecasts: A User’s Handbook to the Codes, 2022 ed.; WMO: Geneva, Switzerland; Available online: https://library.wmo.int/records/item/30224-aerodrome-reports-and-forecasts?offset=2 (accessed on 23 March 2024).
- Priya, K.; Nadimpalli, R.; Osuri, K.K. Do Increasing Horizontal Resolution and Downscaling Approaches Produce a Skillful Thunderstorm Forecast? Nat. Hazards 2021, 109, 1655–1674. [Google Scholar] [CrossRef]
- Yavuz, V.; Lupo, A.R.; Fox, N.I.; Deniz, A. Statistical Characteristics of Sea-Effect Snow Events over the Western Black Sea. Theor. Appl. Climatol. 2022, 150, 955–968. [Google Scholar] [CrossRef]
- Yavuz, V.; Lupo, A.R.; Fox, N.I.; Deniz, A. A long-term analysis of thundersnow events over the Marmara Region, Turkey. Nat. Hazards 2022, 114, 367–387. [Google Scholar] [CrossRef]
- Barbu, N.; Georgescu, F.; Stefan, S. Lage-scale mechanism responsible for heat waves occurrence in Romania. Rom. J. Phys. 2014, 59, 1109–1126. [Google Scholar]
- Andrei, S.; Antonescu, B.; Boldeanu, M.; Mărmureanu, L.; Marin, C.A.; Vasilescu, J.; Ene, D. An Exceptional Case of Freezing Rain in Bucharest (Romania). Atmosphere 2019, 10, 673. [Google Scholar] [CrossRef]
- Kendall, M. Rank Correlation Methods, 4th ed.; Charles Griffin: Glasgow, Scotland, 1975; p. 202. [Google Scholar]
- Batista, P.; Clemesha, B.; Simonich, D. A 14-year monthly climatology and trend in the 35–65 km altitude range from Rayleigh Lidar temperature measurements at a low latitude station. J. Atmos. Sol. Terr. Phys. 2009, 71, 1456–1462. [Google Scholar] [CrossRef]
- Van Beusekom, A.; González, G.; Rivera, M. Short-term precipitation and temperature trends along an elevation gradient in northeastern Puerto Rico. Earth Interact. 2015, 19, 1–33. [Google Scholar] [CrossRef]
- Egli, S.; Thies, B.; Drönner, J.; Cermak, J.; Bendix, J. A 10 year fog and low stratus climatology for Europe based on Meteosat Second Generation data. Q. J. R. Meteorol. Soc. 2017, 143, 530–541. [Google Scholar] [CrossRef]
- Mildrexler, D.; Shaw, D.C.; Cohen, W.B. Short-term climate trends and the Swiss needle cast epidemic in Oregon’s public and private coastal forestlands. For. Ecol. Manag. 2019, 432, 501–513. [Google Scholar] [CrossRef]
- Bhardwaj, P.; Singh, O. Spatial and Temporal Analysis of Thunderstorm and Rainfall Activity over India. Atmósfera 2018, 31, 255–284. [Google Scholar] [CrossRef]
- Letson, F.; Shepherd, T.J.; Barthelmie, R.J.; Pryor, S.C. Modelling Hail and Convective Storms with WRF for Wind Energy Applications. J. Phys. Conf. Ser. 2020, 1452, 012051. [Google Scholar] [CrossRef]
- Punge, H.J.; Kunz, M. Hail Observations and Hailstorm Characteristics in Europe: A Review. Atmos. Res. 2016, 176–177, 159–184. [Google Scholar] [CrossRef]
- Chakraborty, D.; Mondal, J.; Barua, H.B.; Bhattacharjee, A. Computational solar energy–Ensemble learning methods for prediction of solar power generation based on meteorological parameters in Eastern India. Renew. Energy Focus. 2023, 44, 277–294. [Google Scholar] [CrossRef]
- Istrate, V.; Dobri, R.V.; Bărcăcianu, F.; Ciobanu, R.A.; Apostol, L. A Ten Years Hail Climatology Based on Eswd Hail Reports in Romania, 2007–2016. Geogr. Tech. 2017, 12, 110–118. [Google Scholar] [CrossRef]
- Laviola, S.; Monte, G.; Cattani, E.; Levizzani, V. Hail Climatology in the Mediterranean Basin Using the GPM Constellation (1999–2021). Remote Sens. 2022, 14, 4320. [Google Scholar] [CrossRef]
- Rusz, O. Cumulonimbus Clouds and Related Weather Phenomena at Târgu-Mureş, Romania. In Proceedings of the Air and Water Components of the Environment International Conference, Cluj-Napoca, Romania, 17–19 March 2014. [Google Scholar]
- Groisman, P.; Knight, R.W.; Easterling, D.R.; Karl, T.R.; Hegerl, G.C.; Razuvaev, V.N. Trends in precipitation Intensity in the climate record. J. Clim. 2005, 18, 1326–1350. [Google Scholar] [CrossRef]
- Warren, S.G.; Eastman, R.; Hahn, C.J. Asurvey of changes in cloud cover and cloud types over land from surface observations, 1971–1996. J. Clim. 2007, 20, 717–738. [Google Scholar] [CrossRef]
- Khlebnikova, E.I.; Sall, I.A. Peculiarities of climatic changes in cloud cover over the Russian Federation. Russ. Meteorol. Hydrol. 2009, 34, 411–417. [Google Scholar] [CrossRef]


| No | Station | Location | Latitude (deg) | Longitude (deg) | Elevation (m) |
|---|---|---|---|---|---|
| 1. | LRTR | Timişoara | 45.7711 | 21.2582 | 88 |
| 2. | LRAR | Arad | 46.1336 | 21.3536 | 118 |
| 3. | LROD | Oradea | 47.0358 | 21.8958 | 140 |
| 4. | LRSM | Satu Mare | 47.7214 | 22.8872 | 124 |
| 5. | LRBM | Baia Mare | 47.6608 | 23.4917 | 185 |
| 6. | LRCL | Cluj-Napoca | 46.7821 | 23.6758 | 413 |
| 7. | LRCT | Câmpia Turzii | 46.4957 | 23.8925 | 325 |
| 8. | LRTM | Târgu-Mureş | 46.4681 | 24.413 | 309 |
| 9. | LRSB | Sibiu | 45.7893 | 24.0913 | 444 |
| 10. | LRSV | Suceava | 47.6328 | 26.2406 | 351 |
| 11. | LRIA | Iaşi | 47.1708 | 27.6283 | 104 |
| 12. | LRBC | Bacău | 46.5319 | 26.9125 | 185 |
| 13. | LRTC | Tulcea | 45.0667 | 28.7167 | 6 |
| 14. | LRCK | Constanţa (Mihail Kogălniceanu) | 44.3333 | 28.4333 | 108 |
| 15. | LRBS | Bucureşti-Băneasa | 44.5 | 26.13 | 91 |
| 16. | LROP | Otopeni | 44.5722 | 26.1022 | 95 |
| 17. | LRCV | Craiova | 44.3103 | 23.8669 | 191 |
Disclaimer/Publisher’s Note: The statements, opinions and data contained in all publications are solely those of the individual author(s) and contributor(s) and not of MDPI and/or the editor(s). MDPI and/or the editor(s) disclaim responsibility for any injury to people or property resulting from any ideas, methods, instructions or products referred to in the content. |
© 2024 by the authors. Licensee MDPI, Basel, Switzerland. This article is an open access article distributed under the terms and conditions of the Creative Commons Attribution (CC BY) license (https://creativecommons.org/licenses/by/4.0/).
Share and Cite
Piticar, A.; Andrei, S.; Tudor, A. Spatiotemporal Variability of Convective Events in Romania Based on METAR Data. Sustainability 2024, 16, 3243. https://doi.org/10.3390/su16083243
Piticar A, Andrei S, Tudor A. Spatiotemporal Variability of Convective Events in Romania Based on METAR Data. Sustainability. 2024; 16(8):3243. https://doi.org/10.3390/su16083243
Chicago/Turabian StylePiticar, Adrian, Simona Andrei, and Alexandru Tudor. 2024. "Spatiotemporal Variability of Convective Events in Romania Based on METAR Data" Sustainability 16, no. 8: 3243. https://doi.org/10.3390/su16083243
APA StylePiticar, A., Andrei, S., & Tudor, A. (2024). Spatiotemporal Variability of Convective Events in Romania Based on METAR Data. Sustainability, 16(8), 3243. https://doi.org/10.3390/su16083243