

Evaluation of Ecosystem Services in Ruoergai National Park, China
Abstract
:1. Introduction
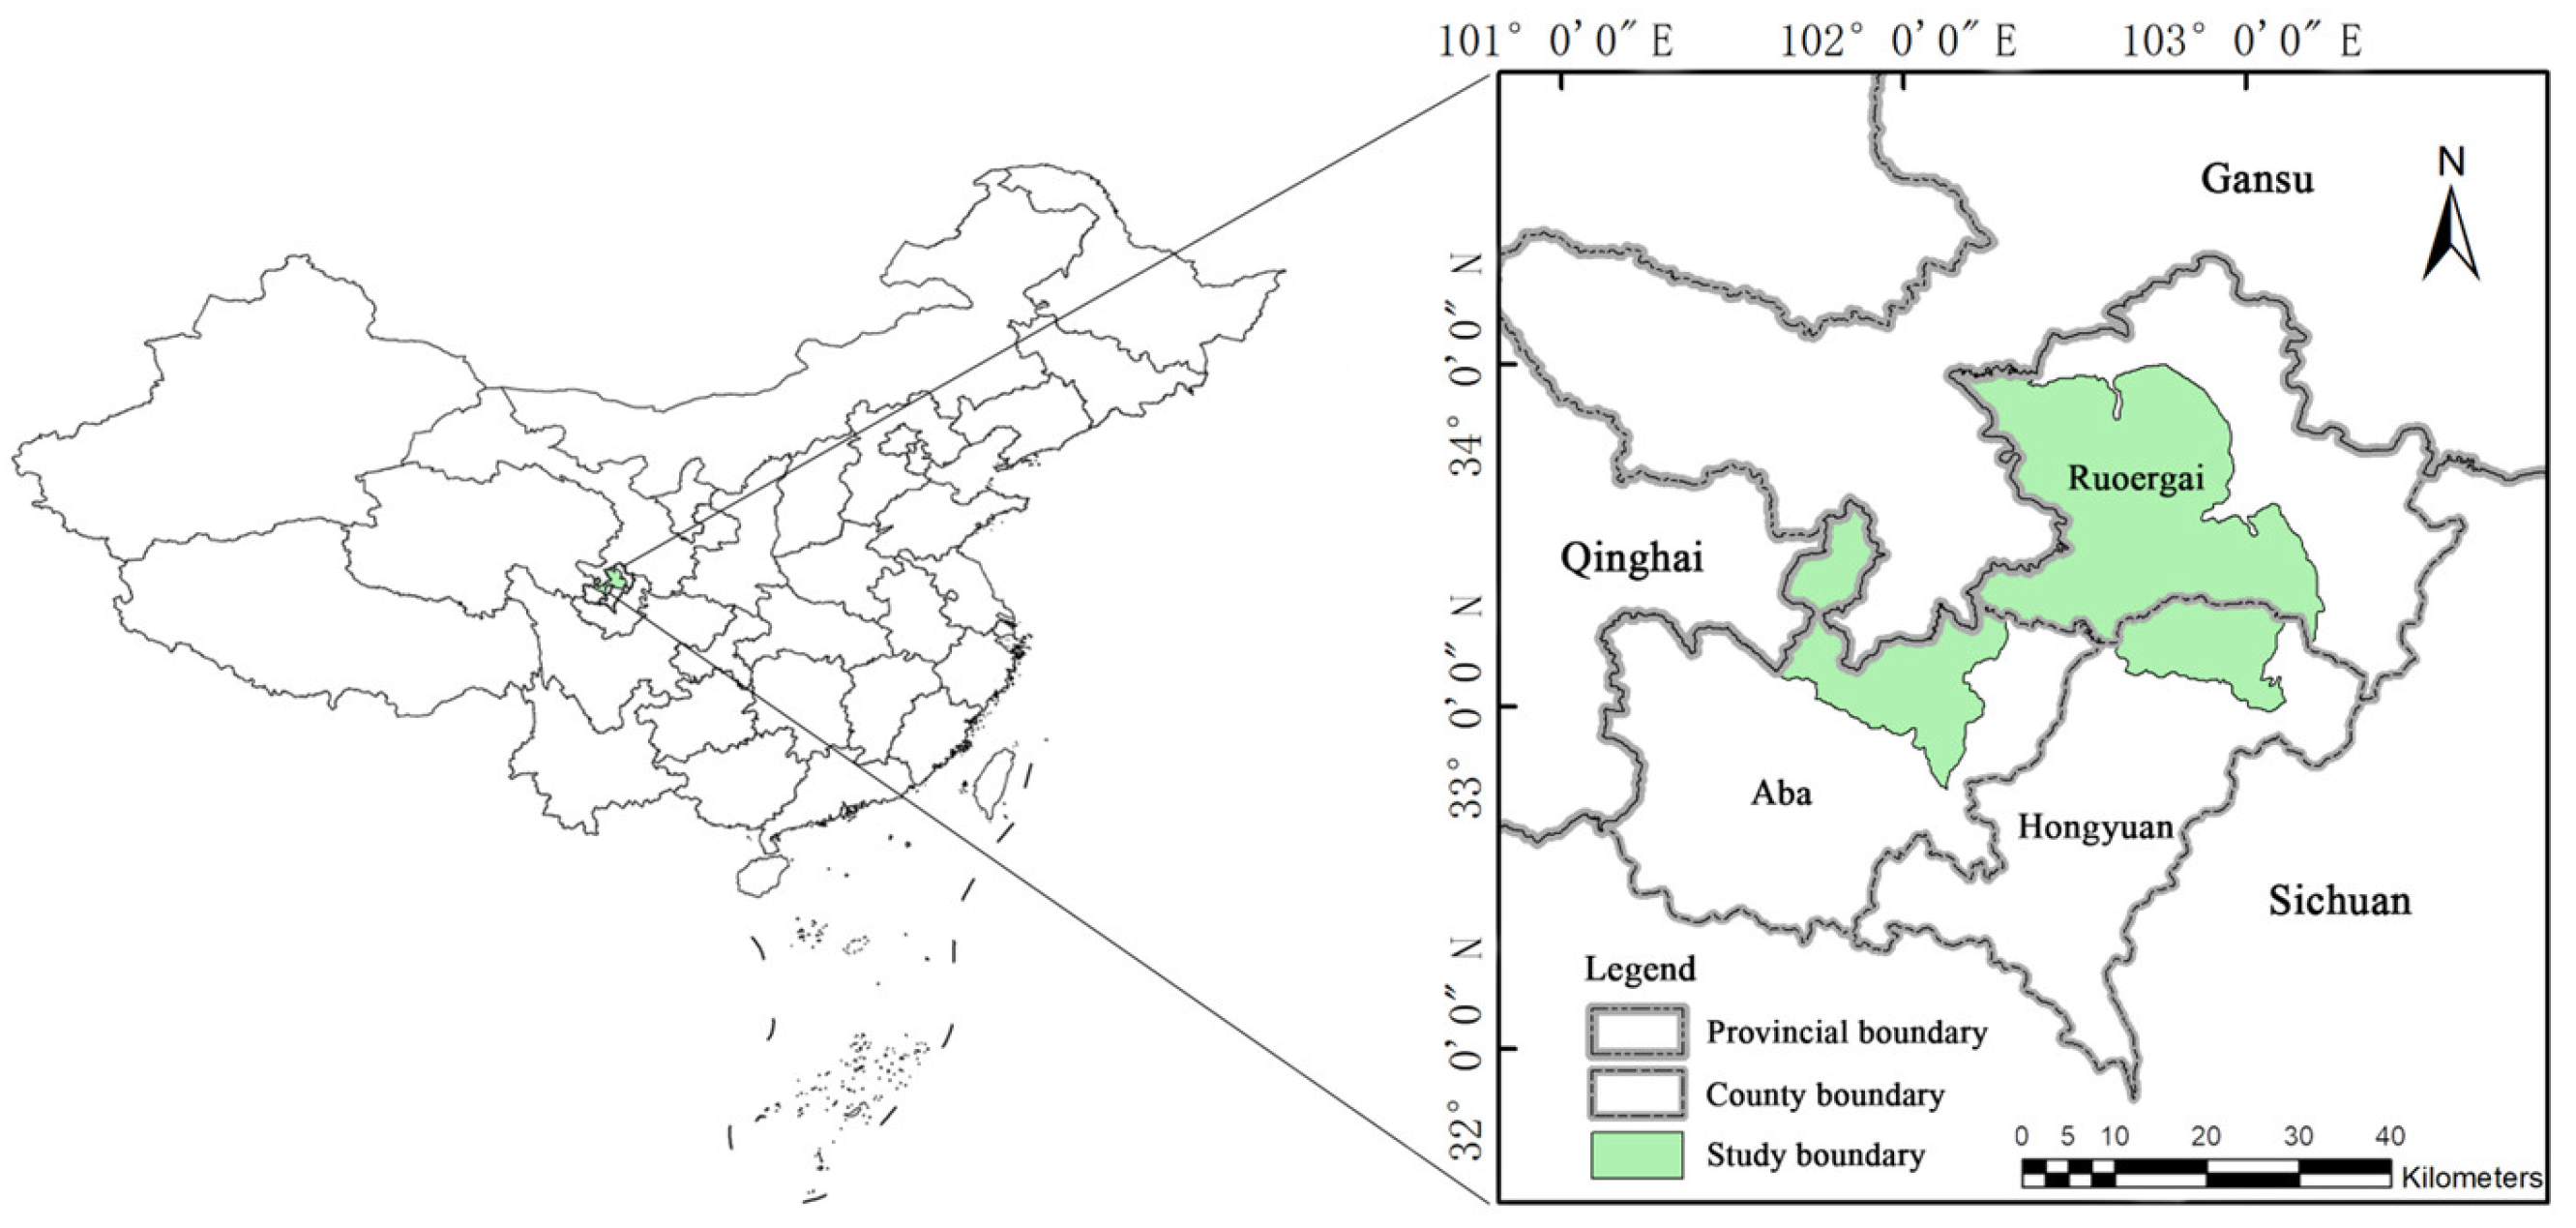
2. Study Area
3. Material and Methods
3.1. LULC Image Acquisition and Processing
3.2. Research Methods
3.2.1. Soil Retention Model
- (1)
- Model principle
- (2)
- Data source and processing
3.2.2. Carbon Storage Model
- (1)
- Model principle
- (2)
- Data source and processing
3.2.3. Water Supply Model
- (1)
- Model principle
- (2)
- Data source and processing
3.2.4. Habitat Quality Model
- (1)
- Model principle
- (2)
- Data source and processing
- ①
- Threat factor data
- ②
- Habitat adaptation and sensitivity data
3.2.5. Ecosystem Services Importance Zone
4. Results and Analysis
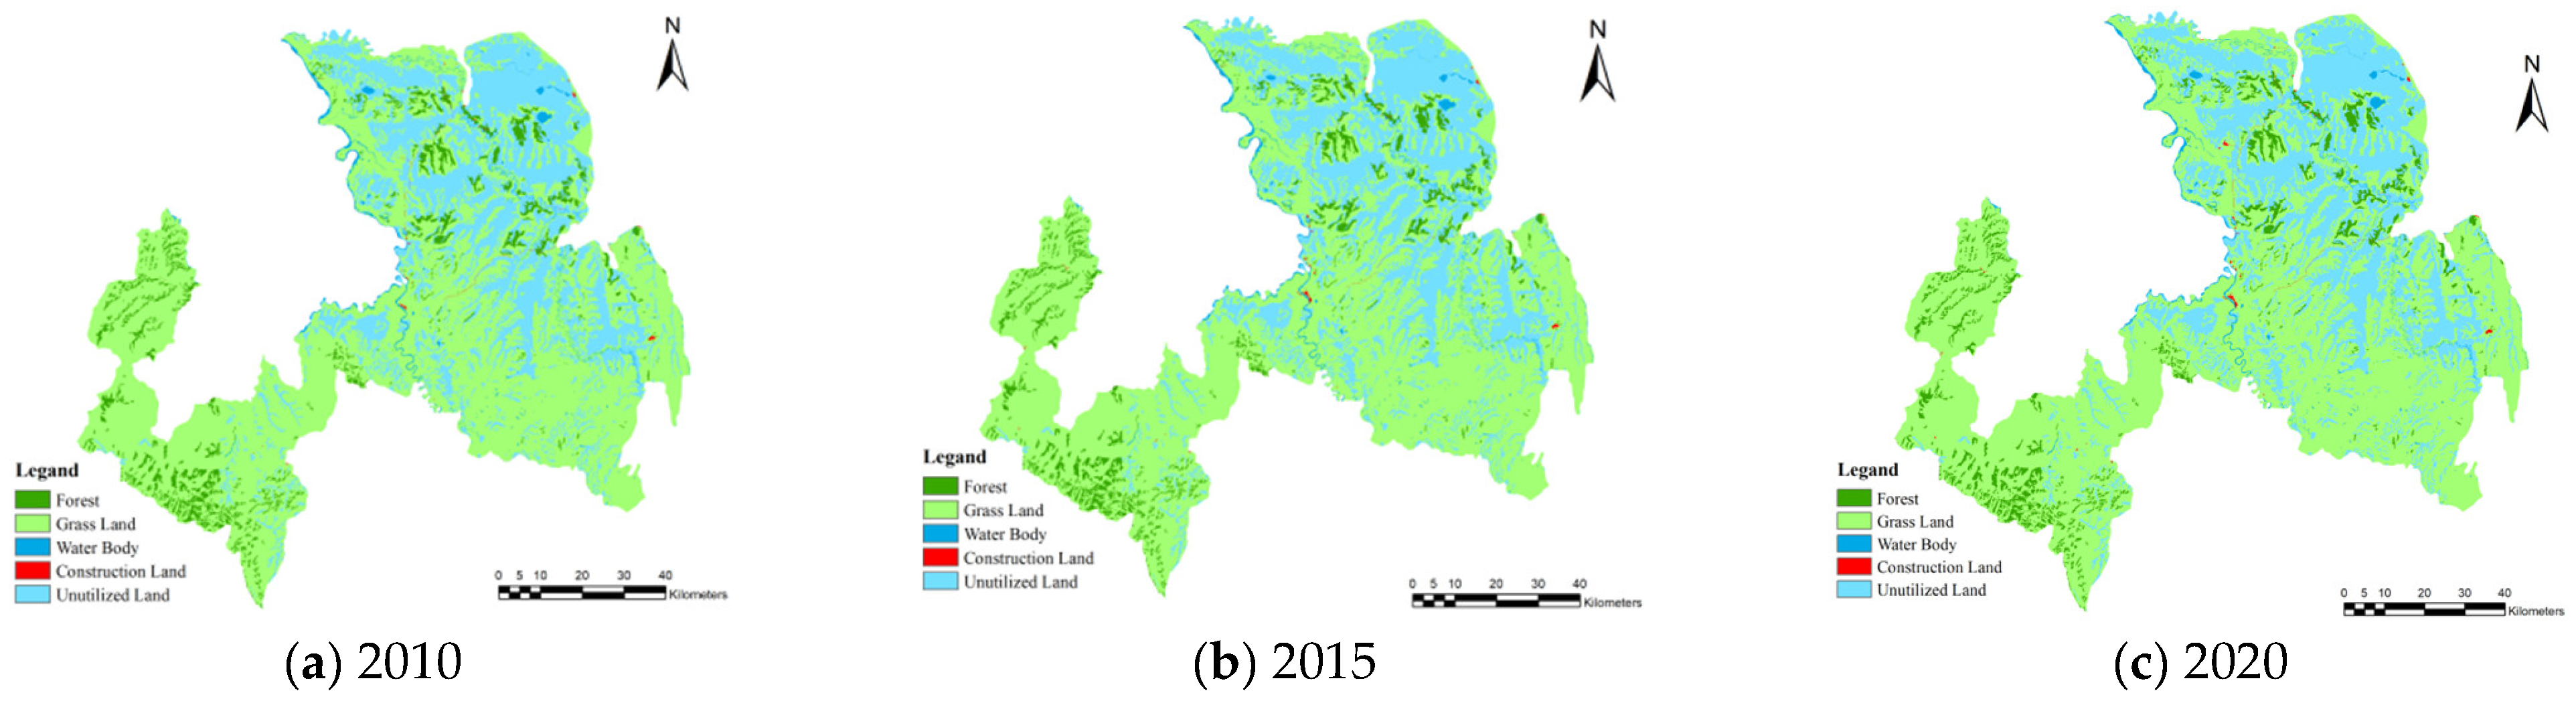
4.1. LULC Change Analysis
4.1.1. Temporal and Spatial Characteristics of LULC
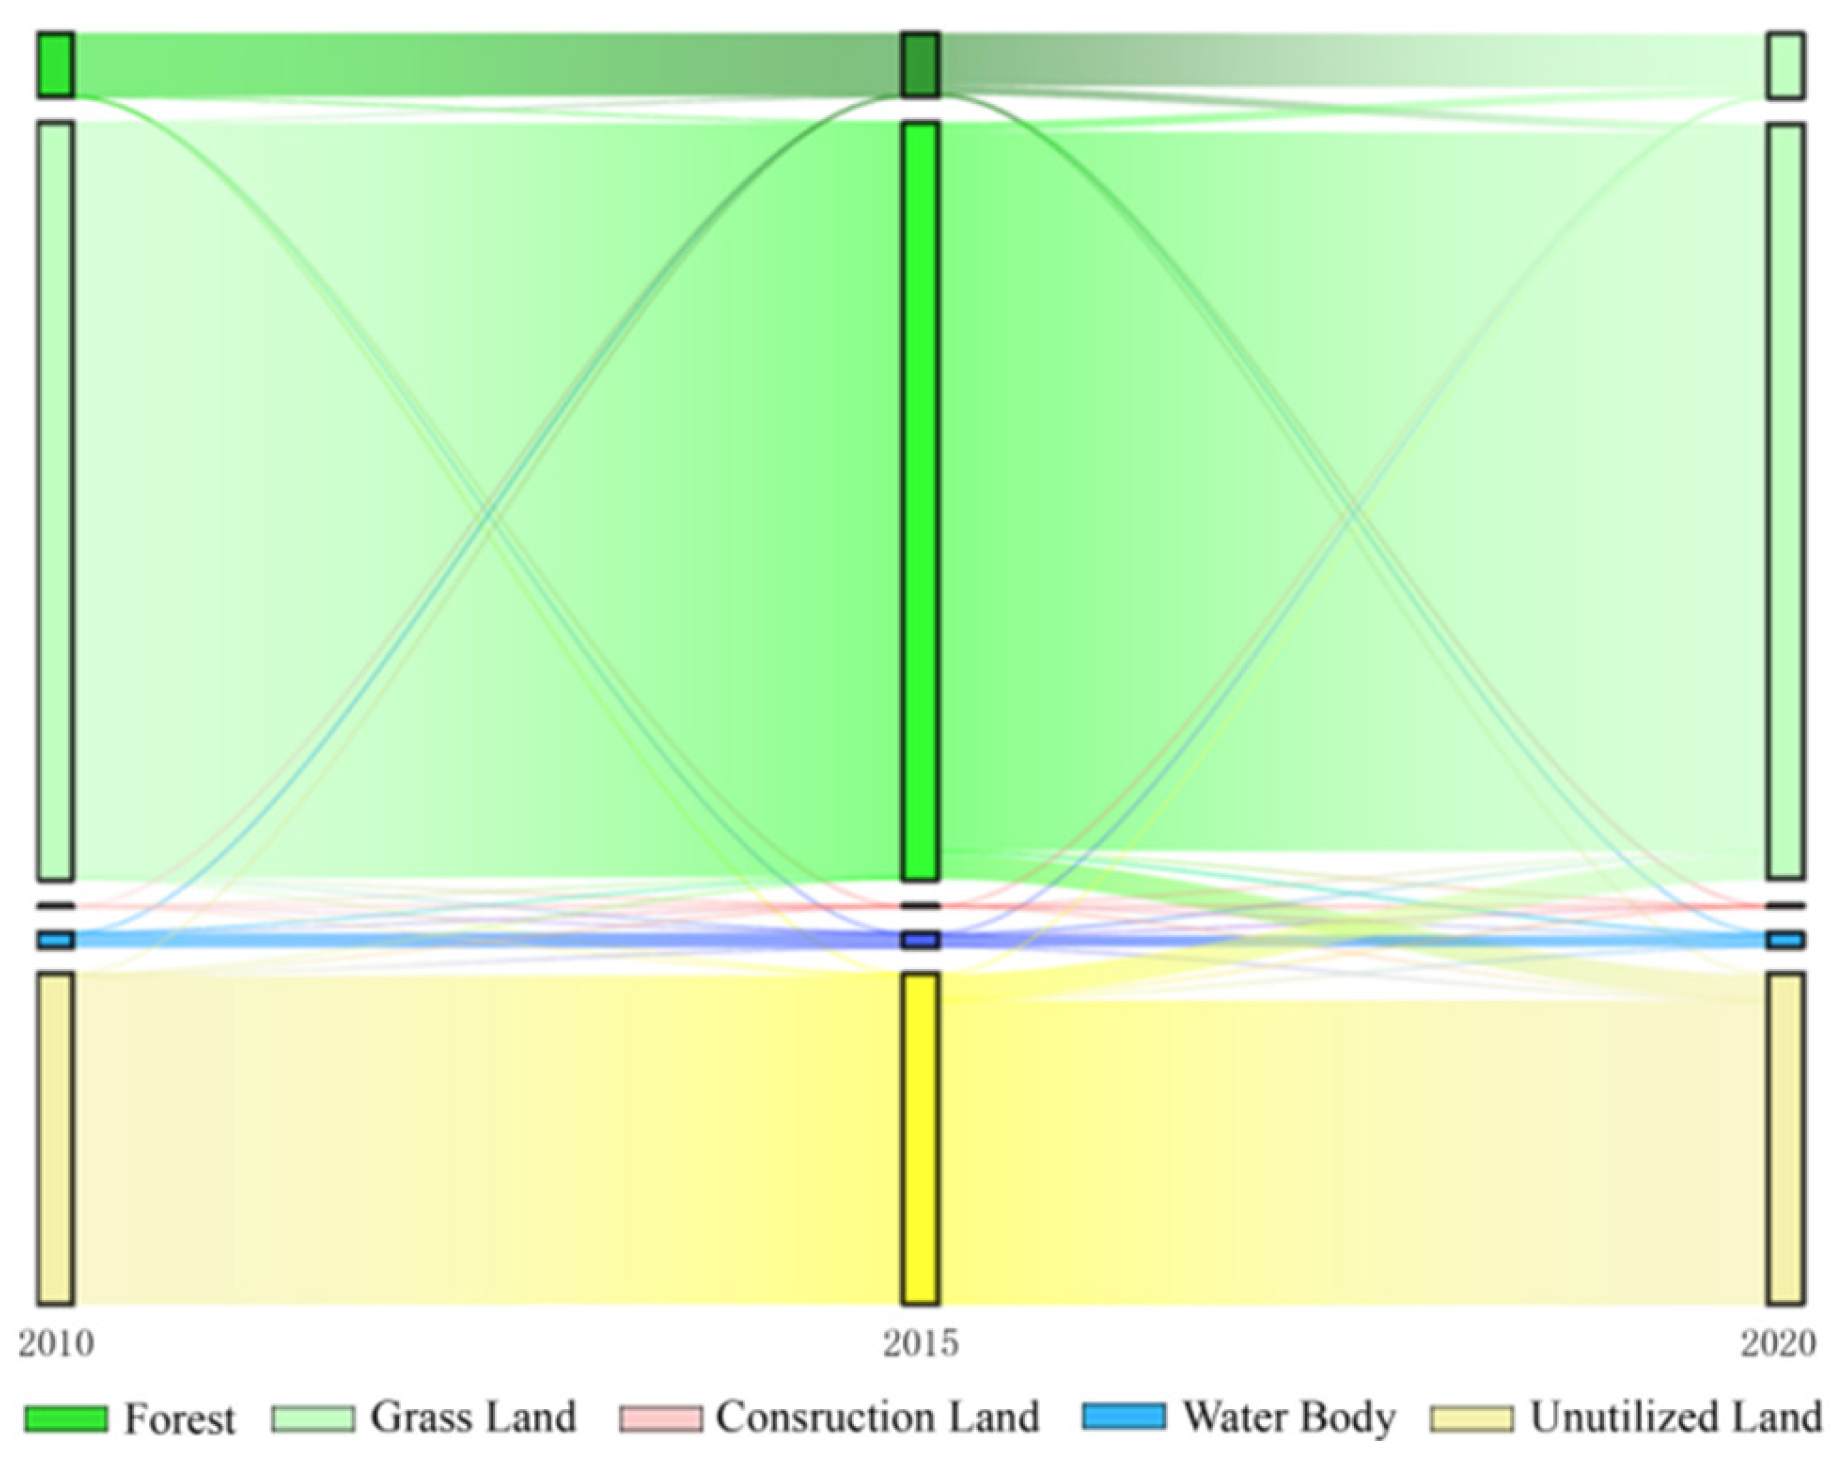
4.1.2. Analysis of LULC Transfer Change
4.2. Ecosystem Services Assessment
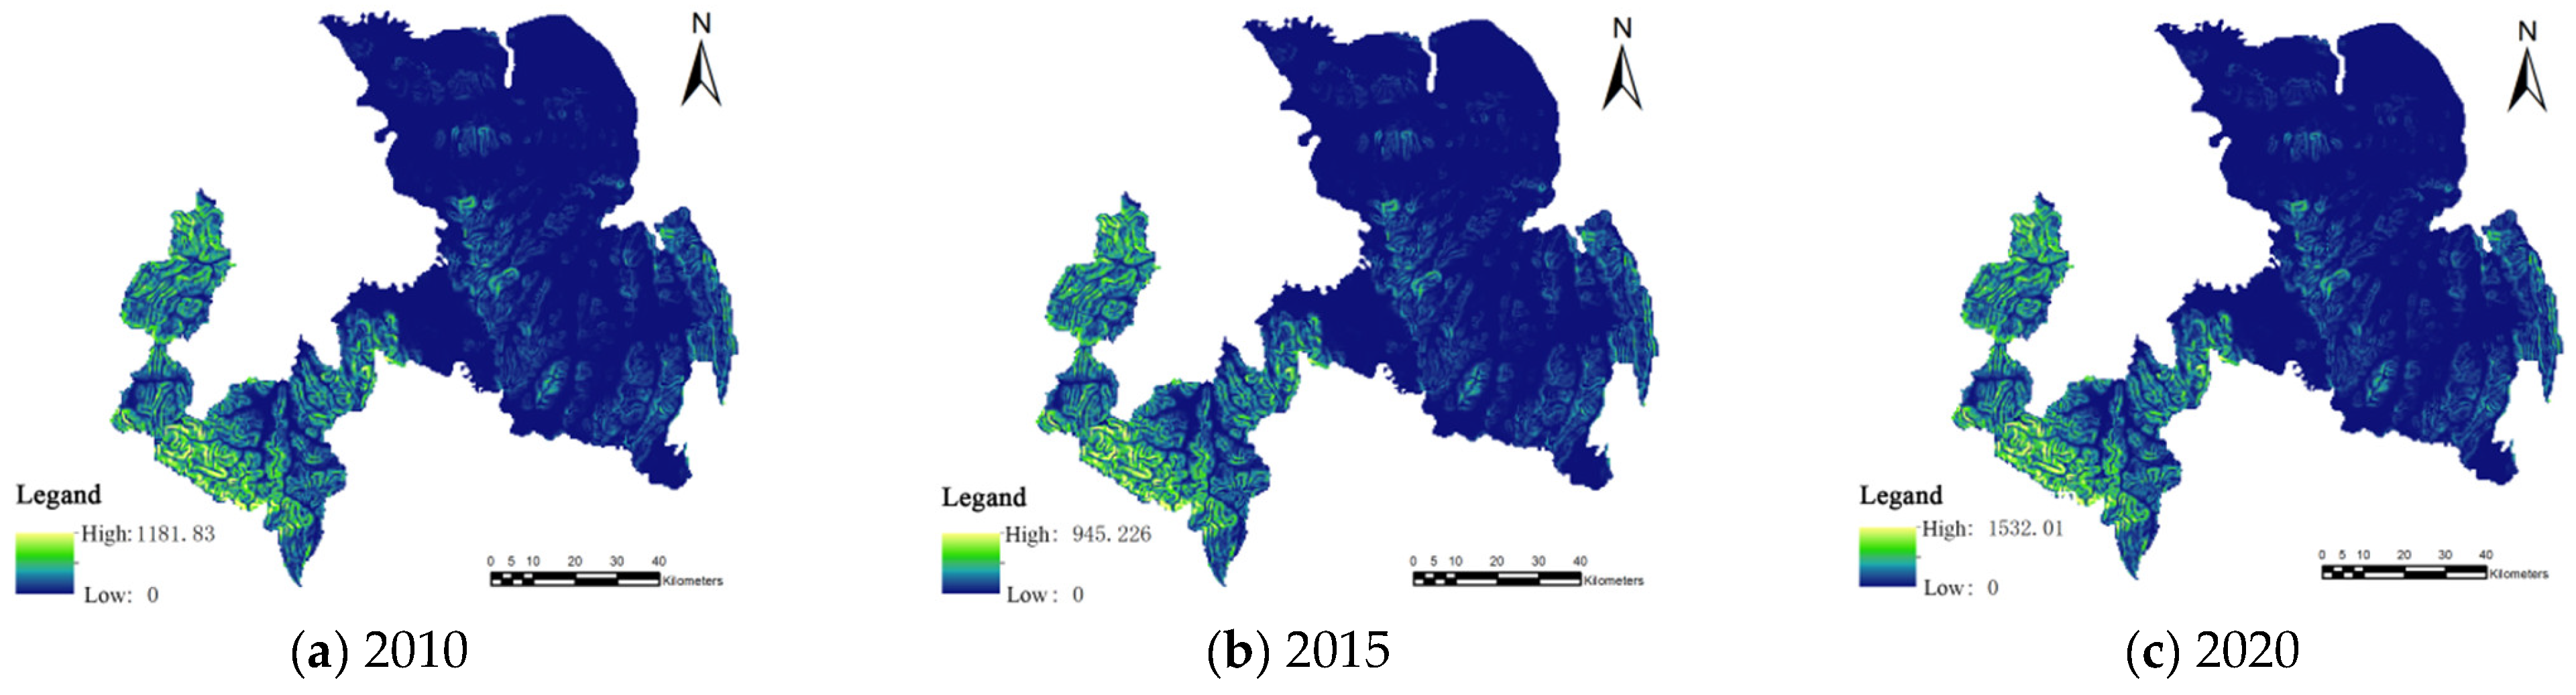
4.2.1. Soil Retention Assessment
4.2.2. Carbon Storage Assessment
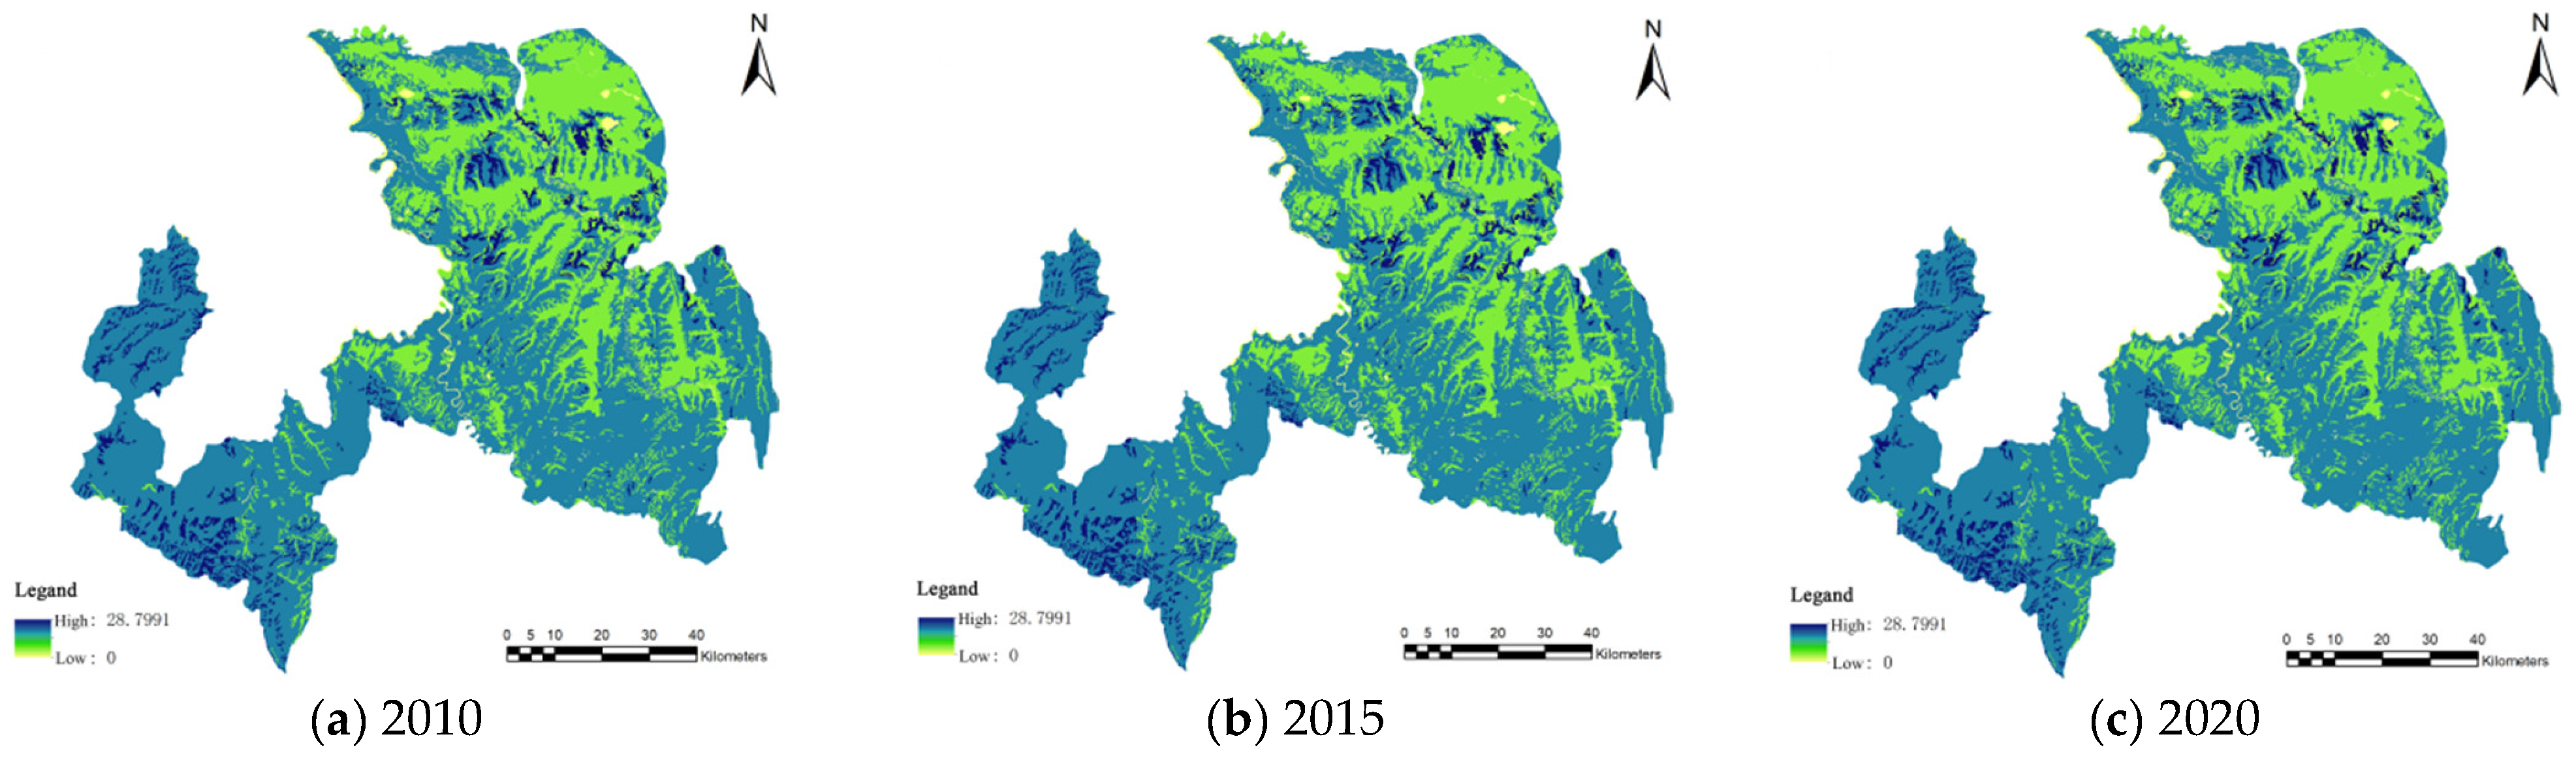
4.2.3. Water Supply Function Assessment
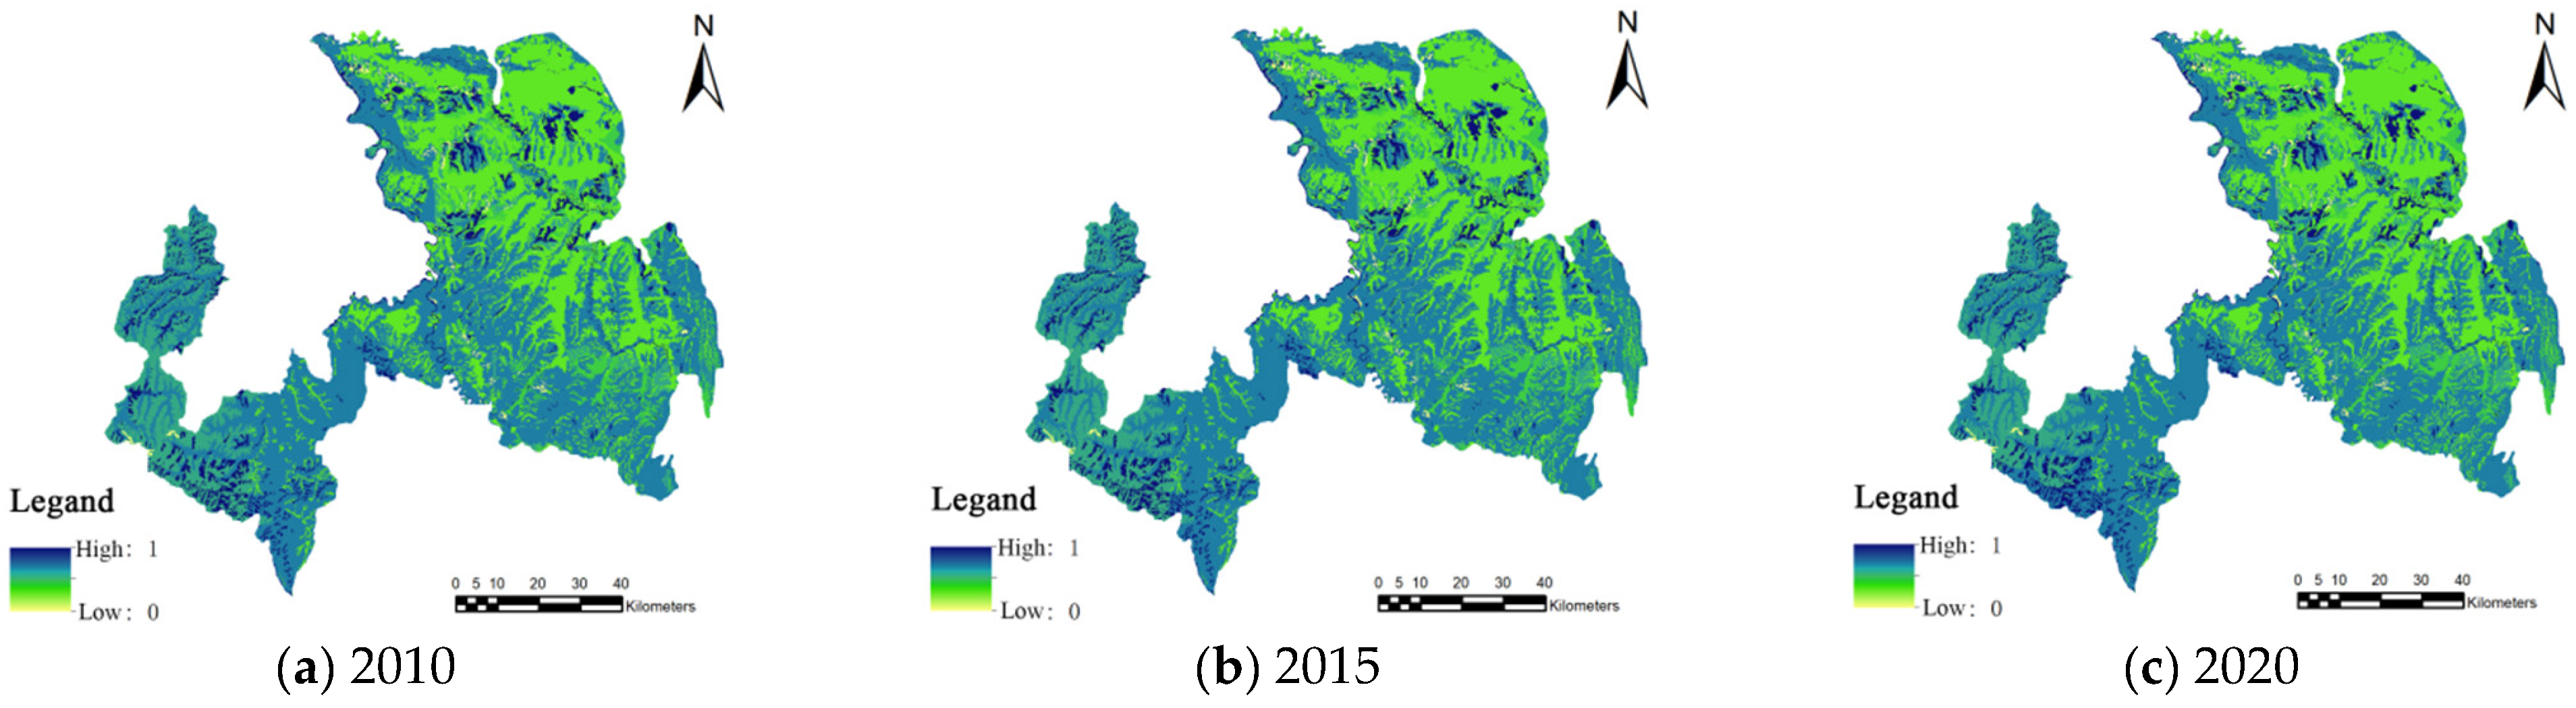
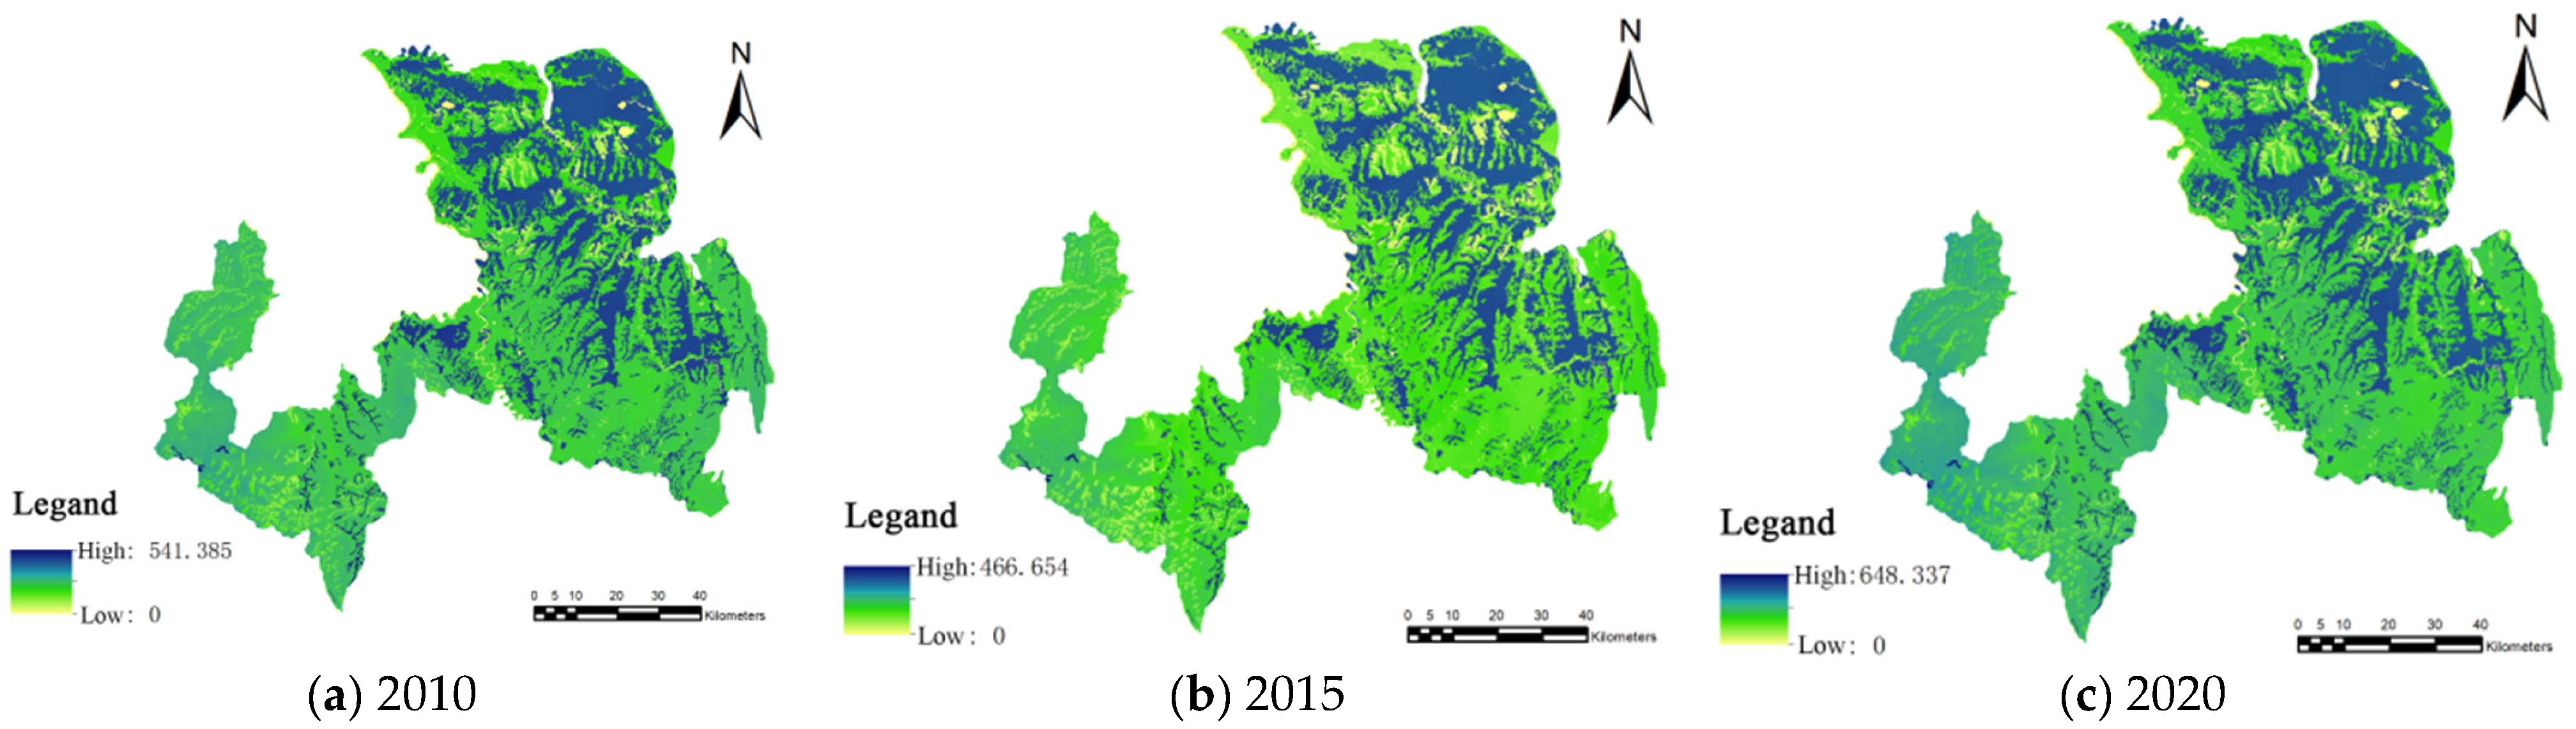
4.2.4. Habitat Quality Assessment
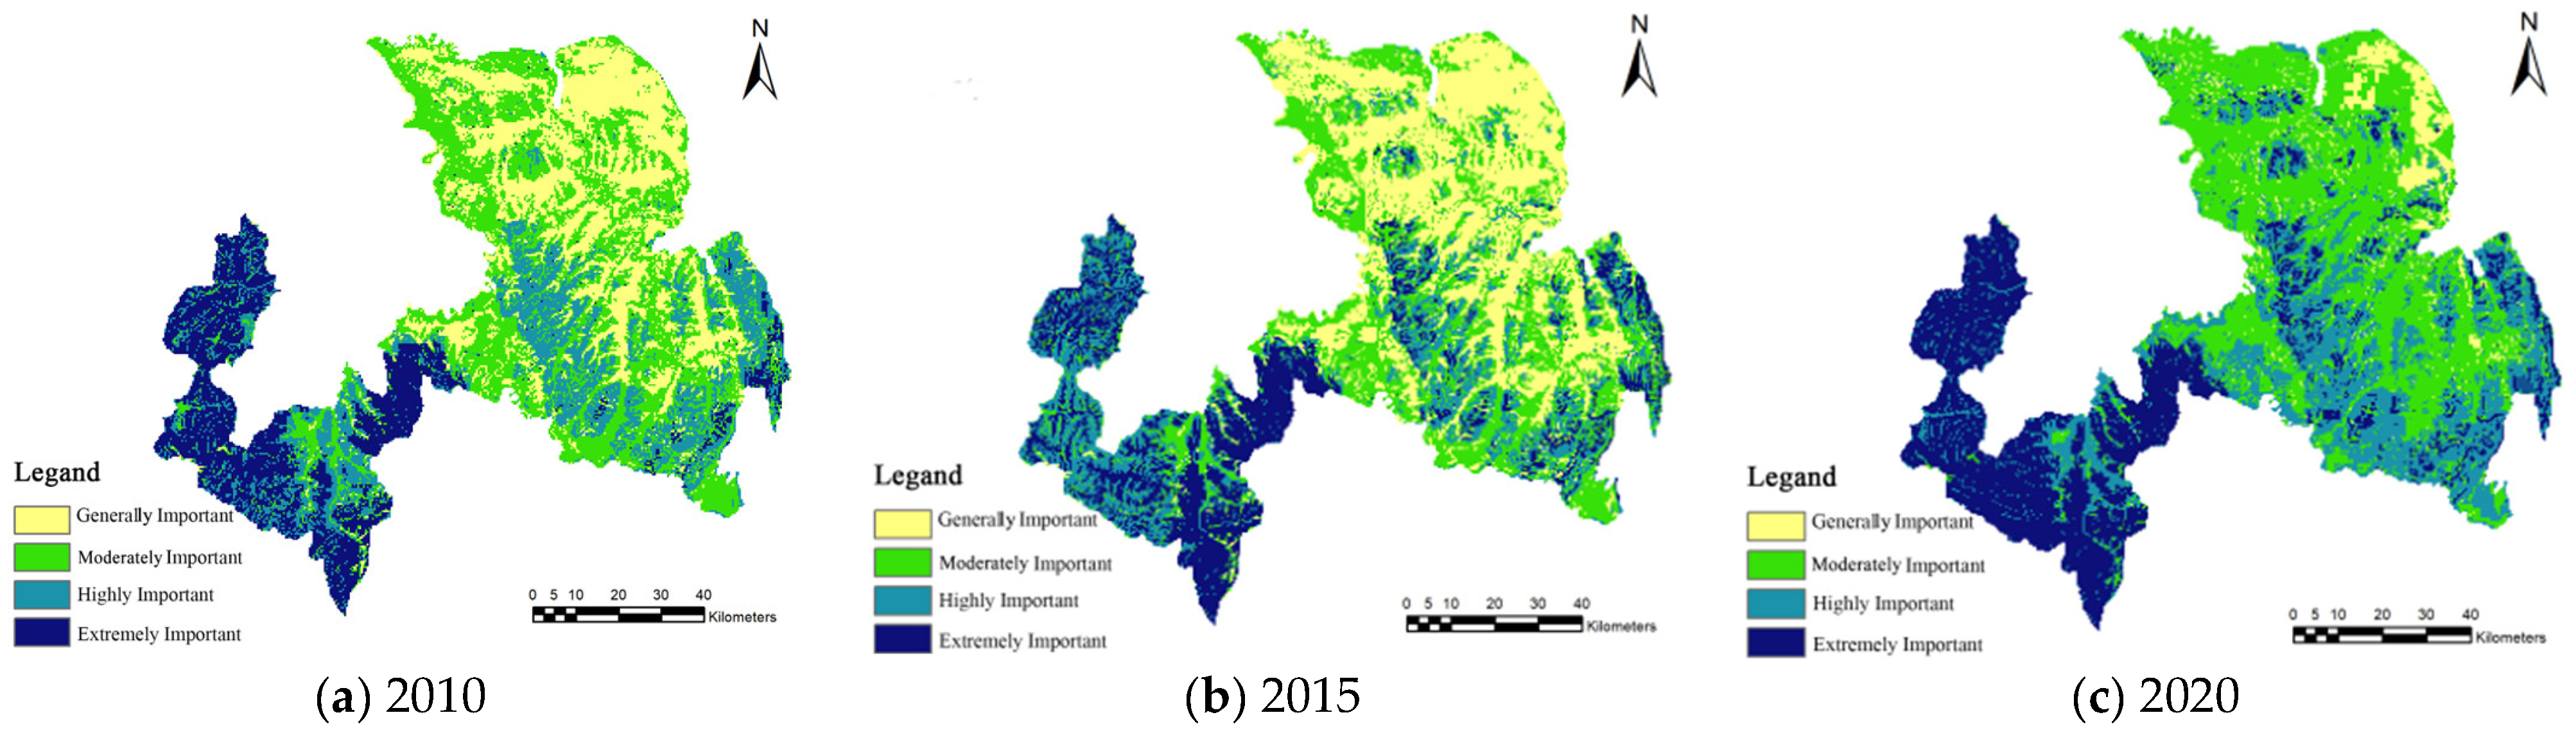
4.2.5. Ruoergai National Park Ecosystem Service Importance Zones
5. Discussion
5.1. Drivers Affecting Ecosystem Services in Ruoergai National Park
5.2. Strategies to Restoration Grasslands in the Future
5.3. Limitations and Future Perspectives
6. Conclusions
Author Contributions
Funding
Institutional Review Board Statement
Informed Consent Statement
Data Availability Statement
Conflicts of Interest
References
- Daily, G.C. Nature’ s Service: Societal Dependence on Natural Ecosystems; Island Press: Washington, DC, USA, 1997. [Google Scholar]
- Kritzberg, E.S.; Hasselquist, E.M.; Škerlep, M.; Löfgren, S.; Olsson, O.; Stadmark, J.; Valinia, S.; Hansson, L.-A.; Laudon, H. Browning of freshwaters: Consequences to ecosystem services, underlying drivers, and potential mitigation measures. Ambio 2020, 49, 375–390. [Google Scholar] [CrossRef] [PubMed]
- Chowdhury, K.; Behera, B. Economic significance of provisioning ecosystem services of traditional water bodies: Empirical evidences from West Bengal, India. Resour. Environ. Sustain. 2021, 5, 100033. [Google Scholar] [CrossRef]
- Singh, J.S.; Gupta, V.K. Soil microbial biomass: A key soil driver in management of ecosystem functioning. Sci. Total Environ. 2018, 634, 497–500. [Google Scholar] [CrossRef] [PubMed]
- Bagstad, K.J.; Johnson, G.W.; Voigt, B.; Villa, F. Spatial dynamics of ecosystem service flows: A comprehensive approach to quantifying actual services. Ecosyst. Serv. 2013, 4, 117–125. [Google Scholar] [CrossRef]
- Cheng, B.; Li, H.; Yue, S.; Huang, K. A conceptual decision-making for the ecological base flow of rivers considering the economic value of ecosystem services of rivers in water shortage area of Northwest China. J. Hydrol. 2019, 578, 124126. [Google Scholar] [CrossRef]
- Zank, B.; Bagstad, K.J.; Voigt, B.; Villa, F. Modeling the effects of urban expansion on natural capital stocks and ecosystem service flows: A case study in the Puget Sound, Washington, USA. Landsc. Urban Plan. 2016, 149, 31–42. [Google Scholar] [CrossRef]
- Fischer, A.; Eastwood, A. Coproduction of ecosystem services as human-nature interactions—An analytical framework. Land Use Policy 2016, 52, 41–50. [Google Scholar] [CrossRef]
- Costanza, R.; De Groot, R.; Braat, L.; Kubiszewski, I.; Fioramonti, L.; Sutton, P.; Farber, S.; Grasso, M. Twenty years of ecosystem services: How far have we come and how far do we still need to go? Ecosyst. Serv. 2017, 28, 1–16. [Google Scholar] [CrossRef]
- Syrbe, R.U.; Walz, U. Spatial indicators for the assessment of ecosystem services: Providing, benefiting and connecting areas and landscape metrics. Ecol. Indic. 2012, 21, 80–88. [Google Scholar] [CrossRef]
- Schaafsma, M.; Bartkowski, B. Synergies and trade-offs between ecosystem services. Life Land 2021, 155, 1022–1032. [Google Scholar]
- Costanza, R.; De Groot, R.; Sutton, P.; Van der Ploeg, S.; Anderson, S.J.; Kubiszewski, I.; Farber, S.; Turner, R.K. Changes in the global value of ecosystem services. Glob. Environ. Change 2014, 26, 152–158. [Google Scholar] [CrossRef]
- Radford, K.G.; James, P. Changes in the value of ecosystem services along a rural–urban gradient: A case study of Greater Manchester, UK. Landsc. Urban Plan. 2013, 109, 117–127. [Google Scholar] [CrossRef]
- Gao, J.; Du, F.; Zuo, L.; Jiang, Y. Integrating ecosystem services and rocky desertification into identification of karst ecological security pattern. Landsc. Ecol. 2021, 36, 2113–2133. [Google Scholar] [CrossRef]
- Peng, J.; Yang, Y.; Liu, Y.; Du, Y.; Meersmans, J.; Qiu, S. Linking ecosystem services and circuit theory to identify ecological security patterns. Sci. Total Environ. 2018, 644, 781–790. [Google Scholar] [CrossRef]
- Wang, Y.; Pan, J. Building ecological security patterns based on ecosystem services value reconstruction in an arid inland basin: A case study in Ganzhou District, NW China. J. Clean. Prod. 2019, 241, 118337. [Google Scholar] [CrossRef]
- Hein, L.; Bagstad, K.J.; Obst, C.; Edens, B.; Schenau, S.; Castillo, G.; Soulard, F.; Brown, C.; Driver, A.; Bordt, M.; et al. Progress in natural capital accounting for ecosystems. Science 2020, 367, 514–515. [Google Scholar] [CrossRef] [PubMed]
- Ouyang, Z.; Song, C.; Zheng, H.; Polasky, S.; Xiao, Y.; Bateman, I.J.; Liu, J.; Ruckelshaus, M.; Shi, F.; Xiao, Y.; et al. Using gross ecosystem product (GEP) to value nature in decision making. Proc. Natl. Acad. Sci. USA 2020, 117, 14593–14601. [Google Scholar] [CrossRef]
- Ouyang, Z.; Zheng, H.; Xiao, Y.; Polasky, S.; Liu, J.; Xu, W.; Wang, Q.; Zhang, L.; Xiao, Y.; Rao, E.; et al. Improvements in ecosystem services from investments in natural capital. Science 2016, 352, 1455–1459. [Google Scholar] [CrossRef]
- Zhang, X.; Li, Y.; Lv, C.J.; Bi, R.T.; Xia, L.; Guo, Y.S.; Wang, Y.; Xv, C.; Sun, B. Research progress on application of ecosystem service functions based on InVEST model. Ecol. Sci. 2022, 41, 237–242. [Google Scholar]
- Villa, F.; Ceroni, M.; Bagstad, K.; Johnson, G.; Krivov, S. ARIES (Artificial Intelligence for Ecosystem Services): A new tool for ecosystem services assessment, planning, and valuation. In Proceedings of the 11th Annual BIOECON Conference on Economic Instruments to Enhance the Conservation and Sustainable Use of Biodiversity, Venice, Italy, 21–22 September 2009. [Google Scholar]
- Sherrouse, B.C.; Semmens, D.J. Social Values for Ecosystem Services, Version 3.0 (SolVES 3.0): Documentation and User Manual (No. 2015-1008, p. 65); US Geological Survey: Reston, VA, USA, 2015. [Google Scholar]
- Tallis, H.; Polasky, S. Mapping and valuing ecosystem services as an approach for conservation and natural-resource management. Ann. N. Y. Acad. Sci. 2009, 1162, 265–283. [Google Scholar] [CrossRef]
- Hein, L.; Van Koppen, K.; De Groot, R.S.; Van Ierland, E.C. Spatial scales, stakeholders and the valuation of ecosystem services. Ecol. Econ. 2006, 57, 209–228. [Google Scholar] [CrossRef]
- Kemkes, R.J.; Farley, J.; Koliba, C.J. Determining when payments are an effective policy approach to ecosystem service provision. Ecol. Econ. 2010, 69, 2069–2074. [Google Scholar] [CrossRef]
- Nepal, S.K.; Weber, K.W. Managing resources and resolving conflicts: National parks and local people. Int. J. Sustain. Dev. World Ecol. 1995, 2, 11–25. [Google Scholar] [CrossRef]
- He, S.; Su, Y.; Wang, L.; Gallagher, L.; Cheng, H. Taking an ecosystem services approach for a new national park system in China. Resour. Conserv. Recycl. 2018, 137, 136–144. [Google Scholar] [CrossRef]
- Alemu, M.M. Environmental role of national parks. J. Sustain. Dev. 2016, 9, 1–7. [Google Scholar] [CrossRef]
- Baron, J.S.; Gunderson, L.; Allen, C.D.; Fleishman, E.; McKenzie, D.; Meyerson, L.A.; Oropeza, J.; Stephenson, N. Options for national parks and reserves for adapting to climate change. Environ. Manag. 2009, 44, 1033–1042. [Google Scholar] [CrossRef] [PubMed]
- Wang, X.; Liu, X.; Long, Y.; Liang, W.; Zhou, J.; Zhang, Y. Analysis of Soil retention service function in the North Area of Guangdong based on the InVEST model. IOP Conf. Ser. Earth Environ. Sci. 2020, 510, 032011. [Google Scholar] [CrossRef]
- Geng, L.; Zhang, Y.; Hui, H.; Wang, Y.; Xue, Y. Response of Urban Ecosystem Carbon Storage to Land Use/Cover Change and Its Vulnerability Based on Major Function-Oriented Zone Planning. Land 2023, 12, 1563. [Google Scholar] [CrossRef]
- Liang, Y.; Liu, L.; Huang, J. Integrating the SD-CLUE-S and InVEST models into assessment of oasis carbon storage in northwestern China. PLoS ONE 2017, 12, e0172494. [Google Scholar] [CrossRef]
- Tang, X.; Zhao, X.; Bai, Y.; Tang, Z.; Wang, W.; Zhao, Y.; Wan, H.; Xie, Z.; Shi, X.; Wu, B.; et al. Carbon pools in China’s terrestrial ecosystems: New estimates based on an intensive field survey. Proc. Natl. Acad. Sci. USA 2018, 115, 4021–4026. [Google Scholar] [CrossRef]
- Xiang, M.; Wang, C.; Tan, Y.; Yang, J.; Duan, L.; Fang, Y.; Li, W.; Shu, Y.; Liu, M. Spatio-temporal evolution and driving factors of carbon storage in the Western Sichuan Plateau. Sci. Rep. 2022, 12, 8114. [Google Scholar] [CrossRef] [PubMed]
- Zhang, L.; Dawes, W.R.; Walker, G.R. Response of mean annual evapotranspiration to vegetation changes at catchment scale. Water Resour. Res. 2001, 37, 701–708. [Google Scholar] [CrossRef]
- Bao, Y.B.; Li, T.; Liu, H.; Ma, T.; Wang, H.X.; Liu, K.; Shen, X.; Liu, X.H. Spatial and temporal changes of water conservation of Loess Plateau in northern Shaanxi province by InVEST model. Geogr. Res. 2016, 35, 664–676. [Google Scholar]
- Fu, B.; Xu, P.; Wang, Y.K.; Peng, Y.; Ren, J. Spatial pattern of water retetnion in Dujiangyan County. Acta Ecol. Sin. 2013, 33, 789–797. [Google Scholar]
- Wang, S.; Liang, X.; Wang, J. Parameter assignment for InVEST habitat quality module based on principal component analysis and grey coefficient analysis. Math. Biosci. Eng. 2022, 19, 13928–13948. [Google Scholar] [CrossRef] [PubMed]
- Nematollahi, S.; Fakheran, S.; Kienast, F.; Jafari, A. Application of InVEST habitat quality module in spatially vulnerability assessment of natural habitats (case study: Chaharmahal and Bakhtiari province, Iran). Environ. Monit. Assess. 2020, 192, 487. [Google Scholar] [CrossRef]
- Wang, B.; Cheng, W. Effects of land use/cover on regional habitat quality under different geomorphic types based on InVEST model. Remote Sens. 2022, 14, 1279. [Google Scholar] [CrossRef]
- Zhong, L.; Wang, J. Evaluation on effect of land consolidation on habitat quality based on InVEST model. Trans. Chin. Soc. Agric. Eng. 2017, 33, 250–255. [Google Scholar]
- Wu, L.; Sun, C.; Fan, F. Estimating the characteristic spatiotemporal variation in habitat quality using the invest model—A case study from Guangdong–Hong Kong–Macao Greater Bay Area. Remote Sens. 2021, 13, 1008. [Google Scholar] [CrossRef]
- Wu, Y.; Zhu, B.; Eissenstat, D.M.; Wang, S.; Tang, Y.; Cui, X. Warming and grazing interact to affect root dynamics in an alpine meadow. Plant Soil 2021, 459, 109–124. [Google Scholar] [CrossRef]
- Li, B.; Lv, W.; Sun, J.; Zhang, L.; Jiang, L.; Zhou, Y.; Liu, P.; Hong, H.; Wang, Q.; Wang, A.; et al. Warming and grazing enhance litter decomposition and nutrient release independent of litter quality in an alpine meadow. J. Plant Ecol. 2022, 15, 977–990. [Google Scholar] [CrossRef]
- Zhou, Y.; Lv, W.W.; Wang, S.P.; Zhang, L.R.; Sun, J.P.; Jiang, L.L.; Liu, P.P.; Wang, Q.; Li, B.W.; Wang, A.; et al. Additive effects of warming and grazing on fine-root decomposition and loss of nutrients in an alpine meadow. J. Plant Ecol. 2022, 15, 1273–1284. [Google Scholar] [CrossRef]
- Reheman, R.; Kasimu, A.; Duolaiti, X.; Wei, B.; Zhao, Y. Research on the Change in Prediction of Water Production in Urban Agglomerations on the Northern Slopes of the Tianshan Mountains Based on the InVEST–PLUS Model. Water 2023, 15, 776. [Google Scholar] [CrossRef]
- Ainsworth, E.A.; Long, S.P. What have we learned from 15 years of free-air CO2 enrichment (FACE)? A meta-analytic review of the responses of photosynthesis, canopy properties and plant production to rising CO2. New Phytol. 2005, 165, 351–372. [Google Scholar] [CrossRef] [PubMed]
- Hall, L.S.; Krausman, P.R.; Morrison, M.L. The habitat concept and a plea for standard terminology. Wildl. Soc. Soc. Bull. 1997, 25, 173–182. [Google Scholar]
- Zhang, B.; Zhang, R.; Li, Y.; Wang, S.; Zhang, M.; Xing, F. Deploying photovoltaic arrays in degraded grasslands is a promising win-win strategy for promoting grassland restoration and resolving land use conflicts. J. Environ. Manag. 2024, 349, 119495. [Google Scholar] [CrossRef]
- Jin, X.; Wei, L.; Wang, Y.; Lu, Y. Construction of ecological security pattern based on the importance of ecosystem service functions and ecological sensitivity assessment: A case study in Fengxian County of Jiangsu Province, China. Environ. Dev. Sustain. 2021, 23, 563–590. [Google Scholar] [CrossRef]


| LULC | Image Interpretation Key |
|---|---|
| Forest | Including woodland, shrubbery, open woodland, and gardens. Distributed in patches along the ridge or mountainside. |
| Grassland | Irregular, patchy distribution; some areas are relatively fragmented, and the color is lighter than the forest. |
| Water body | Low-lying areas or low-altitude river valleys. Distributed in a strip or dot shape. |
| Construction land | Irregularly distributed in blocks, dots, and lines. The distribution is relatively concentrated, with clear boundaries. |
| Unutilized land | Mainly based on wetlands. Wetlands are characterized by low-lying terrain, inadequate drainage, and waterlogging. |
| Data Type | Initial Data | Data Sources |
|---|---|---|
| DEM | DEM | Geospatial Data Cloud (http://www.gscloud.cn, accessed on 20 September 2023) |
| Annual and monthly average precipitation | Annual and monthly precipitation | National Earth System Science Data Center (http://www.geodata.cn, accessed on 20 September 2023) |
| Soil texture data | The maximum burial depth of soil roots, soil sand, silt, clay, organic carbon content, etc. | World soil database (Harmonized World Soil Database version 1.2, HWSD) |
| Vegetation coverage | NDVI data | Geospatial Data Cloud (http://www.gscloud.cn, accessed on 20 September 2023). Using the pixel binary model to calculate |
| LULC | Landsat image | Geospatial Data Cloud (http://www.gscloud.cn, accessed on 21 September 2023) |
| LULC | C_Above | C_Below | C_Soil | C_Dead |
|---|---|---|---|---|
| Forest | 66.55 | 11.31 | 242.13 | 0 |
| Grassland | 0.42 | 11.16 | 215 | 0 |
| Water body | 0 | 0 | 0 | 0 |
| Construction land | 0.59 | 0 | 78.49 | 0 |
| Unutilized land | 0 | 0 | 71.45 | 0 |
| Data | Source and Treatment |
|---|---|
| Annual average precipitation, potential evapotranspiration | National Earth System Science Data Center (http://www.geodata.cn, accessed on 26 September 2023) |
| LULC | Geospatial Data Cloud (http://www.gscloud.cn, accessed on 21 September 2023) |
| DEM | Geospatial Data Cloud (http://www.gscloud.cn, accessed on 20 September 2023). Calculate the percentage Slope using the Slope tool |
| Soil properties (soil thickness, soil texture, organic matter content, etc.) | World soil database (Harmonized World Soil Database-HWSD version 1.2). Soil texture was used to calculate plant water availability and soil saturated water conductivity |
| Others (maximum root depth, vegetation evapotranspiration coefficient, velocity coefficient) | References research results, FAO crop reference values and InVEST model documentation |
| Threat | Max_Dist/km | Weight | Decay |
|---|---|---|---|
| Urban land | 8.0 | 1 | Exponential |
| Rural settlements | 5.0 | 0.6 | Exponential |
| Construction land | 6.0 | 0.7 | linear |
| Bare land | 2.5 | 0.3 | Exponential |
| LULC | 2010 | 2015 | 2020 | |||
|---|---|---|---|---|---|---|
| Area/km2 | Proportion | Area/km2 | Proportion | Area/km2 | Proportion | |
| Forest | 456.81 | 5.48% | 455.98 | 5.47% | 456.81 | 5.48% |
| Grassland | 5400.06 | 64.78% | 5400.89 | 64.79% | 5394.23 | 64.71% |
| Water body | 110.87 | 1.33% | 108.37 | 1.30% | 109.20 | 1.31% |
| Construction land | 8.08 | 0.09% | 8.60 | 0.10% | 11.62 | 0.14% |
| Unutilized land | 2360.76 | 28.32% | 2362.42 | 28.34% | 2364.09 | 28.36% |
| Importance Zoning | 2010 | 2015 | 2020 | |||
|---|---|---|---|---|---|---|
| Area (km2) | Proportion | Area (km2) | Proportion | Area (km2) | Proportion | |
| Generally important | 2111.29 | 25.33% | 2674.36 | 32.08% | 419.37 | 5.03% |
| Moderately important | 3033.90 | 36.40% | 2501.80 | 30.01% | 3323.89 | 39.87% |
| Highly important | 1669.61 | 20.03% | 1580.02 | 18.95% | 2308.95 | 27.70% |
| Extremely important | 1521.60 | 18.24% | 1579.83 | 18.94% | 2283.78 | 27.40% |
Disclaimer/Publisher’s Note: The statements, opinions and data contained in all publications are solely those of the individual author(s) and contributor(s) and not of MDPI and/or the editor(s). MDPI and/or the editor(s) disclaim responsibility for any injury to people or property resulting from any ideas, methods, instructions or products referred to in the content. |
© 2024 by the authors. Licensee MDPI, Basel, Switzerland. This article is an open access article distributed under the terms and conditions of the Creative Commons Attribution (CC BY) license (https://creativecommons.org/licenses/by/4.0/).
Share and Cite
Li, H.; Wang, Y.; Chen, W.; Li, H.; Tian, Y.; Chen, R. Evaluation of Ecosystem Services in Ruoergai National Park, China. Sustainability 2024, 16, 3241. https://doi.org/10.3390/su16083241
Li H, Wang Y, Chen W, Li H, Tian Y, Chen R. Evaluation of Ecosystem Services in Ruoergai National Park, China. Sustainability. 2024; 16(8):3241. https://doi.org/10.3390/su16083241
Chicago/Turabian StyleLi, Hongfu, Yuelin Wang, Wende Chen, Hongyu Li, Yue Tian, and Ruojing Chen. 2024. "Evaluation of Ecosystem Services in Ruoergai National Park, China" Sustainability 16, no. 8: 3241. https://doi.org/10.3390/su16083241
APA StyleLi, H., Wang, Y., Chen, W., Li, H., Tian, Y., & Chen, R. (2024). Evaluation of Ecosystem Services in Ruoergai National Park, China. Sustainability, 16(8), 3241. https://doi.org/10.3390/su16083241