Abstract
As a strategic pillar of the Chinese economy, high-quality development of the tourism industry has become a pressing demand in the contemporary era. Following the new developmental concept advocated by the Chinese government, this study has constructed a comprehensive set of indicators for high-quality tourism development. A thorough spatial analysis of the developmental quality of China’s provincial tourism industry from 2000 to 2021, as well as the developmental conditions of various subsystems, was conducted by employing the entropy–value–TOPSIS method, Dagum Gini coefficient, and ESTDA approach. The research has found that (1) the overall quality of China’s tourism industry has significantly improved, (2) the determinants of differences in tourism-development quality in China transitioned from endowment advantages to innovation capabilities. (3) positive spatial-agglomeration effects are evident in the developmental landscape of China’s tourism industry, (4) the quality of regional tourism development is closely related to the economic development of urban agglomerations, (5) China’s tourism industry demonstrates resilience and capacity for restructuring in the post-pandemic era.
1. Introduction
Since the initiation of reform and opening up, China’s economy has experienced four decades of rapid growth and transitioned into a new stage of high-quality development. This stage requires the implementation of the new development concept of “innovation, coordination, green, openness, and sharing”. This concept is in accordance with the definition of tourism development by the United Nations World Tourism Organization (UNWTO), which emphasizes the consideration of economic, social, and environmental impacts to meet the needs of all stakeholders. Researching the development-quality process of China’s tourism industry is of significant importance for promoting a transition towards more sustainable, innovative, and inclusive tourism in China and globally.
As a pillar of China’s new-era economy, the tourism industry plays a crucial role in meeting the growing expectations of people regarding quality of life [1]. According to data from the Ministry of Culture and Tourism, China’s 2019 tourism revenue reached CNY 6.63 trillion and saw an 11% increase from the previous year, contributing CNY 10.94 trillion to the GDP (11.05%). The number of domestic tourists grew to 6.006 billion, up 8.4%, with a domestic tourism revenue of CNY 5.73 trillion, up 11.7%. Despite this, the growth has decelerated when compared to 2018’s 10.76% increase in tourist numbers and 12.3% increase in revenue, highlighting a slowdown in domestic tourism’s pace of growth [2]. Each dimension presents its own developmental challenges, as identified in the existing literature. (1) Innovative Development. Continuous development of the digital economy has rapidly transformed emerging tourism trends, including culture and tourism integration, growth of VR experiences, and varied tourism perspectives beyond sightseeing [3]. However, differences in the digital construction base of destinations will affect the development of tourism [4]. (2) Coordinated Development. As a comprehensive industry, tourism not only requires internal coordination among various departments but also emphasizes external coordination with economic and social areas. Different departments in the tourism industry demonstrate diverse developmental patterns and capabilities [5]. (3) Green Development. In some areas, the tourism industry relies heavily on resources and has not shifted towards more sustainable practices. Tourists in these places prioritize the reality of local resources [6]. The waste and carbon dioxide generated by tourism activities can create negative feedback on the green development of tourist destinations [7,8,9]. (4) Open Development. As the tourism industry transforms from receiving foreign guests to mass tourism, inbound tourism in coastal and border provinces has developed vigorously, forming a “high in the south and low in the north” pattern, showing obvious regional differences [10,11,12]. (5) Shared Development. The tourism process is a process where tourists and residents share the urban environment, but there is a phenomenon that the tourist satisfaction on the environmental supply is greater than that of local residents [13]. Tourists occupy a part of the living space of residents [14].
Since 2020, the global tourism industry has been severely affected by the COVID-19 pandemic [15,16]. According to UNWTO data, all tourist destinations worldwide were forced to suspend operations, resulting in an almost 74% decline in international tourist arrivals in 2020, the most severe downturn since records began in 1950.
As the largest developing country and the second-largest economy, China’s tourism development reflects broader economic, policy, and cultural shifts. Studying the spatiotemporal evolution of China’s tourism industry provides valuable policy insights into its future and the potential for other nations.
2. Literature Review
Academic discourse on the development of a high-quality tourism industry revolves around various dimensions. The first aspect is the quality of tourism development. High-quality development is the focus of China, and other countries often look at the quality of tourism from the perspective of sustainable development. In the 1990s, scholars began to study sustainable tourism. In 1997, Berry and Ladkin explored the concept of sustainable development in tourism enterprises and analyzed the path to achieving micro actors. [17]. “Tourism: Principles, Practices, Philosophies” highlights global success stories in sustainable tourism and stresses the industry’s significant environmental and societal impacts [18]. Recent research has focused on multiple facets such as the market, culture, environment, and economy. Weaver believed that natural resources, environmental protection, and internet development have combined to promote the sustainability of mass tourism [19]. Additionally, the relationship between destinations and visitors plays a crucial role in industry development [20]. Sustainability depends on finding a balance between the costs of serving tourists and the benefits for all involved parties [21]. Due to the substantial carbon footprint of the tourism industry, particularly in transitioning economies, sustainability is a vital concept to address [22]. Innovative strategies are necessary to mitigate negative externalities [23], and promoting sustainable transportation options is crucial for combating the industry’s climate impact [24].
The second aspect is the construction of an indicator system. Scholars often construct comprehensive systems and use methods such as the Delphi method, the analytic hierarchy process (AHP), and the entropy method to assess development quality. Lozano–Oyola et al. developed a three-dimensional system, including social, economic, and environmental aspects, with 85 sub-indicators based on the UNWTO’s sustainable goals and indicators to measure sustainable development levels in cultural tourism destinations [25]. Blancas et al. defined a dynamic, comprehensive assessment system for sustainable tourism, comprising 20 aspects and 59 indicators while covering social, economic, and environmental dimensions [26]. As China enters a new era, research on comprehensive indicator systems for high-quality development has increased. Wei and Li constructed a comprehensive system with 10 dimensions and 53 indicators, including economic, market, innovation, product, and ecological aspects, to measure the level- and spatial-distribution patterns of high-quality economic development in China’s new era [27]. In the tourism industry, Liu and Han constructed and calculated indicators for tourism economic-development quality based on efficiency, structure, and environmental dimensions, analyzing the mechanisms for high-quality tourism economic development [28]. Wang et al. developed a measurement system for high-quality tourism in urban agglomerations focusing on industrial transformation, operational efficiency, and sharing [29].
The third aspect concerns the development path of the tourism industry. The development paths of the tourism industry vary across countries and regions. Hadad’s analysis of 105 countries found that globalization is crucial for tourism efficiency, emphasizing its importance in developing countries’ tourism sectors [30]. Grilli et al. [31] conducted research on small island nations, highlighting tourists’ interest in holistic experiences and resource management. Liu et al. observed tourism’s positive role in reducing urban–rural disparities, particularly in China’s central and western regions [32]. As tourism grows, areas that rely on natural resources to become rich in tourism may develop Dutch diseases, and physical investment and human capital can indirectly have a more positive impact on economic growth [33,34]. Following the COVID-19 pandemic, there has been a notable shift in tourist preferences and technological use. Campos et al. advocated sustainable hospitality practices and proposed measures such as adopting more sustainable energy sources and breakfast options [35]. In addition, VR technology has emerged as a crucial marketing tool in the tourism industry, enabling virtual tourism experiences even during restricted periods [36,37].
The existing literature has fruitful research results, but most of them concentrate on the aspects of tourism micro-subjects, tourism scale, and tourism destinations. However, few studies have been conducted on the quality of China’s long-term tourism development based on this “new development concept”. This study has aimed to fill this gap by investigating the concepts and components of high-quality development in the tourism sector. This study has constructed a high-quality tourism development-index system that includes five systems: innovation, coordination, greenness, openness, and sharing.
The structure of this article is as follows: First, this paper expounds on the logical main line of China’s high-quality tourism development and the index system for implementing the new development concept; second, it introduces the data sources and calculation methods of this paper; third, it presents the quality score of tourism development at the provincial level in China and regional differences, analyzes the spatiotemporal evolution of tourism-development quality; and, finally, summarizes the research conclusions of this paper and discusses them.
3. Provincial Tourism Development Quality Indicators
As a pillar industry of China’s national economy, tourism has the characteristics of wide coverage and plays a role in driving economic growth. There is a two-way relationship between tourism and social and economic development [28], and promoting the sustainable development of tourism requires the joint efforts of multiple factors such as politics, culture, infrastructure, and the environment [29,30]. The high-quality development of tourism plays a key role in meeting new expectations for a better life and releasing the momentum of domestic demand [31,32]. This study adheres to the principles of the new development concept by integrating existing research to establish an evaluative framework (Table 1) comprising five dimensions: innovation, coordination, green, openness, and shared.

Table 1.
Tourism-development-quality indicators.
3.1. Innovative Development
Aghion and Howitt (1992) proposed that technological progress resulting from innovation can trigger creative destruction and drive long-term economic growth, and they specifically pointed out that patents are an important indicator of technological innovation [38]. Buhalis and Licata foresaw the digital transformation of tourism intermediaries through the internet in 2002, highlighting the impact of information technology on tourism business models [39]. Online consumer reviews have become an important tourism attraction [40]. Digital transformation is crucial for local tourism industries to enter global markets by enhancing competitiveness and production efficiency through upgrades on both the user and supply sides.
3.2. Coordinated Development
China’s high-quality development currently emphasizes coordinated integration and enhances resource utilization and allocation efficiency [41]. The coordinated development of tourism involves a wide range of tourism industries, including not only the balance and coordination between various tourism departments, but also the adaptation and win–win situation with the external environment. Currently, there is a structural issue of “overcapacity” and “supply gap”. Travel agencies, tourist attractions, and star-rated hotels, as important sectors of the tourism industry, require rationalization and also upgrading [42,43]. The tourism industry has a significant relationship with other industries, playing a key role in driving regional economic development and promoting wealth redistribution [44,45,46].
3.3. Green Development
The tourism industry is a significant energy consumer, accounting for 3.2% of global energy consumption in 2001 and 8% of global greenhouse gas emissions in 2018 [47,48]. Green development in tourism involves economic, social, and ecological dimensions, aiming for coordinated and sustainable growth, covering aspects such as tourism resources, environment, and energy consumption [49].Tourism activities may disrupt vegetation and wildlife, prompting measures such as nature reserves for protection [50]. Industry also affects waste emissions, including solid waste, and it requires ecological protection through planning and regulation [50,51]. With the focus on “dual-carbon” goals, carbon emissions from tourism have garnered attention, particularly from transportation [22,52].
3.4. Open Development
The open development of the tourism industry can significantly boost the tourism economy and enhance international competitiveness [28]. The international visibility of Chinese cities can be enhanced by improving their level of open development [53] and fostering a higher-level open economy. Empirical evidence shows that foreign-exchange earnings from tourism and foreign investment have increased since China’s accession to the World Trade Organization (WTO), affirming that open development can drive China’s economic growth [54,55].
3.5. Shared Development
Shared development aims to ensure widespread benefits of reform and development by fostering a virtuous cycle. The tourism industry encompasses diverse sectors and plays a vital role in driving shared development. Cultural tourism sites such as museums and art galleries offer rich cultural resources and attract tourists [56]. Tourism development creates employment opportunities that contribute to the shared economic growth [57]. However, destination-carrying capacity and host–guest relationships are also issues that the tourism industry needs to pay attention to [58,59].
4. Measurement Methods and Data Sources
4.1. Measurement Methods
To evaluate the development quality scores of regional tourism from 2000 to 2021, it is necessary to assign weights to indicators and score each region annually. This paper references existing research and adopts the entropy–TOPSIS method to avoid potential biases introduced by subjective weighting [60].
4.1.1. Entropy–TOPSIS
In the entropy method, entropy is used to measure the degree of dispersion of a variable. A higher degree of dispersion indicates greater information content and higher importance in the evaluation system [61].
Firstly, to eliminate differences in scale and dimension among various indicators, the entropy method normalizes the data.
In the formula, i represents the ith sample and j represents the indicator.
Secondly, calculate the proportion of in :
Thirdly, calculate the entropy value of :
Fourthly, determine the weight of the indicator:
Fifthly, form the weighted matrix of indicators:
Sixthly, determine the optimal solution and the worst solution :
Seventhly, calculate the Euclidean distance from each solution to the optimal and worst solutions .
Eighthly, calculate the relative closeness of each solution to the ideal solution:
where represents the measurement score, , and the score reflects the level of tourism-industry development, with higher scores indicating higher levels of development.
4.1.2. DEA–Malmquist
The calculation of the TFP index for the tourism industry adopts the non-parametric Malmquist index method in the DEA. This method has two major advantages: firstly, it obtains the frontier function through the principles of linear programming, independent of any specific functional form or distribution assumptions. Secondly, the Malmquist index can further decompose changes into scale-efficiency change, pure technical-efficiency change, and technological change. This study refers to the calculation methods of Caves et al. and Liu et al. [62,63] to measure the TFP of the tourism industry in each province and city and decompose it. The Malmquist productivity index for a single input and a single output relationship is defined as:
where and are the output-distance functions obtained by comparing the production points with the frontier technology in the same time period (period t and t + 1); and are the output-distance functions obtained by comparing the production points with the frontier technology during the mixed period.
To address the arbitrary selection of two indicators in Equation (12) and consider the impact of both concurrent and cross-period factors, the Malmquist productivity index is calculated for total factor productivity using a geometric mean approach [64].
where characterizes the change in the output-oriented technical efficiency from period t to t + 1 (gradually approaching the production frontier). Technical efficiency is the product of pure technical efficiency and scale efficiency, as expressed in the following formula:
4.1.3. Carbon Emissions
This article adopts the carbon emissions calculation method proposed by Shi and Wu, which employs a method of decomposition followed by summation for statistics [8]. The core formula is:
Here, represents the energy consumption or carbon emissions in a specific sector of the tourism industry: is the scale of a specific sector in the tourism industry; is the unit energy consumption or unit carbon emissions in a specific stage of the tourism industry; and is the number of subdivisions in a specific sector of the tourism industry. This article refers to existing literature on per-capita daily travel distances in China, per-capita daily travel distances in developing countries, the proportion of tourism purposes, etc. The estimation of carbon emissions in the tourism industry is mainly based on three aspects: transportation, accommodation, and tourist activities [8,65,66].
4.1.4. The Industrial Structure Rationalization Index
The Tourism Industry Industrial Structure Rationalization Index is used to measure the degree of coordination among the tourism industry sectors in various provinces and cities. Following the approach of Wang et al. [43], this study employs the modified Theil index formula:
In the formula, represents the Tourism Industry Industrial Structure Rationalization Index. Since it is a Theil index, the closer it approaches 0, the more rational the structure. Therefore, this index is a negative indicator. Y stands for income, L stands for the number of employees, t stands for the year, and i stands for the three sectors: travel agencies, tourist attractions, and star-rated hotels.
4.2. Data Sources
The data for this paper are categorized into three main types: statistical yearbooks, databases, and web collection. Statistical yearbooks primarily include “China Tourism Statistical Yearbook”, “China Cultural Relics and Tourism Statistical Yearbook”, “China Environmental Statistical Yearbook”, and “China Regional Economic Statistical Yearbook”. Databases mainly involve the EPS database, Zhongjing Net, and the Incopat database. Web collection is derived from authoritative departments and relevant public information released by local governments.
5. Spatial–Temporal Evolution of Provincial Tourism Quality
5.1. Spatial–Temporal Evolution of Provincial Tourism Subsystem Development Quality
This study employs the entropy–TOPSIS method to assess the overall and subsystem development-quality scores of the tourism industry in 30 provinces. This analysis focused on representative years (2000, 2004, 2008, 2012, 2016, 2019, 2020, and 2021) to examine the evolution of China’s tourism industry and the impact of the COVID-19 pandemic.
5.1.1. Innovative Development
The quality of China’s tourism industry has been consistently increasing, with the eastern region leading, as shown in Figure 1. In 2000, China’s tourism industry has generally exhibited low innovative-development quality, with technological innovation and digital capabilities still in the early stages of development. At this point, the levels of innovative development are primarily determined by the TFP. The western region is rich in natural tourism resources, and the total factor level of tourism is higher than that of other regions. In 2004, regional disparities in tourism-innovation quality surfaced, with the eastern region being the most economically vibrant area, scoring an average with 0.147, almost double that of the other regions. Beijing stood out as a frontrunner in innovative development within the tourism industry, boasting superior total-factor productivity, technological-innovation levels, and digital capabilities, surpassing other regions in China. In 2008, the quality of China’s innovative tourism development was comprehensively improved. The eastern region demonstrated a stronger innovation of capabilities in the tourism industry, with Beijing, Shanghai, Zhejiang, and Guangdong provinces exhibiting strong advantages. In 2012, tourism-innovation quality surged, with the national average score reaching 0.329, twice the average in 2008 (0.155). In 2016, the imbalance between supply and demand resulted in a low level of TFP, and the number of patents grew slowly, and the innovative development of the tourism industry was generally lower than in 2012. By 2019, there was a general improvement in the quality of innovation and development in the Chinese tourism industry. The central region experienced a significant advancement in the quality of innovative development within the tourism industry, contributing to a noticeable trend of regional disparities, with the east showing higher levels than the west and the south surpassing the north. From 2012 to 2019, R&D investment in the North lagged far behind that in the South, with a gap exceeding CNY 700 billion by 2019 and a personnel growth-rate difference of over 5% [67]. The COVID-19 pandemic had a negative impact on the quality of innovation and development within the Chinese tourism industry between 2020 and 2021. The sudden implementation of pandemic-control measures led to a sharp decline in TFP by 2020, causing significant disruptions in the tourism industry.
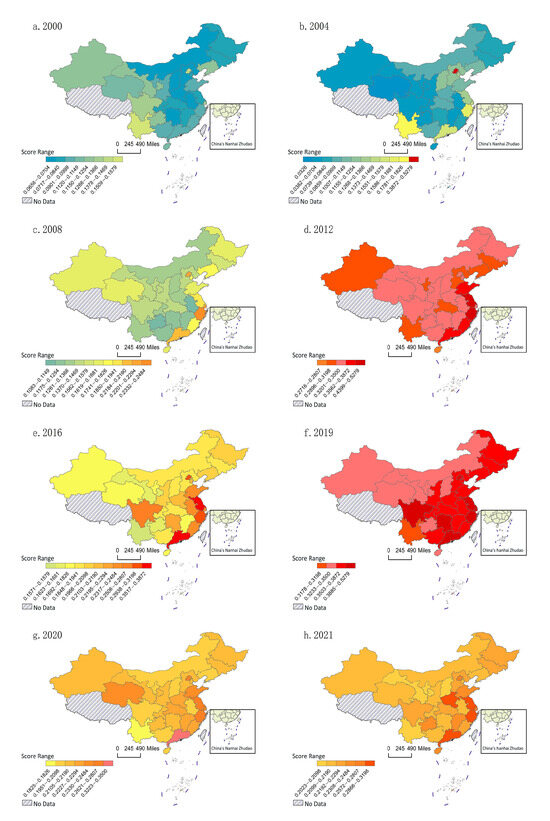
Figure 1.
Scores of innovative development.
The standard deviation ellipse (Figure 2) shows that after 2008, the ellipse area stabilized, and the center point underwent minimal changes. (“Dots” in the standard deviation ellipse refers to the capitals of each province, the following has the same meaning.) High-quality clusters of tourism-industry innovation and development are concentrated in the eastern region, with a tightening trend towards the south, which is consistent with the conclusions from the score-distribution map.
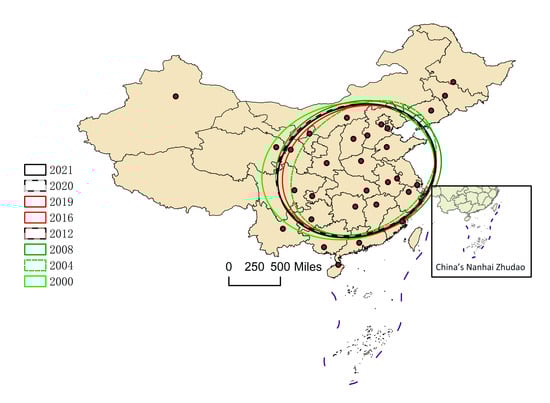
Figure 2.
Deviation ellipse of innovative development.
The Dagum Gini coefficients (Table A1 and Table A2) reveal the provincial disparities in innovative development quality among the four major regions and within each region. Interregional differences in initiation time and innovation capabilities are evident. The eastern region has strong innovation capabilities, while the central region has taken the lead in narrowing the gap in innovation capabilities with the eastern region. However, the improvement in innovation capabilities in the eastern region is much higher than in other regions, and it has always maintained its advantage. Intra-regionally, the eastern region has the largest gap, with Guangdong, Shanghai, and Beijing consistently leading, while Hainan and Shandong hover around the national average. The central region shows smaller gaps, progressing collectively from “lagging” to “good”. In the western and northeastern regions, where the intra-regional differences are small, most provinces have innovation levels at relatively lower standards, highlighting the need for improved capabilities.
5.1.2. Coordinated Development
The coordinated development quality of the tourism industry (Figure 3) has steadily increased nationwide, with a relatively consistent development quality across regions in China. In 2000, China was in a phase of accelerating industrialization and economic development [68], with the overall development level of the service industry being relatively low. The level of coordination development in the tourism industry is relatively poor. At this stage, Beijing, Shanghai, and Guangdong, as economically advanced regions, dominate the four-to-five-star hotel sector, accounting for nearly 40% of the 469 hotels nationwide. In 2004 and 2008, China’s tourism industry’s coordinated development level gradually improved, but the pattern remained unchanged, with the level in the eastern region being higher than that in the others. In 2012, the China National Tourism Administration revised the “Tourist Attraction Quality Rating Management Measures” issued in 2005 to standardize the evaluation of 4A- and 5A-rated tourist attractions. With the continuous regularization of evaluations and strengthening of quality management for A-rated tourist attractions, China’s tourism industry’s coordination development quality has significantly increased. Guangdong, Fujian, Shanghai, Guangxi, and Shanxi had a relatively high coordination-development quality in 2012, with a more reasonable industry structure. In 2016 and 2019, China’s coordinated development quality improved, and the industry structure tended to be more rational. However, most provinces have fluctuating scores, with only Shanxi and Shanghai maintaining consistently high scores. Owing to the difficulty in adjusting the industry structure of tourist attractions and star-rated hotels in a short period, the coordinated development score for the tourism industry after the outbreak of the COVID-19 pandemic showed minimal differences compared to 2019.
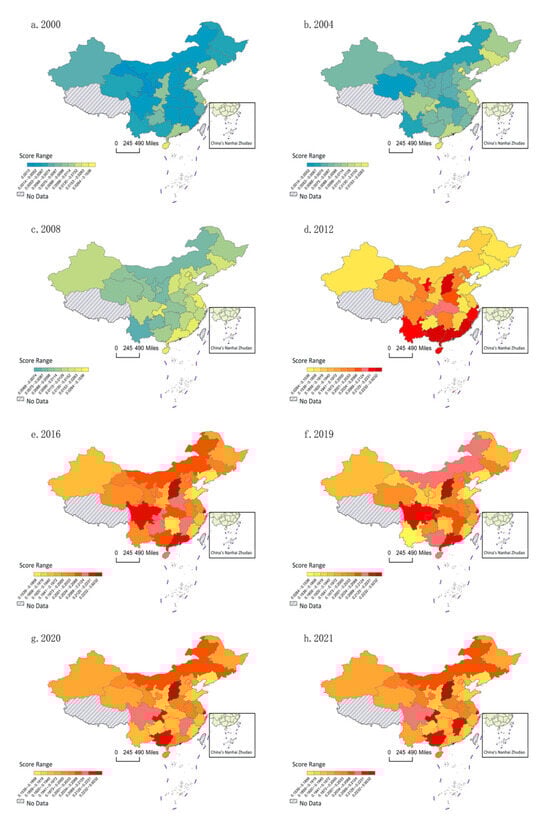
Figure 3.
Scores of coordinated development.
By combining the results of the standard deviation ellipse (Figure 4), it can be observed that the elliptical area and central position fluctuations were relatively small. The orientation angle fluctuated and increased from 2000 to 2019, indicating that the central region of the high-quality coordinated development in the tourism industry remained in the same position. The aggregated area tended to develop in the northeast–southwest direction.
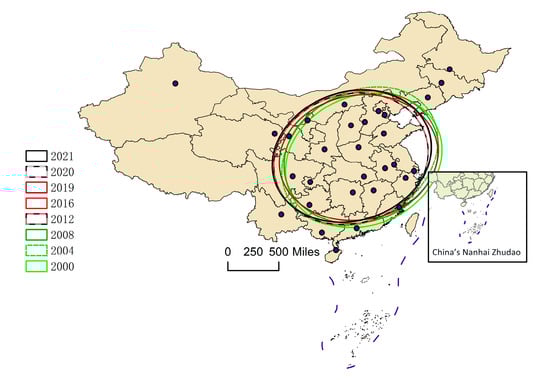
Figure 4.
Deviation ellipse of coordinated development.
The Dagum Gini Coefficient results (Table A3 and Table A4) indicate that since the inclusion of data related to tourist attractions in 2010, the disparities among the four major regions have notably reduced. The standardized management of tourist attractions has played a key role in promoting the coordinated development of China’s tourism industry. The internal differences among the four regions varied. The eastern region exhibits significant internal disparities, with Shanghai outperforming all other provinces, whereas Guangdong and Hainan show a growth trend superior to that of other provinces. The northeastern region had greater internal differences than the central and western regions. Liaoning initially scored well, but its later growth was not significant, and Jilin Province led in scores after 2016. In the western region, variations exist among the Chengdu–Chongqing metropolitan area, Yunnan–Guizhou Plateau, and the northwestern region. The central region exhibited small internal differences, displaying a stable, fluctuating, and upward trend.
5.1.3. Green Development
The quality of green development in the tourism industry (Figure 5) is closely tied to natural-resource endowment. While there has been gradual improvement nationwide, the overall spatial pattern of green development has changed minimally. In 2000, the quality of green development in China’s tourism industry was generally low. However, Hainan, with its abundant tropical rainforest resources, achieved a high green development score. With the implementation of the “Outline of Ecological and Environmental Protection in China”, significant progress has been made in the green-development quality of the tourism industry in China since 2000. In 2004 and 2008, many provinces achieved remarkable results in the development of ecological civilization, especially in provinces with sufficient natural resource endowments, such as Qinghai Province, which accounted for 30% of the region’s nature reserves. By 2012, China’s waste management had improved, with sewage- and garbage-disposal rates reaching 82.877% and 84.88%, respectively, from 67.317% and 67.546% in 2008. In 2016, the forest coverage of the central region increased by 6.3% compared with a decade ago, further enhancing the quality of green development. In 2019, the green development quality continued to be significantly better west of the Hu Huanyong Line, with only Beijing and Shanghai successfully breaking through resource constraints and achieving sustainable development that harmonized economic and social development with ecological and environmental concerns. As green resources are relatively fixed and waste-treatment technology matured before the COVID-19 pandemic, changes in green development in China’s tourism industry were minimal during the pandemic-control period. In 2020 and 2021, the green-development quality remained consistent with pre-pandemic levels, with the central region showing greater improvement than the eastern region.
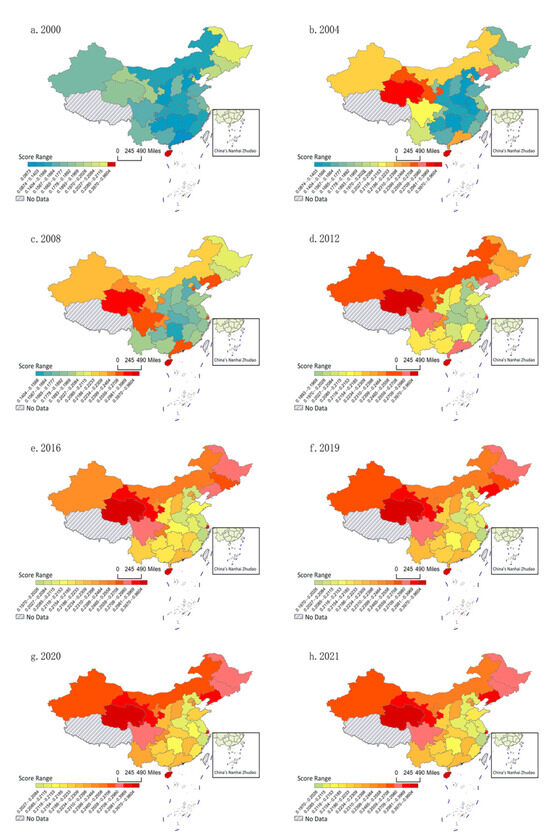
Figure 5.
Scores of green development.
The Standard Deviation Ellipse for Green Development Quality (Figure 6) is positioned closer to the inland regions, indicating a close connection with natural resource endowment. Regions should accelerate their transition to a low-carbon green economy to achieve decoupling between the green development of the tourism industry and natural resources, ensuring sustainable economic and social development.
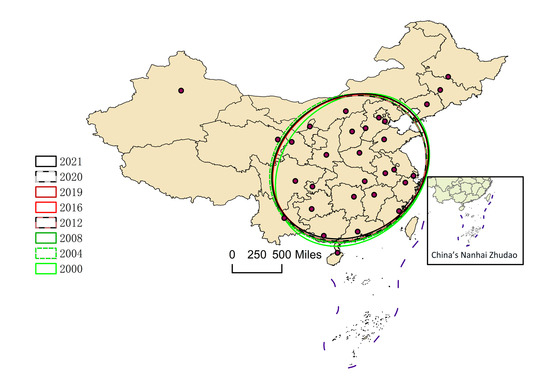
Figure 6.
Deviation ellipse of green development.
As China advances its ecological civilization, the Dagum Gini coefficient results (Table A5 and Table A6) indicated a gradual reduction in regional disparities in green development, accompanied by a steady improvement. In the eastern region, provinces such as Beijing, Shanghai, and Hainan show notable variations in growth rates with diverse levels of success in green development. While these provinces excel in green development, others in the East must enhance coordination between the tourism economy and green initiatives. The northeastern region experienced fluctuating yet improved levels of green development. For the six provinces in the central region, the Dagum Gini coefficients remained stable from 2008 to 2018, signifying slow growth in the tourism industry’s green development. In the western region, endowed with abundant natural resources, the overall green development quality is good but offers room for enhancement.
5.1.4. Open Development
The Chinese tourism industry’s open-development quality (Figure 7) steadily improved before pre-COVID-19, shifting spatially from “east higher, west lower” to “ east high, west low, south high, north low”. In 2000, Guangdong and Beijing led China to open up its development, followed by Shanghai and Jiangsu. Border provinces such as Yunnan, Guangxi, and Heilongjiang showed relatively good open development, whereas other regions had lower-quality tourism-related open development. This trend continued in 2004, with Beijing, the Yangtze River Delta, and the Pearl River Delta becoming focal points. By 2008, Guangdong, Beijing, Shanghai, Jiangsu, and Zhejiang maintained their leadership. Disparities persisted, with Heilongjiang, Liaoning, Shandong, Fujian, and Yunnan outscoring the inland provinces. In 2008, marked disparities were evident in the open development of China’s tourism industry, especially between the eastern regions, which significantly outperformed the central and western regions. In 2012, the eastern region widened its gap in terms of the quality of open development. By 2016, the eastern region still excelled, and inland areas improved in terms of external openness. In 2019, the eastern region led, whereas the central and southwestern provinces increased in openness. A spatial pattern emerged: higher concentrations in the south and east and lower concentrations in the north and west. The COVID-19 impact from 2021–2022 severely hit China’s open tourism development, requiring urgent reshaping.
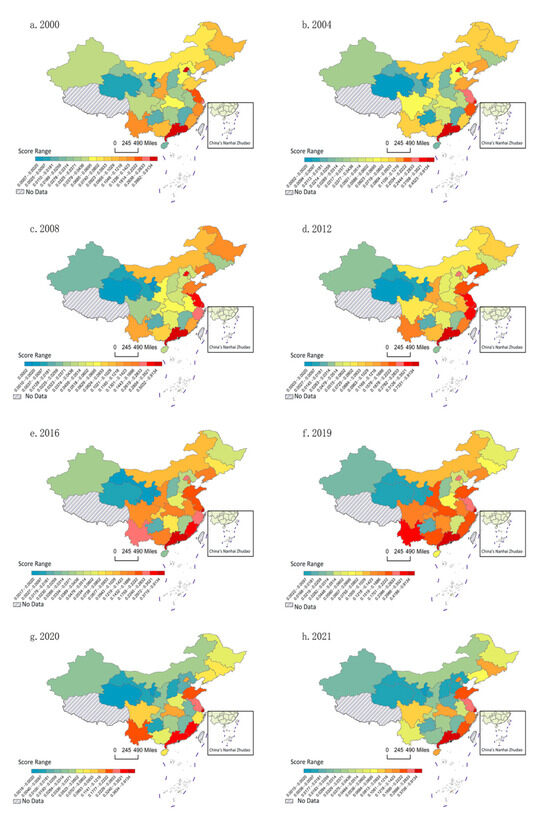
Figure 7.
Scores of open development.
The results of the standard deviation ellipse (Figure 8) were aligned with the score distribution. The elliptical area noticeably decreased in 2008, indicating a concentration of high-quality open development in the eastern region. This trend continued in 2012, further narrowing the ellipse and expanding the leading advantage of the eastern region. In 2016, the elliptical area increased and moved inland, reflecting progress in open development in inland areas of the tourism industry. In 2019, the standard deviation ellipse shifted southward and decreased in size, emphasizing a greater concentration of high-quality development areas. Owing to the COVID-19 pandemic, China’s tourism industry will face a significant setback in open development from 2020 to 2021. Inbound policies have been tightened, with a sharp decline of 81% in inbound tourist arrivals by 2020. Thus, the tourism sector requires an urgent reshaping.
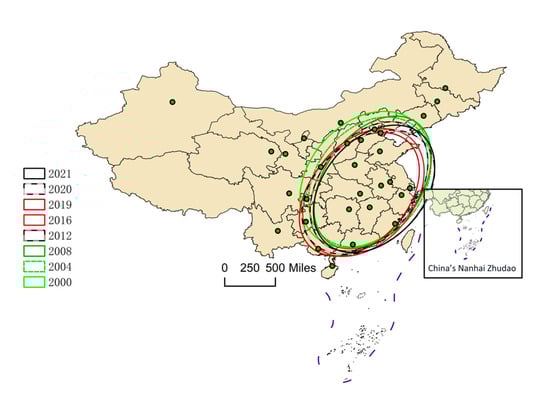
Figure 8.
Deviation ellipse of open development.
The Dagum Gini coefficients (Table A7 and Table A8) indicate notable regional disparities in open-development quality. The score-distribution chart highlights a higher degree of independence among provinces and cities in this aspect compared with the other subsystems. Jiangxi, Guizhou, Ningxia, and several other provinces have consistently faced challenges in achieving open development of the tourism industry. The regional disparities among the four major areas varied. In the eastern region, the internal coefficient differences remain high, with most provinces achieving high-quality open development in tourism. However, Hebei and Hainan differed significantly from the other eastern provinces. In the northeast, Liaoning has consistently led the tourism industry’s open-development quality. Heilongjiang, a border province with an initially high score, faces insufficient economic development and openness to tourism resources, resulting in inadequate growth. The central region exhibits smaller differences in the open development of the tourism industry, with Anhui and Hubei showing noticeable growth. After 2016, there was a clear trend towards increasing regional disparity in the central region. The western region had notable differences in the initial scores and subsequent growth rates, with an initially high coefficient of variation that later experienced a declining trend. However, Guangxi and Yunnan have consistently maintained top positions in China’s tourism industry’s open-development quality.
5.1.5. Shared Development
China’s tourism industry’s shared development quality (Figure 9) has been found to improve year by year, presenting a development pattern of “higher in the east and west, lower in the central region”. In 2000 and 2004, the shared development quality of China’s tourism industry was low, with only the eastern provinces consistently maintaining and expanding their advantageous positions within China. In 2008, both the eastern and northwestern provinces achieved higher scores in the shared development of the tourism industry. The eastern region focuses on large-scale urban investments, emphasizing shared resource development, whereas the northwestern region, which is endowed with excellent natural resources and a smaller population, emphasizes the sharing of benefits. In 2012, China’s tourism industry witnessed a general improvement in the quality of its shared development. Efforts to construct parks, museums, and art venues have intensified across the provinces. The national averages of parks, museums, and art performance venues per ten thousand people rose from 0.061, 0.015, and 0.018 to 0.08, 0.024, and 0.02, respectively. However, a shared development quality is constrained by differences in population density among the provinces. In 2016, there was a significant improvement in the quality of shared development in China, forming a spatial development pattern of “higher in the east and west, lower in the central region”. In 2019, the shared development quality further improved, maintaining a spatial development pattern similar to that of 2016, with a gradual improvement in the central region. During the COVID-19 pandemic, local tourism surged, with a minor impact on the shared development quality in tourism. Public service infrastructure has improved when compared to pre-pandemic levels. In 2019, the national averages for parks, museums, and art venues per 10,000 people were 0.126, 0.039, and 0.023, respectively. By 2021, they rose to 0.156, 0.044, and 0.027. The standard deviation of the elliptical area expanded, reflecting an overall improvement in the shared development of China’s tourism industry.
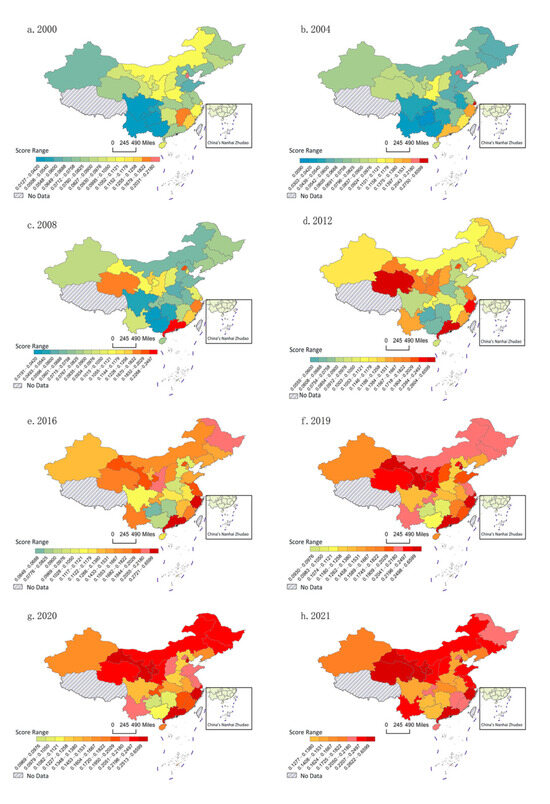
Figure 9.
Scores of shared development.
The standard deviation ellipse for provincial tourism shared development (Figure 10) shows an “east–west” trend aligned with the score distribution. In 2008, the standard deviation of the elliptical area expanded significantly, similar to the increased shared development scores in the eastern and northwestern regions. Subsequently, the position of the standard deviation ellipse remains relatively fixed, stabilizing the spatial pattern. From 2020–2021, with strengthened shared resource development, the elliptical area expanded when compared to 2019.
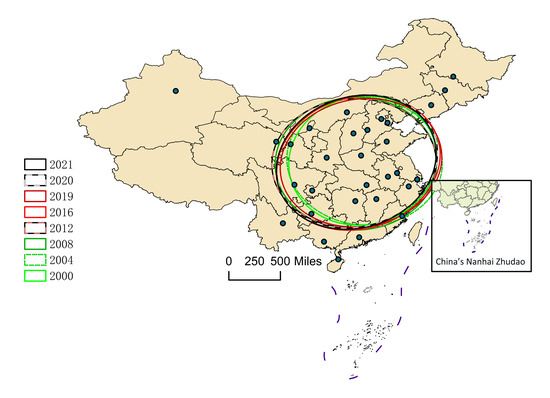
Figure 10.
Deviation ellipse of shared development.
The Dagum Gini coefficients (Table A9 and Table A10) suggest a trend towards narrowing regional disparities in the tourism industry’s shared development quality in China. When compared to other subsystems, provinces exhibited relatively small differences, indicating robust progress. Across the four major regions, there was a coordinated trend in shared development quality. The eastern region exhibited internal differences from Beijing, Shanghai, and Tianjin. Guangdong, Jiangsu, Zhejiang, and Fujian shared development quality with Hebei and Hainan. In the northeastern region, shared development was relatively well coordinated, with Jilin and Heilongjiang outperforming Liaoning. The six provinces in the central region exhibited varied growth with fluctuations in regional development differences. Central provinces generally show a growth trend only after 2015. Influenced by population factors, the northwest generally outperformed the southwest in terms of shared development quality.
5.2. Provincial Tourism Development Quality Evolution
Tourism industry-development quality consists of five subsystems: innovation, coordination, greenness, openness, and sharing. The overall quality of development (Figure 11) in the 30 provinces shows a fluctuating upward trend from 2000 to 2021, with the provincial gaps narrowing before 2008 and widening thereafter.
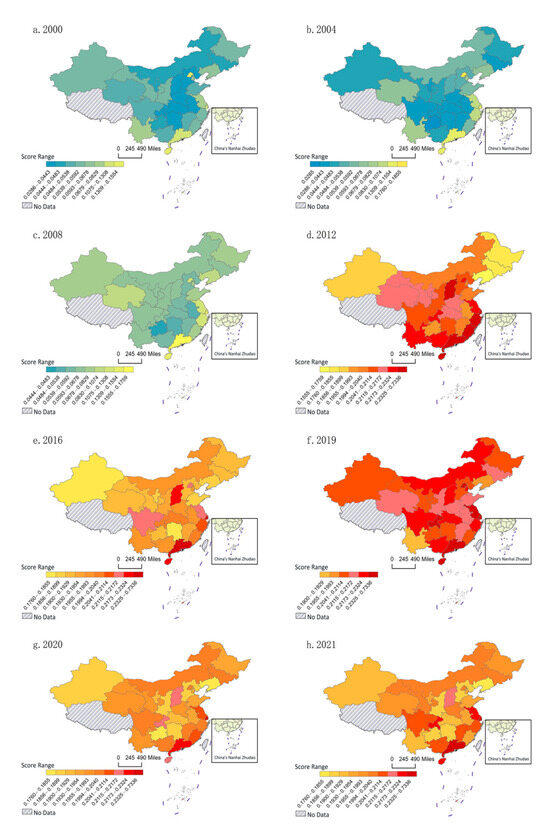
Figure 11.
Scores of tourism development.
In 2000, China was in the early stages of market-oriented reforms, with the tourism industry laying the foundation for development in areas such as dining, accommodation, transportation, sightseeing, shopping, and entertainment. However, it has not yet entered a rapid development phase [69]. With China’s accession to the WTO in 2004, the level of openness in the eastern coastal areas increased further. The eastern region, characterized by higher socioeconomic development and abundant urban public resources, emerged as the hub for provinces with the highest tourism development quality. By 2008, China’s tourism quality had improved, showcasing more balanced development across regions. The eastern region maintained its leading position, significantly widening the gap with other regions in areas such as innovation, sharing, and openness. The western region has made full use of its natural endowment and expanded from green development to shared development. The northeastern region capitalizes on its geographical location and university resources, excelling in open and innovative tourism development. The central region strategically pursued a “latecomer advantage”, achieving notable progress in subsystems such as open and innovative development, which are less dependent on resource endowments.
With the introduction of a series of policies, China’s tourism industry has entered a fast track of development. In 2009, the “Opinions on Accelerating the Development of the Tourism Industry” issued by the State Council established the strategic position of the tourism industry as a pillar industry in the national economy. In 2011, the “Cultural Strong Nation” strategy proposed at the 17th Sixth Plenary Session placed the culture and tourism industry in a prominent position. Through concerted efforts by the government and industry, the quality of China’s tourism industry development reached a new level in 2012.
In 2012, the high-quality development of the tourism industry in the eastern region led to China. Apart from green development being constrained by natural protection areas, the eastern region served as a model for innovation, coordination, sharing, and openness. The western region maintained its advantages in shared and green development, with Yunnan, Guangxi, and Shaanxi attracting more overseas tourists due to their geographical and historical resource endowments. The central region experienced rapid growth, exhibiting good-quality innovation and coordination, high attractiveness of new tourism products, and a slight inland shift in the standard deviation ellipse (Figure 12). However, the pace of development in the northeastern region was relatively slow, especially in terms of coordinated development, where the scores of the three provinces required improvement.
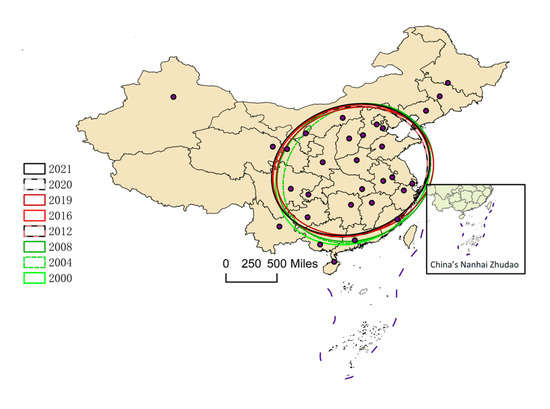
Figure 12.
Deviation ellipse of tourism development.
In 2016, China’s tourism Total Factor Productivity (TFP) slightly decreased. At that time, the tourism industry faced imbalances in supply and demand, with the public demanding high-quality tourism products and services. Additionally, outbound tourism experienced rapid growth, with a 46% increase in the number of outbound tourists in 2016 compared with 2012. Ctrip sales revenue for outbound tourism products exceeded 65% that year. As China entered a new era, its main social contradictions shifted to a growing demand for a better life and an imbalance in development. The tourism industry has vigorously carried out supply side structural reforms, actively responding to the higher-quality tourism demands of the people.
In 2019, China’s tourism industry experienced an improvement in quality, particularly in terms of innovation and shared development. With the development of tourist-centered new tourism formats [70], tourism resource endowment encompasses not only natural resources and historical artifacts but also personalized new tourism products that can generate significant tourism appeal. Beijing, Shanghai, Jiangsu, Guangdong, Hainan, and Chongqing lead development quality, forming a hub for high-quality tourism development in the eastern region. The standard deviation ellipse shifted towards the eastern region. The central region has experienced rapid tourism industry development, with provinces making efforts to overcome resource and geographical constraints and vigorously exploring new tourism formats and markets. The eastern and central regions achieved an innovative, non-resource-dependent growth model in the tourism economy. The western region has seen a general improvement in tourism development quality, although growth rates vary among the provinces. However, the tourism industry in the three northeastern provinces lags behind other regions, with tourism facilities and services still requiring enhancement.
Due to the impact of the pandemic, the development quality of China’s tourism industry will experience a noticeable decline in 2020 and 2021. Quality of innovative development and open development slides across China. However, the pace of construction of public cultural and tourism facilities in various provinces has not stopped. The quality of shared development has continued to improve, indicating significant potential for reshaping the tourism industry.
5.3. Provincial Tourism Industry-Development Quality Analysis using ESTDA
5.3.1. Measurement Method
Spatial-effect analysis is essential for understanding regional development disparities. However, recent studies often neglect temporal dynamics. The integration of time into Exploratory Spatial Data Analysis (ESDA) is crucial. The ESTDA method by Rey et al. effectively integrates time and space for a comprehensive analysis [71]. This study applies ESTDA to analyze tourism-development quality both spatially and temporally.
ESTDA includes various statistical analysis methods for spatial data. We utilized four statistical methods to analyze the spatial evolution of the quality of provincial tourism-industry development. These methods include the Global Spatial Autocorrelation Index (Moran’s I), the Local Spatial Autocorrelation Index (LISA), LISA temporal path length and curvature, and spatiotemporal transitions.
- Global Spatial Autocorrelation Index (Moran’s I)
The Global Spatial Autocorrelation Index reflects the spatial distribution of the variables in the study area, indicating a spatial pattern of tourism industry development across China. Moran’s I is one of the most commonly used spatial autocorrelation statistics. The calculation formula is as follows:
N represents the number of spatial units, N = 30; denotes the observed values; represents the elements of the spatial weight matrix (this study uses a spatially adjacent 0–1 matrix); and is the sum of all elements in the spatial weight matrix. : a positive result indicates positive spatial autocorrelation or spatial clustering, while a negative result indicates negative spatial autocorrelation or spatial dispersion.
- 2.
- Local Spatial Autocorrelation Index (LISA)
The Local Indicator of Spatial Association (LISA) improves upon Moran’s I by reflecting the degree of correlation between a specific area and its neighboring regions [72]. It further decomposes the results of the global spatial autocorrelation. The formula for the LISA statistic is:
- 3.
- LISA Time Path
As time progressed, the LISA coordinates varied, thereby delineating the LISA time path. This trajectory comprised variable attributes and spatial lag terms. The relative length and curvature of the LISA time path help elucidate the spatiotemporal interactions inherent in the quality scores of provincial tourism-industry development. This approach achieves dynamic analysis, facilitating a nuanced exploration of the continuous spatial evolution of the tourism industry development quality across different provinces and cities. The formulas for relative length () and curvature () are as follows [73]:
T represents the time interval of the time series; represents the provincial LISA coordinate position (standardized score values, spatial lag of scores), represents the distance traveled by Province i in the LISA coordinates between the years t and t + 1. The relative distance has a critical threshold of 1. When the relative distance exceeds 1, this implies that the interdependence between the tourism-industry development of the province and its adjacent provinces, as well as the regional spatial structure, is more dynamic. The curvature reflects the degree of curvature in the LISA time path. A larger curvature indicates a greater polarization and spillover effect generated with neighboring provinces, suggesting a more volatile spatial dependence direction and growth process in the tourism industry.
- 4.
- LISA Spatiotemporal Transitions
LISA spatiotemporal transitions can characterize the spatial connections of provincial tourism-industry development quality, reflecting the transformational forms of local spatial association types. There are four categories in total (Table 2).
Table 2.
The four types of LISA spatiotemporal transitions.
The spatial stability of the LISA statistics for the provincial tourism-industry development quality can be expressed as follows:
is the number of provinces or cities undergoing Type 0 transitions at time t out of the total possible number, represented by n.
5.3.2. Global Spatial Autocorrelation Trend
This study has measured Moran’s I statistics for high-quality development scores of the tourism industry in 30 Chinese provinces from 2000 to 2021. The results were as follows (Table 3):
Table 3.
Global spatial autocorrelation results.
From 2000 to 2021, the consistent positive values of Moran’s I statistic, with p-values below 0.1 for 20 out of 22 years (excluding 2016 and 2018) reveal a significant positive spatial correlation in the high-quality development of the provincial tourism industry. Notably, for 13 of these years, the p-values were less than 0.05, indicating a robust and statistically significant positive spatial correlation. Before 2013, the provincial tourism industry-development quality exhibited a predominantly strong positive spatial correlation, suggesting a similarity with the development quality of the surrounding provinces or cities and manifesting spatial clustering tendencies. The “time–space compression” effect of high-speed rail influenced the expansion of client market radii for tourism destinations. Post-2014, while spatial correlation in the development quality of the provincial tourism industry persisted, there was a discernible weakening of this correlation, attributable to the impact of the HSR.
5.3.3. The Evolution Trend of Local Spatial Autocorrelation
- LISA Time Path—Relative Length
The relative lengths of the LISA time paths (Figure 13) reflect the local spatial structural stability and spatial dependency of the quality of tourism development. A larger relative length indicates a more active development of the local tourism industry, whereas a smaller relative length, coupled with lower development quality, suggests a need for revitalization. Using the natural-breaks method and manual-classification method in the ArcGIS10.5 software (with a critical value of 1 for relative length), this study divided the relative length of the LISA time paths into six levels. Among them, 16 provinces had a relative length of less than 1, indicating a relatively stable local spatial structure. The graph illustrates that the quality of tourism industry development in each province showed significant growth from 2000 to 2021. The relative length was greater in the eastern and northeastern regions, and the overall spatial structure in the central region was relatively stable. In the western region, the relative length was greater in the northwest than in the southwest. The eastern region has made significant progress in innovation, coordination, green development, openness, and sharing, benefiting from clear advantages in terms of socioeconomic conditions, tourism resources, and geographical location, but the spatial pattern exhibited considerable fluctuations. The northeastern and northwestern regions experienced substantial fluctuations in the quality of the tourism industry development, indicating unstable local spatial patterns. The central and southwestern regions have shorter relative lengths, indicating a steady pace of tourism industry development. These regions are gradually exploring progress in regard to tourism, with relatively stable local spatial patterns.
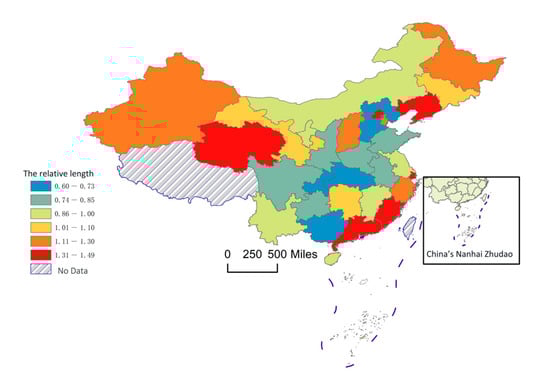
Figure 13.
LISA time path—relative length.
- 2.
- LISA Time Path—Curvature
The curvature of the LISA time paths (Figure 14) reflects the spatial dependency of the provincial tourism industry’s development quality. Using the natural break method and manual classification in ArcGIS software, the curvature was divided into five levels. A larger curvature indicates a stronger spatial dependency of the province (city) on the surrounding area, with more evident spillover or polarization effects from neighboring regions. The average curvature was 21.46, with eight provinces or cities having curvatures greater than the average. The maximum curvature is 101.06 in Ningxia, while the minimum was 3.3 Chongqing, showing a significant range. The average curvature of the time paths was higher in the eastern and northwestern regions and lower in the central, northeastern, and southwestern regions. The eastern and northwestern regions exhibit strong interactions in terms of economic development and landscape features, with significant variability in the spatial dependency direction of the tourism industry-development quality. In contrast, the spatial-dependency direction in the central, northeastern, and southwestern regions is relatively stable, with small differences in the level and growth rate of tourism development among provinces and cities within the region.
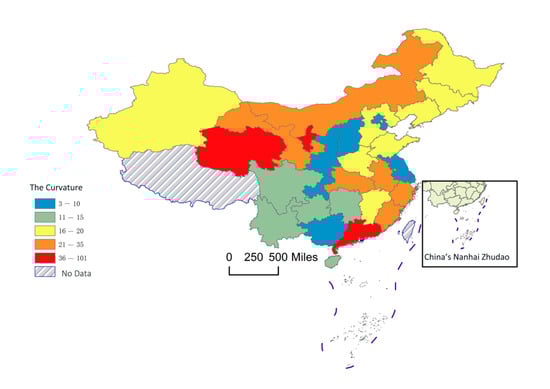
Figure 14.
LISA time path—curvature.
- 3.
- LISA Spatiotemporal Transition
The LISA Spatiotemporal Transition measures the process characteristics of local spatial correlation types that interconnect with the development quality of the provincial tourism industry. Spatiotemporal transition is categorized into four types: Type 1, where neither itself nor the neighboring areas undergo transition; Type 2, where they undergo transition while the neighboring areas remain unchanged; Type 3, where they remain unchanged while the neighboring areas undergo transition; and Type 4, where both themselves and the neighboring areas undergo transition. The probability of spatiotemporal transition in the development quality follows the order (Table 4): Type 1 (0.7937) > Type 2 (0.1238) > Type 3 (0.0714) > Type 4 (0.0111). This indicates that most regions did not undergo a spatial correlation-type transition.
Table 4.
LISA spatiotemporal transition analysis.
In Type 1, the highest probability was associated with the LL–LL type, indicating a significant phenomenon of low-value clustering. The HH–HH type suggests the presence of clustering in regions with high-quality tourism industry development. However, few areas were seen to achieve high-quality development, and the areas that did were specifically concentrated in the eastern region.
In Type 2, the highest probability was associated with the HL–LL type, followed closely by the LL–HL type. These two transition patterns mostly occurred before 2012 and typically manifested as a combination of LL–HL–LL. These transitions are concentrated in the southwest, northwest, and central plains, where natural and historical resources are abundant. Despite briefly becoming high-value areas for tourism development due to their resource endowments, these regions failed to consolidate their development achievements in a timely manner. Moreover, neighboring provinces had lower tourism industry development quality, indicating that there is room for improvement at the regional tourism industry development level.
In Type 3, the predominant transition patterns involved maintaining low values, such as the LH–LL and LL–LH types, with a higher probability for the LH–LL type. Fewer instances maintained high values, as represented by the HH–HL and HL–HH types. Prior to 2015, the LH–LL and LL–LH types were mainly concentrated in six provinces and cities (Anhui, Hebei, Hunan, Tianjin, Xinjiang, and Yunnan). The provinces neighboring these six regions were mostly located in the central and western regions. During this period, the scores for the quality-of-tourism-industry development in these six provinces and cities exhibited fluctuating increases but were notably lower than those in the southeast region. In contrast, the HH–HL and HL–HH types were mainly found in the Guangdong Province. Guangdong consistently leads the development quality of the Chinese tourism industry, whereas the development levels of neighboring provinces vary.
Type 4 transitions are relatively few in number and are concentrated primarily before 2005 and 2020. During these two periods, China’s tourism industry became unstable. Before 2005, the industry was still in the initial stages of development. In 2020, the COVID-19 pandemic significantly affected spatial patterns of tourism in China.
6. Conclusions
By studying the spatiotemporal evolution of China’s tourism industry, it is found that the development quality is crucial for charting pathways towards high-quality development in the new era. Unlike previous studies that have focused mainly on industry efficiency, this study integrates the concept of the new development philosophy and constructs a comprehensive indicator system covering five dimensions: innovation, coordination, green development, openness, and shared development [30,74]. Guided by this philosophy, this study establishes five subsystems—innovative, coordinated, green, open, and shared development—to assess the development quality of the provincial tourism industry. Through the entropy–TOPSIS method and spatial-analysis techniques, the following conclusions were drawn on the spatiotemporal evolution of the tourism industry development quality.
The first is the need for high-quality development. China’s tourism industry has transitioned through three stages from 2000 to 2021: rapid advancement, format integration, and, recently, high-quality development. The extensive development model of tourism, relying on natural and historical resource endowments, has been curbed, and a high-quality development model led by technological innovation is a future development trend in China’s tourism industry. Tourists’ pursuit of shifting from “viewing” to “experiencing” requires tourism destinations to innovate and upgrade to a higher level with new tourism elements such as products and services, space design, interactive experience, and so on. Especially after the impact of the new crown epidemic, tourists prefer the smart tourism model, and the tourism industry needs to combine local economic and social conditions to carry out differentiated and characteristic tourism activities according to the local conditions.
Second, the realization of high-quality tourism development relies on the joint efforts of five dimensions: innovation, coordination, greenness, openness, and sharing. First, the relatively high-quality regions take the lead in technological innovation and opening up of the tourism industry, exert their technological frontier advantages based on the open highland, provide technical experience for other regions, and provide full play to the advantages of latecomers in learning excellent technologies and models. Second, attention should be paid to environmental supervision, ecological protection, and green technology development to ease the environmental problems that has caused in the process of tourism development. With increasing and upgraded public demand for spiritual civilization, cultural tourism venues need to be built and improved as well. Finally, with the upgrading and structural reform of the tourism industry, the degree of coordination within the tourism industry and that of coordination with the external environment shall be improved, and the realization of coordinated development requires the coordinated promotion of multiple social, economic, and ecological subjects.
Third, spatial disparities and clustering effects. Disparities exist within and between regions, with the eastern region leading to quality development and the formation of clusters of high-quality tourism. The central and western regions lagged, requiring strategic improvement. Urban agglomerations such as the Yangtze River Delta exhibit superior development, influencing neighboring regions through spillover effects.
Fourth, resilience and recovery after the pandemic. Despite reduced inter-provincial mobility due to the pandemic, enthusiasm for intra-provincial and intra-city tourism remained high. Provinces and cities promote spiritual civilization construction, integrate culture and tourism, and enhance resource sharing, particularly in terms of cultural and tourism assets. In addition, the emergence of new online tourism models in 2020 and 2021, such as virtual experiences and smart guides, offers diverse opportunities for tourism development. Meanwhile, with outbound tourism on hold, domestic destinations are gaining visibility, setting the stage for the post-pandemic recovery of domestic tourism.
7. Discussion and Limitation
This section highlights the key findings and insights for China and similar economies. Changes in tourist preferences driven by economic development and the COVID-19 pandemic include a growing interest in virtual experiences and local travel [33,37]. Innovative tourism formats are reshaping tourism resources. Moreover, advancements in green technology are still required for sustainable development [8,70].
However, this study had some limitations. Challenges with data availability and variations in statistical methodologies were present. The depth and breadth of the research could be enhanced through diversifying data-collection methods and further researching on city-level analysis for practical contributions to the tourism industry.
Author Contributions
Conceptualization, H.Z. and Z.X.; methodology, H.Z. and J.W.; formal analysis, J.W.; investigation, Z.X.; resources, H.Z.; data curation, J.W.; writing—original draft preparation, H.Z. and J.W.; writing—review and editing, H.Z. and Z.X.; visualization, J.W.; project administration, H.Z.; funding acquisition, H.Z. All authors have read and agreed to the published version of the manuscript.
Funding
This research was funded by the Social Science Foundation of Hunan Province (21JD053) and the Policy Research Office in Zhuzhou City.
Institutional Review Board Statement
Not applicable.
Informed Consent Statement
Not applicable.
Data Availability Statement
Data are contained within the article.
Conflicts of Interest
The authors declare no conflicts of interest.
Appendix A
Table A1.
Inter-regional disparities in the quality of innovative development.
Table A1.
Inter-regional disparities in the quality of innovative development.
| East–Central | East–West | East–Northeast | Central–West | Central–Northeast | West–Northeast | |
|---|---|---|---|---|---|---|
| 2000 | 0.1313 | 0.1439 | 0.2123 | 0.1281 | 0.1611 | 0.1291 |
| 2001 | 0.1341 | 0.1402 | 0.2021 | 0.1239 | 0.1556 | 0.1137 |
| 2002 | 0.1949 | 0.4082 | 0.3556 | 0.3406 | 0.2721 | 0.2737 |
| 2003 | 0.0750 | 0.1147 | 0.1848 | 0.0860 | 0.1322 | 0.1037 |
| 2004 | 0.2979 | 0.2933 | 0.3962 | 0.1050 | 0.2320 | 0.2249 |
| 2005 | 0.0161 | 0.0204 | 0.0254 | 0.0087 | 0.0142 | 0.0101 |
| 2006 | 0.2279 | 0.2466 | 0.3200 | 0.0349 | 0.1815 | 0.1767 |
| 2007 | 0.1658 | 0.2348 | 0.3199 | 0.1174 | 0.2250 | 0.1637 |
| 2008 | 0.0898 | 0.1652 | 0.2075 | 0.0991 | 0.1400 | 0.0689 |
| 2009 | 0.2441 | 0.2689 | 0.2887 | 0.0950 | 0.1267 | 0.1160 |
| 2010 | 0.1836 | 0.2141 | 0.2232 | 0.0594 | 0.0647 | 0.0461 |
| 2011 | 0.2413 | 0.2624 | 0.2761 | 0.0791 | 0.1045 | 0.0917 |
| 2012 | 0.0637 | 0.0690 | 0.0903 | 0.0212 | 0.0471 | 0.0424 |
| 2013 | 0.0974 | 0.2231 | 0.2473 | 0.1884 | 0.2178 | 0.1049 |
| 2014 | 0.1610 | 0.1955 | 0.2224 | 0.0532 | 0.0768 | 0.0555 |
| 2015 | 0.1400 | 0.1690 | 0.1700 | 0.0525 | 0.0417 | 0.0492 |
| 2016 | 0.1543 | 0.1582 | 0.1877 | 0.0504 | 0.0785 | 0.0611 |
| 2017 | 0.1719 | 0.1928 | 0.1831 | 0.0859 | 0.0546 | 0.0734 |
| 2018 | 0.1204 | 0.1375 | 0.1315 | 0.0508 | 0.0317 | 0.0442 |
| 2019 | 0.0662 | 0.0721 | 0.0822 | 0.0193 | 0.0363 | 0.0291 |
| 2020 | 0.0782 | 0.0869 | 0.0915 | 0.0240 | 0.0337 | 0.0250 |
| 2021 | 0.0824 | 0.0797 | 0.0931 | 0.0399 | 0.0470 | 0.0214 |
Table A2.
Intra-regional Disparities in the Quality of Innovative Development.
Table A2.
Intra-regional Disparities in the Quality of Innovative Development.
| National | East | Central | West | Northeast | |
|---|---|---|---|---|---|
| 2000 | 0.1403 | 0.1174 | 0.1200 | 0.1129 | 0.0389 |
| 2001 | 0.1388 | 0.1166 | 0.1277 | 0.0995 | 0.0451 |
| 2002 | 0.2976 | 0.2175 | 0.1098 | 0.3467 | 0.0790 |
| 2003 | 0.0909 | 0.0454 | 0.0661 | 0.0808 | 0.0661 |
| 2004 | 0.2881 | 0.2519 | 0.1157 | 0.0716 | 0.2752 |
| 2005 | 0.0157 | 0.0186 | 0.0030 | 0.0098 | 0.0030 |
| 2006 | 0.2241 | 0.2070 | 0.0130 | 0.0366 | 0.1985 |
| 2007 | 0.2080 | 0.1223 | 0.0973 | 0.0459 | 0.1954 |
| 2008 | 0.1201 | 0.0869 | 0.0308 | 0.0695 | 0.0389 |
| 2009 | 0.1898 | 0.1373 | 0.0962 | 0.0750 | 0.1302 |
| 2010 | 0.1447 | 0.1643 | 0.0408 | 0.0452 | 0.0436 |
| 2011 | 0.1847 | 0.1787 | 0.0784 | 0.0589 | 0.1039 |
| 2012 | 0.0535 | 0.0847 | 0.0134 | 0.0242 | 0.0304 |
| 2013 | 0.1689 | 0.1187 | 0.0562 | 0.1006 | 0.0978 |
| 2014 | 0.1347 | 0.1459 | 0.0396 | 0.0387 | 0.0600 |
| 2015 | 0.1115 | 0.1071 | 0.0263 | 0.0570 | 0.0335 |
| 2016 | 0.1259 | 0.1348 | 0.0598 | 0.0246 | 0.0670 |
| 2017 | 0.1400 | 0.1563 | 0.0598 | 0.0953 | 0.0310 |
| 2018 | 0.0971 | 0.1309 | 0.0307 | 0.0587 | 0.0212 |
| 2019 | 0.0569 | 0.0720 | 0.0234 | 0.0026 | 0.0380 |
| 2020 | 0.0623 | 0.0824 | 0.0218 | 0.0056 | 0.0344 |
| 2021 | 0.0633 | 0.0695 | 0.0563 | 0.0050 | 0.0229 |
Table A3.
Inter-regional disparities in the quality of coordinated development.
Table A3.
Inter-regional disparities in the quality of coordinated development.
| East–Central | East–West | East–Northeast | Central–West | Central–Northeast | West–Northeast | |
|---|---|---|---|---|---|---|
| 2000 | 0.3708 | 0.4503 | 0.5288 | 0.2362 | 0.2694 | 0.2726 |
| 2001 | 0.2742 | 0.2885 | 0.3944 | 0.1860 | 0.2483 | 0.2019 |
| 2002 | 0.1979 | 0.2357 | 0.3582 | 0.1078 | 0.2338 | 0.1927 |
| 2003 | 0.1883 | 0.2453 | 0.3319 | 0.1123 | 0.2025 | 0.1536 |
| 2004 | 0.1470 | 0.2561 | 0.2600 | 0.1949 | 0.2044 | 0.1025 |
| 2005 | 0.1396 | 0.2665 | 0.3048 | 0.1765 | 0.2226 | 0.1337 |
| 2006 | 0.2410 | 0.3256 | 0.3935 | 0.1231 | 0.2109 | 0.1584 |
| 2007 | 0.2303 | 0.2787 | 0.3418 | 0.1079 | 0.1668 | 0.1336 |
| 2008 | 0.2238 | 0.2709 | 0.3234 | 0.0924 | 0.1482 | 0.1283 |
| 2009 | 0.2184 | 0.2767 | 0.3142 | 0.0805 | 0.1327 | 0.1078 |
| 2010 | 0.2012 | 0.2845 | 0.5483 | 0.2639 | 0.5289 | 0.4559 |
| 2011 | 0.0744 | 0.0726 | 0.1996 | 0.0757 | 0.1896 | 0.1910 |
| 2012 | 0.0525 | 0.0533 | 0.1361 | 0.0431 | 0.1255 | 0.1134 |
| 2013 | 0.0510 | 0.0515 | 0.0466 | 0.0488 | 0.0308 | 0.0344 |
| 2014 | 0.0435 | 0.0402 | 0.0554 | 0.0380 | 0.0517 | 0.0415 |
| 2015 | 0.0438 | 0.0333 | 0.0482 | 0.0337 | 0.0443 | 0.0325 |
| 2016 | 0.0499 | 0.0320 | 0.0433 | 0.0401 | 0.0441 | 0.0281 |
| 2017 | 0.0488 | 0.0473 | 0.0496 | 0.0273 | 0.0349 | 0.0289 |
| 2018 | 0.0584 | 0.0292 | 0.0390 | 0.0578 | 0.0569 | 0.0344 |
| 2019 | 0.1727 | 0.1834 | 0.1886 | 0.0406 | 0.0469 | 0.0471 |
| 2020 | 0.0385 | 0.0308 | 0.0328 | 0.0362 | 0.0339 | 0.0302 |
| 2021 | 0.0317 | 0.0350 | 0.0323 | 0.0327 | 0.0300 | 0.0277 |
Table A4.
Intra-regional disparities in the quality of coordinated development.
Table A4.
Intra-regional disparities in the quality of coordinated development.
| National | East | Central | West | Northeast | |
|---|---|---|---|---|---|
| 2000 | 0.3779 | 0.3656 | 0.1582 | 0.2587 | 0.1146 |
| 2001 | 0.2603 | 0.2343 | 0.1977 | 0.1404 | 0.1610 |
| 2002 | 0.2100 | 0.2004 | 0.0584 | 0.1103 | 0.1430 |
| 2003 | 0.2015 | 0.1864 | 0.0315 | 0.1182 | 0.1004 |
| 2004 | 0.1892 | 0.1708 | 0.0547 | 0.1319 | 0.0570 |
| 2005 | 0.2094 | 0.1627 | 0.0528 | 0.0772 | 0.1594 |
| 2006 | 0.2710 | 0.2612 | 0.0666 | 0.0822 | 0.1790 |
| 2007 | 0.2322 | 0.2261 | 0.0780 | 0.0850 | 0.1374 |
| 2008 | 0.2181 | 0.1976 | 0.0649 | 0.0885 | 0.1336 |
| 2009 | 0.2088 | 0.1873 | 0.0460 | 0.0612 | 0.1243 |
| 2010 | 0.2813 | 0.2010 | 0.1689 | 0.2964 | 0.1855 |
| 2011 | 0.0924 | 0.0662 | 0.0698 | 0.0705 | 0.2212 |
| 2012 | 0.0614 | 0.0569 | 0.0418 | 0.0397 | 0.0403 |
| 2013 | 0.0459 | 0.0432 | 0.0432 | 0.0428 | 0.0071 |
| 2014 | 0.0404 | 0.0424 | 0.0413 | 0.0319 | 0.0204 |
| 2015 | 0.0357 | 0.0401 | 0.0435 | 0.0200 | 0.0271 |
| 2016 | 0.0383 | 0.0367 | 0.0543 | 0.0201 | 0.0179 |
| 2017 | 0.0405 | 0.0622 | 0.0222 | 0.0259 | 0.0191 |
| 2018 | 0.0478 | 0.0231 | 0.0769 | 0.0292 | 0.0230 |
| 2019 | 0.1360 | 0.2549 | 0.0257 | 0.0456 | 0.0340 |
| 2020 | 0.0338 | 0.0284 | 0.0378 | 0.0292 | 0.0226 |
| 2021 | 0.0314 | 0.0292 | 0.0313 | 0.0280 | 0.0215 |
Table A5.
Inter-regional disparities in the quality of green development.
Table A5.
Inter-regional disparities in the quality of green development.
| East–Central | East–West | East–Northeast | Central–West | Central–Northeast | West–Northeast | |
|---|---|---|---|---|---|---|
| 2000 | 0.2629 | 0.2679 | 0.2847 | 0.1188 | 0.1644 | 0.0802 |
| 2001 | 0.2366 | 0.2656 | 0.2871 | 0.1392 | 0.1996 | 0.1638 |
| 2002 | 0.2382 | 0.2644 | 0.3016 | 0.1424 | 0.2031 | 0.1737 |
| 2003 | 0.2343 | 0.2568 | 0.3080 | 0.1365 | 0.2043 | 0.1936 |
| 2004 | 0.2381 | 0.2510 | 0.3112 | 0.1446 | 0.2089 | 0.2032 |
| 2005 | 0.2481 | 0.2318 | 0.3095 | 0.1286 | 0.2068 | 0.1907 |
| 2006 | 0.2442 | 0.2265 | 0.3070 | 0.1253 | 0.2114 | 0.1864 |
| 2007 | 0.2365 | 0.2085 | 0.2802 | 0.1131 | 0.1836 | 0.1604 |
| 2008 | 0.2221 | 0.2023 | 0.2556 | 0.0992 | 0.1534 | 0.1366 |
| 2009 | 0.2121 | 0.2051 | 0.2325 | 0.1086 | 0.1354 | 0.1049 |
| 2010 | 0.1998 | 0.1881 | 0.2107 | 0.0800 | 0.1245 | 0.1097 |
| 2011 | 0.1953 | 0.2052 | 0.2026 | 0.0875 | 0.1090 | 0.1110 |
| 2012 | 0.2026 | 0.1929 | 0.1998 | 0.0815 | 0.1069 | 0.1032 |
| 2013 | 0.2010 | 0.2011 | 0.1809 | 0.0812 | 0.1125 | 0.0977 |
| 2014 | 0.2068 | 0.2058 | 0.1864 | 0.0840 | 0.1185 | 0.0985 |
| 2015 | 0.2142 | 0.2050 | 0.1827 | 0.0920 | 0.1319 | 0.0956 |
| 2016 | 0.2117 | 0.2046 | 0.1830 | 0.0931 | 0.1334 | 0.0962 |
| 2017 | 0.2099 | 0.2049 | 0.1837 | 0.0927 | 0.1276 | 0.0969 |
| 2018 | 0.2115 | 0.2048 | 0.1840 | 0.0939 | 0.1323 | 0.0980 |
| 2019 | 0.2116 | 0.2039 | 0.1844 | 0.0957 | 0.1357 | 0.0971 |
| 2020 | 0.2121 | 0.2020 | 0.1826 | 0.0963 | 0.1395 | 0.0972 |
| 2021 | 0.2142 | 0.2036 | 0.1835 | 0.0969 | 0.1418 | 0.0980 |
Table A6.
Intra-regional disparities in the quality of green development.
Table A6.
Intra-regional disparities in the quality of green development.
| National | East | Central | West | Northeast | |
|---|---|---|---|---|---|
| 2000 | 0.2137 | 0.3629 | 0.0080 | 0.0671 | 0.0727 |
| 2001 | 0.2284 | 0.3211 | 0.0462 | 0.1593 | 0.0585 |
| 2002 | 0.2325 | 0.3185 | 0.0832 | 0.1603 | 0.0668 |
| 2003 | 0.2309 | 0.3086 | 0.0965 | 0.1574 | 0.0573 |
| 2004 | 0.2304 | 0.3034 | 0.1151 | 0.1529 | 0.0503 |
| 2005 | 0.2271 | 0.3055 | 0.1480 | 0.0919 | 0.0507 |
| 2006 | 0.2240 | 0.3005 | 0.1455 | 0.0810 | 0.0426 |
| 2007 | 0.2096 | 0.2880 | 0.1432 | 0.0572 | 0.0382 |
| 2008 | 0.1926 | 0.2794 | 0.1230 | 0.0567 | 0.0375 |
| 2009 | 0.1825 | 0.2692 | 0.1167 | 0.0837 | 0.0428 |
| 2010 | 0.1663 | 0.2609 | 0.0943 | 0.0497 | 0.0329 |
| 2011 | 0.1671 | 0.2665 | 0.0543 | 0.1005 | 0.0297 |
| 2012 | 0.1634 | 0.2644 | 0.0930 | 0.0516 | 0.0280 |
| 2013 | 0.1582 | 0.2584 | 0.0491 | 0.0917 | 0.0207 |
| 2014 | 0.1624 | 0.2633 | 0.0415 | 0.0969 | 0.0199 |
| 2015 | 0.1625 | 0.2610 | 0.0326 | 0.0976 | 0.0206 |
| 2016 | 0.1626 | 0.2601 | 0.0270 | 0.1000 | 0.0176 |
| 2017 | 0.1629 | 0.2607 | 0.0342 | 0.1009 | 0.0199 |
| 2018 | 0.1633 | 0.2605 | 0.0278 | 0.1011 | 0.0231 |
| 2019 | 0.1633 | 0.2602 | 0.0263 | 0.1010 | 0.0236 |
| 2020 | 0.1622 | 0.2580 | 0.0223 | 0.0992 | 0.0247 |
| 2021 | 0.1633 | 0.2596 | 0.0221 | 0.0992 | 0.0239 |
Table A7.
Inter-regional disparities in the quality of open development.
Table A7.
Inter-regional disparities in the quality of open development.
| East–Central | East–West | East–Northeast | Central–West | Central–Northeast | West–Northeast | |
|---|---|---|---|---|---|---|
| 2000 | 0.4798 | 0.6085 | 0.6916 | 0.3599 | 0.4183 | 0.4415 |
| 2001 | 0.4568 | 0.6043 | 0.6535 | 0.3594 | 0.3940 | 0.4267 |
| 2002 | 0.4835 | 0.6286 | 0.6670 | 0.3745 | 0.4071 | 0.4339 |
| 2003 | 0.4783 | 0.6777 | 0.7591 | 0.4565 | 0.5624 | 0.4768 |
| 2004 | 0.5279 | 0.6651 | 0.7100 | 0.3779 | 0.4152 | 0.4132 |
| 2005 | 0.5552 | 0.6706 | 0.6931 | 0.3797 | 0.3687 | 0.4054 |
| 2006 | 0.5390 | 0.6697 | 0.6679 | 0.3957 | 0.3681 | 0.3888 |
| 2007 | 0.5255 | 0.6693 | 0.6594 | 0.4027 | 0.3733 | 0.3782 |
| 2008 | 0.4637 | 0.6446 | 0.6895 | 0.4323 | 0.4978 | 0.3983 |
| 2009 | 0.4892 | 0.6376 | 0.6923 | 0.3844 | 0.4861 | 0.3839 |
| 2010 | 0.5044 | 0.6412 | 0.7028 | 0.3700 | 0.4813 | 0.3761 |
| 2011 | 0.4865 | 0.6286 | 0.6802 | 0.3714 | 0.4709 | 0.3737 |
| 2012 | 0.4861 | 0.6182 | 0.6678 | 0.3579 | 0.4674 | 0.3869 |
| 2013 | 0.4613 | 0.5762 | 0.6217 | 0.3142 | 0.3837 | 0.3973 |
| 2014 | 0.5049 | 0.5965 | 0.6271 | 0.2825 | 0.3539 | 0.4147 |
| 2015 | 0.5711 | 0.6122 | 0.6029 | 0.4138 | 0.2932 | 0.4508 |
| 2016 | 0.5515 | 0.6049 | 0.5966 | 0.4148 | 0.3031 | 0.4483 |
| 2017 | 0.5862 | 0.5792 | 0.5842 | 0.4513 | 0.4287 | 0.3073 |
| 2018 | 0.5751 | 0.5466 | 0.5712 | 0.4504 | 0.4448 | 0.3171 |
| 2019 | 0.5113 | 0.5634 | 0.5535 | 0.4571 | 0.3114 | 0.4734 |
| 2020 | 0.5213 | 0.6857 | 0.6738 | 0.4612 | 0.3782 | 0.5353 |
| 2021 | 0.4969 | 0.6972 | 0.7541 | 0.4316 | 0.4727 | 0.4586 |
Table A8.
Intra-regional disparities in the quality of open development.
Table A8.
Intra-regional disparities in the quality of open development.
| National | East | Central | West | Northeast | |
|---|---|---|---|---|---|
| 2000 | 0.5223 | 0.4357 | 0.1736 | 0.4468 | 0.2686 |
| 2001 | 0.5083 | 0.4230 | 0.1762 | 0.4391 | 0.3375 |
| 2002 | 0.5238 | 0.4276 | 0.2099 | 0.4326 | 0.3535 |
| 2003 | 0.5636 | 0.4126 | 0.2283 | 0.4690 | 0.3316 |
| 2004 | 0.5448 | 0.4205 | 0.2338 | 0.4220 | 0.2655 |
| 2005 | 0.5463 | 0.4210 | 0.2498 | 0.4376 | 0.2477 |
| 2006 | 0.5370 | 0.4095 | 0.2558 | 0.4387 | 0.2460 |
| 2007 | 0.5305 | 0.3988 | 0.2524 | 0.4364 | 0.2331 |
| 2008 | 0.5343 | 0.3919 | 0.2381 | 0.1598 | 0.5033 |
| 2009 | 0.5348 | 0.3979 | 0.2975 | 0.1445 | 0.4938 |
| 2010 | 0.5420 | 0.4098 | 0.2954 | 0.1690 | 0.4910 |
| 2011 | 0.5272 | 0.3983 | 0.2922 | 0.1822 | 0.4803 |
| 2012 | 0.5233 | 0.4021 | 0.3068 | 0.2071 | 0.4809 |
| 2013 | 0.4983 | 0.4242 | 0.2057 | 0.2836 | 0.4545 |
| 2014 | 0.5086 | 0.4228 | 0.1471 | 0.3183 | 0.4603 |
| 2015 | 0.5233 | 0.4252 | 0.2238 | 0.5116 | 0.3303 |
| 2016 | 0.5168 | 0.4213 | 0.2421 | 0.5031 | 0.3338 |
| 2017 | 0.5067 | 0.3932 | 0.5020 | 0.3357 | 0.2090 |
| 2018 | 0.5119 | 0.4682 | 0.5077 | 0.3361 | 0.2029 |
| 2019 | 0.4985 | 0.4418 | 0.3182 | 0.5228 | 0.1984 |
| 2020 | 0.5659 | 0.4176 | 0.0417 | 0.5786 | 0.4492 |
| 2021 | 0.5688 | 0.3877 | 0.1421 | 0.4571 | 0.4080 |
Table A9.
Inter-regional disparities in the quality of shared development.
Table A9.
Inter-regional disparities in the quality of shared development.
| East–Central | East–West | East–Northeast | Central–West | Central–Northeast | West–Northeast | |
|---|---|---|---|---|---|---|
| 2000 | 0.1790 | 0.1573 | 0.2697 | 0.1820 | 0.2836 | 0.2083 |
| 2001 | 0.2594 | 0.3066 | 0.2745 | 0.2497 | 0.0854 | 0.2487 |
| 2002 | 0.2651 | 0.2745 | 0.3334 | 0.0962 | 0.2395 | 0.2316 |
| 2003 | 0.3849 | 0.3588 | 0.3556 | 0.2564 | 0.2517 | 0.0924 |
| 2004 | 0.3816 | 0.3908 | 0.4266 | 0.1141 | 0.2367 | 0.2302 |
| 2005 | 0.3694 | 0.3423 | 0.3836 | 0.2992 | 0.3132 | 0.1224 |
| 2006 | 0.3293 | 0.2838 | 0.3507 | 0.2340 | 0.2628 | 0.1397 |
| 2007 | 0.3340 | 0.3198 | 0.3242 | 0.1602 | 0.1750 | 0.0970 |
| 2008 | 0.2812 | 0.2577 | 0.2956 | 0.2026 | 0.2345 | 0.1121 |
| 2009 | 0.2748 | 0.2579 | 0.3261 | 0.1705 | 0.2196 | 0.1438 |
| 2010 | 0.2525 | 0.2392 | 0.2953 | 0.1548 | 0.1996 | 0.1360 |
| 2011 | 0.2396 | 0.2358 | 0.2958 | 0.1659 | 0.2143 | 0.1299 |
| 2012 | 0.2517 | 0.2255 | 0.2751 | 0.1945 | 0.2451 | 0.1305 |
| 2013 | 0.1837 | 0.2040 | 0.2358 | 0.1569 | 0.1834 | 0.1823 |
| 2014 | 0.2009 | 0.1855 | 0.2265 | 0.1539 | 0.1806 | 0.1380 |
| 2015 | 0.1733 | 0.1967 | 0.2423 | 0.1282 | 0.1426 | 0.1826 |
| 2016 | 0.1535 | 0.1950 | 0.2464 | 0.1419 | 0.1910 | 0.1816 |
| 2017 | 0.1200 | 0.1790 | 0.2268 | 0.1384 | 0.1688 | 0.1912 |
| 2018 | 0.1315 | 0.1673 | 0.2282 | 0.1370 | 0.1674 | 0.1990 |
| 2019 | 0.2203 | 0.2458 | 0.3102 | 0.1373 | 0.1567 | 0.1974 |
| 2020 | 0.1309 | 0.1676 | 0.2150 | 0.1318 | 0.1593 | 0.1938 |
| 2021 | 0.1517 | 0.1220 | 0.1910 | 0.1236 | 0.1671 | 0.1363 |
Table A10.
Intra-regional disparities in the quality of shared development.
Table A10.
Intra-regional disparities in the quality of shared development.
| National | East | Central | West | Northeast | |
|---|---|---|---|---|---|
| 2000 | 0.2271 | 0.1475 | 0.1976 | 0.0329 | 0.2735 |
| 2001 | 0.2545 | 0.2077 | 0.1025 | 0.2921 | 0.0386 |
| 2002 | 0.2615 | 0.2116 | 0.1196 | 0.0388 | 0.2982 |
| 2003 | 0.3124 | 0.2808 | 0.3017 | 0.1169 | 0.0428 |
| 2004 | 0.3272 | 0.2780 | 0.1348 | 0.0634 | 0.2858 |
| 2005 | 0.3236 | 0.2602 | 0.3502 | 0.0853 | 0.1193 |
| 2006 | 0.2868 | 0.2621 | 0.2946 | 0.0677 | 0.1214 |
| 2007 | 0.2587 | 0.2415 | 0.2085 | 0.0457 | 0.1164 |
| 2008 | 0.2491 | 0.2302 | 0.2610 | 0.0045 | 0.1400 |
| 2009 | 0.2426 | 0.2258 | 0.2095 | 0.0176 | 0.1647 |
| 2010 | 0.2243 | 0.2278 | 0.1859 | 0.0505 | 0.1577 |
| 2011 | 0.2210 | 0.2056 | 0.1979 | 0.0648 | 0.1436 |
| 2012 | 0.2348 | 0.2169 | 0.2502 | 0.0364 | 0.1550 |
| 2013 | 0.1928 | 0.2131 | 0.1265 | 0.1658 | 0.1406 |
| 2014 | 0.1880 | 0.2093 | 0.1665 | 0.1106 | 0.1226 |
| 2015 | 0.1844 | 0.2004 | 0.0692 | 0.1549 | 0.1399 |
| 2016 | 0.1835 | 0.1786 | 0.0837 | 0.1633 | 0.1308 |
| 2017 | 0.1707 | 0.1434 | 0.0544 | 0.1758 | 0.1174 |
| 2018 | 0.1695 | 0.1436 | 0.0730 | 0.1697 | 0.1296 |
| 2019 | 0.2217 | 0.2506 | 0.0763 | 0.1625 | 0.1177 |
| 2020 | 0.1653 | 0.1427 | 0.0699 | 0.1590 | 0.1378 |
| 2021 | 0.1478 | 0.1236 | 0.1448 | 0.0775 | 0.1164 |
References
- Zhang, H. The Governance Logic and System Innovation for the High-quality Development of Tourism in the New Era. Contemp. Econ. Manag. 2019, 41, 60–66. [Google Scholar]
- Yang, Y.; Liu, X.; Shi, B. Problems of and suggestions on economic development of regions relying on tourism. Macroecon. Manag. 2019, 3, 84–90. [Google Scholar]
- You, F.; He, H.; Cui, W. A Review of Sustainable Urban Regeneration Approaches Based on Augmented Reality Technology: A Case of the Bund in Shanghai. Sustainability 2022, 14, 12869. [Google Scholar] [CrossRef]
- Yang, Y.; Wu, X. From the Digital Economy to the Digital Divide: New Logic and Issues in the Development of Tourism Industry. Tour. Trib. 2022, 37, 3–5. [Google Scholar]
- Song, R. The Total Factor Productivity of Tourism:An Empirical Analysis Based on the Comparison of Star Hotels, Travel Agencies and Tourist Attractions. J. Grad. Sch. Chin. Acad. Soc. Sci. 2017, 6, 72–80. [Google Scholar]
- Grayson, K.; Martinec, R. Consumer Perceptions of Iconicity and Indexicality and Their Influence on Assessments of Authentic Market Offerings. J. Consum. Res. 2004, 31, 296–312. [Google Scholar] [CrossRef]
- Huang, H.; Qiao, X.; Zhang, J.; Li, Y.; Zeng, Y. Spatio-Temporal Differentiation and Influencing Factors of Regional Tourism Carbon Emissions under the Background of Green Development:A Case Study of the Yangtze River Economic Belt. Econ. Geogr. 2019, 39, 214–224. [Google Scholar]
- Shi, P.; Wu, P. A Rough Estimation of Energy Consumption and CO2 Emissionin Tourism Sector. Acta Geogr. Sin. 2011, 66, 235–243. [Google Scholar]
- Beckena, S.; Simmonsb, D.G.; Framptonc, C. Energy use associated with different travel choices. Tour. Manag. 2003, 24, 267–277. [Google Scholar] [CrossRef]
- Chen, X.; Huang, F. Temporal Change of Regional Disparity in Chinese Inbound Tourism. Acta Geogr. Sin. 2006, 61, 1271–1280. [Google Scholar]
- Wang, X.; Lu, X.; Zhu, W. Analysis and Evaluation of the Influencing Factors of Tourism Development in China’s Major Tourism Cities. Econ. Geogr. 2020, 40, 198–209. [Google Scholar]
- Wu, T.; Zhang, J.; Li, W.; Cao, J.; Liu, Z. The spatial pattern evolution of the inbound tourism economic development level and the causes in China—Based on the inbound tourism economic entropy analysis. J. Arid Land Resour. Environ. 2009, 23, 189–194. [Google Scholar]
- Li, Y.; Zeng, J.; Cheng, S. Research on Tourists’ Satisfaction of Urban Environment Supply and Their Revisit Intention:Based on The Difference Analysis Between Visitors and Residents. Hum. Geogr. 2014, 29, 133–139. [Google Scholar]
- Ashworth, G.; Page, S.J. Urban tourism research: Recent progress and current paradoxes. Tour. Manag. 2011, 32, 1–15. [Google Scholar] [CrossRef]
- Jin, Y.; Xi, H.; Wang, X.; Ren, X.; Yuan, L. Evaluation of the Integration Policy in China: Does the Integration of Culture and Tourism Promote Tourism Development? Ann. Tour. Res. 2022, 97, 103491. [Google Scholar] [CrossRef]
- Cheng, L.; Liu, L. Exploring posttraumatic growth after the COVID-19 pandemic. Tour. Manag. 2022, 90, 104474. [Google Scholar] [CrossRef]
- Berry, S.; Ladkin, A. Sustainable tourism: A regional perspective. Tour. Manag. 1997, 18, 433–440. [Google Scholar] [CrossRef]
- McIntosh, R.W.; Goeldner, C.R.; Ritchie, J.R.B. Tourism: Principles, Practices, Philosophies; Wiley: Hoboken, NJ, USA, 1994. [Google Scholar]
- Weaver, D.B. Organic, incremental and induced paths to sustainable mass tourism convergence. Tour. Manag. 2012, 33, 1030–1037. [Google Scholar] [CrossRef]
- Bimonte, S.; Punzo, L.F. Tourist development and host–guest interaction: An economic exchange theory. Ann. Tour. Res. 2016, 58, 128–139. [Google Scholar] [CrossRef]
- Chica, M.; Hernández, J.M.; Perc, M. Sustainability in tourism determined by an asymmetric game with mobility. J. Clean. Prod. 2022, 355, 131662. [Google Scholar] [CrossRef]
- Cavallaro, F.; Irranca Galati, O.; Nocera, S. Climate change impacts and tourism mobility: A destination-based approach for coastal areas. Int. J. Sustain. Transp. 2021, 15, 456–473. [Google Scholar] [CrossRef]
- Erdoğan, S.; Gedikli, A.; Cevik, E.; Erdoğan, F. Eco-friendly technologies, international tourism and carbon emissions: Evidence from the most visited countries. Technol. Forecast. Soc. Change 2022, 180, 121705. [Google Scholar] [CrossRef]
- Zaman, K.; Moemen, M.A.; Islam, T. Dynamic linkages between tourism transportation expenditures, carbon dioxide emission, energy consumption and growth factors: Evidence from the transition economies. Curr. Issues Tour. 2017, 20, 1720–1735. [Google Scholar] [CrossRef]
- Lozano-Oyola, M.; Blancas, F.; González, M.; Caballero, R. Sustainable tourism indicators as planning tools in cultural destinations. Ecol. Indic. 2012, 18, 659–675. [Google Scholar] [CrossRef]
- Blancas, F.J.; Contreras, I.; Lozano-Oyola, M. Evaluating destinations’ efforts to improve sustainability in tourism using the inter-temporal decomposition of a composite indicator. Environ. Impact Assess. Rev. 2023, 98, 106947. [Google Scholar] [CrossRef]
- Wei, M.; Li, S. Study on the Measurement of Economic High-Quality Development Level in China in the New Era. J. Quant. Tech. Econ. 2018, 35, 3–20. [Google Scholar]
- Liu, Y.; Han, Y. Factor Structure, Institutional Environment and High-quality Development of the Tourism Economy in China. Tour. Trib. 2020, 35, 28–38. [Google Scholar]
- Wang, Z.; Xie, J.; Wu, W. Spatio-temporal Evolution and Influencing Factors of High-quality Tourism Industry Development Around Changsha-Zhuzhou-Xiangtan Urban Agglomeration. Econ. Geogr. 2022, 42, 172–181+221. [Google Scholar]
- Hadad, S.; Hadad, Y.; Malul, M.; Rosenboim, M. The Economic Efficiency of the Tourism Industry: A Global Comparison. Tour. Econ. 2012, 18, 931–940. [Google Scholar] [CrossRef]
- Grilli, G.; Tyllianakis, E.; Luisetti, T.; Ferrini, S.; Turner, R. Prospective tourist preferences for sustainable tourism development in Small Island Developing States. Tour. Manag. 2021, 82, 104178. [Google Scholar] [CrossRef]
- Liu, J.; Nijkamp, P.; Lin, D. Urban-rural imbalance and Tourism-Led Growth in China. Ann. Tour. Res. 2017, 64, 24–36. [Google Scholar] [CrossRef]
- Capó, J.; Font, A.R.; Nadal, J.R. Dutch Disease in Tourism Economies: Evidence from the Balearics and the Canary Islands. J. Sustain. Tour. 2007, 15, 615–627. [Google Scholar] [CrossRef]
- Deng, T.; Ma, M. Resource Curse in Tourism Economies? An Investigation of China’s World Cultural and Natural Heritage Sites. Asia Pac. J. Tour. Res. 2014, 19, 809–822. [Google Scholar] [CrossRef]
- Campos, C.; Gutiérrez, D.; Dias, A.C.; Quinteiro, P.; Herrero, Á.; Gallego, M.; Villanueva-Rey, P.; Laso, J.; Albertí, J.; Fullana-i-Palmer, P.; et al. ‘Small-scale’ tourism versus traditional tourism: Which will be the new key to achieve the desired sustainable tourism? Sci. Total Environ. 2024, 912, 168964. [Google Scholar] [CrossRef] [PubMed]
- Losada, N.; Jorge, F.; Teixeira, M.; Sousa, N.; Melo, M.; Bessa, M. Place Attachment Through Virtual Reality: A Comparative Study in Douro Region (Northern Portugal) with Video and ‘Real’ Visit. In Marketing and Smart Technologies; Springer Nature: Singapore, 2022; pp. 585–594. [Google Scholar]
- Sousa, N.; Jorge, F.; Teixeira, M.S.; Losada, N.; Melo, M.; Bessa, M. An Exploratory Study about the Effect of COVID-19 on the Intention to Adopt Virtual Reality in the Tourism Sector. Sustainability 2023, 15, 8725. [Google Scholar] [CrossRef]
- Aghion, P.; Howitt, P. A model of growth through creative destruction. Econometrica 1992, 60, 323–351. [Google Scholar] [CrossRef]
- Buhalis, D.; Licata, M.C. The future eTourism intermediaries. Tour. Manag. 2002, 23, 207–220. [Google Scholar] [CrossRef]
- Xiang, Z.; Du, Q.; Ma, Y.; Fan, W. A comparative analysis of major online review platforms: Implications for social media analytics in hospitality and tourism. Tour. Manag. 2017, 58, 51–65. [Google Scholar] [CrossRef]
- Chen, J.; Chen, Y.; Chen, M. China’s High-quality Economic Development Level, Regional Differences and Dynamic Evolution of Distribution. J. Quant. Tech. Econ. 2020, 37, 108–126. [Google Scholar]
- Sun, Z.; Xi, J. The Effect of Industrial Policy in China:Industrial Upgrade or Short-term Economic Growth. China Ind. Econ. 2015, 32, 52–67. [Google Scholar]
- Wang, K.; Guo, X.; Gan, C.; Tang, X.; Liu, H. Provincial scientific & technological innovation and high-quality development of tourism in China and their interactive relationship. Resour. Sci. 2022, 44, 114–126. [Google Scholar]
- Li, H.; Chen, L.; Li, G.; Carey, G. Tourism and regional income inequality: Evidence from China. Ann. Tour. Res. 2016, 58, 81–99. [Google Scholar] [CrossRef]
- He, X.; Hu, Q. The Harmonic Interaction between Tourism Industry Cluster and Regional Economy in Hunan Province. Econ. Geogr. 2018, 38, 209–216. [Google Scholar]
- Zhao, L.; Xia, X. Tourism and poverty reduction: Empirical evidence from China. Tour. Econ. 2020, 26, 233–256. [Google Scholar] [CrossRef]
- Gössling, S. Global environmental consequences of tourism. Glob. Environ. Change 2002, 12, 283–302. [Google Scholar] [CrossRef]
- Lenzen, M.; Sun, Y.; Faturay, F.; Ting, Y.; Geschke, A.; Malik, A. The carbon footprint of global tourism. Nat. Clim. Change 2018, 8, 522–528. [Google Scholar] [CrossRef]
- Liu, Y.; Tang, J. Measurement and Spatial-temporal Evolution Characteristics of High-quality Development Level of China’s Tourism. J. Nat. Resour. 2022, 37, 681–700. [Google Scholar]
- Buckley, R. Sustainable tourism: Research and reality. Ann. Tour. Res. 2012, 39, 528–546. [Google Scholar] [CrossRef]
- Zeng, Y.; Viachaslau, F.; Wang, L.; Zhong, L. The impact of tourism on municipal solid waste generation in China. J. Clean. Prod. 2023, 427, 139255. [Google Scholar]
- Zhang, J.; Zhang, Y. Tourism, economic growth, energy consumption, and CO2 emissions in China. Tour. Econ. 2021, 27, 1060–1080. [Google Scholar] [CrossRef]
- Chow, C.K.W.; Tsui, W.H.K.; Wu, H. Airport subsidies and domestic inbound tourism in China. Ann. Tour. Res. 2021, 90, 103275. [Google Scholar] [CrossRef]
- Sun, S.; Anwar, S. Foreign direct investment and the performance of indigenous firms in China’s textile industry. Q. Rev. Econ. Financ. 2017, 65, 107–113. [Google Scholar] [CrossRef]
- You, K.; Solomon, O. China’s outward foreign direct investment and domestic investment: An industrial level analysis. China Econ. Rev. 2015, 34, 249–260. [Google Scholar] [CrossRef]
- Mckercher, B.; Du Cros, H. Cultural Tourism: The Partnership between Tourism and Cultural Heritage Management, 1st ed.; Routledge: London, UK, 2002. [Google Scholar]
- Law, R.; Li, G.; Fong, D.; Han, X. Tourism demand forecasting: A deep learning approach. Ann. Tour. Res. 2019, 75, 410–423. [Google Scholar] [CrossRef]
- Su, L.; Yang, X.; Swanson, S.R. The impact of spatial-temporal variation on tourist destination resident quality of life. Tour. Manag. 2022, 93, 104572. [Google Scholar] [CrossRef]
- He, H.; Shen, L.; Wong, S.; Cheng, G.; Shu, T. A “load-carrier” perspective approach for assessing tourism resource carrying capacity. Tour. Manag. 2023, 94, 104651. [Google Scholar] [CrossRef]
- Wang, J.; Zhu, J.; Luo, X. Research on the Measurement of China’s Digital Economy Development and the Characteristics. J. Quant. Tech. Econ. 2021, 38, 26–42. [Google Scholar]
- Chen, M.; Lu, D.; Zhang, H. Comprehensive Evaluation and the Driving Factors ofChina’s Urbanization. Acta Geogr. Sin. 2009, 64, 387–398. [Google Scholar]
- Caves, D.W.; Christensen, L.R.; Diewert, W.E. The Economic Theory of Index Numbers and the Measurement of Input, Output, and Productivity. Econometrica 1982, 50, 1393–1414. [Google Scholar] [CrossRef]
- Liu, J.; Li, G.; Zhang, J.; Sun, T. Spatial Distribution and Its Affecting Factors of Economy Efficiency and Total Factor Productivity in China: 1990–2009. Acta Geogr. Sin. 2012, 67, 1069–1084. [Google Scholar]
- Fre, R.; Grosskopf, S.; Norris, M.; Zhang, Z. Productivity growth, technical progress, and efficiency change in industrialized countries. Am. Econ. Rev. 1994, 87, 1033–1039. [Google Scholar]
- Schafer, A. Regularities in travel demand: An international perspective. J. Transp. Stat. 2000, 1–31. [Google Scholar] [CrossRef]
- Schafer, A.; Victor, D.G. Global passenger travel: Implications for carbon dioxide emissions. Energy 1999, 24, 657–679. [Google Scholar] [CrossRef]
- Yan, J.; Shen, K. The Measurement and Causes of the Economic Gap Between North and South China. J. Cap. Univ. Econ. Bus. 2022, 24, 3–14. [Google Scholar]
- Wei, L.; Baoping, R. Judgment of China’s Economic Development Stages and the Analysis of the Characters at the Current Economic Development Stage. J. Quant. Tech. Econ. 2009, 26, 3–18+44. [Google Scholar]
- Cheng, Y.; Yang, Y.; Liu, Z.; Xiong, D. Retrospect and Prospect of Tourism in China. East China Econ. Manag. 2020, 34, 1–9. [Google Scholar]
- Guo, W.; Qin, Y.; Huang, W.; Yu, Q. The Convergence of Tourism Industries, New Tourism Formats and the Growth of Informal Employment: A Positive Analysis Based on Industries Experience and Conceptual Model. Tour. Trib. 2017, 32, 14–27. [Google Scholar]
- Rey, S.J.; Janikas, M.V. STARS: Space–Time Analysis of Regional Systems. Geogr. Anal. 2006, 38, 67–86. [Google Scholar] [CrossRef]
- Anselin, L. Local Indicators of Spatial Association—LISA. Geogr. Anal. 1995, 27, 93–115. [Google Scholar] [CrossRef]
- Pan, J.; Zhang, Y. Spatiotemporal patterns of energy carbon footprint and decoupling effect in China. Acta Geogr. Sin. 2021, 76, 206–222. [Google Scholar]
- Cracolici, M.F.; Nijkamp, P.; Rietveld, P. Assessment of tourism competitiveness by analysing destination efficiency. Tour. Econ. 2008, 14, 325–342. [Google Scholar] [CrossRef]

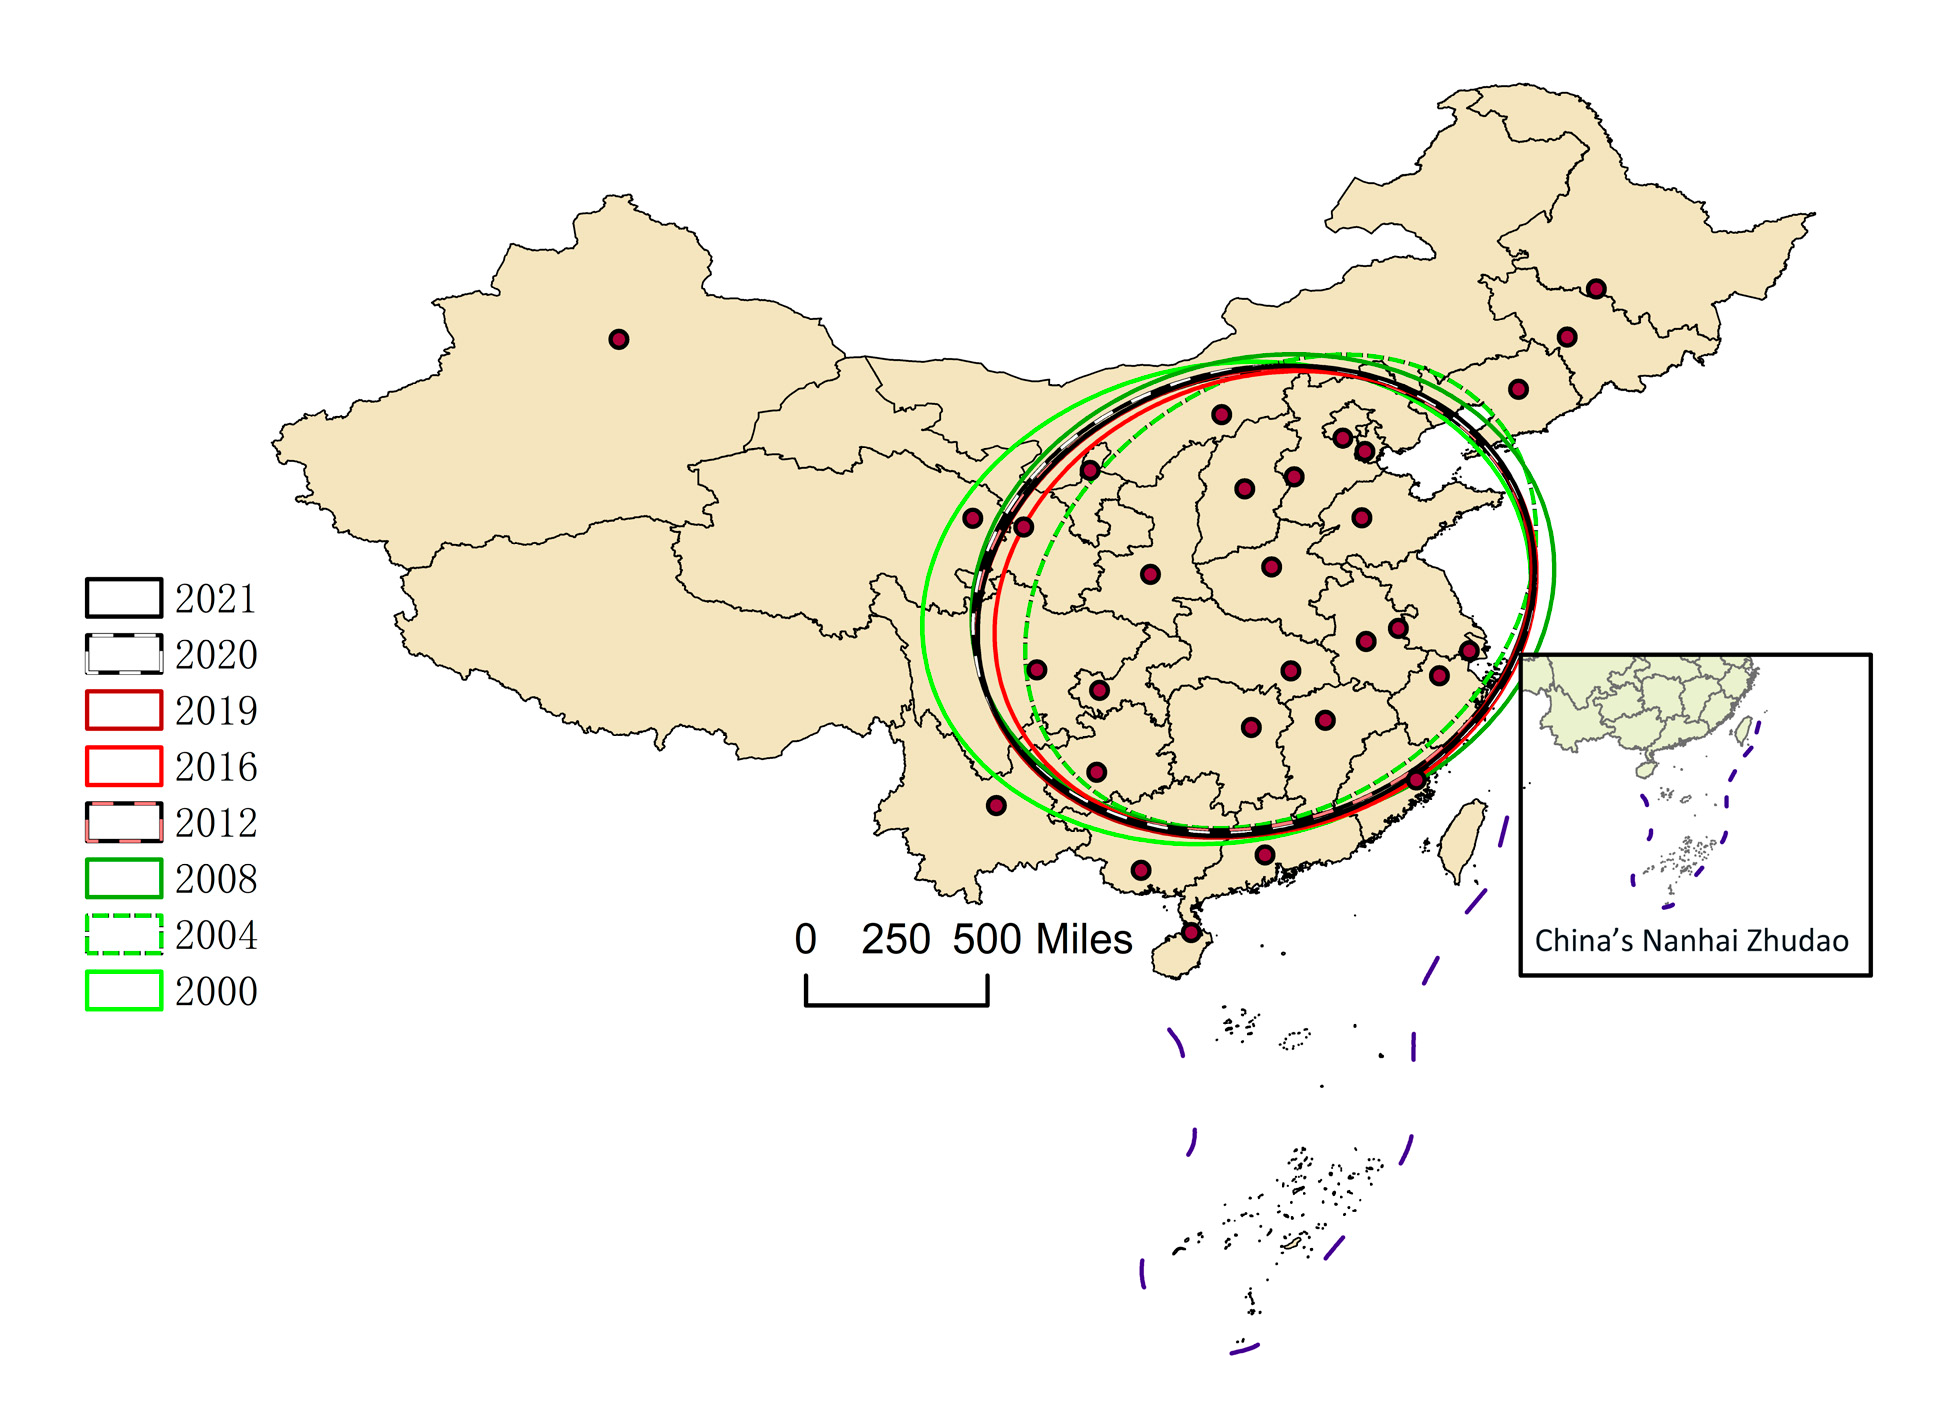
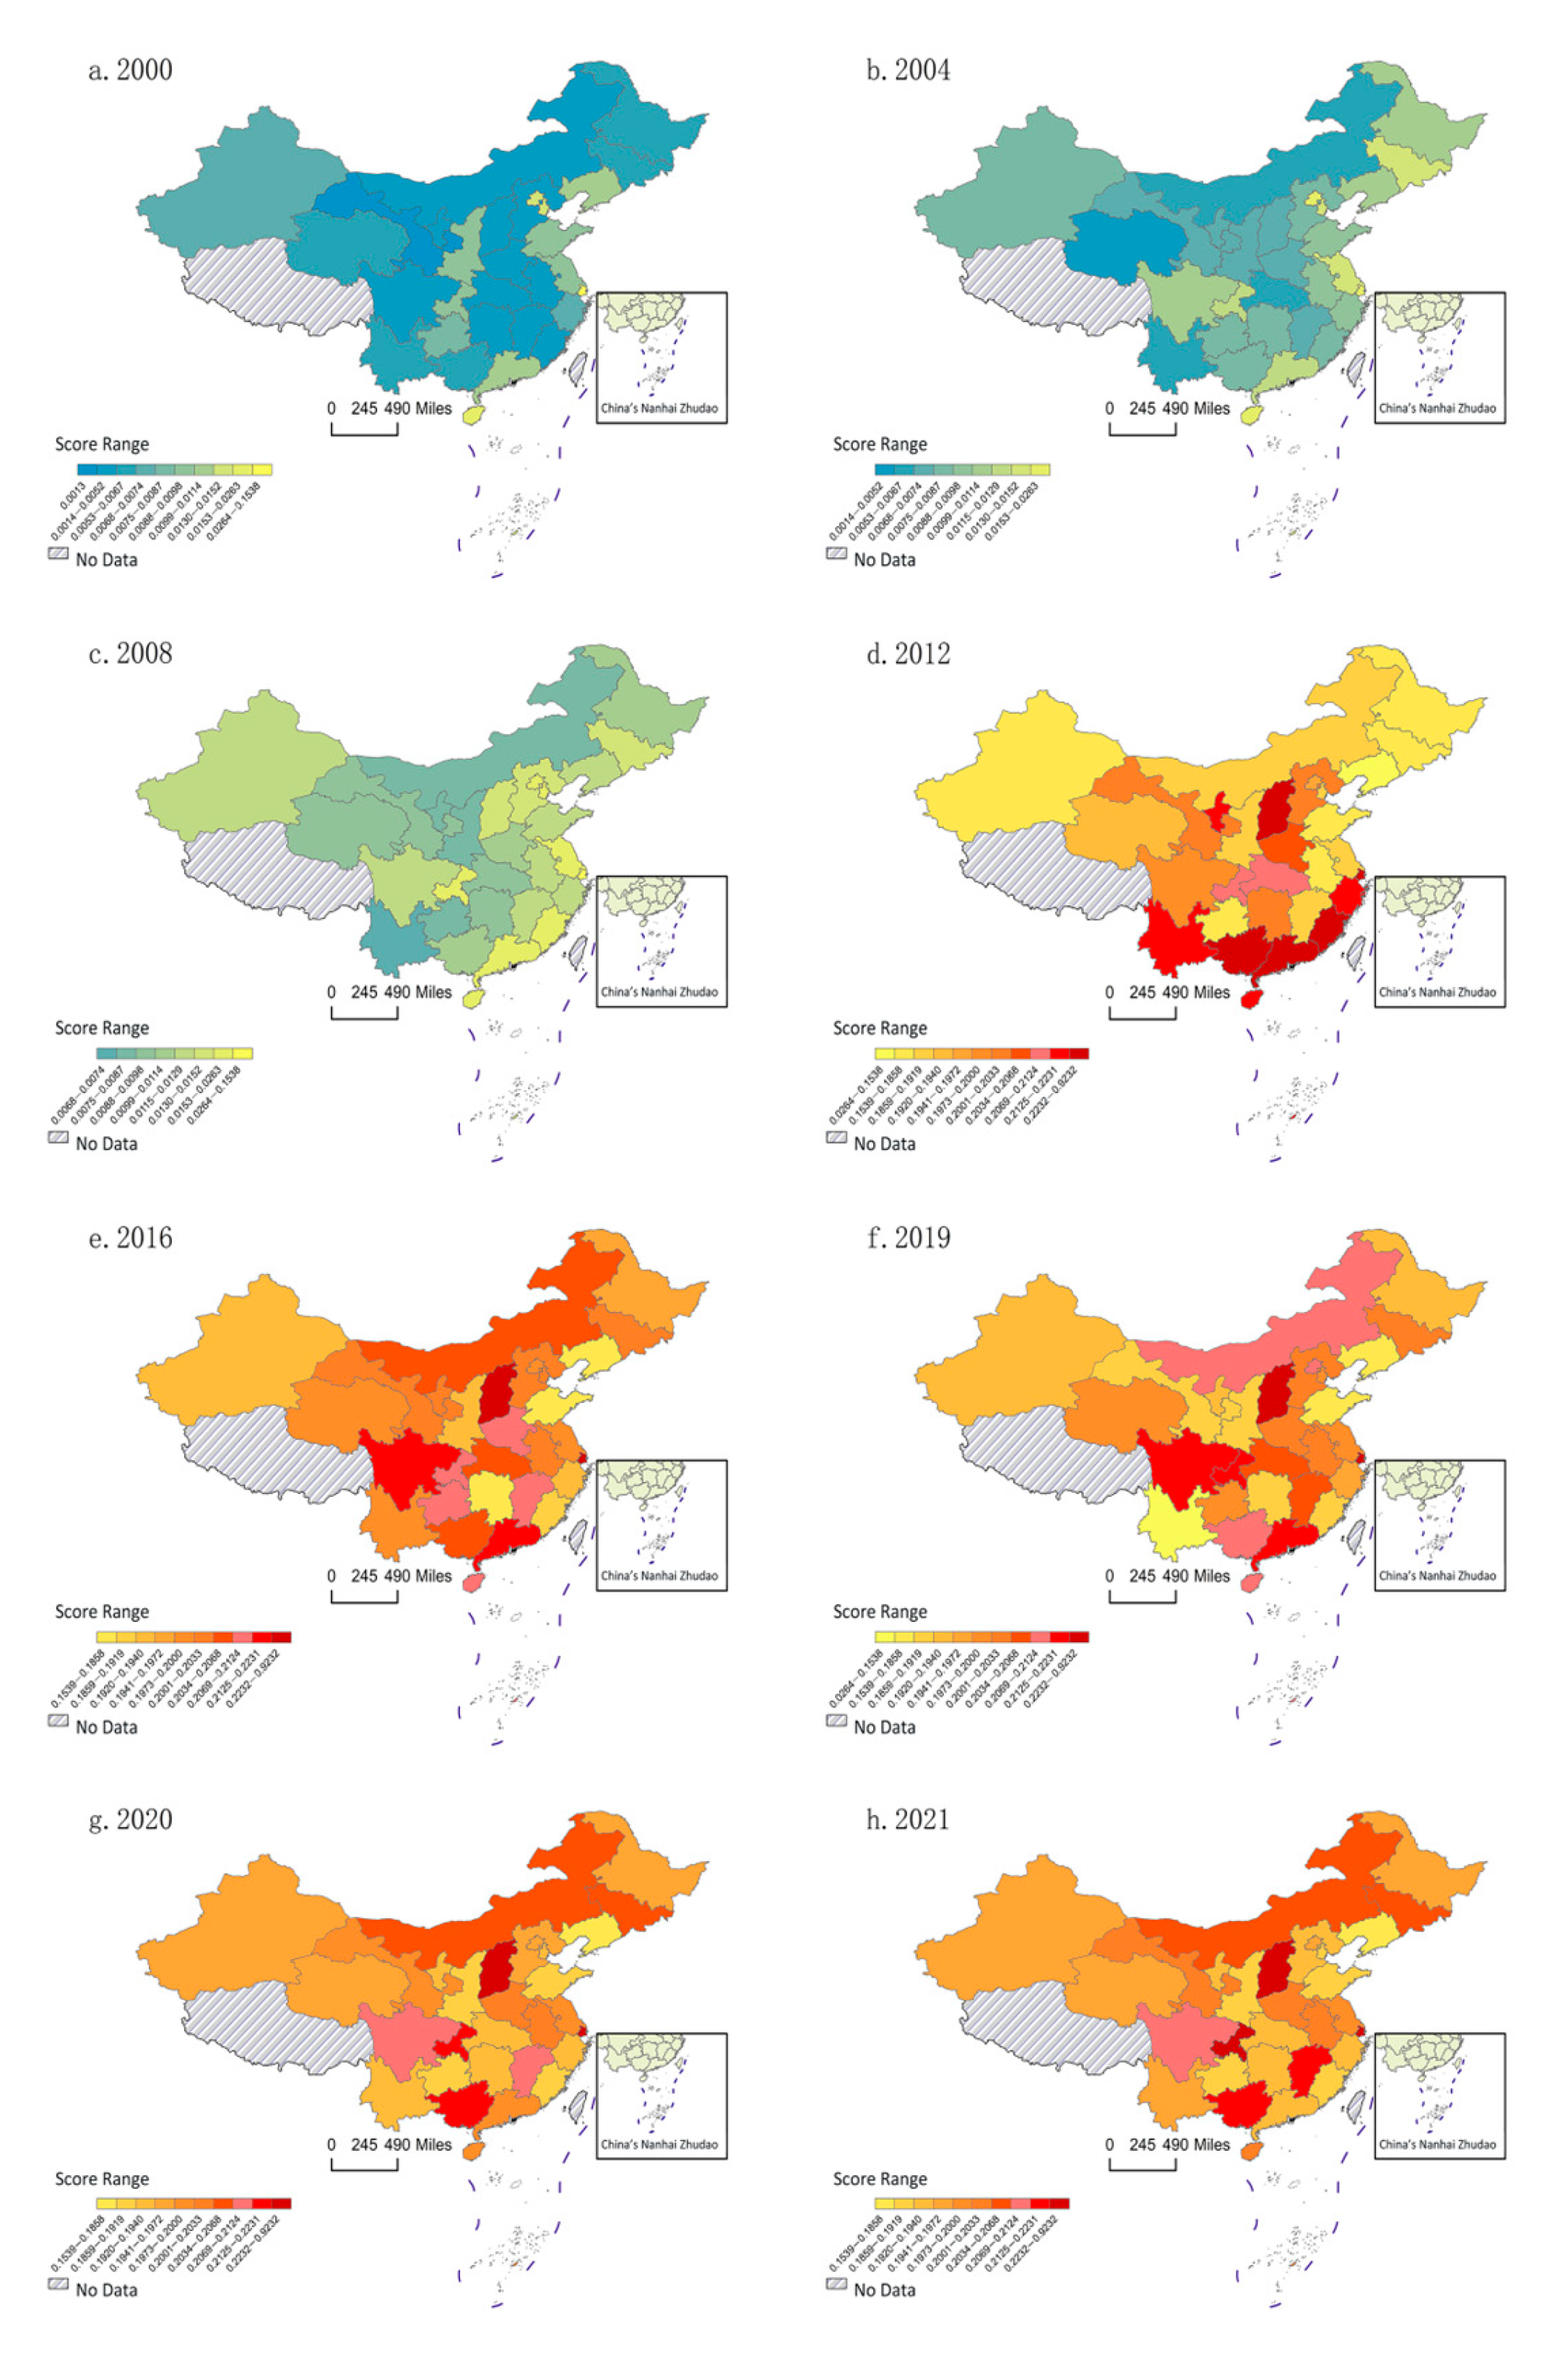
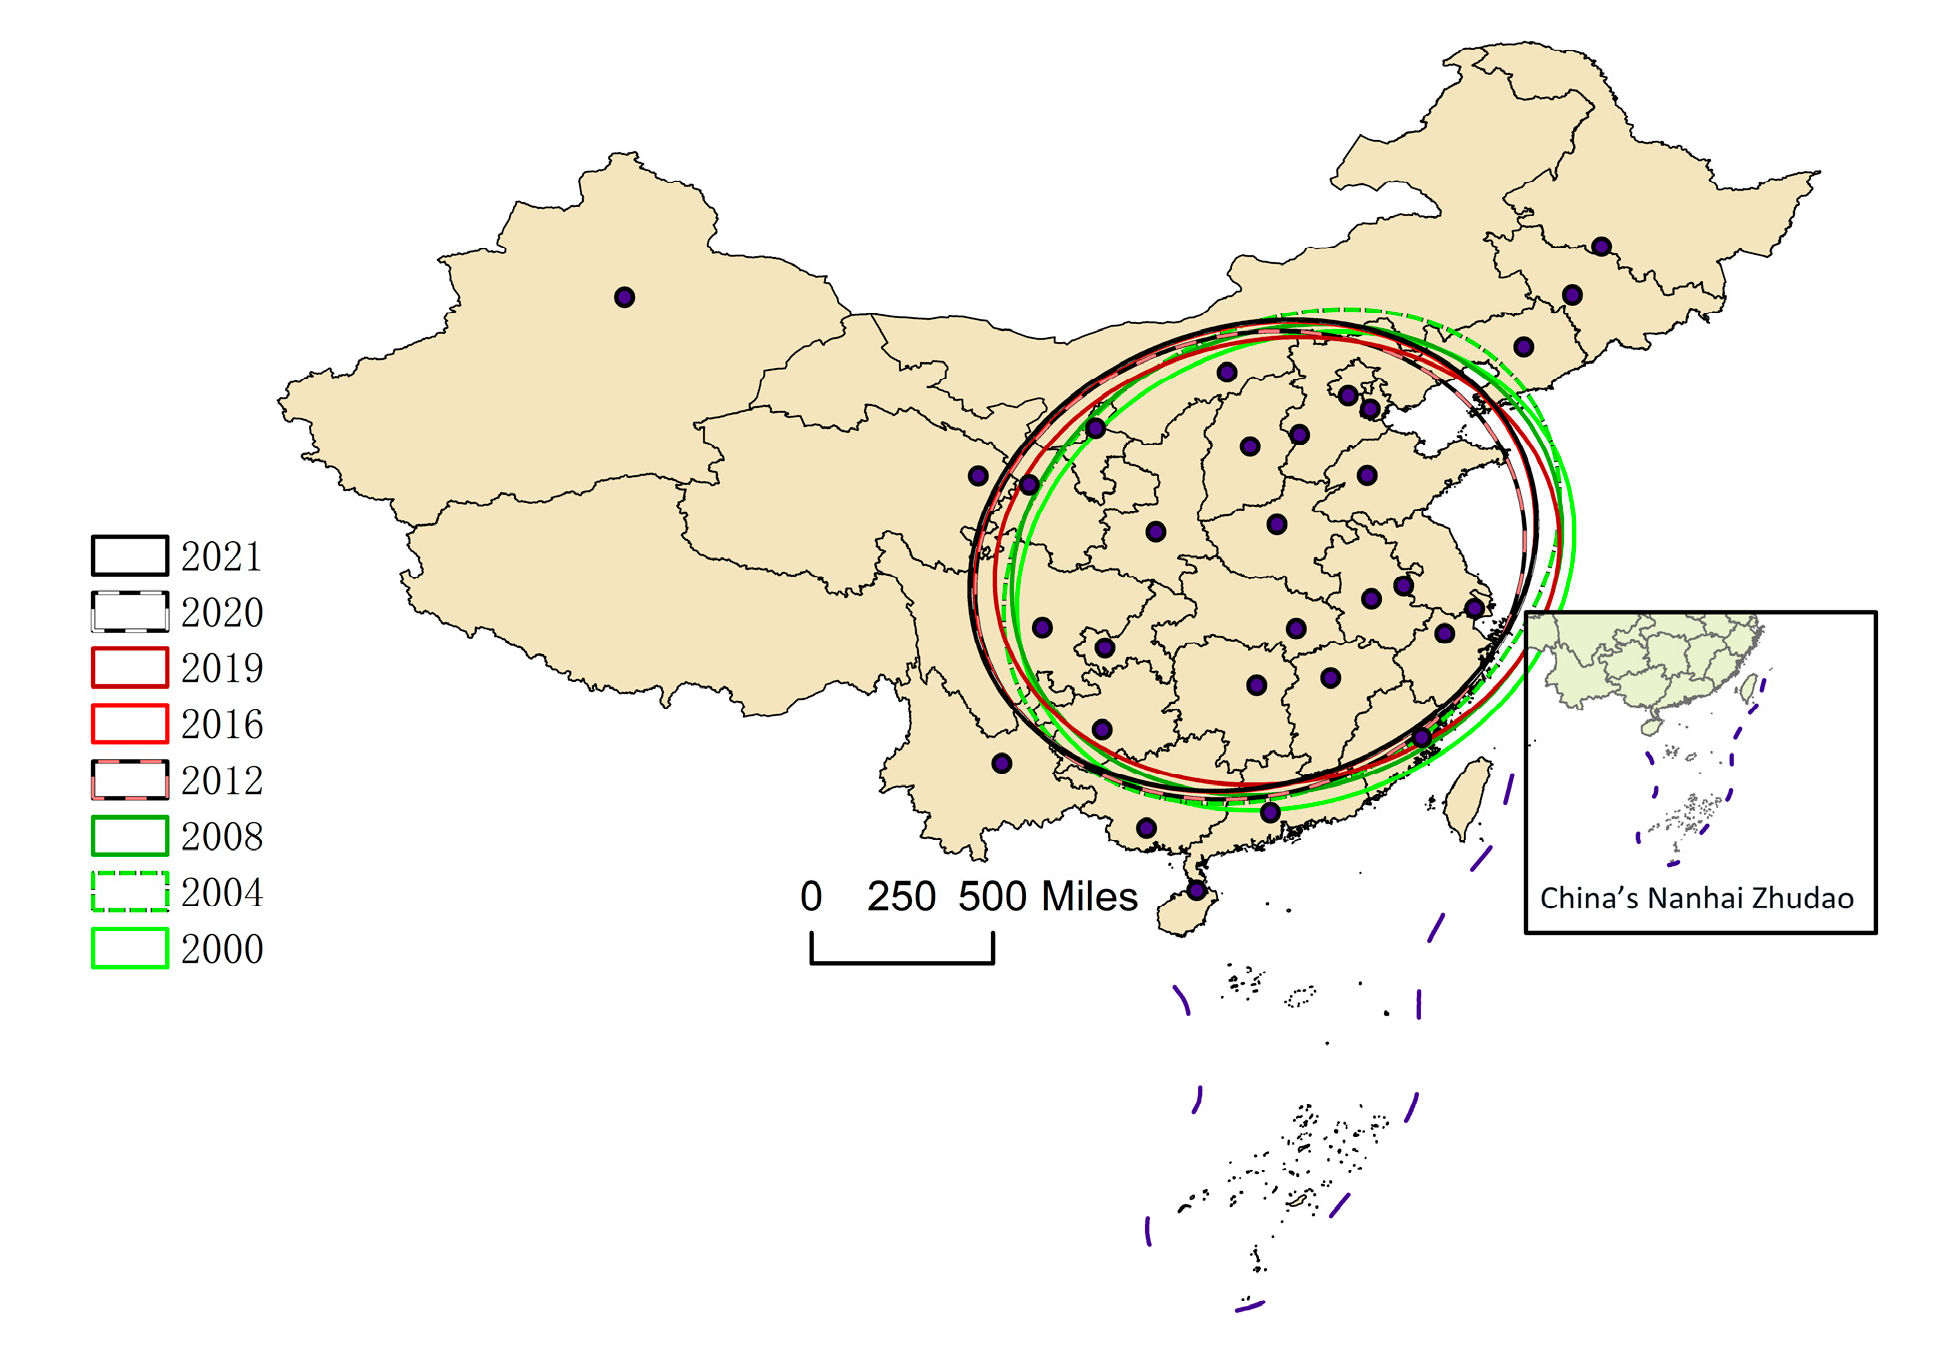
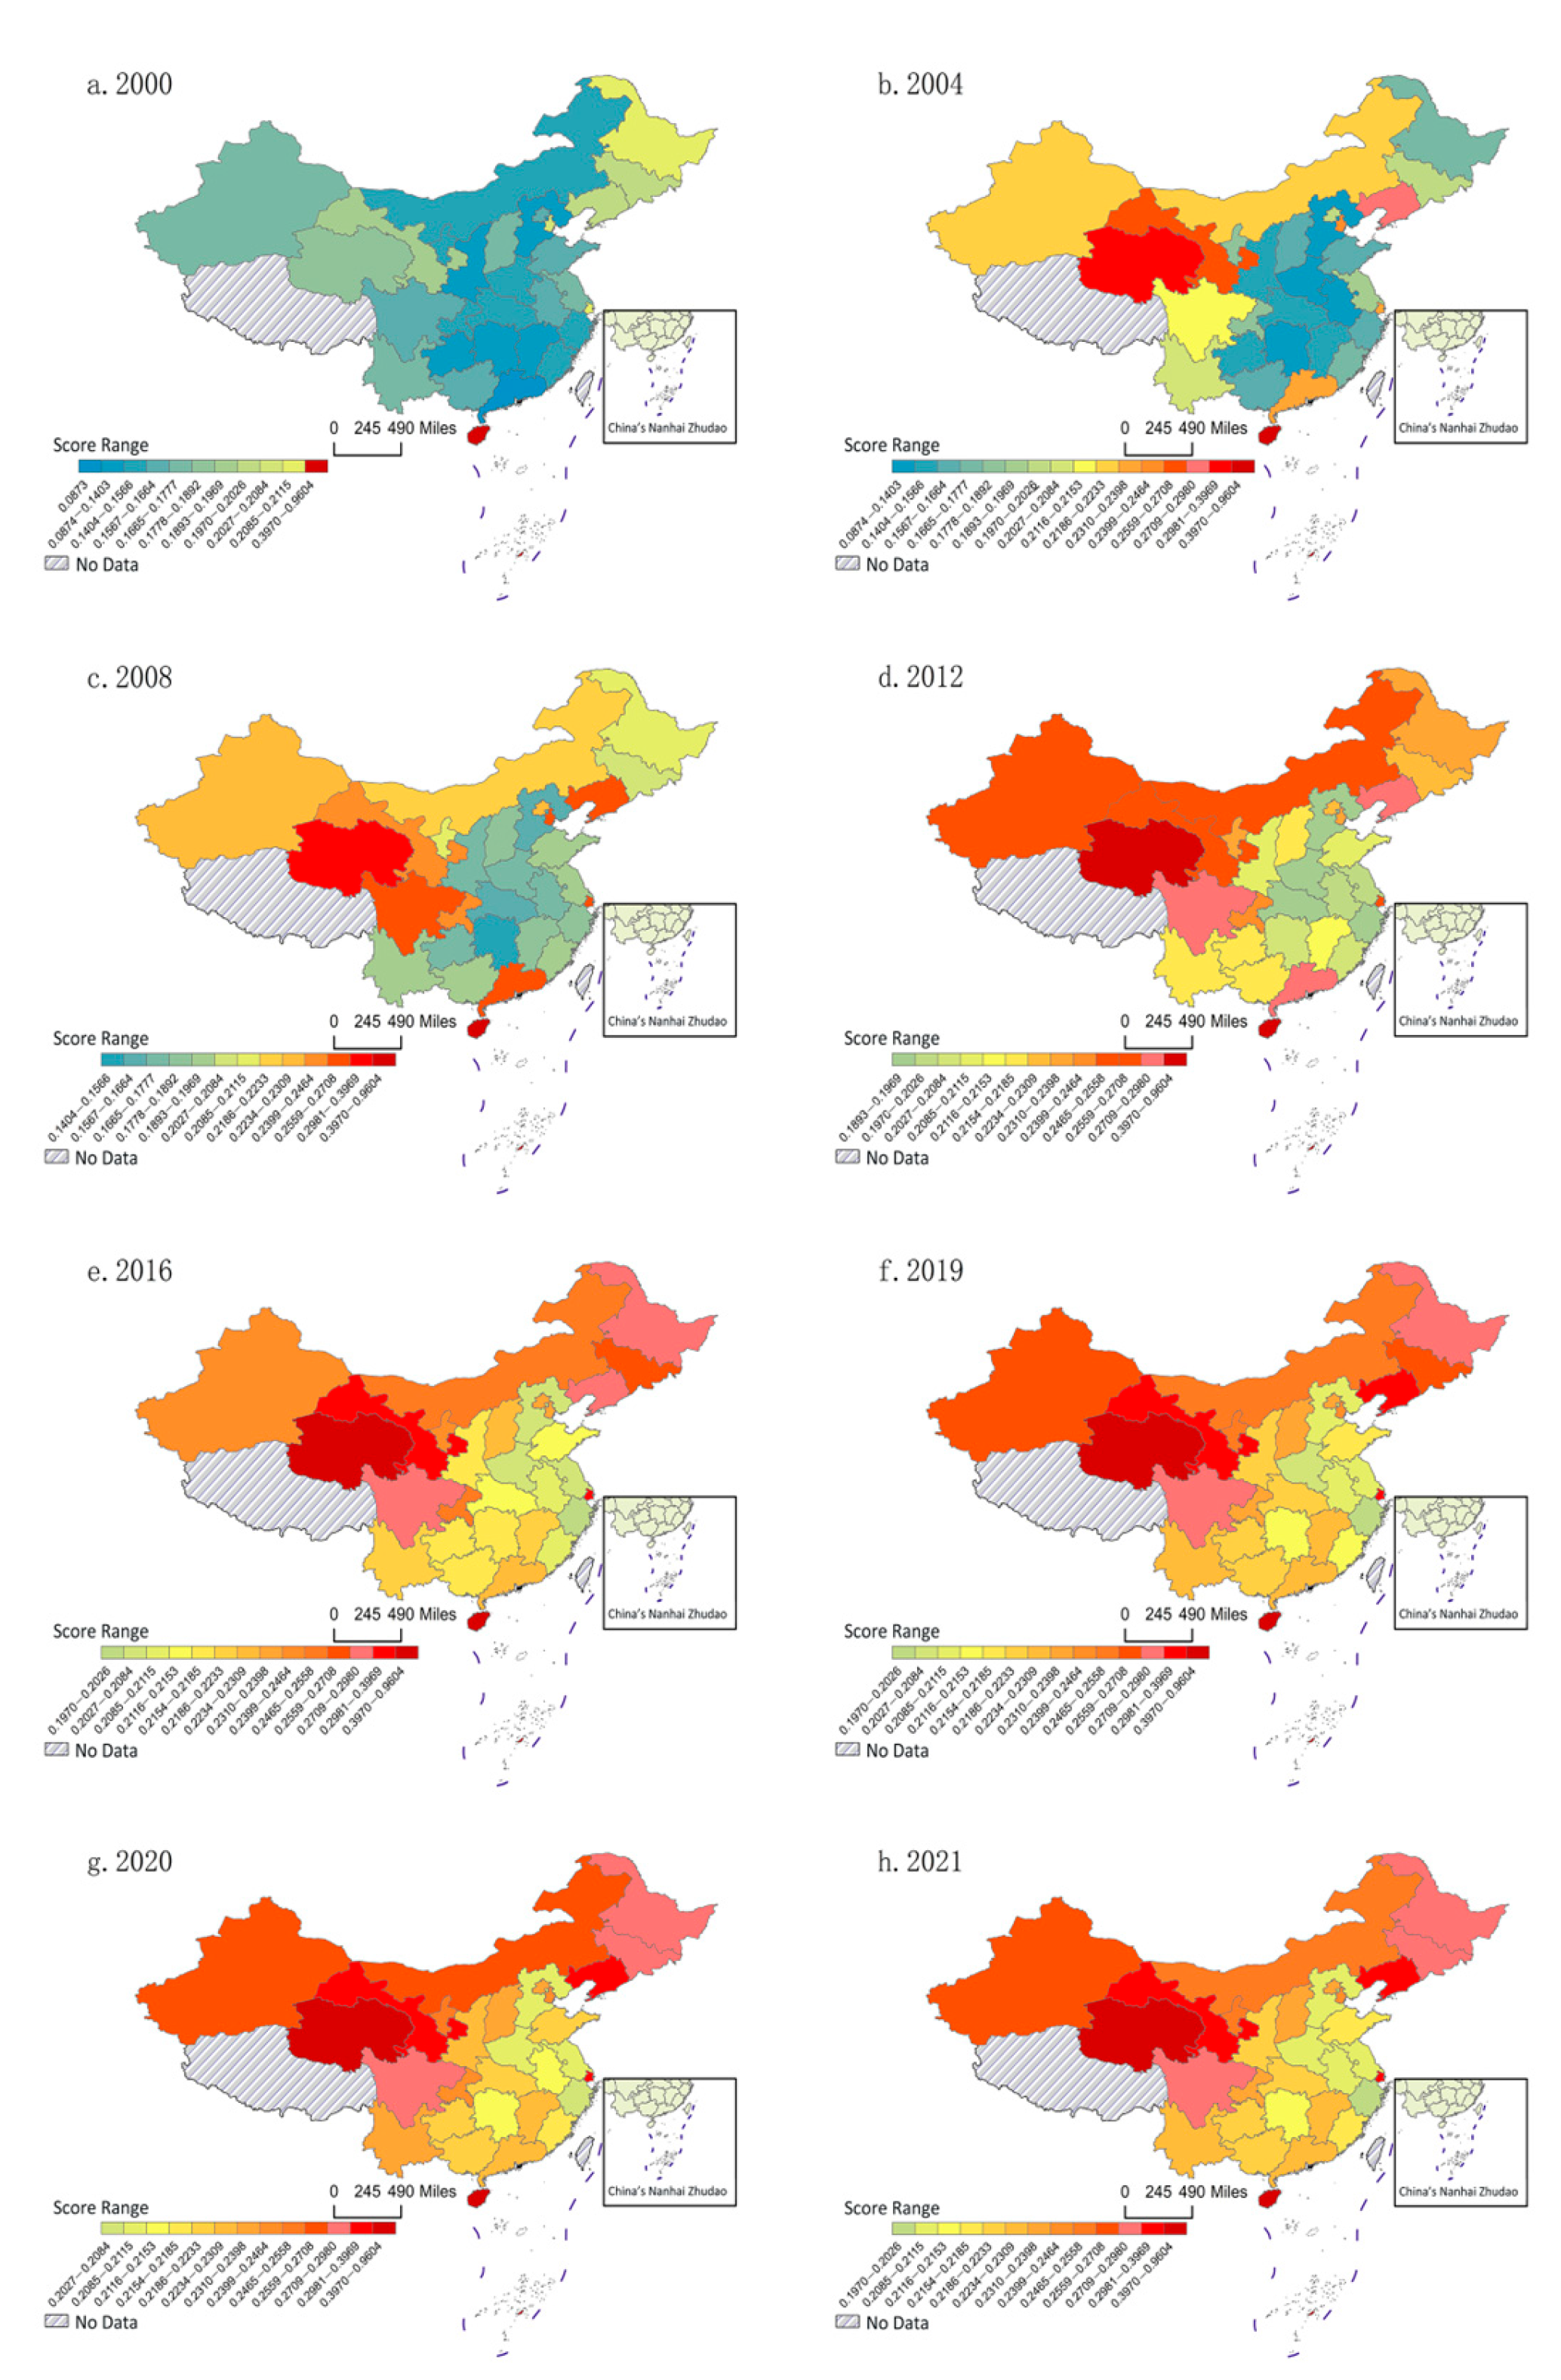
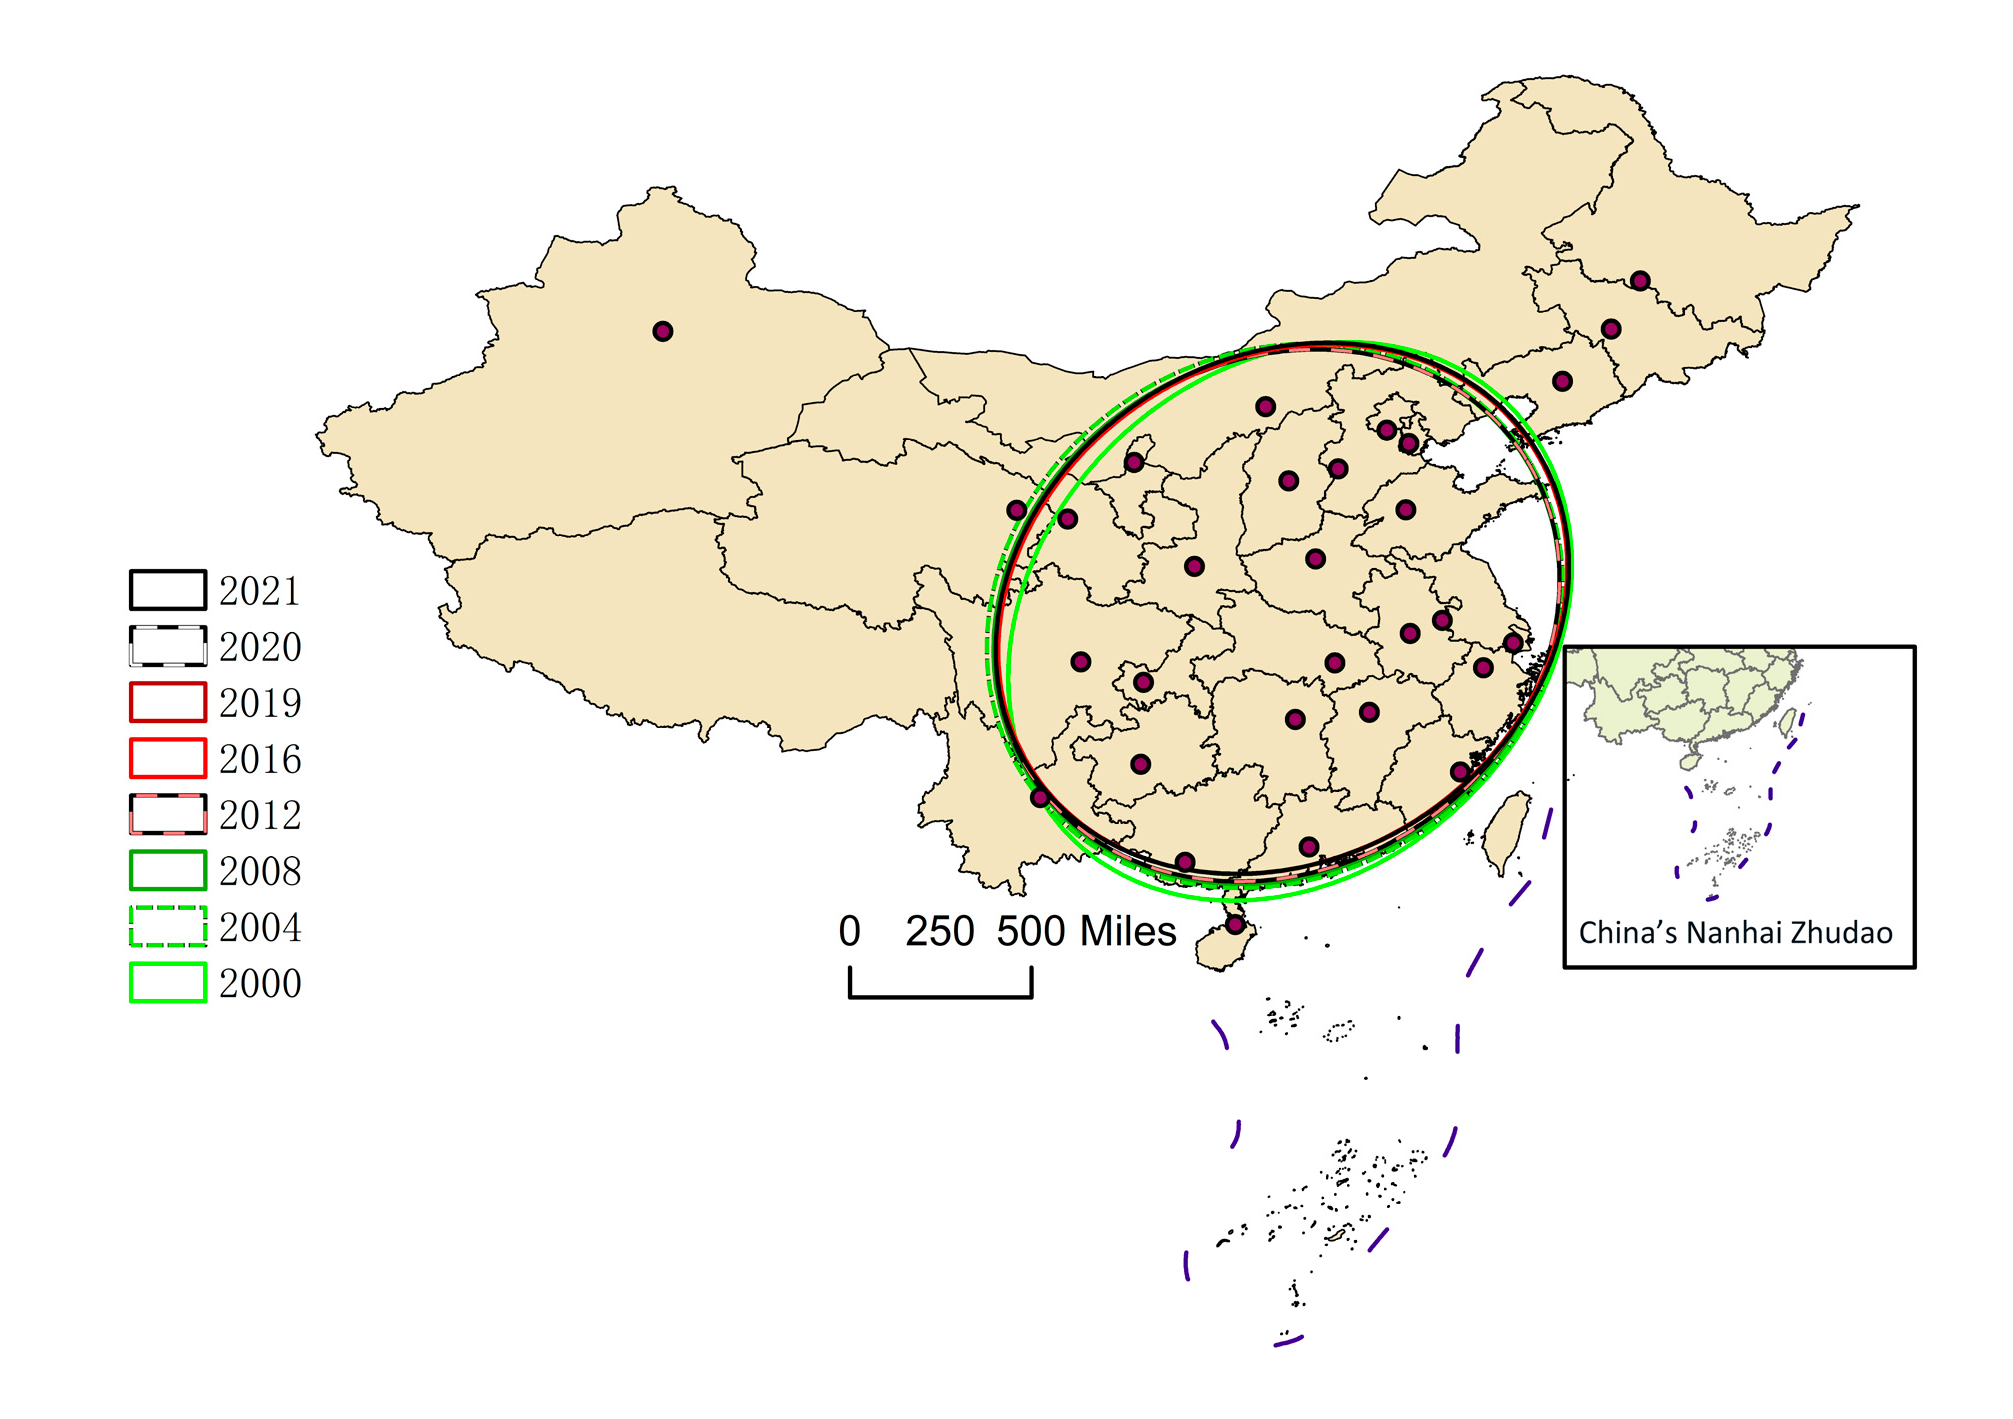
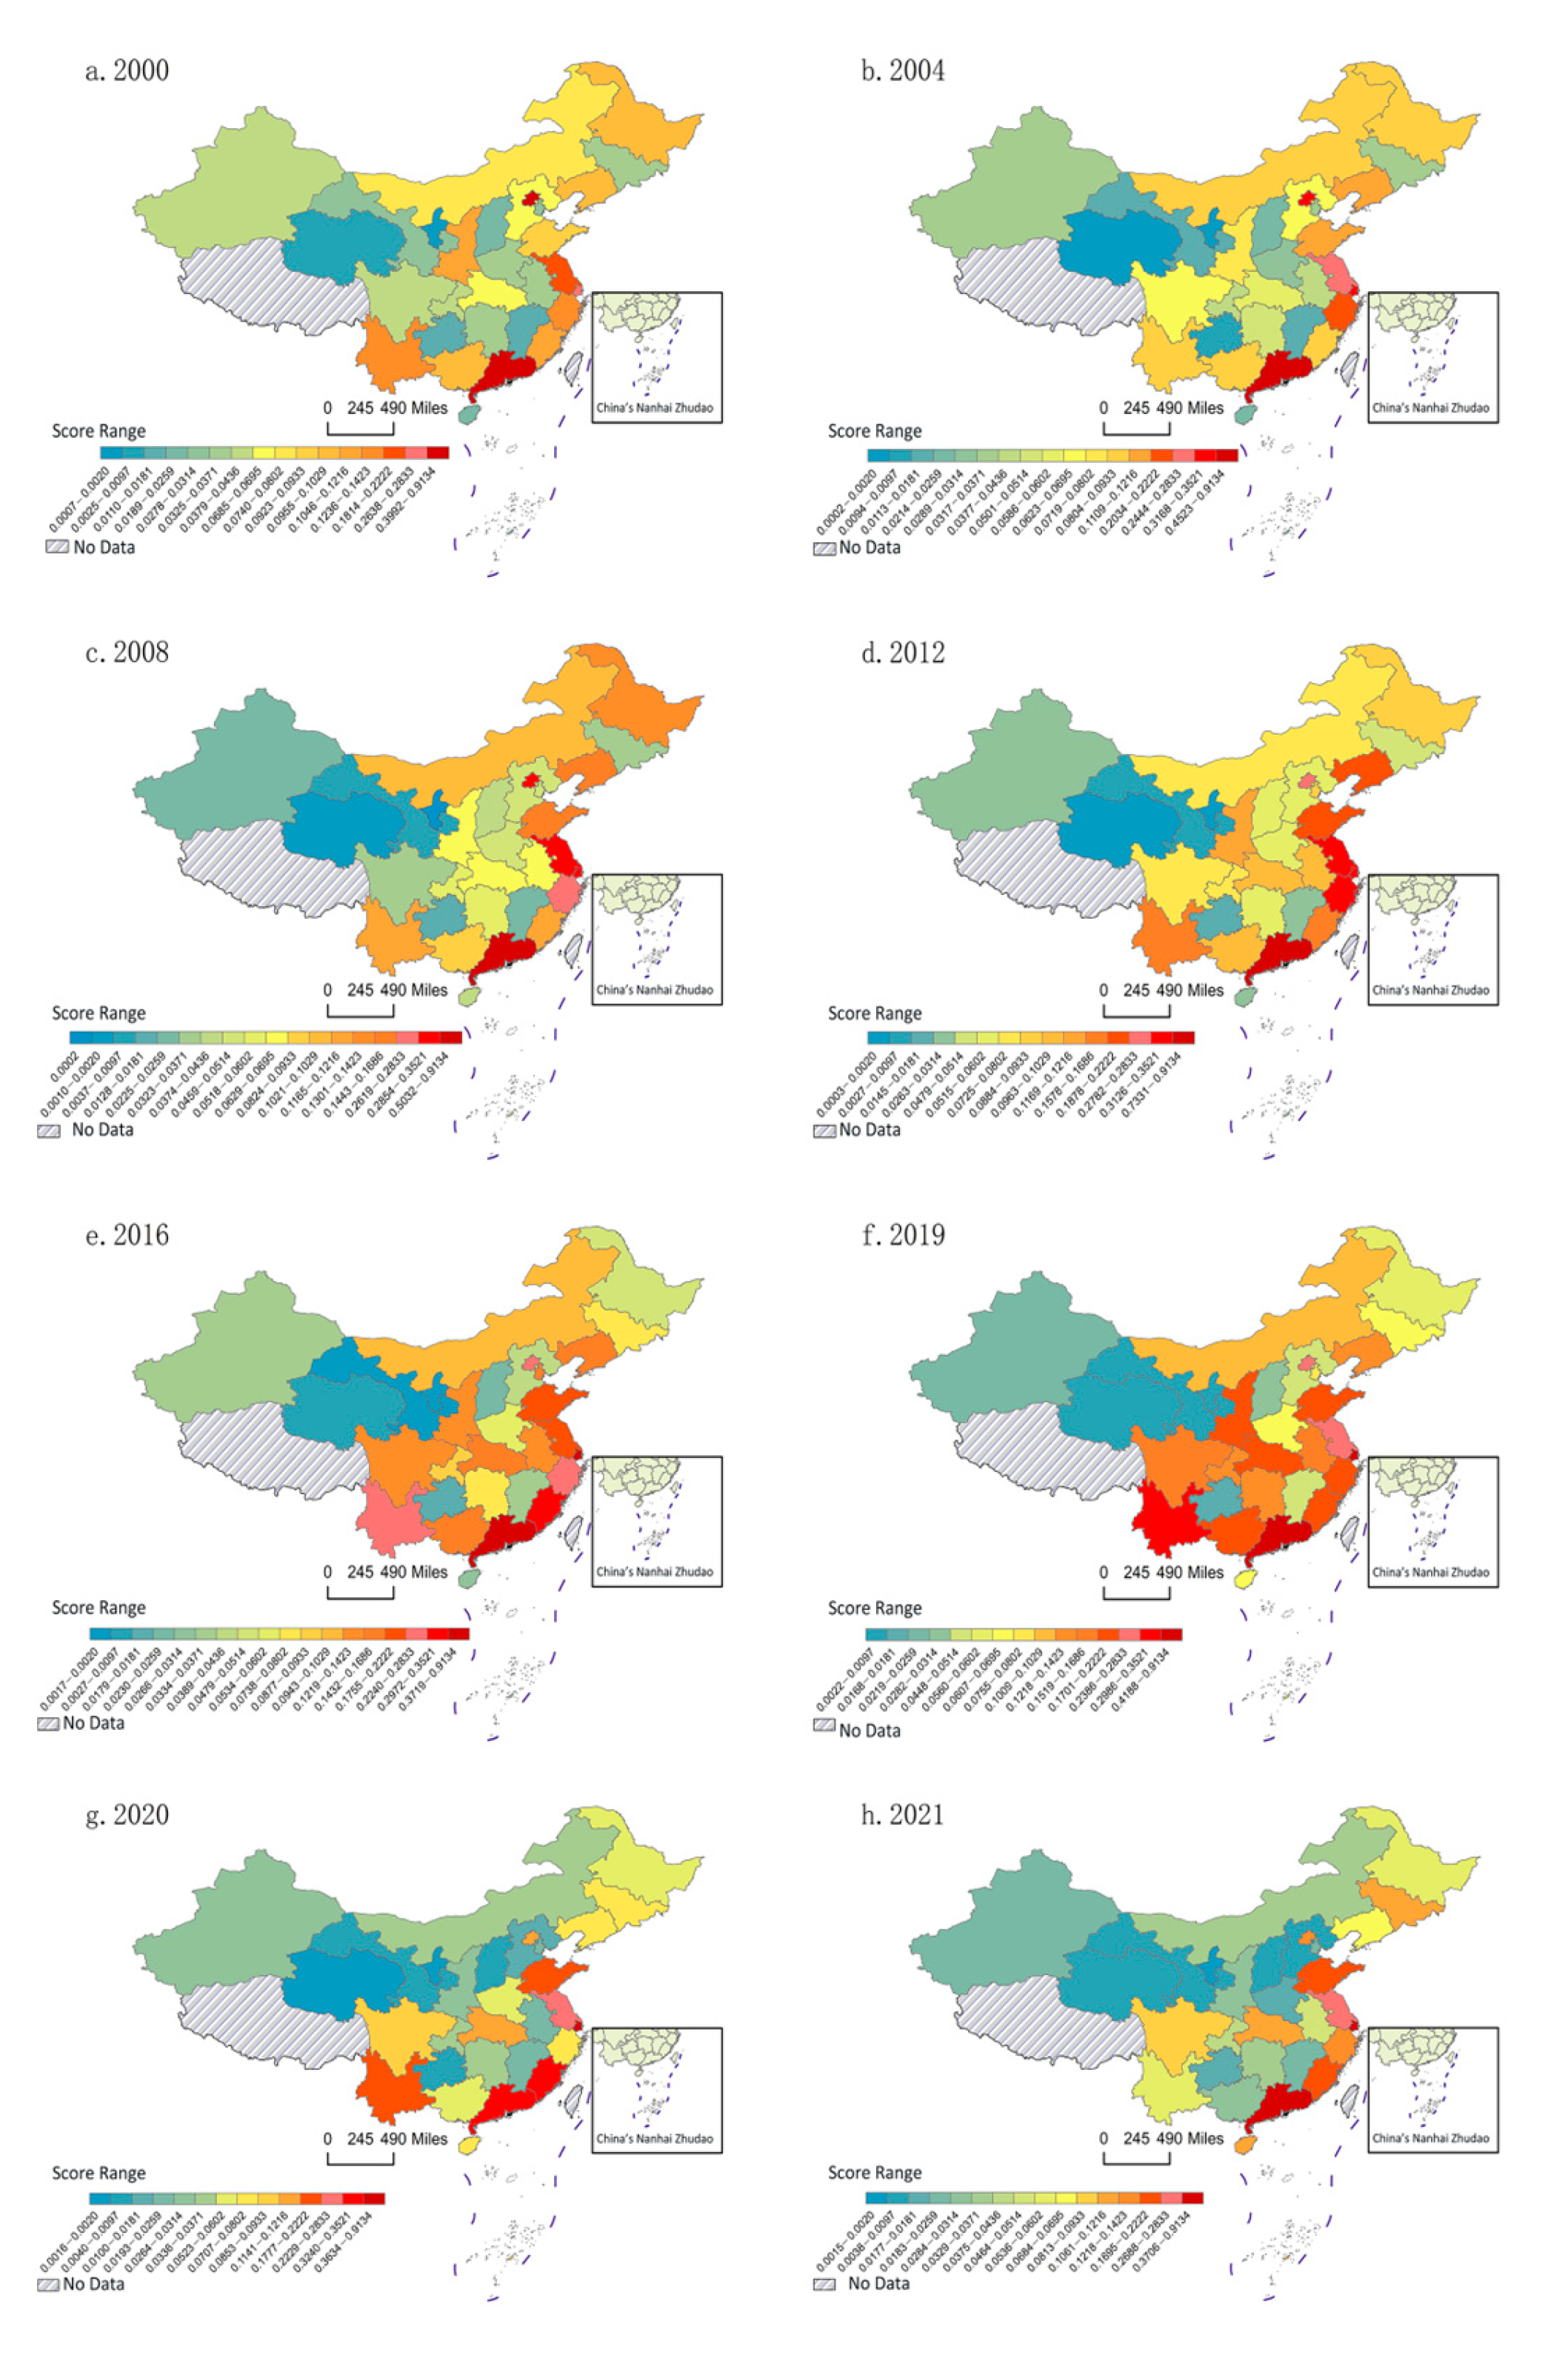
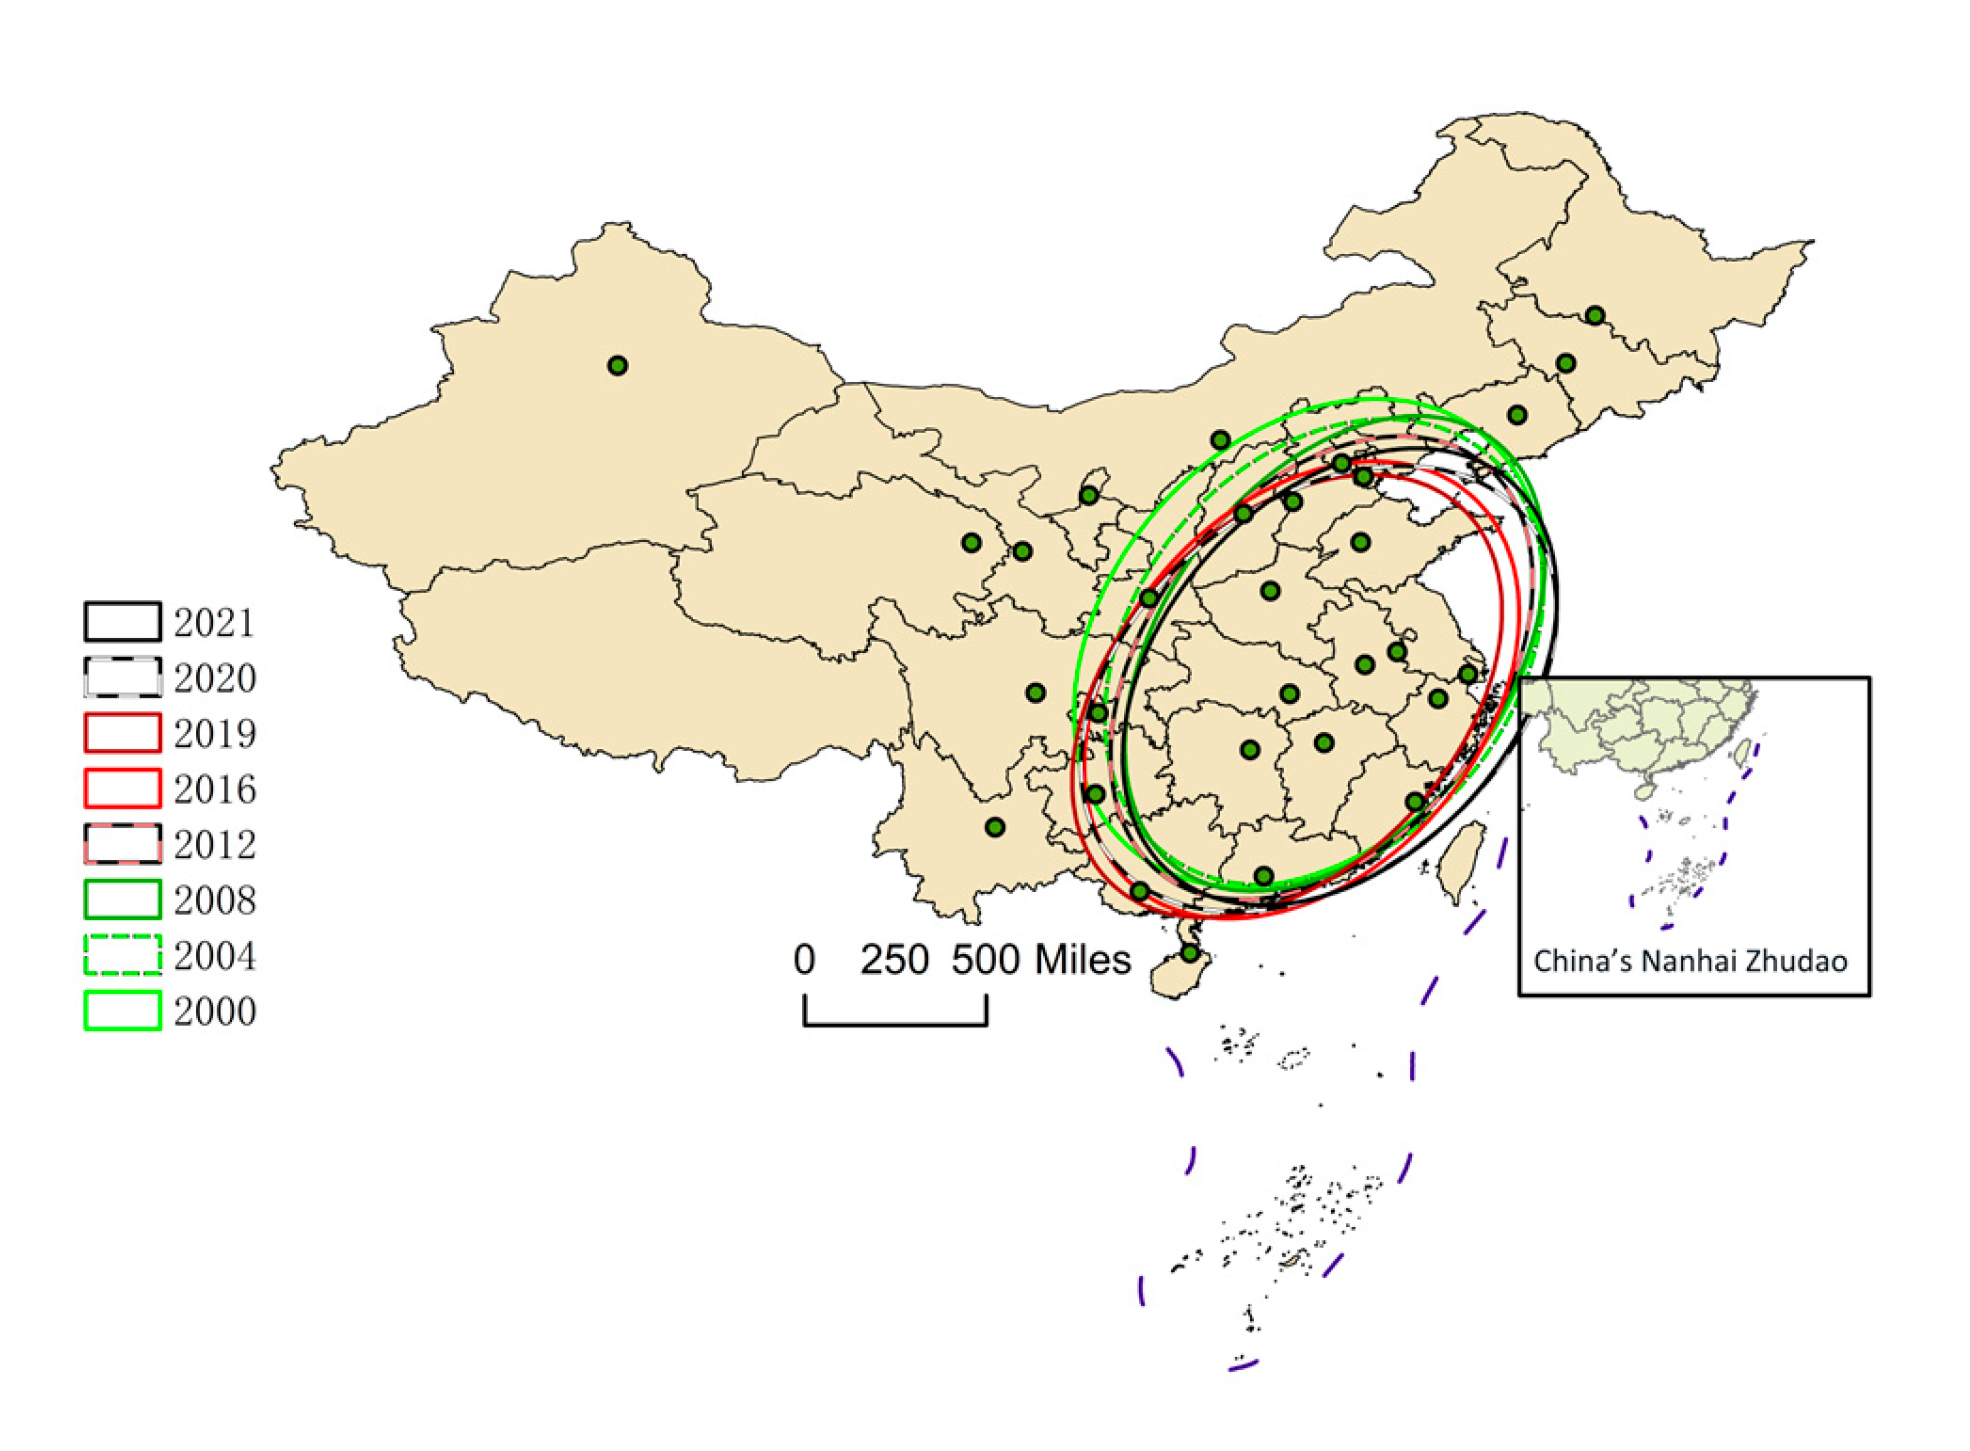

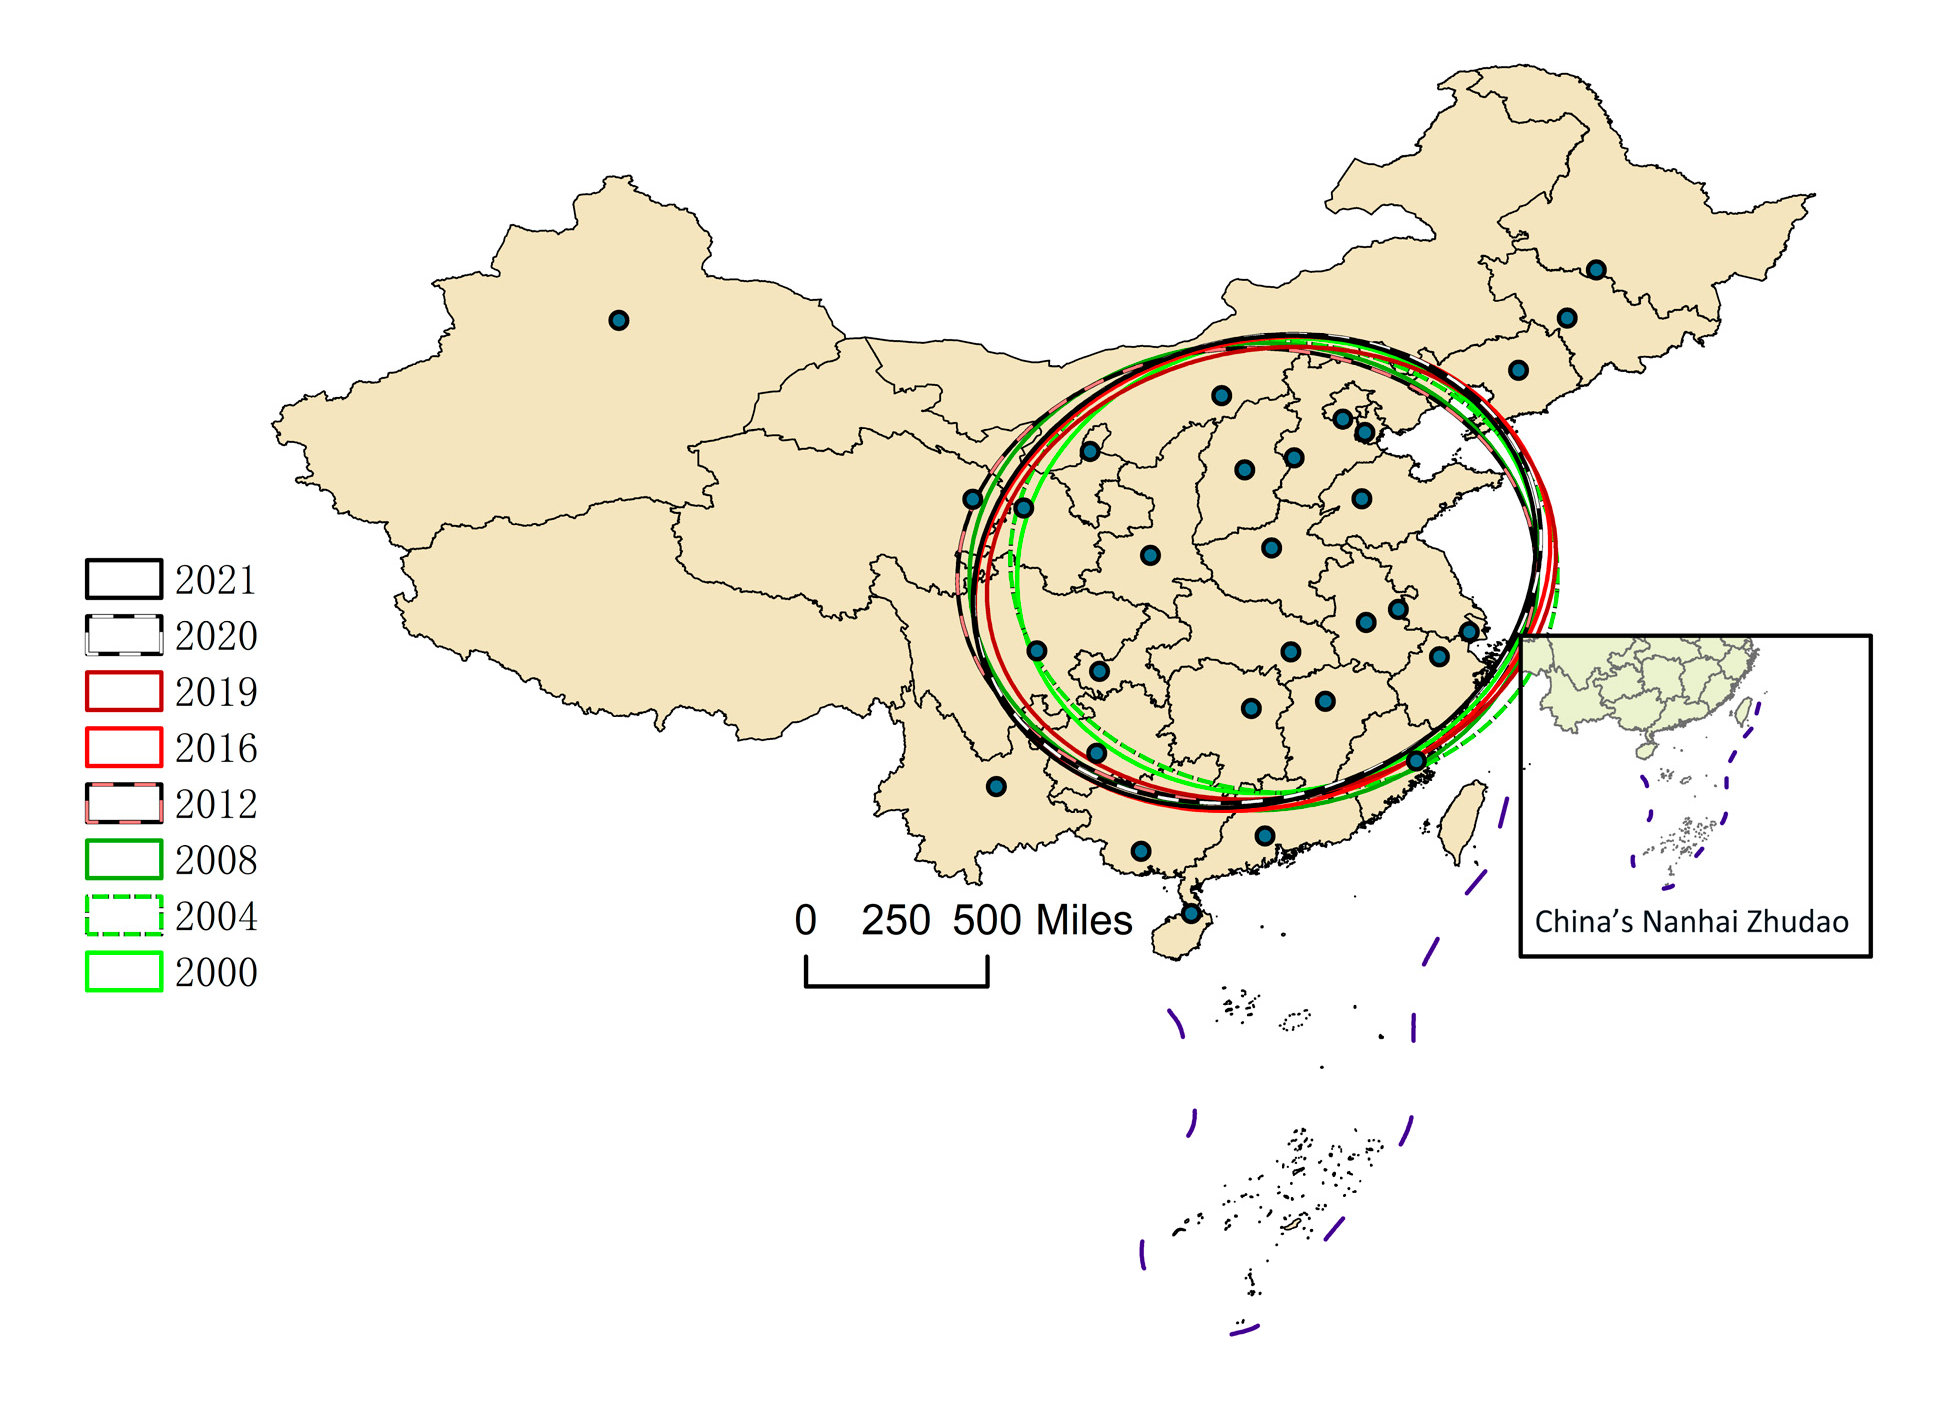


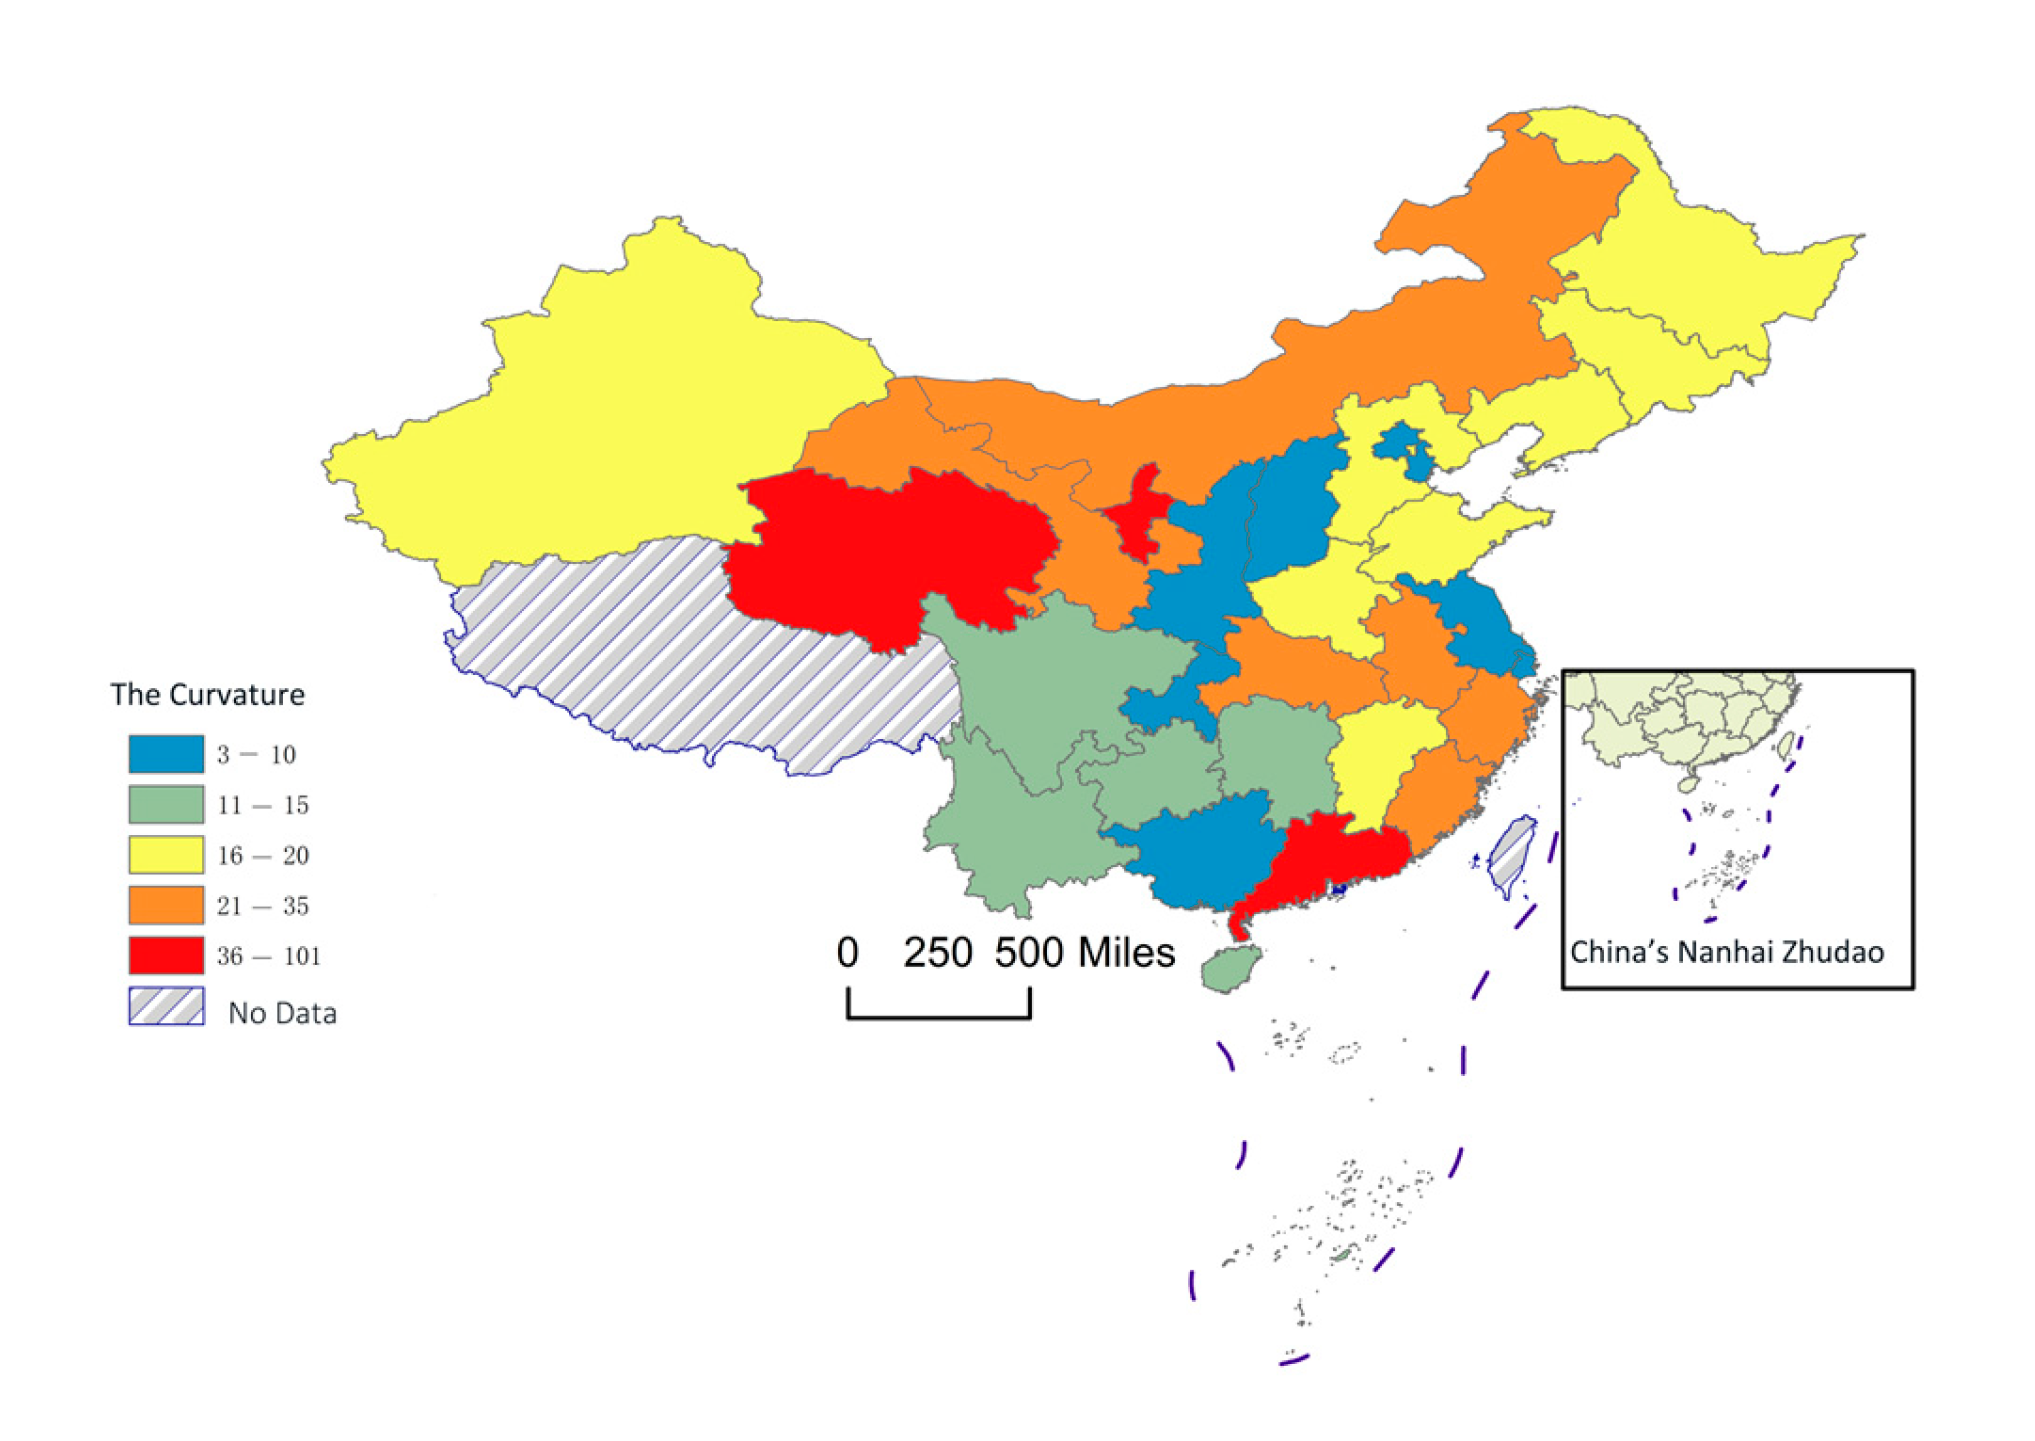
Disclaimer/Publisher’s Note: The statements, opinions and data contained in all publications are solely those of the individual author(s) and contributor(s) and not of MDPI and/or the editor(s). MDPI and/or the editor(s) disclaim responsibility for any injury to people or property resulting from any ideas, methods, instructions or products referred to in the content. |
© 2024 by the authors. Licensee MDPI, Basel, Switzerland. This article is an open access article distributed under the terms and conditions of the Creative Commons Attribution (CC BY) license (https://creativecommons.org/licenses/by/4.0/).