1. Introduction
China’s economic development has entered a new era characterized by the transition from high-speed growth to high-quality growth. The strategic goal of economic development is to build a modern economic system and continuously enhance innovation and competitiveness [
1]. High-quality development, the main feature of China’s current economic operation, is necessary for adapting to and steering the new normal. Total factor productivity (TFP) is the additional production efficiency achieved at a given level of factor input [
2]. Its essence lies in the ability and effort demonstrated by a production entity in the production process, serving as a comprehensive reflection of the role of technological innovation in economic development and a key indicator for measuring the quality of economic growth [
3,
4]. Therefore, the Chinese government has repeatedly emphasized that increasing TFP is crucial for achieving high-quality economic development.
Regional economies are key components of China’s high-quality development, serving as the starting point for reforms focused on quality, efficiency, and driving forces [
5,
6,
7]. The quality of regional economic development is fundamentally correlated with that of the national economy [
8,
9,
10].
In the stage of high-quality development, regions are more than just geographical concepts; they also serve as primary spaces for knowledge production, technological innovation, and policy application [
11]. Theories and studies on regional innovation systems, smart cities, and science parks highlight that regional high-quality development is primarily attributed to knowledge accumulation and technological innovation [
12,
13,
14]. From a policy perspective, high-quality development is a fundamental requirement for China’s current and future development philosophy, economic policies, and regulatory measures. Regions are often seen as economic policy tools, making it efficient for countries to implement a new set of enabling policies at the regional and local levels [
15]. Therefore, regions should integrate “economic growth, knowledge production, technological innovation, and policy application”, setting the direction for national high-tech zones (NHTZs) [
16,
17].
Supported and guided by national policies, NHTZs are established in high-tech and intellectually resource-intensive development zones in China. Since the establishment of the first NHTZ in Zhongguancun, Beijing, in 1988, China has made remarkable achievements in developing NHTZs over the past 30 years. According to statistics from the Torch High Technology Industry Development Center, Ministry of Science and Technology, in 2018, China’s NHTZs employed 1.772 million full-time equivalent (FTE) research and development (R&D) personnel, accounting for 40.4% of the country’s total. Internal R&D expenditures of companies reached CNY 7455.7 billion, representing 48.9% of the total. Moreover, the number of National Engineering Research Centers, State Key Laboratories, and National Engineering Laboratories accounted for 87.8%, 73.2%, and 73.3%, respectively. NHTZs are undoubtedly regions boasting abundant resources for entrepreneurship and innovation, dynamic technological innovation, an entrepreneurial atmosphere, and significant policy support in China. They embody the deep integration of technology and the economy, serving as the frontline for China’s shift from an investment-driven to a TFP-driven economic growth model [
17].
Therefore, this paper analyzes the quality of regional economic development through the lens of NHTZ TFP. This analysis can bridge the gap in existing regional research from a relatively mesoscopic perspective and meet the requirements of high-quality regional economic development in the new era. Key research questions include the level of TFP growth in NHTZs, different TFP growth models among various NHTZs, and influencing factors of different TFP growth models. The significance and innovations of this study are as follows.
First, this research enhances our understanding of modern regional economic development. It emphasizes that economic development in the new era requires attention to industrial development, knowledge creation, and scientific and technological innovation. Reliance on factor input alone leads to unsustainable, low-quality growth. High-quality regional economic development lies in efficiency improvement and technological progress (total factor productivity, TFP). The establishment of NHTZs aims to fulfill this role, reflecting modern regional development and indicating that studying TFP in NHTZs is crucial for understanding high-quality, modern regional development.
Second, the research lays a theoretical model foundation for subsequent TFP studies in NHTZs. TFP represents the additional production efficiency achieved at a given factor input level, indicative of ability and effort in economic development. The paper addresses the challenge of establishing a scientific and reasonable TFP measurement method, selecting a stochastic frontier analysis model with a translog production function based on NHTZs’ actual development. This approach promotes the establishment of standardized TFP measurement methods and processes for NHTZs.
Third, the research applies TFP analysis as a policy tool in practice. Current research on NHTZ TFP, particularly regarding growth models and influencing factors, is limited and often qualitative. This paper aims to provide a more in-depth and systematic study, identifying differences in innovation factor accumulation, development mode transformation, economic structure optimization, and momentum transition. This targeted research serves policy-making by improving policy quality and relevance.
Fourth, the study helps to understand the current unbalanced development of NHTZs and identify policy focuses for promoting coordinated development. It presents “model differences” and “influencing factors” in TFP growth, offering insights into the spatial imbalance in NHTZ development and highlighting regionally significant influencing factors. These results support decision-making departments in problem recognition and resolution.
This paper’s primary contributions include selecting NHTZs as a rare research object in TFP studies, enriching the regional composition system, and addressing research gaps. It reveals China’s economic development under its innovation-driven strategy, proposes three TFP growth modes in NHTZs, and provides a detailed analysis of each mode’s characteristics. The study also focuses on the influencing factors of TFP under different growth models, including unique factors such as the innovation and entrepreneurship platform and the proportion of overseas returnees and resident foreigners in the workforce. This targeted, in-depth approach effectively supports policy-making.
The study underscores that sustainable and high-quality regional economic development depends on efficiency improvement and technological progress. NHTZs, emerging from China’s reform and opening up, aim to integrate science, technology, and economy and have become demonstration zones for innovation-driven and high-quality development. Studying TFP in NHTZs thus holds significant theoretical and practical implications for sustainable and healthy regional economic development.
The paper is organized as follows:
Section 2 reviews relevant literature.
Section 3 outlines the methodology and research objects.
Section 4 applies a productivity measurement model to calculate TFP in China’s NHTZs and summarizes different TFP growth model characteristics.
Section 4 conducts an empirical analysis of the influencing factors of different TFP growth modes in NHTZs.
Section 5 summarizes the research and proposes policy implications.
2. Literature Review and Research Questions
Romer introduced the endogenous growth theory at the close of the 20th century, emphasizing that sustainable regional economic growth hinges on technological change [
18]. Krugman similarly asserts that sustained growth is rooted in efficiency improvement and technological change, notably total factor productivity [
19]. Thus, efficiency and TFP growth stand as key drivers for high-quality regional development. In existing literature, regional TFP denotes the additional production efficiency achieved under a given factor input level, often surpassing output growth as a crucial driving factor for many developed countries [
20]. Essentially, it mirrors a region’s ability and effort in the economic development process and offers a comprehensive reflection of efficiency improvement and technological innovation effects [
21,
22,
23,
24].
China’s NHTZs are established to foster high technology in designated areas. Serving as comprehensive hubs with abundant intellectual resources and advanced technologies, NHTZs, supported by various preferential policies and reform measures, optimize the soft and hard environments for high-tech industry development [
17]. Consequently, measuring the “input–output” efficiency of China’s NHTZs is pertinent to evaluating the policy effects on high-tech industrial development regions in China. However, existing literature in this area remains relatively scarce.
Regarding research objects, existing literature primarily focuses on TFP research at macro-levels, such as countries and provinces, and micro-levels, such as high-tech industries. Some studies explore the paths and influencing mechanisms of regional TFP growth in East Asian countries using DEA Malmquist analysis [
23,
24]. Ahmed and Krishnasamy [
25], for instance, investigated TFP growth in ASEAN-5 nations, highlighting the pivotal role of human capital investment. To enrich this research domain, the regional unit (NHTZ) at the meso-level was selected as the research sample.
In terms of measurement methods, existing literature predominantly employs non-parametric methods like data envelopment analysis (DEA) and parametric methods such as stochastic frontier analysis (SFA) for TFP measurement [
26,
27,
28]. Compared to DEA, SFA offers richer specifications, particularly in panel data scenarios [
29]. Alvarez-Ayuso et al. [
30], for instance, utilized stochastic frontier production functions to measure TFP in European industries, attributing TFP growth primarily to human capital input and technological change (TC).
Regarding factors influencing different TFP growth models, existing literature has mainly focused on TFP influencing factors and its decomposition structure; yet, it has not fully illuminated the reasons behind different TFP growth models [
31,
32]. Additionally, existing studies have examined factors such as economic development, scientific and technological innovation, industrial structure, capital accumulation, foreign cooperation, and energy structure [
33,
34]. Recognizing the uniqueness of NHTZs, this paper innovatively incorporates more targeted factors, such as innovation platforms and overseas talent introduction.
To sum up, this paper mainly focuses on the growth models and influencing mechanisms of total factor productivity in NHTZs. The key issues are as follows: (1) As a national innovation-driven development demonstration zone and high-quality development pilot zone, what is the total factor productivity growth level of NHTZs? What are the characteristics of space–time evolution? (2) China is a large economy, and the imbalance and contradiction of economic development in NHTZs are prominent. There are obvious regional disparities, and in recent years, this imbalance has been aggravated. Are there different models of total factor productivity growth? What are the characteristics of each growth model? (3) What are the factors that cause the different growth models of total factor productivity in NHTZs? What are the differences in the mechanisms and the paths behind them? The existing research has not carried out in-depth analysis around the above issues, and the aim of this study was to carry out more in-depth and more systematic research on TFP in NHTZs to make up for the shortcomings of current similar research in depth and practical application. Only more targeted research can effectively serve the decision-making process and help to improve the quality and level of relevant policy-making.
3. Methods and Data
3.1. TFP Measurement Method
The translog SFA set in this paper is shown in Formula (1) below:
where
Yit is the production output of region
i in year
t,
L is the labor input of region
i in year
t,
K is the capital input of region
i in year
t,
t is the time frame of TC, all
α and
β are the parameters to be estimated, and the last two terms are the random error term
vit and technical inefficiency term
uit.
vit reflects the influence of unobservable and uncontrollable random factors on the production function and follows a normal distribution with an expected value of 0 and a variance of σ
v2.
uit reflects the deviation of actual output Y
it from frontier output f (.). Subject to a truncated normal distribution with an expected value of 0 and a variance of σ
u2,
exp(−
uit) is the technical efficiency. Battes and Collie [
35] proposed a time-varying technical inefficiency term,
uit, which follows a non-negative truncated normal distribution because
uit is ≥0, and its specific expression is shown in Equation (2):
In Equation (2), η is the change rate of technical efficiency. When η > 0, the technical inefficiency item uit decreases with the increase in time, that is, the technical efficiency increases. When η < 0, the technical inefficiency item uit increases with the increase in time, that is, the technical efficiency decreases. When η = 0, the model degenerates to a truncated normal distribution, where the technical inefficiency term no longer changes with time.
This study also determined the applicability of the translog stochastic frontier production function model, that is, the specific form of the production function. Two methods were adopted: the variance parameter test and the hypothesis test (as this subsection mainly introduces the calculation methods of TFP, the description and analysis of these two tests are elaborated in the following subsection). Next, TFP was calculated according to the regression parameters. The specific algorithm of this paper follows the decomposition formula shown below (3):
where
TFPit represents the TFP growth rate of region
i in year
t,
TCit represents the technological change rate of region
i in year
t, TECit represents the technical efficiency change rate of region
i in year
t, and
SECit represents the scale efficiency change rate of region
i in year
t. Equation (3) shows that TFP can be further decomposed into TC, TEC, and SEC. In the decomposition process, TC is represented by the change in output over time, TEC is represented by the ratio of the expectation of the actual output to the expectation of the stochastic frontier output, and SEC is represented by the extra output brought by factor inputs per unit. The formulas to attain these components are expressed below as Equation (4):
where
E is the sum of the scale elasticity of capital and labor input factors,
Ej is the scale elasticity of
j input factors, and
Xj is the growth rate of the input factor
j.
3.2. TFP Model Applicability Testing Method
To avoid errors caused by mis-set production functions, the applicability of the translog stochastic frontier production function model was determined by the following two aspects.
The variance parameter method set by Battese and Coelli [
35] was used for the testing, and the formula is as follows:
where
σu represents the technical inefficiency,
σV is the random error, and
γ is the proportion of the technical inefficiency to the compound disturbance. Specifically, if the null hypothesis of
γ = 0 is accepted, it indicates that all deviations between the actual output and the frontier output are from random error. Then, OLS regression should be applied; otherwise, SFA should be adopted for estimation.
Four hypothesis tests were set up to determine whether the translog stochastic frontier function model of non-neutral technological change is reasonable. First, H
0:
αT =
βKK =
βKL =
βKT =
βLL =
βLT =
βTT = 0, i.e., it is appropriate to use Cobb–Douglas (C–D) production functions without technological change (t) (model 1.1). Second, H
0:
βKK =
βKL =
βKT =
βLL =
βLT =
βTT = 0, i.e., it is appropriate to use C–D production functions with technological change (t) (Model 1.2). Third, H
0:
αT =
βKT =
βLT =
βTT = 0, i.e., it is appropriate to use a production function without technological change (t) (model 1.3). Fourth, H
0:
, i.e., it is appropriate to use the production function with technical inefficiency (Model 1.4). Each hypothesis was tested by the generalized likelihood ratio test (GLRT) statistic λ. The formula is as follows:
where
L(
H0) and
L(
H1) are the likelihood function values of the frontier models of null and alternative hypotheses, respectively. If the null hypothesis is true, the test statistic λ follows a mixed chi-square distribution, and the number of degrees of freedom equals the number of bounded variables. The translog stochastic frontier function was set as the benchmark model (alternative hypothesis H
1, as shown in Equation (1)).
3.3. Tobit Regression Model
In order to analyze the influencing factors that affect different growth models of TFP in the NHTZs, this study constructed an econometric model that included multiple influencing factors. In view of the particularity of the NHTZs, the influencing factors added included the following: (1) Capital accumulation: measured by the ratio of the total assets at the end of the year to the number of employees (K/L). (2) R&D investment: measured by R&D expenditure and internal expenditure as a percentage of business income (RDE). (3) Patent outcome: measured by the number of newly-added invention patents filed by 10,000 people in that year (PAT). (4) Innovation and entrepreneurship platforms: measured by the sum of the national innovation platform and the national entrepreneurship platform (IEP), taking into account the availability of data. The national innovation platform mainly includes national key laboratories, national enterprise technology centers, national post-doctoral workstations, national engineering research centers, national engineering technology research centers, and national high-tech industry incubators. (5) Industrial structure: measured by the ratio of income from service sectors to total revenue (IND). (6) Overseas talent acquisition: measured by the proportion of overseas students returning from overseas and foreign permanent residents (ITA). (7) Overseas market participation: measured by the ratio of total exports of the park to business income (ITE).
It is worth emphasizing that in order to further fully reflect the long-term situation of different growth models of TFP in NHTZs and eliminate the influence of negative numbers on the estimation results, this study used 2011 as the base period (valued 1) to deal with the cumulative TFP growth rate, obtaining the 2012–2018 NHTZ cumulative total factor productivity index (ATFP) for the explained variables. Because the explained variables are censored data, the results of the traditional ordinary least squares regression will be biased, so this study employed the Tobit model as follows:
3.4. Data
Building upon international and domestic studies on regional total factor productivity (TFP), this study shifted its research focus from national/provincial/municipal economies to NHTZs. Considering the accuracy and availability of data from NHTZs and recognizing that NHTZs have transitioned into the third stage of development, characterized by innovation-oriented development, this study selected 88 NHTZs spanning the years 2011 to 2018 as the research objects.
Utilizing the translog stochastic frontier production function model, the calculation of NHTZs’ TFP involved both input and output indices. Drawing insights from domestic and international studies on TFP calculation [
35,
36,
37], most studies employ economic size or aggregates (e.g., operating income, GDP, etc.) to measure economic output, while capital and labor inputs serve as measures for economic input. Additionally, to ensure the accuracy and validity of data obtained from NHTZs, this study measured economic output by analyzing the operating income of the 88 NHTZs from 2011 to 2018. Total fixed assets at the end of the year (obtained from Torch statistics to ensure consistency in statistical standards and conversion methods for calculating capital stock) were used as capital input, while the number of employees at the end of the year was used as labor input. The aforementioned data sources included the National Bureau of Statistics, the Torch Program of the Torch High Technology Industry Development Center of the Ministry of Science and Technology (MoST), and the China Statistical Yearbook on Science and Technology. (The data for this study were all obtained from publicly available official sources, accessible from the National Bureau of Statistics database. Available:
https://www.stats.gov.cn/sj/, accessed on 5 September 2019).
Table 1 shows the changes in input and output of 88 NHTZs from 2011 to 2018. As can be seen from
Table 1, from 2011 to 2018, the operating income of 88 NHTZs showed a trend of continuous growth, increasing from CNY 13,684.38 billion in 2011 to CNY 30,124.06 billion in 2018. From the perspective of the growth rate of operating income, the growth rate of operating income from 2011 to 2018 showed a trend of obvious decline and then a slow rise, with an average annual growth rate of 12.03%. Specifically, taking 2015 as the cut-off point, it showed a downward trend before 2015 and a slow upward trend after 2015, but the growth rate before 2015 was significantly higher than that after 2015. The steady growth of operating income from 2015 to 2018 also indirectly reflects the transformation of NHTZs from the stage of high-speed economic growth to the stage of high-quality development.
From 2011 to 2018, total fixed assets at the end of the year of 88 NHTZs showed a trend of continuous increase, increasing from CNY 3110.44 billion in 2011 to CNY 7918.23 billion in 2018. From the perspective of the growth rate of total fixed assets at the end of the year, the growth rate of total fixed assets from 2011 to 2017 showed a continuous decline, reaching the minimum value of 2.93% in 2017 and bottoming out in 2018. In short, in addition to 2017, the growth rate of total fixed assets in other years (2012, 2013, 2014, 2015, 2016, and 2018) was maintained at more than 10%. At the same time, the average growth rate from 2011 to 2018 was also maintained at more than 14%.
From 2011 to 2018, the number of employees at the end of the year in 88 NHTZs showed a continuous growth trend, increasing from 1100.6719 in 2011 to 1750.0963 in 2018. From the perspective of the growth rate of employees at the end of the year, taking 2014 as the cut-off point, the growth rate of employees from 2011 to 2014 showed a significant downward trend and basically fluctuated around the level of 5% from 2015 to 2018, with the growth rate in 2018 being lower than 5%. In short, although the number of employees at the end of the year in 88 NHTZs showed a sustained growth trend from 2011 to 2018, its growth rate slowed down significantly, with the average annual growth rate below 7%. This is a large gap between the growth level and the growth level of total fixed assets at the end of the year (14.6%), which indirectly reflects that, compared with labor factor input, NHTZs pay more attention to the driving role of capital input in economic growth.
4. Empirical Analysis
4.1. Empirical Test of the Model
To further validate the applicability of the translog stochastic frontier function model, this study employed two test methods to mitigate measurement errors resulting from incorrectly set production functions and enhance the accuracy of measurement results.
Table 2 presents the regression results of stochastic frontier analysis (SFA). Model 1 serves as the benchmark model defined in this paper, representing the translog stochastic frontier function model. Model 1.1 adopts the traditional C–D production function without TC, while Model 1.2 incorporates TC in the C–D production function. Model 1.3 features the production function without TC, and Model 1.4 incorporates technical inefficiency. According to the variance parameter test method, in each stochastic frontier model, the value of γ exceeds 0.75. This signifies that over 75% of the total error arises from technical inefficiency. Thus, compared with traditional ordinary least squares (OLS) regression, SFA offers a more effective explanation of technical efficiency (TE) and its variations in the production activities of NHTZs. Based on the generalized likelihood ratio test (GLRT) statistic λ, the relevant hypothesis test results are presented in
Table 3. The results indicate that the null hypotheses of Models 1.1, 1.2, 1.3, and 1.4 are all rejected, suggesting the reasonability of the benchmark Model 1. Furthermore, the significantly positive value of η indicates a noticeable time trend in TE. In summary, employing the translog stochastic frontier production function model to calculate the TFP values of NHTZs is deemed appropriate.
After selecting the appropriate form of production function, the decomposition formula of TFP was used to calculate the growth rate of TFP in NHTZs according to the regression coefficients of the model. The following sections of this chapter focus on the changes in TFP growth in NHTZs based on overall analysis, regional analysis, and NHTZ-specific analysis.
4.2. Results Analysis
4.2.1. Overall Analysis of NHTZs
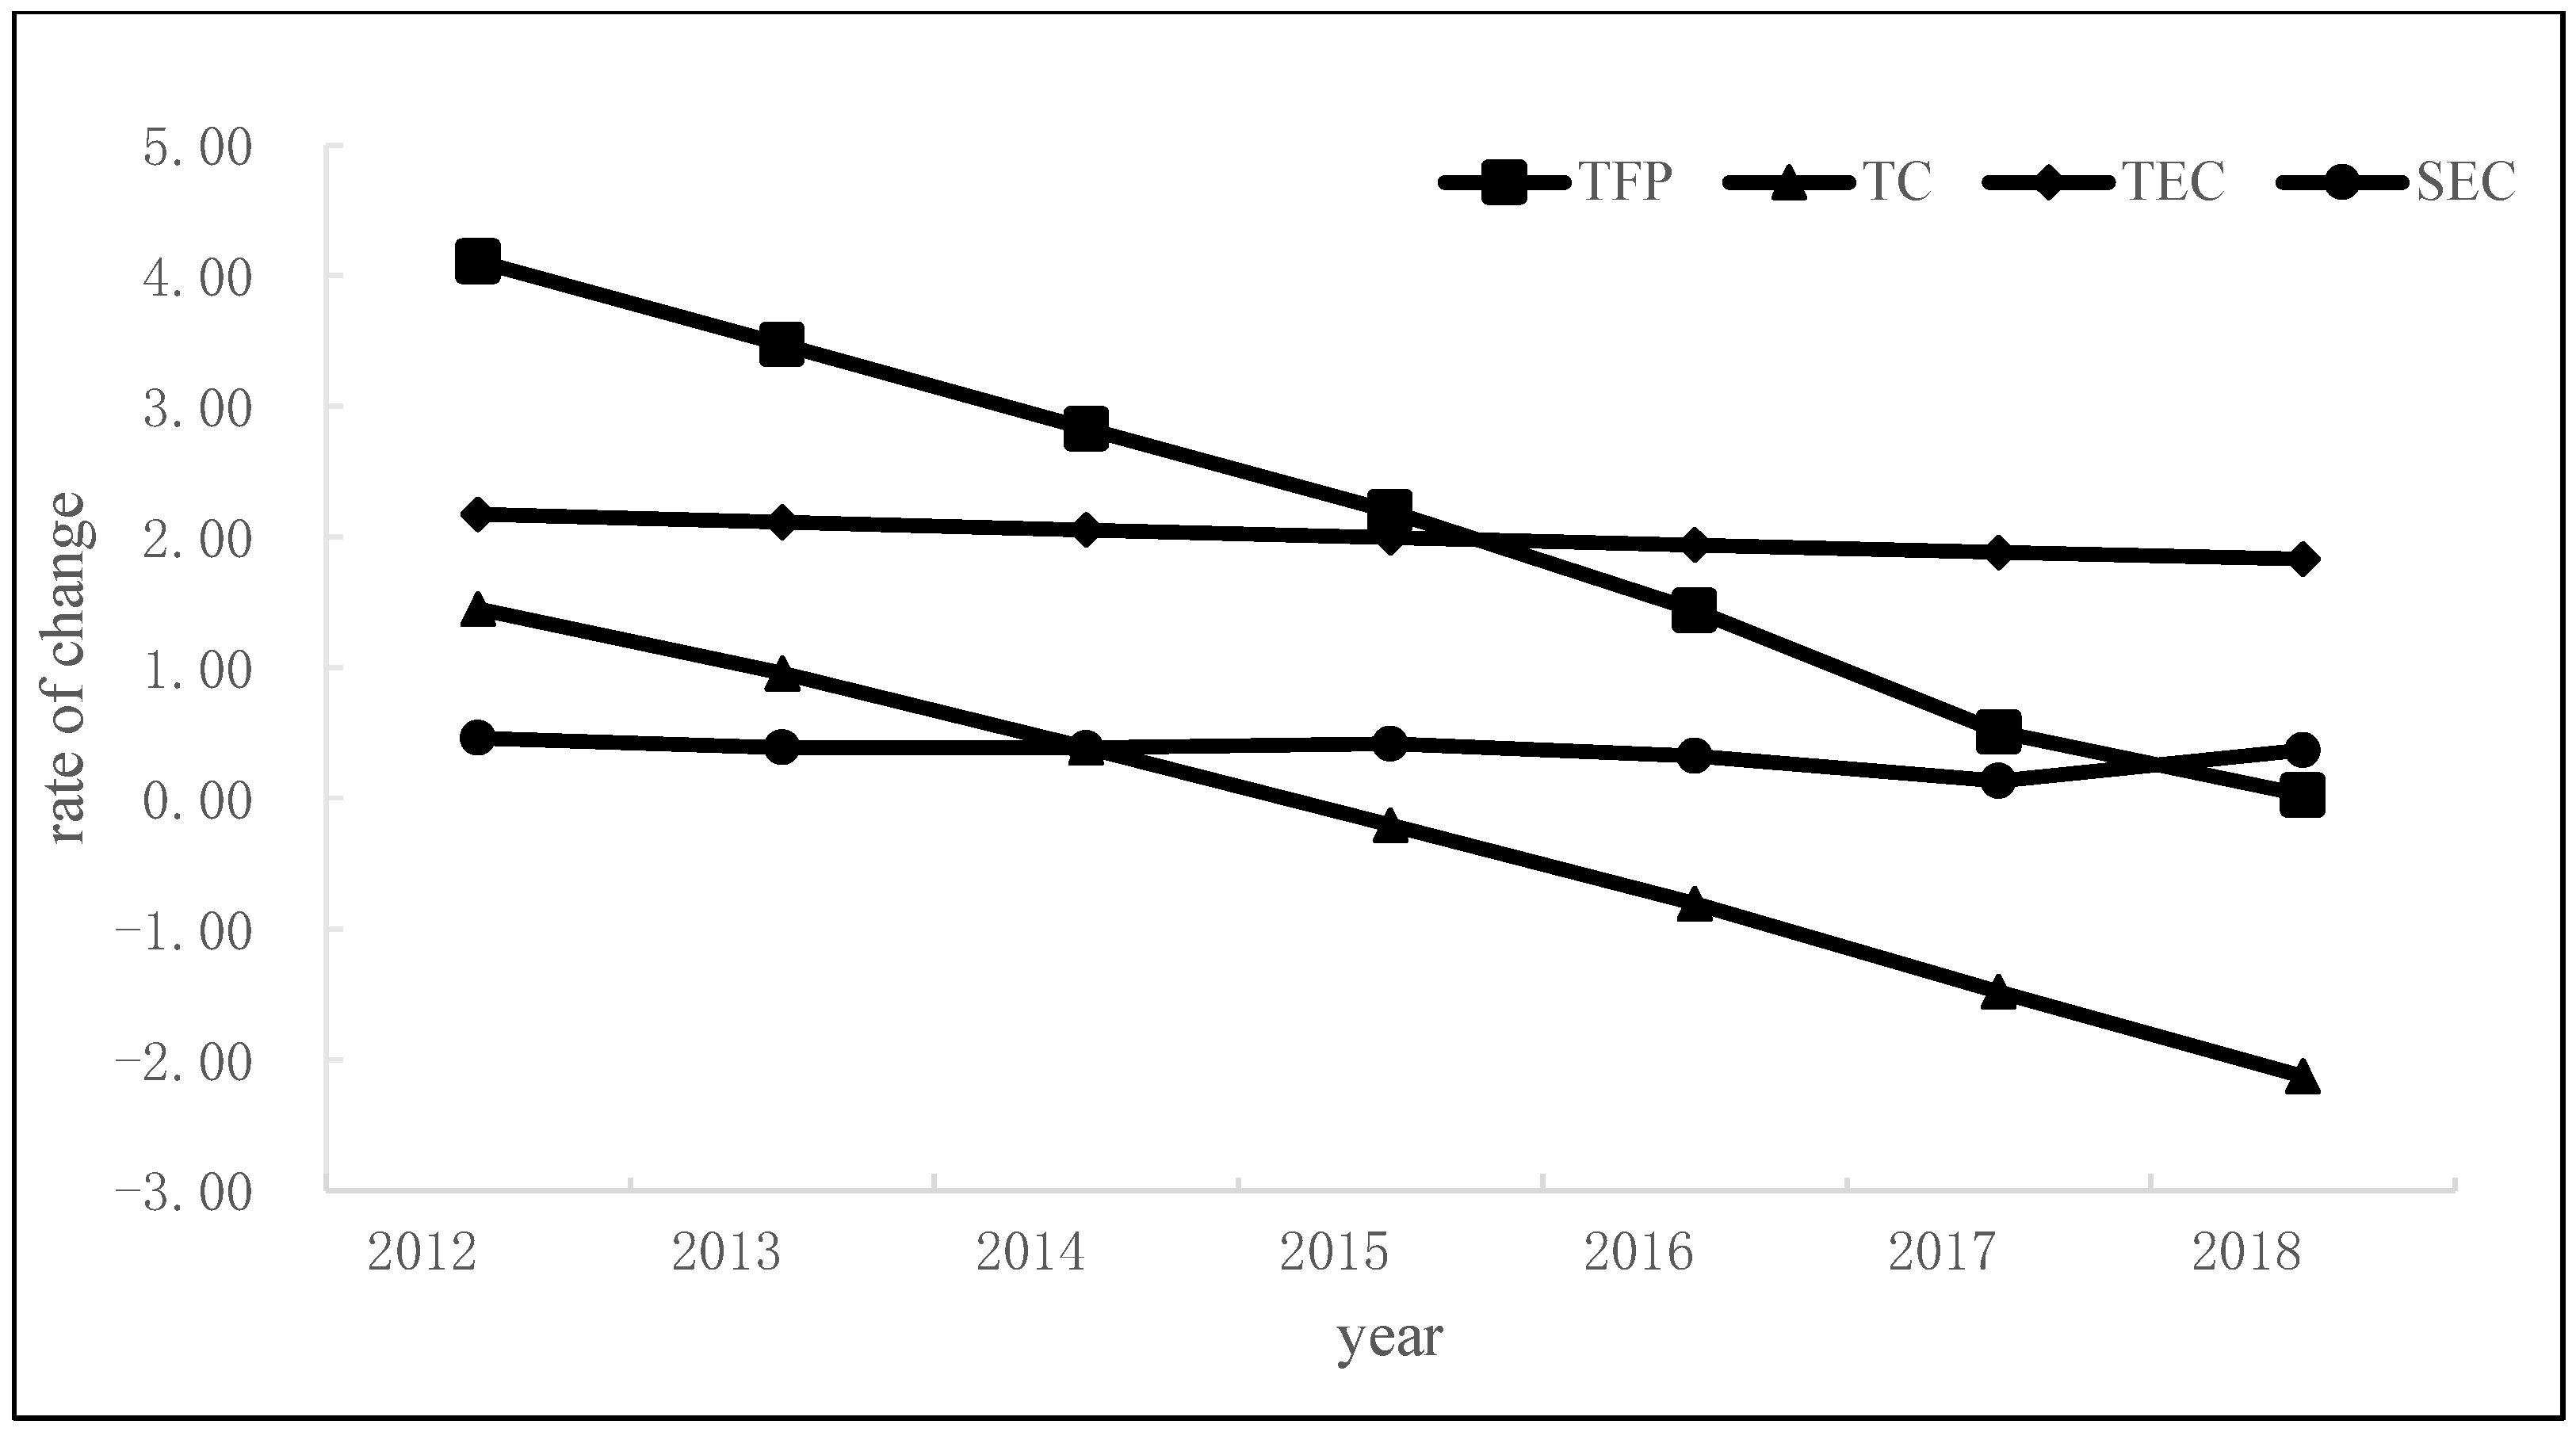
Table 4 and
Figure 1 present the TFP growth rate of 88 NHTZs between 2012 and 2018. The overall TFP growth rate of NHTZs experienced a continuous decline from 4.1109% in 2012 to 0.0254% in 2018, with an average annual decline rate of 0.5836%. Despite the declining growth rate, the absolute value of TFP continued to rise. This reflects the significance of NHTZs, renowned for their intensive intellectual resources, conducive environment for innovation and entrepreneurship, and dynamic innovative economy in China, in improving regional TFP. Moreover, existing research indicates that while China’s provincial TFP growth rate has remained around 1% since 2011 [
38,
39], NHTZs’ TFP growth has consistently exceeded 2%. This underscores the pivotal role of NHTZs as a potent engine for steering China’s economy towards a TFP-driven growth model, away from investment-driven growth.
4.2.2. Analysis of Technical Change (TC) Variance
Consistent with TFP growth trends, TC exhibited a continuous decline from 1.4482% in 2012 to −2.1273% in 2018, with 2015 marking an inflection point where it transitioned from positive to negative growth. This indicates that the cutting-edge technologies in the NHTZs declined or deteriorated, and this core conclusion is somewhat similar to the research results of Kuang and Peng [
40]. According to the frontier analysis method, the progress of frontier technology is determined by the outward or inward shift of the best practice surface constructed by the input–output data of the best practitioners in NHTZs. Only when the output–input ratio of the best practitioners increases will the best practice surface be outward shifted, resulting in technological progress and, on the contrary, technology decline. This explains why the rate of technological progress in the sample analysis period of this paper took 2015 as the cut-off point, with positive growth before 2015 (excluding) and negative growth after 2015 (including). According to stochastic frontier theory, the above reasons can be attributed to excessive capital growth.
Table 1 shows the growth of output and input in NHTZs. As shown in
Table 1, the sample cycle can be divided into two stages, namely, 2012–2014 and 2015–2018. During the period from 2012 to 2014, although the growth rate of capital input in 2012 was higher than that of operating income, the growth rate of capital input in 2013–2014 was significantly lower than that of operating income. In this stage, the increase in output–input ratio was bound to result, that is, technological progress would occur during this stage. In the period from 2015 to 2018, except for 2017, the growth rate of capital in other years was significantly faster than the growth rate of operating income. Therefore, in this stage, the output–input ratio generally declined. In this case, the outward migration of best practices supported by the output–input ratio of best practitioners was no longer possible, and the so-called regression of frontier technology caused by its year-by-year invagination appeared [
40]. In addition, these results can also be analyzed and explained in terms of the concept of relative technological decline. On the one hand, with the endless emergence of entrepreneurial activities in NHTZs, the number of enterprises in NHTZs continues to increase. Although the level of technological frontier of existing individual enterprises has not been regulated, new enterprises (especially those with low technology) have lowered the overall level of technological frontier of NHTZs, resulting in negative growth of TFP. On the other hand, from the perspective of the micro-production process, when higher requirements are put forward for the required technology, the actual technical level is not improved, which is in essence a relative technological regression.
4.2.3. Analysis of Technical Efficiency Change (TEC)
TEC displayed a steady downward trend from 2012 to 2018, albeit with insignificant changes, decreasing from 2.1750% in 2012 to 1.8308% in 2018. This stability is attributed to efforts to enhance TFP by improving TEC to offset a technical recession. As NHTZs approach optimal frontier output, technical inefficiency and random factors make it increasingly challenging to achieve optimal output, resulting in a gradual decline in TEC.
4.2.4. Analysis of Scale Efficiency Change (SEC)
SEC exhibited a fluctuating downward trend between 2012 and 2018, although it remained positive overall. The year 2017 witnessed the lowest SEC value (0.1328%). Further comparative analysis revealed that the improvement of TE and SE compensated for the technical recession, thereby contributing to TFP growth. However, due to the relatively small SEC and TEC in NHTZs, achieving substantial TFP growth through enhancing TE and SE alone would be challenging. Hence, TC emerges as a key factor in driving TFP improvement.
4.3. Regional Analysis
The study conducted a comparative analysis on the mean values of TFP, TC, TEC, SEC, and the corresponding contributions of NHTZs in East, Central, West, and Northeast China from 2012 to 2018. The specific analysis results are shown in
Table 5.
Table 5 shows the regional performance of TFP in NHTZs. On average, based on the TFP variable, the TFP of the West region was the fastest, followed by the Central and East regions, and the Northeast region was the slowest. Based on the TC, the technical recession of the Northeast region was the most significant, followed by the West and East regions, and the Central region was the least significant. The TEC improvement in the West region was the most significant, followed by the East and Central regions, and the Northeast region was the least significant. The SEC of the East region saw the largest increase, followed by the West and Central regions, and the Northeast region was the smallest. In terms of evolution, based on the TFP variable, the TFP of the East, Central, West, and Northeast regions showed a downward trend from 2012 to 2018. The TC and TEC of the East, Central, West, and Northeast regions showed a downward trend year by year. The SEC in the East and Central regions showed an upward trend, while the SEC in the West and Northeast regions showed a downward trend.
4.4. Three Models of TFP Growth
Table 6 presents the mean value distribution of TFP, TC, TEC, and SEC of the 88 NHTZs from 2012 to 2018. Based on the data distribution characteristics and TFP indices, NHTZs were divided into three echelons. The first echelon comprised NHTZs with TFP growth rates exceeding 2.8%, totaling 32 NHTZs (ranked 1–32). The second echelon consisted of NHTZs with TFP growth rates between 1.7% and 2.8%, totaling 26 NHTZs (ranked 33–58). The third echelon comprised NHTZs with TFP growth rates below 1.7%, totaling 30 NHTZs (ranked 59–88). To conduct an in-depth analysis of the TFP growth characteristics of NHTZs across different echelons, the characteristics of each echelon were evaluated and analyzed based on two dimensions.
The analysis proceeded as follows. Firstly, TC, TEC, and SEC were ranked based on their numerical values and evaluated according to both the ranking of internal components and echelons. For instance, for the first echelon (the top 32 NHTZs in terms of TFP), this study examined the rankings of TC, TEC, and SEC, identifying the variable ranking higher than 32 as a major internal driving factor. Subsequently, the rankings of internal components were compared, defining factors with top rankings and absolute differences less than 2 as the main internal driving factors. Finally, combining the results of the above steps, the TFP model of each echelon was analyzed based on the number of checks.
Based on the statistical methods employed, the findings are summarized in
Table 7. In the first echelon, 22 out of 32 NHTZs (approximately 69% of the total) exhibited TFP growth, primarily driven by TC. This implies that vigorous improvement in TE and SE, along with promotion of TC, is crucial for achieving significant TFP growth in these NHTZs. Further analysis based on the administrative level of the cities where the NHTZs are located revealed that 21 out of the 32 NHTZs are situated in provincial capital cities, accounting for 66% of the total. Moreover, the TCs of these NHTZs were all positive and higher compared to others. This suggests that NHTZs in provincial capitals generally benefit from more favorable conditions for innovation and entrepreneurship, resulting in greater technological change. Consequently, the TFP growth model of the first echelon can be summarized as a technology-led growth model.
In the second echelon, out of 26 NHTZs, 18 (approximately 70%) exhibited TFP growth, primarily driven by improvements in TE and SE. Therefore, vigorously carrying out technological innovation activities and enhancing original and endogenous innovation capabilities, alongside promotion of technological change and improvement of TEC and SEC, is essential for achieving substantial TFP growth in these NHTZs. Hence, the TFP growth model of the second echelon can be summarized as a multi-efficiency improvement growth model.
In the third echelon, 22 out of 30 NHTZs (approximately 73%) exhibited TFP growth, primarily driven by SEC. Thus, it is imperative to vigorously carry out technological innovation activities, improve original and endogenous innovation capabilities, promote TC, and enhance production efficiency alongside improving SEC to achieve sustained TFP growth in these NHTZs. Consequently, the TFP growth model of the third echelon can be summarized as a scale efficiency compensation growth model.
In conclusion, NHTZs primarily reliant on technological change and innovation exhibited significant TFP growth, aligning with China’s innovation-driven development strategy and the concept of high-quality economic development. Conversely, NHTZs primarily driven by scale efficiency(SE) showed low or deteriorating TFP, underscoring the insufficiency of relying solely on capital and labor inputs for achieving high-quality economic development. Instead, the alternative path for high-quality economic development should involve increasing the efficiency of labor and capital allocation while simultaneously promoting technological innovation, upgrading industries, and enhancing the contribution of technology to the economy.
4.5. Influencing Factor Analysis
From the regression results presented in
Table 8, it is evident that both the overall and three growth models of NHTZs exhibit a significant negative correlation between capital accumulation and TFP growth. This phenomenon can be attributed to the law of diminishing marginal returns of capital, wherein the continuous increase in capital input does not result in a proportional increase in output but rather leads to resource wastage, thereby impeding TFP growth. Analyzing the three growth models of NHTZs, it can be observed that the impact of capital accumulation is most pronounced in the technology-led growth model compared to the multi-efficiency improvement and scale efficiency compensation growth models. This discrepancy may arise from the relatively robust capital accumulation in the technology-led growth model of NHTZs, where diminishing marginal returns of capital manifest earlier compared to the other two models.
Furthermore, it is noted that R&D investment plays a crucial role in augmenting TFP growth across all models of NHTZs. Specifically, R&D investment, particularly in addressing production and technical challenges, facilitates product and process innovation. Moreover, through the process of learning by doing, R&D investment nurtures a cadre of high-quality scientific and technological talent, thereby fostering technological progress and enhancing TFP.
In the context of overall NHTZs, patent output demonstrates a significant negative impact on TFP growth, indicating that patent output tends to hinder TFP growth. This is attributed to the existing level of integration between technology and the economy within NHTZs, which requires further deepening. Despite the high output of invention patents, their conversion into tangible productivity remains low. Consequently, a considerable portion of invention patents not only fail to achieve industrialization but also do not contribute to actual production and technological advancement, thus representing a waste of innovation resources [
41,
42]. Consequently, the benefits derived from patent output at this stage are outweighed by its opportunity cost, thereby impeding TFP growth. Although NHTZs’ patent output exhibits a negative impact on TFP growth across three growth models, it lacks statistical significance.
It is evident that both within the overall NHTZs and across the three growth models, innovation and entrepreneurship platforms exert a significantly positive influence on TFP growth. This is attributed to their effective integration of innovation and entrepreneurship resources, facilitation of resource openness and sharing, establishment of linkages between various innovation and entrepreneurship entities through innovation networks [
43,
44,
45], and provision of requisite resources or services throughout the innovation process—from research and development to design, testing, standardization, and industrialization. Consequently, the establishment of innovation platforms ensures the orderly progression of various innovative and entrepreneurial activities, thereby promoting technological innovation, industrial development, and ultimately augmenting the TFP of NHTZs.
Regression results indicate that the proportion of service income has an insignificant impact on TFP. This is because the service industry within NHTZs has maintained a relatively small scale and slow growth rate, thus not yet emerging as a significant factor influencing the economic development of NHTZs [
46]. Notably, statistics reveal that in 2012, service revenue in NHTZs accounted for an average of 13.02% of business income, compared to 17.18% in 2018, with an average annual growth rate of less than 1% [
38,
39]. Moreover, in 2018, only 59.09% of NHTZs’ service income contributed to business income, with the ratio being less than 15%. Therefore, the limited scale and sluggish growth rate of the service industry within NHTZs have contributed to its subdued impact on TFP.
The regression analysis reveals that the introduction of overseas talent significantly enhances TFP growth within national high-tech zones (NHTZs), reflecting their degree of openness to the global market. This effect is driven by the attraction of foreign talent, thereby bolstering the human capital reservoir, fostering technological advancements, and ultimately elevating TFP. Across various NHTZ models, the influx of overseas talent consistently propels TFP growth, with a particularly notable impact observed in technology-led growth NHTZs. This heightened effect can be attributed to the fundamental role of human capital in driving technological progress, aligning with research indicating that knowledge-intensive activities necessitate highly skilled and creative human resources to facilitate economic growth [
47]. Consequently, overseas talent plays a pivotal role in facilitating the high-quality development of technology-led growth NHTZs.
Conversely, participation in overseas markets exhibits a significant negative correlation with TFP growth across all NHTZs, underscoring the productivity paradox associated with NHTZ exports. This phenomenon arises from the prevalent reliance of many NHTZs on low-cost comparative advantages, positioning them in the lower echelons of the global value chain. Engaging primarily in processing trade activities and exporting products with minimal technological content and added value, these zones face constrained profit margins, fostering significant inertia in research and development within export-oriented parks. This predicament perpetuates a detrimental cycle wherein heightened export activity corresponds with diminished productivity and deteriorating environmental conditions [
48]. However, if enterprises within NHTZs enhance the value-added component of their export products, heightened participation in overseas markets holds the potential to positively stimulate TFP growth [
49,
50], although this assertion warrants further empirical validation.
5. Conclusions
5.1. Research Conclusions
This study mainly focused on the growth models and influencing mechanisms of total factor productivity in NHTZs. The key research topics included the level of TFP growth in NHTZs, different TFP growth models among various NHTZs, and the influencing factors of different TFP growth models. This paper’s primary innovations and contributions lie in several aspects. Firstly, it deviates from prior studies concentrating on macro- or provincial levels by selecting NHTZs—a meso-industrial functional area—as the research object. Secondly, it employs the stochastic frontier model of the translogarithmic production function to analyze TFP growth rates in NHTZs and explore different TFP growth models. Thirdly, it conducts a comparative analysis of TFP spatial and geographic distribution and time evolution across different NHTZs, categorizing TFP into three growth models and summarizing their main characteristics. Lastly, Tobit regression models are employed to quantitatively reveal the influencing factors of different TFP growth models, aiming to construct corresponding countermeasures and solutions to enhance TFP cooperatively at a practical level. The specific conclusions are as follows.
Different from existing regional TFP studies, this study takes NHTZs as the research object, and the research object is more typical and representative. The NHTZ is the product of China’s reform and opening up. The original intention of construction was to realize the combination of science, technology, and economy and promote the development of high-tech industries. Now, they have developed into a demonstration zone for innovation-driven development and a leading zone for high-quality development in China. To a large extent, the study of TFP in NHTZs helps analyze regional sustainable and high-quality development, which has great theoretical and practical significance for the sustainable and healthy development of regional economies.
This study demonstrates that the overall TFP of NHTZs from 2012 to 2018, averaging approximately 2%, significantly surpasses that of provincial and municipal economies in China, which stands at around 1% [
38,
39]. This disparity underscores the pivotal role of NHTZs as drivers of high-quality development propelled by TFP rather than mere investment. This key finding strongly aligns with empirical evidence, effectively validating the feasibility and efficacy of the translog stochastic frontier production function model in analyzing NHTZ TFP and thus establishing a theoretical framework for future research in this domain. It also serves to encourage both domestic and international scholars to delve into extensive discussions on the intricate relationship between NHTZs and the high-quality development of the national economy.
This paper categorizes NHTZ TFP models into three types: the technology-led growth model, the multi-efficiency improvement growth model, and the scale efficiency compensation growth model. These models significantly contribute to comprehending the essence of China’s economic development towards high quality. Notably, technology-led growth NHTZs are predominantly situated in provincial capitals, characterized by early establishment, abundant innovation resources, and robust policy support. Conversely, scale efficiency compensation growth NHTZs exhibit the opposite traits. Initially reliant on increased factor input for economic growth, technology-led growth NHTZs have evolved to emphasize technological innovation, thus transitioning from factor-driven to technology-driven growth. Conversely, scale efficiency compensation growth NHTZs remain at a stage of factor input-driven growth, necessitating continued efforts in knowledge creation and technological innovation to facilitate transformation. In essence, the establishment and development of NHTZs epitomize China’s accelerated innovation-driven development strategy, reflecting the nation’s transition from factor-driven to innovation-driven economic models, in line with the core tenets of high-quality economic development.
It is evident that both overall NHTZs and the three growth models exhibit a significant negative relationship between capital accumulation and TFP growth. In the context of overall NHTZs, patent output negatively impacts TFP growth, indicating that despite the high output of invention patents, their translation into tangible productivity remains limited. This discrepancy suggests a misalignment between technological innovation and economic integration within overall NHTZs, culminating in underutilization of innovation resources. Conversely, innovation and entrepreneurship platforms exhibit a significant positive impact on TFP growth across all NHTZ categories, underscoring their critical role in driving productivity enhancements. Additionally, overseas talent introduction yields a significant positive effect on overall NHTZ TFP, while overseas market participation exerts a significant negative impact on TFP growth across all NHTZs, thus validating the productivity paradox associated with NHTZ exports.
5.2. Policy Implications
Based on the findings of this study, several policy recommendations are proposed:
Continued promotion of NHTZ development: China should continue to foster NHTZ development by considering regional heterogeneity. NHTZs are instrumental in steering China’s economic growth model towards TFP-driven strategies, facilitating the nation’s high-quality economic development within the framework of its innovation-driven strategy.
Regional resource allocation: China should discern regional resource transfer patterns and tailor industrial policies to enhance technological innovation in high-tech industries in the eastern region while accelerating industrial structure optimization in the central, western, and northeastern regions. This regional differentiation is crucial in transitioning China from traditional growth models to innovation-driven development.
Support for high-tech industries: The Chinese government should actively support high-tech industries by reducing entry barriers for domestic and foreign resources and enhancing the human capital structure. Collaboration with developed countries to introduce frontier technologies and high-level talent, as well as promoting innovation and entrepreneurship, is essential for driving innovation in NHTZs.
Optimization of industrial advantages: Each NHTZ should capitalize on its resource advantages to develop targeted industries, transitioning from resource advantages to industrial advantages. Local government industrial policies should facilitate the formation of modern industrial clusters, bolstering the digital economy to empower high-tech industries.
5.3. Limitations
While this study contributes to understanding NHTZ TFP measurement, growth models, and drivers, it does not explore the spatial correlation and spillover effects of TFP among different NHTZs. Future research should delve into these aspects, focusing on the interaction and mechanisms underlying spatial effects on NHTZ TFP. Challenges may arise in interpreting intra-correlation or spatial spillover effects and selecting appropriate spatial measurement models. Therefore, subsequent spatial correlation factors will be included in the analysis framework, and the research results or conclusions will be more significant for guiding regional sustainable development.


