
Location-Oriented Policies in China: Establishment of State-Level Development Zones and Enterprise Innovation Behaviors

Abstract
:1. Introduction
2. Literature Review
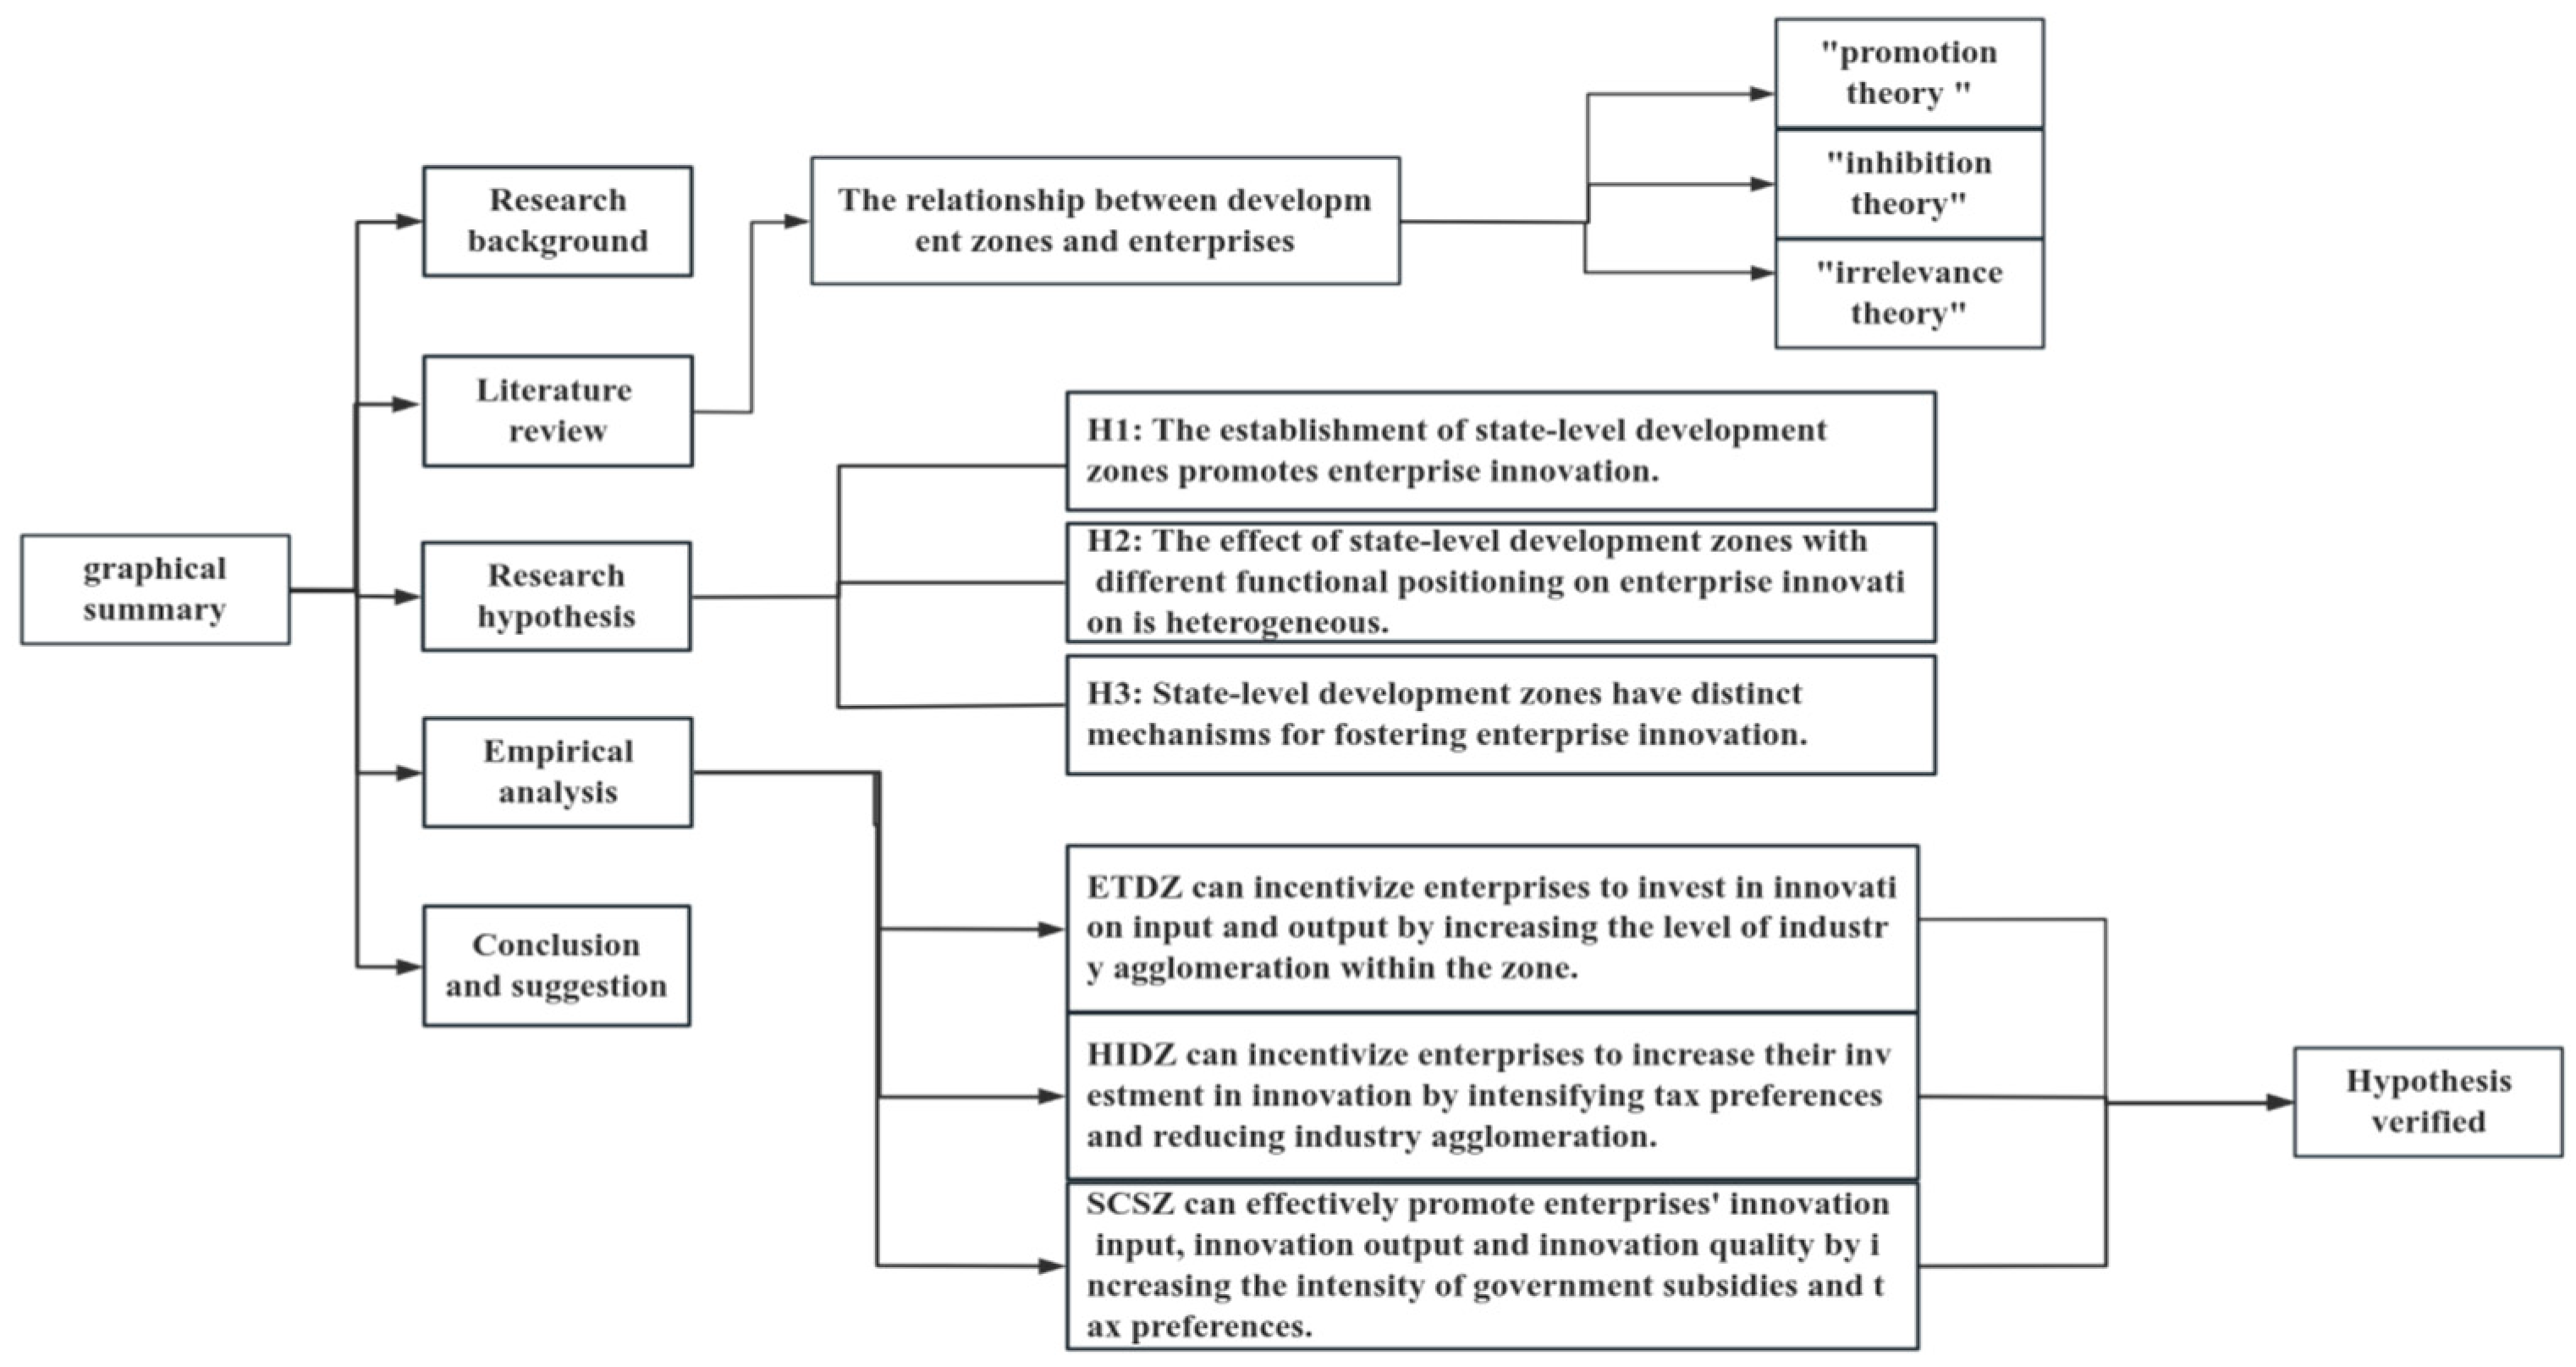
2.1. Theory of Development Zones
2.2. Effects of Development Zone Policies
2.2.1. Macro Level
2.2.2. Micro Level
2.3. Development Zones and Enterprise Innovation
3. Research Hypotheses
4. Research Design
4.1. Identification Strategy
4.2. Data and Variables
5. Empirical Explorations
5.1. Impact of the Establishment of State-Level Development Zones on Enterprises Innovation
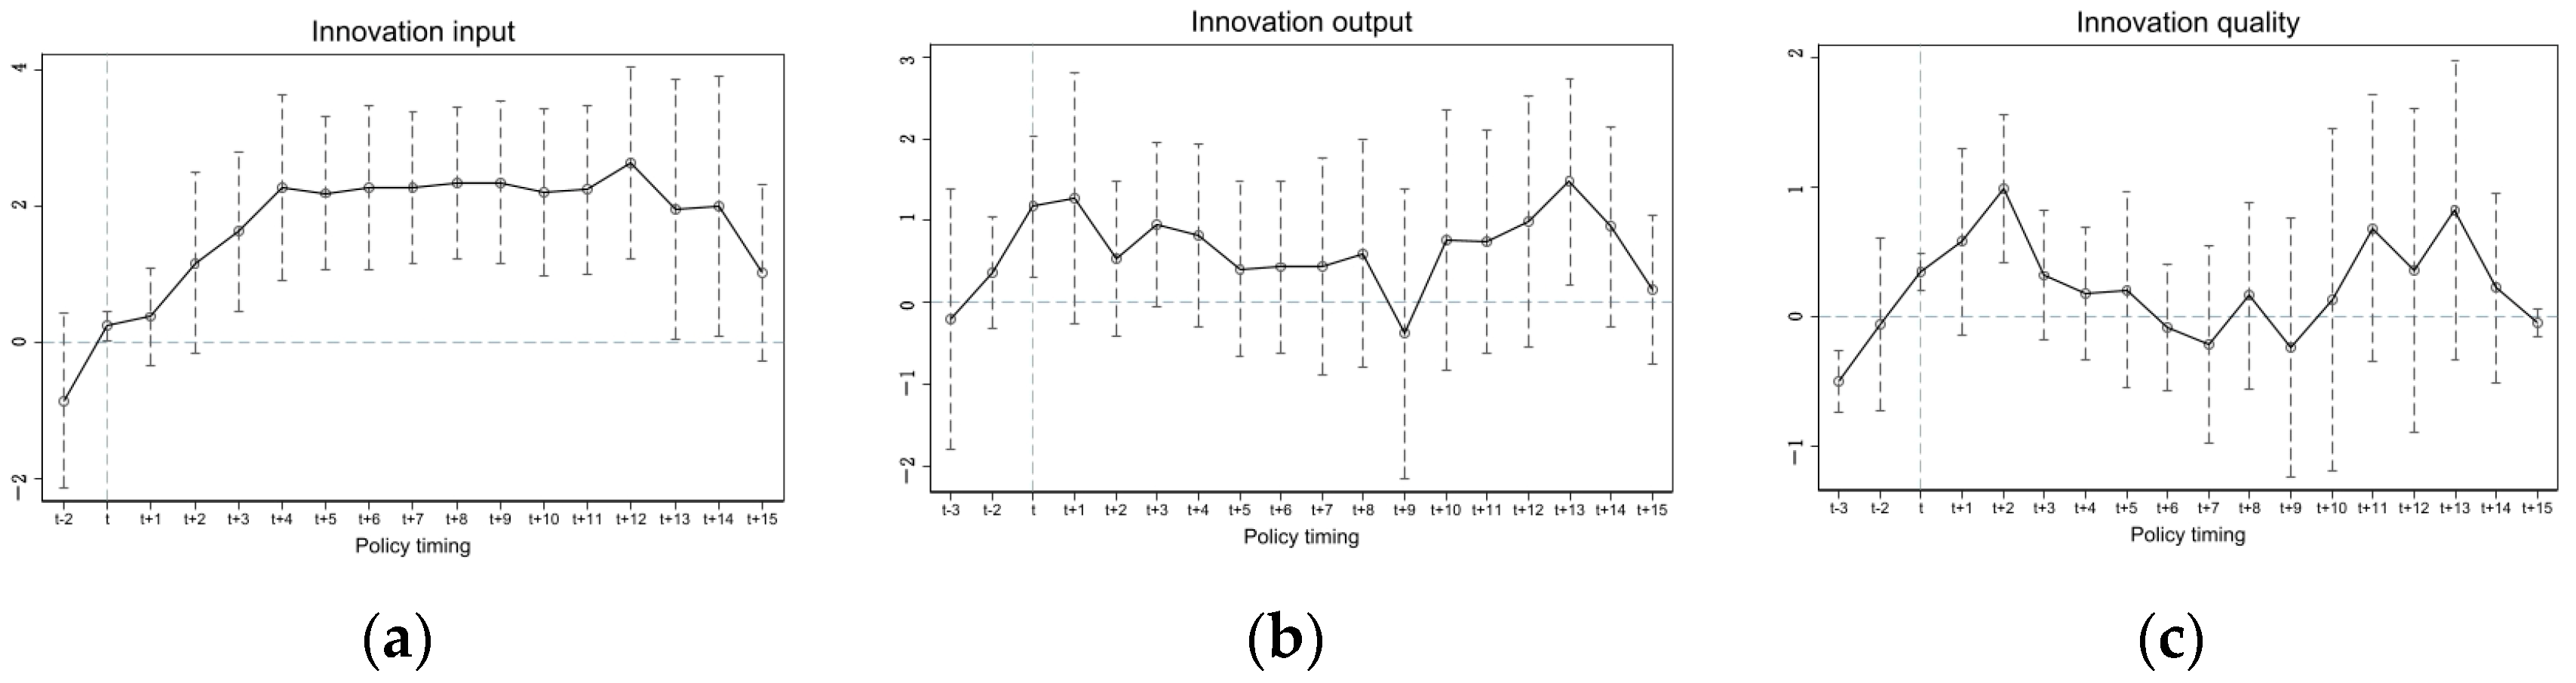
5.2. Dynamic Effects
5.3. Robustness Test
5.3.1. Sensitivity
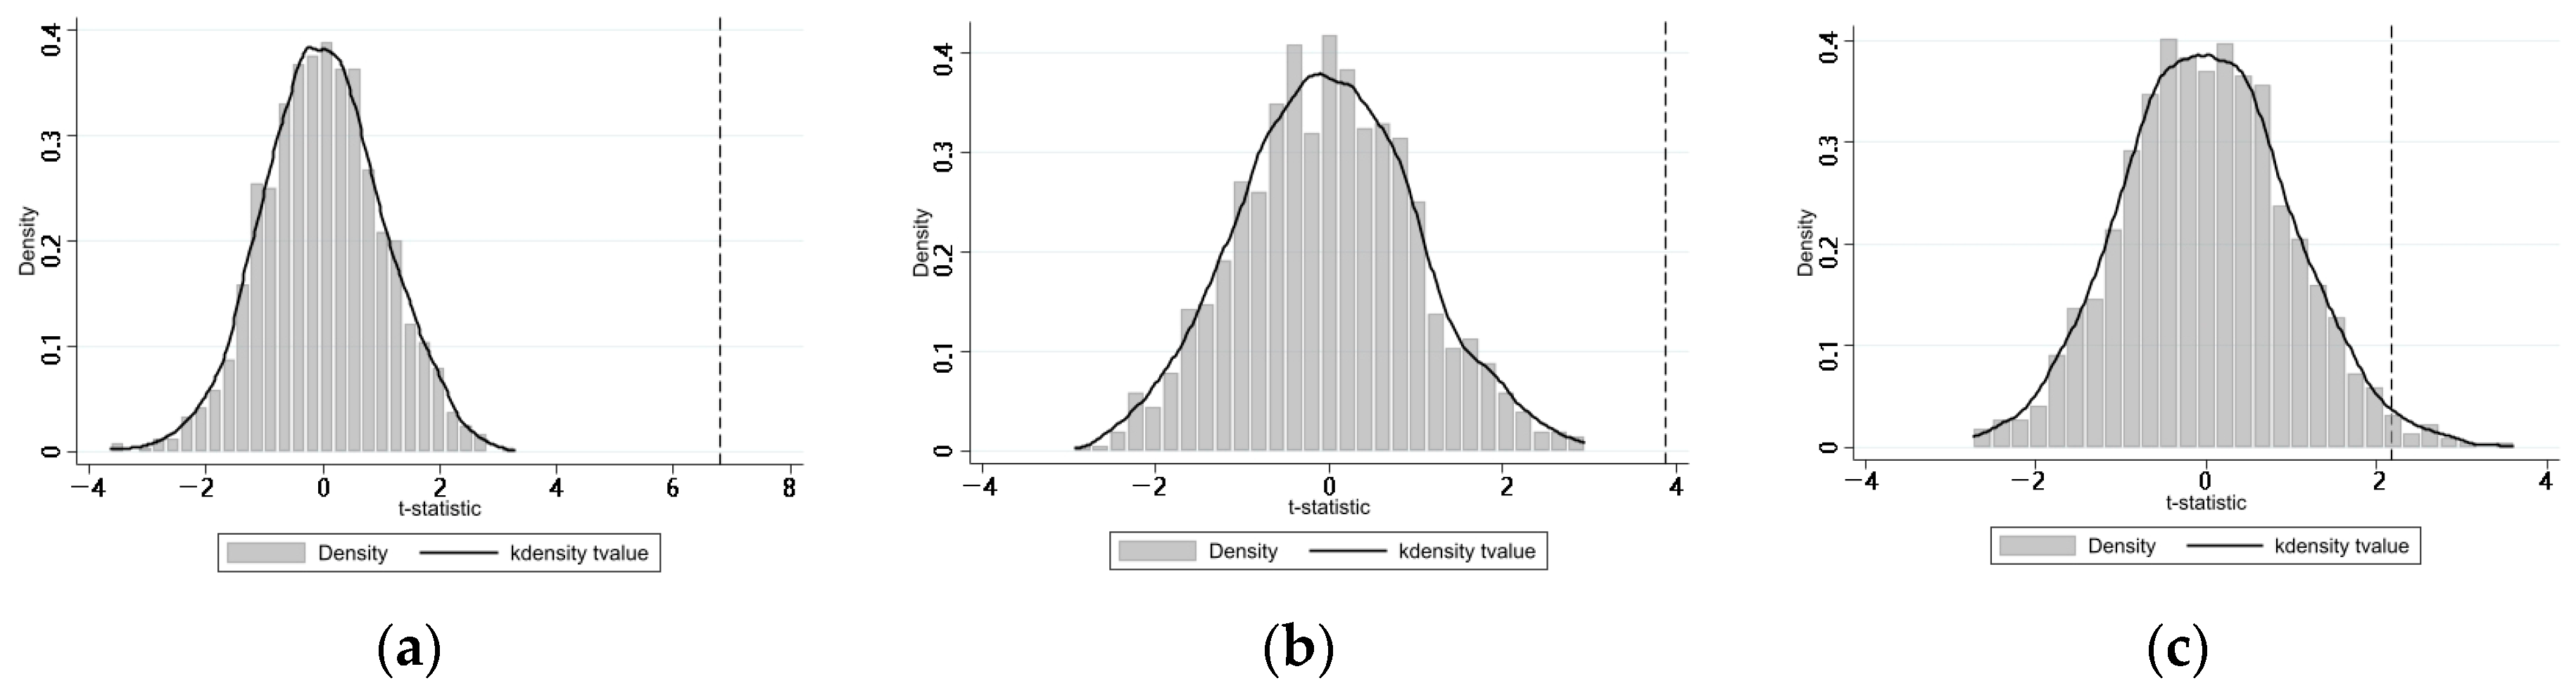
5.3.2. Placebo
6. Heterogeneity and Mechanism
6.1. Heterogeneity
6.2. Mechanism
7. Conclusions and Policy Implications
7.1. Conclusions
7.2. Policy Implications
Author Contributions
Funding
Institutional Review Board Statement
Informed Consent Statement
Data Availability Statement
Conflicts of Interest
References
- Yan, H.C.; Qian, J.X.; Liu, X. Towards the road of eco-efficiency improvement: Evidence from China’s economic and technological development zone. Environ. Sci. Pollut. Res. 2023, 30, 43522–43535. [Google Scholar] [CrossRef]
- Shi, Y.S.; Zheng, B.; Wang, Z.; Zheng, J.W. Mixed land use and its relationship with CO2 emissions: A comparative analysis based on several typical development zones in Shanghai. Land 2023, 12, 1675. [Google Scholar] [CrossRef]
- Myrdal, G. The transfer of technology to underdeveloped countries. Sci. Am. 1974, 231, 172–182. [Google Scholar] [CrossRef]
- Kurita, K.; Managi, S. New economic geography model with natural capital and migration congestion effect. Econ. Anal. Policy 2023, 77, 635–641. [Google Scholar] [CrossRef]
- Ottaviano, G.I.P. New new economic geography: Firm heterogeneity and agglomeration economies. J. Econ. Geogr. 2011, 11, 231–240. [Google Scholar] [CrossRef]
- Lyu, D.G.; Geng, Q.; Jian, Z.; Lu, R. Market Size, labor cost and location of heterogeneous firms: Solving the riddle of economic and productivity gaps in China. Econ. Res. J. 2019, 2019, 36–53. [Google Scholar]
- Liu, H.Y.; Liu, Y.H.; Yuan, P. Productivity advantages in cluster regions: Agglomeration or selection? China Econ. Q. 2015, 3, 1073–1092. [Google Scholar]
- Du, C.J.; Wang, C.J.; Feng, T. The impact of China’s national sustainable development experimental zone policy on energy transition. Sustainability 2023, 15, 8315. [Google Scholar] [CrossRef]
- Feng, Y.C.; Gao, Y.; Zhu, Y.H.; Hu, S.L. How does national development zone policy affect carbon emissions in China? New evidence from a quasi-natural experiment. Front. Public Health 2023, 11, 1122139. [Google Scholar] [CrossRef]
- Mayer, T.; Mayneris, F.; Py, L. The impact of urban enterprise zones on establishment location decisions and labor market outcomes: Evidence from France. J. Econ. Geogr. 2017, 17, 709–752. [Google Scholar] [CrossRef]
- Chaisse, J.; Dimitropoulos, G. Special economic zones in international economic law: Towards unilateral economic law. J. Int. Econ. Law 2021, 24, 229–257. [Google Scholar] [CrossRef]
- Hua, Y.; Partridge, M.; Sun, W.Z. Pollution effects of place-based policy: Evidence from China’s development-zone program. J. Reg. Sci. 2023, 63, 703–727. [Google Scholar] [CrossRef]
- Liu, R.M.; Mao, Y.; Kang, Y.K. Deregulation, market vitality and tourism economy development: Evidence from Chinese cultural system reform. Econ. Res. J. 2020, 55, 115–131. [Google Scholar]
- Deng, H.H.; Yu, Y.H.; Zhao, J.L. Are place-based policies effective? Evidence from China’s development zones. J. Financ. Econ. 2019, 1, 4–18. [Google Scholar]
- Wu, M.; Huang, J.L. Provincial development zones, leading industries and county industrial development. Econ. Perspect. 2017, 1, 52–61. [Google Scholar]
- Li, L.X.; Shen, G.J. Special economic zones, comparative advantage and industrial structural transformation. China Econ. Q. 2015, 14, 885–910. [Google Scholar]
- Meng, M.X.; Cao, X.G.; Zhang, X.L. Does the special economic zones policy affect industrial agglomeration in China-based on the agglomeration perspective of the cross administrative boundary. China Ind. Econ. 2019, 11, 79–97. [Google Scholar]
- Zheng, S.; Sun, W.; Wu, J.; Kahn, M.E. The birth of edge cities in China: Measuring the effects of industrial parks policy. J. Urban Econ. 2017, 100, 80–103. [Google Scholar] [CrossRef]
- Sun, W.Z.; Wu, J.F.; Zheng, S.Q. The consumption-driven effect of place-based industrial policy: An empirical study based on development zone policy. Soc. Sci. China 2018, 12, 48–68. [Google Scholar]
- Wang, J. The economic impact of special economic zones: Evidence from Chinese municipalities. J. Dev. Econ. 2013, 101, 133–147. [Google Scholar] [CrossRef]
- Chen, Z.; Xiong, R.X. Comparative advantage and the effects of industrial policy: Evidence from quasi-experiments in export processing zones. J. Manag. World 2015, 8, 67–80. [Google Scholar]
- Li, B.; Wu, L.H. Development zone and firms’ growth: Research on heterogeneity and mechanism. China Ind. Econ. 2018, 4, 79–97. [Google Scholar]
- Zhang, G.F.; Wang, Y.J.; Li, K.W. Special economic development zones and firm dynamic growth: Research based on firm entry, exit and growth. J. Financ. Econ. 2016, 12, 49–60. [Google Scholar]
- Huang, J.L.; Wang, R. The upgrading of special economic zones, FDI and comparative advantage. J. Beijing Technol. Bus. Univ. (Soc. Sci.) 2017, 5, 36–49. [Google Scholar]
- Bian, Z.Y.; Qiang, Y.C.; Li, Z.Y. Does development zone policy promote local firm’s export participation-based on the difference-in-difference method test. J. Int. Trade 2019, 11, 116–132. [Google Scholar]
- Tan, J.; Zhang, J.H. Special economic zones and firm productivity-empirical evidence from Chinese listed companies. Econ. Perspect. 2019, 10, 43–59. [Google Scholar]
- Yuan, Q.G.; Liu, B.; Zhu, X.C. Research on “productivity effect” of economic function zone. J. World Econ. 2015, 5, 81–104. [Google Scholar]
- Chen, S.X. Governmental investment incentives and firms’ productivity: A policy experiment of China. J. Zhongnan Univ. Econ. Law 2018, 4, 71–81. [Google Scholar]
- Vasquez-Urriag, A.R.; Barge-Gil, A.; Rico, A.M.; Paraskevopoulou, E. The impact of science and technology parks on firms’ product innovation: Empirical evidence from Spain. J. Evol. Econ. 2014, 24, 835–873. [Google Scholar] [CrossRef]
- Marcon, A.; Ribeiro, J.L.D.; Olteanu, Y.; Fichter, K. How the interplay between innovation ecosystems and market contingency factors impacts startup innovation. Technol. Soc. 2024, 76, 102424. [Google Scholar] [CrossRef]
- Xi, Q.; Sun, R.; Mei, L. The impact of special economic zones on producer services productivity: Evidence from China. China Econ. Rev. 2021, 65, 101–558. [Google Scholar] [CrossRef]
- Sosnovskikh, S. Industrial clusters in Russia: The development of special economic zones and industrial parks. Russ. J. Econ. 2017, 3, 174–199. [Google Scholar] [CrossRef]
- Nishimura, J.; Okamuro, H. R&D productivity and the organization of cluster policy: An empirical evaluation of the Industrial Cluster Project in Japan. J. Technol. Transf. 2011, 36, 117–144. [Google Scholar]
- Lamperti, F.; Mavilia, R.; Castellini, S. The role of science parks: A puzzle of growth, innovation and R&D investments. J. Technol. Transf. 2017, 42, 158–183. [Google Scholar]
- Ramírez-Alesón, M.; Fernández-Olmos, M. Unravelling the effects of science parks on the innovation performance of NTBFs. J. Technol. Transf. 2018, 43, 482–505. [Google Scholar] [CrossRef]
- Zhang, J.; Zheng, W.P.; Xin, F. Bank deregulation, structural competition and enterprises’ innovation in China. China Ind. Econ. 2017, 10, 118–136. [Google Scholar]
- Zheng, F.C.; Zhang, X.L. Do development zones help small and micro enterprises innovate: Empirical evidence from surveys of small and micro enterprises. Mod. Econ. Res. 2021, 2021, 93–105. [Google Scholar]
- Liu, X.; Zhang, J.; Liu, T.H.; Zhang, X.J. Can the special economic zones promote the green technology innovation of enterprises? An evidence from China. Front. Environ. Sci. 2023, 10, 870019. [Google Scholar] [CrossRef]
- Tu, W.; Zhang, L.; Sun, D.; Mao, W. Evaluating high-tech industries’ technological innovation capability and spatial pattern evolution characteristics: Evidence from China. J. Innov. Knowl. 2023, 8, 100287. [Google Scholar] [CrossRef]
- Li, J.W. Impact of financial development on innovation efficiency of high-tech industrial development zones in Chinese cities. Technol. Soc. 2024, 76, 102467. [Google Scholar] [CrossRef]
- Yao, Y.; Zhang, M. Subnational leaders and economic growth: Evidence from Chinese cities. J. Econ. Growth 2015, 20, 405–436. [Google Scholar] [CrossRef]
- Sheng, D.; Zhang, G.F. Special economic zones and firms’ markup dispersion. China Econ. Q. 2018, 17, 299–332. [Google Scholar]
- Wang, Y.J.; Zhang, G.F. Sources of productivity advantages of special economic zones: Agglomeration effect or selection effect? Econ. Res. J. 2016, 51, 58–71. [Google Scholar]
- Xiang, K.H.; Lu, M. Speed versus quality: Why regional dispersion tendency of development zone policy is not sustainable? J. Financ. Econ. 2015, 41, 4–17. [Google Scholar]
- Huang, J. The latest generation of SEZs: Consumer-oriented unilateralism in China’s e-commerce trade. J. Int. Econ. Law 2021, 24, 299–320. [Google Scholar] [CrossRef]
- Yan, G.W.; Liu, Q.; Chen, H.B. Development zone and corporate innovation: Data based on China development zone audit announcement list. Foreign Econ. Manag. 2020, 42, 32–46. [Google Scholar]
- Kong, Q.; Li, R.; Peng, D.; Wong, Z. High-technology development zones and innovation in knowledge-intensive service firms: Evidence from Chinese A-share listed firms. Int. Rev. Financ. Anal. 2021, 78, 101–883. [Google Scholar] [CrossRef]
- Schminke, A.; Biesebroeck, J.V. Using export market performance to evaluate regional preferential policies in China. Rev. World Econ. 2013, 149, 343–367. [Google Scholar] [CrossRef]
- Zhang, R.Y.; Liu, W.D.; Song, Z.Y. Spatio-temporal evolution and driving factors of national development zones of China based on geodetectors. J. Nat. Resour. 2021, 36, 2672–2683. [Google Scholar] [CrossRef]
- Zhou, M.; Wu, C.Q. The influence of government subsidies on small and medium-sized enterprise technology innovation. Sci. Res. Manag. 2017, 2017, 574–580. [Google Scholar]
- Mao, Q.L.; Xu, J.Y. Does input trade liberalization raise firms’ markups: Evidence from China. China Econ. Q. 2017, 2, 485–524. [Google Scholar]
- Xie, Z.Y.; Wu, L.J. Industrial agglomeration level and innovation efficiency of industrial enterprises-An empirical study based on the panel data of 20 industries from the year 2000 to 2012. Sci. Res. Manag. 2017, 1, 91–99. [Google Scholar]
- Sun, P.Y.; Han, S.; Xu, Q.Q. Dynamic effects of industrial agglomeration on labor productivity. J. World Econ. 2013, 3, 33–53. [Google Scholar]
- Sun, Y.Y.; Zhang, J.G. The evolution of efficiency of Chinese manufacturing industry’s inter-provincial resource allocation: Based on the perspective of the binary margin. Econ. Res. J. 2015, 50, 89–103. [Google Scholar]
- Tang, S.; Bao, Q. Do leading industrial policies improve firm performance? World Econ. Stud. 2016, 9, 97–109. [Google Scholar]
- Zhang, T.H.; Deng, Y.M. Development zone, resource allocation and macroeconomic efficiency empirical research based on Chinese industrial enterprises. China Econ. Q. 2020, 19, 1237–1266. [Google Scholar]
- Lu, M.; Xiang, K.H. Solving the dilemma between efficiency and balance: On China’s regional development strategy. Comp. Econ. Soc. Syst. 2014, 4, 1–16. [Google Scholar]
- Wu, Y.P.; Li, L. Performance evaluation of special economic zones in China: From the perspective of firm innovation capacity. J. Financ. Res. 2017, 6, 126–141. [Google Scholar]
- Chai, Z.Y.; Kong, L.C. Do the enterprises of development zones have productivity advantages? Based on a quasi-experiment of the upgrading policy of development zones. Bus. Manag. J. 2020, 42, 59–76. [Google Scholar]
- Huang, W.; Zhang, Z.Y.; Liu, A.R. From Difference-In-Differences to event study. Rev. Ind. Econ. 2022, 2, 1–18. [Google Scholar]
- Wu, M.; Liu, C.; Huang, J. The special economic zones and innovation: Evidence from China. China Econ. Q. Int. 2021, 1, 319–330. [Google Scholar] [CrossRef]
- Qiu, Y.D. The establishment of development zones, regional bias and the improvement of enterprise innovation. Ind. Econ. Res. 2020, 4, 61–73. [Google Scholar]
- Bai, X.Y.; Wang, Y.Y.; Su, X. R&D subsidies or tax preferences: An empirical analysis of government intervention on enterprise innovation performance and innovation quality. Sci. Res. Manag. 2019, 40, 9–18. [Google Scholar]
- Luo, L.; Shan, R.B.; Xiang, J. The government intervention effectiveness in promoting remanufacturing: Subsidy or remanufacturing target? Socio-Econ. Plan. Sci. 2024, 92, 101829. [Google Scholar] [CrossRef]
- Teng, Y.Y.; Zheng, J.Z.; Li, Y.C.; Wu, D. Optimizing digital transformation paths for industrial clusters: Insights from a simulation. Technol. Forecast. Soc. Chang. 2024, 200, 123170. [Google Scholar] [CrossRef]
- Sun, W.Y.; Yin, K.D.; Liu, Z. Tax incentives, R&D manipulation, and corporate innovation performance: Evidence from listed companies in China. Sustainability 2021, 13, 11819. [Google Scholar] [CrossRef]
- Guo, L.; Long, W.Y.; Dai, Z.M. Manufacturing R&D investment efficiency and financing constraints: Evidence from China. Appl. Econ. 2021, 53, 676–687. [Google Scholar]
- Deng, J.; Su, C.; Zhang, Z.M.; Wang, X.P.; Ma, J.Y.; Wang, C.P. Evolutionary game analysis of chemical enterprises’ emergency management investment decision under dynamic reward and punishment mechanism. J. Loss Prev. Process Ind. 2024, 87, 105230. [Google Scholar] [CrossRef]


| Variable Type | Variable Name | Notation | Define |
|---|---|---|---|
| Outcome variables | Innovation input | Ln(total amount of R&D expenditures)t | |
| Innovation output | Ln(total patent applications)t + 1 | ||
| Innovation quality | Ln(patent invention patents)t + 1 | ||
| Treatment variable | Establishment of development zones | In the year of the establishment of the development zone and thereafter, if the location of the enterprise is within the boundary of the development zone, it is defined as 1, otherwise it is defined as 0. | |
| Control variables | Enterprise age | Ln(year of enterprise establishment) | |
| Shareholding structure | Shareholding ratio of top ten shareholders | ||
| Proportion of independent directors | Number of independent directors/total number of board members | ||
| Enterprise ownership | State-owned enterprise take the value of 1, otherwise 0 | ||
| Mediating variables | Government subsidy | Ln(amount of government subsidy) | |
| Tax preference | Ln(amount of government tax rebates) | ||
| Industry agglomeration | Sum of squares (enterprise revenue/total industry enterprise revenue) |
| Variable | Mean | Median | Variance | Min | Max | Observations |
|---|---|---|---|---|---|---|
| 17.520 | 17.499 | 1.396 | 13.368 | 21.121 | 9231 | |
| 2.458 | 2.303 | 1.217 | 0.693 | 9.242 | 7660 | |
| 1.861 | 1.609 | 1.039 | 0.693 | 8.693 | 6060 | |
| 0.010 | 0.000 | 0.101 | 0.000 | 1.000 | 18,742 | |
| 2.524 | 2.639 | 0.559 | 0.693 | 3.401 | 18,742 | |
| 59.441 | 61.023 | 15.084 | 24.030 | 89.767 | 16,063 | |
| 0.341 | 0.333 | 0.101 | 0.000 | 0.556 | 17,630 | |
| 0.486 | 0.000 | 0.500 | 0.000 | 1.000 | 18,742 | |
| 11.385 | 14.980 | 7.117 | 0.000 | 19.547 | 16,065 | |
| 12.660 | 15.379 | 6.638 | 0.000 | 20.175 | 15,115 | |
| 0.104 | 0.074 | 0.099 | 0.014 | 0.633 | 16,804 |
| (1) | (2) | (3) | |
|---|---|---|---|
| Variable | |||
| 0.908 *** | 0.413 *** | 0.214 ** | |
| (6.80) | (3.88) | (2.18) | |
| −0.028 | 0.173 *** | 0.081 ** | |
| (−0.68) | (4.15) | (2.05) | |
| 0.000 | 0.005 *** | 0.003 *** | |
| (0.07) | (5.47) | (3.00) | |
| −0.277 | 0.425 * | 0.551 ** | |
| (−1.07) | (1.65) | (2.28) | |
| 0.544 *** | 0.157 *** | 0.256 *** | |
| (15.47) | (4.67) | (8.07) | |
| Constant | 17.539 *** | 1.450 *** | 1.161 *** |
| (107.81) | (8.98) | (7.61) | |
| Year | yes | yes | yes |
| Industry | yes | yes | yes |
| Province | yes | yes | yes |
| Observations | 9225 | 7357 | 5944 |
| R-squared | 0.173 | 0.104 | 0.103 |
| (1) | (2) | (3) | |
|---|---|---|---|
| Variable | |||
| 0.936 *** | 0.411 *** | 0.217 ** | |
| (6.96) | (3.87) | (2.20) | |
| −0.012 | 0.187 *** | 0.081 * | |
| (−0.27) | (4.30) | (1.95) | |
| −0.000 | 0.005 *** | 0.003 *** | |
| (−0.32) | (5.02) | (3.01) | |
| −0.157 | 0.517 * | 0.599 ** | |
| (−0.58) | (1.95) | (2.39) | |
| 0.502 *** | 0.146 *** | 0.242 *** | |
| (13.66) | (4.24) | (7.42) | |
| Constant | 17.453 *** | 1.395 *** | 1.144 *** |
| (101.81) | (8.28) | (7.15) | |
| Year | yes | yes | yes |
| Industry | yes | yes | yes |
| Province | yes | yes | yes |
| Observations | 8565 | 6893 | 5564 |
| R-squared | 0.170 | 0.104 | 0.102 |
| (1) | (2) | (3) | (4) | (5) | (6) | (7) | (8) | (9) | |
|---|---|---|---|---|---|---|---|---|---|
| Variable | ETDZ | HIDZ | SCSZ | ETDZ | HIDZ | SCSZ | ETDZ | HIDZ | SCSZ |
| 0.602 *** | 1.243 *** | 0.983 *** | 0.574 *** | −0.018 | 1.271 *** | 0.035 | 0.037 | 1.139 *** | |
| (3.38) | (5.67) | (2.86) | (3.90) | (−0.12) | (4.17) | (0.25) | (0.26) | (4.27) | |
| Control variable | yes | yes | yes | yes | yes | yes | yes | yes | yes |
| Year | yes | yes | yes | yes | yes | yes | yes | yes | yes |
| Industry | yes | yes | yes | yes | yes | yes | yes | yes | yes |
| Province | yes | yes | yes | yes | yes | yes | yes | yes | yes |
| Observations | 9180 | 9161 | 9143 | 7297 | 7281 | 7238 | 5890 | 5885 | 5850 |
| R-squared | 0.173 | 0.170 | 0.171 | 0.105 | 0.101 | 0.103 | 0.104 | 0.103 | 0.105 |
| Mechanisms | (1) | (2) | (3) | (4) | |
|---|---|---|---|---|---|
| Government subsidy | |||||
| 0.300 (0.62) | 0.609 *** (3.43) | 0.589 *** (4.02) | 0.051 (0.36) | ||
| 0.028 *** (9.76) | 0.023 *** (7.49) | 0.024 *** (8.27) | |||
| Control variable | yes | yes | yes | yes | |
| Observations | 15,919 | 9179 | 7297 | 5890 | |
| R-squared | 0.564 | 0.182 | 0.112 | 0.115 | |
| Tax preference | |||||
| −0.446 (−0.69) | 0.522 *** (2.92) | 0.633 *** (4.10) | 0.112 (0.78) | ||
| 0.058 *** (23.90) | 0.029 *** (10.92) | 0.024 *** (9.63) | |||
| Control variable | yes | yes | yes | yes | |
| Observations | 13,612 | 8195 | 6578 | 5380 | |
| R-squared | 0.270 | 0.243 | 0.123 | 0.129 | |
| Industry agglomeration | |||||
| 0.034 *** | 0.629 *** | 0.549 *** | 0.031 | ||
| (3.84) | (3.53) | (3.73) | (0.22) | ||
| −0.556 *** | 0.591 *** | 0.063 | |||
| (−3.18) | (3.41) | (0.37) | |||
| Control variable | yes | yes | yes | yes | |
| Observations | 15,777 | 9136 | 7297 | 5890 | |
| R-squared | 0.233 | 0.174 | 0.107 | 0.104 |
| Mechanisms | (1) | (2) | (3) | (4) | |
|---|---|---|---|---|---|
| Government subsidy | |||||
| 0.464 (0.84) | 1.242 *** (5.70) | −0.035 (−0.23) | 0.016 (0.11) | ||
| 0.029 *** (10.00) | 0.023 *** (7.35) | 0.023 *** (7.97) | |||
| Control variable | yes | yes | yes | yes | |
| Observations | 15,886 | 9160 | 7281 | 5885 | |
| R-squared | 0.564 | 0.179 | 0.108 | 0.112 | |
| Tax preference | |||||
| 1.352 * (1.84) | 1.308 *** (5.99) | −0.021 (−0.13) | 0.031 (0.22) | ||
| 0.060 *** (24.52) | 0.030 *** (11.30) | 0.025 *** (10.01) | |||
| Control variable | yes | yes | yes | yes | |
| Observations | 13,584 | 8178 | 6567 | 5376 | |
| R-squared | 0.269 | 0.244 | 0.119 | 0.129 | |
| Industry agglomeration | |||||
| −0.024 ** | 1.238 *** | −0.013 | 0.037 | ||
| (−2.42) | (5.65) | (−0.08) | (0.26) | ||
| −0.536 *** | 0.540 *** | 0.000 | |||
| (−3.05) | (3.11) | (0.00) | |||
| Control variable | yes | yes | yes | yes | |
| Observations | 15,744 | 9117 | 7281 | 5885 | |
| R-squared | 0.234 | 0.171 | 0.102 | 0.103 |
| Mechanisms | (1) | (2) | (3) | (4) | |
|---|---|---|---|---|---|
| Government subsidy | |||||
| 4.136 *** (3.27) | 0.884 *** (2.58) | 1.194 *** (3.93) | 1.070 *** (4.03) | ||
| 0.029 *** (9.91) | 0.022 *** (7.16) | 0.023 *** (7.88) | |||
| Control variable | yes | yes | yes | yes | |
| Observations | 15,826 | 9142 | 7238 | 5850 | |
| R-squared | 0.563 | 0.180 | 0.109 | 0.115 | |
| Tax preference | |||||
| 3.742 ** (2.10) | 0.897 ** (2.43) | 1.016 *** (2.98) | 0.983 *** (3.28) | ||
| 0.059 *** (24.24) | 0.029 *** (11.13) | 0.025 *** (9.92) | |||
| Control variable | yes | yes | yes | yes | |
| Observations | 13,530 | 8160 | 6524 | 5340 | |
| R-squared | 0.270 | 0.244 | 0.120 | 0.130 | |
| Industry agglomeration | |||||
| 0.001 | 0.989 *** | 1.268 *** | 1.139 *** | ||
| (0.05) | (2.88) | (4.17) | (4.27) | ||
| −0.540 *** | 0.530 *** | 0.012 | |||
| (−3.08) | (3.05) | (0.07) | |||
| Control variable | yes | yes | yes | yes | |
| Observations | 15,684 | 9099 | 7238 | 5850 | |
| R-squared | 0.236 | 0.172 | 0.104 | 0.105 |
Disclaimer/Publisher’s Note: The statements, opinions and data contained in all publications are solely those of the individual author(s) and contributor(s) and not of MDPI and/or the editor(s). MDPI and/or the editor(s) disclaim responsibility for any injury to people or property resulting from any ideas, methods, instructions or products referred to in the content. |
© 2024 by the authors. Licensee MDPI, Basel, Switzerland. This article is an open access article distributed under the terms and conditions of the Creative Commons Attribution (CC BY) license (https://creativecommons.org/licenses/by/4.0/).
Share and Cite
Zhao, K.; Wu, W.; Xu, S.; Liu, J.; Sun, W. Location-Oriented Policies in China: Establishment of State-Level Development Zones and Enterprise Innovation Behaviors. Sustainability 2024, 16, 3250. https://doi.org/10.3390/su16083250
Zhao K, Wu W, Xu S, Liu J, Sun W. Location-Oriented Policies in China: Establishment of State-Level Development Zones and Enterprise Innovation Behaviors. Sustainability. 2024; 16(8):3250. https://doi.org/10.3390/su16083250
Chicago/Turabian StyleZhao, Kai, Wanshu Wu, Shengxiang Xu, Jialin Liu, and Weidong Sun. 2024. "Location-Oriented Policies in China: Establishment of State-Level Development Zones and Enterprise Innovation Behaviors" Sustainability 16, no. 8: 3250. https://doi.org/10.3390/su16083250