Abstract
This study combines the latest vague set similarity measurement method with the entropy weight TOPSIS method; furthermore, it applies the grey relational analysis method to establish a model for the synergistic development of supply and demand in the health industry, and it empirically analyzes the development status, synergy level, and synergistic development level of China’s health industry supply and demand from 2013 to 2021. The findings reveal that: (1) China’s health industry supply maintains steady growth, while demand grows rapidly. However, the overall level of supply and demand development is generally low, indicating significant potential for future development. Moreover, the development of the supply lags behind that of the demand, leading to an increasing gap year by year. (2) The level of synergy between supply and demand in China’s health industry is relatively high but is decreasing year by year. Although the degree of synergistic development between supply and demand continues to increase, it remains at a low level, indicating that high coordination between supply and demand comes at the cost of a low development level. (3) There exists a significant regional imbalance in the development of China’s health industry, with the overall difference showing a widening trend year by year. Regional disparities are the main source of the overall difference.
1. Introduction
The development of China’s health industry is occurring during a rare era of opportunities. On one hand, China is facing a serious issue of population aging. By the end of 2021, the number of elderly people aged 60 and above in China reached 267 million, accounting for 18.9% of the total population [1]. In the vast population of China, the increase in the elderly population has led to a sharp rise in the demand for the health industry. On the other hand, the concept of nationwide health has been widely established and promoted in China. Since the 18th National Congress of the Communist Party of China, the Chinese government has introduced a series of policies to promote public health, such as the “Healthy China 2030” outline [2] and the “14th Five-Year Plan” for national health. Concepts like “Health is the foundation of people’s livelihood”, and “Without nationwide health, there is no comprehensive well-off society” have become deeply rooted in the hearts of the Chinese people. At the same time, the rapid increase in demand poses many new challenges to the development of the health industry, including regional uneven distribution of resources, disparities in the accessibility of health services, and the rising cost of medical expenses. To effectively address these challenges, it is necessary to conduct a thorough assessment of the current state of the health industry’s development and to undertake deeper research to identify more comprehensive and sustainable development models.
As a populous nation with a population of 1.4 billion, China’s health industry development should leverage the advantage of an enormous market, promote a virtuous cycle of “mutual promotion of supply and demand, and integrated production and marketing,” and firmly grasp the initiative for development. However, in China, the intricate interplay of multiple factors, such as the availability of healthcare services, medical resources, and the preferences and needs of the population, poses a formidable challenge to the coordinated development of the health industry. Therefore, this paper conducts an evaluative study of the coordination between supply and demand in the health industry and the level of industry development, aiming to comprehensively understand the operational status of China’s health industry and to identify the current problems and bottlenecks in the industry development through separate analysis and coordination between its supply and demand. Based on the evaluation results, government departments and enterprises can formulate corresponding policies and measures to promote the optimization of resource allocation and the upgrading of the health industry, thereby enhancing its service level and market competitiveness.
This study makes the following marginal contributions:
- (1)
- The existing research on the development of China’s health industry tends to focus more on the study of the status of medical services [3] and public health [4,5] development in China; standardized definitions of the health industry in the literature and the provision of systematic methods to construct a comprehensive evaluation index system for assessing the development of China’s health industry are lacking. We established a comprehensive evaluation index system to assess the development of China’s health industry based on a supply–demand perspective.
- (2)
- The evaluation research on the development level of the health industry supply and demand often neglects the existence of uncertain fuzzy data and their impact on the evaluation results. To address this issue, this study introduces the method of fuzzy set similarity measurement from fuzzy mathematics. This method enhances representational capability when dealing with evaluation problems characterized by fuzziness and uncertainty.
- (3)
- Given the vast territory and significant economic and cultural disparities among regions in China, we incorporate kernel density methods and Gini coefficient analysis into the study of China’s health industry development, aiming to further analyze regional disparities in China’s health industry development and to identify their main causes.
The structure of the remaining chapters in this paper is as follows: Section 2 provides a review of the relevant literature. Section 3 introduces the research methods. Section 4 introduces the evaluation index system established in this paper. Section 5 analyzes the synergy and development status of supply and demand in China’s health industry. Section 6 summarizes the research conclusions and provides relevant recommendations.
2. Literature Review
2.1. Definition of the Health Industry
The health industry is a typical complex industry, and in order to study its development, it is necessary to provide a clearer definition of it. Different scholars define the health industry differently. Relman [6] provided an authoritative definition of the health industry for the first time, describing it as a “new medical-industrial complex” with a profit-oriented purpose; it encompasses a vast new industry that offers various healthcare services, including specialized hospitals, nursing homes, and home care. Tien et al. [7] depicted the health industry as a people-centered, complex service system composed of personnel, processes, and products. Based on their research, we defined the health industry. The health industry is a highly integrated sector with healthcare and pharmaceutical industries at its core; it expands and merges with multiple industries, such as health product manufacturing, health services, long-term care, and health insurance.
2.2. Evaluation of the Development Level of the Health Industry
Evaluating the development level of the health industry is a significant research area. Various methodologies have been used by both government and academia to assess this level. As early as 2007, the World Health Organization established a comprehensive assessment framework for the health industry, encompassing six essential components: services, workforce, information systems, pharmaceuticals and technology, financial aspects, and governance [8]. The Consolidated Health Economic Evaluation Reporting Standards 2022 (CHEERS 2022) stands as the most recent milestone in health economic evaluation [9] and is known for its universality. A continuous influx of scholarly articles focuses on assessing health industry development. For instance, Assaf et al. [10] demonstrated precise analysis of the health food service sector through data envelopment analysis. Moreover, Anderson et al. [11] introduced an innovative assessment framework for evaluating health industry development, focusing on gauging industrial resilience. Some studies have also touched upon the development of China’s health industry. Li et al. [3] conducted an assessment of the present quality of primary healthcare in China, elucidating its principal challenges and proposing potential solutions. Wang et al. [4] conducted a historical retrospective study on the development of public health in China spanning the last seven decades. They advocated prioritizing prevention and enhancing the quality of public health services for the future. Deng et al. [5] analyzed the principal inputs and outputs of China’s public health and healthcare policies, spotlighting the prevailing issues and challenges in the industry’s development.
Despite the important contributions made by the aforementioned studies in assessing the development of the health industry, there are still two unresolved issues at present. On the one hand, despite numerous studies on public health in China, there is still a lack of academic works that specifically focus on studying the Chinese health industry. On the other hand, there is currently no research that has established an evaluation index system suitable for assessing the development of the health industry in China. Due to China’s large population, vast territory, and significant regional differences in terms of economic, cultural, and environmental aspects, it is necessary to establish a multi-indicator evaluation system based on reasonable criteria when assessing the development of the health industry. This system should objectively and accurately reflect the actual level of health industry development in the different regions of China.
2.3. Research on the Synergistic Development of Supply and Demand in the Health Industry
The utilization of supply and demand analysis in industry development is broad. Comparing industry supply with demand through research enables a precise alignment of these factors, enhances industry synergies, mitigates supply–demand disparities, and fosters the industry’s health within a state of equilibrium between supply and demand. Many studies have also recognized the importance of supply–demand coordination in industrial development and have conducted in-depth discussions on the development of the health industry from this perspective. Engel et al. [12] focus on the supply–demand gap and utilize survey results from participants in the Harvard Global Health Delivery Project to investigate the inconsistency between medical diagnostic demand and supply. Gopalan et al. [13] studied how fiscal incentives on the demand side influence the coordination of supply and demand in the healthcare industry in low- and middle-income countries. Govinda et al. [14] applied the theory of supply–demand coordination in management studies, analyzing the decision making associated with the healthcare supply chain and demand management after the outbreak of the 2019 coronavirus disease. Vidoli et al. [15] conducted a case study in Italy to examine the spatial alignment of demand and supply in the healthcare industry at the municipal level. Referring to the above studies, in establishing an evaluation index system for the development level of China’s health industry, we chose to conduct our study from the perspective of supply and demand. Based on this, we selected the supply–demand synergy degree in the health industry to determine the balance of development on both sides of the industry’s supply and demand; then, through the degree of the synergistic development of supply and demand in the health industry, we comprehensively considered the overall development level of the health industry.
3. Methods
3.1. Evaluation of Vague Value Calculation for Evaluation Data
3.1.1. Transformation of the Initial Vague Value of Evaluation Data
The development level of the health industry is influenced by many factors, such as society, environment, economy, ethnicity, and local culture, which are difficult to precisely calculate. Therefore, the assessment of the development level of the health industry presents a problem with apparent uncertainty, and it should be explored and understood using fuzzy set theory. The core purpose of fuzzy set theory is to describe two types of information, support and opposition, using the concept of a membership degree. However, in reality, it is common not only to have elements supporting and opposing fuzzy concepts but also to exhibit hesitancy between support and opposition. The vague set is an extension of the fuzzy set and introduces the concept of vagueness. A vague set is more flexible than a fuzzy set in dealing with uncertain and fuzzy information and is closer to reality in describing objective phenomena; hence, it is more widely used in the research process.
We draw on the latest research findings of Feng Weibing et al. [16] and improve the traditional vague set evaluation method using a similarity measurement approach based on inclusion relationships. The specific calculation steps are as follows: first, each single-value data point within all the collected evaluation indicators is denoted as , which represents the single-value data point for area in year and indicator , which is then transformed into an initial vague value data point. An initial vague set for the supply–demand evaluation is established as A, and the true membership function is defined as , which represents the lower bound of membership for the supporting evidence, while the false membership function is denoted as , which represents the lower bound of membership for the opposing evidence. For convenience, and are represented, respectively, as and , and the transformation formula for the initial vague value data is defined based on the nature of the indicators. Let , :
The transformation formula for the initial vague value data is:
In the formula, is typically set to 2.
At this point, the uncertainty of the initial vague set is denoted as :
3.1.2. Improvement of the Initial Vague Set Using Similarity Measurement Methods Based on Inclusion Relationships
Define , , and as the support, opposition, and uncertainty when considering the secondary evaluation, which is calculated as follows:
Then, the new vague set for the supply–demand evaluation is established as :
3.2. Selection of Positive and Negative Ideal Points in TOPSIS Based on the Entropy Weight of New Vague Values
The core of the TOPSIS (Technique for Order Preference by Similarity to Ideal Solution) method lies in the calculation of the weighted Euclidean distance between each solution and the positive and negative ideal values, using the degree to which each solution is close to the positive ideal value and far from the negative ideal value as the evaluation criterion. This evaluation method combined with the vague set can not only simultaneously express information regarding “support”, “opposition”, and “uncertainty” but can also determine the relative advantages of the evaluation objects based on the amount of relatively known and unknown information. We employed the entropy weight method to determine the indicator weights and, based on the calculated new vague set, identified the positive and negative ideal points in the TOPSIS method [17]. First, all the single-value data are standardized and denoted as :
Next, the utility value of the indicators is calculated, where represents the total number of regions in area , and represents the total number of time periods .
The weights for the supply and demand indicators are calculated separately based on the utility value [18], where the total number of supply and demand indicators is denoted as and , respectively. is used to represent the weights for the indicators:
Then, the corresponding fitness using the new vague value and the selected positive and negative ideal points is calculated accordingly. Let represent the fitness of individual i with respect to indicator j at different times t:
The supply of positive and negative ideal points can be represented as follows:
The demand for positive and negative ideal points can be represented as follows:
represents the corresponding vague value in the new vague set for , and represents the corresponding vague value within the new vague set for .
3.3. Calculating the Development Degree of Supply and Demand Based on the New Vague Set
Based on the selected positive and negative ideal points, the development status of the health industry’s supply and demand at different time points and the similarity to the positive and negative ideal points, denoted as and , is calculated using the following formula:
The similarity measurement formula for the new vague set’s singularity and the ideal point is as follows:
The calculation of the development degree of supply and demand is as follows:
where ∈ [0, 1], a higher value of indicates a greater similarity between the development status of the health industry’s supply and demand and the positive ideal point, implying a higher level of development.
Furthermore, the development degree of the entire health industry in the time period is denoted as Calculating based on the above formula results in the supply development degree being denoted as and the demand development degree being denoted as , with the calculation of as follows:
Due to practical significance, an equal weight of 0.5 is assigned to both supply and demand, where .
3.4. Calculation of the Correlation between the Development of the Health Industry Supply and Demand
Based on the development of the health industry supply and demand and referring to the calculation method used by Luo et al. [19], the grey relative correlation and grey absolute correlation between the two are calculated to study the interaction and impact between health supply and demand. First, the absolute correlation is calculated: organize the development degree sequences of supply and demand, with the supply development degree denoted as and the demand development degree denoted as , and zeroize the initial sequence:
Organize the zeroed sequence of supply development degree as and the zeroed sequence of demand development degree as .
Calculate the absolute value of the difference between and .
The grey relative correlation between supply and demand is as follows:
ranges from 0 to 1, with a higher value indicating a higher degree of correlation, and a lower value indicating a lower degree of correlation.
Next, calculate the relative correlation. Use the following formula to transform the initial sequence:
After reorganizing, the transformed sequences of supply and demand development degrees are denoted as and , respectively:
The grey relative correlation between supply and demand is as follows:
represents the degree of correlation of the supply and demand change rate, with a value ranging from 0 to 1. A higher value indicates that the change rate between the supply and demand is closer.
Finally, calculate the grey comprehensive correlation:
The grey comprehensive correlation comprehensively represents the degree of correlation between supply and demand in the health industry. In this article, θ = 0.5 is used to indicate equal attention to absolute quantity and change rate.
3.5. Calculation of the Synergy and Synergistic Development Degree of the Health Industry Supply and Demand
The distance coordination model is adopted to measure the synergy and synergistic development degree of the health industry; essentially, it measures the coordination of the system by measuring the Euclidean distance between the actual development status and the ideal status of supply and demand. By calculating the development degrees and based on Equation (11), which computes the distances between supply and demAand and their positive and negative ideal points, we consider the interaction between the supply and demand in the industry and calculate the coupling development degree of the health industry supply and demand, denoted as and , respectively:
Calculate the synergy degree of the health industry’s supply and demand:
Finally, calculate the synergistic development degree of the health industry’s supply and demand:
3.6. Analysis of the Synergy and Synergistic Development Degree of the Health Industry Supply and Demand
3.6.1. ArcGIS
With the cross-integration of economics with other disciplines such as environmental economics and urban economics, there is an increasing demand for geographic information. ArcGIS can integrate economic data with geographic location information, thereby analyzing economic phenomena more comprehensively. This paper utilizes ArcGIS version 10.2 to express the spatial distribution of the synergy and development degree of the health industry by geographic region, thereby visually depicting the differences and connections between different regions more intuitively.
3.6.2. Kernel Density Estimation Analysis
The kernel density estimation method is a research approach that studies the distribution characteristics of data using the data themselves, overcoming the subjectivity issue of function form setting in parameter estimation and exhibiting strong robustness. This paper employs the kernel density estimation method [20], following the methods of Terrell and Scott, to examine the spatial distribution of the level of synergistic development in the health industry during the sample period. The basic functional form of kernel density estimation is as follows:
In Equations (26) and (27), represents the number of observations, denotes independently and identically distributed observations, namely the synergistic development degree of supply and demand for the health industry. is the kernel density function; this paper uses the Gaussian kernel density function. represents the optimal bandwidth, which is determined using the “rule of thumb”.
3.6.3. Dagum Gini Coefficient
This paper introduces Dagum’s Gini coefficient theory to decompose the spatial differences in the development level of the health industry, exploring regional disparities and their sources. The specific decomposition method refers to the study by Dagum [21].
4. Indicator System Construction and Data Sources
We select several indicators to assess the development levels of both supply and demand in the health industry, constructing evaluation index systems for the development of health industry supply and demand, respectively. The evaluation indicator system for health industry supply development is constructed based on the “Health Industry Classification (2019)”, published by the National Bureau of Statistics. Considering data availability, 12 major categories comprising a total of 35 indicators are selected to measure the development level of health industry supply, as shown in Table 1.

Table 1.
Evaluation index system and weights for the development of the health industry supply.
The evaluation indicator system for health industry demand development is constructed from the perspectives of the consumption capacity and consumption potential of the health industry. Consumption capacity includes residents’ expenditure, expenditure by enterprises and social organizations, government expenditure, and imports and exports. Consumption potential includes income, population, and consumption preferences. A total of 7 categories comprising 18 indicators were selected to measure the development level of health industry demand, as shown in Table 2.
Table 2.
Evaluation index system and weights for the development of the health industry demand.
Based on the construction of the indicator system, we selected panel data from 31 provinces (autonomous regions and municipalities directly under the Central Government) of China from 2013 to 2021 as research samples. Considering the accessibility of data, Taiwan, Hong Kong, and Macau were excluded. The data for this study mainly come from the “China Health and Health Statistical Yearbook”, “China High-tech Industry Statistical Yearbook”, and “China Statistical Yearbook”, with some data sourced from the National Economic and Social Development Statistical Bulletin, provincial statistical yearbooks, and the website of the National Bureau of Statistics (The above data can be obtained from the following websites: Various statistical yearbooks are from the EPS data platform: https://www.epsnet.com.cn/ (accessed on 1 September 2022) and the National Bureau of Statistics website: http://www.stats.gov.cn/ (accessed on 1 September 2022); National Economic and Social Development Statistical Bulletin data are from the National Development and Reform Commission website: http://www.ndrc.gov.cn/ (accessed on 1 September 2022)). The original data were processed as follows. To ensure the integrity of the data, interpolation was used to estimate individual missing data; some proportion data (such as the proportion of health industry exports to GDP and the proportion of traditional Chinese medicine planting area to total arable land area of crops, etc.) were calculated using original data.
5. Analysis of the Level of Synergy and Synergistic Development of Supply and Demand in the Chinese Health Industry
5.1. Evolutionary Characteristics of the Supply and Demand Development Level of the Health Industry
Based on Equations (1)–(13), this paper calculates the supply and demand development level of the health industry in various regions and divides the 31 provinces (autonomous regions and municipalities directly under the central government) into 4 major economic zones: the eastern, central, western, and northeastern regions. (The eastern region includes Beijing, Tianjin, Hebei, Shanghai, Jiangsu, Zhejiang, Fujian, Shandong, Guangdong, and Hainan. The central region includes Shanxi, Anhui, Jiangxi, Henan, Hubei, and Hunan. The western region includes Inner Mongolia, Guangxi, Chongqing, Sichuan, Guizhou, Yunnan, Shaanxi, Gansu, Qinghai, Ningxia, Xinjiang, and Tibet. The northeastern region includes Liaoning, Jilin, and Heilongjiang). Thus, the changing trends of the supply and demand development levels of the health industry in each region are illustrated, as shown in Figure 1.
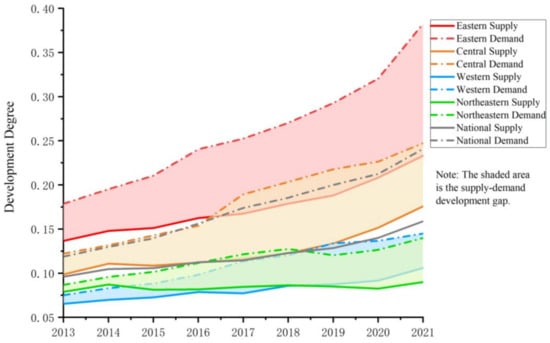
Figure 1.
Trend chart of the development of supply and demand in the health industry from 2013 to 2021.
From the perspective of supply development, the supply development level of China’s health industry shows a trend of low-level steady growth and widening regional disparities year by year. Overall analysis shows that the supply level of China’s health industry is relatively low. Although the average supply development index has steadily increased from 0.0961 in 2013 to 0.1589 in 2021, it has not yet reached 0.2. Analysis of the original data reveals significant structural disparities in the supply of health industry. The increase in the number of elderly care beds, the development of health education, the growth of medical and pharmaceutical patents, and the number of doctors has exceeded 500%, far outpacing other sectors. Meanwhile, the growth of other indicators remains relatively stable, indicating that the aging population and the increasing health awareness among residents have influenced the internal structure of healthcare industry development. A comparative analysis of the regional differences shows that the supply development index is highest in the eastern region, followed by the central region, and then by the western region and northeastern region, which have similar development levels. Since 2019, the supply development index in the northeastern region has consistently been slightly lower than that in the western region and has been the lowest among the four major economic regions. The supply development index of the health industry in various regions of China is showing a trend of widening disparities year by year. The gap in the supply development index between the eastern region and the northeastern region has increased from 0.0577 in 2013 to 0.1431 in 2021, a growth of 148.25%.
In terms of the degree of demand development, the demand development level of China’s health industry is also at a relatively low level, but the growth rate is fast, and there is a significant regional development imbalance phenomenon. The average development degree of demand in the health industry has rapidly increased at an average annual rate of 9.27%, from 0.1188 in 2013 to 0.2409 in 2021, an increase of 102.76%. A comparative analysis of the original data reveals that the indicators showing the greatest growth on the demand side of the health industry are the export value of the health industry, the number of participants in medical insurance, total health expenditure, and government budgetary health expenditure. This indicates that the demand for the health industry has been strengthened in various aspects, possibly due to factors such as changes in population structure, advancements in medical technology, and government policy support. This also reflects the increasing importance people place on health and medical care, indicating that the outlook for the development of the health industry is promising. However, while the demand for the health industry is rapidly developing, the gap in demand development degree between regions is also rapidly widening. The gap between the eastern and northeastern regions increased from 0.0919 in 2013 to 0.2427 in 2021, an increase of 164.25%. This exacerbates the regional imbalance in the development level of demand for the health industry. Currently, the development level of demand for the health industry shows the highest level in the eastern region, followed by the central region, and the lowest level in the western and northeastern regions. In 2021, the demand development degree in the eastern region had reached 2.73 times that of the northeastern region.
Combining the analysis of supply and demand development, the health industry in China is in a state of “supply shortage”, and the gap in the level of supply and demand development has been widening year by year. During the period from 2013 to 2021, the development degree of supply in various regions was lower than that of demand. According to the calculation of the gap in the level of supply and demand development in the average health industry in China, the difference was only 0.0227 in 2013, while it had reached 0.0820 in 2021. Moreover, the average annual growth rate of demand over the eight years was 12.85%, while supply was only 8.17%, which will further widen the gap between supply and demand in the future. By analyzing the gap in supply and demand between regions, it was found that the regions with higher levels of health industry development also have larger gaps in supply and demand development. Ranking regions according to the difference in supply and demand development degree in 2021 from high to low, they are, respectively, the eastern, central, northeastern, and western regions, with differences of 0.1495, 0.0715, 0.0499, and 0.0390. It can be seen that although the overall scale of the health industry continues to expand, the problem of imbalance in supply and demand development is becoming more serious. The promotion of the synergistic development of supply and demand in the health industry is an urgent issue that needs to be addressed.
5.2. Grey Comprehensive Correlation and Coupling Development Degree between Supply and Demand in the Health Industry
Using Formulas (14)–(22), the grey comprehensive correlation between supply and demand in the health industry from 2013 to 2021 was calculated overall, and the results are shown in Table 3.
Table 3.
2013–2021 grey comprehensive correlation between supply and demand in the health industry in China.
Overall, the grey comprehensive correlation between the supply and demand of the health industry in various provinces and regions of China is relatively high, with the correlation level in each region averaging above 0.80, and 22 provinces and regions have a grey comprehensive correlation above 0.9, indicating that there is a significant interaction between the supply and demand of the health industry. Based on this, the degree of coupling development between the supply and demand of the health industry is calculated using Equation (23), and the results are shown in Table 4.
Table 4.
Coupling development degree of supply and demand in the health industry in China from 2013 to 2021.
Compared to unilateral development degrees, the coupling development degree can portray the development of supply and demand while considering their interaction in the health industry. By analyzing the data in Table 4 and comparing them with those in Figure 1, three conclusions can be drawn.
After coupling, the degree of supply and demand development in the health industry shows a convergence trend, and the gap in the level of supply and demand development narrows. Due to the relatively increased level of supply development and the relatively decreased level of demand development in the health industry after coupling, the gap between supply and demand in various regions has been significantly reduced. Taking the year 2021 as an example, the national average gap between supply and demand in the health industry before coupling was 0.0820, which reduced to 0.0035 after coupling. Due to the significant reduction in the gap in the degree of supply and demand development after coupling, the development trend of the coupling degree between supply and demand showed a high degree of synchronicity, indicating the obvious mutual constraint and driving the relationship between supply and demand in the Chinese health industry.
After coupling, the degree of supply and demand development in the health industry still shows a “supply shortage” situation, and the backward development level on the supply side has a greater hindering effect on industry development. Although the gap in the degree of supply and demand development after coupling is significantly smaller than before coupling, the health industry still maintains a “supply shortage” status on both sides, and the gap between supply and demand continues to widen year by year. Further analysis of the changes in the development levels of supply and demand on both sides of the health industry before and after coupling reveals that the magnitude of the increase in supply level after coupling is smaller than that of the demand level, indicating that the hindrance of demand development in the health industry by supply is greater than the effort to promote supply development from the demand side of the health industry. It can be seen that the lag in supply-side development is an urgent issue that needs to be addressed in the development of the Chinese health industry.
After coupling, the regional differences in the degree of supply and demand development in the health industry continue to increase year by year. Due to the convergence effect of the coupling between supply and demand on the degree of development, the regional differences in supply and demand development are also somewhat reduced when the coupling effect is not considered. However, the gap in supply and demand levels between regions still maintains a trend of increasing year by year after coupling. In addition, the gap in the level of supply and demand development in the health industry after coupling still shows the highest distribution pattern in the east, followed by the central region, and the lowest distribution pattern in the western and northeastern regions, which is consistent with the distribution status before coupling.
5.3. Health Industry Supply–Demand Synergy Degree and Supply–Demand Synergistic Development Degree
5.3.1. Calculation of Supply–Demand Synergy Degree and Supply–Demand Synergistic Development Degree
The health industry supply–demand synergy degree and supply–demand synergistic development degree between 2013 and 2021 in each province (autonomous region and municipality directly under the Central Government) were calculated based on Formulas (24) and (25). The supply–demand synergy degree reflects the level of synergy in the development of health industry supply and demand, and the supply–demand synergistic development degree reflects the overall development level of the industry under the influence of the synergy level of health industry supply and demand. Table 5 shows the calculation results for some of the years.
Table 5.
Supply and demand synergy degree and synergistic development degree of the health industry.
The degree of synergistic development between supply and demand in the health industry is far lower than the degree of synergy between supply and demand; yet, as the level of industry development gradually increases, the degree of synergy decreases. The reason lies in the fact that although the overall development level of the health industry in various regions has been continuously improving in recent years, the gap in the supply and demand development levels has widened with the development of the industry, and the speed of overall development growth lags behind the speed at which the gap in supply and demand widens. The problem of “supply exceeding demand” is becoming increasingly serious, leading to a downward trend in the synergy between supply and demand. It is worth noting that, by combining the supply development degree not exceeding 0.24 and the demand development degree not exceeding 0.39 of the health industry in various regions, although there is a gap in the development of supply and demand in the health industry, the development degrees are both relatively low. Therefore, it is on the basis of low-level development on both the supply and demand sides that a higher composite synergy degree between supply and demand in the health industry is achieved. It can be seen that the development of China’s health industry not only needs to address the increasingly serious imbalance between supply and demand but also needs to improve the overall development level of the industry to break out of the development dilemma of “high coordination and low growth”. There is still a lot of room for improvement in the development of the health industry.
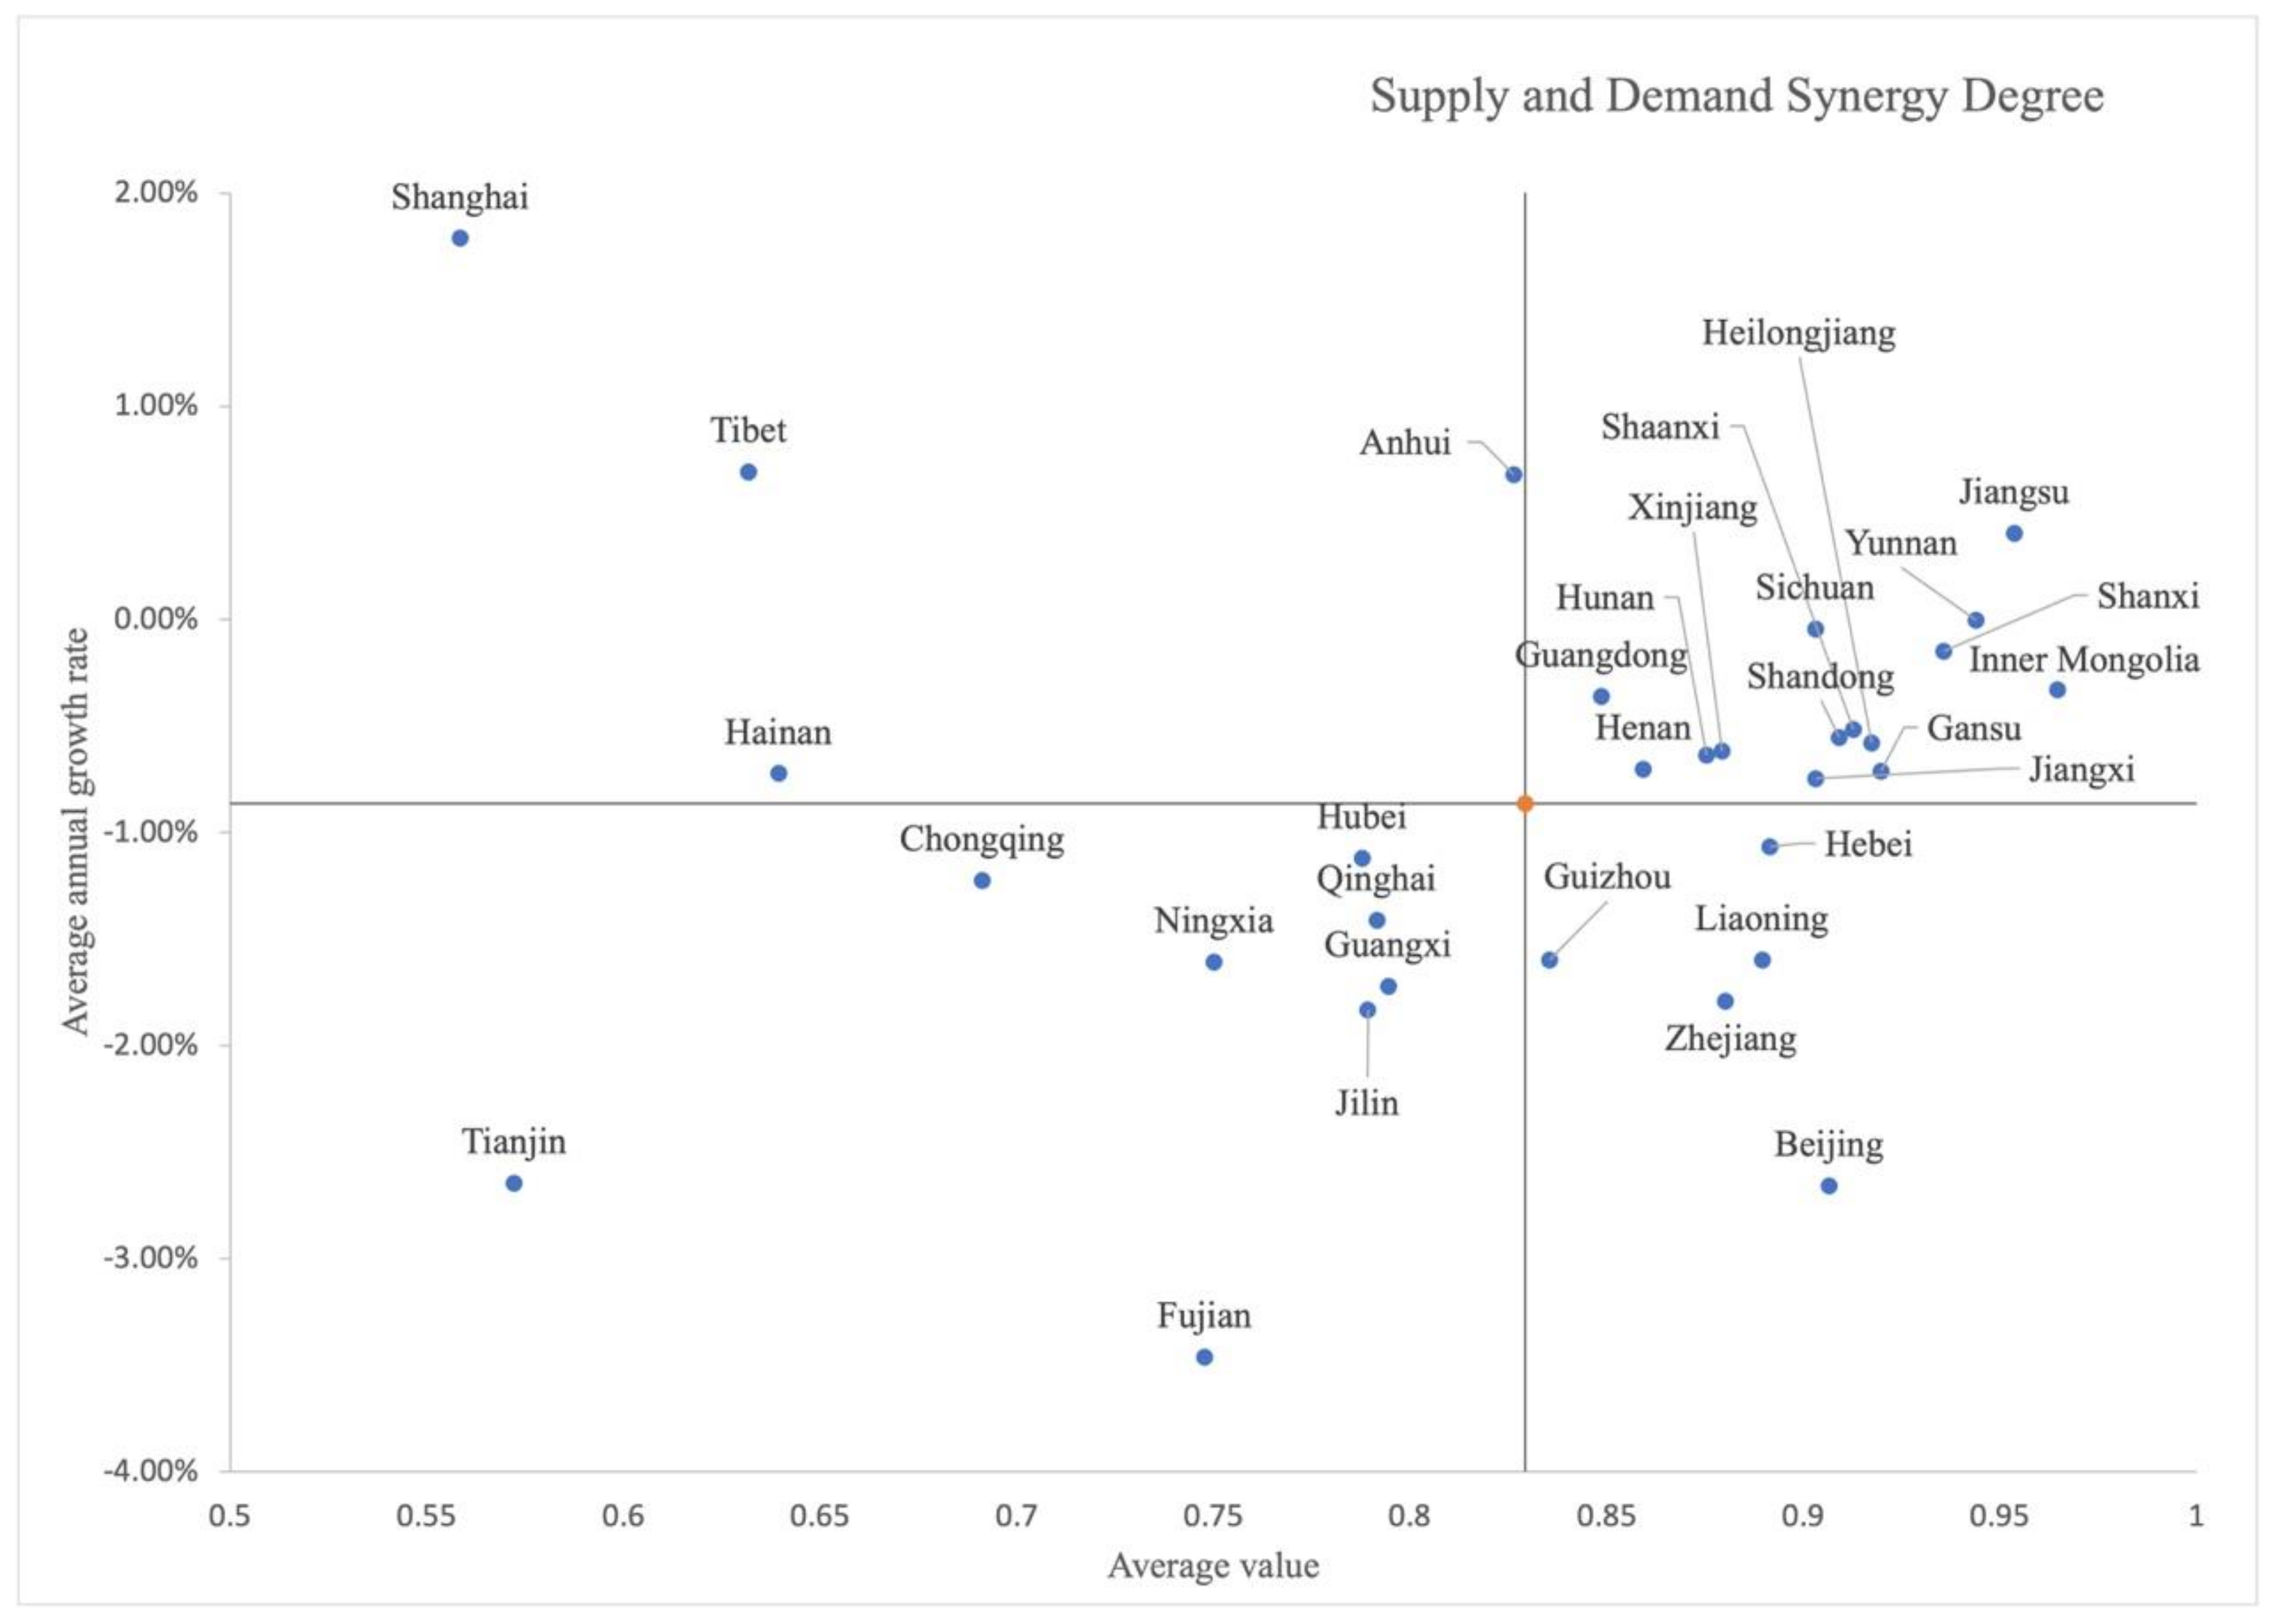
A further examination of the development status of the health industry in various provinces and regions was conducted. Using the two indicators of mean value and annual average growth rate for analysis, the four quadrants were divided based on the national average level; they were high level–high growth, low level–high growth, low level–low growth, and high level–low growth (Figure 2 and Figure 3). Regarding the analysis of supply–demand synergy, most provinces are located in the first and third quadrants, indicating that regions with high supply–demand synergy can still resist the trend of decline during the industrial development process, while regions with low synergy decline more rapidly, with the gap between the two widening over time, showing the “Matthew effect” of “the strong get stronger, the weak get weaker”; Hainan, Tibet, Anhui, and Shanghai are located in the second quadrant, indicating that although their overall synergy level is lower than the national average, their decline rate is slower; Hebei, Guizhou, Liaoning, Zhejiang, and Beijing are located in the fourth quadrant, where the industrial supply–demand synergy level is relatively high, but the trend of declining synergy is also more pronounced.
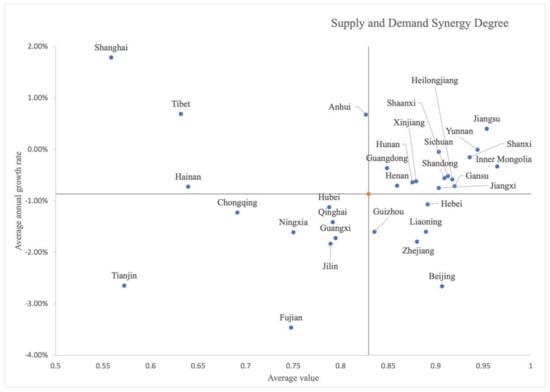
Figure 2.
Average level and annual growth rate of supply–demand synergy degree in the health industry.
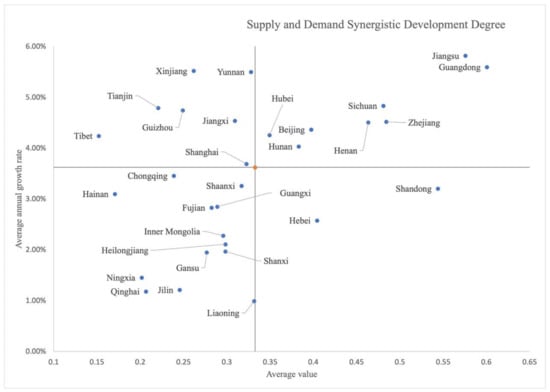
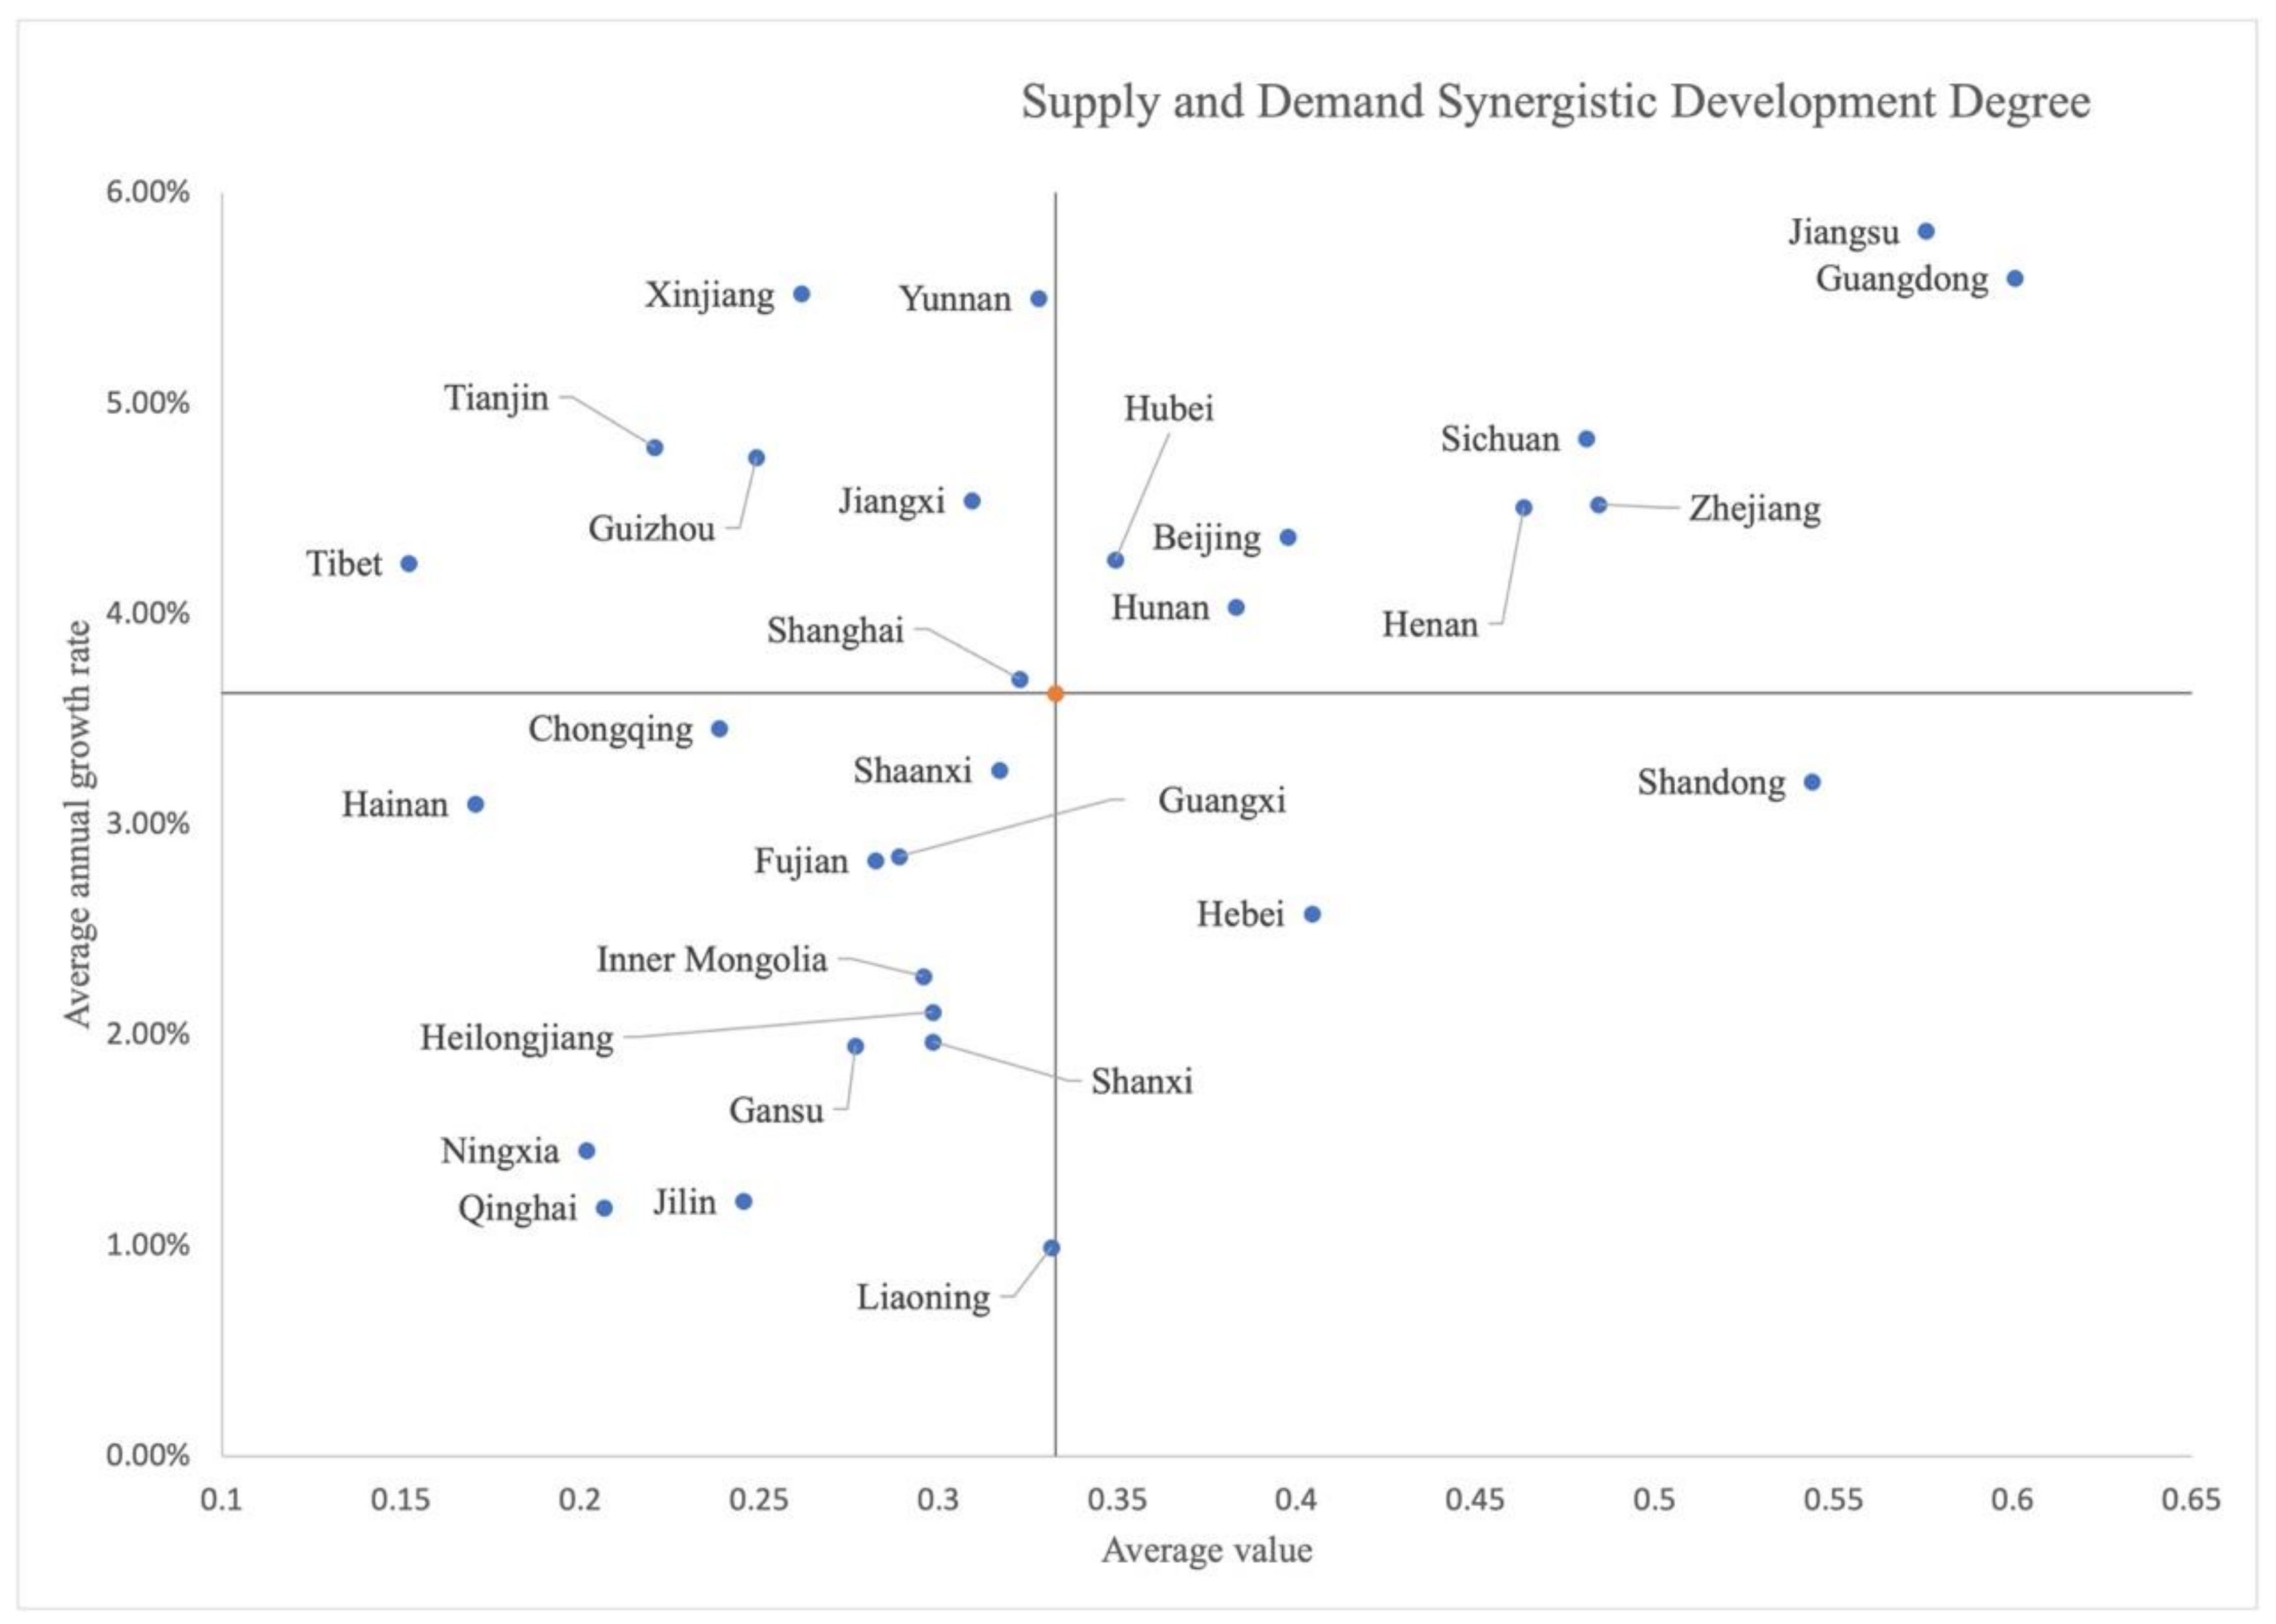
Figure 3.
Average level and annual growth rate of supply–demand synergistic development in the health industry.
Regarding the analysis of supply–demand synergy development, Jiangsu, Guangdong, Zhejiang, and other regions located in the first quadrant have a good momentum in the development of the health industry, ranking at the forefront in both overall strength and growth rate and maintaining advantages; Yunnan, Xinjiang, Guizhou, and other regions are located in the second quadrant, indicating that although their overall level is lower than the national average, the growth rate of the health industry is relatively fast; most regions are located in the third quadrant, indicating that the Chinese health industry is still in an emerging growth stage with a low level and low growth rate, with enormous future development potential; Shandong and Hebei, located in the fourth quadrant, have strong development capabilities in the health industry, and after experiencing rapid growth, they have entered a stable development stage of improving quality and efficiency.
5.3.2. Spatial–Temporal Distribution of Supply–Demand Synergy and Supply–Demand Synergy Development
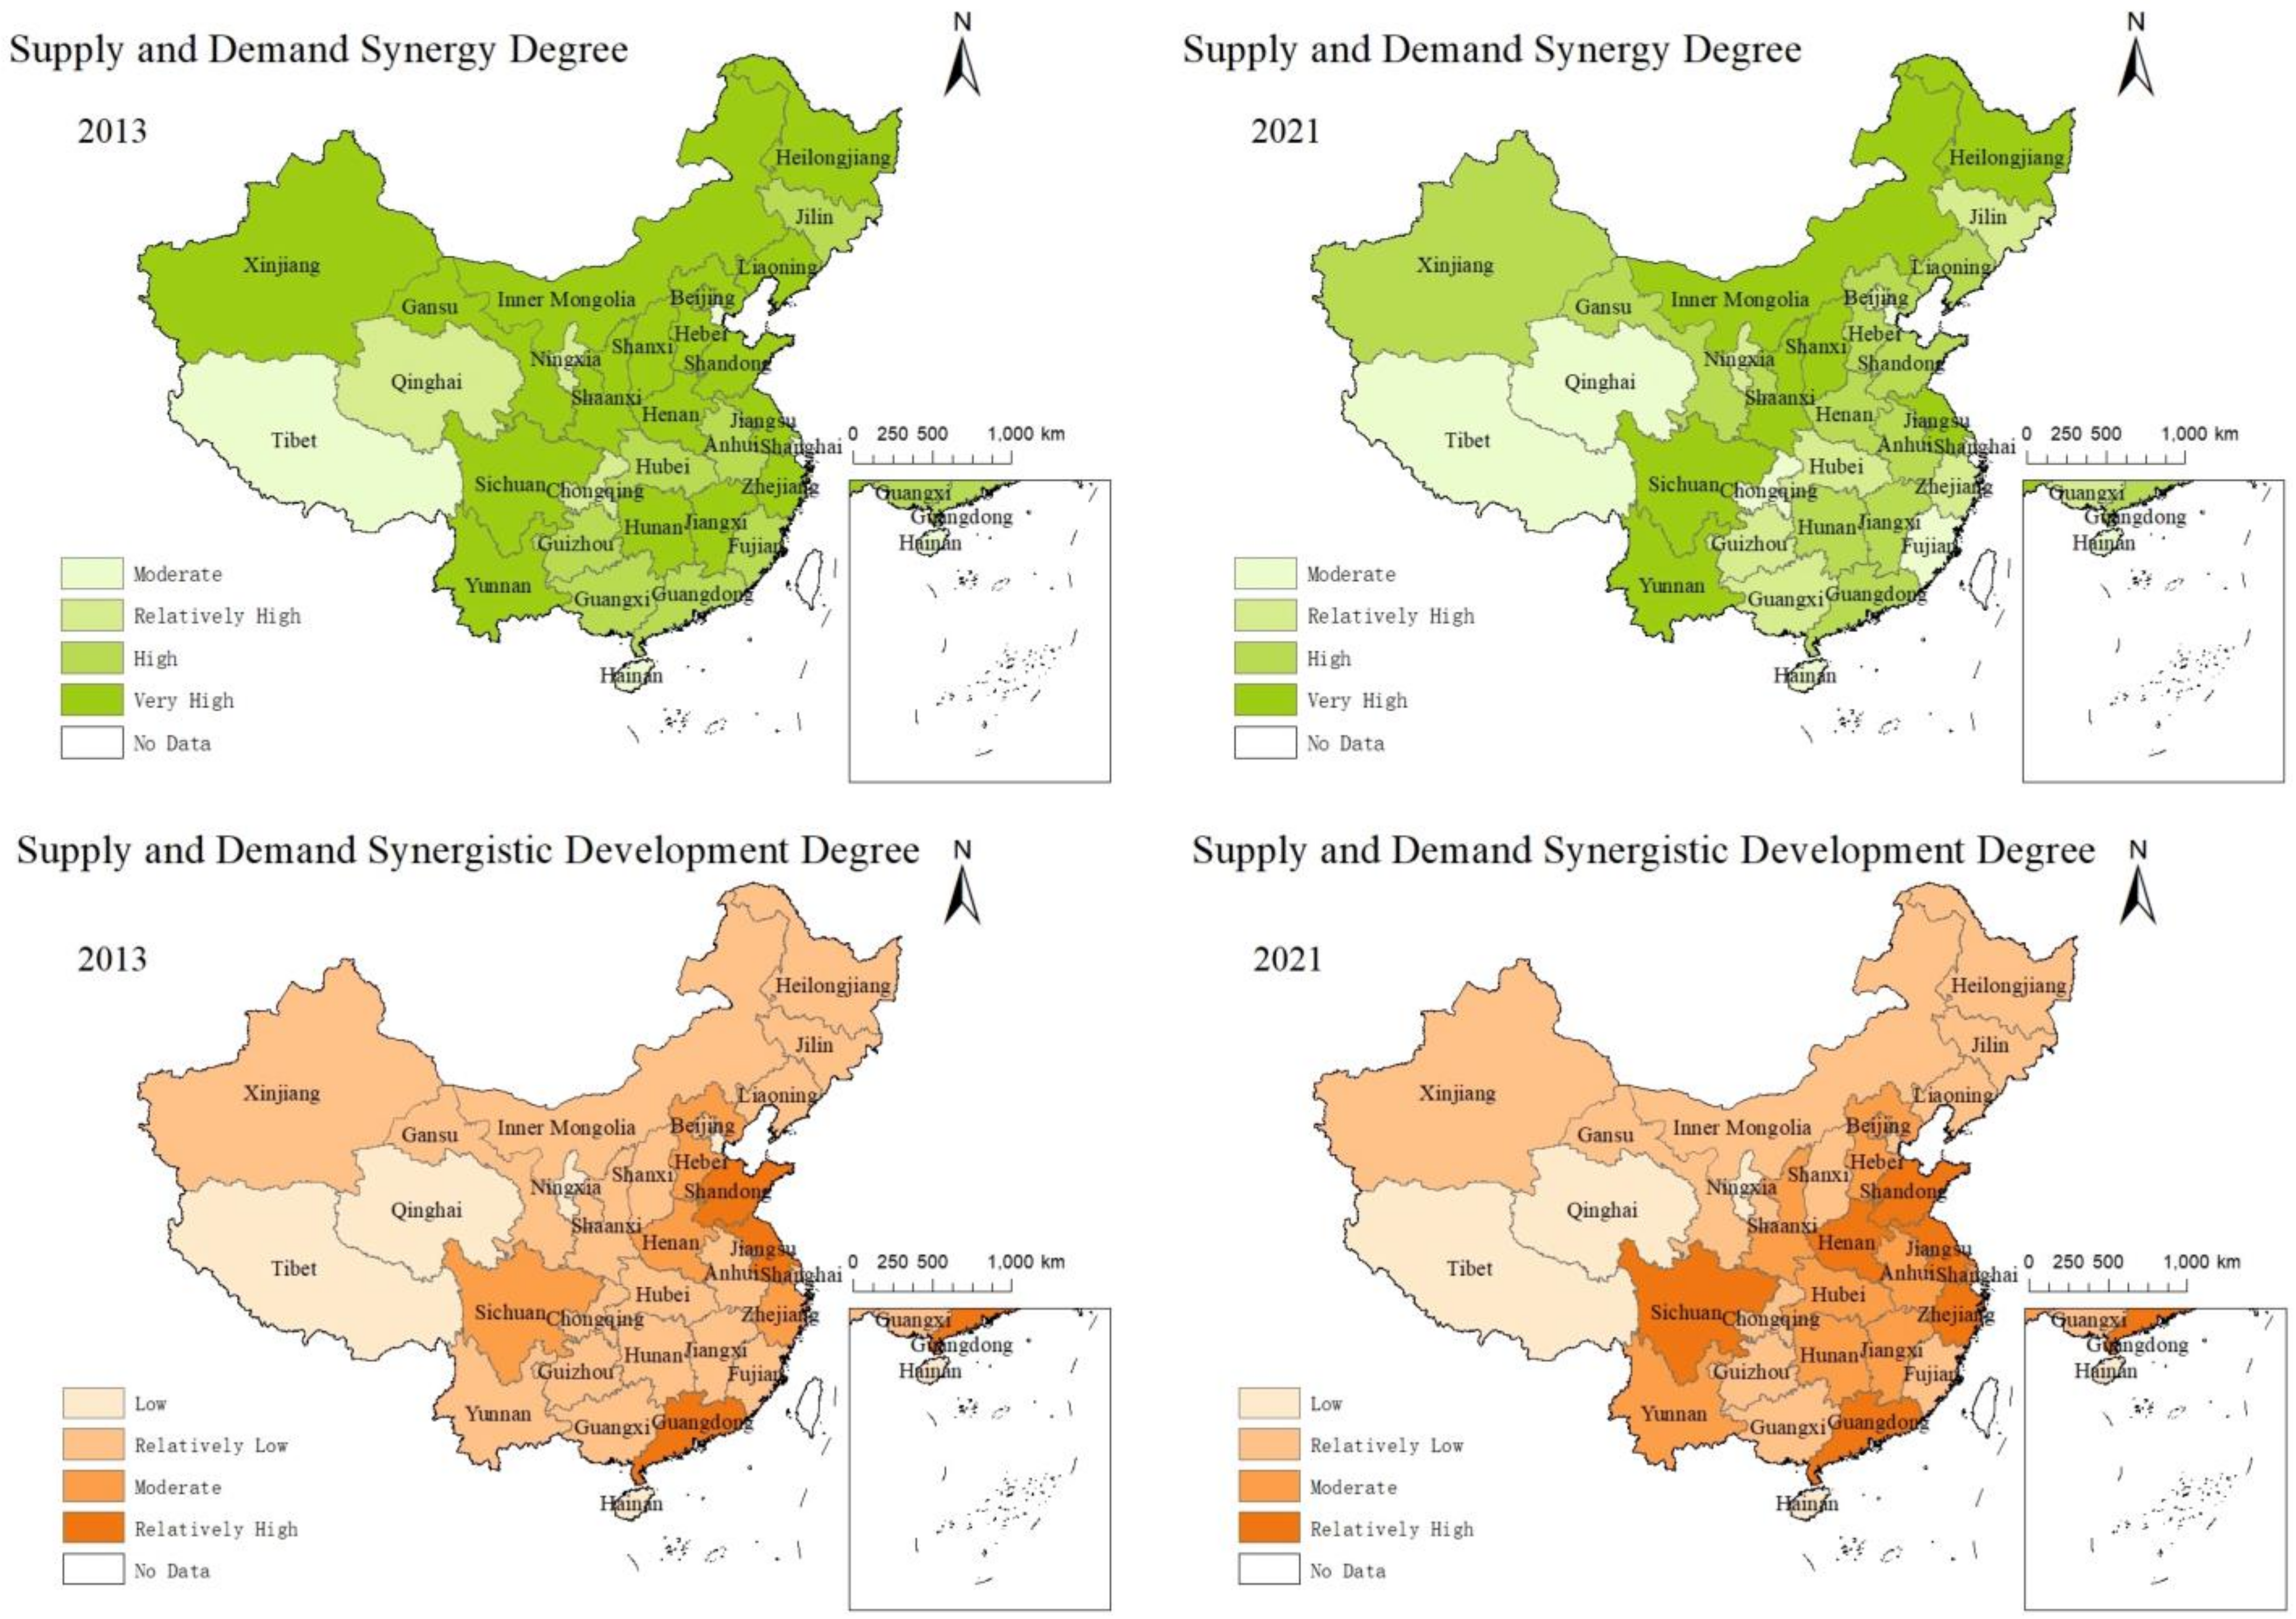
Based on Table 5, the supply–demand synergy and supply–demand synergistic development values of the health industry in various provinces (autonomous regions and municipalities directly under the central government) of China are calculated. Using data from 2021 as the baseline, and referring to the results of the natural break method for grouping, the level of synergy is divided into a moderate level (value lower than 0.6419), a relatively high level (value between 0.6419 and 0.8041), a high level (value between 0.8041 and 0.8987), and an extremely high level (value higher than 0.8987); the level of development is divided into a low level (value lower than 0.2041), a relatively low level (value between 0.2041 and 0.3445), a moderate level (value between 0.3445 and 0.4585), and a relatively high level (value higher than 0.4585). Selecting data from the years 2013 and 2021 as representatives, the distribution map of the composite supply–demand synergy and development degree of the health industry in China’s provinces is drawn using ArcGIS software 10.2 (Figure 4 is drawn based on the standard map of the Ministry of Natural Resources Map Technical Review Center (Review Number GS(2022)1873), and the boundaries of the base map remain unaltered) (Figure 4).

Figure 4.
Spatial–temporal distribution of supply–demand synergy and supply–demand synergistic development.
From 2013 to 2021, the overall synergy between supply and demand in the health industry presented a distribution pattern of “high in the middle, low in the east and west”. The eastern region had relatively low synergy between supply and demand; although its levels of supply and demand development were relatively high, the gap between its supply and demand development levels was the largest, and the imbalance in supply and demand was greater than the degree of development, resulting in its relatively low synergy. Conversely, the central region had smaller gaps between supply and demand compared to other regions with similar levels of development, thus showing higher synergy during the observation period. The western region showed the most stable synergy between supply and demand; although there was a decrease in synergy during the observation period, the fluctuation amplitude was smaller compared to other regions; however, its synergy between supply and demand was also relatively low. The northeastern region experienced the most significant overall decline in synergy between supply and demand. In combination with Table 5, it can be seen that the synergy level of the health industry between supply and demand in the northeastern region was the highest among the four major economic regions in 2013, but by 2021, the synergy had decreased by 10.53%, while the other three regions only averaged a decrease of 6.38%.
From 2013 to 2021, the level of synergistic development of supply and demand in the health industry showed a distribution pattern of “high in the east and south, low in the west and north”. In combination with data from Table 5, it can be seen that during the observation period, the levels of health industry development in the eastern, central, and western regions all showed significant improvement, with an average growth of 32.44% in the three regions. In contrast, the level of development in the northeastern region not only ranked the lowest among the four major economic regions, but also only increased by 11.42%. In combination with Table 5, it can be seen that the provinces with the slowest growth in composite synergy development between supply and demand in the health industry from 2013 to 2021 were Liaoning (7.96%), Qinghai (9.44%), and Jilin (9.69%); all except Qinghai belong to the northeastern region; thus, northeastern region ranks lower in the synergy development of the health industry between supply and demand. It is worth noting that compared with the synergy between supply and demand in the health industry, the level of industrial development in each region is not higher than 0.5, indicating a low level of development. Each region should implement corresponding measures to promote the synergy between supply and demand in the health industry, and the northeastern region should pay more attention to the development issues of the health industry.
5.3.3. Analysis of the Core Density of Health Industry Development
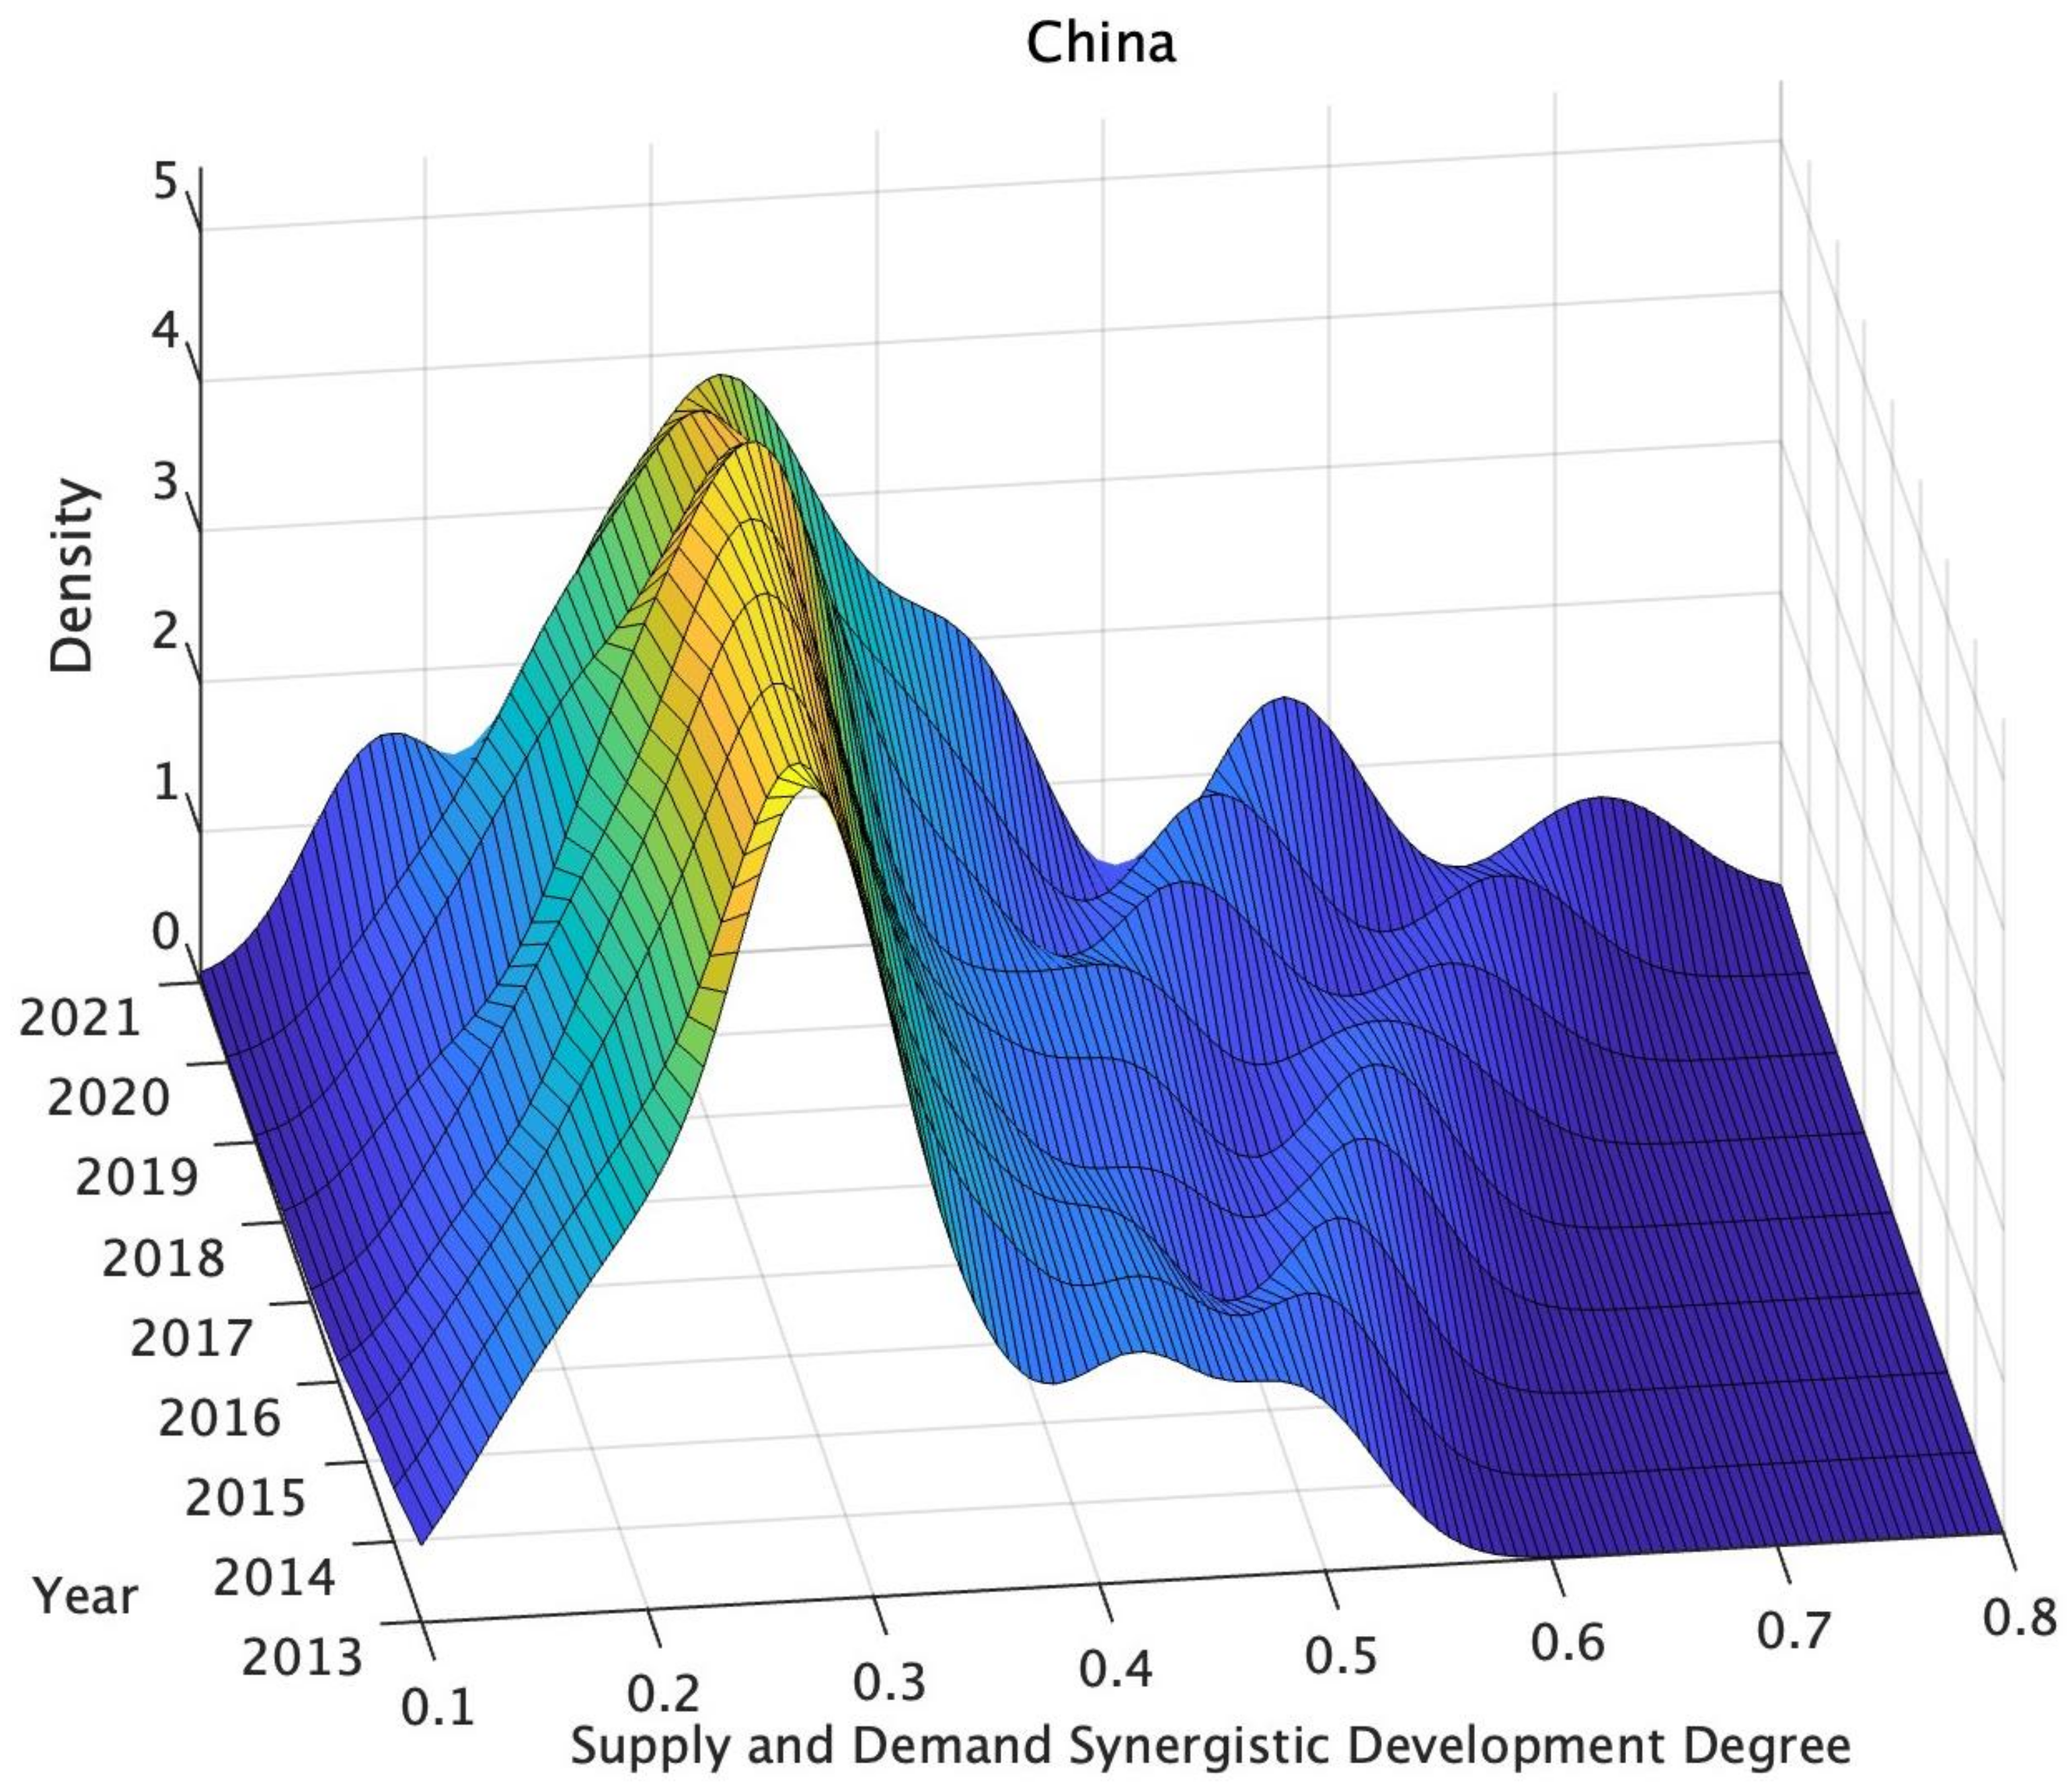
Based on the calculated degree of supply–demand synergistic development in the health industry, this study adopts the kernel density estimation method to investigate the dynamic evolution of the distribution of the health industry development levels during the sample period.
Observed from a national perspective (Figure 5), the center of gravity of the kernel density curve of the health industry development is generally left-skewed, with a noticeable phenomenon of “low-side peaks”, where high-value areas are scarce and low-value areas are abundant. The increasing number of peaks indicates a trend of increasing dispersion in the level of health industry development across regions during the sample period. In the observed low-value areas, the main peak height does not show a significant downward trend, confirming the overall low level of China’s health industry development. In the observed high-value areas, the gradually emerging peaks indicate that the level of health industry development in some provinces is higher than in other domestic provinces and that their development speed is rapid.

Figure 5.
Density curve of supply–demand synergistic development degree of China’s health industry from 2013 to 2021.
The dynamic evolution characteristics of kernel density in the four major economic regions (Figure 6) were analyzed. (1) Eastern Region: Compared with the number of peaks in other regions, the eastern region shows a more obvious multipeak pattern, indicating a significant trend of polarization in the development level of the health industry in the eastern region. (2) Central Region: During the sample period, the kernel density curve of the central region shows a significant bimodal phenomenon, and the two peaks gradually shift towards the high-value area, indicating the existence of polarization in the development level of the health industry in the central region. Although the regional development level generally improves, the gap between extreme values and the average value within the region has not gradually narrowed. (3) Western Region: In a similar manner to the central region, the western region also exhibits a significant bimodal phenomenon, and the distance between the main peak and the side peak increases year by year. The polarization characteristics tend to strengthen overall, and the degree of differentiation within the region gradually increases. (4) Northeastern Region: The development level of the health industry in the northeastern region is relatively low. Compared with other economic regions of China, the kernel density curve distribution in the northeastern region during the sample period is the most concentrated, and the height increases year by year, with the smallest development gap within the region.
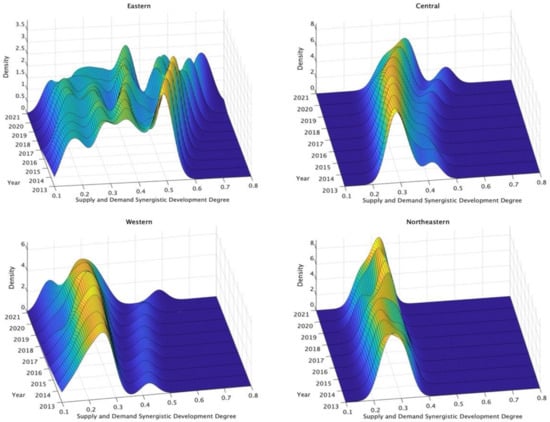
Figure 6.
Density curve of supply–demand synergistic development degree of China’s health industry from 2013 to 2021 (four major economic zones).
5.3.4. Analysis of Spatial Differences and Sources Decomposition of the Development Level of the Health Industry
Based on the calculated synergy of supply and demand in the health industry, this paper employs Gini coefficient calculation and the decomposition method to study the regional differences and their sources in the development of the health industry. The calculation and decomposition results of the Gini coefficient of the synergy between supply and demand in the health industry are shown in Table 6.
Table 6.
Spatial differences and sources decomposition of the development level of the health industry from 2013 to 2021.
Overall, the Gini coefficient of the development of the health industry shows an increasing trend during the sample period, indicating that the inter-provincial gap in the development of the health industry continues to widen without showing a trend of convergence. In terms of contribution rate, regional differences are the main source of inter-provincial differences in the development of the health industry in China, indicating that regional disparities are the main problem restricting the synergy between supply and demand in the Chinese health industry. The contribution rates of super-variable density differences and intra-regional differences are particularly stable, and both have been maintained at around 25% for a long time.
Further analysis of the Gini coefficient in each region reveals the following. Firstly, except for the northeastern region, the intra-regional differences generally show an increasing trend. The eastern and central regions exhibit relatively small fluctuations in intra-regional differences, while the western region experiences a rapid increase in intra-regional differences, and the northeastern region undergoes a sharp decline in intra-regional differences. This aligns with the conclusions drawn from the previous kernel density analysis, indicating that during the sample period, the western region tends to strengthen its polarization in development, while the development level in the three northeastern provinces is generally low, with the smallest regional differences. Secondly, in terms of inter-regional differences, the disparity between the eastern and western regions is the largest, followed by the difference between the eastern and northeastern regions, indicating that the development level of the health industry in the eastern region significantly surpasses that of the whole country, leading to a development gap with other regions. The levels of difference between the eastern and central regions, the northeastern and central regions, and the northeastern and western regions only show slight fluctuations during the study period, while the development gap between the central and western regions experiences a leapfrog increase. In combination with Table 5, it can be observed that the gap in the synergy of supply and demand in the health industry between the central and western regions increased by 55.21% during the study period. While the central region significantly outperforms the western region in terms of the foundation of health industry development, its development speed is also faster, leading to a gradual widening of the gap between the two.
6. Conclusions and Discussion
6.1. Conclusions
Based on the perspective of supply and demand, this study constructs a model of synergistic development of supply and demand in the health industry, and empirically analyzes the development status, degree of synergy, and level of synergistic development of supply and demand in the Chinese health industry from 2013 to 2021. The main research conclusions are as follows:
- (1)
- The level of development of China’s health industry supply and demand is relatively low, and the phenomenon of supply not meeting demand is becoming increasingly serious. The supply growth rate is slow, while the demand growth rate is fast, leading to significant regional development disparities. By independently analyzing the development status of both the supply and demand sides of the health industry during the study period, China’s health industry exhibited steady growth on the supply side and rapid development on the demand side, but the overall level of supply and demand development was low, with significant regional disparities. The level of supply development both before and after coupling generally lagged behind the level of demand development, and the gap between supply and demand widened year by year with the development of the industry.
- (2)
- The level of synergy between supply and demand in the health industry is relatively high, but it has been decreasing year by year, while the degree of synergistic development continues to grow, albeit at a low level. However, the high level of synergy in the industry is based on low levels of supply and demand. The overall synergy between supply and demand presents a distribution pattern of “high in the middle, low in the east and west,” and there is a solidified hierarchical development situation of “the higher get higher, the lower get lower.” The level of synergistic development in the health industry decreases from southeast to northwest, and as a “sunrise industry” in its rising phase, the synergy between supply and demand in most provinces still remains at a low level with low growth rates.
- (3)
- The spatial distribution of the health industry development is uneven, and regional disparities are increasingly widening. The number of peaks in the kernel density curve shows an increasing trend year by year, indicating that the differences between the provinces within the region are gradually expanding and that the level of dispersion is strengthening. The calculation and decomposition results of the Dagum Gini coefficient indicate that the overall difference in the development of the health industry is expanding nationwide, with regional disparities being the main source of the overall difference, while intra-regional differences and ultra-density variations contribute relatively less to the overall difference.
6.2. Theoretical Contribution
The results of this study offer several noteworthy theoretical contributions. Firstly, we explicitly defined and delineated the Chinese health industry as the focus of our study and constructed an evaluation index system based on the statistical classifications provided by the National Bureau of Statistics of China; this system holds a certain value for the advancement of the research on the Chinese health industry. Furthermore, we adopted a supply–demand perspective as the primary approach for evaluating the health industry and introduced fuzzy mathematical evaluation methods to consider the uncertain information in the assessment of the developmental level of the health industry, which enables a more comprehensive assessment of the development of the health industry and aids in the identification of potential issues and development opportunities within the industry. Lastly, the introduction of vague evaluation methods to handle uncertain information has provided a new approach for assessing the developmental level of the health industry, enhancing the scientific rigor and accuracy of the evaluation.
6.3. Managerial Contribution
This study holds practical significance for policymakers, urban planners, and city officials. Firstly, it emphasizes that the Chinese health industry is still in its early stages of development and cannot meet the growing health demands of the population. For the government and relevant practitioners, this indicates that the primary goal of development should be to improve the overall development level of the health industry. Furthermore, this study underscores the increasing disparity between supply and demand in the health industry over time. Decision makers involved in the development of the health sector should prioritize achieving supply–demand equilibrium to foster comprehensive coordinated advancement. They should acknowledge the existence of lagging supply-side progress, identify the underlying causes, and present tailored remedies. Additionally, the study highlights the importance of narrowing the development gap in the health industry between regions. For urban officials and planners, on one hand, development in the eastern and central regions can drive the development of the western and northeastern regions, deepen the exchange and cooperation of the health industry between regions, strengthen investment attraction and industrial transfer in the health industry field, and narrow the gap in the development level of supply and demand in the health industry between regions. On the other hand, through inter-provincial industrial docking and transfer, policy support, and other means, the exchange of health capital between adjacent provinces can be promoted in order to continuously promote the interconnection of natural, material, financial, social, and human health capital elements, thereby promoting coordinated development of supply and demand in the health industry.
6.4. Limitations and Future Research
Due to limitations in the data sources and the complexity and diversity of the Chinese health industry, there may be other unconsidered factors influencing industry development; thus, this study did not delve deeper into the reasons for market and industry evolution. Therefore, future research could focus more on the processes of market and industry evolution, as well as the factors influencing these processes, thereby providing a more comprehensive and in-depth understanding. Additionally, if research could be conducted using data from Chinese health industry enterprises to understand how these enterprises respond to government policies, changes in consumer demand, and their strategies and behaviors at different stages, it would provide valuable insights into the dynamic micro-level development of the health industry.
Author Contributions
Conceptualization, L.J.; methodology, X.Y.; software, X.Y.; validation, L.J.; formal analysis, X.Y.; investigation, M.Z.; resources, M.Z.; data curation, M.Z.; writing—original draft preparation, X.Y.; writing—review and editing, X.Y.; supervision, L.J. All authors have read and agreed to the published version of the manuscript.
Funding
This research received no external funding.
Institutional Review Board Statement
Not applicable.
Informed Consent Statement
Not applicable.
Data Availability Statement
The data presented in this study are available on request from the corresponding author.
Conflicts of Interest
The authors declare no conflicts of interest.
References
- Ding, X.; Yuan, L.; Zhou, Y. Internet access and older adults’ health: Evidence from China. China Econ. Rev. 2023, 82, 102047. [Google Scholar] [CrossRef]
- Chen, P.; Li, F.; Harmer, P. Healthy China 2030: Moving from blueprint to action with a new focus on public health. Lancet Public Health 2019, 4, e447. [Google Scholar] [CrossRef] [PubMed]
- Li, X.; Krumholz, H.M.; Yip, W.; Cheng, K.K.; De Maeseneer, J.; Meng, Q.; Mossialos, E.; Li, C.; Lu, J.; Su, M.; et al. Quality of primary health care in China: Challenges and recommendations. Lancet 2020, 395, 1802–1812. [Google Scholar] [CrossRef] [PubMed]
- Wang, L.; Wang, Z.; Ma, Q.; Fang, G.; Yang, J. The development and reform of public health in China from 1949 to 2019. Glob. Health 2019, 15, 45. [Google Scholar] [CrossRef] [PubMed]
- Deng, F.; Lv, J.H.; Wang, H.L.; Gao, J.; Zhou, Z. Expanding public health in China: An empirical analysis of healthcare inputs and outputs. Public Health 2017, 142, 73–84. [Google Scholar] [CrossRef] [PubMed]
- Relman, A.S. The health care industry: Where is it taking us? N. Engl. J. Med. 1991, 325, 854–859. [Google Scholar] [CrossRef] [PubMed]
- Tien, J.M.; Goldschmidt-Clermont, P.J. Healthcare: A complex service system. J. Syst. Sci. Syst. Eng. 2009, 18, 257–282. [Google Scholar] [CrossRef]
- World Health Organization. Everybody’s Business—Strengthening Health Systems to Improve Health Outcomes: WHO’s Framework for Action; WHO: Geneva, Switzerland, 2007. [Google Scholar]
- Husereau, D.; Drummond, M.; Augustovski, F.; de Bekker-Grob, E.; Briggs, A.H.; Carswell, C.; Caulley, L.; Chaiyakunapruk, N.; Greenberg, D.; Loder, E.; et al. Consolidated Health Economic Evaluation Reporting Standards 2022 (CHEERS 2022) statement: Updated reporting guidance for health economic evaluations. Int. J. Technol. Assess. Health Care 2022, 38, 23814683211061097. [Google Scholar] [CrossRef] [PubMed]
- Assaf, A.; Matawie, K.M. Improving the accuracy of DEA efficiency analysis: A bootstrap application to the health care foodservice industry. Appl. Econ. 2010, 42, 3547–3558. [Google Scholar] [CrossRef]
- Anderson, J.E.; Ross, A.J.; Macrae, C.; Wiig, S. Defining adaptive capacity in healthcare: A new framework for researching resilient performance. Appl. Ergon. 2020, 87, 103111. [Google Scholar] [CrossRef]
- Engel, N.; Wachter, K.; Pai, M.; Gallarda, J.; Boehme, C.; Celentano, I.; Weintraub, R. Addressing the challenges of diagnostics demand and supply: Insights from an online global health discussion platform. BMJ Glob. Health 2016, 1, e000132. [Google Scholar] [CrossRef]
- Gopalan, S.S.; Mutasa, R.; Friedman, J.; Das, A. Health sector demand-side financial incentives in low-and middle-income countries: A systematic review on demand-and supply-side effects. Soc. Sci. Med. 2014, 100, 72–83. [Google Scholar] [CrossRef]
- Govindan, K.; Mina, H.; Alavi, B. A decision support system for demand management in healthcare supply chains considering the epidemic outbreaks: A case study of coronavirus disease 2019 (COVID-19). Transp. Res. Part E Logist. Transp. Rev. 2020, 138, 101967. [Google Scholar] [CrossRef] [PubMed]
- Vidoli, F.; Auteri, M. Health-care demand and supply at municipal level: A spatial disaggregation approach. Socio-Econ. Plan. Sci. 2022, 84, 101229. [Google Scholar] [CrossRef]
- Feng, W.B.; Han, Y. A new similarity measure for Vague set based on inclusion relationship. J. Henan Univ. Sci. Technol. (Nat. Sci. Ed.) 2023, 44, 90–97+10. [Google Scholar]
- Zheng, Y.; Xue, W.X.; Gu, J. Evaluation of ecological civilization in Silk Road Economic Belt based on Vague set-TOPSIS. China Soft Sci. 2021, 9, 95–104. [Google Scholar]
- Wu, H.R.; Wang, E.W.; Qi, Y.X. Evaluation of livelihood status of Pearl River Delta cities based on Vague set. Oper. Res. Manag. 2019, 28, 137–141. [Google Scholar]
- Luo, Q.; He, X.J. Evaluation research on synergistic development of regional industrial technology supply and demand based on Vague set distance and gray correlation. Oper. Res. Manag. 2021, 30, 193–199. [Google Scholar]
- Terrell, G.R.; Scott, D.W. Variable kernel density estimation. Ann. Stat. 1992, 20, 1236–1265. [Google Scholar] [CrossRef]
- Dagum, C. A New Approach to the Decomposition of the Gini Income Inequality Ratio; Physica-Verlag HD: Heidelberg, Germany, 1998. [Google Scholar]


Disclaimer/Publisher’s Note: The statements, opinions and data contained in all publications are solely those of the individual author(s) and contributor(s) and not of MDPI and/or the editor(s). MDPI and/or the editor(s) disclaim responsibility for any injury to people or property resulting from any ideas, methods, instructions or products referred to in the content. |
© 2024 by the authors. Licensee MDPI, Basel, Switzerland. This article is an open access article distributed under the terms and conditions of the Creative Commons Attribution (CC BY) license (https://creativecommons.org/licenses/by/4.0/).