Abstract
The Qinling Mountains serve as a vital ecological barrier for China, needing regular monitoring for sustainable progress. The present study analyzed the Qinling Mountains (sections in Shaanxi province) via the Google Earth Engine (GEE) and Landsat images, constructing a Remote Sensing Ecological Index (RSEI) for quantitatively analyzing the spatiotemporal evolution of the ecological environment quality from 1990 to 2020. Additionally, this study integrated geodetector and multiscale geographically weighted regression (MGWR) to discern the driving factors influencing ecological quality. The results indicated the following: (1) over the 30 years, the RSEI in the study area initially declined (1990–2005) and then began to improve (2005–2020), demonstrating an overall upward trend; (2) RSEI varied with topography: lower values corresponded to lower elevations (<1200 m) and gentle slopes (<10°), whereas higher values were linked to higher elevations (>1600 m) and steeper slopes (>20°); and (3) NDVI, DEM, land use, and the presence of protected areas emerged as the main driving forces of ecological quality. The interaction between ecological conservation policies and socioeconomic factors enhanced the explanatory strength for the differentiation in ecological environment quality. In conclusion, factors like increased vegetation cover and the establishment of protected areas have significantly promoted the improvement of ecological environment quality in the Qinling region, making this study a scientific reference for providing ecological environment protection and promoting high-quality development.
1. Introduction
The ecological environment constitutes the material foundation for human survival, serves as the base and core of regional social economic development, and interacts closely with historical development processes [1]. However, the pace of modernization has exerted significant stress on ecosystems. Consequently, objective, scientific, and timely assessments of ecological quality have become critical for effective monitoring of ecological conditions and the sustainable management of natural resources. This also aids in advancing environmental protection and sustainable economic prosperity [2].
Since the 1960s, researchers have explored the evaluation of ecological environment quality, shifting from single-factor surveys to multifaceted evaluations [3]. Advances in remote sensing technology have facilitated the rapid acquisition of a wide range of ecological indicators, surpassing the constraints of traditional manual monitoring, and have been of widespread use in ecological and environmental research [4]. While many studies utilize remote sensing technology to extract indicators such as the Normalized Difference Vegetation Index (NDVI) [5], the Normalized Difference Water Index (NDWI) [6], and the Land Surface Temperature (LST) [7], these singular metrics are insufficient for capturing the complexity of ecological environments. Subsequently, Xu [8] proposed the Remote Sensing Ecological Index (RSEI), which provides an objective evaluation of regional ecological quality across four dimensions: greenness, wetness, heat, and dryness. RSEI’s comprehensive and semi-automatic approach has been successfully implemented and validated in various regions, including those of watersheds [9,10,11], urban areas [12], and mining zones [13], yielding favorable results.
The Qinling Mountains serve as a natural boundary separating the climatic, biological, hydrological, pedological, and geological elements of northern and southern China, playing a vital role in the nation’s ecological stability. The forest ecosystem of the Qinling Mountains is pivotal for water conservation, biodiversity preservation, and soil erosion control [14]. The ecological condition here is also crucial for the water supply of the South-to-North Water Diversion Project, significantly impacting the ecological civilization construction and socioeconomic development of the Yangtze and Yellow River basins [15]. Consequently, protecting the Qinling’s ecological environment is essential for the ecological security of the nation and surrounding regions [16]. However, frequent human activities have caused significant ecological problems in the Qinling Mountains, including deforestation, soil erosion, and geological disasters [17]. In particular, the extensive illegal construction on the Qinling’s northern slopes in Shaanxi province has negatively impacted the area’s ecological functions [18]. In response, the Shaanxi government has enforced various ecological protection measures, such as natural forest protection and the Grain for Green (GFG) project, aiding in the ecosystem’s recovery [19].
Therefore, investigating the patterns and spatial distribution of changes in the ecological environment quality of the Qinling Mountains as well as analyzing the key drivers behind these changes is crucial for a comprehensive understanding of Qinling’s distinct geographic significance. Moreover, extracting and quantifying these drivers is essential for assessing the enduring impact of human activities on the ecosystem in the context of global warming.
Recent studies have applied remote sensing technology to investigate vegetation cover, net primary productivity, and land use changes in the Qinling area [16,20,21]. Specifically, from 2000 to 2020, the vegetation coverage on the east and west sides of the Qinling remained consistently lower than that in the central areas, yet there was an overall trend of continuous improvement [22]. Factors such as terrain slope and elevation were found to significantly impact vegetation, as vegetation degradation mainly occurred in areas with a slope of less than 10 degrees and an elevation of less than 1000 m between 2000 and 2015 [23]. Furthermore, influenced by global climate change, the Qinling region has seen a marked increase in the number of days with a daily average temperature ≥ 10 °C from 1960 to 2019. Yu et al. [24] have crafted an ecosystem management planning map, taking into account the altered ecosystem services in the Qinling region amidst climatic shifts. In addition, Cui [25] conducted an analysis of the landscape ecological index, revealing that zones with extremely high ecological risk within the Qinling predominantly lie in the central and southeastern areas.
However, these studies often focus on single ecological elements and lack comprehensive monitoring and evaluation of the entire ecological environment, and place little emphasis on the drivers of these changes. Therefore, this study selected the Shaanxi section of the Qinling Mountains as the study area, employed RSEI to investigate the spatiotemporal patterns of the ecological environment over the past 30 years in the area, and analyzed the driving factors behind changes in its ecological environment quality. The aim of this article is (i) to reveal the variability in the ecological environment under human influence, (ii) to grasp the intrinsic factors affecting environmental quality, and (iii) to provide data support and a scientific basis for the ecological protection and sustainable development of the Qinling Mountains.
2. Materials and Methods
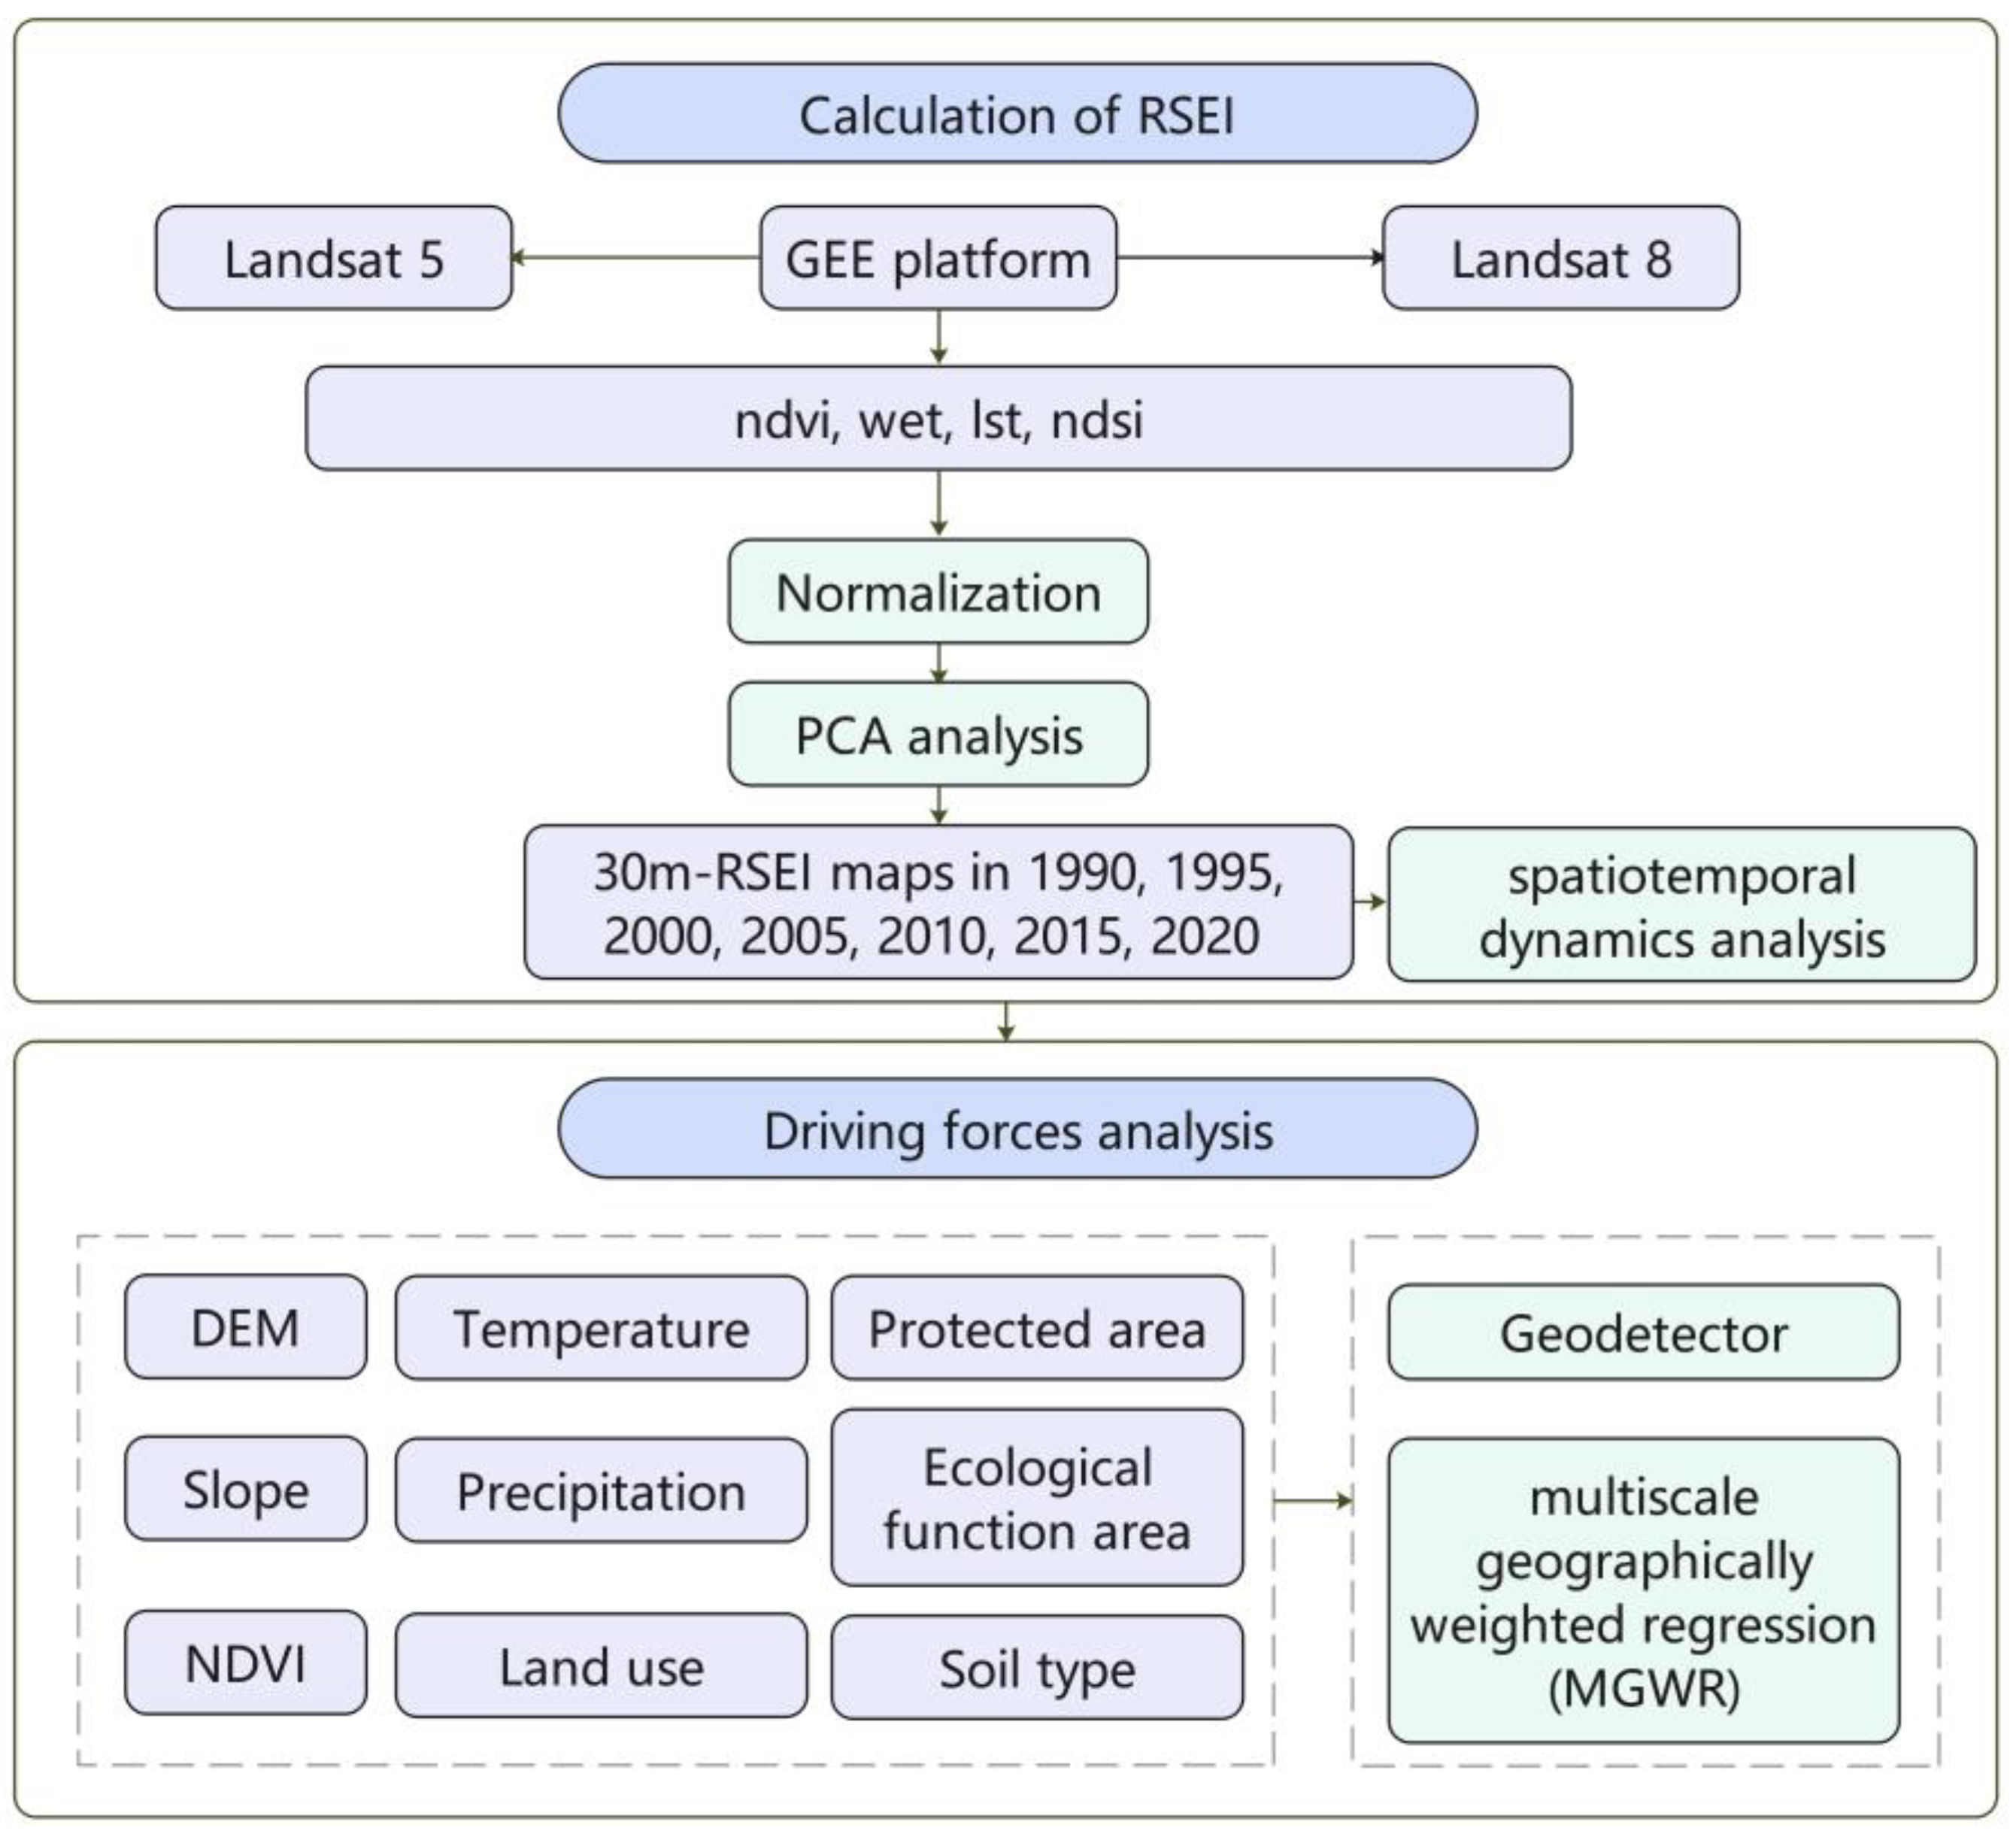
A detailed workflow was established for this study (Figure 1). First, seven 30 m resolution RSEI maps for the years 1990, 1995, 2000, 2005, 2010, 2015, and 2020 were generated using Landsat5 TM and Landsat8 OLI imagery based on the GEE platform. Second, the temporal and spatial changes in the ecological environment quality for the Qinling Mountains were analyzed based on seven RSEI maps from 1999 to 2020. Finally, the factors affecting environmental quality were identified via geodetector and multiscale geographically weighted regression (MGWR).
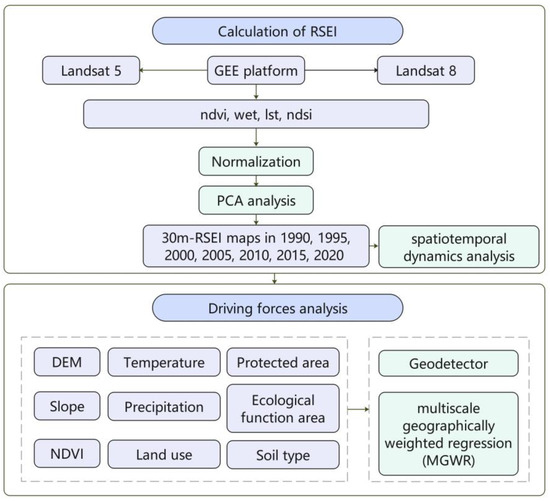
Figure 1.
Workflow image.
2.1. Study Area
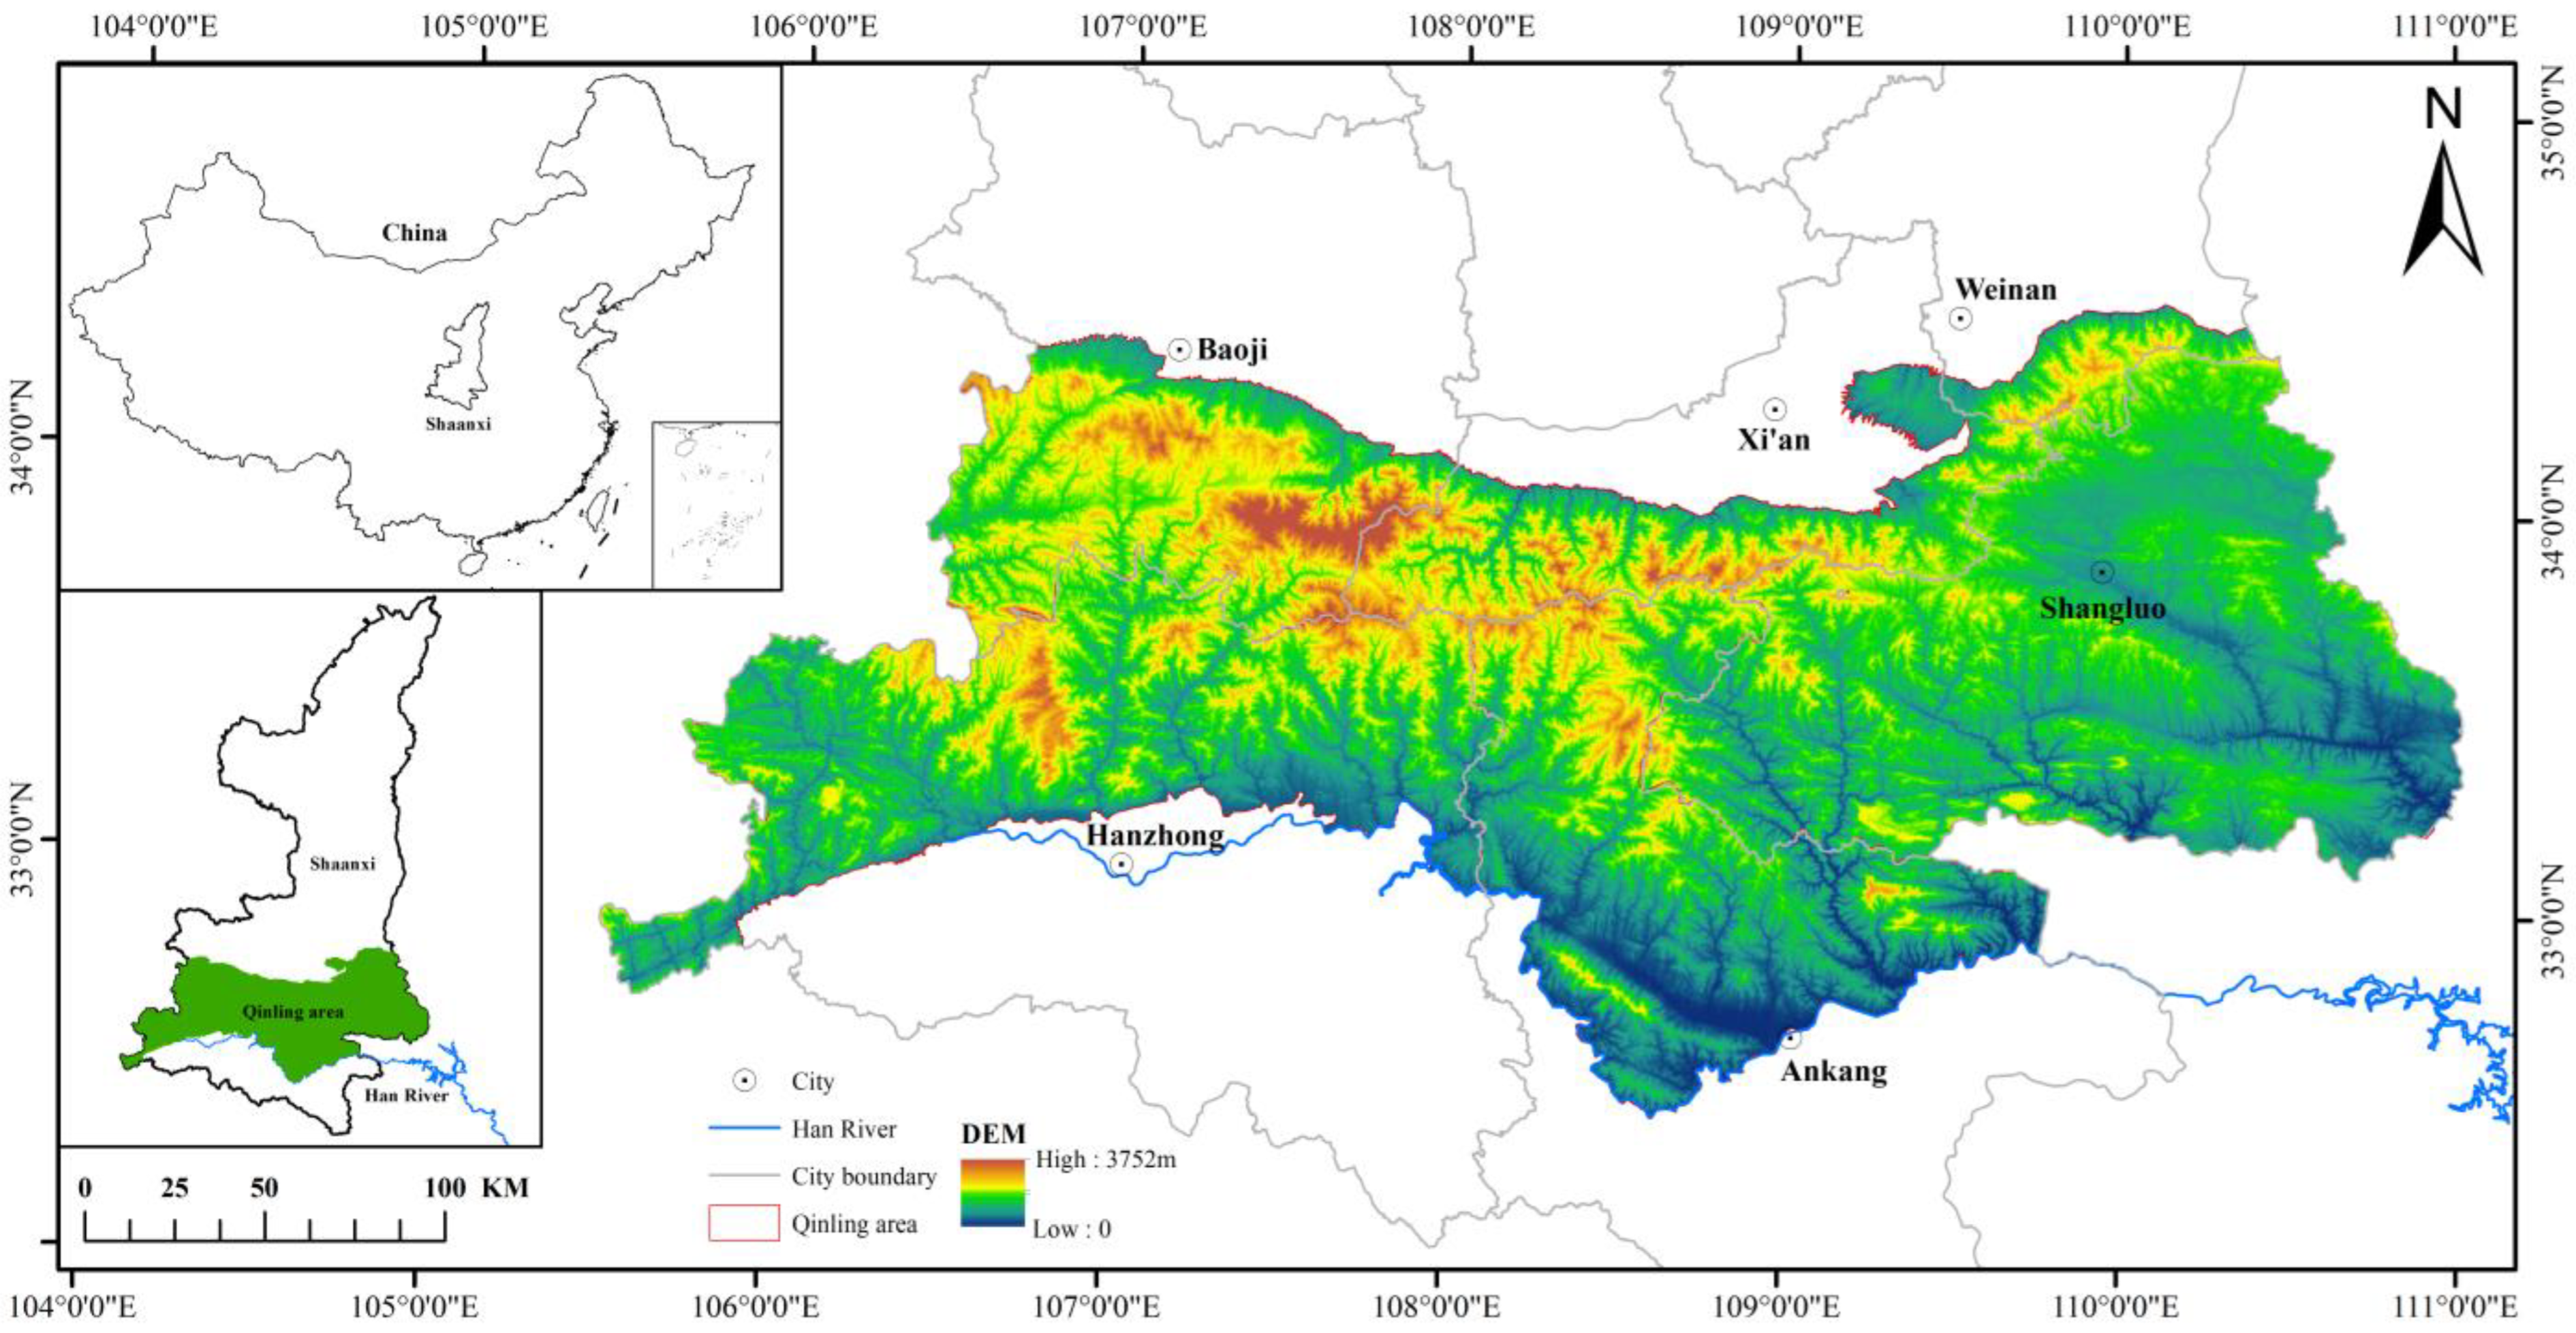
This study focused on the narrower Qinling range (105°30′ E–110°05′ E, 32°40′ N–34°35′ N), specifically the section within Shaanxi province, as the area of study. The northern boundary is marked by the base of the northern slope of the Qinling Mountains, and the southern boundary is set along the northern bank of the Han River. The eastern and western boundaries follow the provincial borders. The administrative division includes 39 districts and counties within six cities of Shaanxi province, spanning an area of approximately 58,200 km2 (Figure 2). The region boasts a diverse landscape, with an average altitude surpassing 1000 m, containing an array of mid-sized mountains that rise above 2500 m and several towing peaks over 3000 m. Its northern face presents a dramatic, steep incline, in contrast to the more gently sloping southern face. Additionally, the terrain rises to higher elevations in the west and lower in the east [26]. And there are significant differences in climate across the area. The north slope is dry, with average annual precipitation generally below 600 mm and average annual temperatures below 10 °C. In contrast, the south slope is more humid, with annual precipitation exceeding 600 mm and average annual temperatures around 11 °C [27]. This variation in precipitation and temperature leads to different types of natural vegetation on the northern and southern slopes, with the area predominantly characterized by temperate deciduous broadleaf forests. The soils in the area are mainly brown soils [28]. The boundaries of the protected areas and the ecological functional zones are shown in Figures S1 and S2.

Figure 2.
Location of study area.
2.2. Data Sources and Processing
Remote sensing image data were acquired from the Google Earth Engine (GEE) platform database, specifically from the Tier 1 Surface Reflectance (SR) products of Landsat5 (TM) and Landsat8 (OLI). These datasets have been processed for geometric, radiometric, and atmospheric corrections, yielding a spatial resolution of 30 m. Through the GEE platform, images for the summer months (June to September) of the years 1990, 1995, 2000, 2005, 2010, 2015, and 2020 were selected. A cloud mask algorithm was employed to eliminate pixels affected by clouds, and the median of the cloud-free pixels was used to generate the composite images with the least cloud cover for the target years. Additionally, a water index was employed to mask the water body information [29].
Land use data were derived from the 1985–2020 China Land Cover product of Wuhan University [30], which, after reclassification, were used to characterize the degree of human disturbance [31]. DEM data were obtained from the Geospatial Data Cloud [32], and slope information was then extracted using ArcGIS spatial analysis functions. Precipitation data were sourced from the National Earth System Science Data Center [33]. The ecological function area vectors originated from the Resource and Environmental Science Data Center, Chinese Academy of Sciences [34]. The soil type data were sourced from the Harmonized World Soil Database [35].
Utilizing ArcGIS 10.2 software, the study area was divided into a regular grid. Balancing sampling point density and model computation efficiency, the grid size was set to 1 km by 1 km. Samples were taken from the center of each grid cell for the purpose of calculations and analyses using the geodetector and multiscale geographically weighted regression (MGWR).
2.3. Methods
2.3.1. Assessment of Ecological Environment Evaluation Indices
The initial phase of the research involved the evaluation and selection of appropriate indices. In 2006, China’s Ministry of Environmental Protection formulated the “Technical Criterion for Ecosystem Status Evaluation”, which was first revised in 2015 [36] (hereinafter referred to as the Criterion). This Criterion introduced the Ecological Environment Condition Index (EI), a tool primarily reliant on remote sensing technology designed to assess the ecological status of regions at or above the county level. The EI calculation is as follows:
EI = 0.35 × Biodiversity Index + 0.25 × Vegetation Cover Index + 0.15 × Water Network Density Index + 0.15 × (100 − Land Stress Index) + 0.1 × (100 − Pollution Load Index) + Environmental Constraint Index
The numbers within the formula represent weights that have been subjectively assigned. Specific calculations for each index can be referenced in the Criterion [36]. Following the EI scores, the ecological environment is classified into five levels: excellent (EI ≥ 75), good (55 ≤ EI < 75), moderate (35 ≤ EI < 55), fair (20 ≤ EI < 35), and poor (EI < 20). Since its adoption, the EI has been widely used across China for environmental assessments [37,38]. The current study presents the ecological environment assessment results for the Qinling region based on the EI of 2020 (Figure 3). The EI provides a broad-brush assessment of an area’s ecological status but lacks the ability to depict the precise spatial distribution of environmental quality. Therefore, this study turns to the RSEI, which is entirely based on remote sensing technology, devoid of subjective weighting, and allows for a visual, quantitative assessment of the Qinling’s ecological environment.
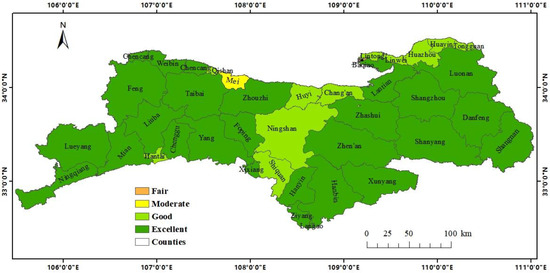
Figure 3.
Ecological environment assessment of the Qinling based on the EI of 2020 (revised based on the ecological environmental data from the 2020 Shaanxi Province Environment Status Bulletin [39]).
2.3.2. The Calculation of the RSEI
This study employed the RSEI for dynamic monitoring and assessment of the ecological environment quality of the study area. This index couples four assessment indicators—greenness, wetness, heat, and dryness—which are expressed as follows [8]:
In this formula, WET represents the wetness index, NDVI represents the greenness index, LST denotes the heat index, and NDBSI stands for the dryness index. The formulas of these remote sensing indices mentioned above are listed in Table 1. Since the four indices were not dimensionally uniform, they were normalized to map their values to the [0, 1] interval. After normalization, Principal Component Analysis (PCA) was conducted. The first principal component (PC1) obtained through PCA was then normalized to yield the RSEI. Results closer to 1 indicated a better ecological environmental quality in the study area. All the aforementioned computational processes were implemented in GEE.

Table 1.
NDVI, WET, LST, and NDBSI calculation formulas.
2.3.3. Analysis of Driving Factors for Spatial Variations in RSEI
The geodetector was employed to test the spatial heterogeneity of single variables and to uncover the driving factors behind it. This study used geodetector to compute the q-statistic, analyzing the explanatory strength of driving factors in explaining the spatial variations in ecological environment quality in the study area. The formula is represented as
where the q values are in the range of [0, 1], with higher q values indicating stronger explanatory strength of the driving factors for the spatial differentiation of ecological environmental quality; SSW and SST represent the sum of within-stratum variances and the total variance across the entire region; h represents the stratification of variable Y or factor X; Nh and N are the numbers of units in stratum h and the entire region, respectively; and and are the variances of Y values in stratum h and the entire region. Additionally, interaction detection was used to determine whether there was a combined effect between two factors, assessing whether the driving factors jointly enhance or weaken the explanatory power for spatial differences in ecological environmental quality [40].
2.3.4. Multiscale Geographically Weighted Regression
MGWR was built upon geographically weighted regression (GWR) as a type of local regression model. This model allowed the regression coefficients of each explanatory variable to vary with geographic location, and permitted each explanatory variable to exert its influence at different spatial scales. It demonstrates heightened sensitivity to the spatial heterogeneity inherent in geographical phenomena [41]. The range of influence (or bandwidth) of an explanatory variable determined which data points were included in the linear regression analysis for the target feature, thereby assessing the impact of the coefficient of that explanatory variable. The formula is represented as
where represents the j-th predictor variable; are the coordinates of the sample point; and is the bandwidth for the regression coefficient of the j-th variable. These calculations were completed using MGWR 2.2 software.
3. Results and Analysis
3.1. Analysis of the Average RSEI in the Study Area
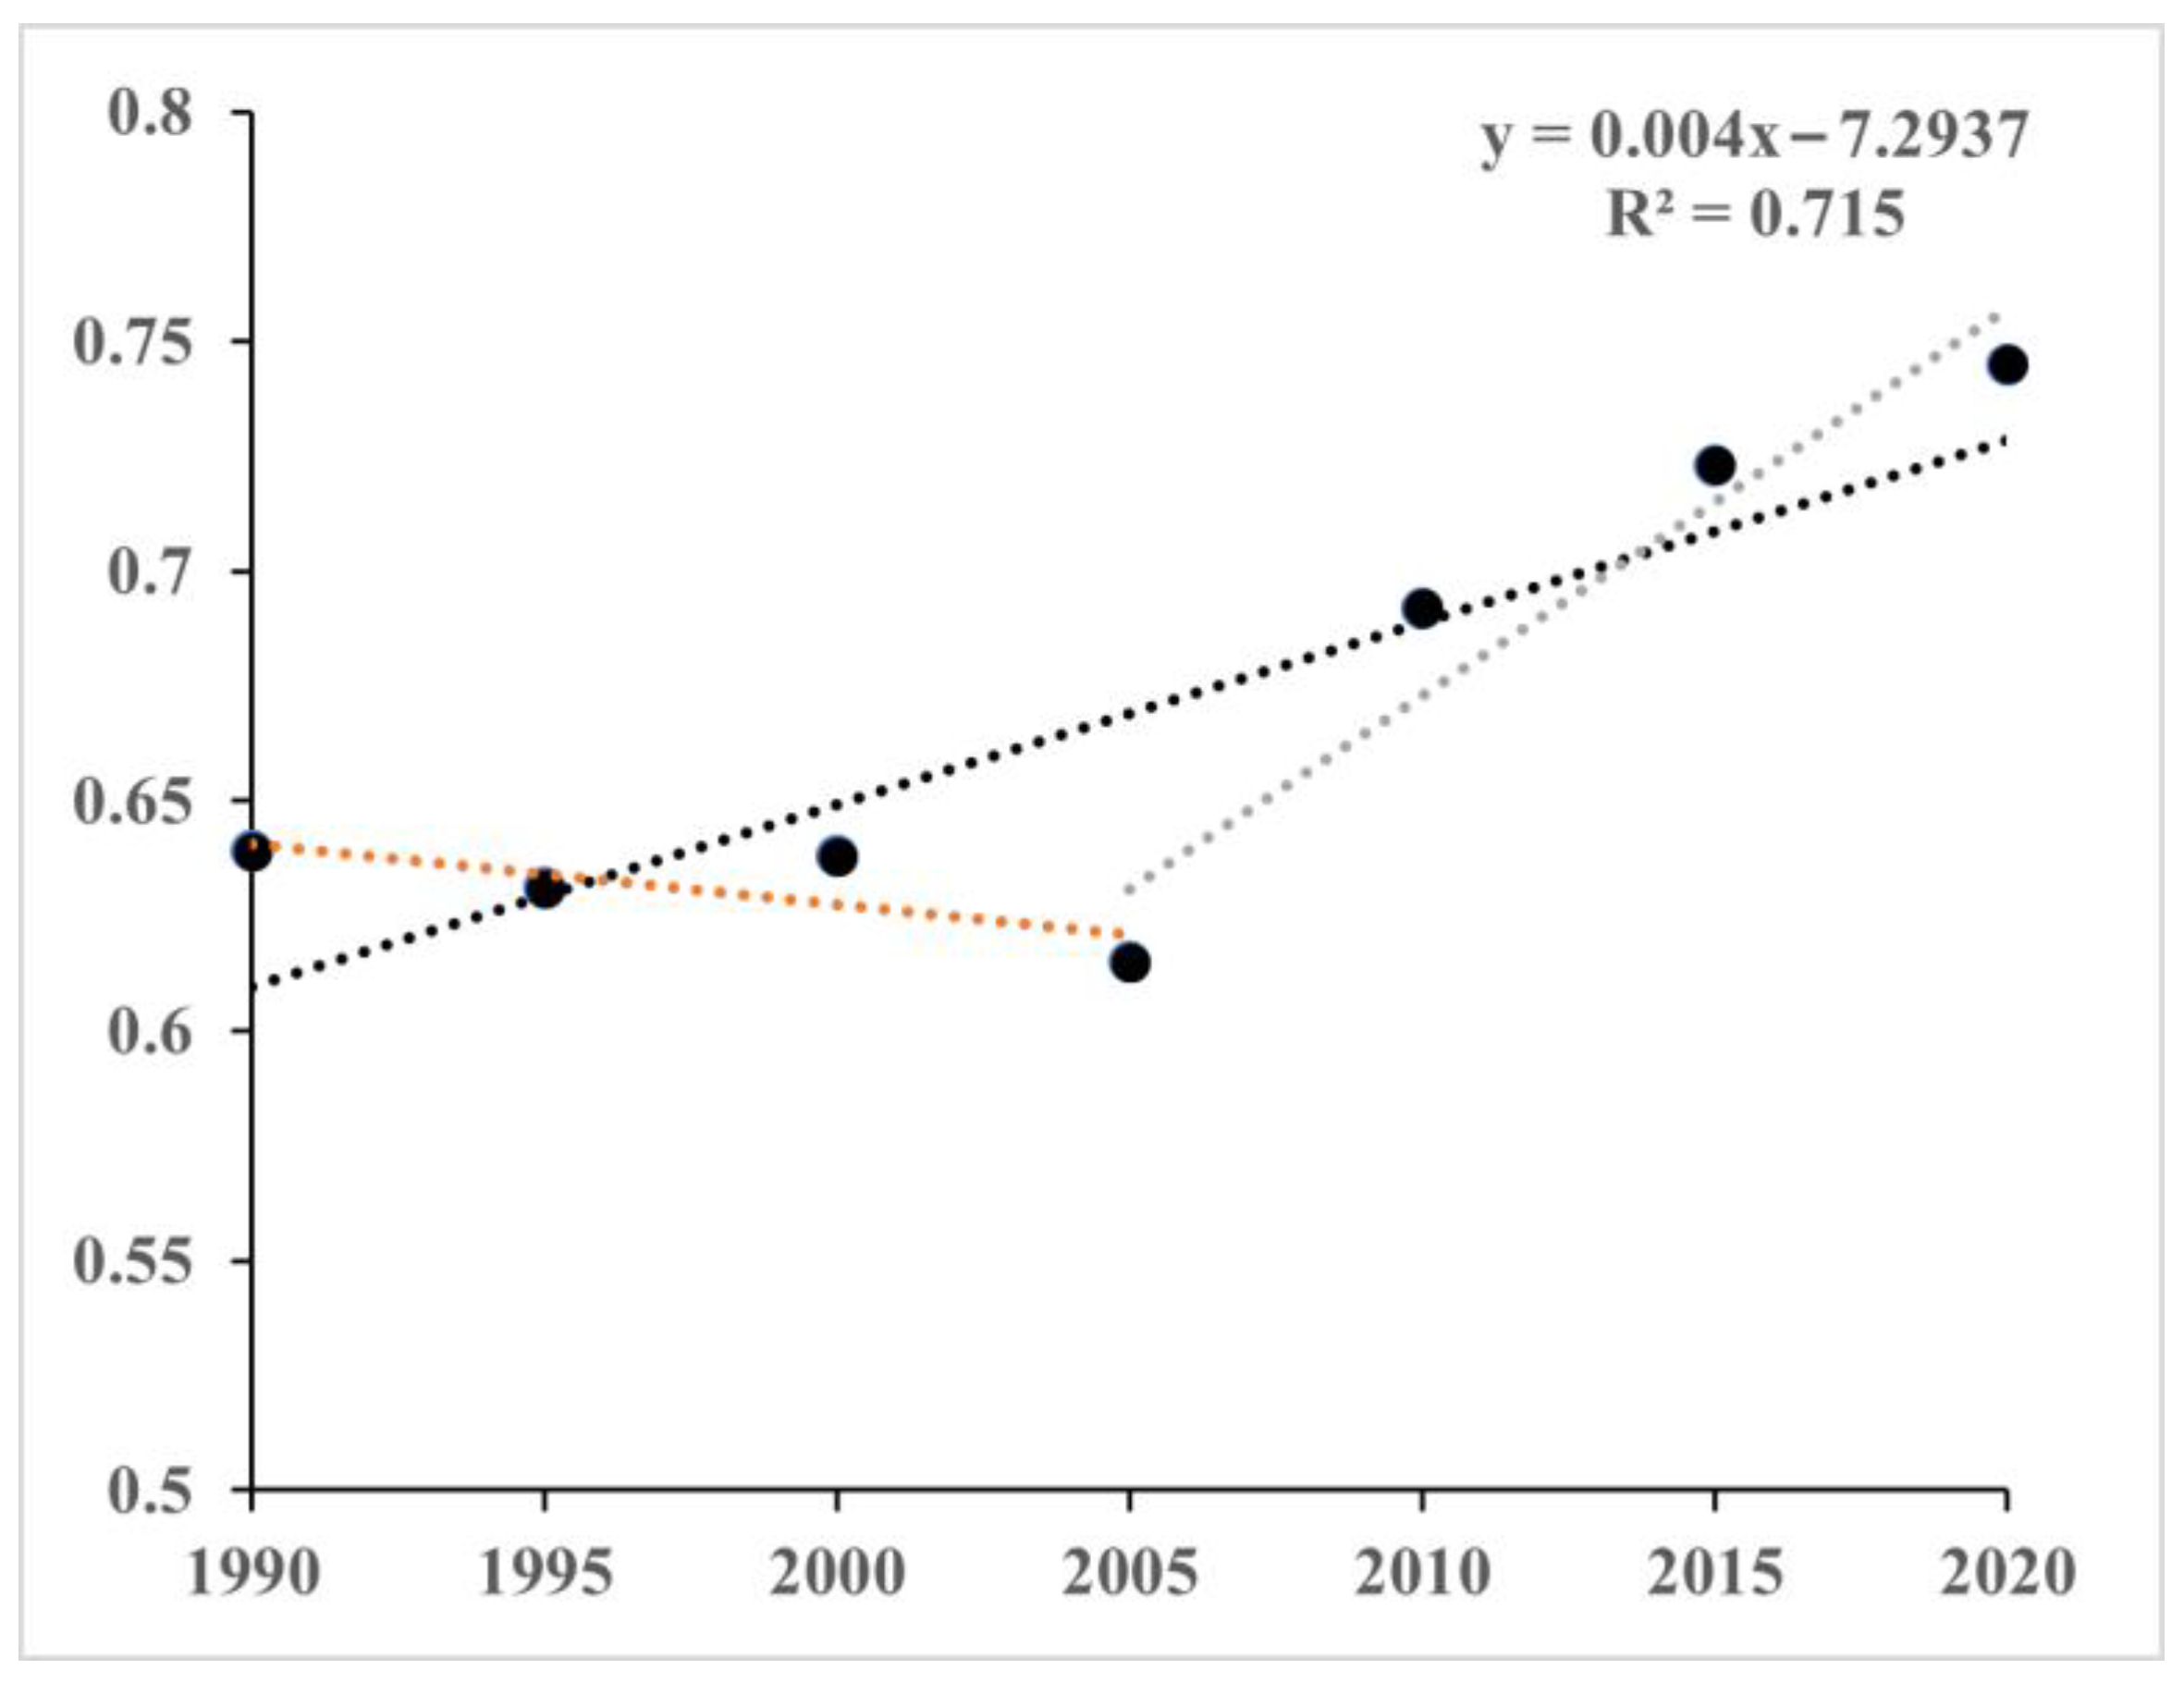
The changes in the average RSEI value for the study area from 1990 to 2020 are shown in Figure 4. Over the past 30 years, the average RSEI in the study area generally exhibited an increasing trend, with an average of 0.669. The lowest value was 0.618 in 2005, and the highest was 0.745 in 2020. Combining the characteristics of the RSEI histogram distributions from different periods, the study area was divided into five ecological environment quality grades (Figure 5): excellent (0.8–1), good (0.6–0.8), moderate (0.4–0.6), fair (0.2–0.4), and poor (0–0.2) [8]. The areas and their respective proportions for each ecological grade were calculated across seven time periods. The results indicated that from 1990 to 2020, the ecological environment quality grade of the study area was predominantly classified as good, with an average proportion of 70.94%. The next most prevalent grade was moderate, with an average proportion of 19.28%. The average proportions for poor, fair, and excellent were relatively low, at 0.11%, 2.41%, and 6.92%, respectively (Table 2).
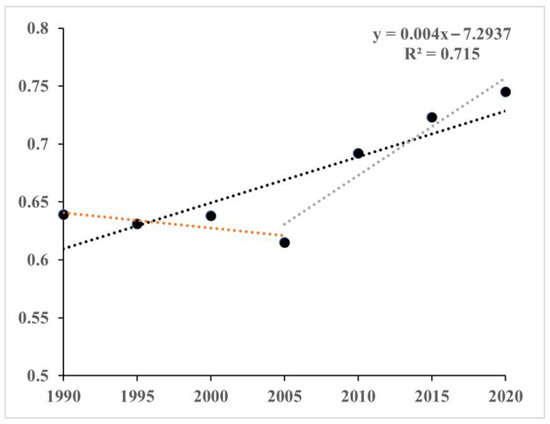
Figure 4.
Interannual changes in RSEI average values in the study area from 1990 to 2020. (Different colored lines represent the fitting of the change trends of RESI over different time periods).
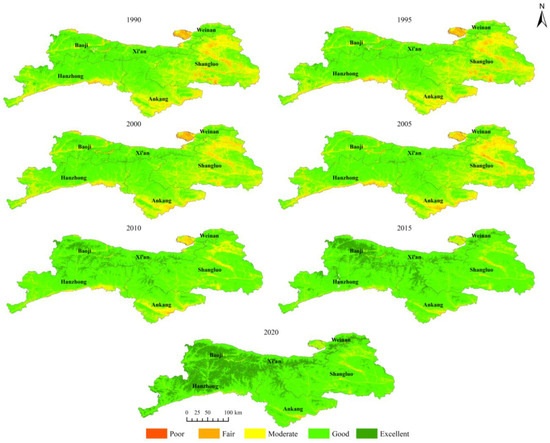
Figure 5.
Distribution of ecological grades in the study area from 1990 to 2020.
Table 2.
Area and proportion statistics of ecological environment quality grades in the study area.
3.2. Spatiotemporal Characteristics Analysis of Ecological Environment Quality in the Study Area
3.2.1. Temporal Characteristics Analysis of Ecological Environment Quality in the Study Area
Over the past 30 years, the ecological environment quality of the study area exhibited a two-stage evolution, characterized by a gentle decline followed by a substantial improvement (Figure 4). From 1990 to 2005, the RSEI decreased from 0.639 to 0.618, indicating a downward trend. During this period, the ecological environment quality was predominantly classified as good and moderate, with their combined area proportion exceeding 94%. From 2005 to 2020, the RSEI increased from 0.618 to 0.745, demonstrating a significant upward trend. The primary ecological environment quality grades were good and excellent, with their combined proportion surpassing 68.52%. Since 2010, the combined proportion classified as good and excellent consistently exceeded those classified as good and moderate. Specifically, the excellent proportion has significantly increased, rising from 10.82% in 2010 to 24.83% in 2020.
The ecological environment quality grades of the study area from 1990 to 2020 are presented in Table 3. On average, over the 30 years, the area with an unchanged ecological environment quality grade accounted for 50.06% of the study area. The combined area with light and significant improvements accounted for 48.86%, which was substantially higher than the areas with light (1.08%) and significant (0%) degradation.
Table 3.
Statistics of ecological grade changes in the study area.
When examined in stages, from 1990 to 2005, the proportion of the study area with light and significant degradation reached 10.86%, exceeding the 7.43% of areas that experienced light and significant improvements during the same period. In contrast, from 2005 to 2020, the proportion of areas with light and significant improvements significantly increased to 51.86%, and the light and significant degradation areas decreased to 174.46 km2, making a reduction of 97.24%. This trend demonstrates that over the past 30 years, the ecological environment quality in the study area initially declined and then improved markedly. Furthermore, an analysis of ecological environment quality grade changes over seven periods indicates that the most substantial degradation occurred from 1990 to 1995, while the most significant improvement occurred from 2005 to 2010, aligning with the previously described two stages of the environmental quality trajectory.
3.2.2. Spatial Characteristics Analysis of Ecological Environment Quality in the Study Area
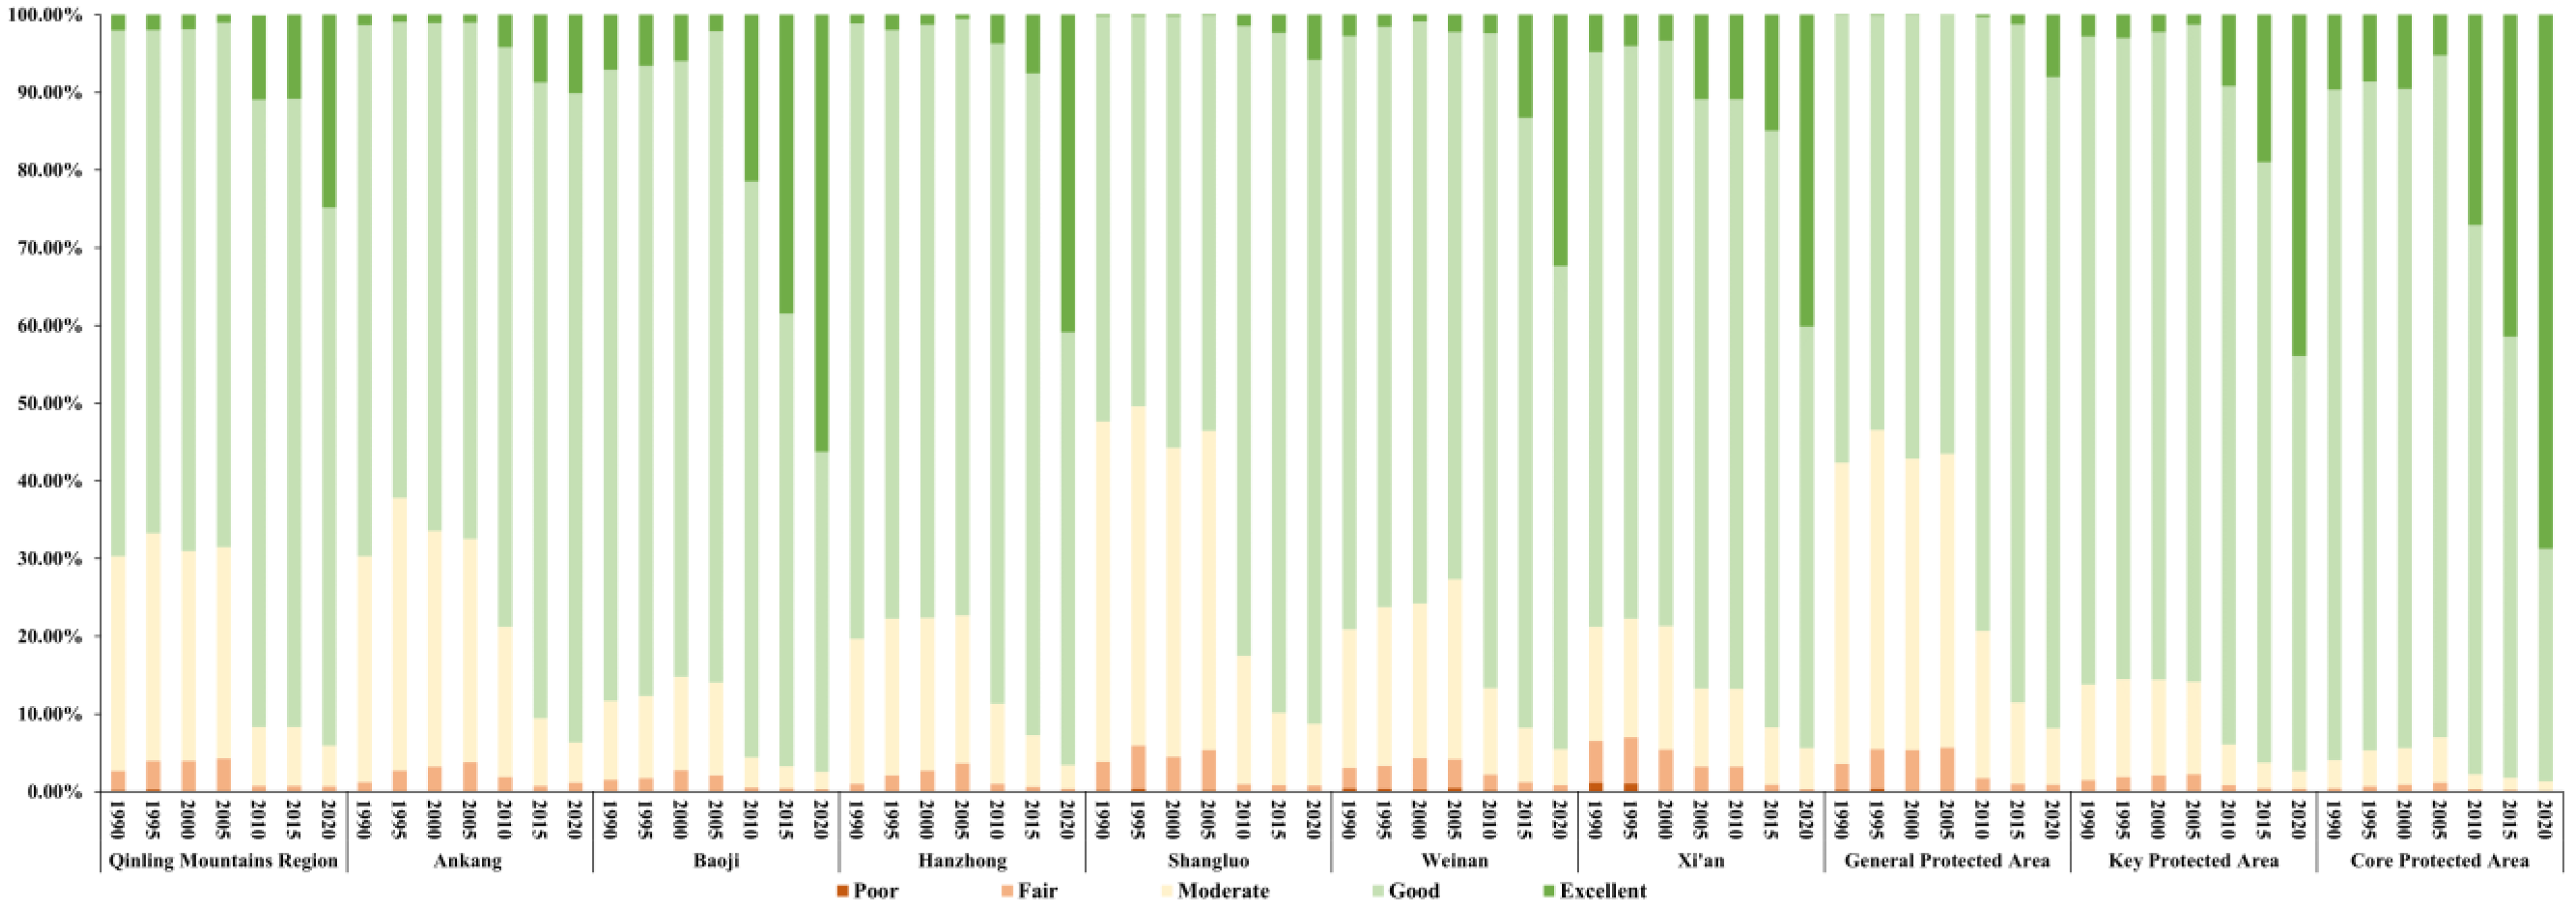
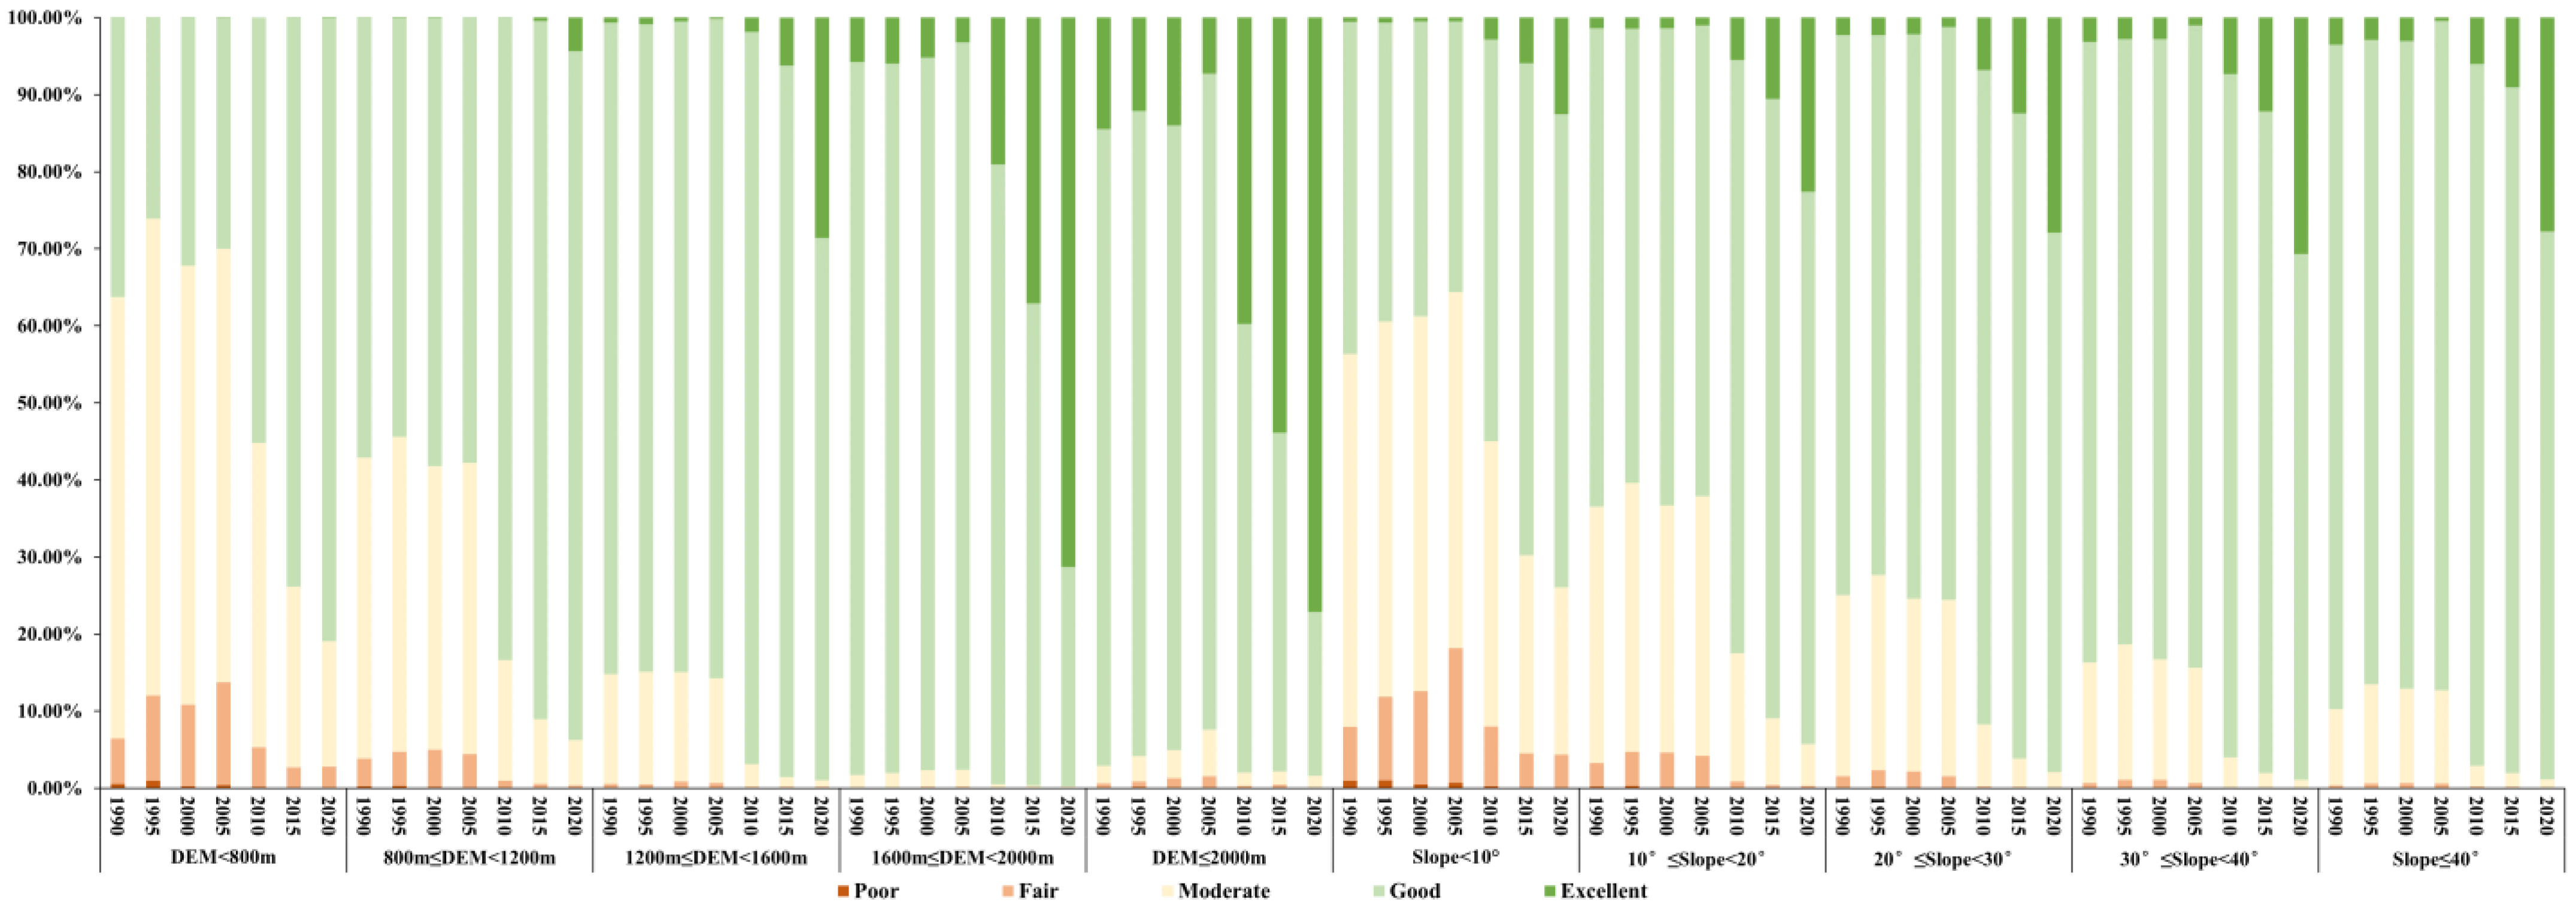
The spatial distribution of the ecological environment quality grades in the study area is illustrated in Figure 6 and Figure 7. The areas of moderate or lower quality were primarily located at altitudes below 1200 m and on slopes less than 10°, which also fell within the general ecological protected area. The areas of good and excellent quality were primarily situated at altitudes above 1600 m, within key and core protected areas. Over the 30 years, the regions where the ecological environment quality grade degraded were concentrated in the built-up and mining areas of Ankang City, Hanzhong City, Shangluo City, and Weinan City.
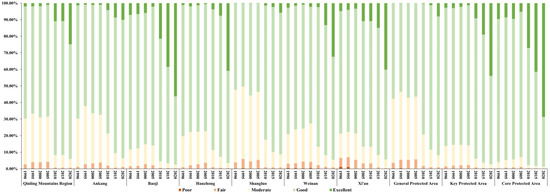
Figure 6.
Stacked chart of ecological environment quality grades in different regions from 1990 to 2020.
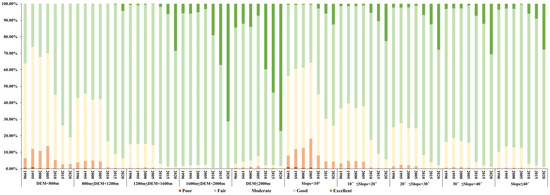
Figure 7.
Spatial distribution of ecological environment quality grade changes from 1990 to 2020.
In the general protected area, the improvement in ecological grades was mainly evident in the shift from moderate to good. In the key and core protected area, the trend of change from good to moderate ecological quality was not significant before 2005. After 2005, there was a noticeable decline in the proportion of areas with good and moderate ecological quality, largely reflecting a transition from good to excellent. When considering elevation and slope, regions with elevations under 1600 m primarily showed an ecological upgrade from fair and moderate to good, while regions with elevations over 1600 m mainly saw an upgrade from good to excellent in ecological quality. For areas with slopes less than 20°, ecological grades were mostly fair, poor, and moderate. In areas with slopes greater than 20°, the ecological grades were predominantly good, with the proportion of excellent ecological quality significantly increasing after 2005, with a peak proportion of 30.68% and an average of 15.57%.
3.3. Analysis of Driving Factors for Spatial Heterogeneity in Ecological Environment Quality in the Study Area
In order to analyze the driving factors behind the spatiotemporal changes in ecological environment quality within the study area, the factor detector from the geodetector was utilized to explore the explanatory strength of natural geographic, policy protection, and socioeconomic factors for the spatial heterogeneity in ecological environment quality at different times. The results showed that all factors passed the significance test (p < 0.05), indicating that each factor had a certain explanatory strength for the spatial differentiation in ecological environmental quality (Table 4).
Table 4.
q values of each influencing factor.
The factor detection results for different periods all pointed out that NDVI, temperature, land use, and DEM were the main factors affecting the spatial differentiation in ecological environmental quality. Among them, from 1990 to 2000, NDVI and temperature were the two most important factors causing spatial differentiation in ecological environmental quality; from 2000 to 2010, NDVI and land use became the two most significant impacting factors. After 2010, the explanatory strength of NDVI, temperature, and land use decreased, while the explanatory strength of DEM increased. In addition, the soil type of the study area, the setting of the ecological function area, and protected area boundaries also impacted the spatial differentiation in ecological environmental quality to a certain extent. Notably, the q value for the range of protected ecological areas averaged 0.12 before 2010, but from 2010 to 2020, its explanatory strength rapidly increased to 0.24, indicating that the implementation of ecological protection policies in the study area gradually influenced the spatial differentiation in ecological environmental quality.
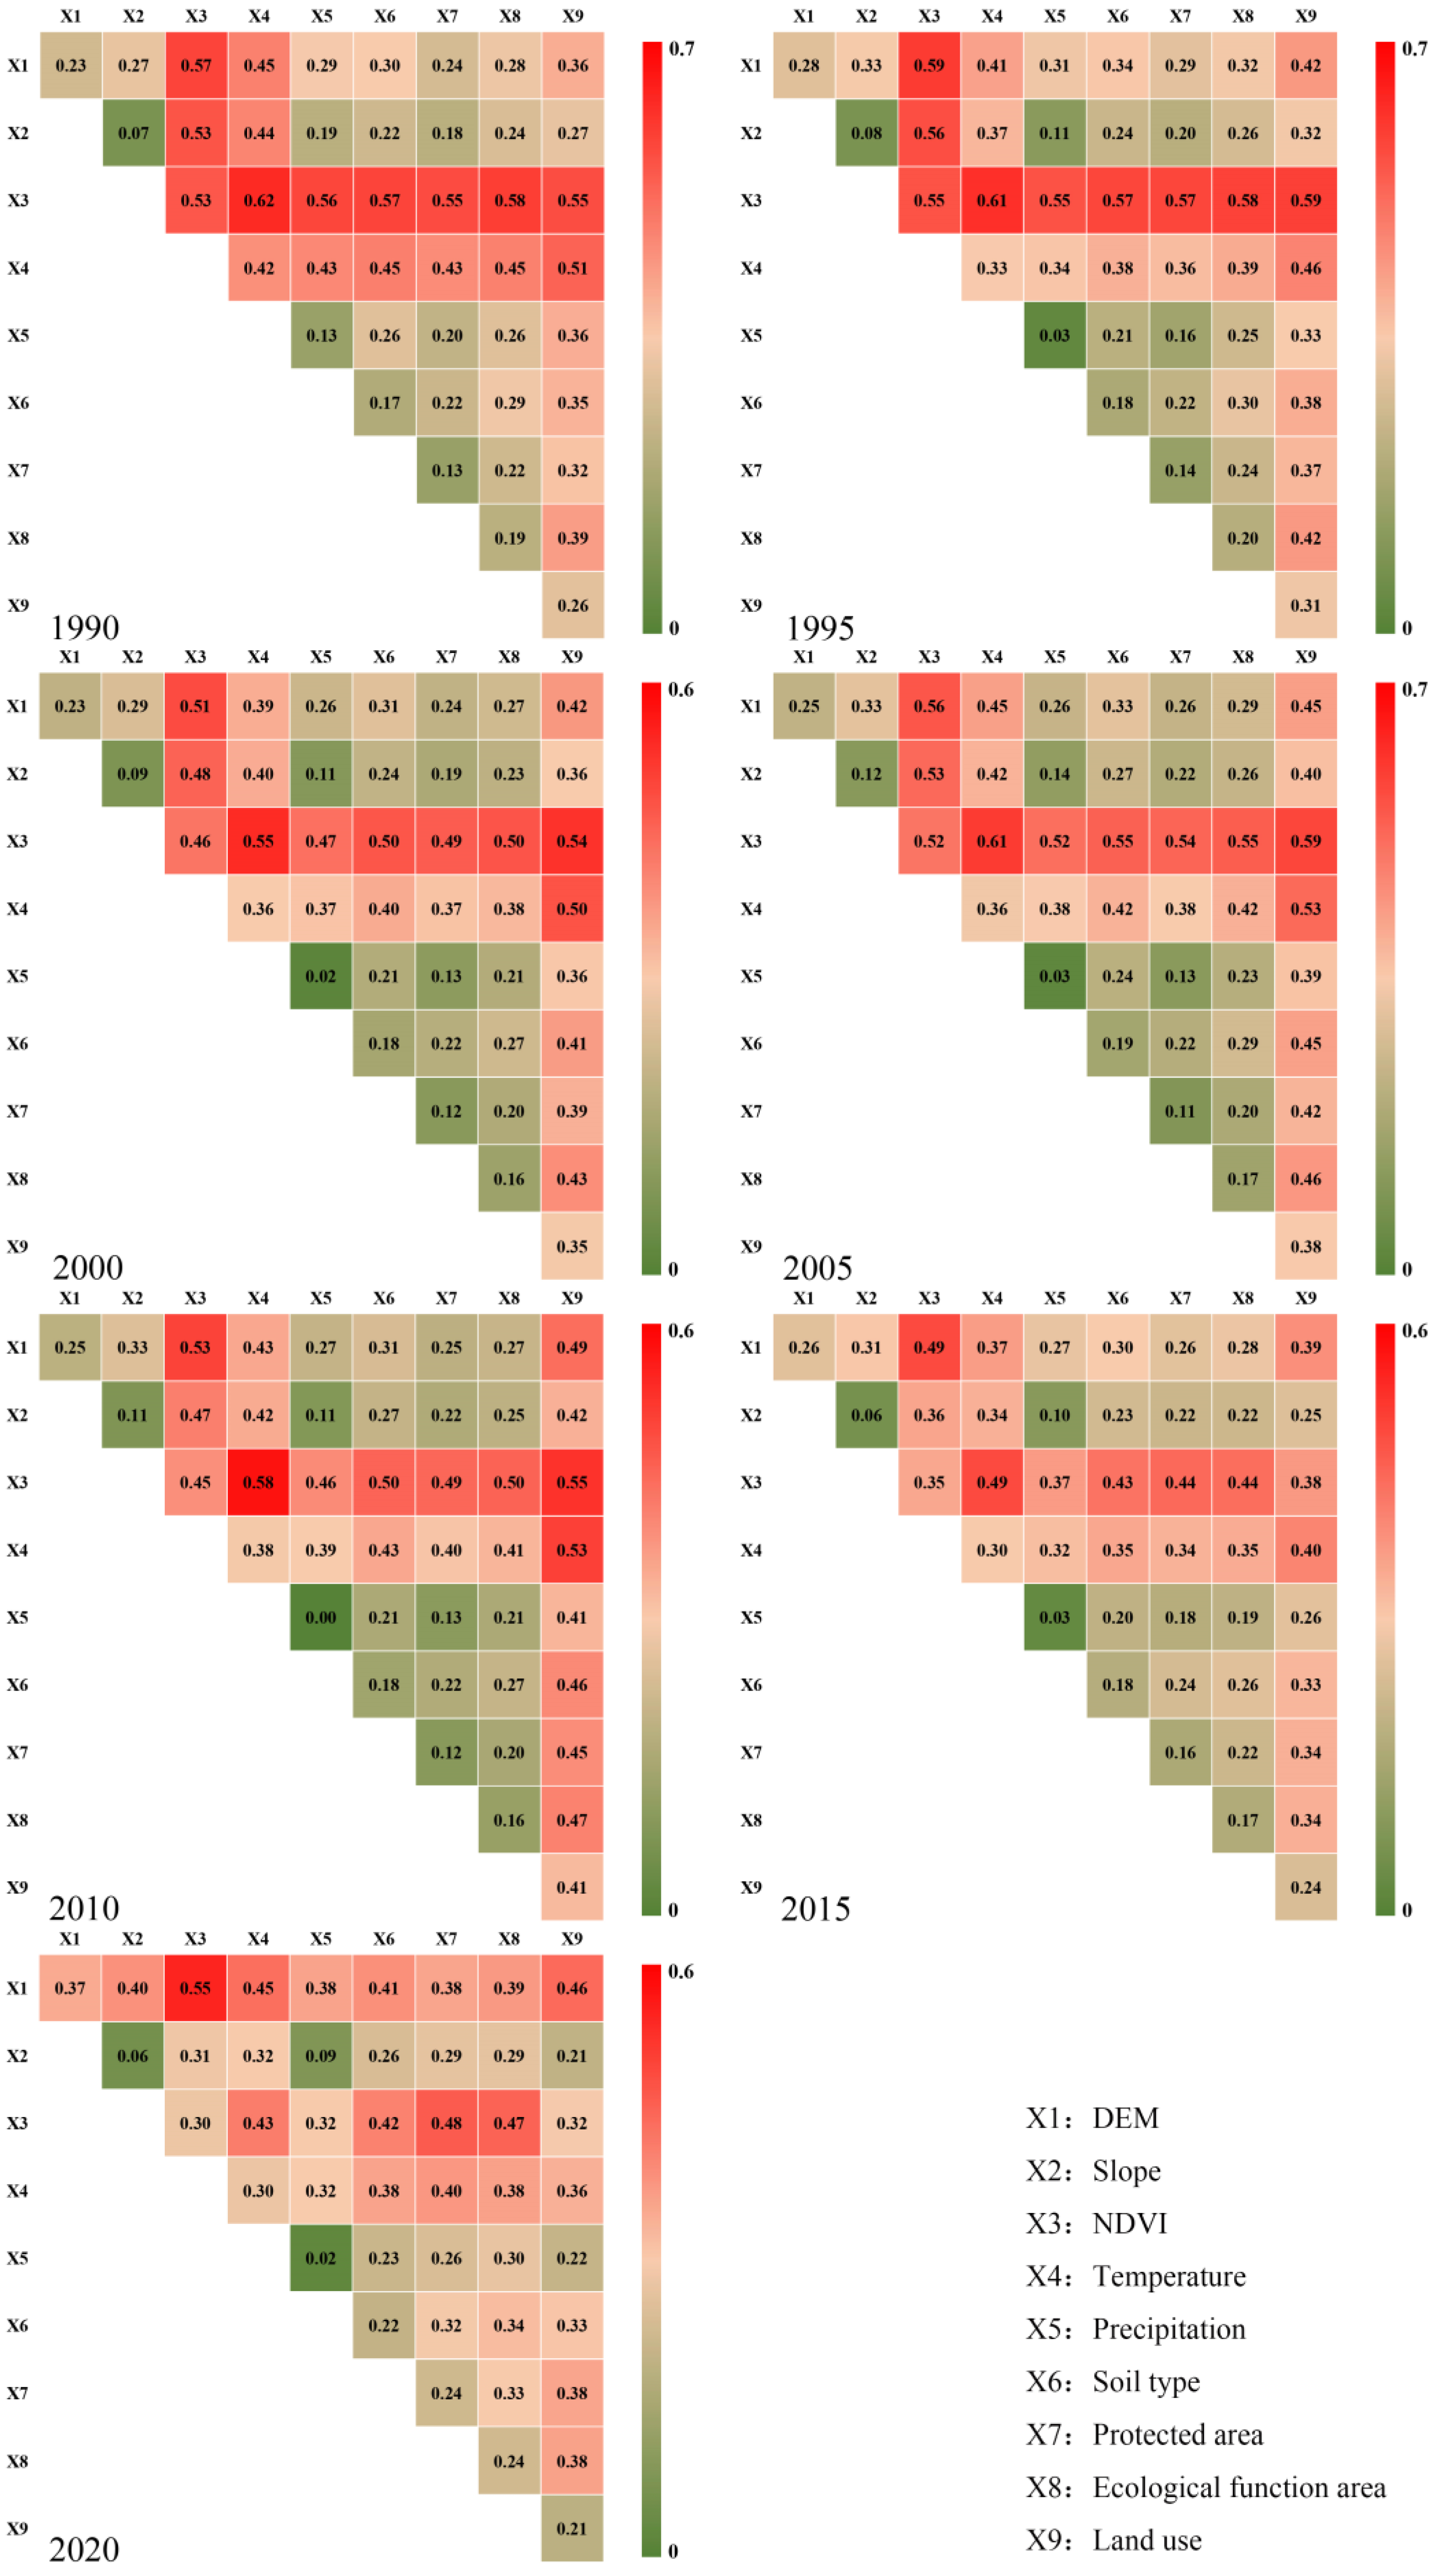
The interaction detection results for the factors across seven different periods (Figure 8) consistently indicated that the interaction between any two influencing factors on the spatial differentiation of ecological environmental quality was greater than the isolated effect of each individual factor, with all the interactions exhibiting synergistic enhancement. This demonstrates that the spatial differentiation in ecological environmental quality within the study area was not dictated by solitary factors, but rather by the interplay of multiple factors. The collective influence of natural geographic, policy protection, and socioeconomic factors often led to an amplified explanatory effect, with a multitude of factors jointly shaping the spatial differentiation in ecological environmental quality.
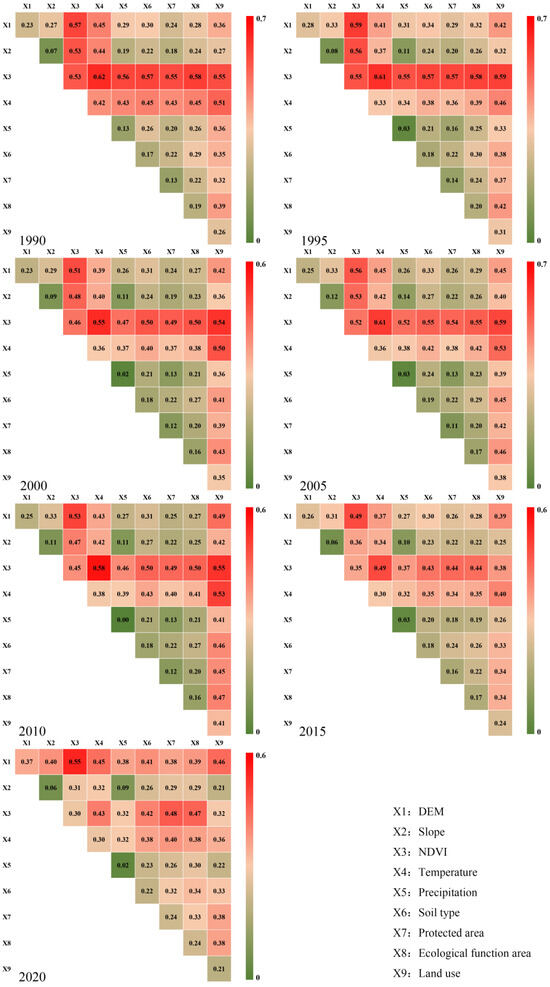
Figure 8.
Interactive detection results of each factor.
Based on the results of the factor detection, an analysis was further conducted integrating the MGWR to examine the response of the main driving factors to the spatial differentiation in ecological environmental quality in the study area. It was found that NDVI and temperature exhibited significant collinearity (Figure 8). Considering the impact of protected areas on the ecological environmental quality of the study area, the temperature factor was replaced with the protected area factor for the MGWR analysis. The results (Table 5) indicated that the average adjusted R-squared (adj.R2) value for the regression outcomes of different periods was 0.874, and there was an overall upward trend in adj.R2 over time, signifying a clear spatial correlation between the spatial differentiation in ecological environmental quality and the main driving factors, with this correlation strengthening over time.
Table 5.
Results of multiscale geographically weighted regression.
The bandwidth was the most crucial parameter of the MGWR, with a smaller value indicating higher spatial heterogeneity. Among the driving factors, NDVI had the smallest bandwidth, suggesting it had the most significant spatial heterogeneity. The bandwidths for NDVI and DEM showed a downward trend, indicating an increase in their spatial heterogeneity over time.
The bandwidths for the land use and protected area factors exhibited significant variability over time. After 1995, the bandwidth for land use mostly presented a decreasing trend, except for a sudden increase in 2010, whereas the bandwidth for the protected area factor hit its lowest in the same period. In 2015, the bandwidth for land use diminished, and that for protected areas grew, but by 2020, the bandwidth for protected areas had gradually decreased once more. This suggests that, even with the expansion of the urbanization process and increased human disturbance, the impact of conservation policies continued to drive improvements in the ecological environmental quality of the study area.
4. Discussion
4.1. Ecological Quality Changes and Influences in the Study Area
Based on the GEE platform, this study calculated the RSEI to determine the changes in ecological environmental quality in the Qinling region from 1990 to 2020. The results showed that the ecological environmental quality experienced a degradation phase from 1990 to 2005. As depicted in Figure 6, the areas of degradation were mainly concentrated at elevations below 1600 m and slopes less than 10°, specifically in the administrative regions of Ankang and Shangluo cities. These cities, located in low-elevation valley basins, were areas within the Qinling region where socioeconomic development and urban land expansion were rapid [42]. In this phase, human activities such as extractive mining, urban expansion, and unsustainable cultivation [43,44] caused a rapid decrease in NDVI in these areas and led to significant environmental damage, resulting in the degradation of ecological environmental quality [17]. The detector results (Table 4) also confirmed that NDVI and land use were the primary factors affecting RSEI.
As urbanization developed in the study area [42], a significant ecological improvement was observed from 2005 onward, largely due to vegetation conservation initiatives undertaken by the government. Since 2000, the Qinling region has implemented measures such as natural forest conservation and advancing the GFG project [45]. By 2021, the coverage of natural forests in the region had reached 3.56 million hectares, with 840.5 thousand hectares subjected to de-farming [46]. These actions have led to an increase in the vegetation coverage, which in turn has benefited the ecological environment [47]. Notably, areas at higher altitudes saw more rapid improvements, aligning with Zhang’s research in the Qilian Mountains [48]. Although variations existed in the ecological environmental quality trends among the different cities within the study area (Figure 6), the overall trajectory for the past 30 years has been positive, reflecting the effectiveness of the ecological restoration efforts undertaken.
This study employed geodetector to reveal the factors influencing ecological environmental quality in the area. NDVI emerged as the principal factor, exerting the greatest impact on the ecological environmental quality of the study area, followed by temperature, which is consistent with the findings of Cui’s research in the upper Yellow River basin [49]. This is because surface vegetation cover proves to be a crucial regulator of surface moisture, energy exchange, and ecosystem balance, effectively curtailing environmental challenges like soil erosion [50]. As a contributing factor, an increase in temperature can lead to soil desiccation, subsequently impacting ecological environmental quality by altering vegetation growth patterns [51,52].
The ecological environment is influenced by both natural factors and human activities, with the latter still playing a dominant role [53]. In the Qinling region, ecological quality positively correlates with the intensity of management, and inversely with human disturbance. This indicates that stringent management measures effectively mitigate human impacts on the environment [54]. In this study, an analysis of data over the past 30 years reveals a declining trend in the q values for both NDVI and temperature. Simultaneously, the q values for land use increased before the year 2010 and then began to decrease. Additionally, the q values for protected areas declined before 2010 but surged rapidly thereafter. This trend indicates that prior to 2010, especially before 2005, the ecological environment of the Qinling Mountains in Shaanxi was increasingly disturbed by human activities despite the constraints and regulations of protected areas due to urbanization [55]. Following the implementation of the Qinling Ecological Protection Regulation in 2006 and the introduction of even stricter ecological and environmental protection measures in the Qinling area in 2018 [56], the pace of social development and urbanization continued unabated. However, the stringent constraints of ecological protection policies significantly mitigated the negative impacts of developmental activities and strengthened ecological and environmental restoration efforts. This improvement is highly consistent with the current state of ecological environmental protection in the Qinling Shaanxi section, and the results obtained from the MGWR analysis (Table 5) also support this conclusion.
Indeed, the implementation of ecological protection policies in China since 2010 has significantly improved the ecological quality across various regions. Nearly two decades of research in the Erhai Lake basin has revealed overall enhancements in the ecological environment, particularly in the less frequented high-altitude areas. However, urbanization has exerted pressure on the ecological environment in the densely populated low-altitude regions [57]. Long-term RSEI-based studies in Fuzhou [58], Taihu Lake [59], Zijin Mountain [60], Wugong Mountain [61], and the Qilian Mountains [62] have further confirmed that ecological environments are better preserved in high-altitude and steep areas where the terrain limits development. These findings resonate with the situation in the Qinling region and reinforce the importance of ecological protection policies in maintaining and improving the ecological environment.
4.2. Limitations and Future Research Directions
The RSEI evaluation’s accuracy has been validated both qualitatively and quantitatively. Qualitative comparisons with 2020’s EI results, depicted in Figure 2, show that RSEI correlates more closely with geographic locations, offering a refined view of the ecological environment’s spatiotemporal variations and providing essential data for analyzing driving forces. For a quantitative accuracy assessment, we conducted ecological environmental surveys in June 2023, examining the ecological conditions and vegetation cover at 12 locations in the Qinling region, with specifics detailed in Supplementary Table S1. Despite the time gap, these surveys reveal consistent patterns. By comparing the surveyed ecological grades with RSEI’s assessments via a confusion matrix, we determined an accuracy rate of 83.3% for RSEI in remote sensing ecological evaluations.
Although qualitative and quantitative evaluations indicate that the accuracy of the RSEI is generally sufficient, certain limitations must be acknowledged. RSEI’s reliance on remote sensing methods introduces a notable sensitivity to the timing of image captures. Variability in the dates of image acquisition can induce significant discrepancies, with potential errors in RSEI of up to 19.2% within a one-month period [63]. Furthermore, the demand for cloud-free images over large areas exacerbates the issue of the data revisit period. This study has also employed a commonly used method to address this issue by using median calculations with data from the target year combined with the two years before and after [64]. However, it is inevitable that annual RSEI values may still fluctuate significantly between adjacent years. In terms of improving temporal resolution, MODIS imagery with its 16-day revisit period has been utilized to monitor ecological quality over large areas, although this approach inevitably loses some detail due to the inherent spatial resolution limitations [65]. The recently developed Continuous Change Detection and Classification (CCDC) technique fully leverages the available observations in time-series imagery [63] and enables the synthesis of images at any given time [66]. Therefore, integrating the strengths of multi-source remote sensing data and enhancing algorithms to optimize temporal and spatial resolution for obtaining continuous time-series images over large areas is a direction for achieving more precise and continuous ecological quality monitoring.
The ecological environment is complex, making it difficult to measure with a single indicator. The current RSEI index, which includes four indicators, cannot fully represent the ecological state of a region. For example, it does not consider the impact of water on the ecological environment, because RSEI is not suitable for assessing the ecological quality of water [59]. Water is an indispensable component of the watershed ecological environment, and future research should further incorporate the ecological effects of water into the regional ecological environmental assessment system. Despite its limitations, it is among the most comprehensive ecological assessment tools available [67]. The Qinling region’s uniform vegetation and consistent geomorphology lend credibility to the RSEI assessment results in this study. However, to further improve the accuracy of the assessment, scholars are considering the introduction of more diversified spatial data indicators, such as gross primary product (GPP), land aerosol optical depth (AOD), et al. [57]. In addition, some researchers have demonstrated that the improved RSEI with sharpened LST imagery can effectively quantify regional ecological status, which is also a direction for improving assessment precision [65]. Therefore, it is crucial to develop and optimize new evaluation indicators for regions with distinct characteristics, and to establish a more rational, scientific, and comprehensive ecological environmental quality assessment system. The enhancement of ecological quality assessments depends on this critical development.
5. Conclusions
This study selected seven sets of Landsat remote sensing image data from 1990 to 2020, utilizing the GEE platform to construct an RSEI to analyze the changes in ecological environment quality of the Qinling region over 30 years. The conclusions are as follows:
- (1)
- From 1990 to 2020, the overall quality of the ecological environment in the study area showed an upward trend, with characteristics of different stages. From 1990 to 2005, it was a phase of ecological degradation, with the changes in ecological grade being light and significant degradation, accounting for 10.86% of the total area, which was higher than the 7.43% of the area that showed improvement. From 2005 to 2020, it was a phase of ecological improvement, with changes in ecological grade mostly reflecting light improvements. The area of improvement increased to 51.86%, while the areas of light and significant degradation decreased by 97.24%.
- (2)
- The ecological environmental quality of the study area exhibits significant spatial heterogeneity. Areas with altitudes below 1200 m and slopes less than 10° have the poorest ecological quality, which mainly transitioned from moderate to good over 30 years. In contrast, areas above 1600 m in altitude within the key and core protected areas have the best ecological quality, primarily transitioning from good to excellent. Regions where ecological grades have degraded were mainly located in Ankang, Hanzhong, Shangluo, and Weinan cities. These cities should place a high priority on ecological environmental protection and high-quality development.
- (3)
- The spatiotemporal changes in the ecological environmental quality of the study area are influenced by multiple factors, among which NDVI, DEM, land use, and protected areas were key driving factors. The coupled and coordinated effects of the Qinling ecological protection policies and socioeconomic factors have created an enhancing effect on the differentiation of ecological environmental quality.
- (4)
- This study has delineated the trends of ecological environmental quality in the Qinling region across three decades, highlighting the significant effects of ecological protection measures and the expansion of vegetation cover on the region’s ecological quality. Continuous monitoring is essential for the sustainable development of this critical ecological zone. This study’s insights can offer a scientific foundation for the protection of the ecological environment and the promotion of high-quality development of the Qinling area.
Supplementary Materials
The following supporting information can be downloaded at https://www.mdpi.com/article/10.3390/su16083251/s1: Figure S1: Ecological protection areas in the Qinling region (downloaded and briefly translated from the government website (http://www.shaanxi.gov.cn/zfxxgk/zfgb/2020/d17q/202009/t20200921_1728563.html). Figure S2: Ecological function area in the Qinling region; Table S1: Validation of RSEI results based on field ecological environment surveys.
Author Contributions
Conceptualization, J.L. and T.X.; methodology, J.L. and T.X.; software, J.L.; validation, D.L., L.C. and Q.L.; formal analysis, D.L. and L.C.; investigation, J.L. and T.X.; resources, T.X.; data curation, D.L., L.C. and Q.L.; writing—original draft preparation, J.L.; writing—review and editing, T.X. and D.L.; visualization, J.L.; supervision, T.X.; project administration, D.L. and L.C.; funding acquisition, T.X. All authors have read and agreed to the published version of the manuscript.
Funding
This research was funded by the Shaanxi Provincial Public Welfare Geological Survey Project, grant number 202311; the Key Research and Development Program of Shaanxi, grant number 2021SF2–01; the Young Talent Fund of Association for Science and Technology in Shaanxi, China, grant number 20230125; and the Shaanxi Province Financial Special Project “Construction and Demonstration Application of Qinling Satellite Remote Sensing Integrated Monitoring Service Platform”, grant number 202254.
Institutional Review Board Statement
Not applicable.
Informed Consent Statement
Not applicable.
Data Availability Statement
The data presented in this study are available on request from the corresponding author.
Conflicts of Interest
The authors declare no conflicts of interest.
References
- Wang, J.; Zhou, W.Q.; Xu, K.P.; Yan, J.L.; Li, W.F.; Han, L.J. Quantitative assessment of ecological quality in Beijing-Tianjin-Hebei urban megaregion, China. Chin. J. Appl. Ecol. 2017, 28, 2667–2676. (In Chinese) [Google Scholar] [CrossRef]
- Xu, W.H.; Xiong, Y.; Huang, S.D.; Wang, L.G.; Kong, L.; Qian, R.; Kang, Q.W.; Dai, D.F. Review and research progress of the application of remote sensing in ecological environment quality monitoring and evaluation. J. Southwest For. Univ. 2023, 43, 195–204. (In Chinese) [Google Scholar] [CrossRef]
- Baig, M.H.A.; Zhang, L.; Shuai, T.; Tong, Q. Derivation of a tasselled cap transformation based on Landsat 8 at-satellite reflectance. Remote Sens. Lett. 2014, 5, 423–431. [Google Scholar] [CrossRef]
- Strobel, C.J.; Buffum, H.W.; Benyi, S.J.; Paul, J.F. Environmental monotoring and assessment program: Current status of Virginian Province (US) estuaries. Environ. Monit. Assess. 1999, 56, 1–25. [Google Scholar] [CrossRef]
- Ivits, E.; Buchanan, G.; Olsvig-Whittaker, L.; Cherlet, M. European Farmland Bird Distribution Explained by Remotely Sensed Phenological Indices. Environ. Model. Assess. 2011, 16, 385–399. [Google Scholar] [CrossRef]
- Guo, W.H.; Wu, L.M.; Zuo, X.Q.; Gang, F. Water body extraction of Huainan city based on TM images. Geotech. Investig. Surv. 2018, 46, 64–67. (In Chinese) [Google Scholar]
- Coutts, A.M.; Harris, R.J.; Phan, T.; Livesley, S.J.; Williams, N.S.G.; Tapper, N.J. Thermal infrared remote sensing of urban heat: Hotspots, vegetation, and an assessment of techniques for use in urban planning. Remote Sens. Environ. 2016, 186, 637–651. [Google Scholar] [CrossRef]
- Xu, H.Q. A remote sensing index for assessment of regional ecological changes. China Environ. Sci. 2013, 33, 889–897. (In Chinese) [Google Scholar]
- Han, R.; Sha, J.; Li, X.; Lai, S.; Lin, Z.; Lin, Q.; Wang, J. Remote Sensing Analysis of Ecological Maintenance in Subtropical Coastal Mountain Area, China. Remote Sens. 2022, 14, 2734. [Google Scholar] [CrossRef]
- Chen, W.; Huang, H.P.; Tian, Y.C.; Du, Y.Y. Monitoring and Assessment of the Eco-Environment Quality in the Sanjiangyuan Region based on Google Earth Engine. J. Geo-Inf. Sci. 2019, 21, 1382–1391. (In Chinese) [Google Scholar] [CrossRef]
- Yang, K.S.; Lu, Y.; Weng, Y.M.; Wei, L.Z. Dynamic monitoring of ecological and environmental quality of the Nanliu River basin, supported by Google Earth Engine. J. Agric. Resour. Environ. 2021, 38, 1112–1121. (In Chinese) [Google Scholar] [CrossRef]
- Zhu, D.; Chen, T.; Wang, Z.; Niu, R. Detecting ecological spatial-temporal changes by Remote Sensing Ecological Index with local adaptability. J. Environ. Manag. 2021, 299, 113655. [Google Scholar] [CrossRef]
- Nie, X.; Hu, Z.; Ruan, M.; Zhu, Q.; Sun, H. Remote-Sensing Evaluation and Temporal and Spatial Change Detection of Ecological Environment Quality in Coal-Mining Areas. Remote Sens. 2022, 14, 345. [Google Scholar] [CrossRef]
- Zhang, H.; Gao, Y.; Hua, Y.; Zhang, Y.; Liu, K. Assessing and mapping recreationists’ perceived social values for ecosystem services in the Qinling Mountains, China. Ecosyst. Serv. 2019, 39, 101006. [Google Scholar] [CrossRef]
- Bai, R.; Li, J. Research on Institutional Guarantee of Ecological Compensation Mechanism for Water Source Area of the Middle Route Project of the South-to-North Water Transfer: Taking the Three Cities of Southern Shaanxi in Qinling Area as Examples. Ecol. Econ. 2022, 38, 209–214. (In Chinese) [Google Scholar]
- Yin, S.; Zhao, Y.H.; Han, L.; Wang, Y.B.; Cai, J. Evaluation of the forest ecosystem service values in Qinling, China. Chin. J. Appl. Ecol. 2016, 27, 3777–3786. (In Chinese) [Google Scholar] [CrossRef]
- Wang, T.; Bai, H.Y. Variation of vegetation NDVI in response to climate changes and human activities in Qinling Mountains. Mt. Res. 2017, 35, 778–789. (In Chinese) [Google Scholar] [CrossRef]
- Li, C.; Gao, X.; Xi, Z. Characteristics, hazards, and control of illegal villa (houses): Evidence from theNorthern Piedmont of Qinling Mountains, Shaanxi Province, China. Environ. Sci. Pollut. Res. 2019, 26, 21059–21064. [Google Scholar] [CrossRef] [PubMed]
- Li, Y.; Vina, A.; Yang, W.; Chen, X.; Zhang, J.; Ouyang, Z.; Liang, Z.; Liu, J. Effects of conservation policies on forest cover change in giant panda habitat regions, China. Land. Use Policy 2013, 33, 42–53. [Google Scholar] [CrossRef] [PubMed]
- Zhao, K.; Shi, Y.; Niu, M.J. Research on the temporal and spatial changes of vegetation coverage in Qinling mountains based on Google Earth Engine platform. Bull. Surv. Mapp. 2022, 5, 49–55. (In Chinese) [Google Scholar] [CrossRef]
- Guo, S.Z. Land Cover Change and Its Driving Factors in Qinling Mountainous from 1980 to 2015. Master’s Thesis, Northwest University, Xi’an, China, 2019. [Google Scholar]
- Ren, H.; Chen, C.; Li, Y.; Zhu, W.; Zhang, L.; Wang, L.; Zhu, L. Response of Vegetation Coverage to Climate Changes in the Qinling-Daba Mountains of China. Forests 2023, 14, 425. [Google Scholar] [CrossRef]
- Wang, B.; Xu, G.; Li, P.; Li, Z.; Zhang, Y.; Cheng, Y.; Jia, L.; Zhang, J. Vegetation dynamics and their relationships with climatic factors in the Qinling Mountains of China. Ecol. Indic. 2020, 108, 105719. [Google Scholar] [CrossRef]
- Yu, F.; Li, C.; Yuan, Z.; Luo, Y.; Yin, Q.; Wang, Q.; Hao, Z. How do mountain ecosystem services respond to changes in vegetation and climate? An evidence from the Qinling Mountains, China. Ecol. Indic. 2023, 154, 110922. [Google Scholar] [CrossRef]
- Cui, L.; Zhao, Y.; Liu, J.; Han, L.; Ao, Y.; Yin, S. Landscape ecological risk assessment in Qinling Mountain. Geol. J. 2018, 53, 342–351. [Google Scholar] [CrossRef]
- Kang, Y. Spatial Distribution Pattern and Strategy for Water Conservation Function of Vegetation in Qinling Mountains. Master’s Thesis, NorthWest University, Xi’an, China, 2005. [Google Scholar]
- Zhang, Y.; Bai, H.; Su, K.; Huang, X.; Meng, Q.; Guo, S. Spatial variation of extreme temperature change on southern and northern slopes of Shaanxi section in Qinling Mountains during 1960–2013. ACTA Geogr. Sin. 2018, 73, 1296–1308. (In Chinese) [Google Scholar] [CrossRef]
- Ji, Y.H.; Zhou, G.S.; Wang, S.D.; Wang, L.X.; Zhou, M.Z. Evolution characteristics and its driving forces analysis of vegetation ecological quality in Qinling Mountains region from 2000 to 2019. Chin. J. Plant Ecol. 2021, 45, 617–625. (In Chinese) [Google Scholar] [CrossRef]
- Xu, H.Q. A study on information extraction of water body with the Modified Normalized Difference Water Index (MNDWI). J. Remote Sens. 2005, 9, 589–595. (In Chinese) [Google Scholar]
- Yang, J.; Huang, X. The 30 m annual land cover dataset and its dynamics in China from 1990 to 2019. Earth Syst. Sci. Data 2021, 13, 3907–3925. [Google Scholar] [CrossRef]
- Zhou, L.; Liu, H.; Tang, D.W.; Sun, Y.; Chang, S.; Liu, X.F. Ecological Quality Assessment and Driving Force Analysis in Wuling Mountain Area from 2001 to 2020. J. Southwest For. Univ. 2024, 44, 1–11. (In Chinese) [Google Scholar]
- Geospatial Data Cloud Site; Computer Network Information Center; Chinese Academy of Sciences. GDEMV3 30M Resolution Digital Elevation Data. Available online: https://www.gscloud.cn/sources/details/aeab8000652a45b38afbb7ff023ddabb?pid=302 (accessed on 10 January 2022).
- National Earth System Science Data Center. National Science & Technology Infrastructure of China. 2020. Available online: https://www.geodata.cn/data/datadetails.html?dataguid=192891852410344&%20docId=686 (accessed on 15 April 2022).
- Xu, X. Multi-Temporal Ecosystem Type Spatial Distribution Data in China. 2022. Available online: https://www.resdc.cn/DOI/doi.aspx?DOIid=131 (accessed on 12 June 2023).
- Wang, H.; Meng, X. Soil Map Based Harmonized World Soil Database (v1.2); National Tibetan Plateau Data Center/Third Pole Environment Data Center: Beijing, China, 2018. [Google Scholar]
- HJ 192-2015; Technical Criterion for Ecosystem Status Evaluation. Ministry of Ecology and Environment of the People’s Republic of China: Beijing, China, 2015.
- Zhi, Y.; Wang, Z.; Ma, Z.; Han, X.; Li, J.; Ren, P.; Li, H.; Gao, T.; Bai, F. Research on Ningxia’s resource and environmental performance and its changing trends. Acta Ecol. Sin. 2009, 29, 6490–6498. (In Chinese) [Google Scholar]
- Ma, Y.; Yu, G.; Ma, Y.; Ma, W. Remote sensing geological evaluation of ecological environmental changes in Qinghai Province during the past 20 years (2000–2020). Miner. Explor. 2024, 15, 202403014. (In Chinese) [Google Scholar] [CrossRef]
- Shaanxi Provincial Department of Ecology and Environment. 2020 Shaanxi Province Ecological Environment Status Bulletin. Available online: https://sthjt.shaanxi.gov.cn/html/hbt/zfxxgk/xxgkhjzl/hjzkgb/70809.html (accessed on 20 June 2023).
- Wang, J.; Xu, C. Geodetector: Principle and prospective. Acta Geogr. Sin. 2017, 72, 116–134. (In Chinese) [Google Scholar] [CrossRef]
- Fotheringham, A.S.; Yang, W.; Kang, W. Multiscale Geographically Weighted Regression (MGWR). Ann. Am. Assoc. Geogr. 2017, 107, 1247–1265. [Google Scholar] [CrossRef]
- Wu, W.; Zhao, Y.; Tian, H.; Chen, Y. Spatio-temporal variation characteristics and driving mechanism of habitat quality of Qinling Mountains in recent 40 year. J. Earth Environ. 2023, 14, 488–504. (In Chinese) [Google Scholar] [CrossRef]
- Chen, C.; Zhu, L.; Tian, L.; Li, X. Spatial-temporal changes in vegetation characteristics and climate in the Qinling-Daba Mountains. Acta Ecol. Sin. 2019, 39, 3257–3266. (In Chinese) [Google Scholar] [CrossRef]
- Deng, C.H.; Bai, H.Y.; Gao, S.; Liu, R.J.; Ma, X.P.; Huang, X.Y. Spatial-temporal Variation of the Vegetation Coverage in Qinling Mountains and Its Dual Response to Climate Change and Human Activities. J. Nat. Resour. 2018, 33, 425–438. (In Chinese) [Google Scholar] [CrossRef]
- He, J.; Ma, Z.; Chen, X. Ecological and Economic Benefits of Grain-to-green Program in Qinba Mountainous Area. Bull. Soil Water Conserv. 2012, 32, 251–260. (In Chinese) [Google Scholar] [CrossRef]
- Shen, D. Forest Coverage in Shaanxi’s Qinling Region Reaches 72.95%. Available online: http://www.shaanxi.gov.cn/xw/sxyw/202104/t20210422_2160763_wap.html (accessed on 2 June 2022).
- Cui, G.; Zhang, Y.; Chao, Y.; Zhao, Y.; Pan, B. Land use change and eco-environmental effects in Qinling Mountains in recent 40 years. Res. Soil Water Conserv. 2022, 30, 319–326. (In Chinese) [Google Scholar] [CrossRef]
- Zhang, H.; Song, J.Y.; Li, M.; Han, H.W. Eco-environmental quality assessment and cause analysis of Qilian Mountain National Park based on GEE. Chin. J. Ecol. 2021, 40, 1883–1894. (In Chinese) [Google Scholar] [CrossRef]
- Cui, Y.T.; Li, H.; Zheng, L.X.; Wu, M.Q. Study of ecological environmental quality changes in the upper Yellow River basin based on remote sensing ecological index. Jour. De. Re. 2023, 43, 107–117. (In Chinese) [Google Scholar]
- Zhang, Y.; Lu, X.; Liu, B.; Wu, D.; Fu, G.; Zhao, Y.; Sun, P. Spatial relationships between ecosystem services and socioecological drivers across a large-scale region: A case study in the Yellow River Basin. Sci. Total Environ. 2021, 766, 142480. [Google Scholar] [CrossRef]
- Jnicke, C.; Okujeni, A.; Cooper, S.; Clark, M.; Linden, S.V.D. Brightness gradient-corrected hyperspectral image mosaics for fractional vegetation cover mapping in northern California. Remote Sens. Lett. 2020, 11, 1–10. [Google Scholar] [CrossRef]
- Piao, S.; Yin, G.; Tan, J.; Cheng, L.; Huang, M.; Li, Y.; Liu, R.; Mao, J.; Myneni, R.B.; Peng, S. Detection and attribution of vegetation greening trend in China over the last 30 years. Glob. Chang. Biol. 2015, 21, 1601–1609. [Google Scholar] [CrossRef] [PubMed]
- Zhang, Y.L.; Liu, L.S.; Bai, W.Q.; Shen, Z.X.; Yan, J.Z.; Ding, M.J.; Li, S.C.; Zheng, D. Grassland degradation in the source region of the Yellow River. ACTA Geogr. Sin. 2006, 61, 3–14. (In Chinese) [Google Scholar]
- Xu, H. Study on the Assessment of Ecological Status and Protection Effectiveness in Qinba Mountains. Ph.D. Thesis, Chengdu University of Technology, Chengdu, China, 2019. [Google Scholar]
- Guo, S.; Bai, H.; Meng, Q.; Huang, X.; Qi, G. Landscape pattern change and its response to anthropogenic disturbance in the Qinling Mountains during 1980 to 2015. Chin. J. Appl. Ecol. 2018, 29, 4080–4088. (In Chinese) [Google Scholar] [CrossRef]
- Shaanxi Provincial People’s Congress. Qinling Ecological Protection Regulation. Available online: http://lyj.shaanxi.gov.cn/zfxxgk/fdzdgknr/zcwj/gjzcfg/202305/t20230523_2287278.html (accessed on 13 June 2022).
- Xiong, Y.; Xu, W.; Lu, N.; Huang, S.; Wu, C.; Wang, L.; Dai, F.; Kou, W. Assessment of spatial–temporal changes of ecological environment quality based on RSEI and GEE: A case study in Erhai Lake Basin, Yunnan province, China. Ecol. Indic. 2021, 125, 107518. [Google Scholar] [CrossRef]
- Geng, J.; Yu, K.; Xie, Z.; Zhao, G.; Ai, J.; Yang, L.; Yang, H.; Liu, J. Analysis of spatiotemporal variation and drivers of ecological quality in Fuzhou based on RSEI. Remote Sens. 2022, 14, 4900. [Google Scholar] [CrossRef]
- Zhou, J.; Liu, W. Monitoring and Evaluation of Eco-Environment Quality Based on Remote Sensing-Based Ecological Index (RSEI) in Taihu Lake Basin, China. Sustainability 2022, 14, 5642. [Google Scholar] [CrossRef]
- Ren, F.; Xu, J.; Wu, Y.; Li, T.; Li, M. Analysis of Eco-Environmental Quality of an Urban Forest Park Using LTSS and Modified RSEI from 1990 to 2020—A Case Study of Zijin Mountain National Forest Park, Nanjing, China. Forests 2023, 14, 2458. [Google Scholar] [CrossRef]
- Gao, Y.; Li, Y.; Xu, H. Assessing ecological quality based on remote sensing images in Wugong Mountain. Earth Space Sci. 2022, 9, e2021EA001918. [Google Scholar] [CrossRef]
- Wang, H.; Liu, C.; Zang, F.; Liu, Y.; Chang, Y.; Huang, G.; Fu, G.; Zhao, C.; Liu, X. Remote sensing-based approach for the assessing of ecological environmental quality variations using Google Earth Engine: A case study in the Qilian Mountains, Northwest China. Remote Sens. 2023, 15, 960. [Google Scholar] [CrossRef]
- Sun, C.; Li, J.; Liu, Y.; Cao, L.; Zheng, J.; Yang, Z.; Ye, J.; Li, Y. Ecological quality assessment and monitoring using a time-series remote sensing-based ecological index (ts-RSEI). GIScience Remote Sens. 2022, 59, 1793–1816. [Google Scholar] [CrossRef]
- Wang, Y.; Zhao, Y.; Wu, J. Dynamic monitoring of long time series of ecological quality in urban agglomerations using Google Earth Engine cloud computing: A case study of the Guangdong-Hong Kong-Macao Greater Bay Area, China. Acta Ecol. Sin. 2020, 40, 8461–8473. [Google Scholar]
- Xu, H.; Wang, Y.; Guan, H.; Shi, T.; Hu, X. Detecting Ecological Changes with a Remote Sensing Based Ecological Index (RSEI) Produced Time Series and Change Vector Analysis. Remote Sens. 2019, 11, 2345. [Google Scholar] [CrossRef]
- Zhu, Z.; Woodcock, C.E. Continuous change detection and classification of land cover using all available Landsat data. Remote Sens. Environ. 2014, 144, 152–171. [Google Scholar] [CrossRef]
- Yang, Z.K.; Tian, J.; Li, W.Y.; Su, W.R.; Guo, R.Y.; Liu, W.J. Spatio-temporal pattern and evolution trend of ecological environment quality in the Yellow River Basin. Acta Ecol. Sin. 2021, 41, 7627–7636. (In Chinese) [Google Scholar] [CrossRef]


Disclaimer/Publisher’s Note: The statements, opinions and data contained in all publications are solely those of the individual author(s) and contributor(s) and not of MDPI and/or the editor(s). MDPI and/or the editor(s) disclaim responsibility for any injury to people or property resulting from any ideas, methods, instructions or products referred to in the content. |
© 2024 by the authors. Licensee MDPI, Basel, Switzerland. This article is an open access article distributed under the terms and conditions of the Creative Commons Attribution (CC BY) license (https://creativecommons.org/licenses/by/4.0/).