


Wireless Diagnosis and Control of DC–DC Converter for Off-Grid Photovoltaic Systems

Abstract
:1. Introduction
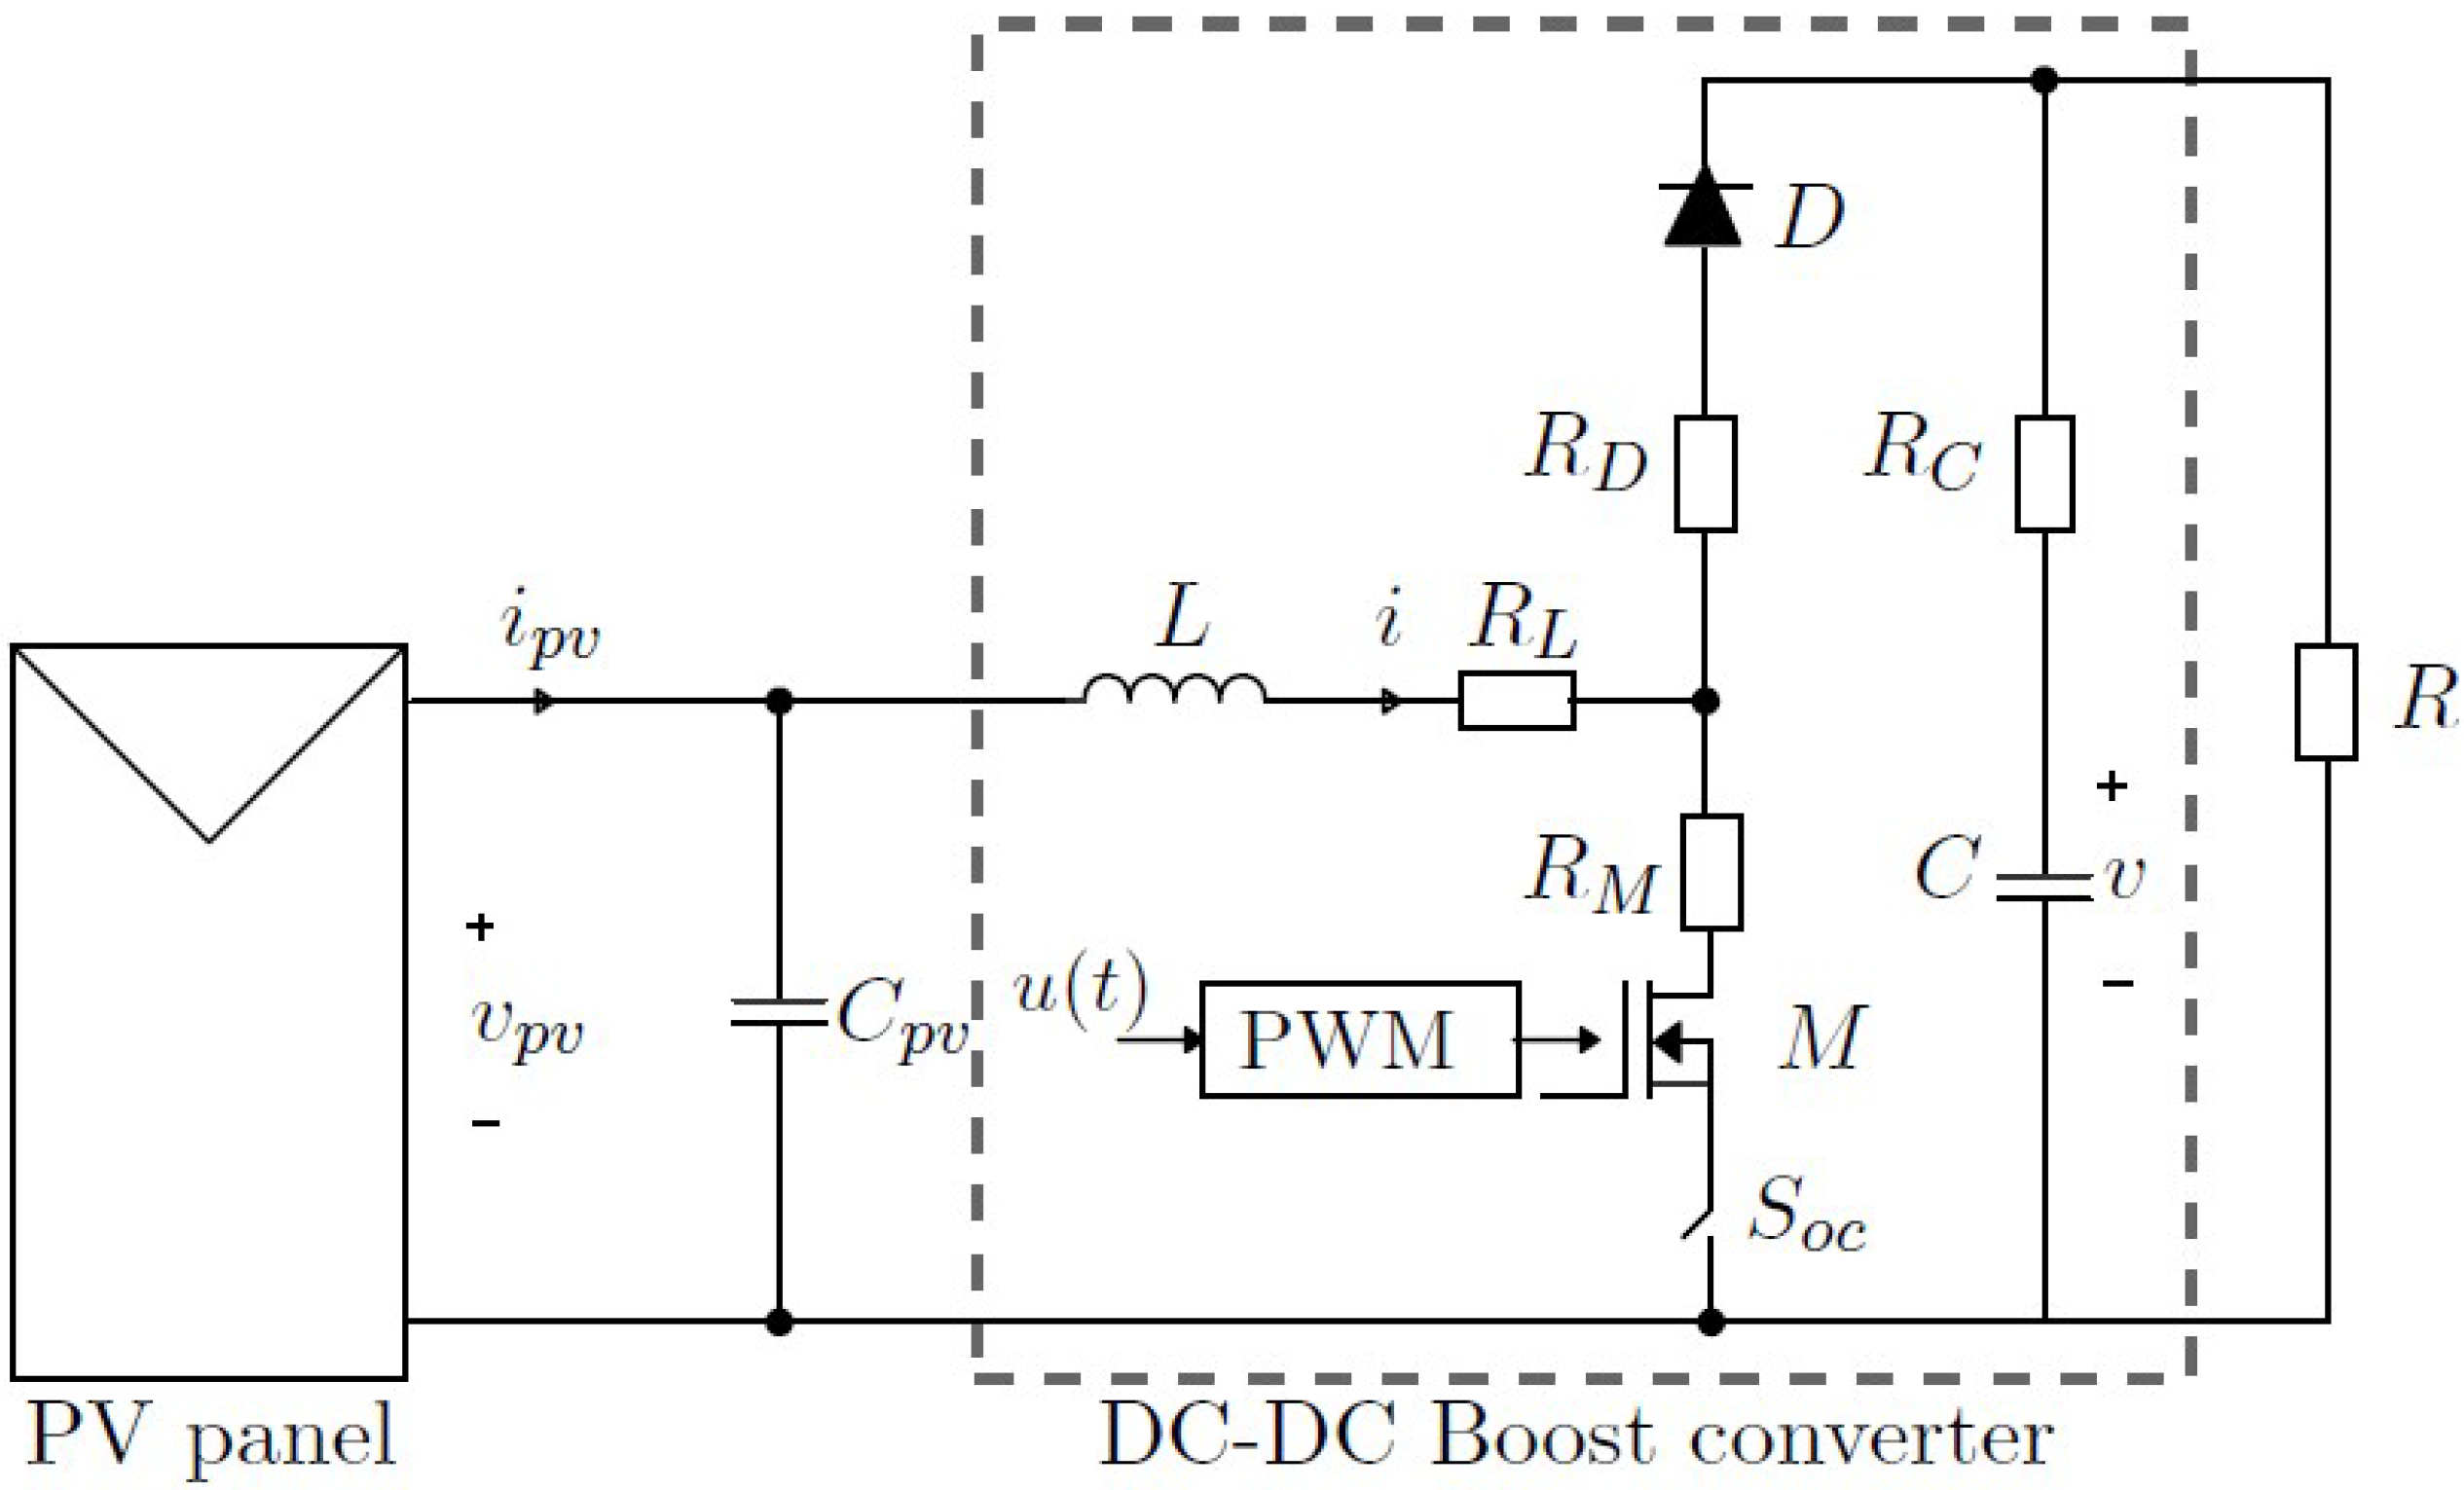
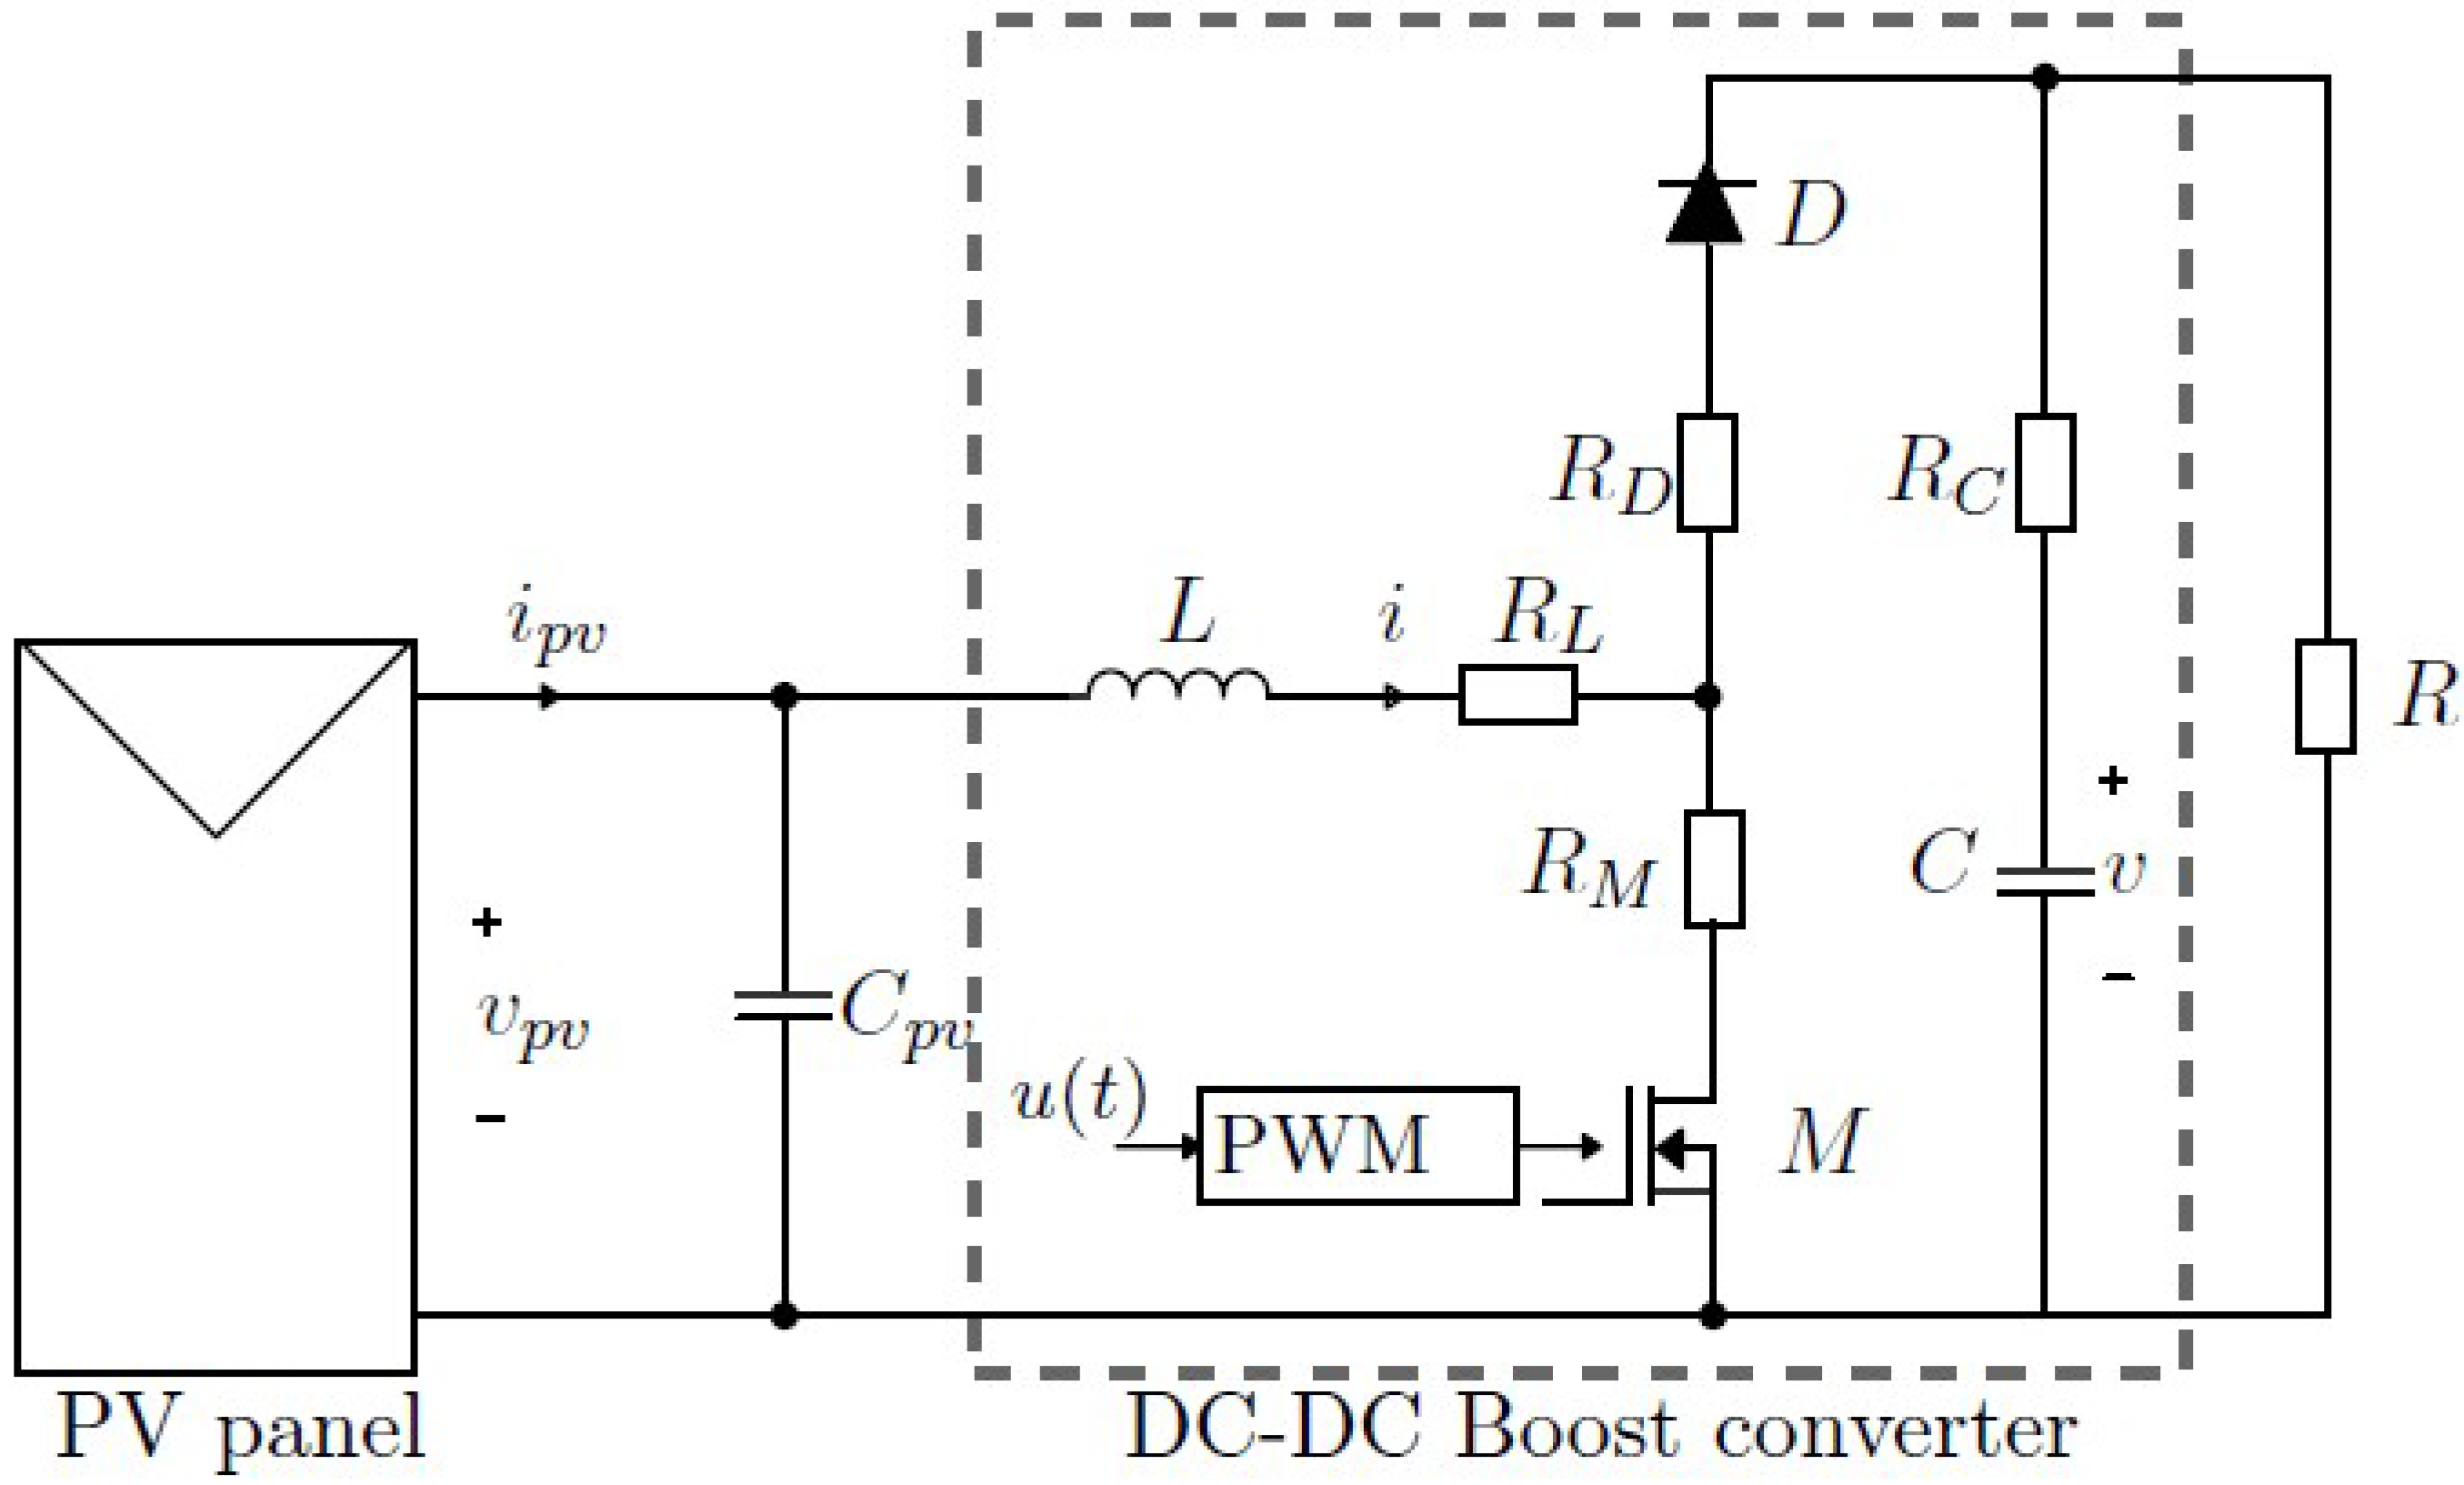
2. Photovoltaic Panel Model
TS Fuzzy Modelling
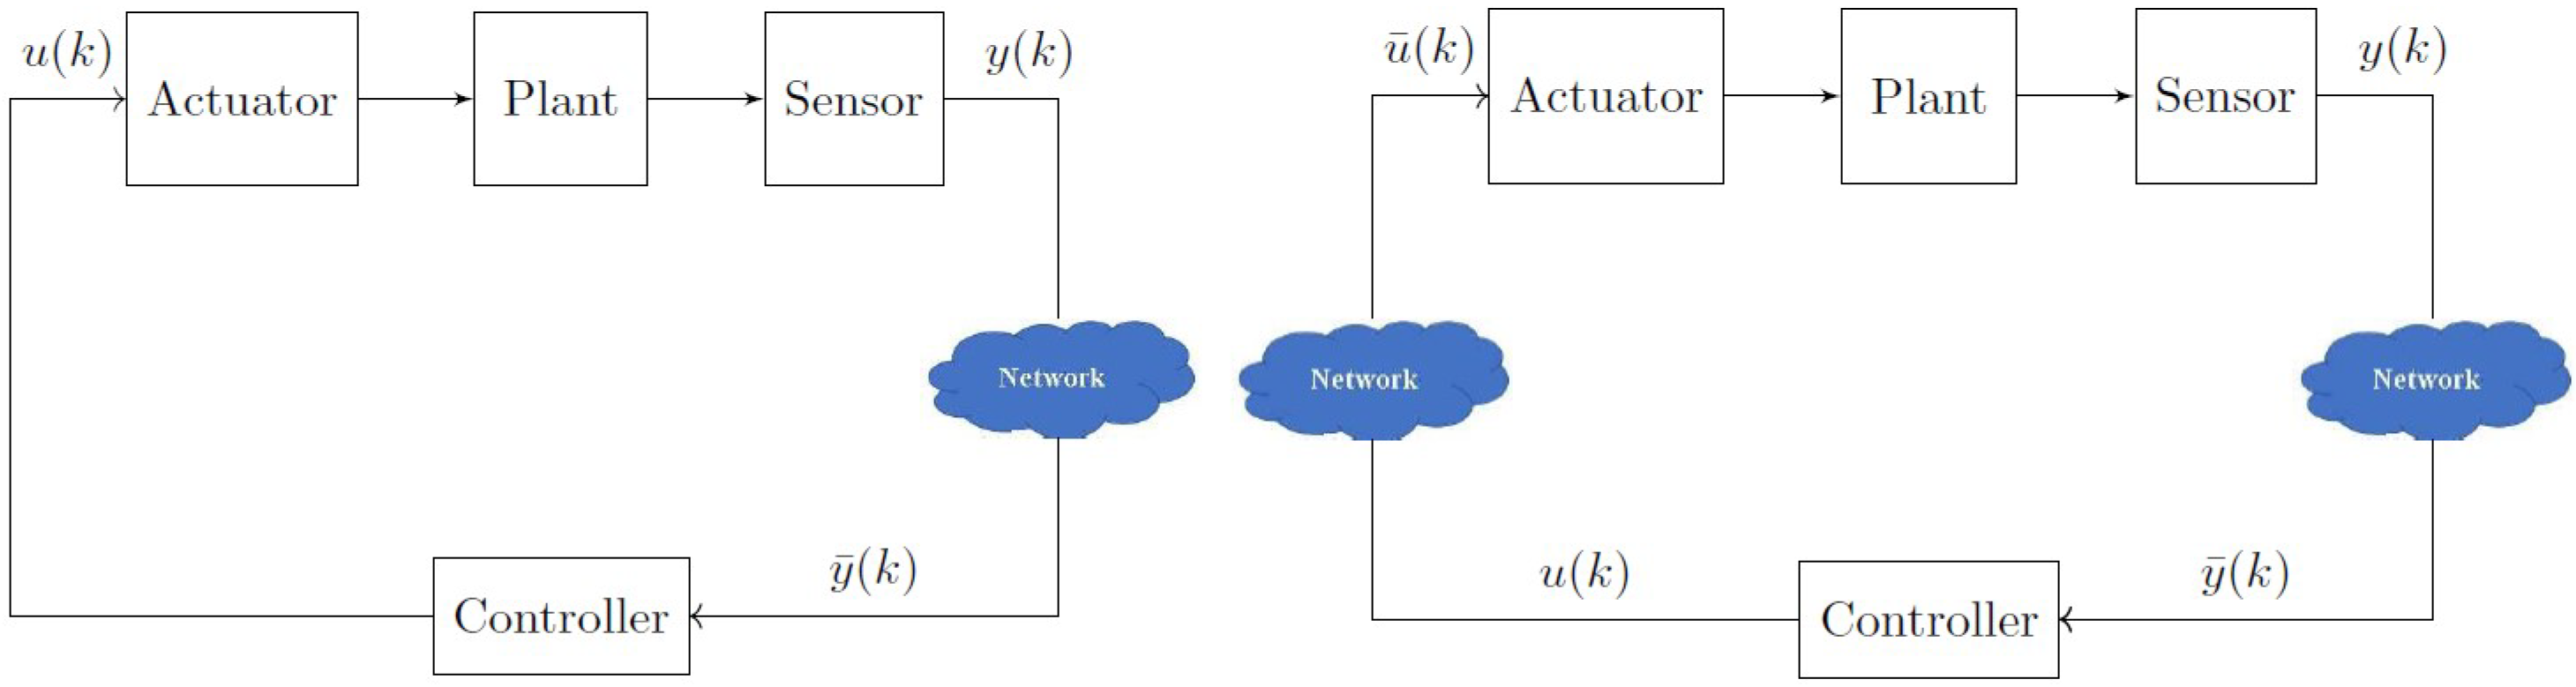
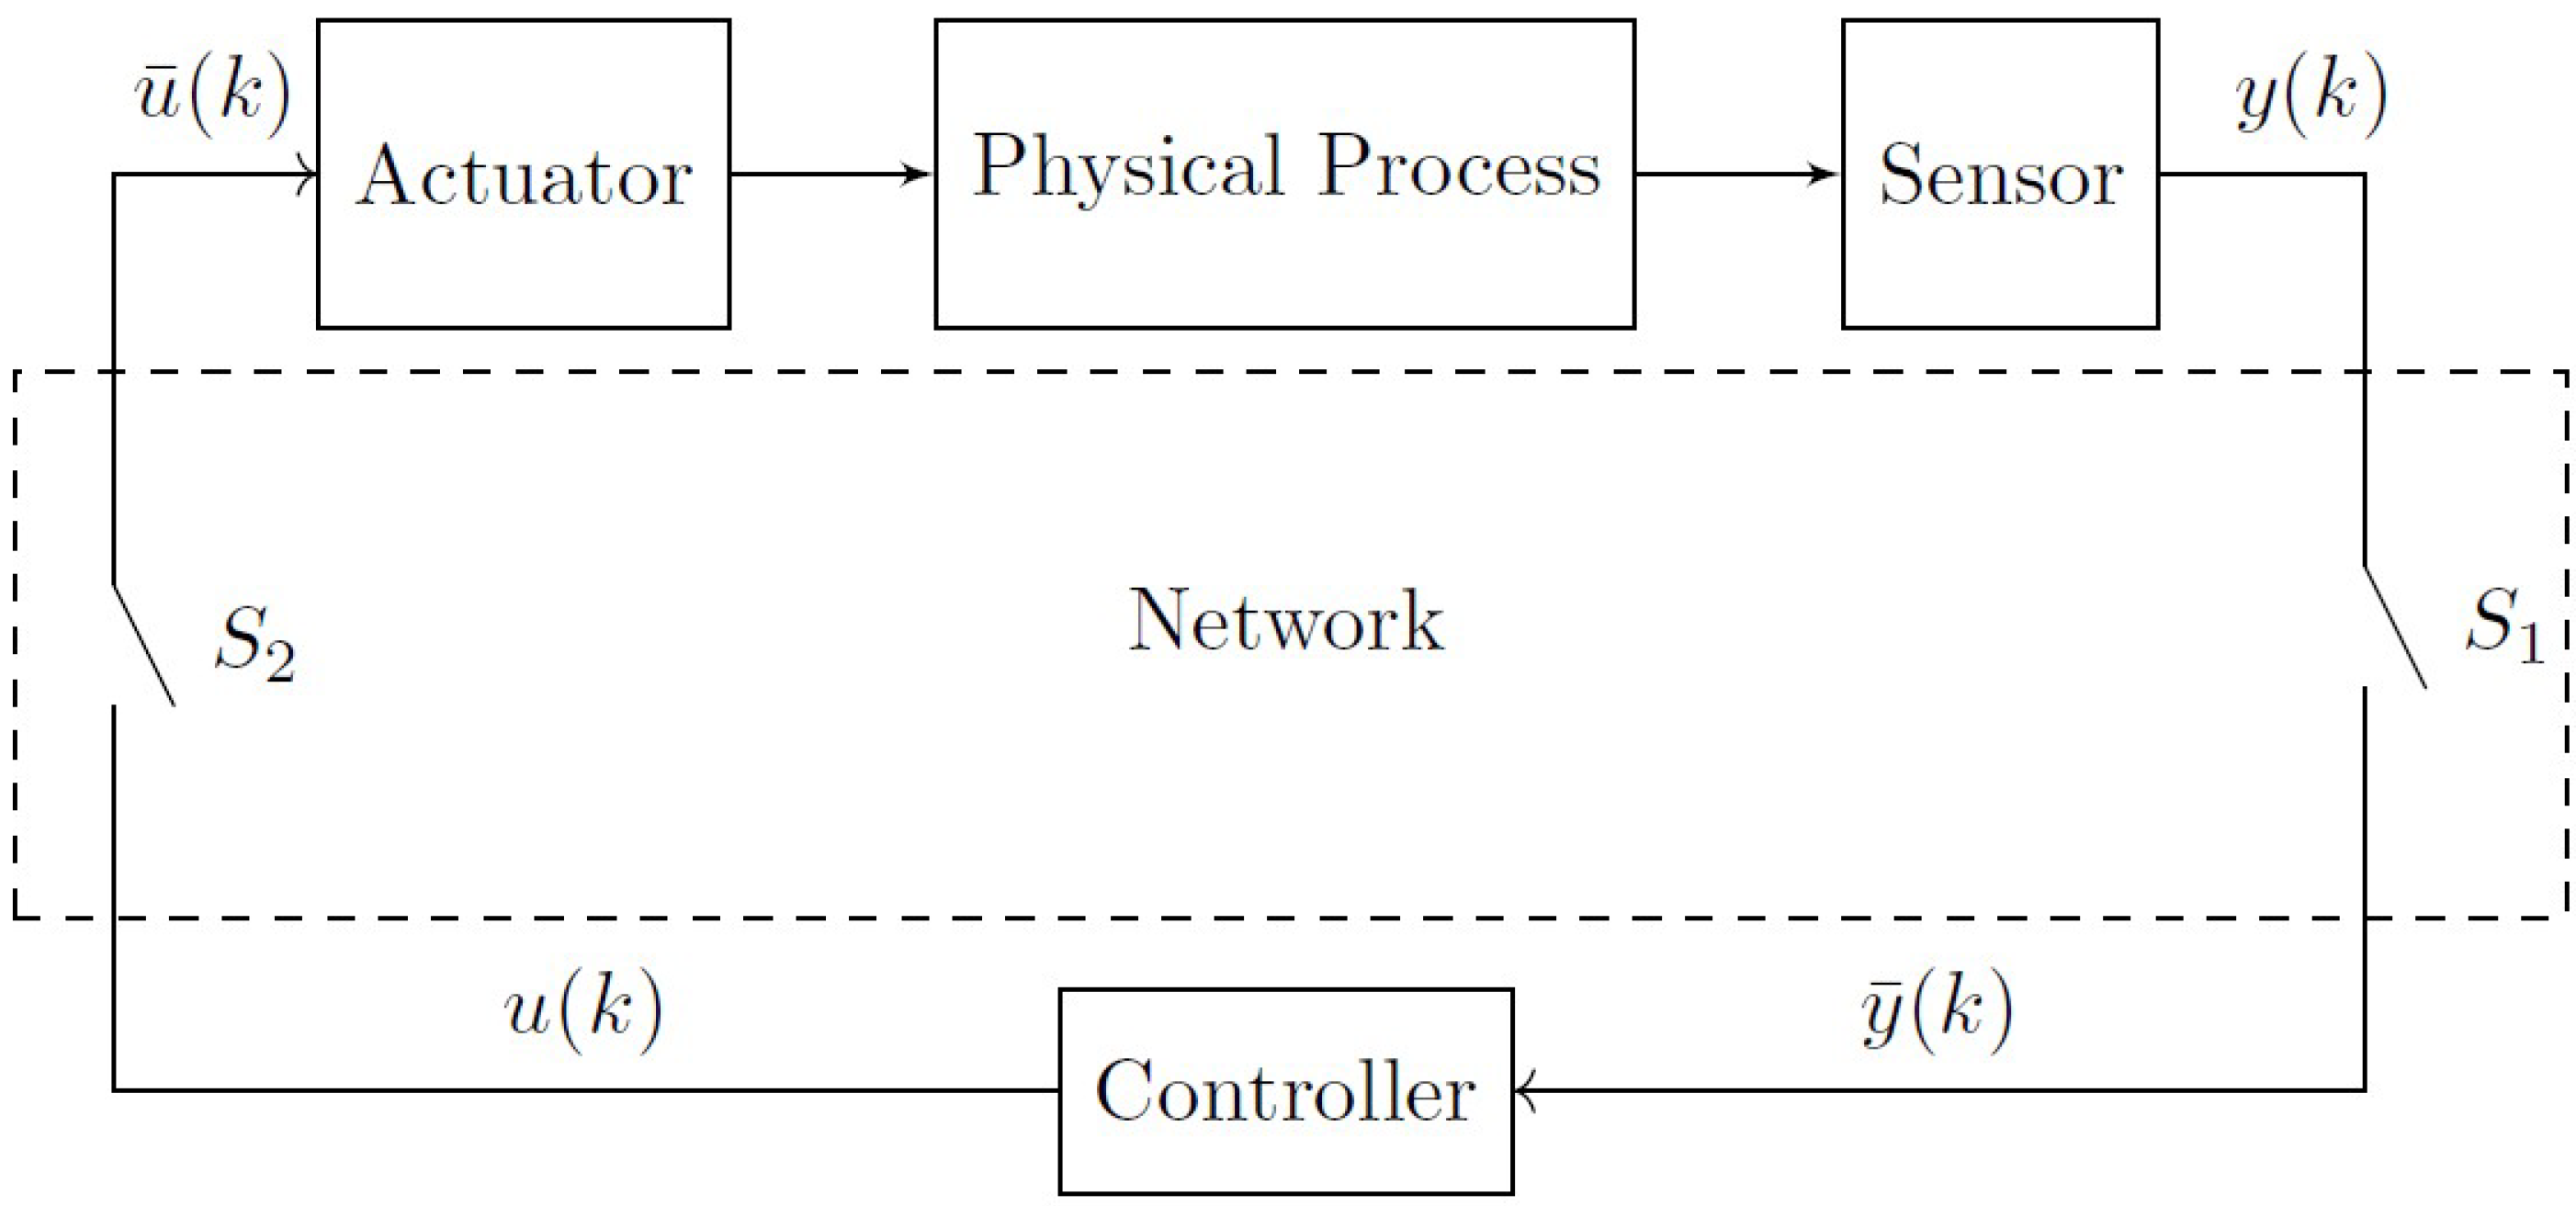
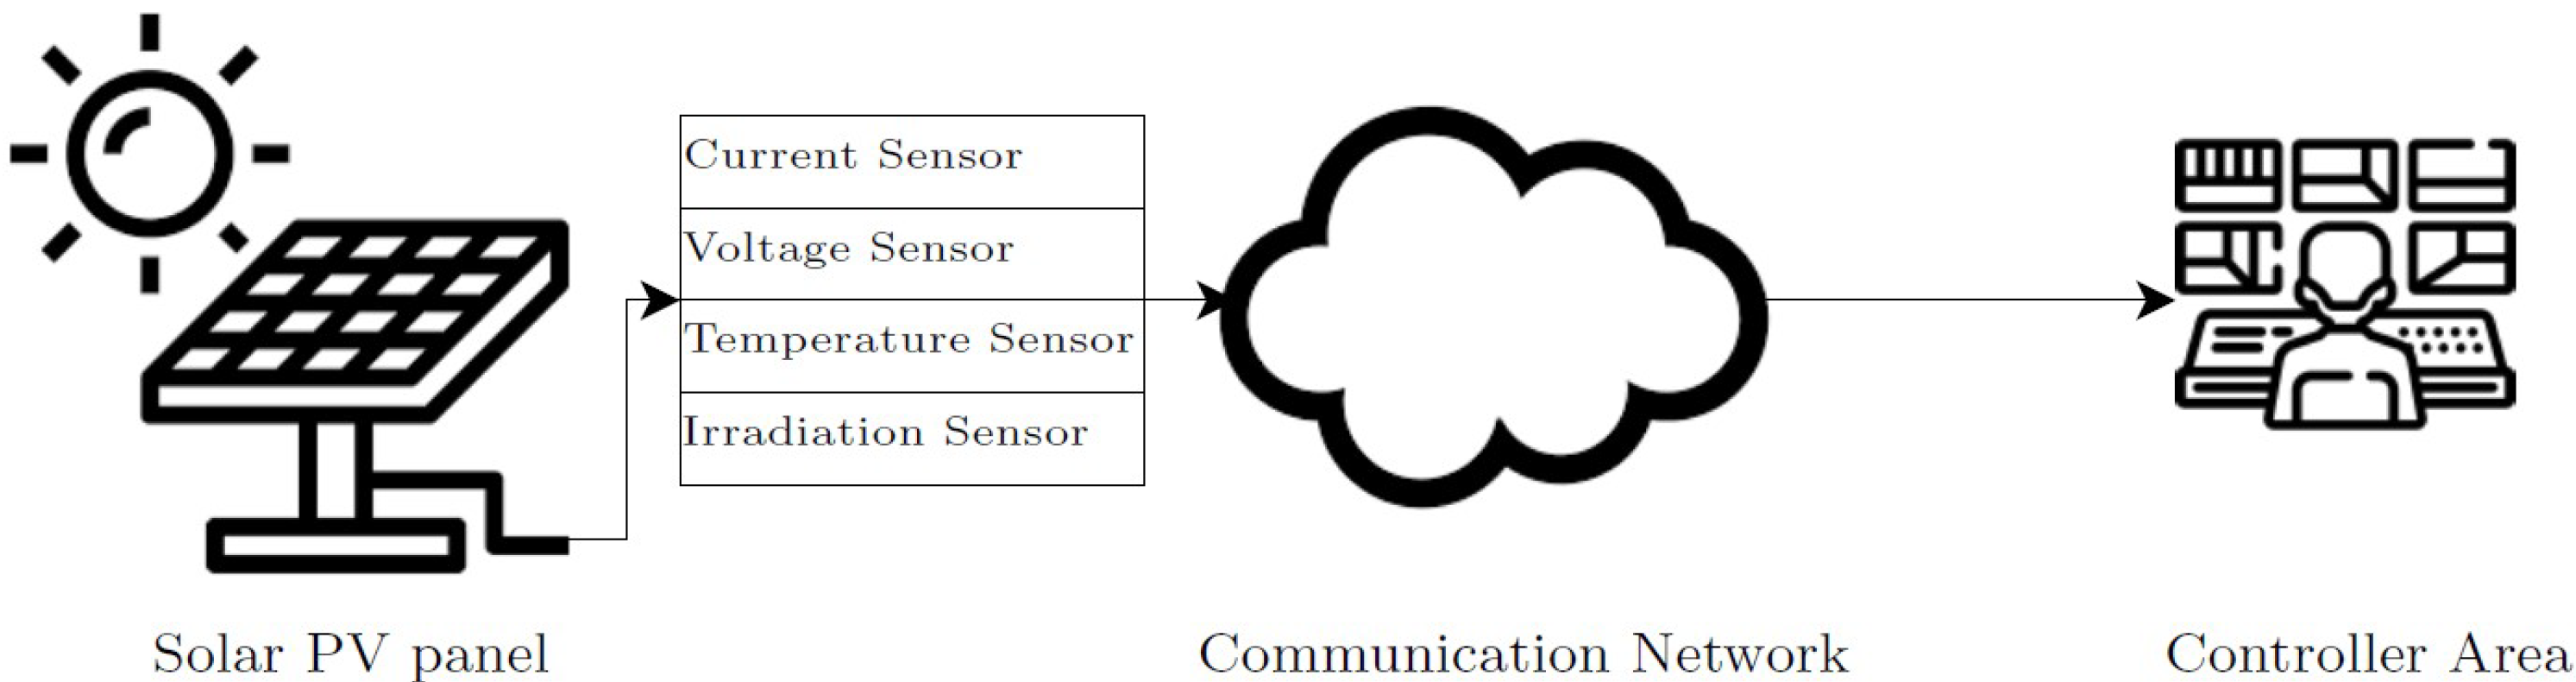
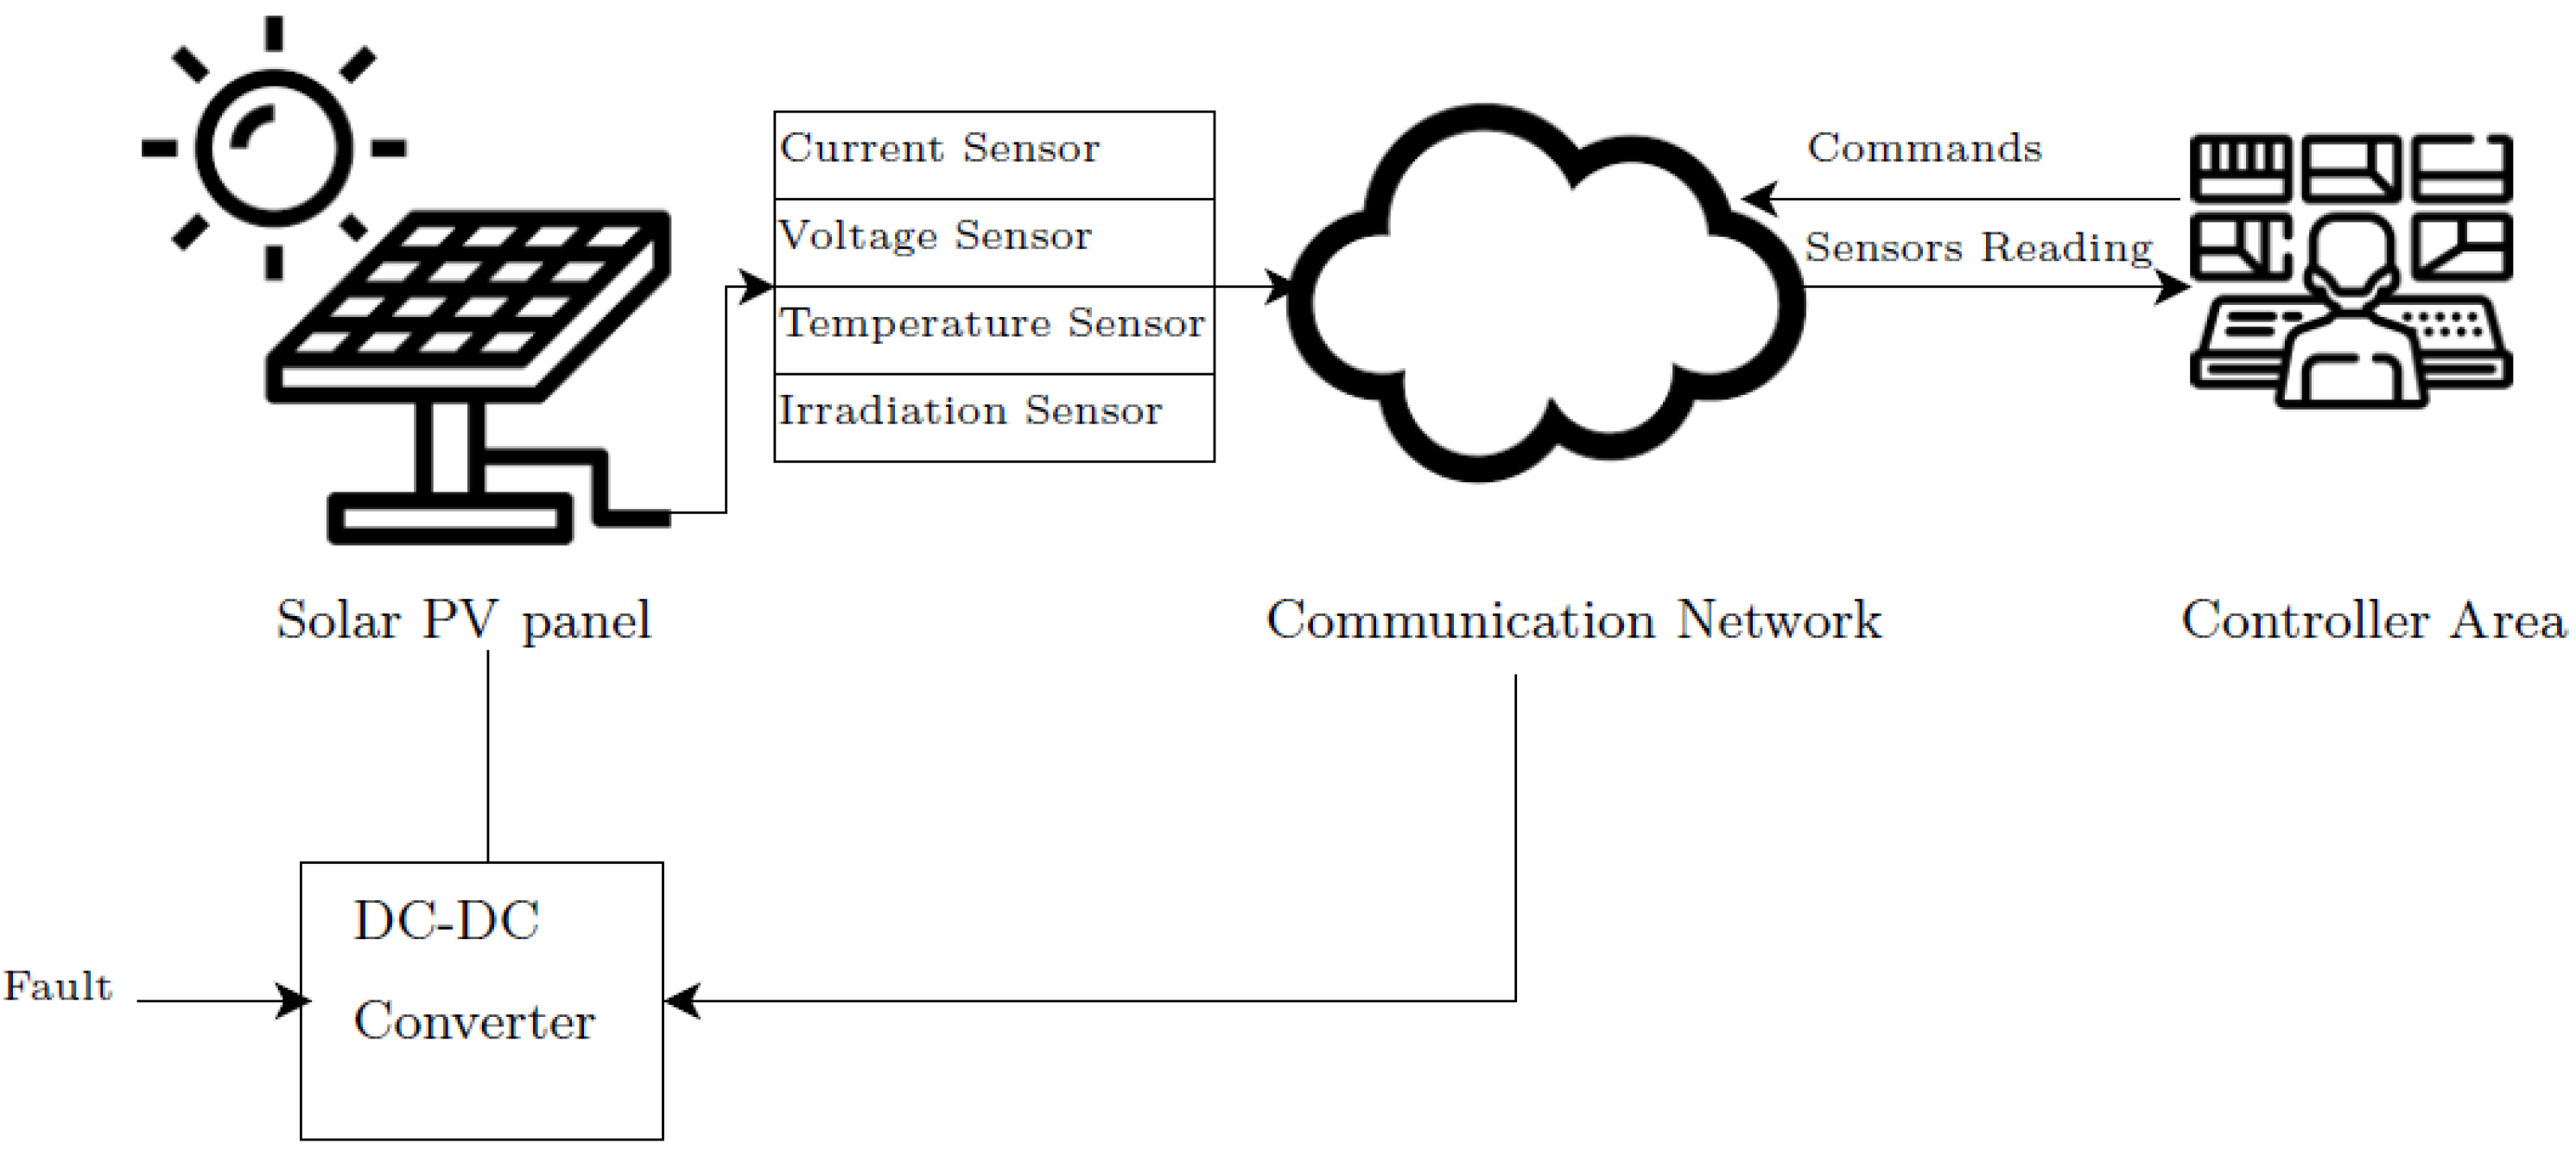
3. Networked Control System Model
4. Wireless Control-Based Power Optimization for PV System
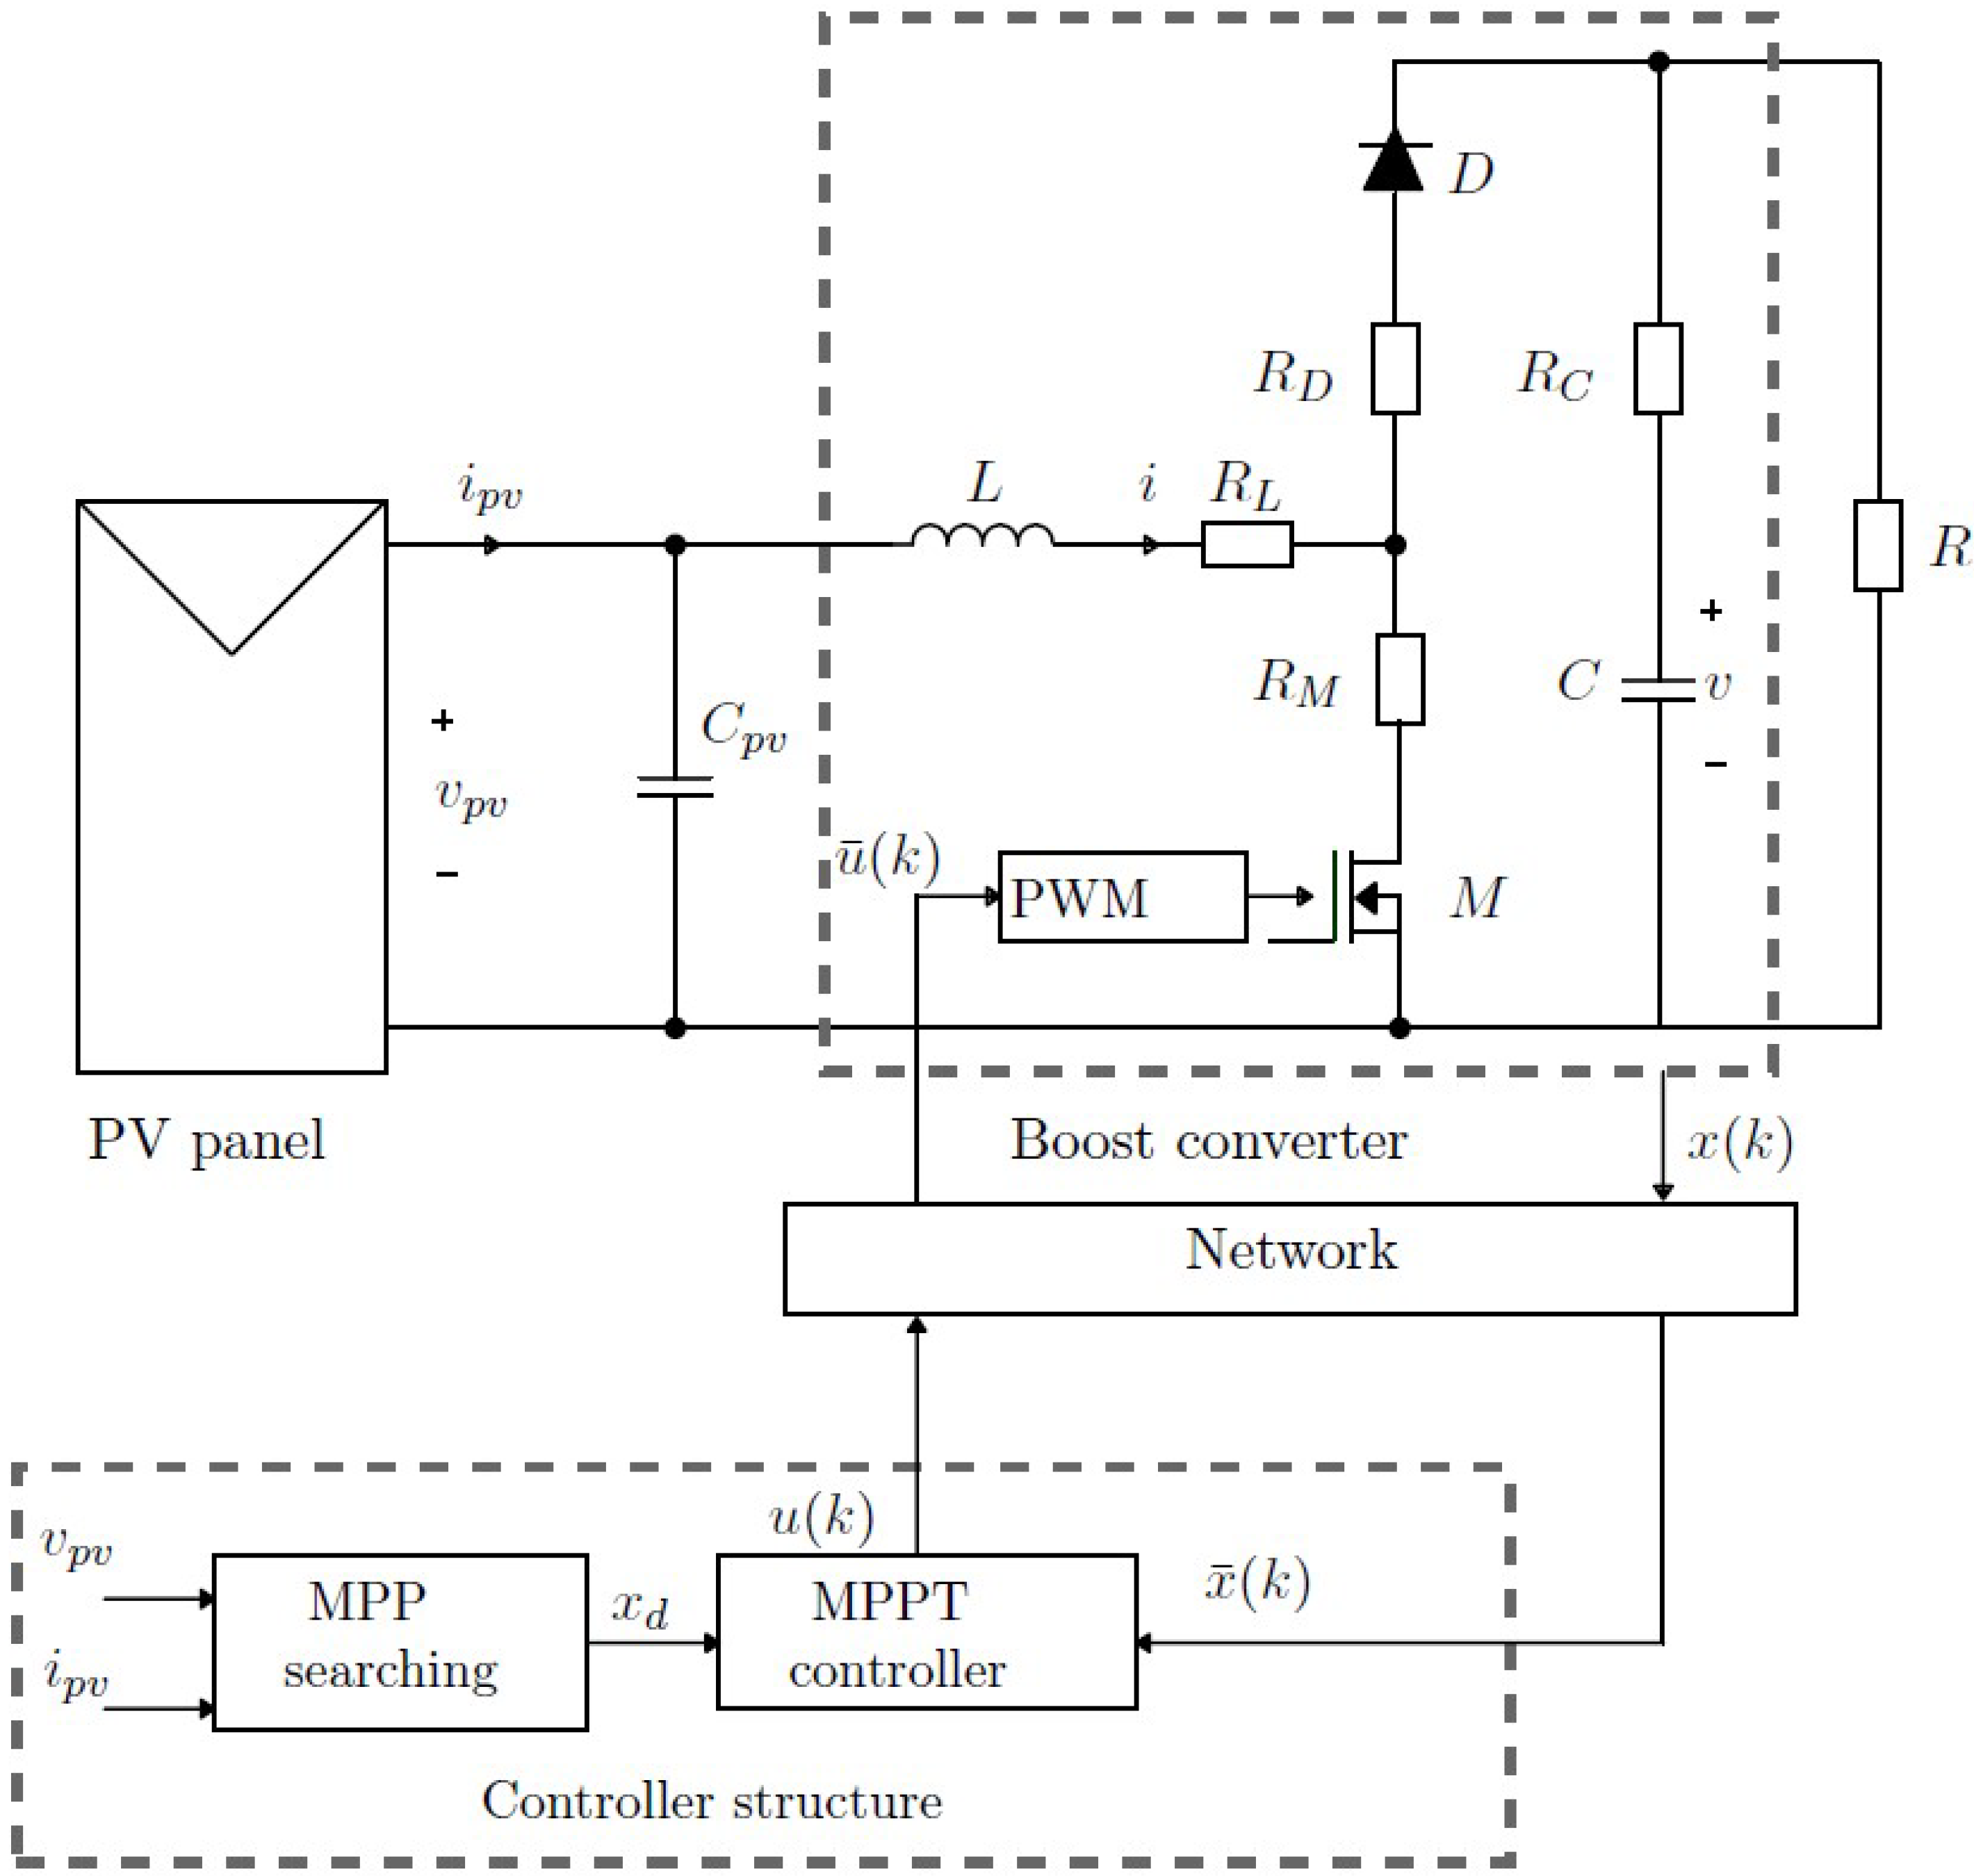
4.1. Networked PV System
4.2. Cloud MPPT Control Design
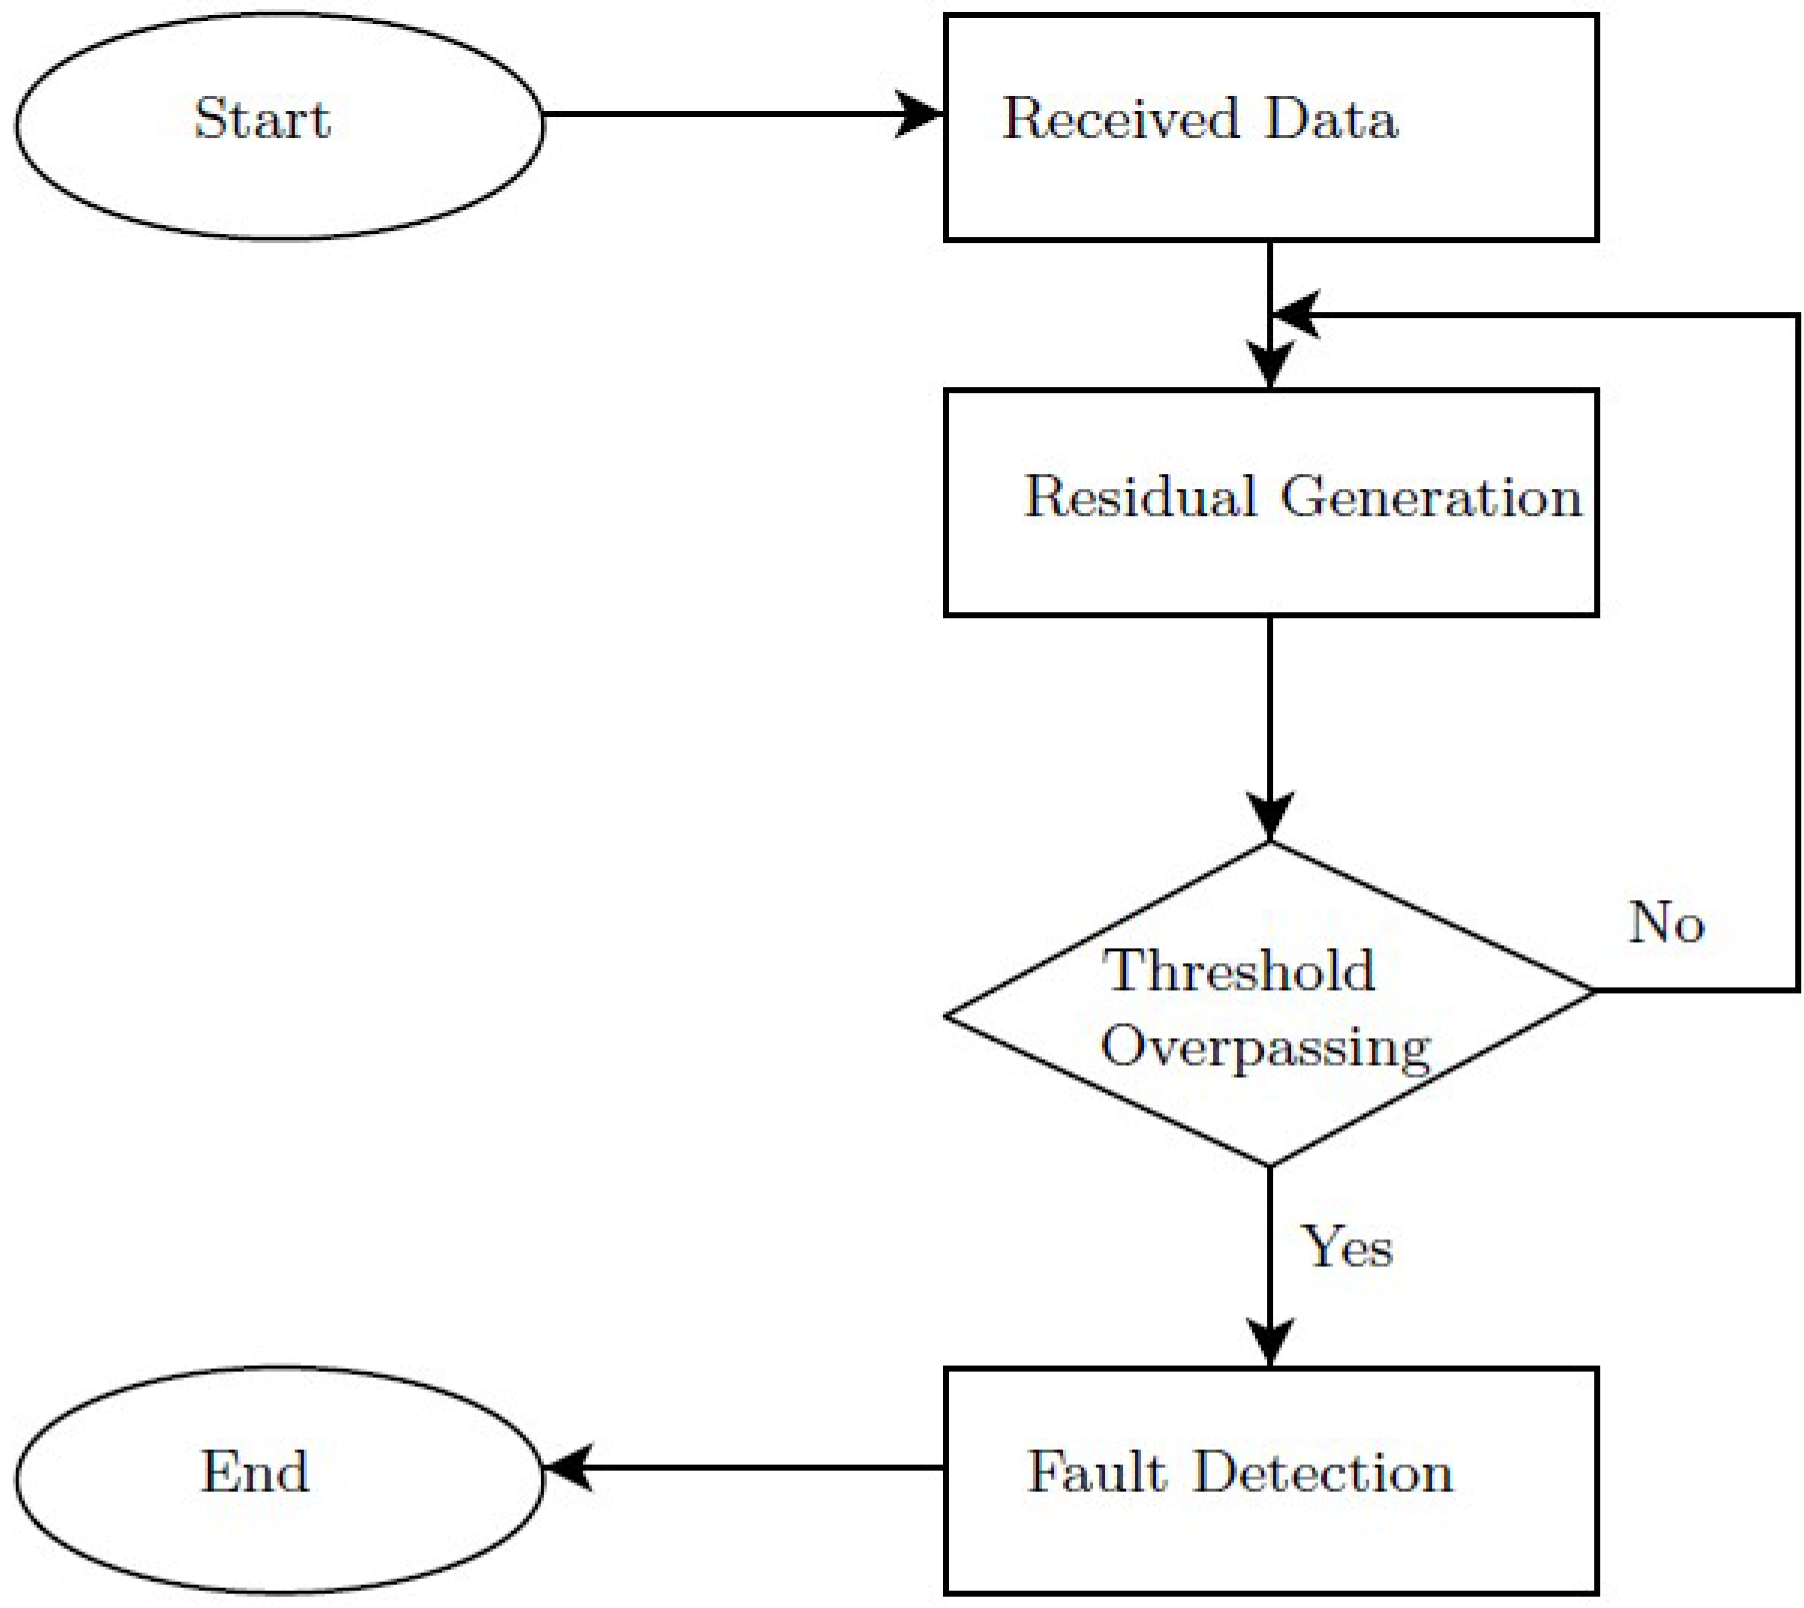
5. Wireless Strategy-Based Diagnosis of PV Conversion Systems
5.1. Fault Modelling
5.2. Observer-Based FDI System
6. Simulation Results and Discussions
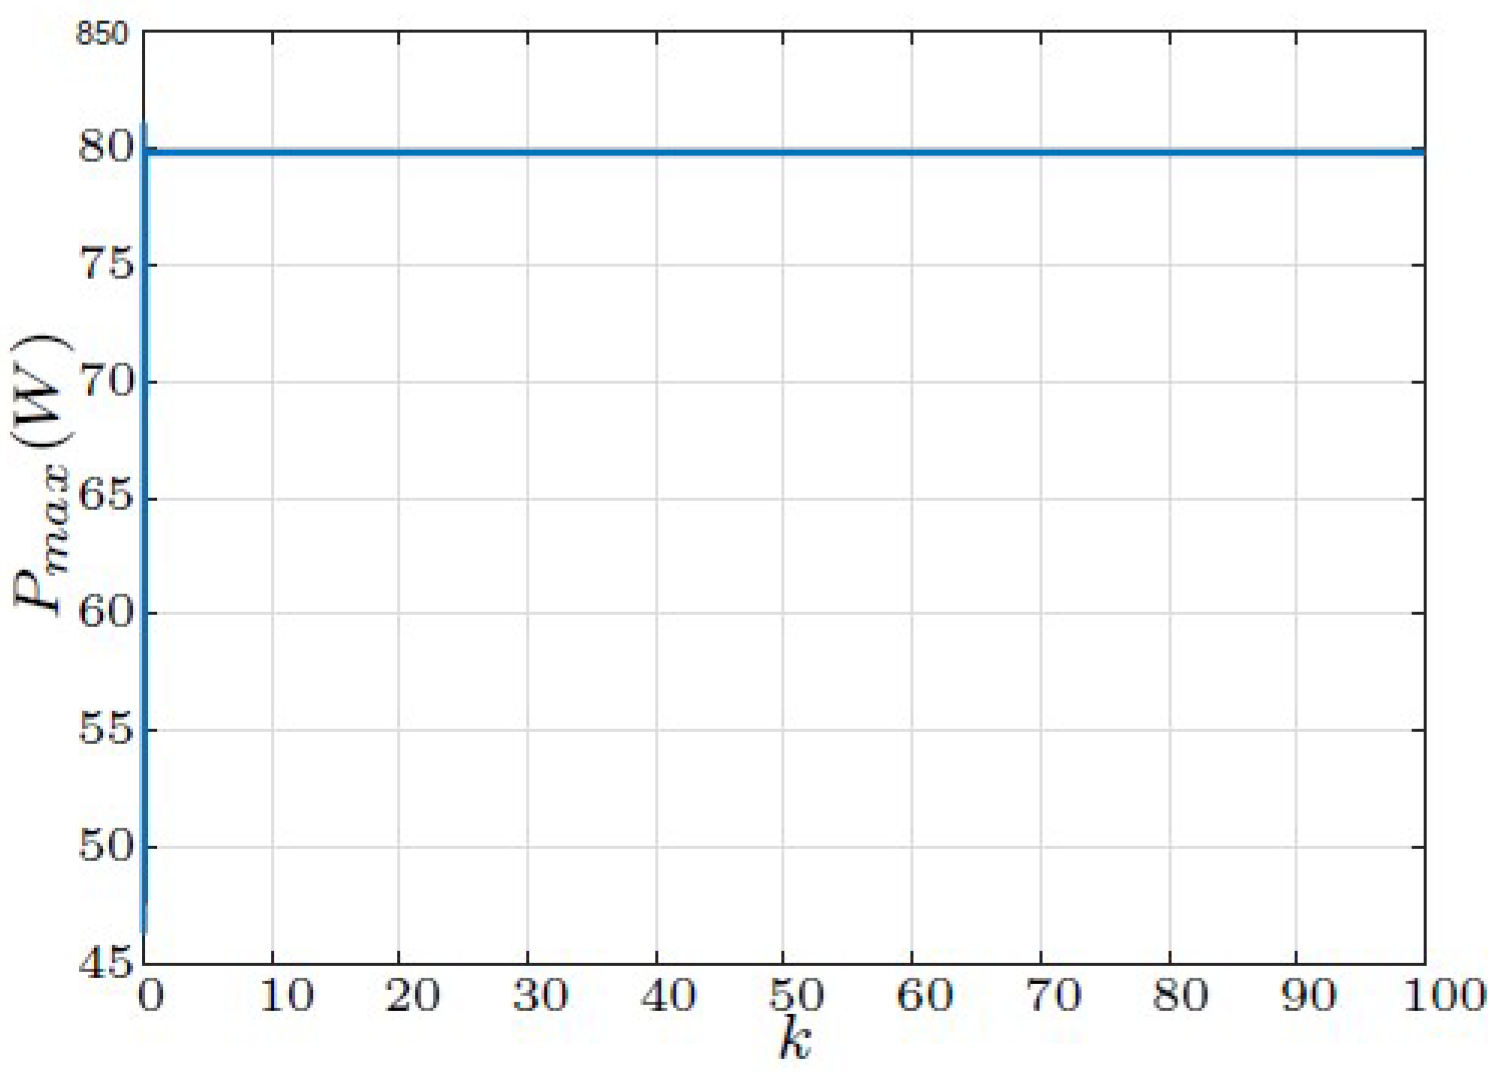
6.1. Networked MPPT Control
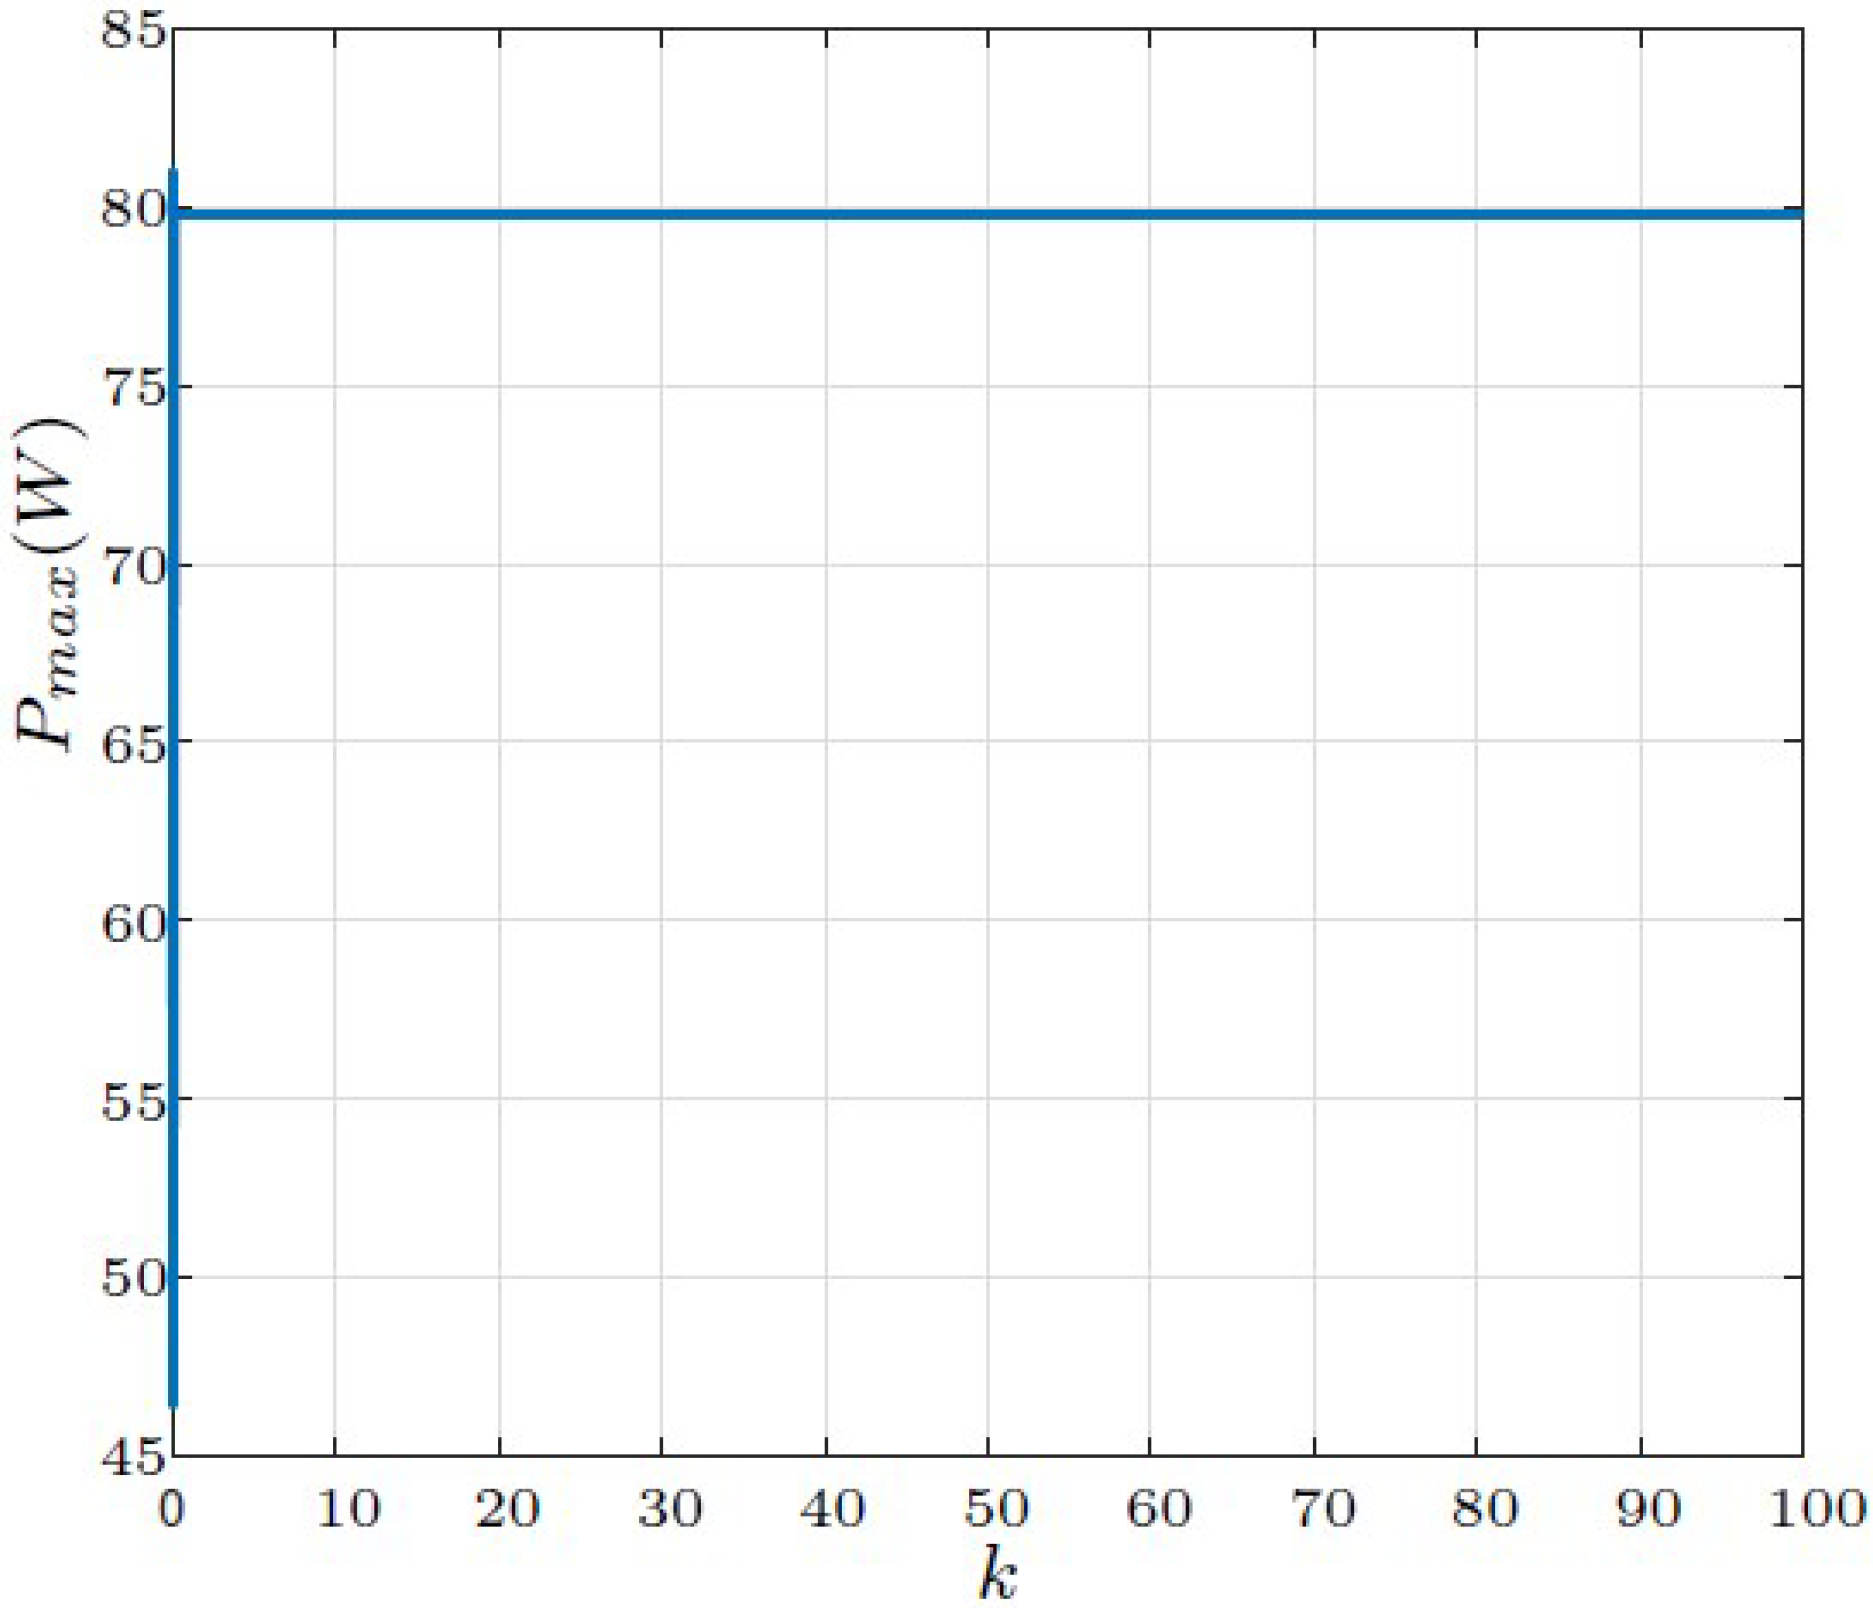
6.1.1. Standard Scenario
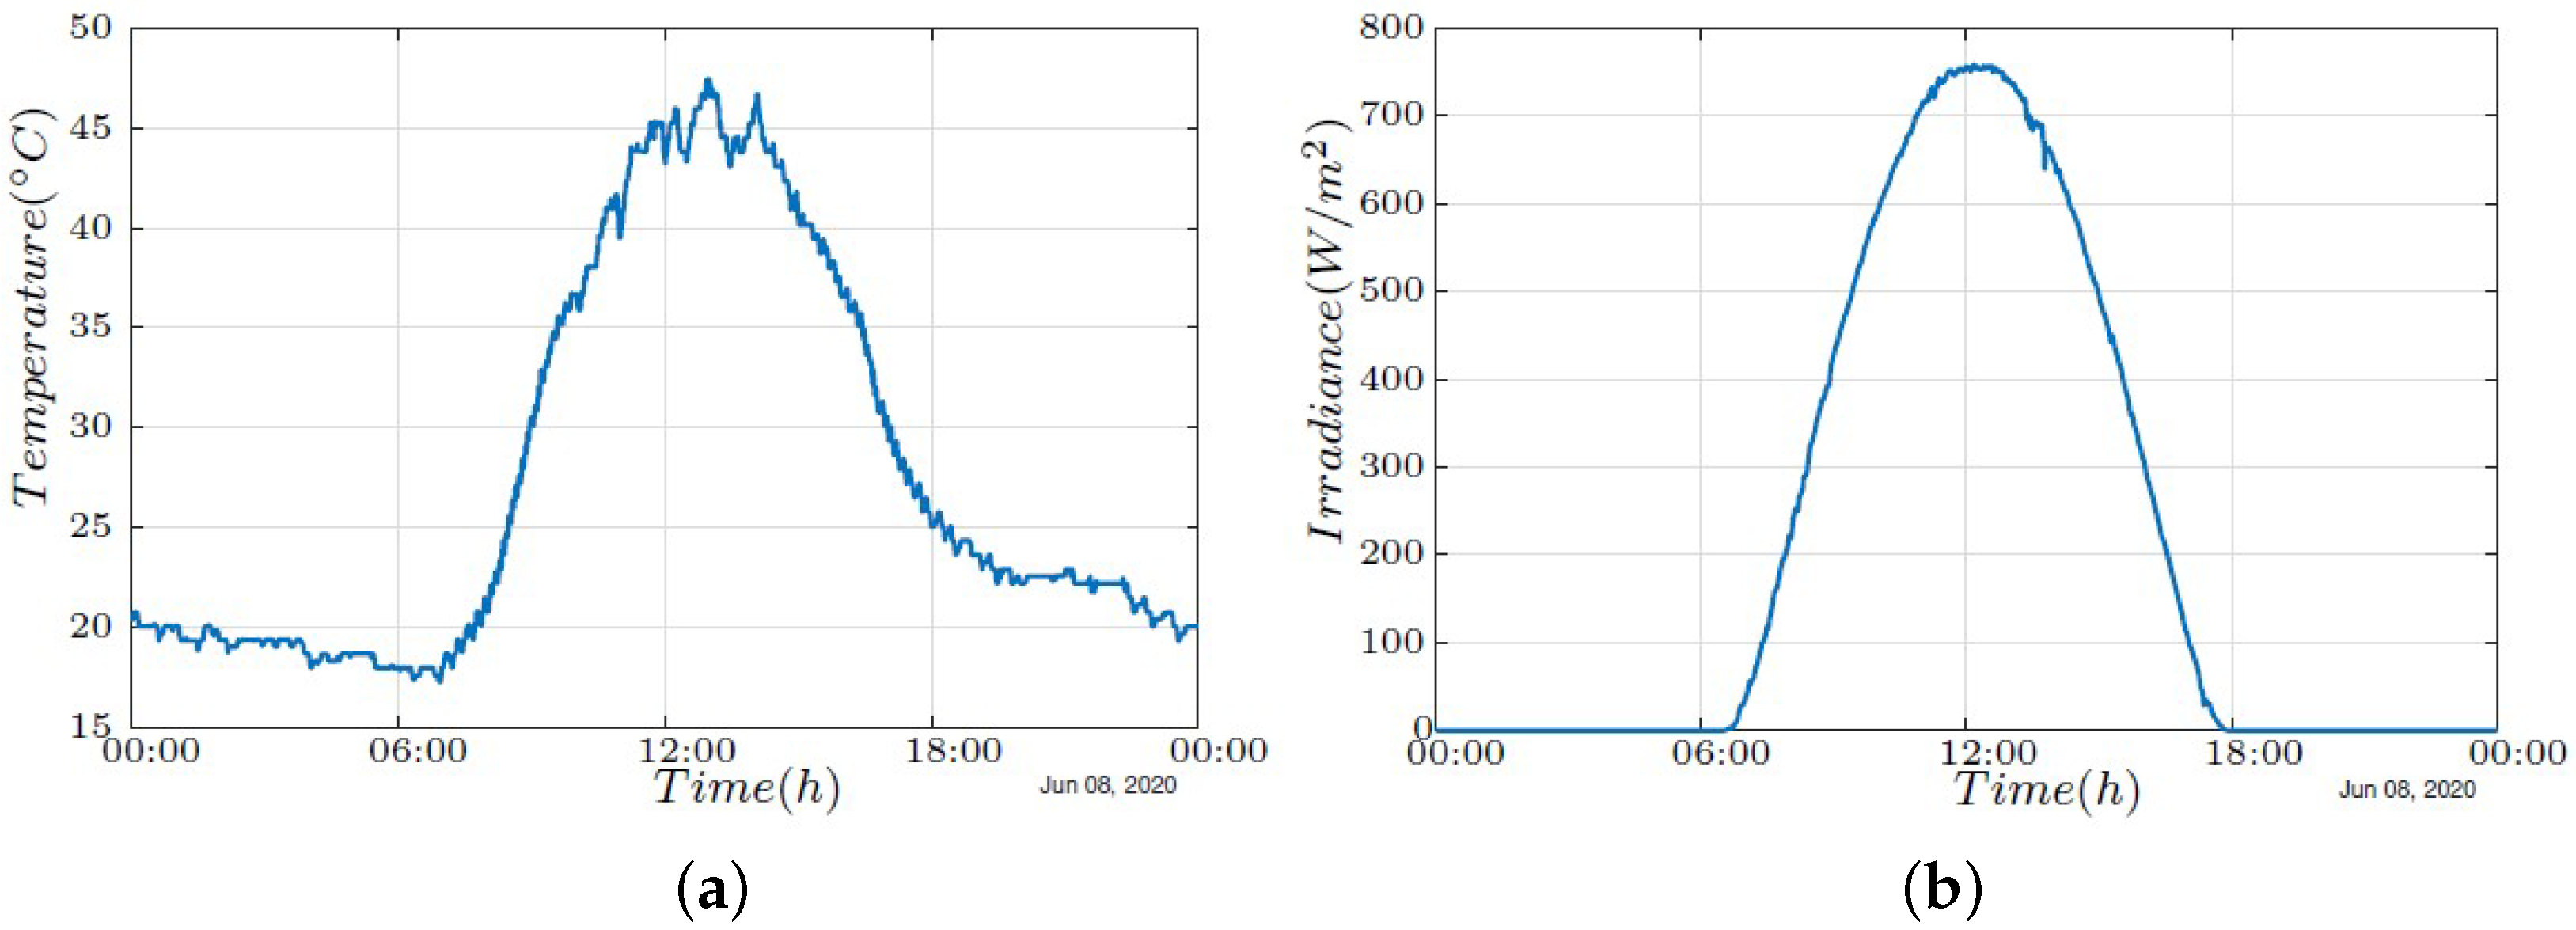
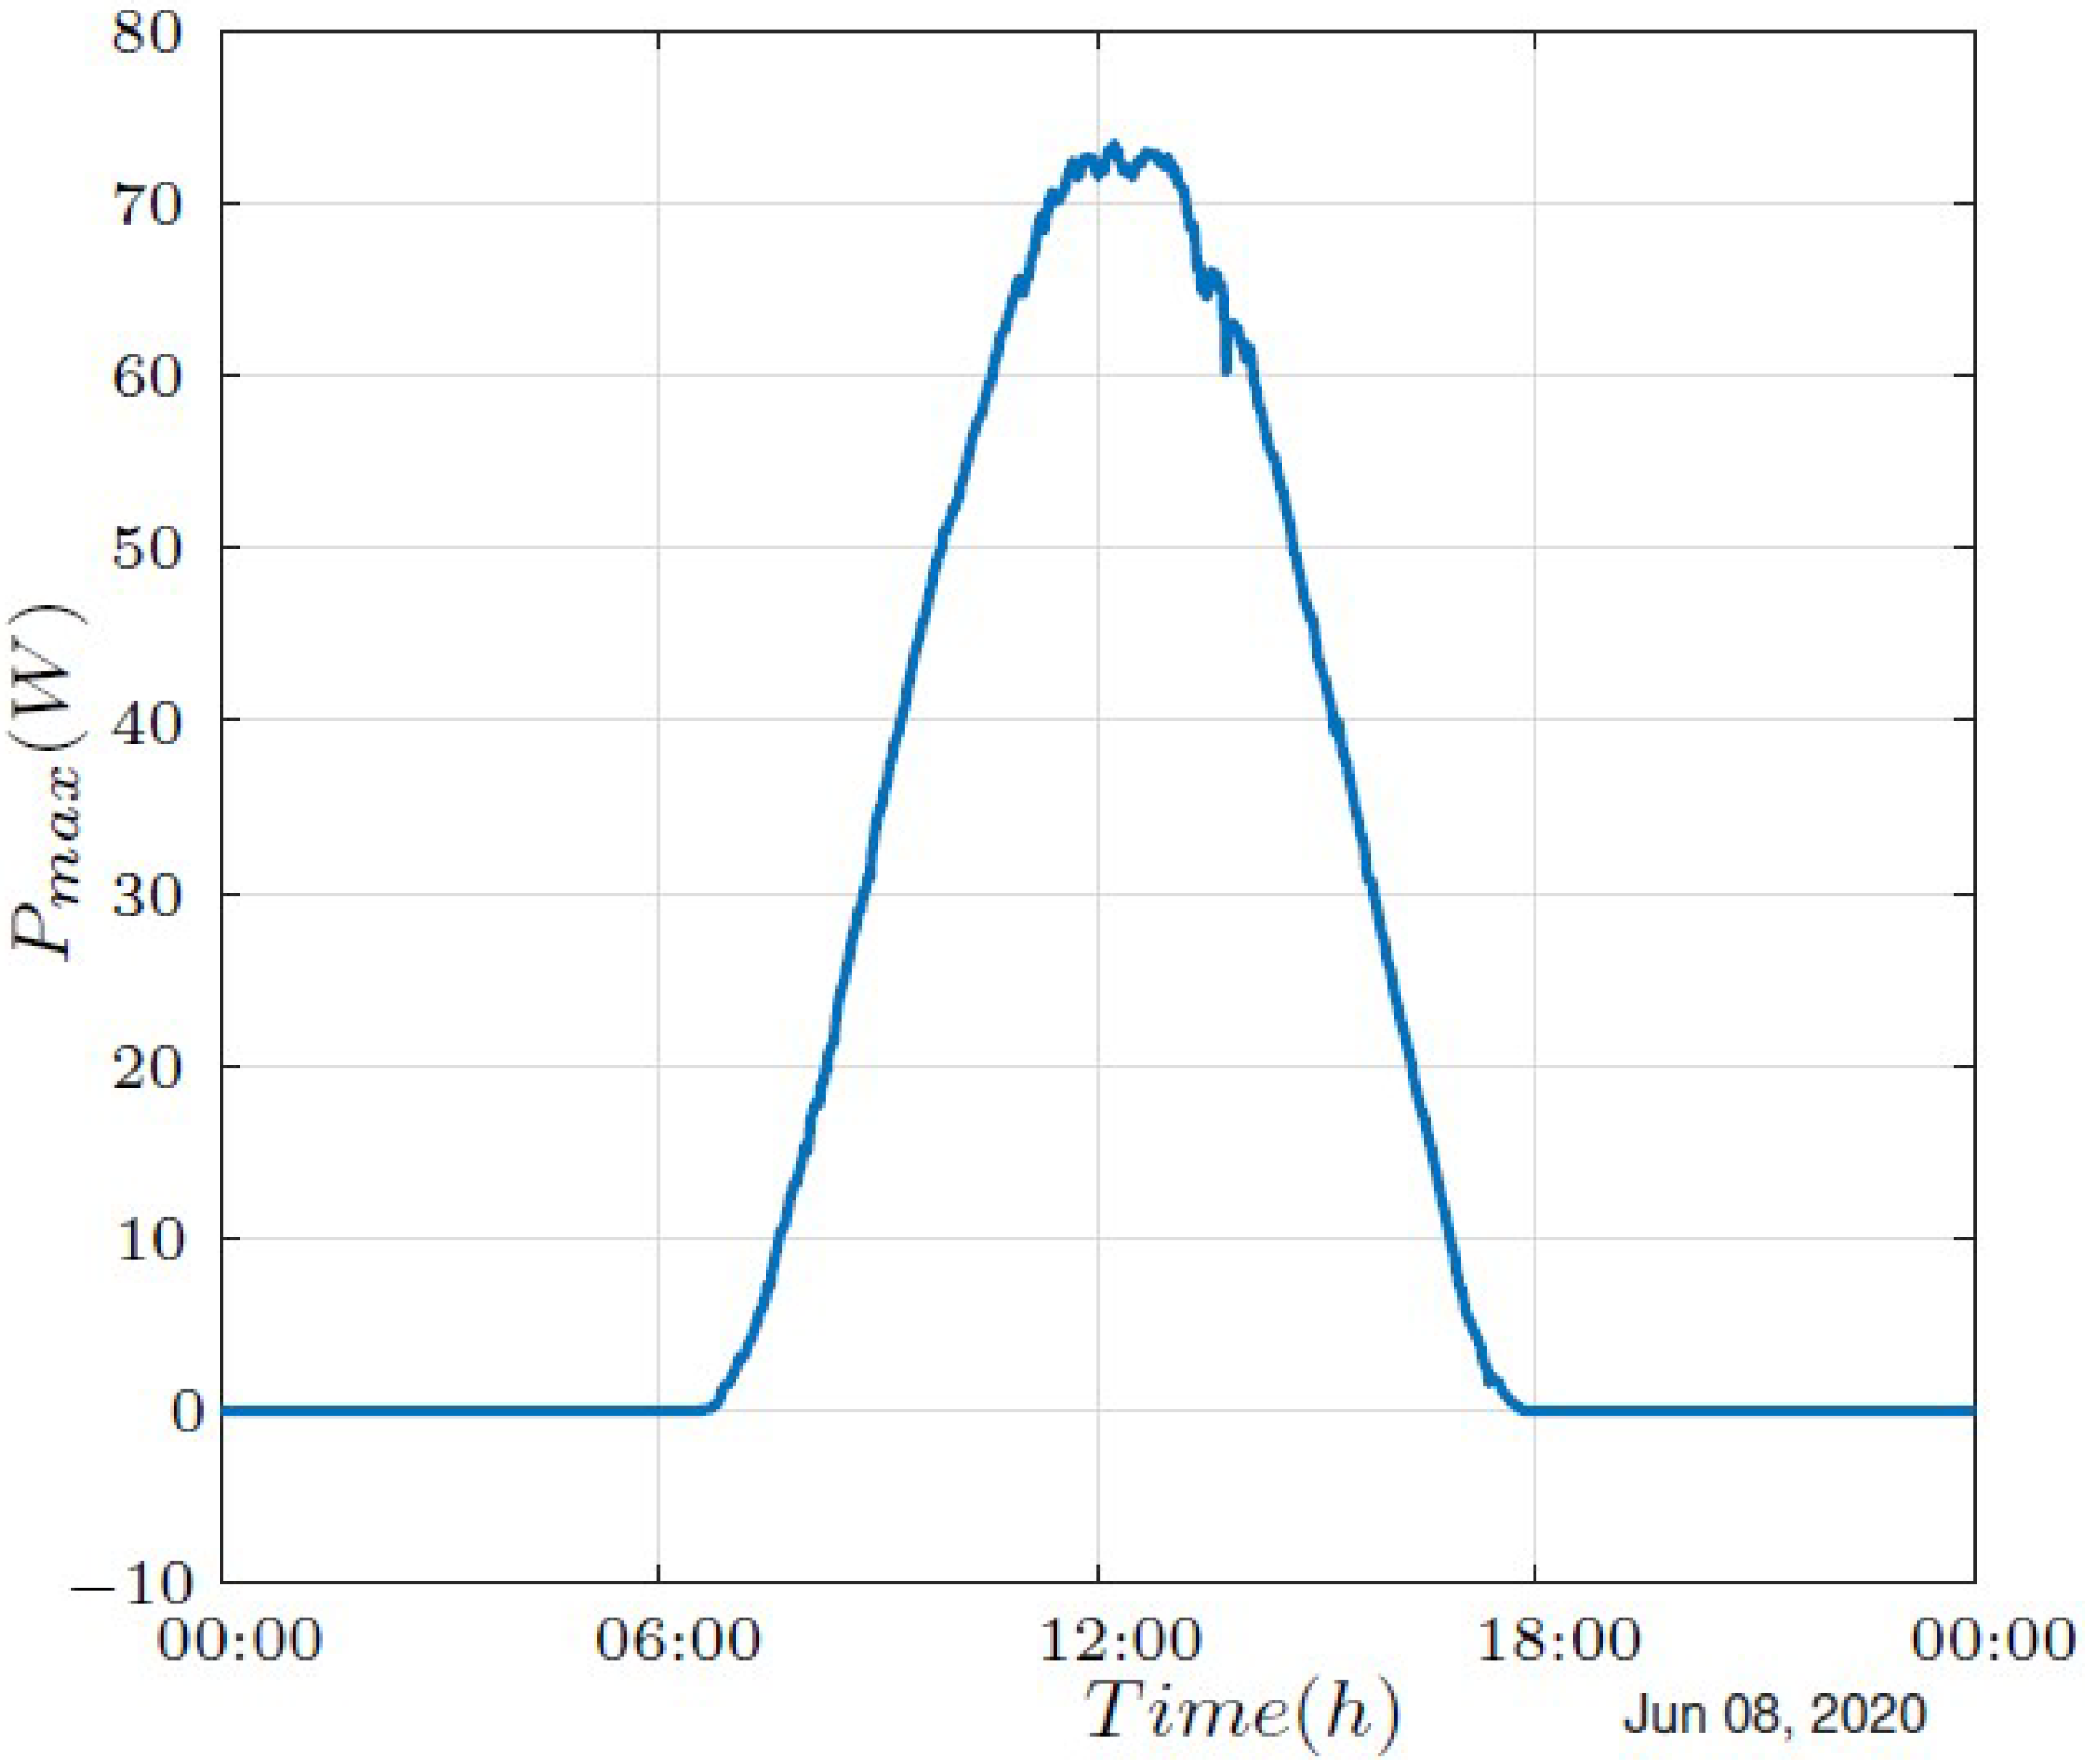
6.1.2. Real-Time Weather Data
6.2. Wireless Diagnosis
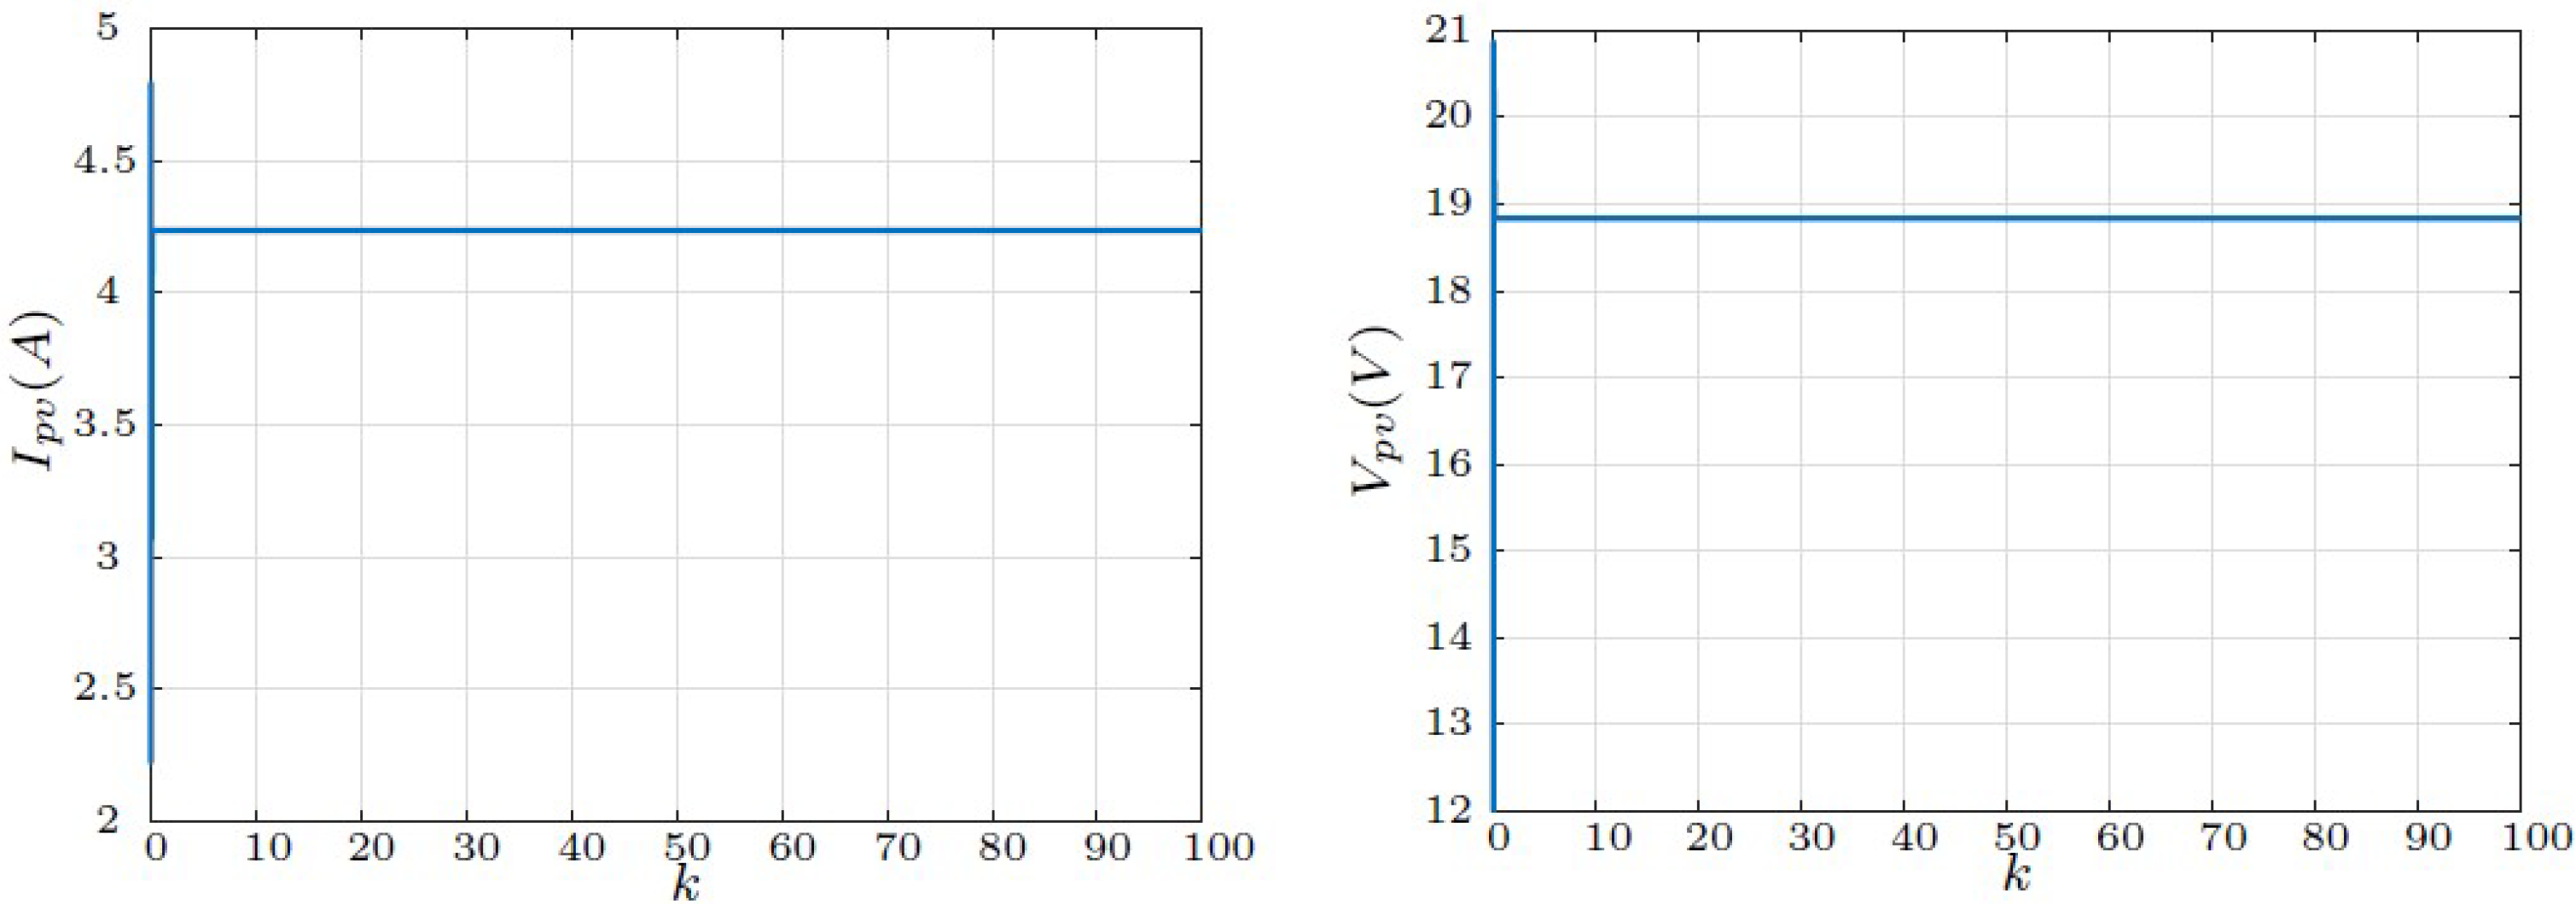
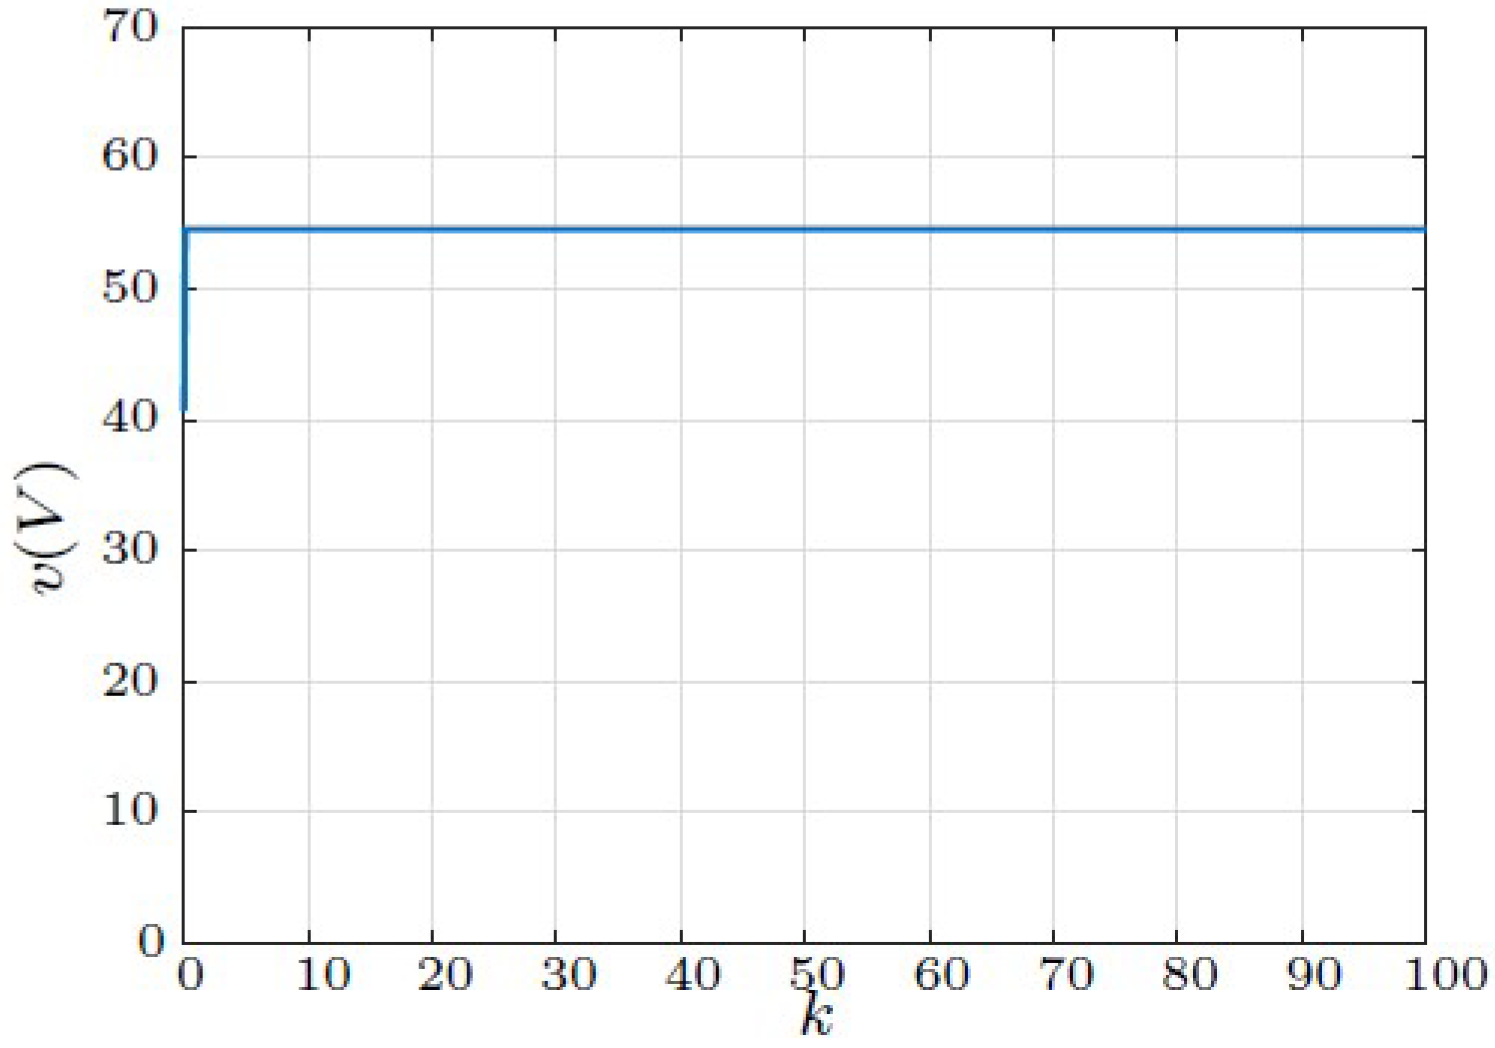
6.2.1. Normal Mode
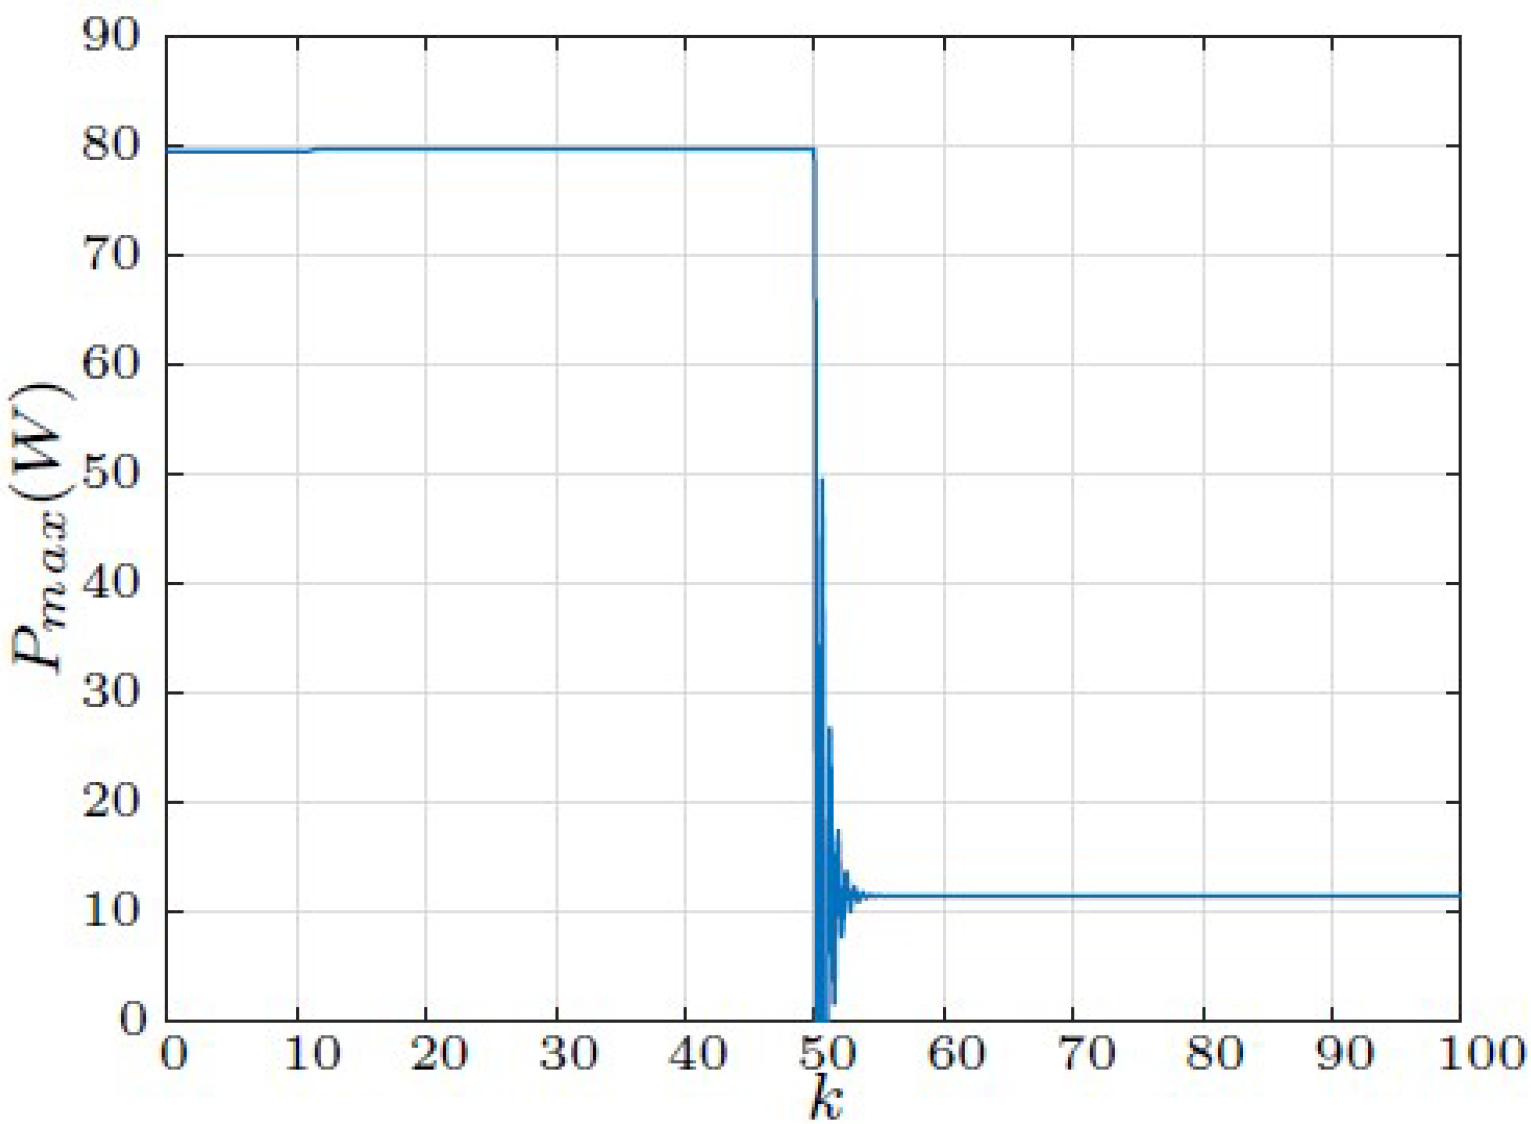
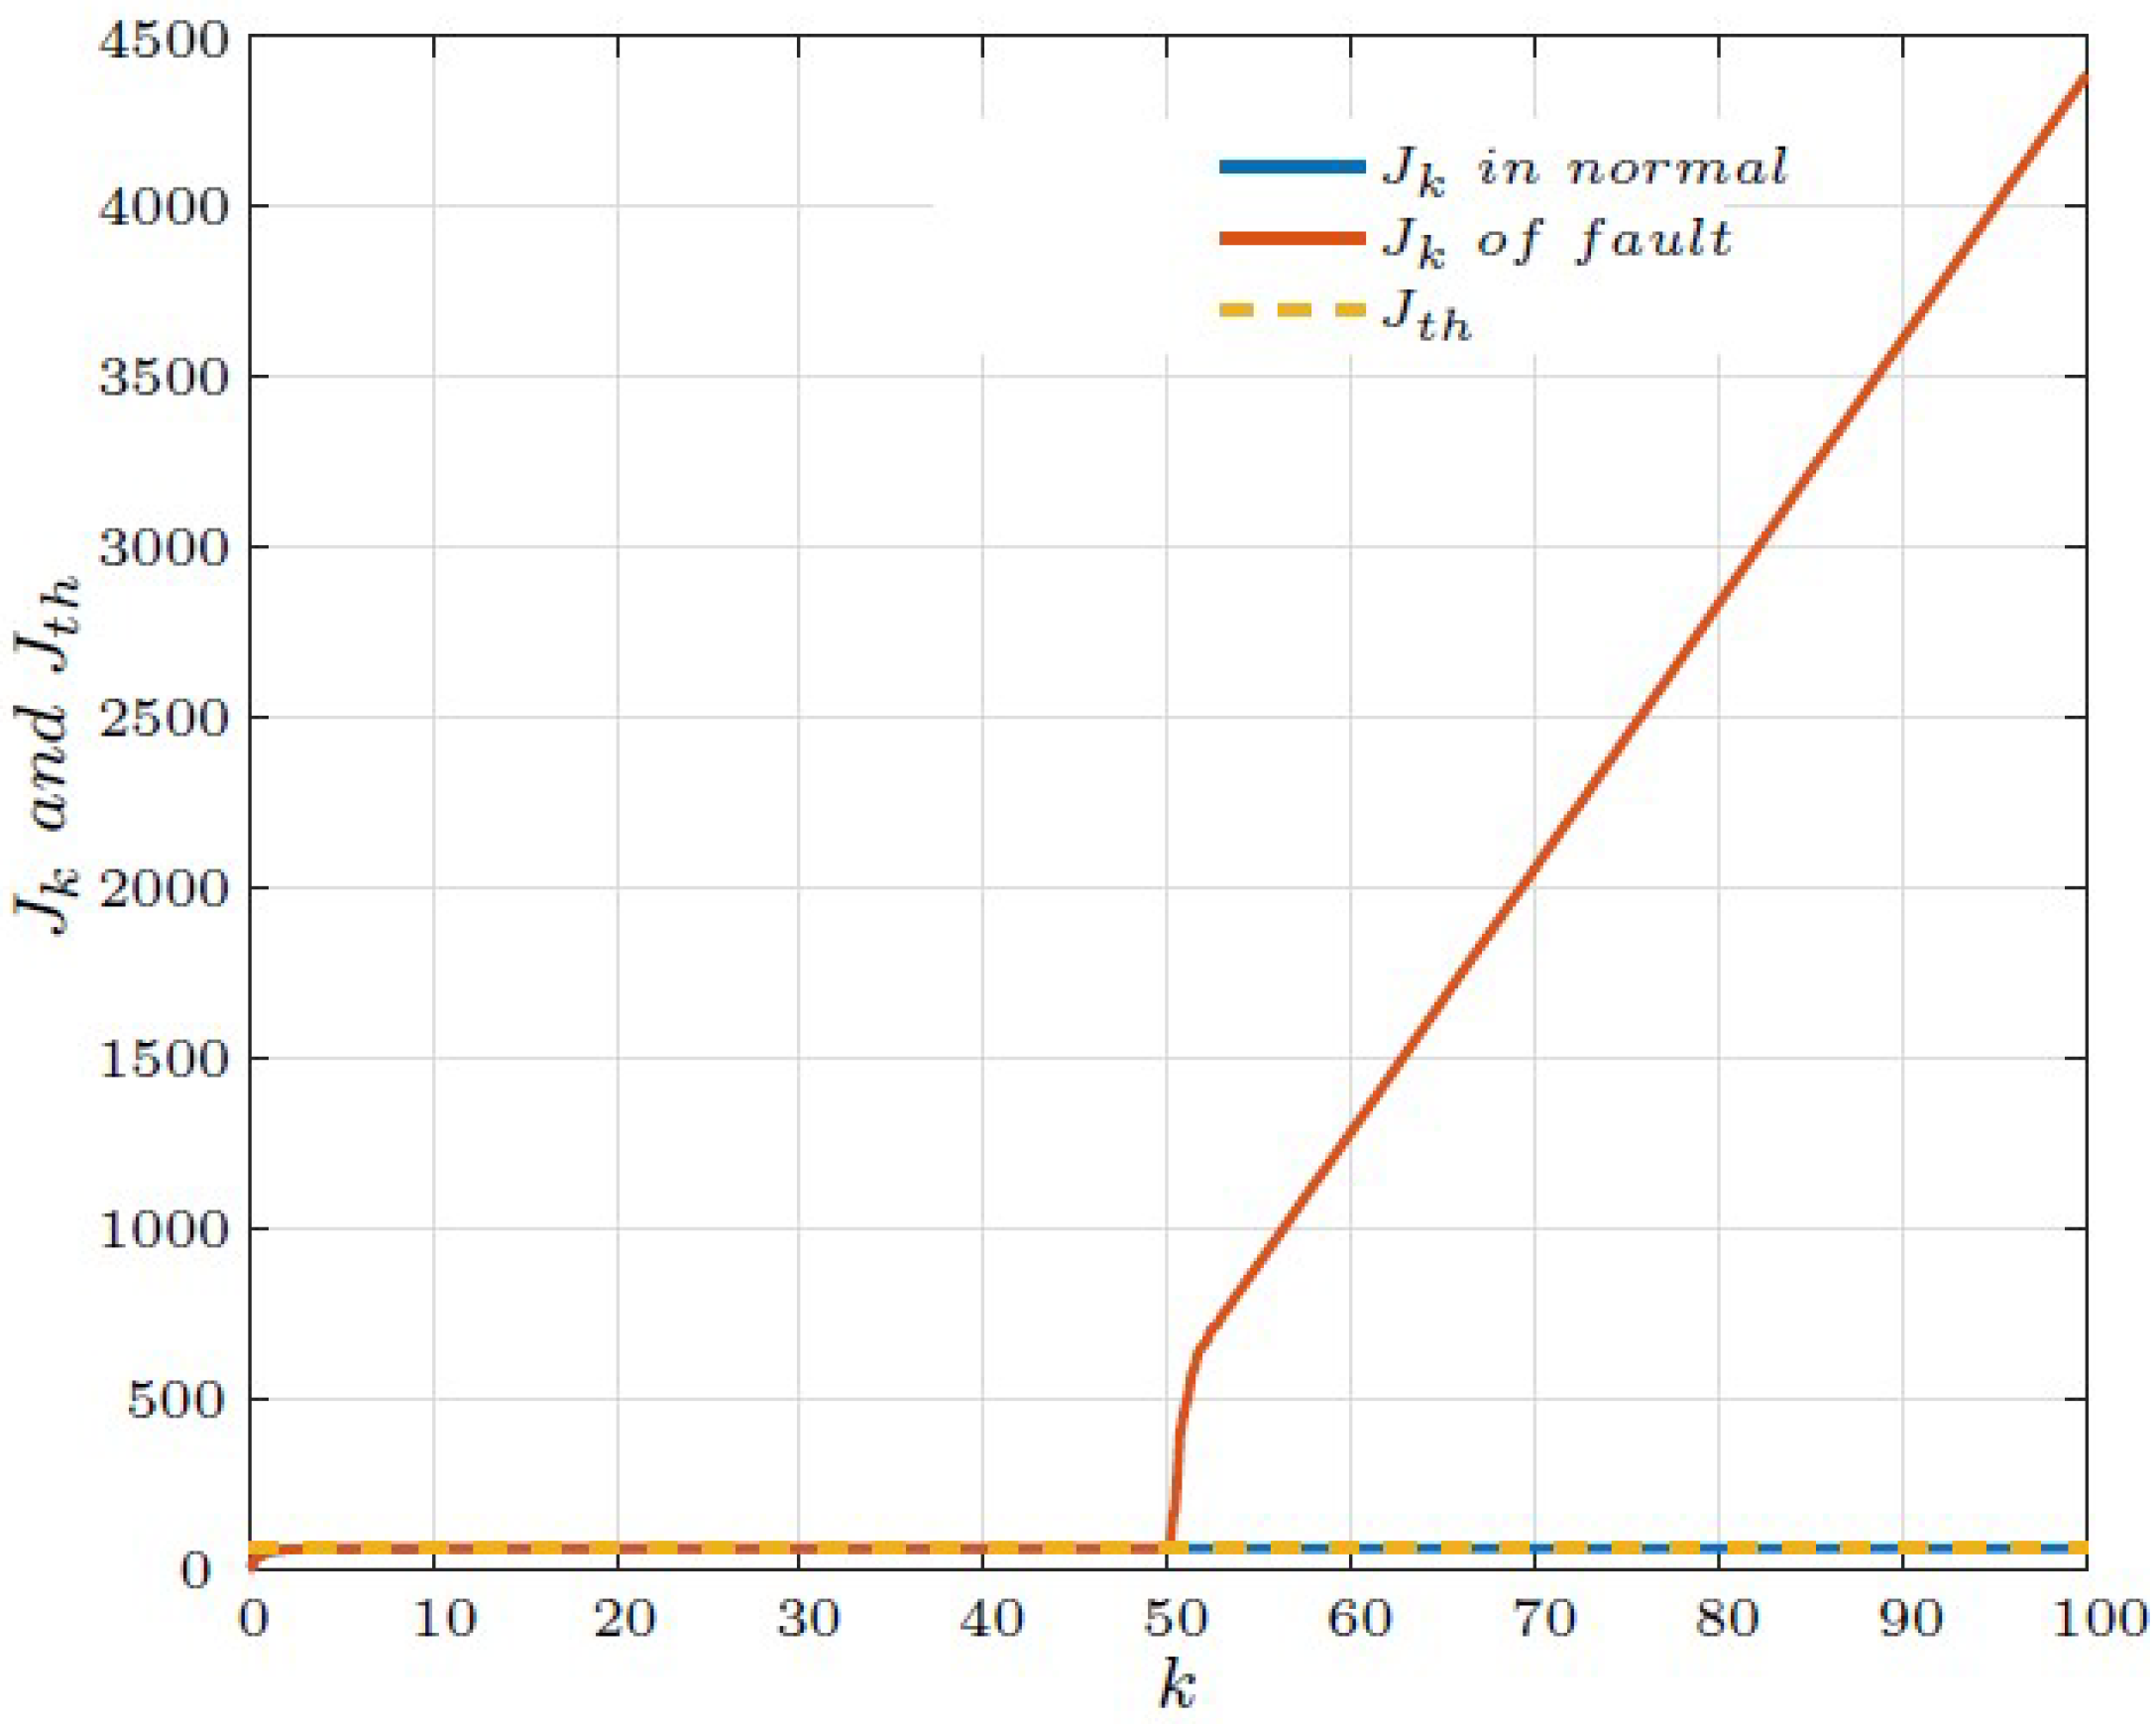
6.2.2. Faulty Mode
7. Conclusions
Author Contributions
Funding
Institutional Review Board Statement
Informed Consent Statement
Data Availability Statement
Conflicts of Interest
Abbreviations
| AC | Alternating Current |
| DC | Direct Current |
| FDI | Fault Detection and Isolation |
| LMIs | Linear Matrix Inequalities |
| MPPT | Maximum Power Point Tracking |
| MPPV | Maximum Power Point Voltage |
| NCS | Networked Control System |
| PV | Photovoltaic |
| PWM | Pulse Width Modulation |
| TS | Takagi–Sugeno |
| WSN | Wireless Sensor Network |
Appendix A

| Parameters | Value | Unit |
|---|---|---|
| PV Module | ||
| Series-parallel cells | ||
| Maximum power, | 80 | W |
| Voltage at Maximum power, | V | |
| Current at Maximum power, | A | |
| Open circuit voltage, | V | |
| Short circuit current, | A | |
| DC–DC Boost Converter | ||
| Input capacitor, | 1 | |
| Output capacitor, C | 100 | |
| Output capacitor resistance, | ||
| Inductance, L | 10 | |
| Inductance resistance, | ||
| Internal resistance of MOSFET, | ||
| Internal resistance of diode, | ||
References
- Zhang, T.; Yang, H. High efficiency plants and building integrated renewable energy systems: Building-integrated photovoltaics (BIPV). In Handbook of Energy Efficiency in Buildings: A Life Cycle Approach; Elsevier: Amsterdam, The Netherlands, 2018; pp. 441–595. [Google Scholar]
- Simya, O.; Radhakrishnan, P.; Ashok, A.; Kavitha, K.; Althaf, R. Engineered nanomaterials for energy applications. In Handbook of Nanomaterials for Industrial Applications; Elsevier: Amsterdam, The Netherlands, 2018; pp. 751–767. [Google Scholar]
- Kumar, N.M.; Chopra, S.S.; de Oliveira, A.K.V.; Ahmed, H.; Vaezi, S.; Madukanya, U.E.; Castañón, J.M. Solar PV module technologies. In Photovoltaic Solar Energy Conversion; Elsevier: Amsterdam, The Netherlands, 2020; pp. 51–78. [Google Scholar]
- Akorede, M.F. Design and performance analysis of off-grid hybrid renewable energy systems. In Hybrid Technologies for Power Generation; Elsevier: Amsterdam, The Netherlands, 2022; pp. 35–68. [Google Scholar]
- Hu, J.; Zhang, H.; Liu, H.; Yu, X. A survey on sliding mode control for networked control systems. Int. J. Syst. Sci. 2021, 52, 1129–1147. [Google Scholar] [CrossRef]
- Duo, W.; Zhou, M.; Abusorrah, A. A survey of cyber attacks on cyber physical systems: Recent advances and challenges. IEEE/CAA J. Autom. Sin. 2022, 9, 784–800. [Google Scholar] [CrossRef]
- Yaacoub, J.P.A.; Salman, O.; Noura, H.N.; Kaaniche, N.; Chehab, A.; Malli, M. Cyber-physical systems security: Limitations, issues and future trends. Microprocess. Microsystems 2020, 77, 103201. [Google Scholar] [CrossRef] [PubMed]
- Hu, J.; Zhang, H.; Yu, X.; Liu, H.; Chen, D. Design of sliding-mode-based control for nonlinear systems with mixed-delays and packet losses under uncertain missing probability. IEEE Trans. Syst. Man Cybern. Syst. 2019, 51, 3217–3228. [Google Scholar] [CrossRef]
- Xiaoli, X.; Daoe, Q. Remote monitoring and control of photovoltaic system using wireless sensor network. In Proceedings of the 2011 International Conference on Electric Information and Control Engineering, IEEE, Wuhan, China, 15–17 April 2011; pp. 633–638. [Google Scholar]
- Hussain, S.S.; Khattak, K.S.; Khan, A.; Khan, Z.H. Cyber physical system for solar energy monitoring. In Proceedings of the 2019 International Conference on Frontiers of Information Technology (FIT), IEEE, Islamabad, Pakistan, 16–18 December 2019; pp. 185–1855. [Google Scholar]
- Martin, A.D.; Cano, J.M.; Herrera, R.S.; Vazquez, J.R. Wireless sliding MPPT control of photovoltaic systems in distributed generation systems. Energies 2019, 12, 3226. [Google Scholar] [CrossRef]
- Yang, S.; Bryant, A.; Mawby, P.; Xiang, D.; Ran, L.; Tavner, P. An industry-based survey of reliability in power electronic converters. IEEE Trans. Ind. Appl. 2011, 47, 1441–1451. [Google Scholar] [CrossRef]
- Espinoza-Trejo, D.R.; Diez, E.; Barcenas, E.; Verde, C.; Espinosa-Perez, G.; Bossio, G. Model-based fault detection and isolation in a MPPT boost converter for photovoltaic systems. In Proceedings of the IECON 2016-42nd Annual Conference of the IEEE Industrial Electronics Society. IEEE, Florence, Italy, 23–26 October 2016; pp. 2189–2194. [Google Scholar]
- Benzaouia, A.; Telbissi, K. Actuator fault estimation based on proportional integral observer for discrete-time switched systems. J. Dyn. Syst. Meas. Control. 2019, 141, 31011. [Google Scholar] [CrossRef]
- Cano, J.M.; Martin, A.D.; Herrera, R.S.; Vazquez, J.R.; Ruiz-Rodriguez, F.J. Grid-connected PV systems controlled by sliding via wireless communication. Energies 2021, 14, 1931. [Google Scholar] [CrossRef]
- Rivai, A.; Abd Rahim, N.; Mohamad Elias, M.F.; Jamaludin, J. Analysis of photovoltaic string failure and health monitoring with module fault identification. Energies 2019, 13, 100. [Google Scholar] [CrossRef]
- Shariff, F.; Abd Rahim, N.; Hew, W.P. Zigbee-based data acquisition system for online monitoring of grid-connected photovoltaic system. Expert Syst. Appl. 2015, 42, 1730–1742. [Google Scholar] [CrossRef]
- Aatabe, M.; El Guezar, F.; Bouzahir, H.; Vargas, A.N. Constrained stochastic control of positive Takagi-Sugeno fuzzy systems with Markov jumps and its application to a DC-DC boost converter. Trans. Inst. Meas. Control. 2020, 42, 3234–3242. [Google Scholar] [CrossRef]
- Khabou, H.; Souissi, M.; Aitouche, A. MPPT implementation on boost converter by using T–S fuzzy method. Math. Comput. Simul. 2020, 167, 119–134. [Google Scholar] [CrossRef]
- Aatabe, M.; El Guezar, F.; Vargas, A.N.; Bouzahir, H. A novel stochastic maximum power point tracking control for off-grid standalone photovoltaic systems with unpredictable load demand. Energy 2021, 235, 121272. [Google Scholar] [CrossRef]
- Tanaka, K.; Wang, H. Fuzzy Control Systems Design and Analysis: A Linear Matrix Inequality Approach; John Wiley & Sons: New York, NY, USA, 2002. [Google Scholar]
- Wang, Z.; Ho, D.W.; Liu, X. Variance-constrained filtering for uncertain stochastic systems with missing measurements. IEEE Trans. Autom. Control. 2003, 48, 1254–1258. [Google Scholar] [CrossRef]
- Fard, M.; Aldeen, M. Robust control design for a boost converter in a photovoltaic system. In Proceedings of the 2016 IEEE 7th International Symposium on Power Electronics for Distributed Generation Systems (PEDG), IEEE, Vancouver, BC, Canada, 27–30 June 2016; pp. 1–9. [Google Scholar]
- Soon, J.L.; Lu, D.D.C. A simple open-circuit fault detection method for a fault-tolerant DC/DC converter. In Proceedings of the 2015 IEEE 11th International Conference on Power Electronics and Drive Systems, IEEE, Sydney, Australia, 9–12 June 2015; pp. 98–103. [Google Scholar]
- Shahbazi, M.; Jamshidpour, E.; Poure, P.; Saadate, S.; Zolghadri, M.R. Open-and short-circuit switch fault diagnosis for nonisolated DC–DC converters using field programmable gate array. IEEE Trans. Ind. Electron. 2012, 60, 4136–4146. [Google Scholar] [CrossRef]
- Lu, B.; Sharma, S.K. A literature review of IGBT fault diagnostic and protection methods for power inverters. IEEE Trans. Ind. Appl. 2009, 45, 1770–1777. [Google Scholar]
- Jagtap, S.; More, D. Switch Open-circuit Fault Diagnosis and Fault-Tolerant Control for Boost DC-DC Converter. Procedia Comput. Sci. 2020, 171, 934–940. [Google Scholar] [CrossRef]
- Espinoza Trejo, D.R.; Bárcenas, E.; Hernández Díez, J.E.; Bossio, G.; Espinosa Pérez, G. Open-and short-circuit fault identification for a boost dc/dc converter in PV MPPT systems. Energies 2018, 11, 616. [Google Scholar] [CrossRef]
- Bento, F.; Cardoso, A.J.M. Open-circuit fault diagnosis and fault tolerant operation of interleaved DC–DC boost converters for homes and offices. IEEE Trans. Ind. Appl. 2019, 55, 4855–4864. [Google Scholar] [CrossRef]


| Switch | Switch | |||
|---|---|---|---|---|
| 1 | 0 | 0 | off | off |
| 2 | 0 | 1 | off | on |
| 3 | 1 | 0 | on | off |
| 4 | 1 | 1 | on | on |
Disclaimer/Publisher’s Note: The statements, opinions and data contained in all publications are solely those of the individual author(s) and contributor(s) and not of MDPI and/or the editor(s). MDPI and/or the editor(s) disclaim responsibility for any injury to people or property resulting from any ideas, methods, instructions or products referred to in the content. |
© 2024 by the authors. Licensee MDPI, Basel, Switzerland. This article is an open access article distributed under the terms and conditions of the Creative Commons Attribution (CC BY) license (https://creativecommons.org/licenses/by/4.0/).
Share and Cite
El Abbadi, R.; Aatabe, M.; Bouzid, A.E.M. Wireless Diagnosis and Control of DC–DC Converter for Off-Grid Photovoltaic Systems. Sustainability 2024, 16, 3252. https://doi.org/10.3390/su16083252
El Abbadi R, Aatabe M, Bouzid AEM. Wireless Diagnosis and Control of DC–DC Converter for Off-Grid Photovoltaic Systems. Sustainability. 2024; 16(8):3252. https://doi.org/10.3390/su16083252
Chicago/Turabian StyleEl Abbadi, Reda, Mohamed Aatabe, and Allal El Moubarek Bouzid. 2024. "Wireless Diagnosis and Control of DC–DC Converter for Off-Grid Photovoltaic Systems" Sustainability 16, no. 8: 3252. https://doi.org/10.3390/su16083252