Article

Comparative Study and Evaluation of Sediment Deposition and Migration Characteristics of New Sustainable Filter Media in Micro-Irrigation Sand Filters

1
Institute of Farmland Irrigation of CAAS, Chinese Academy of Agricultural Sciences, Xinxiang 453003, China
2
Graduate School of Chinese Academy of Agricultural Sciences, Beijing 100081, China
3
Digital Agriculture Rural Research Institute of Zibo, Zibo 255051, China
*
Author to whom correspondence should be addressed.
Sustainability 2024, 16(8), 3256; https://doi.org/10.3390/su16083256
Submission received: 14 March 2024 / Revised: 8 April 2024 / Accepted: 11 April 2024 / Published: 13 April 2024

Abstract

:
The quartz sand filter medium used in micro-irrigation media filters has the disadvantages of short filtration cycle, surface filtration, and mining pollution. Selecting resources as new filter media is essential to improve the performance of the media filter and boost sustainable development. In this study, the traditional quartz sand filter medium and two new filter media were selected, and their corresponding filtration performances were comparatively studied. The influence of the type, particle size, and height of the filter medium on filtration performance was evaluated. The sediment content and distribution based on the size of particles in quartz sand, crushed glass, and glass bead filter layers was measured and analyzed. The hydraulic performance of different filter columns was analyzed. The results showed that for a given particle size, quartz sand exhibits the best sediment retention ability. This promoted the aggregation of small sediment particles into larger ones, whereas the crushed glass and bead glass filter layers promoted the splitting of large sediment particles into smaller ones, which enabled the reduction of blockage during the micro-irrigation process. The filtration rate of the quartz sand filter column exhibited the least fluctuation relative to crushed glass and glass bead filter media, and the pressure in each column exhibited a linear incremental change. In summary, glass microbeads are not suitable as filter material, crushed glass is suitable for general micro-irrigation systems, and quartz sand is suitable for micro-irrigation systems with elaborate filtration requirements. The findings of this study can provide theoretical guidance for the selection of the micro-irrigation filter material.

1. Introduction

With the increasing instances of weather extremes and water scarcity [1,2], micro-irrigation has become more reliant on sandy water sources, particularly in the Yellow River irrigation areas in China, where sandy Yellow River water is used as a micro-irrigation source [3]. This inevitably leads to the problem of sediment clogging in the irrigator [4]. Because emitter clogging is one of the primary reasons for the failure of micro-irrigation systems [5], the use of filters to separate sediment and other impurities from water is essential for preventing the clogging of micro-irrigation systems [6]. Filter columns with three-dimensional pores have good impurity interception and are widely used as filters in micro-irrigation systems worldwide [7].
Quartz sand is primarily used as a filter medium in media filters; however, it is a mineral resource, and its mining and processing increases pollution [8], which is detrimental to the sustainable development of society. The surface of quartz sand particles is rough and acts as a filter layer that performs a surface filtration operation in a short time by adsorbing and intercepting sediment [9,10]. This can lead to a significant increase in pressure in the filter column in a short period of time and an increase in head loss in the micro-irrigation system, resulting in energy wastage [11,12]. Using renewable resources with smoother surfaces as filter media is an alternative that can reduce pollution and water loss [13].
Glass has a smooth surface that does not produce harmful substances, making it an environmentally friendly material and one of the best choices to replace the quartz sand filter medium. Recycled waste glass as glass filter medium [14] can contribute to the sustainable development of society. Several scholars have been investigating the use of glass filter media for water purification. Salzmann et al. [15] concluded that broken glass has a high potential for wastewater filtration. Soyer et al. [16] and Hunce et al. [17] reported that a broken glass filter medium produces less head loss, whereas Zhao et al. [18] explored the use of glass balls as a medium in micro-irrigation filters for sediment filtration. Bové et al. [19] compared the pressure losses during filtration using silica sand, crushed glass, and modified glass. Ramezanianpour et al. [20] concluded that the removal rate of broken glass for various elements in a septic tank was lower than that of quartz sand. These studies show that glass filter media exhibit good filtration performance in the treatment of polluted municipal water, septic water, and sandy water. The filtration performance of filter media is directly related to particle size and shape; however, there are no studies on the filtration performance of glass filter media on the basis of particle shapes.
Previous studies on the filtration performance of micro-irrigation media have focused on turbidity [21,22] and filtered water quality fractions, which have been used to measure the filtration performance of different media. However, it is known that turbidity is only a proxy parameter to indicate the particulate content in water, and it does not accurately reflect the concentration of sediment impurities in the filtered water [23]. The filtered water that has passed through a porous medium layer is clear; therefore, the accuracy of measuring the mass fraction in the filtered water requires discussion. By contrast, micro-irrigation places certain requirements on the concentration [24] and particle size [25,26] of the sediments in filtered water. The above indicators are not sufficient to evaluate the filtration performance of the filter medium; for this, the sediment concentration in water should be clarified and the sediment particle-size distribution in filtered water should be further analyzed. Therefore, to assess the performance of the glass filter medium when filtering sandy water, the performance indices must be updated.
Based on cited research by other authors and our detailed analysis of alternative options, this study employs the quartz sand filter medium as the reference medium and used glass with two different grain sizes as the filter medium. The filtration performance of the three types of filter media with different grain sizes was investigated using 0.4% sandy water. This provides a theoretical reference when selecting an appropriate type of filter medium, the particle size of the medium, and the height of the filter layer, according to the condition of the water, in practical applications.

2. Materials and Methods

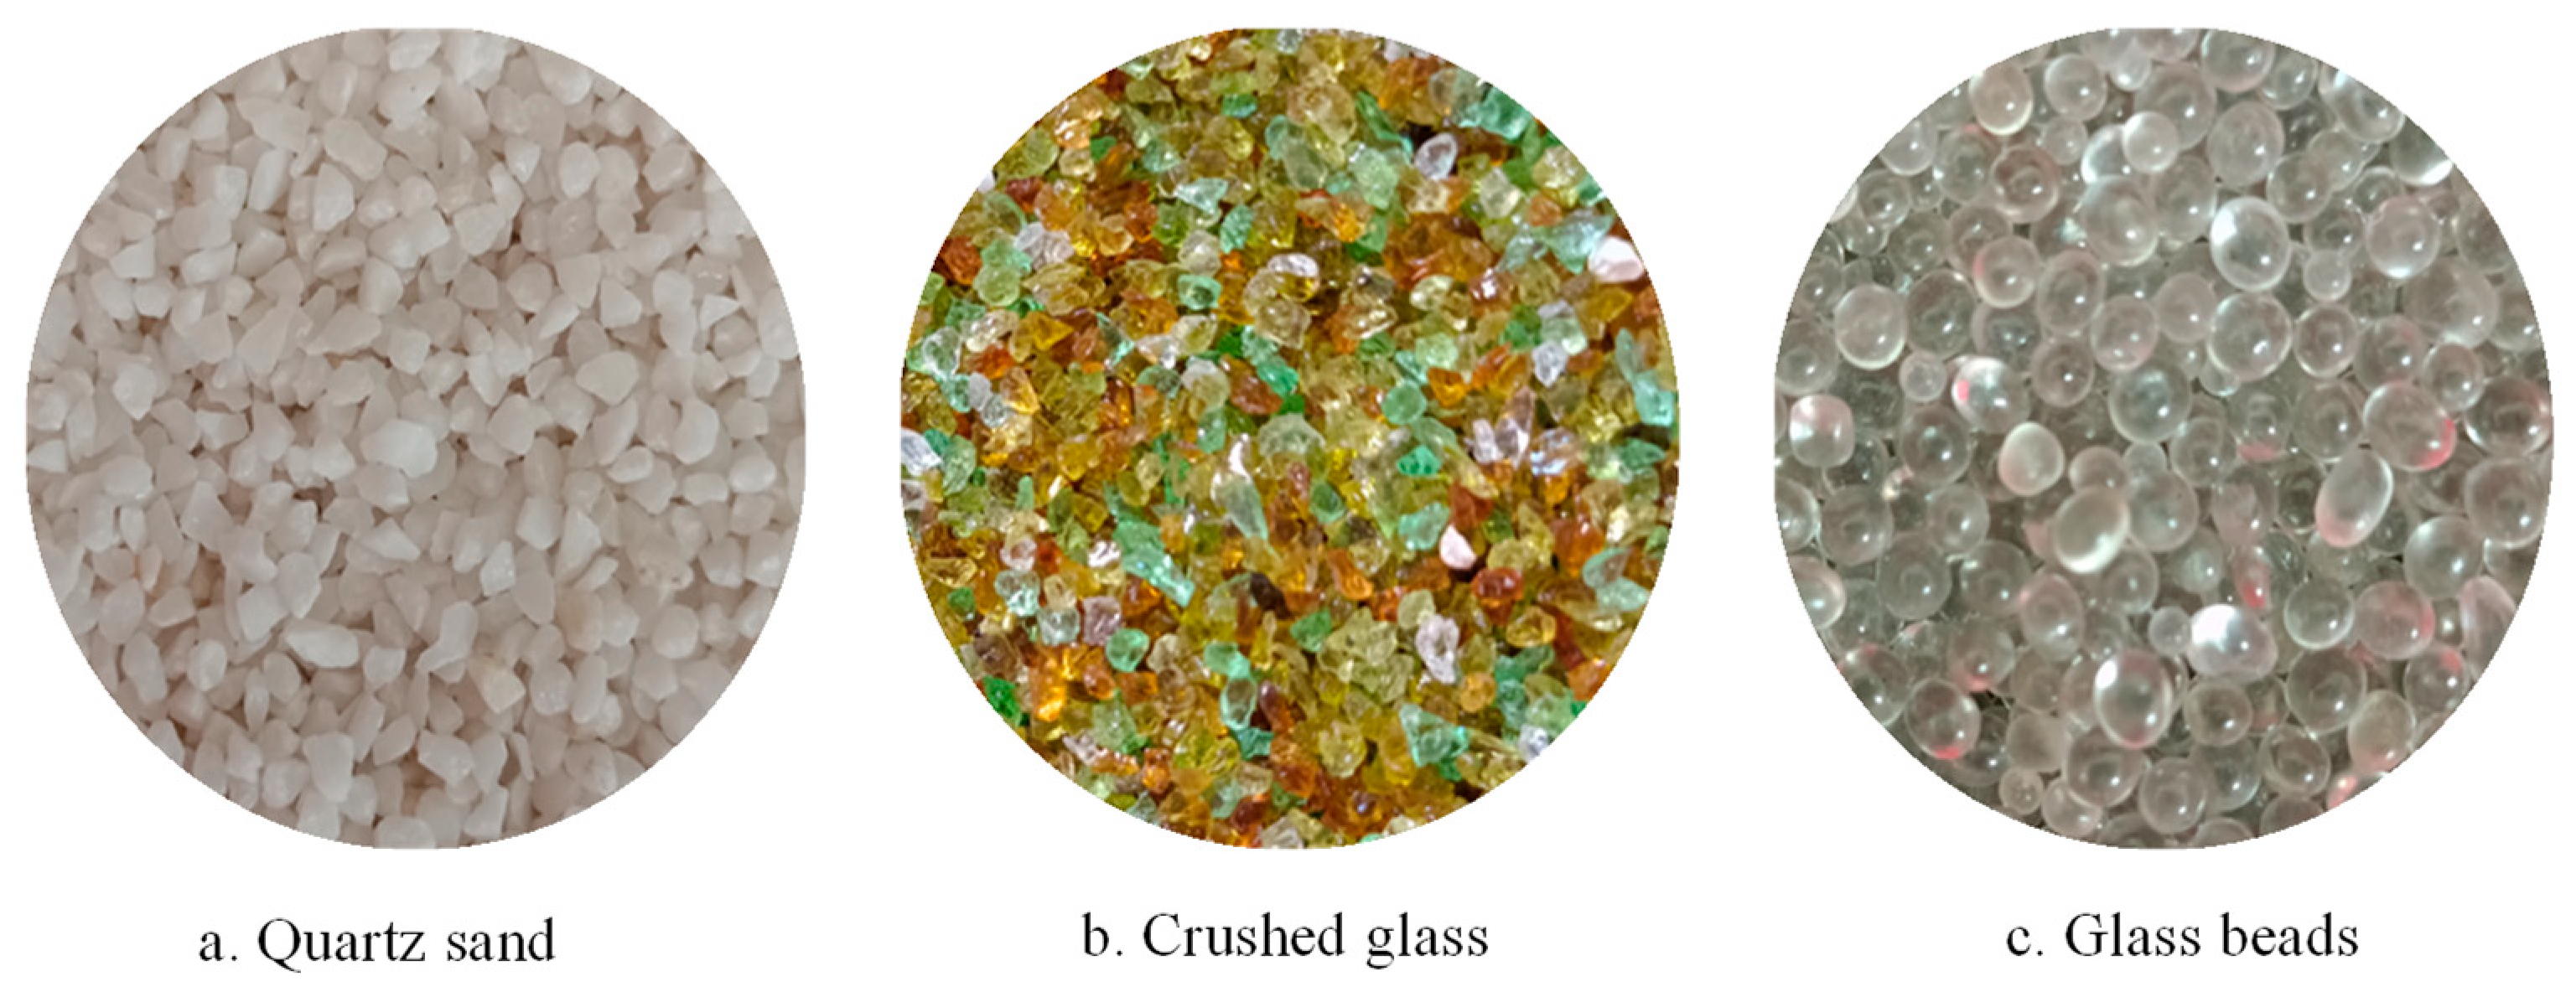
2.1. Filtration Media

Three types of filter media were selected for this study: quartz sand, crushed glass, and glass beads (Figure 1), to represent conventional filter media, new filter media with regular and irregular shapes, and filter media with rough and smooth surfaces, respectively. In addition, each filter medium was separated into three particle-size ranges of 0.9–1.25, 1.25–1.6, and 1.6–2.0 mm using a vibrating screen to evaluate the effect of particle size on the filtration and hydraulic performances. Before filtration, all filter media were loaded into a column of a height of 40 cm. The size ranges 0.9–1.25, 1.25–1.6, and 1.6–2.0 mm of the quartz sand, crushed glass, and glass bead filter media were denoted as FC1, FC2, FC3, BC1, BC2, BC3, GC1, GC2, and GC3, respectively.

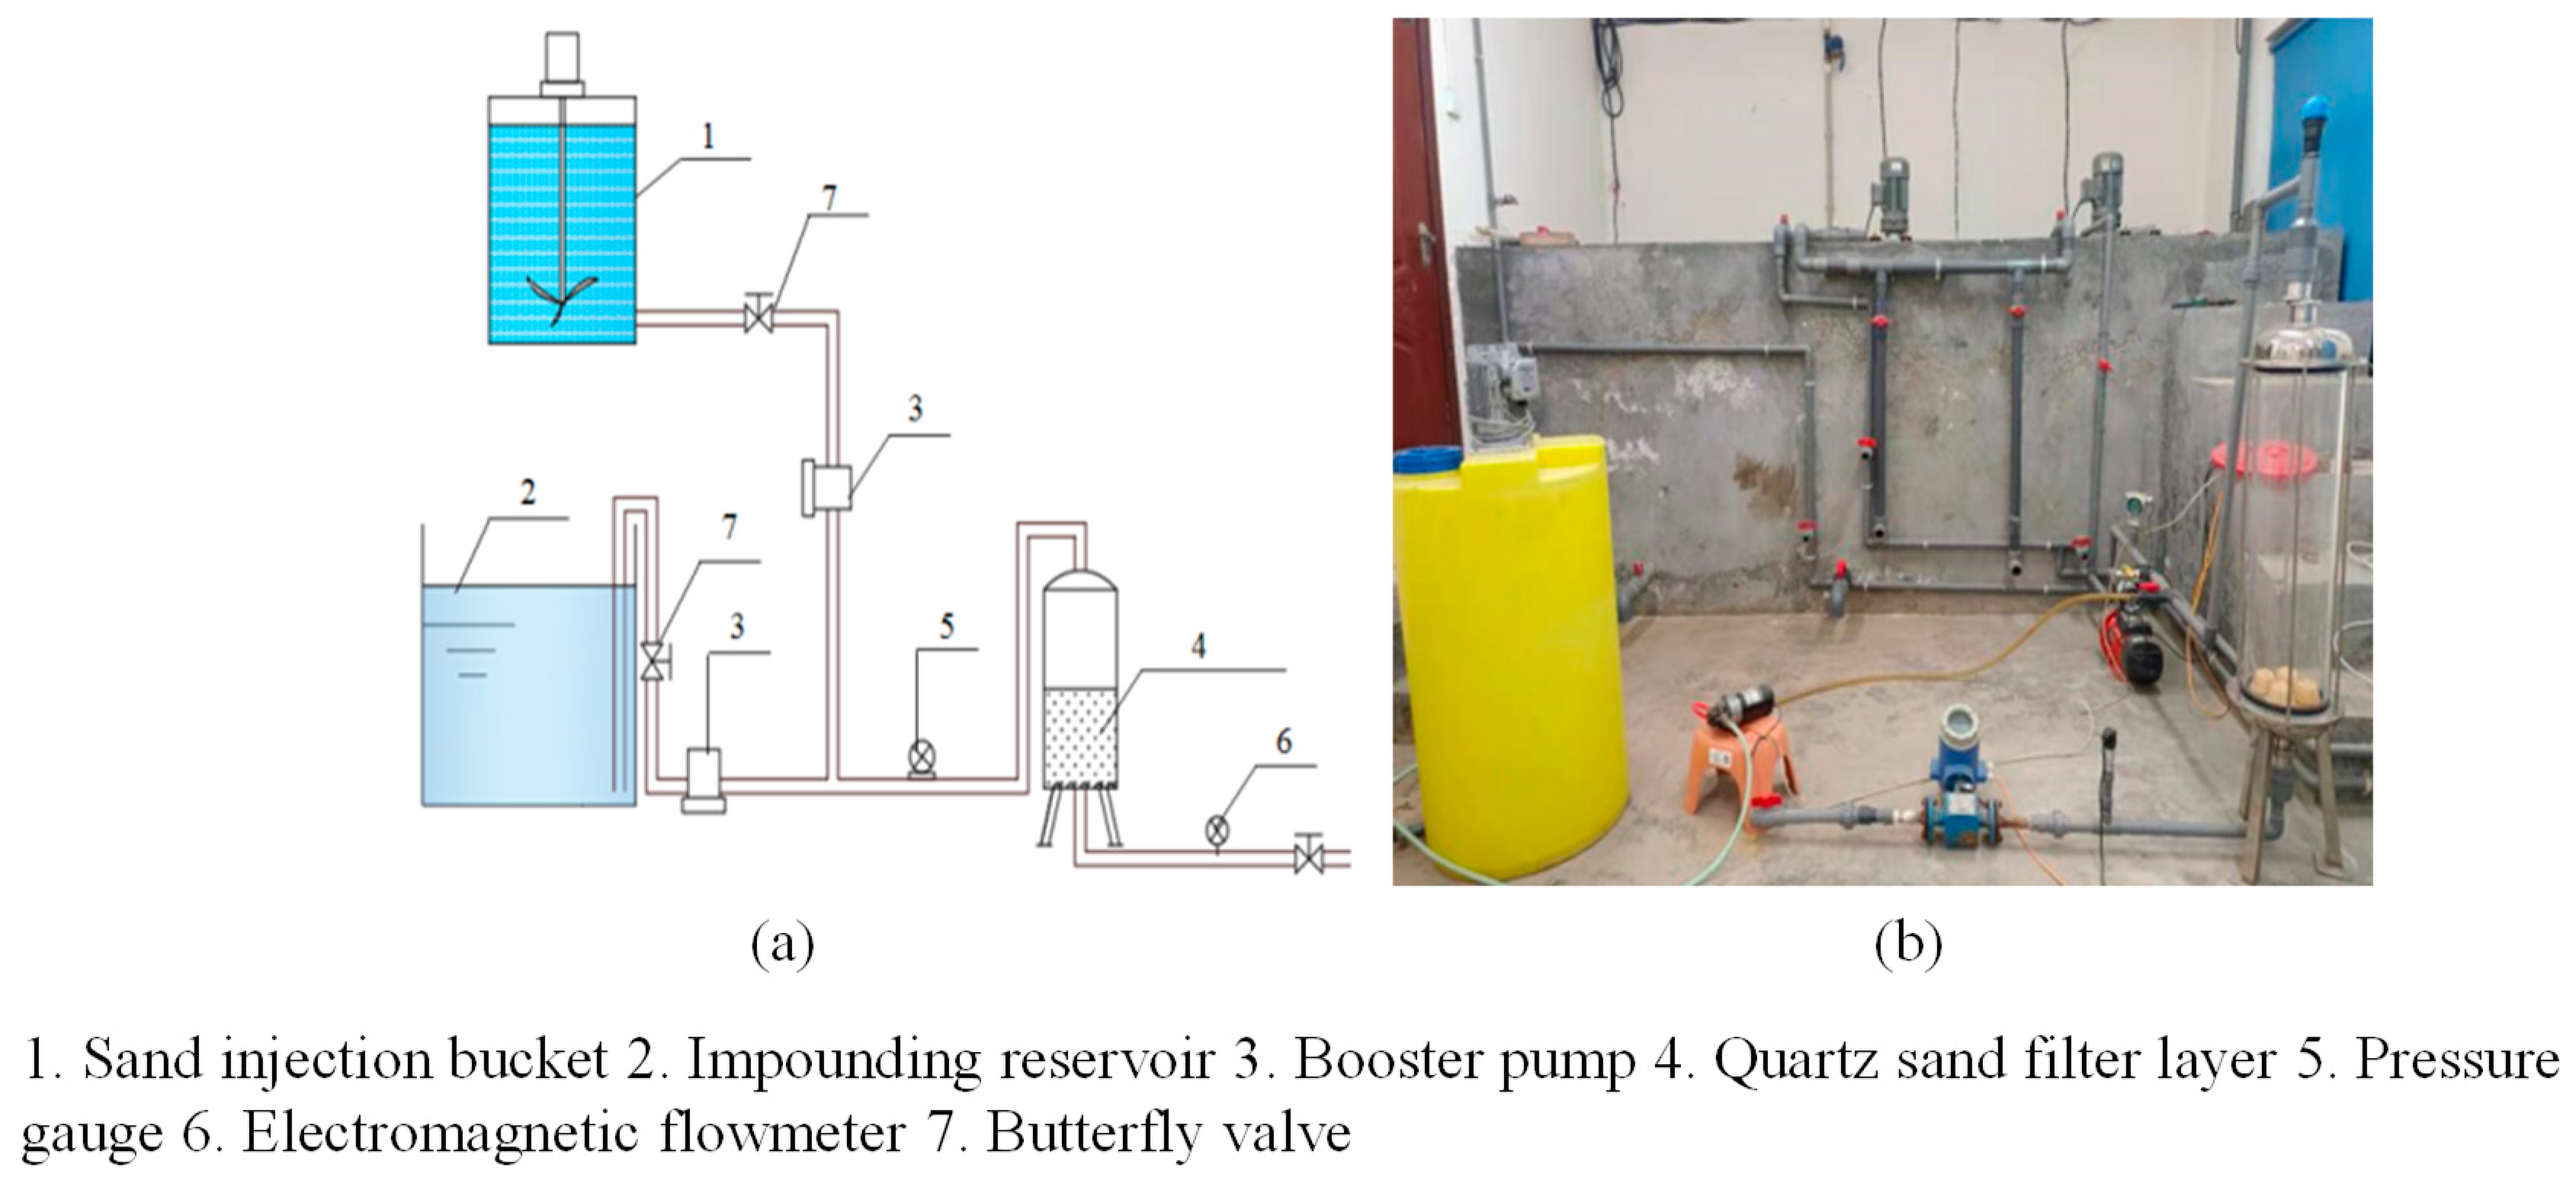
2.2. Experimental Setup

The experiment was conducted in the filtration laboratory at the Institute of Farmland Irrigation, Chinese Academy of Agricultural Sciences, Xinxiang City, Henan Province, China. The experimental setup is shown in Figure 2. The filter consisted of a plexiglass column of 19 cm diameter and 120 cm height. The hollow of the filter column was filled with filter material up to a height of 40 cm, and four filter caps were installed underneath. There were two water inlet channels in front of the filter; the clear water channel was connected to a reservoir with a capacity of 4.5 m3, and the sand injection channel was connected to a sand mixing tank with a capacity of 200 L. The water inlet channels were filled with water using pumps, and the rated water supply flow rates of the two pressurized pumps were 5 and 2 m3·h−1. A manual turbo butterfly valve was installed in front of the water inlet of the pumps to control the flow rate.

2.3. Sandy Water Configuration

Yellow River sediment was used in the sand mixing bucket with a mass fraction of 2% of sand water. The sediment, taken from the new magnetic irrigation canal section of the People’s Victory Canal, was dried, sieved, and prepared for use after drying. The BT-9300H laser particle-size distribution meter (0.1–716.0 µm) from Dandong Baxter was used to analyze the sieved sediment.

2.4. Filtration Steps

Before filtering the sandy water, clean water was introduced into the filter layer to wash it, after which the sand injection flow rate was adjusted to 0.4 m3/h and the water injection flow rate was 1.6 m3/h. The mass fraction of the water–sand mixture reached 0.4%, and the water flow rate in the filter column reached 0.02 m/s. In each test, the water was filtered for 30 min, the flow meter and pressure gauge recorded every 1 min, and the process was repeated three times for each filter material.
After the filtration ended, the filter was opened. The 40 cm filter medium was divided into four layers, each of 10 cm in height, which were recorded as H1 (−10–0 cm), H2 (−20–−10 cm), H3 (−30–−20 cm), and H4 (−40–−30 cm), and each layer of the filter medium was taken out in turn and put in a bucket for purification. Then, the filter medium was separated from the sandy muddy water using a sieve. After separation, 2000 mL of uniformly muddy water was dried to extract the sediment particles. The remaining water in the muddy water bucket was filtered using 600 × 600 mm medium-speed filter paper (pore sizes of 30–50 μm); the filter paper and beaker were dried and weighed separately before use.
After drying, the filter paper and beaker containing the sediment particles were removed from the oven and weighed. The particle sizes of the H1, H2, H3, and H4 layers of the nine-filter media were tested using the BT-9300H laser particle-size distribution meter (0.1–716.0 µm), and the percentage of sediment particles in each particle-size range was analyzed and compared with the particle-size distribution of the original Yellow River sediment.

2.5. Test Indices and Measurement Methods

(1)
Sediment retention in the filter layer: The sediment retention quality of each of the four filter layers in the nine columns was assessed using the test method involving collecting, separating, and drying.
(2)
Sediment retention uniformity: The uniformity of sediment retention in the filter layer was obtained by calculating the standard deviation of the sediment retention in the four filter layers of a single filter column.
(3)
Particle-size distribution of the filter-layer sediment: A BT-9300H laser particle-size distribution meter (0.1–716.0 µm) was used to analyze the particle size of the sediment samples retained by the filter layer. The particle-size distributions of the sediments retained in the four filter layers of the nine columns were obtained.
(4)
Pressure and flow rate: A pressure gauge and flow meter were arranged at the inlet and outlet of the filter model, respectively. Readings were recorded once every minute during the test to calculate and analyze the changes in the flow rate of different particle sizes as well as the changes in the pressure drop of the filtration system.

3. Results and Discussion

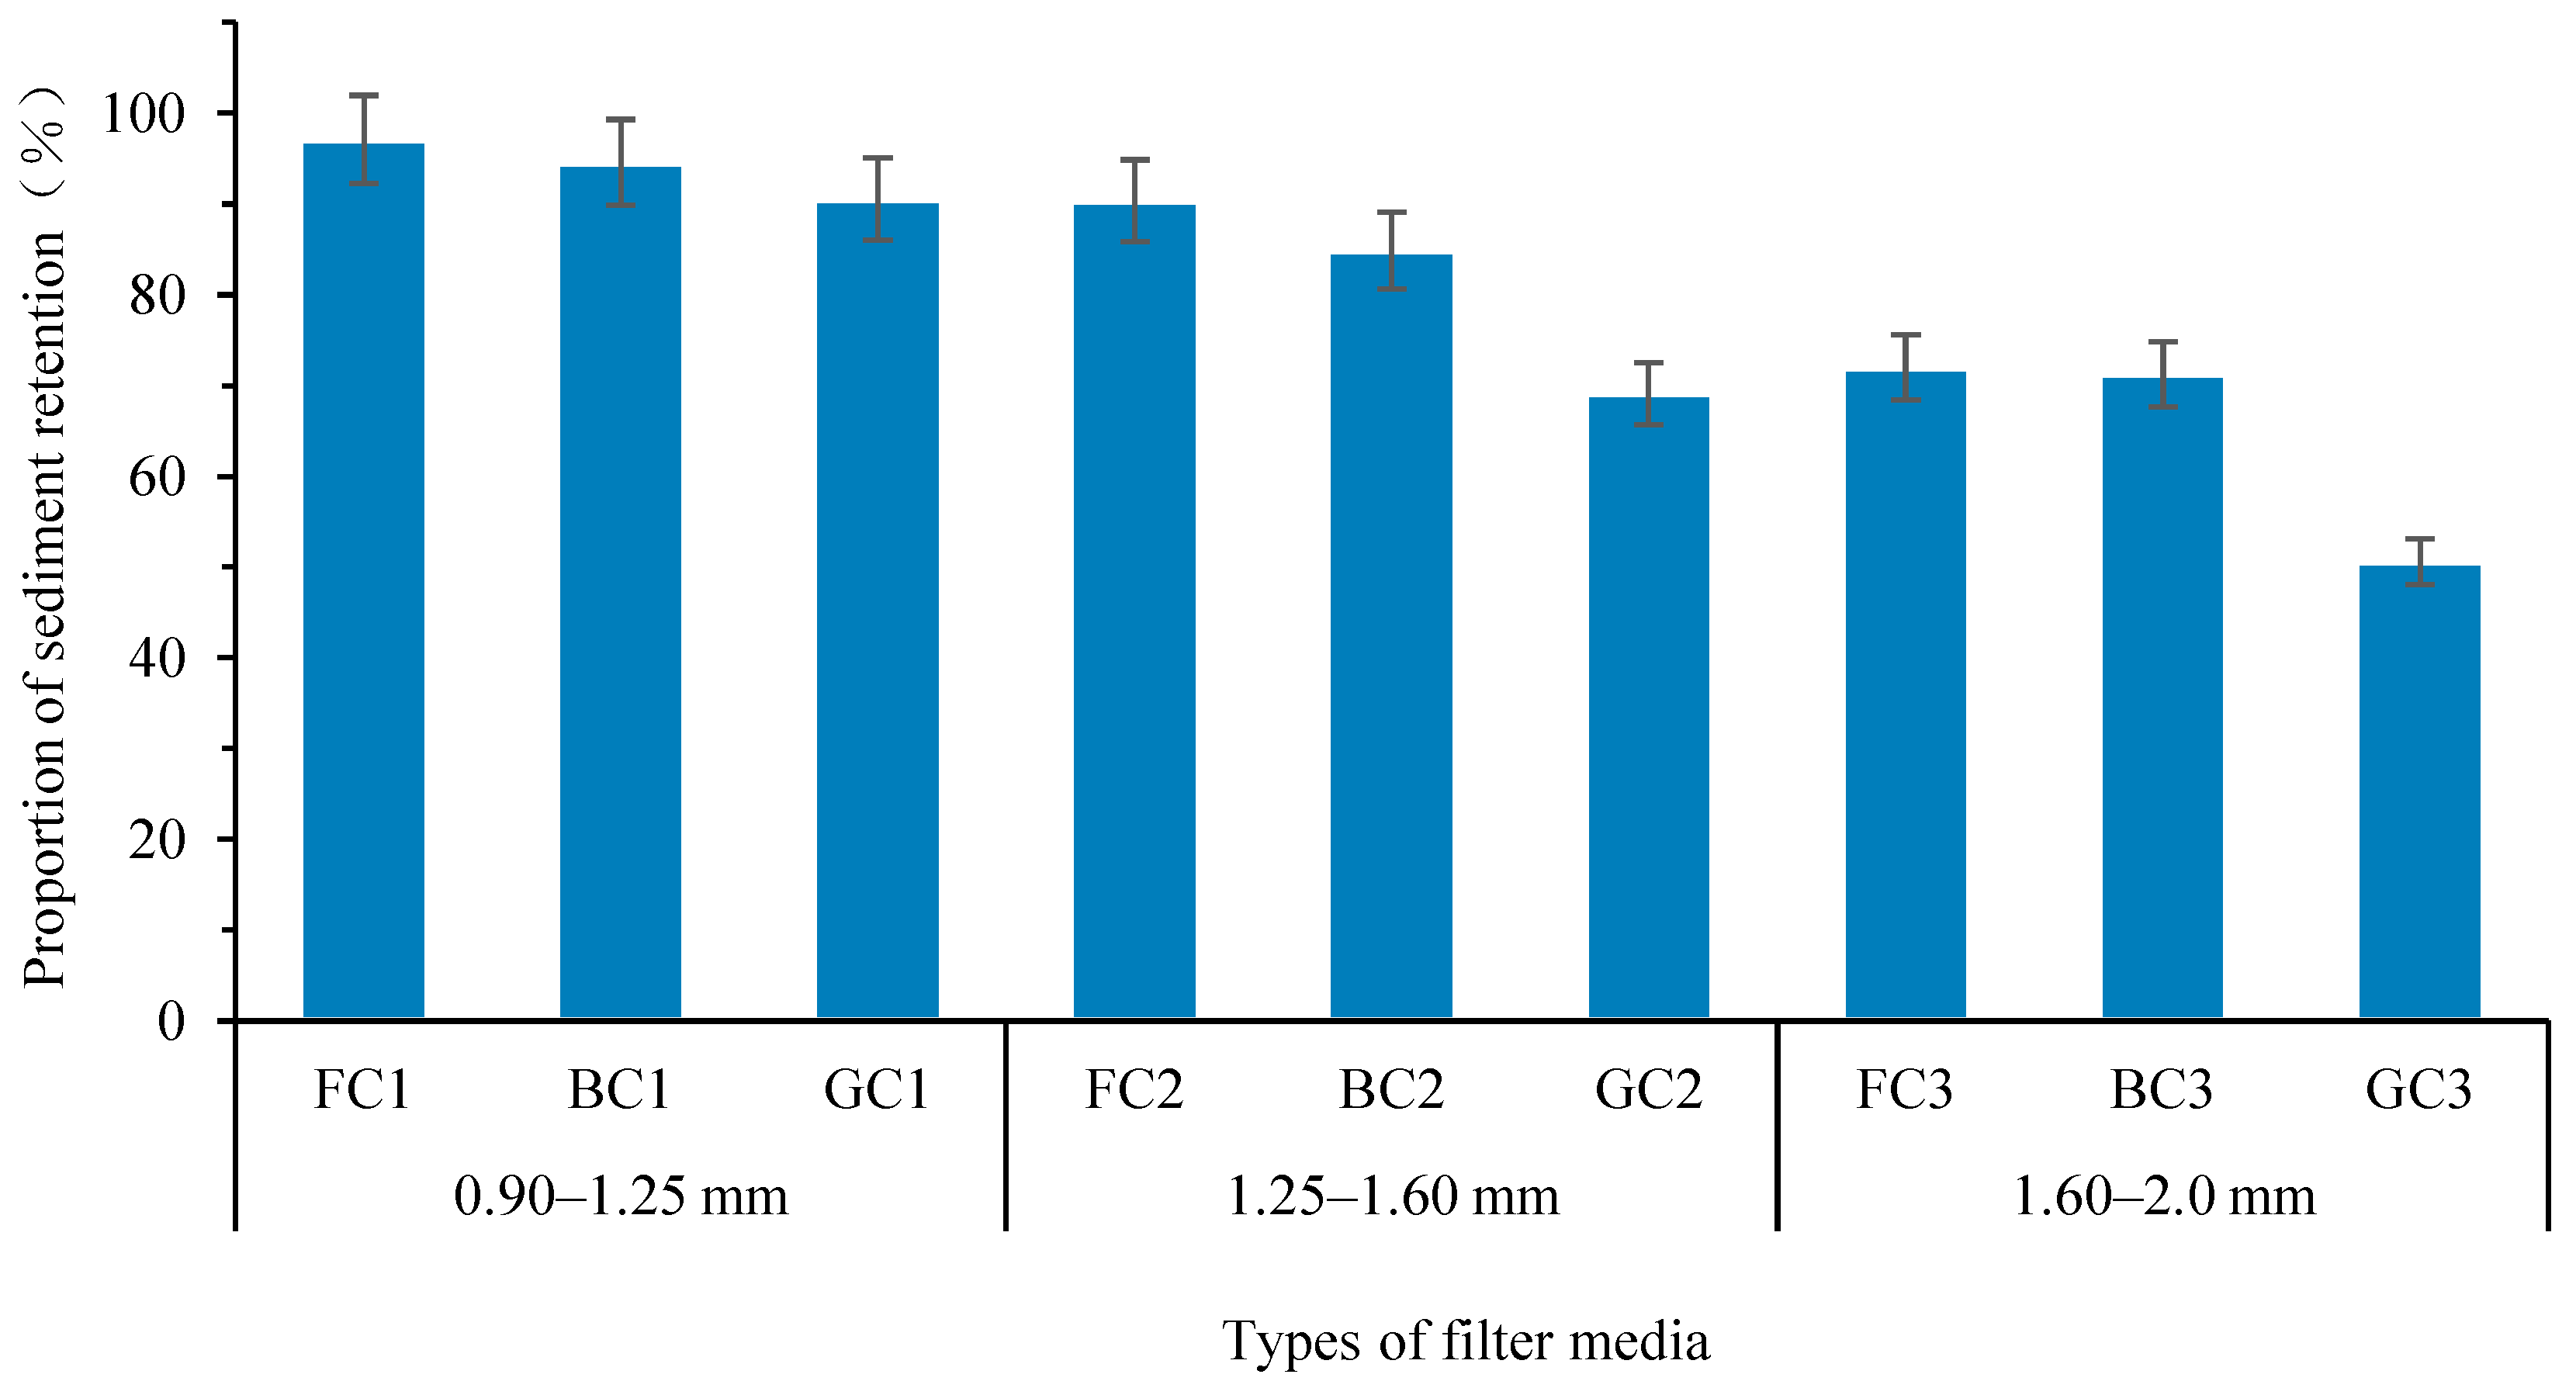
3.1. Quality Analysis of the Sediment Retained in the Filter Column

A single-factor variance analysis was conducted on the quality of the sediment with particles of different sizes, trapped by the filter columns. As shown in Table 1, the differences in the quality of the sediment trapped by each filter column and the particle sizes of the filter material were statistically significant (p < 0.05). The average sediment retention ratios of the 0.9–1.25, 1.25–1.6, and 1.6–2.0 mm filter columns were 94.04%, 81.40%, and 64.59%, respectively. The larger the size of the filter particle, the lower the sediment interception ratio. There was a significant difference between the interception ratios of the 0.90–1.25 and 1.60–2.00 mm filter columns. Therefore, in a micro-irrigation system with high water quality requirements, a filter material with a small pore size should be used.
The sediment retention ratios of the quartz sand, modified glass, and glass bead filter layers are shown in Figure 3. It is clear that within the same particle-size range, the interception ratio of quartz sand is the highest, followed by that of crushed glass, and the interception ratio of the microbead glass is the lowest. Quartz sand has an irregular shape and rough surface with many small pores, crushed glass has an irregular shape and smooth surface, and microbead glass has a spherical shape and smooth surface. Comparing the physical structures of the three filter materials, for the same size range of the filter material, an irregular shape and rough surface can enhance intercepting ability; spherical and smooth surfaces reduce the intercepting ability to a certain extent. Therefore, within the same size range, the intercepting ability of quartz sand is the strongest and that of the glass bead is the weakest. Thus, glass beads should be avoided in micro-irrigation systems with high water quality requirements.
Table 1. One-way ANOVA of sediment retention ratio of filter media with different particle sizes.
Medium Size (mm)0.90–1.25 (n = 3)1.25–1.60 (n = 3)1.60–2.00 (n = 3)FLSD
Sediment retention ratio (%)94.04 ± 3.3281.40 ± 11.0264.59 ± 12.137.026 *[0.9, 1.25] [1.6, 2.0]
Note: The data in the table are mean ± standard deviation; * indicates significant difference between different filter media at 0.05 level. F is the statistic of the F-test, which is the ratio of the sum of squared deviations to the degrees of freedom between and within groups. LSD represents the groups with significant differences tested by the least significant difference method.

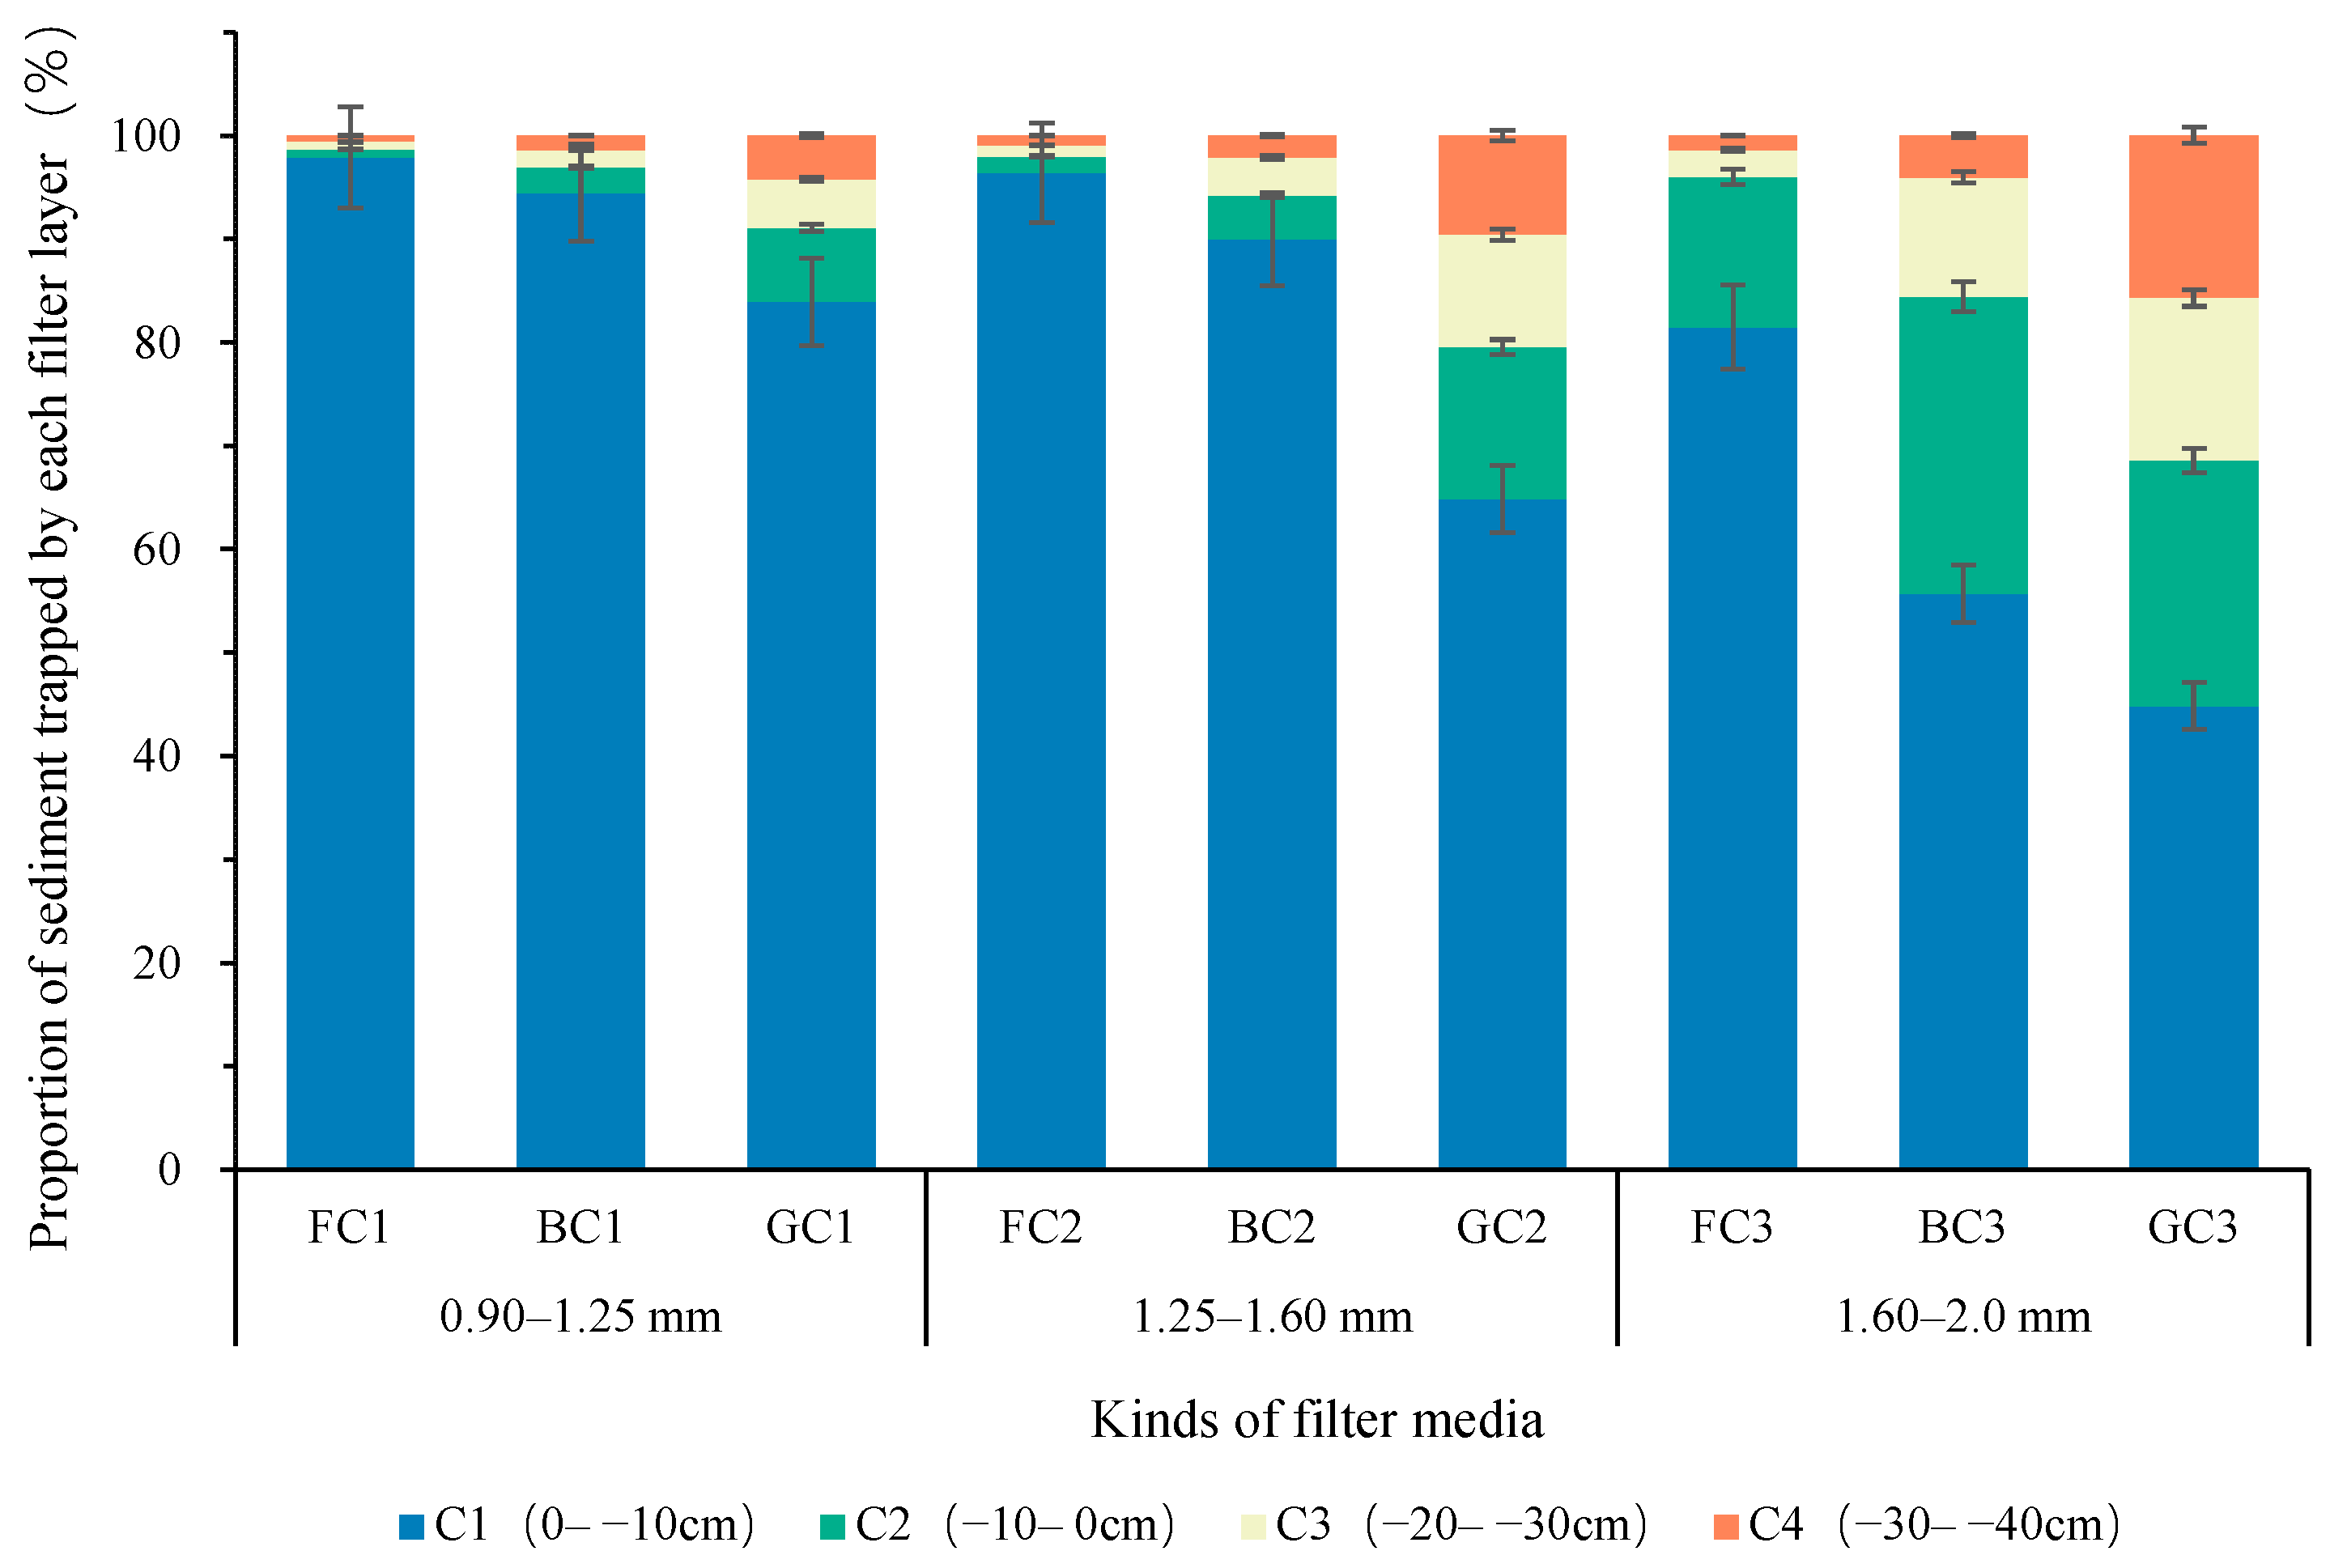
3.2. Analysis of Sediment Uniformity of Filter Column Interception

The sediment distribution in each filter column is shown in Figure 4. The sediment retention ratio of the H1 filter layer was the highest in the same column. The sediment retention ratios of the H2, H3, and H4 filter layers decreased with the depth of the filter layer. For example, the sediment retention rates of the H1–H4 filter layers are 97.87%, 0.80%, 0.72%, and 0.61% in the FC1 column and 44.85%, 23.72%, 15.72%, and 15.71% in the GC3 column, respectively. Based on the ANOVA of the three factors (types, particle size, and the depth of layers) of trapped sediment quantity, it can be seen that for the significance of variable hierarchy F test (p < 0.001), the depth of layers has a significant effect on sediment quality, and there is a major effect. According to the analysis, for a filter column with strong pollution interception capacity, such as FC1, the filter layer thickness should be reduced based on the actual situation to save resources. For a filter material with a weak pollution interception capacity, such as GC1, the thickness of the filter layer should be increased to ensure that the water quality after filtration meets the set standards.
For the FC2, BC2, and GC2 filter columns, the standard deviations of the sediment interception ratios for the H1–H4 filter layers were 155.80, 127.29, and 97.94, respectively. For filter columns with the same particle-size range, the surface filtration phenomenon of the quartz sand filter column was the most significant, that of the crushed glass filter column was reduced, and sediment distribution in the glass beads column was the most uniform. The analysis showed that the bending channel of the quartz sand unit was the longest within the same grain-size range. For the same porosity, the migration space of a quartz sand filter is narrower than that of other types of filters, even if they have the same porosity, because quartz sand particles have more microscopic pores, which allows them to adsorb more sediment. This increased adsorption capacity makes the possibility of filter clogging or “jamming” more likely.
In a microbead glass filter layer with a regular shape and smooth surface, the sediment can be carried by water to a deeper level, and the filter column as a whole can perform the filtering function. Therefore, to improve the overall efficiency of the filter column, in case the filtered water quality of each medium can meet the requirements of micro-irrigation, a medium with a smooth surface should be prioritized as the filter material.
The standard deviation of the sediment retention ratios of the BC1, BC2, and BC3 filter columns are 144.98, 127.29, and 54.83, respectively. It is found that for the same type of filter column, the larger the particle size of the medium, the more evenly distributed the sediment in the filter column. Media filters are automatically back-washed by setting a pressure difference between the upper and lower parts of the filter columns [27]. However, the surface filter blocks the upper filter material in a short time, increases the pressure difference in the filter column, and significantly limits the overall filtration efficiency of the column. Therefore, to prolong the filtration period to ensure water quality after filtration, it is preferable to select a larger size range of filter medium.

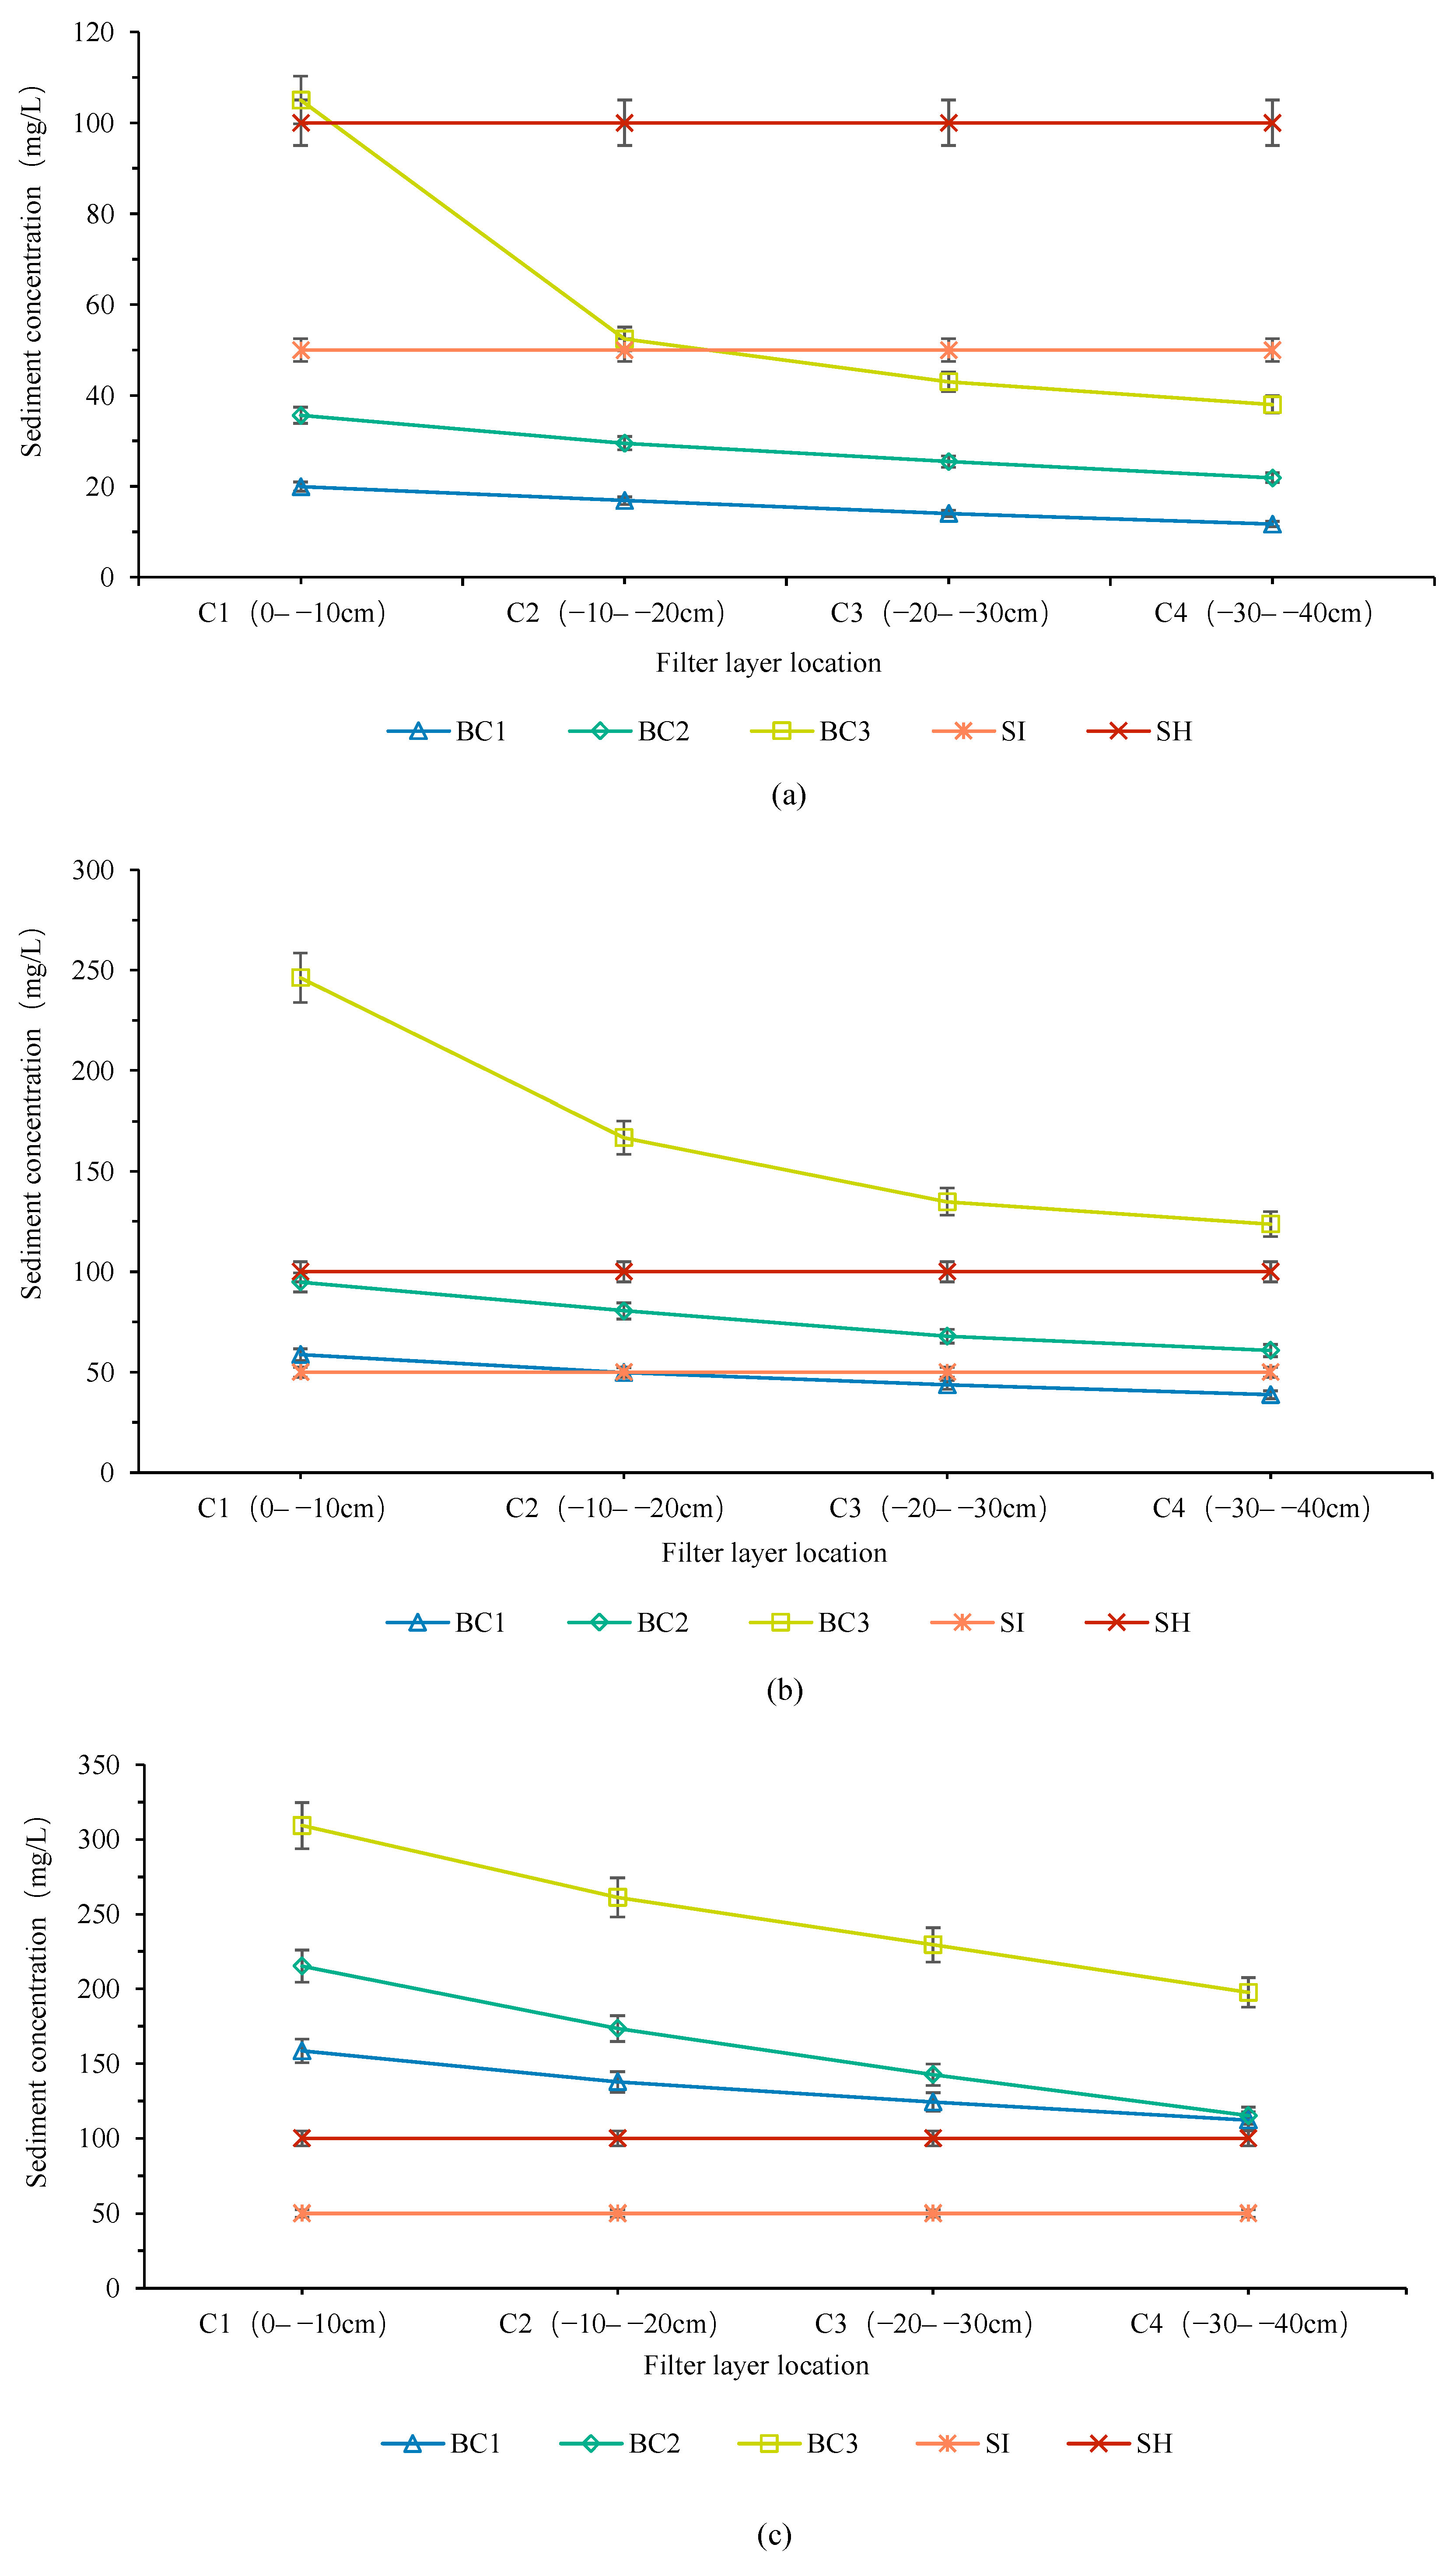
3.3. Analysis of the Sediment Mass Fraction in Water after Filtration

In the water quality requirements section of the China Technical Standards for Micro-Irrigation (2020), an evaluation of emitter plugging showed that the risk of emitter plugging was low when the concentration of suspended solids in the filtered water was below 50 mg/L; for concentrations above 100 mg/L, the risk was high. Figure 5 shows the variation in the sediment concentration in the filtered water with the depth of the filter layer in the nine columns. The value of 50 mg/L is the upper limit of the suspended solid concentration to ensure a low risk of irrigator clogging (SI), and 100 mg/L is the lower limit for the suspended solid concentration to ensure a medium risk of irrigator clogging (SH). The medium risk of irrigator clogging is between SI and SH. The ideal filtration medium should give full play to the filtration potential of each layer of media, so that the concentration of filtered water gradually decreases along the filter layer, and when the filtered water reaches the filter outlet, the impurity concentration and particle size of the water meet the water quality requirements of micro-irrigation.
As shown in Figure 5, at a filtration speed of 0.02 m/s and a muddy water mass fraction of 0.4%, the filtered water–sand concentrations of FC1 and FC2 are always lower than SI for each filtration layer height range, FC3 is lower than SI in the −30–−20 cm filtration layer height range, and BC1 is lower than SI in the −30–−20 cm filtration layer height range. BC2 is always in the medium-risk-of-blockage zone, whereas BC3, GC1, GC2, and GC3 are always in the high-risk-of-blockage zone.
A suitable filter-layer thickness can save resources [28]. According to the experimental results, when the FC1, FC2, FC3, and BC1 columns of 10, 10, 30, and 30 cm height, respectively, were used for filtration, the particle concentrations of the filtered water and sediment were less than 50 mg/L, which met the requirements of suspended solid concentration for micro-irrigation. According to the trend of decreasing sediment content with the thickening of the filter layer, the BC2, BC3, GC1, GC2, and GC3 filter columns still require a thicker filter layer so that the filtered water quality can meet the standards of water quality for micro-irrigation. In practical application scenarios, in order to ensure the filtration accuracy, some manufacturers often fill the sand filter with a thickness of more than 50 cm, and some manufacturers often use a thickness of about 25 cm filter medium in order to reduce the cost. In the actual application process, the specific filling thickness should be determined according to the water source, the type of filter medium, the medium particle size, and the operating conditions.

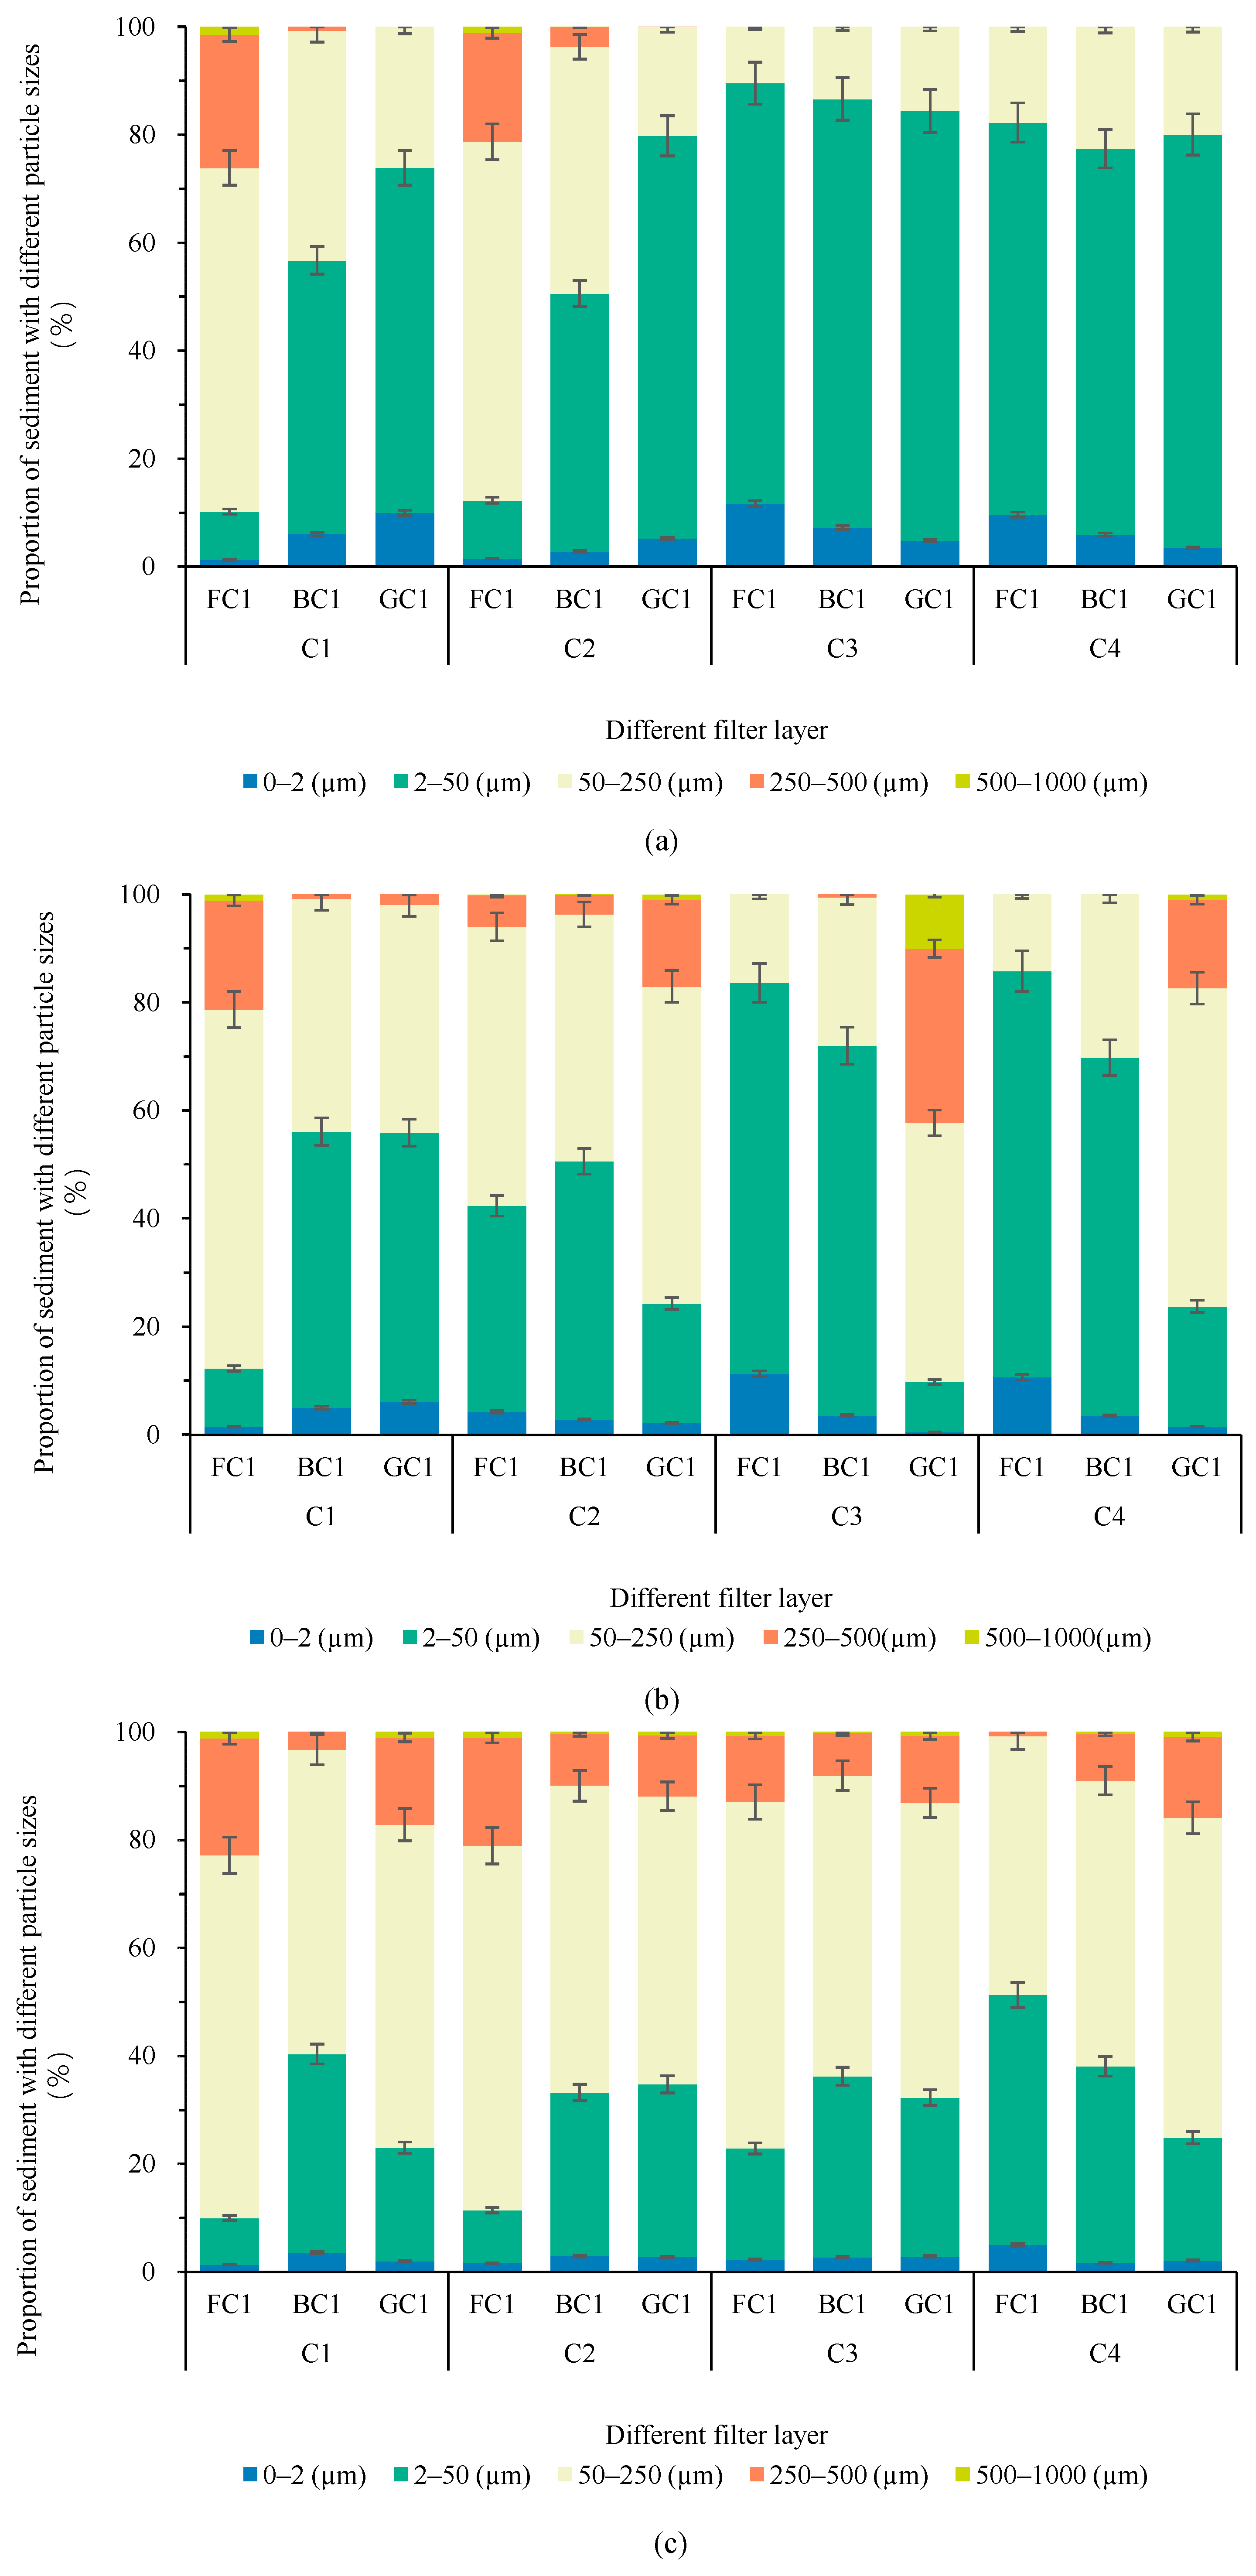
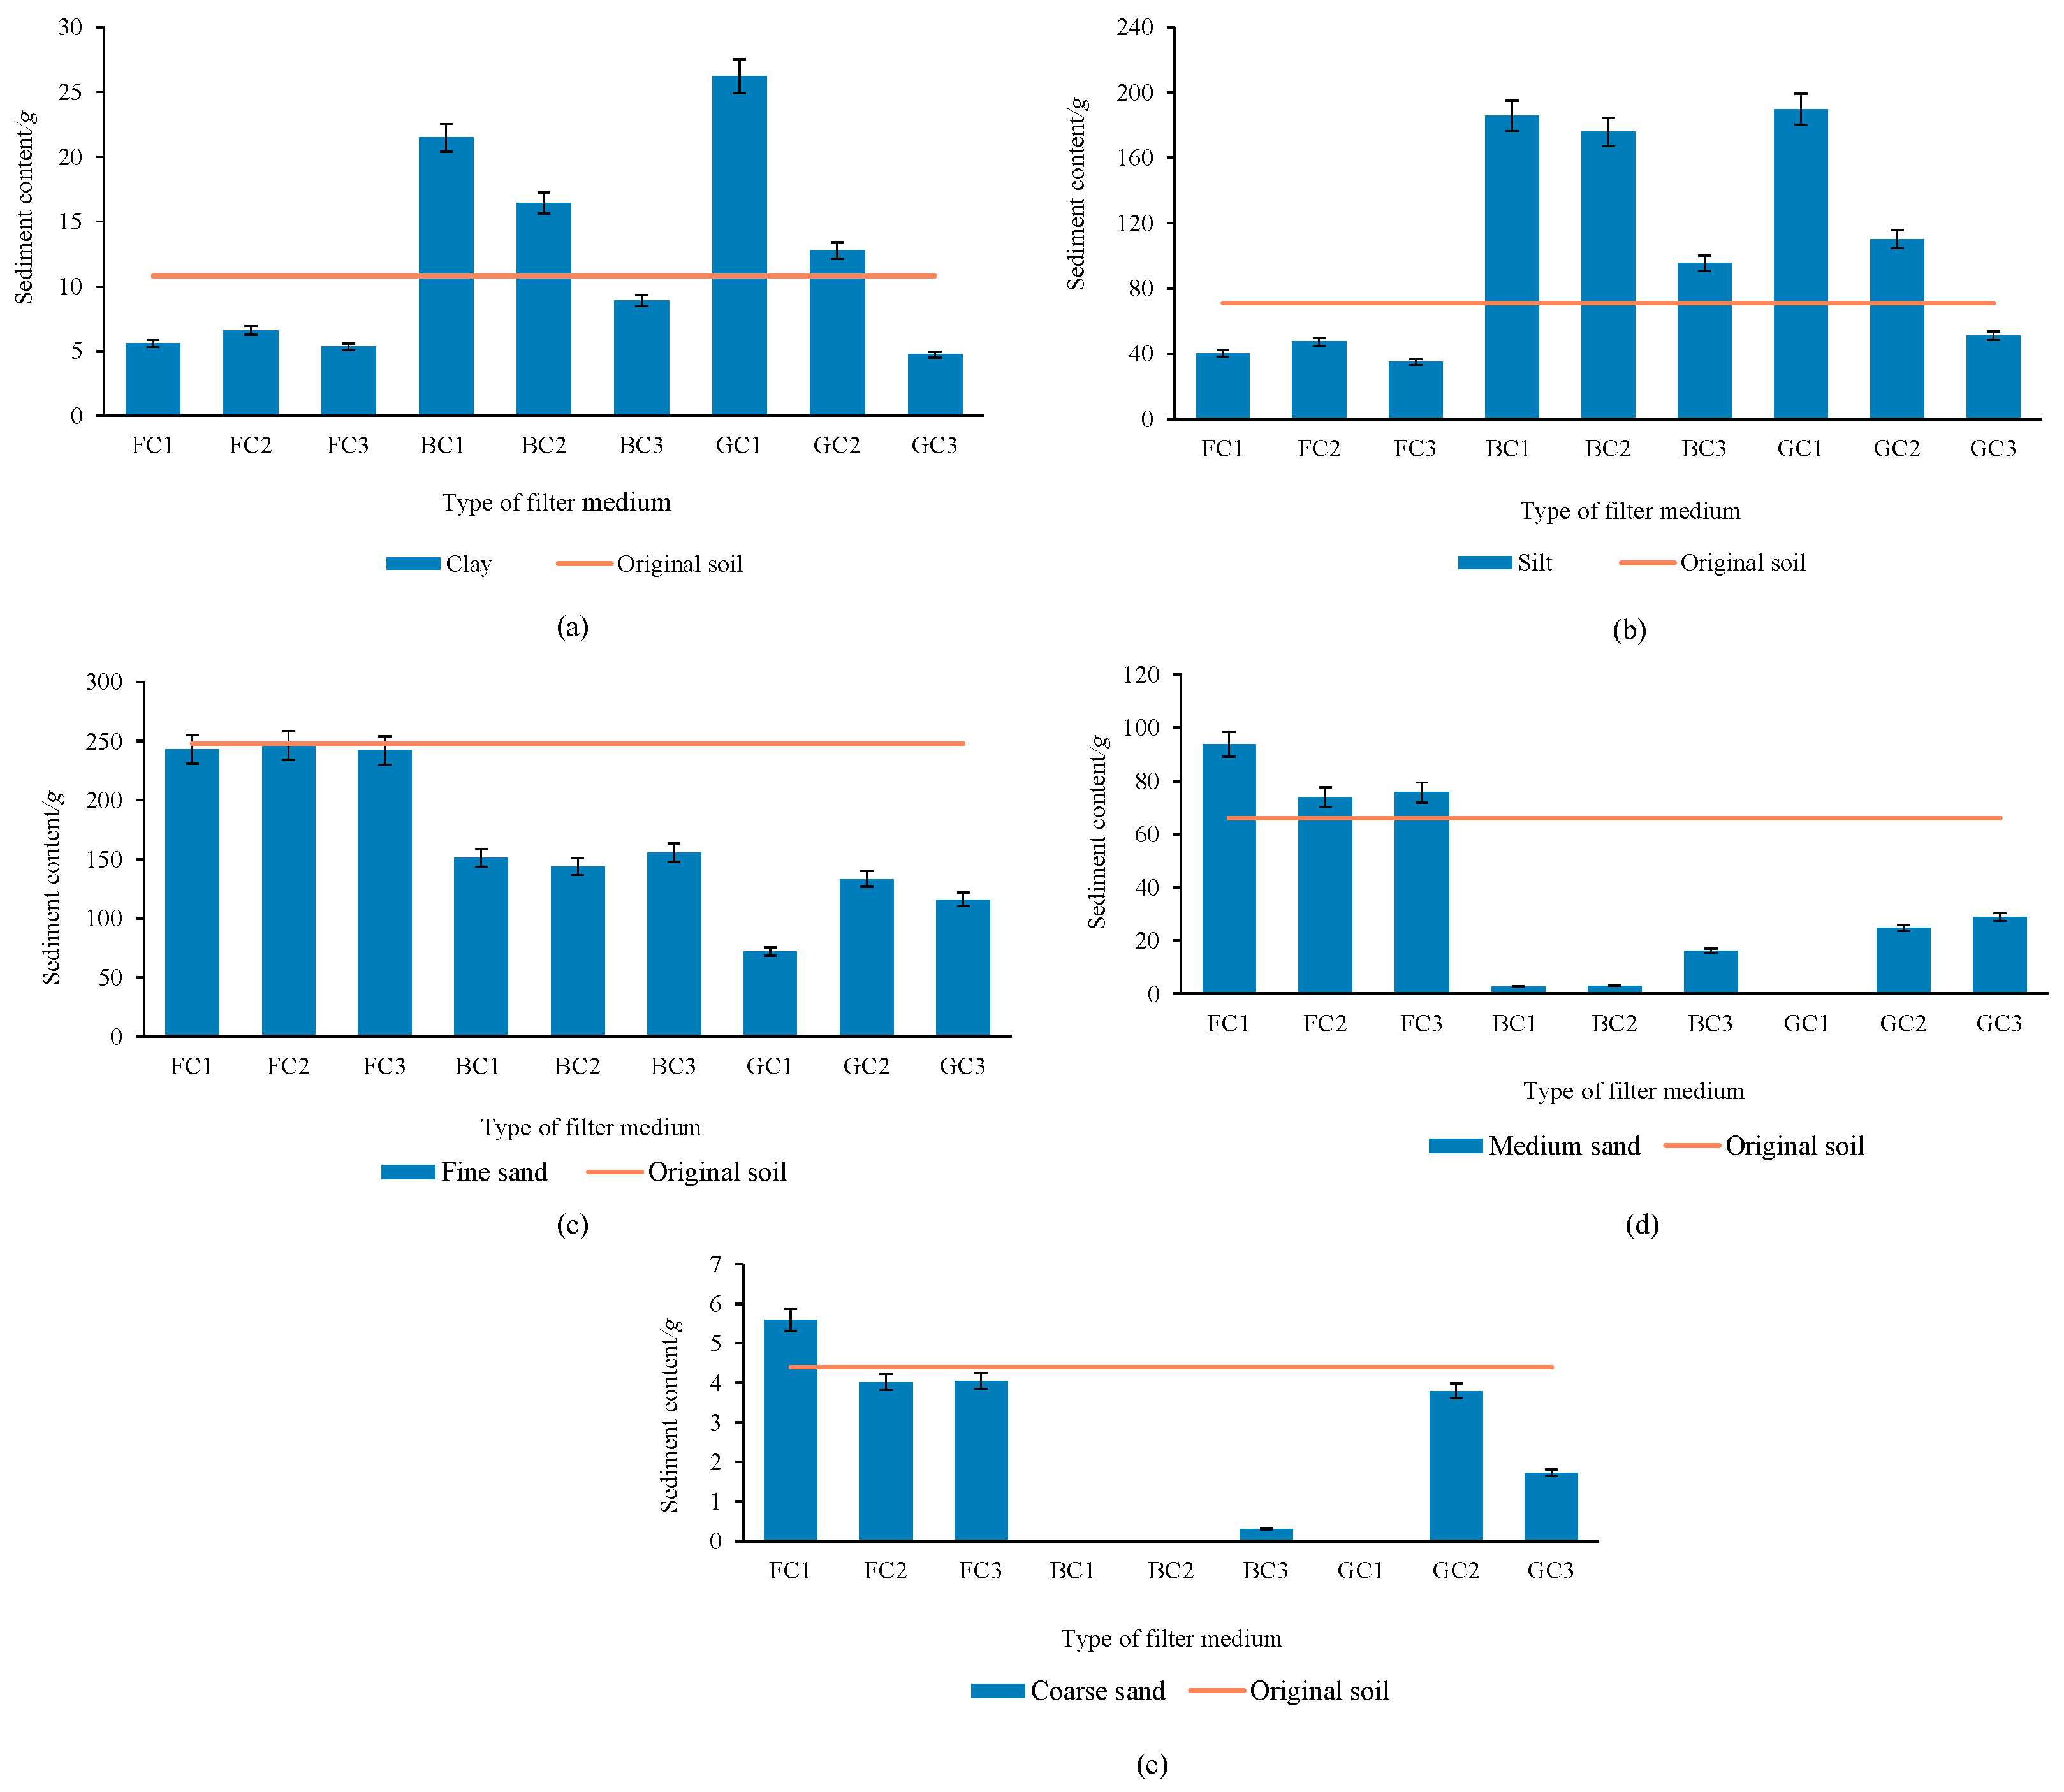
3.4. Analysis of Sediment Particle Size in Filter Layers

According to the particle-size classification standard of the United States Department of Agriculture [13], the classification of particle sizes of sediment particles is defined as follows: clay, d ≤ 2 µm; powder, 2 µm < d ≤ 50 µm; fine sand, 50 µm < d ≤ 250 µm; medium sand, 250 µm < d ≤ 500 µm; and coarse sand, 500 µm < d ≤ 1000 µm.
As shown in Figure 6, the particle-size distribution of sediment trapped by filter columns can be obtained. It is observed that for the same particle sizes of medium quartz sand and modified glass, the proportions of clay and powder increase with the depth of the filter layer, whereas the proportions of fine, medium, and coarse sands decrease. However, the distribution of the sediment particles in the microbead glass filter column was insignificant. Several domestic and international studies [29,30] have focused on the impurities blocking micro-irrigation systems and found that the larger the particle size of the impurities, the more likely it is that a blockage will occur. Therefore, comparing the sediment particle-size distributions of the three filter columns, the sediment particle size of the water filtered through the quartz sand and crushed glass filter columns is smaller, which offers a greater advantage during filtration.
For the same type of filter column, with the increase in filter particle sizes, the pore diameter of the corresponding filter layer increases, the existence of surface pores can be extended, and larger particles of sediment can pass through pores in the filter layer. Thus, the increase in filter particle size increases the filter-layer size, which is the predominant nature of the filter material of the porous medium [31,32]. Based on the ANOVA of three factors (species, particle size, and the depth of layers) for the trapped sediment clay (0~2 µm), silt (2~50 µm), fine sand (50~250 µm), medium sand (250~500 µm), and coarse sand (500~1000 µm), respectively, it can be seen that, the particle size of the filter material has a significant effect on the distribution of clay, powder, fine sand, and medium sand, the level of the filter material has a significant effect on the fine sand and medium sand, and the type of the filter material has a significant effect on the distribution of medium sand. In practical applications, the relationship between the filter particle size and filter-layer thickness should be comprehensively considered to ensure that the impurities are evenly distributed in the filter column, the mass fraction of sediment in the filtered water is low, and the particle size is small.
Based on the above analysis, although the sediment is most evenly distributed in the glass bead filter column, the particle-size distribution pattern of sediment in this medium is chaotic. Therefore, it cannot effectively intercept the large sediment particles; in addition, the presence of larger size sediment particles in the filtered water causes emitter clogging, thus making it unsuitable for use in areas where the sandy water source has large sediment particles. However, crushed glass relieves the phenomenon of surface filtration and effectively intercepts large sediment particles in the lower filter layer, which is the ideal filter medium for general field micro-irrigation systems.

3.5. Analysis of the Particle Size of Sediment Deposited in the Filter Layers

The masses of clay, powder, fine, medium, and coarse sands in the sediment retained by each filter column are shown in Figure 7, where the straight line of the original soil represents the masses of impurities artificially added to the filtration system before the start of the experiment. The clay particle diagram in Figure 7 shows that the mass of the retained clay particles in the BC1, BC2, GC1, and GC2 columns increased to different degrees compared to the original soil, among which GC1 increased the most by 15.43 g. As observed in Figure 7b, the mass of the retained powder particles in columns BC1, BC2, BC3, GC1, and GC2 increased to different degrees compared to the original soil, among which BC1 and GC1 increased by 114.82 and 118.84 g, respectively. As observed in Figure 7c, the content of fine sand retained in each column was lower than that of the original soil. As seen in Figure 7, the content of medium and coarse sand retained in the quartz sand column increased to different degrees compared with the original soil, and the mass of the coarse and medium sand retained in the crushed glass and glass bead columns was much lower than that in the original soil. According to the above analysis, the quartz sand filter layer promoted the polymerization of small sediment particles into large ones, so the measured large particle impurities are more than the initial addition. And the crushed glass and glass bead filter layers promoted the fragmentation of large sediment particles into smaller ones, so that more small particles are measured than were initially added.
Based on these results, it is presumed that during filtration, sediment is transported downward under the pressure of water flowing through the pores and curved channels of the porous medium; the sediment particles appear to aggregate and split under the action of various stresses. In the quartz sand filter column, there were more small sediment particles that aggregated into larger sediment particles, and in the modified glass and glass bead columns, there were more large sediment particles that split into smaller sediment particles. Accordingly, it is concluded that the larger the sediment particle size, the higher the risk of clogging. Crushed glass filter and glass bead filter media are more suitable for use as filters in micro-irrigation systems.

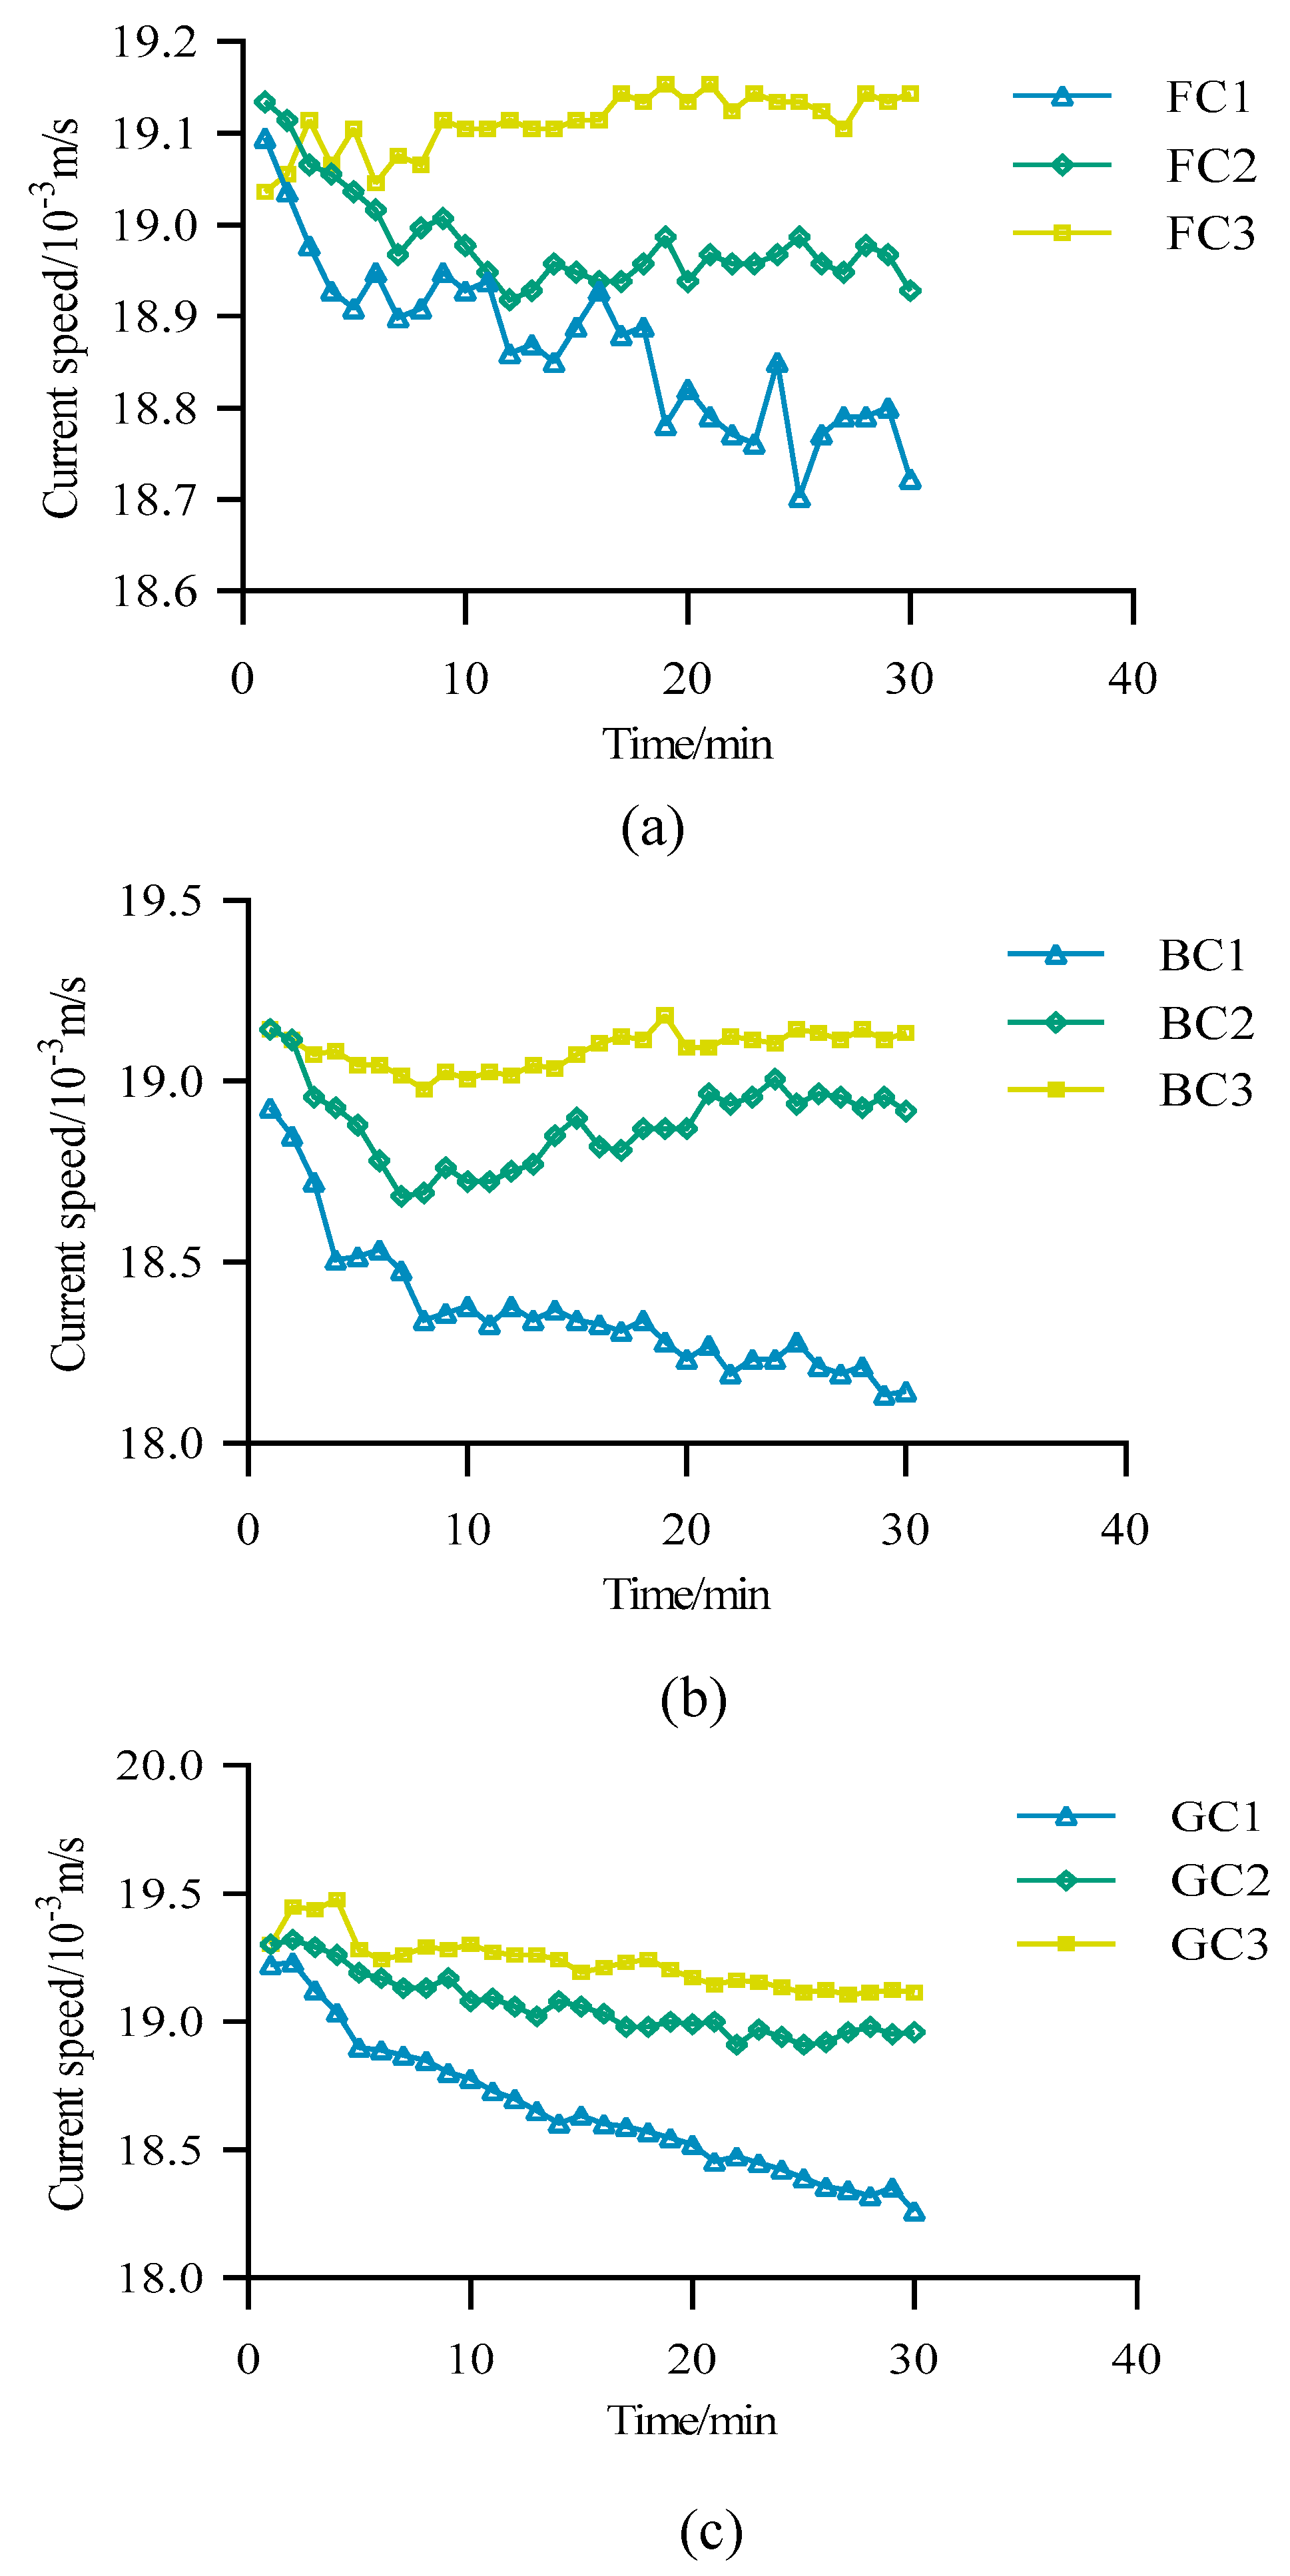
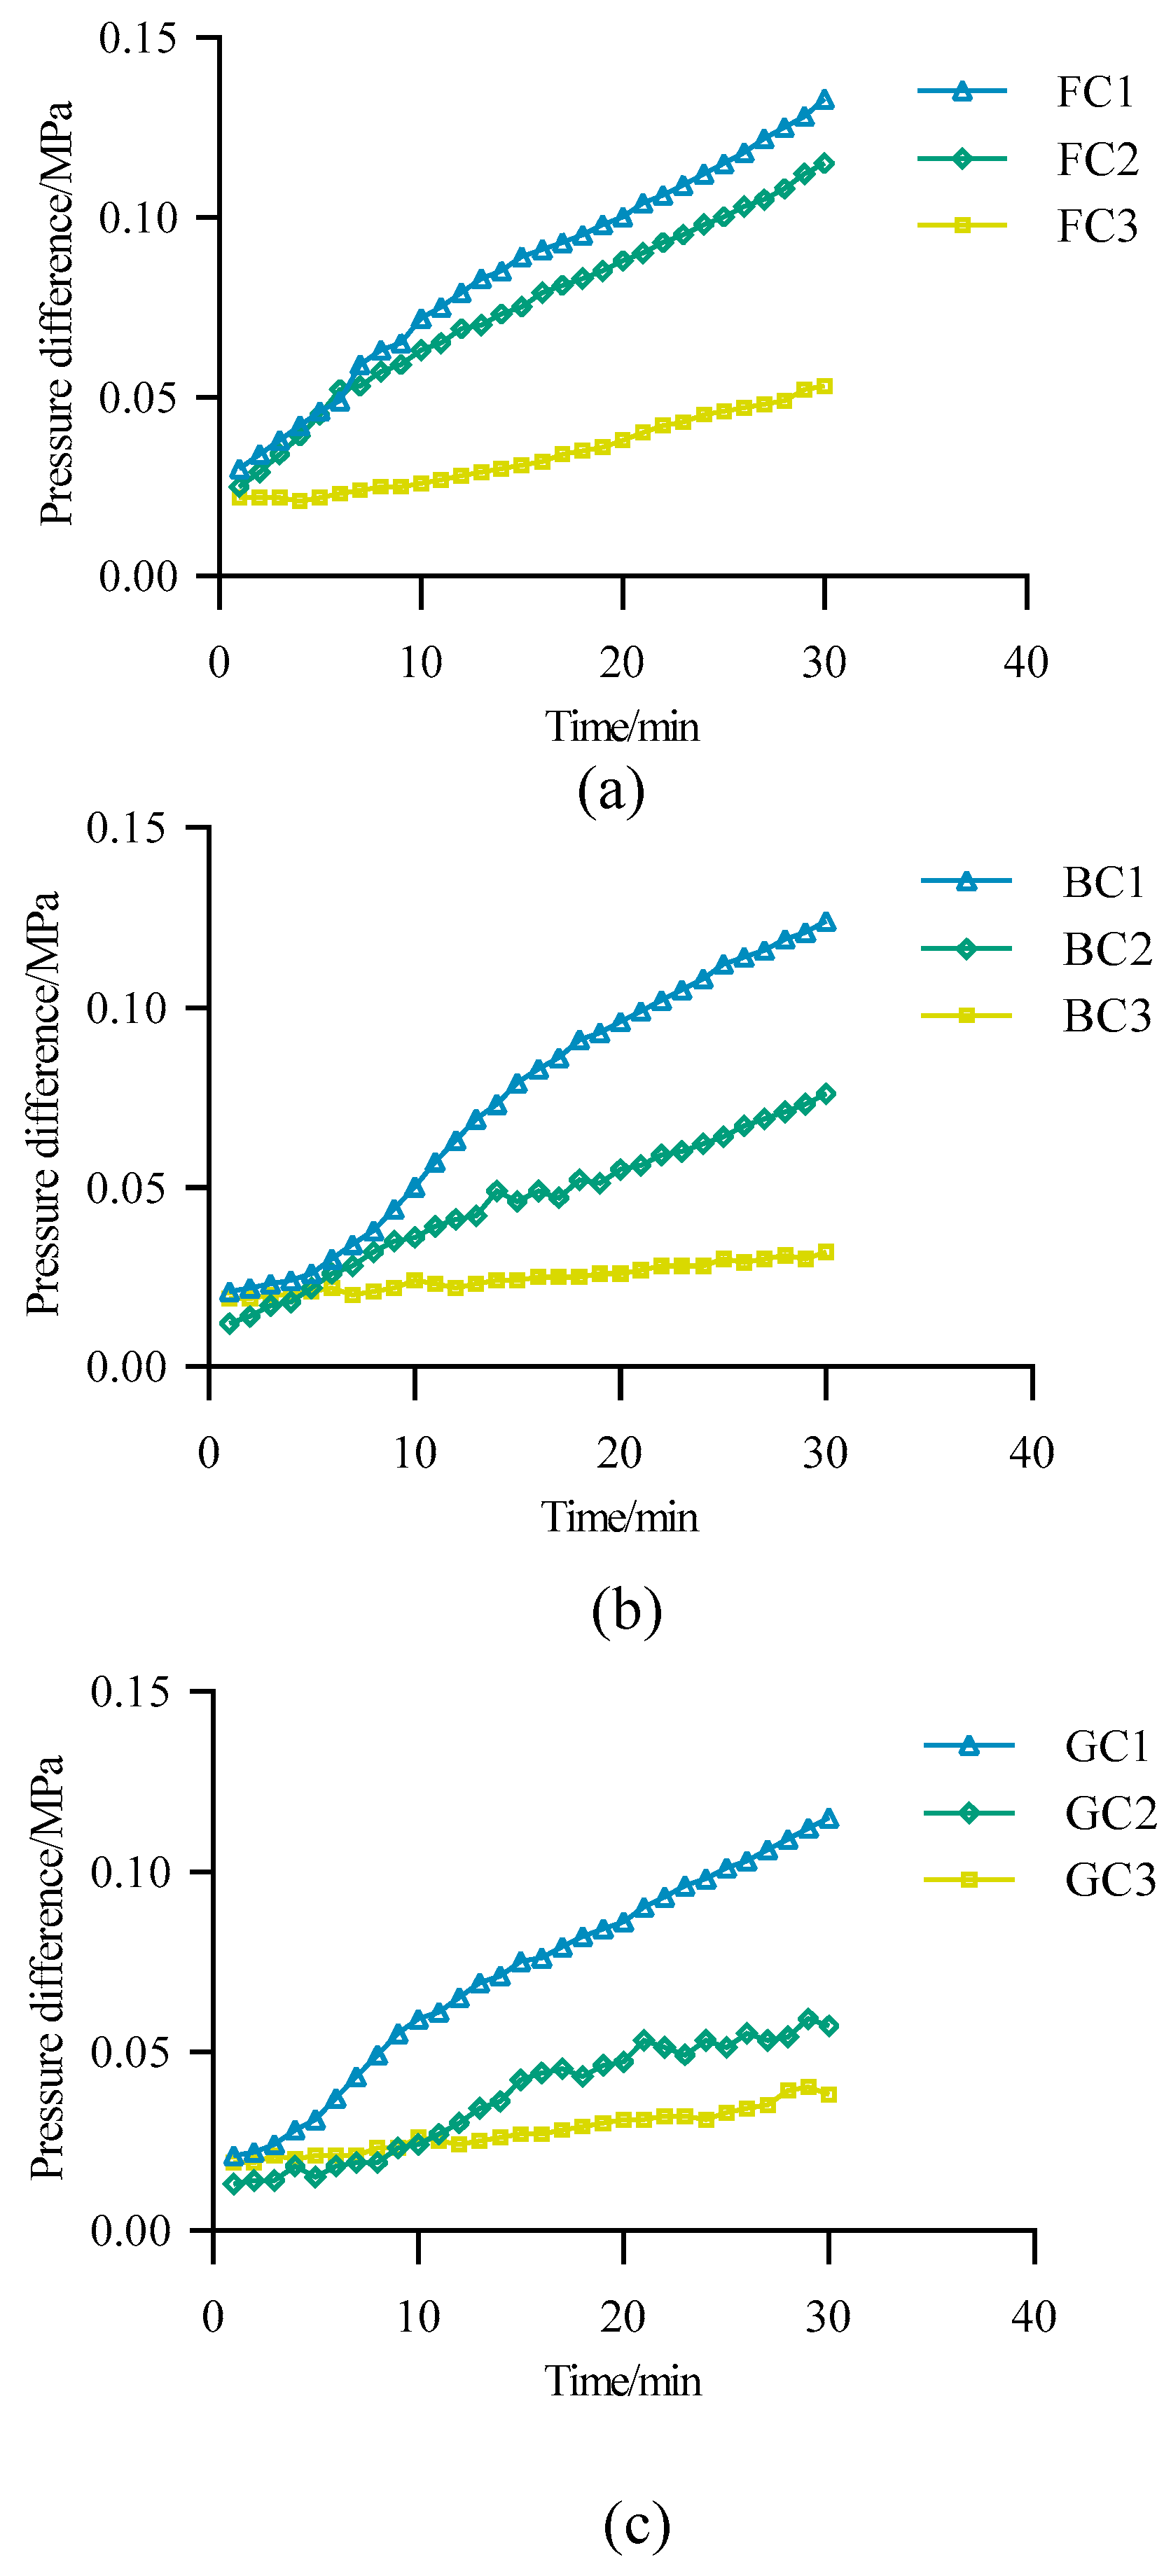
3.6. Analysis of Filtration Hydraulic Performance

The variation in the flow rate in the filter column affects the filtration efficiency, and the analysis of the variation in the filtration velocity is key to evaluating the hydraulic performance of the filter [33]. A two-factor (type and particle size) ANOVA was carried out on the filtration flow rate, and it was found that both type and particle size had significant effects on the flow rate. The standard deviations in the filtration speeds in the entire filtration cycles of FC1, FC2, FC3, BC1, BC2, BC3, GC1, GC2, and GC3 were 9.04 × 10⁻⁵, 5.29 × 10⁻⁵, 3.20 × 10⁻⁵, 19.09 × 10⁻⁵, 11.42 × 10⁻⁵, 5.07 × 10⁻⁵, 26.83 × 10⁻⁵, 12.09 × 10⁻⁵, and 9.94 × 10⁻⁵ m3/s, respectively. Figure 8 shows that the fluctuation in the filtration rate decreases with time; the smaller the filter particle size, the more drastic the fluctuation. The quartz sand filter column showed the best hydraulic performance and a more stable flow rate in the filtration cycle compared with the other two materials; the glass bead filter column showed the greatest fluctuation in flow rate, the greatest decrease in filtration rate, and the most unstable flow field.
The speed at which the pressure rises in the filter column directly affects the head loss during the filtration period [34], and the pressure variation is another key indicator for evaluating the hydraulic performance of filtration [35,36,37]. A two-factor (type and particle size) variance analysis were conducted for filtration pressure, and it was found that both type and particle size had significant influence on pressure variation. During the filtration process, the pressure difference changed at the inlet and outlet of each filter column, as shown in Figure 9. As shown in Figure 9, the larger the particle size for a given filter medium, the slower the pressure increase, and the stronger the clogging resistance of the filter layer. The coefficient of determination, R2, and the slope of the linear fit of the pressure change with time, K, for each filter column within a 95% confidence interval are listed in Table 2. As seen in Table 3, the pressure change of each column linearly increased during the filtration process; the modified glass pressure increased the fastest, and the glass bead pressure changed the least in the particle-size range of 0.90–1.25 mm; the quartz sand pressure increased the fastest, and the glass bead pressure changed the least in the particle-size range of 1.25–2.0 mm. Evidently, the more uniform the distribution of impurities in the filter column, the slower the increase in pressure. In other words, the smoother the surface of the filter material and the more regular the shape, the slower the increase in pressure.
The head loss of the filter usually accounts for more than 40% of the total head loss of the micro-irrigation system [38], and the energy consumption is high. Therefore, to meet the standard for filtered water quality, increasing the filter media particle size and replacing the traditional filter medium with a glass medium can extend the filtration cycle, reduce the filter backwashing frequency, and promote energy and water savings in micro-irrigation.

3.7. Evaluation of the Filtration Performance of Different Filter Media

The definition of the level of good filtering performance is fuzzy and is often not sufficiently accurate to evaluate the filtering performance using only a certain index. According to the results discussed in Section 3.1, Section 3.2, Section 3.3, Section 3.4, Section 3.5 and Section 3.6, filtration performance is related to the sediment retention rate of the filter column, the uniformity of the distribution of sediment in the filter column, the concentration of sediment in the water after filtration, the distribution and transformation of sediment particle size in the filter layer, and the change in filtration velocity and pressure. However, there are significant differences in the above indices for the different types of filter materials and different particle sizes. Therefore, the fuzzy comprehensive evaluation method (FCEM) was used to evaluate the filtration performance of the six filter materials of different sizes and types, except for glass beads. According to the factors influencing filtration performance, the evaluation indices were divided into five categories: uniformity of sediment distribution, particle-size transformation of the filter layer, hydraulic performance, sediment retention rate of the filter column, and environmental protection characteristics of the medium. In this study, the fuzzy approach in FCEM comprised the following steps:
Step 1: Construct object sets. X = {x1, x2, x3, x4, x5, x6} = {FC1, FC2, FC3, BC1, BC2, BC3}
Step 2: Provide factor sets. U = {U1, U2, U3, U4, U5} = {uniformity of sediment distribution, particle-size transformation of the filter layer, hydraulic performance, sediment retention rate of the filter column, environmental protection of the medium}.
Step 3: Create membership function.
(1) Uniformity of sediment distribution VU1
The maximum standard deviation of sediment mass distribution in the four filter layers in each filter column was 164.38, and the minimum was 54.83.
V U 1 = 1 ,     x < 54.83               164.38 x 109.55 ,     54.83 < x     164.38 0 ,     x 164.38
(2) Hydraulic performance VU3
The maximum pressure increase rate of the filter column was 3.97 × 10⁻³, and the minimum was 0.43 × 10⁻³.
V U 3 = 1 ,     x 1000   0.4 3.97 1000 x 3.54 ,     0.43 < x 1000   3.97 0 ,     x 1000 > 3.97
(3) Filter-column sediment retention rate VU4
The maximum sediment mass of the filter column was 388.31 g, and the minimum sediment mass was 276.3 g.
V U 4 = 1 ,     x 388.31             x 276.3 112.01 ,     276.3 < x   388.31 0 ,     x < 276.3
(4) As for the VU2 index of the particle-size transformation of the filter layer, the sediment in both the quartz sand and broken glass filter columns showed a trend of decreasing particle size with the deepening of the filter layer. According to the different materials and particle sizes, different membership degrees were assigned to the six filter materials according to the subjective weight method.
(5) Considering the environmental protection index VU5, because the glass material can be recycled indefinitely and quartz sand is a mineral resource, much pollution results; therefore, based on the subjective weight, the six types of filter media were assigned different environmental protection indices. The evaluation of each filter material factor is shown in Table 3.
The following evaluation matrix is determined based on the contents of Table 3:
R = 0 0.08 0.41 0.18 0.34 1 1 0.9 0.8 0.8 0.70 0.6 0.16 0.31 0.8 0 0.53 1 1 0.91 0.77 0.76 0.56 0 0 0.1 0.2 0.8 0.9 1
Step 4: Weight vector.
Based on several of the main filtration performance parameters tested in this study, the weight coefficients of the filtration performance indices were determined as follows:
A = (a1, a2, a3, a4, a5) = (0.1, 0.1, 0.2, 0.4, 0.2).
Step 5: Establish the object set.
The object set can be expressed by multiplying the index weight set by the factor evaluation matrix, as shown in Equation (4).
B = AR = (0.532, 0.523, 0.588, 0.601, 0.633, 0.560)
Evidently, BC2 has the best filtering performance, followed by BC1, BC3, FC3, and FC1, whereas FC2 has the worst performance. When considering the aforementioned five factors, the filter performance of broken glass filter material is better than that of quartz sand filter material.
Table 3. Membership degree of evaluation indices.
MembershipFC1FC2FC3BC1BC2BC3
VU10.000.080.410.180.341.00
VU21.000.900.800.800.700.60
VU30.160.310.800.000.531.00
VU41.000.910.770.760.560.00
VU50.000.100.20.800.901.00

4. Conclusions

The primary purpose of this study was to evaluate the filtration performance of different filtration media for micro-irrigation filters and explore their respective mechanisms. Filtration tests were performed on three types of filtration media—quartz sand, crushed glass, and glass beads—using an independent innovative test device. The following conclusions were drawn from the analysis of the physical parameters and experimental results of the porous media:
① The surface layer of the quartz sand filter column exhibited the most severe filtration phenomenon, and the distribution of sediment quality in each layer of the microbead glass filter column was the most uniform.
② The filter thicknesses of the BC2, BC3, GC1, GC2, and GC3 filter columns must be increased to ensure that the filtered water meets the requirements of micro-irrigation in terms of water quality.
③ In the quartz sand and crushed glass filter columns, the lower the filter layer, the finer the sediment particles trapped by the filter layer. The distribution of sediment particles in each filter layer of glass beads was not obvious; therefore, they were not suitable for use as a filter medium.
④ The quartz sand filter layer promoted the polymerization of small sediment particles into large ones, and the crushed glass and glass bead filter layers promoted the fragmentation of large sediment particles into smaller ones.
⑤ The fluctuation in the filtration velocity of the quartz sand filter column was the least, and the fluctuation of the filtration velocity of the microbead glass filter column was the greatest. The pressure changes in each filter column increased linearly, and the pressure changes in the column with glass beads were the lowest.
Compared with traditional quartz sand filter materials, glass can alleviate the surface filtration phenomenon, promote the uniform distribution of sediment in the filter column, trap large sediment particles, promote the separation of large sediment particles into smaller sediment particles, and reduce the risk of blockage in micro-irrigation systems. In addition, the pressure of the crushed glass filter column slowly increases. It has good hydraulic performance and is suitable for the filtration of agricultural micro-irrigation water in areas with sand-bearing water sources. The quartz sand filter material has a strong purification capacity and is suitable for meeting the fine water quality requirements of micro-irrigation systems. However, the glass bead filter medium is not suitable for micro-irrigation.
Finally, it is worth mentioning that this study mainly investigated the sediment filtration performance of the filter material. However, for ordinary micro-irrigation systems, the long-term application of filter media may cause different degrees of wear, resulting in changes in media porosity and other parameters, and can yield varied filtration performances. Therefore, it is necessary to further study the long-term filtration performance of filter media under different wear conditions.

Author Contributions

Conceptualization, J.C.; methodology, J.C.; validation, N.M.; formal analysis, P.H.; investigation, L.S.; resources, F.M.; data curation, G.Z.; writing—original draft preparation, L.S.; writing—review and editing, J.F.; visualization, G.Z. and J.H.; supervision, J.F.; project administration, Y.F. All authors have read and agreed to the published version of the manuscript.

Funding

Chinese Academy of Agricultural Sciences [grant number IFI2023-26]. The Agricultural Science and Technology Innovation Program (ASTIP). Team Innovation Project of Zibo Digital Agriculture and Rural Research Institute: Integration and application innovation of mountain orchard intelligent irrigation system. Major science and technology special project in Henan Province “wheat complete industry chain integration development of key technology research and development and application demonstration” (project number: 221100110700).

Institutional Review Board Statement

Not applicable.

Informed Consent Statement

Not applicable.

Data Availability Statement

Data are contained within the article.

Conflicts of Interest

The authors declare that they have no known competing financial interests or personal relationships that could have appeared to influence the work reported in this paper.

References

  1. Good, P.; Booth, B.B.B.; Chadwick, R.; Hawkins, E.; Jonko, A.; Lowe, J.A. Large differences in regional precipitation change between a first and second 2 K of global warming. Nat. Commun. 2016, 7, 13667. [Google Scholar] [CrossRef] [PubMed]
  2. Salehi, M. Global water shortage and potable water safety; Today’s concern and tomorrow’s crisis. Environ. Int. 2022, 158, 106936. [Google Scholar] [CrossRef] [PubMed]
  3. Cui, Y.; Zhou, Y.; Jin, J.; Wu, C.; Zhang, L.; Ning, S. Quantitative evaluation and diagnosis of water resources carrying capacity (WRCC) based on dynamic difference degree coefficient in the Yellow River irrigation district. Front. Earth Sci. 2022, 10, 816055. [Google Scholar] [CrossRef]
  4. Zhang, W.; Lv, C.; Zhao, X.; Dong, A.; Niu, W. The influence mechanism of the main suspended particles of Yellow River sand on the emitter clogging—An attempt to improve the irrigation water utilization efficiency in Yellow River basin. Agric. Water Manag. 2021, 258, 107202. [Google Scholar] [CrossRef]
  5. Liu, L.; Hou, P.; Liu, Z.; Wu, N.; Li, W.; Wu, R.; Wang, H.; Ma, Y.; Li, Y. Selection of suitable drip-emitters for Yellow River water drip irrigation. Trans. Chin. Soc. Agric. Eng. 2021, 37, 99–107. [Google Scholar] [CrossRef]
  6. Tao, H.; Shen, P.; Li, Q.; Jiang, Y.; Yang, W.; Wei, J. Research on head loss of pre-pump micro-pressure filter under clean water conditions. Water Supply 2022, 22, 3271–3282. [Google Scholar] [CrossRef]
  7. de Deus, F.P.; Mesquita, M.; Testezlaf, R.; de Almeida, R.C.; de Oliveira, H.F.E. Methodology for hydraulic characterisation of the sand filter backwashing processes used in micro irrigation. MethodsX 2020, 7, 100962. [Google Scholar] [CrossRef]
  8. Dold, B. Sourcing of critical elements and industrial minerals from mine waste—The final evolutionary step back to sustainability of humankind? J. Geochem. Explor. 2020, 219, 106638. [Google Scholar] [CrossRef]
  9. Napotnik, J.A.; Baker, D.; Jellison, K.L. Effect of sand bed depth and medium age on Escherichia coli and turbidity removal in biosand filters. Environ. Sci. Technol. 2017, 51, 3402–3409. [Google Scholar] [CrossRef]
  10. Young-Rojanschi, C.; Madramootoo, C. Intermittent versus continuous operation of biosand filters. Water Res. 2014, 49, 1–10. [Google Scholar] [CrossRef]
  11. Hu, Y.; Wu, W.; Liu, H.; Huang, Y.; Bi, X.; Liao, R.; Yin, S. Dimensional Analysis Model of Head Loss for Sand Media Filters in a Drip Irrigation System Using Reclaimed Water. Water 2022, 14, 961. [Google Scholar] [CrossRef]
  12. Mesquita, M.; Testezlaf, R.; Ramirez, J. The effect of media bed characteristics and internal auxiliary elements on sand filter head loss. Agric. Water Manag. 2012, 115, 178–185. [Google Scholar] [CrossRef]
  13. Cai, J.M. Study on Flow Resistance Distribution of Sand Filter and Filtration Characteristics of Different Granular Filter Media; Chinese Academy of Agricultural Sciences: Beijing, China, 2021. [Google Scholar] [CrossRef]
  14. Silva, R.V.; De Brito, J.; Lye, C.Q.; Dhir, R.K. The role of glass waste in the production of ceramic-based products and other applications: A review. J. Clean. Prod. 2017, 167, 346–364. [Google Scholar] [CrossRef]
  15. Salzmann, R.D.; Ackerman, J.N.; Cicek, N. Pilot-scale, on-site investigation of crushed recycled glass as tertiary filter media for municipal lagoon wastewater treatment. Environ. Technol. 2022, 43, 51–59. [Google Scholar] [CrossRef] [PubMed]
  16. Soyer, E.; Akgiray, Ö.; Eldem, N.Ö.; Saatçı, A.M. Crushed recycled glass as a filter medium and comparison with silica sand. Clean—Soil, Air, Water 2010, 38, 927–935. [Google Scholar] [CrossRef]
  17. Hunce, S.Y.; Soyer, E.; Akgiray, Ö. Use of filterability index in granular filtration: Effect of filter medium type, size and shape. Water Supply 2018, 19, 382–391. [Google Scholar] [CrossRef]
  18. Zhao, P.; Zhai, G.; Deng, Z.; Cai, J.; Zhang, W. Experimental study on the feasibility of using glass beads as micro-irrigation filter. J. Irrig. Drain. 2018, 37, 65–70. [Google Scholar] [CrossRef]
  19. Bové, J.; Arbat, G.; Duran-Ros, M.; Pujol, T.; Velayos, J.; de Cartagena, F.R.; Puig-Bargués, J. Pressure drop across sand and recycled glass media used in micro irrigation filters. Biosyst. Eng. 2015, 137, 55–63. [Google Scholar] [CrossRef]
  20. Ramezanianpour, M.; Truong, Q.; Jensen, M.; Yuki, I. Treatment of septic tank discharge using crushed glass filter media. J. Environ. Eng. 2023, 149, 04023017. [Google Scholar] [CrossRef]
  21. Li, Q.; Wu, Z.; Tao, H.; Aihemaiti, M.; Jiang, Y.; Yang, W. Establishment of prediction models of trapped sediment mass and total filtration efficiency of pre-pump micro-pressure filter. Irrig. Sci. 2022, 40, 203–216. [Google Scholar] [CrossRef]
  22. Nieto, P.G.; García-Gonzalo, E.; Puig-Bargués, J.; Solé-Torres, C.; Duran-Ros, M.; Arbat, G. A new predictive model for the outlet turbidity in micro-irrigation sand filters fed with effluents using Gaussian process regression. Comput. Electron. Agric. 2020, 170, 105292. [Google Scholar] [CrossRef]
  23. Liang, H. Detection summarization on particulate matter in water. Guangdong Chem. Ind. 2010, 37, 296–298. [Google Scholar] [CrossRef]
  24. GB/T 50485–2020; Technical Standard for Micro-Irrigation Engineering. Ministry of Housing and Urban-Rural Development: Beijing, China, 2020.
  25. Yu, Y.; Xu, W.; Song, S.; Yang, H.; Zhang, Y. Influence of red loam particles, fertilizer concentration and irrigation method on clogging of different irrigation emitters. Trans. Chin. Soc. Agric. Eng. 2018, 34, 92–99. [Google Scholar] [CrossRef]
  26. Wu, Z.; Zhang, Z.; Zhang, K.; Luo, C.; Niu, W.; Yu, L. Influence of particle size and concentration of sediment on clogging of labyrinth channels emitters. Trans. Chin. Soc. Agric. Eng. 2014, 30, 99–108. [Google Scholar] [CrossRef]
  27. Yul, F.A.; Denur, D. Rancang bangun alat penjernih air berbasis backwash menggunakan metode quality function deployment (QFD). J. Tek. Ind. Terintegrasi 2021, 4, 15–20. [Google Scholar] [CrossRef]
  28. Graciano-Uribe, J.; Pujol, T.; Hincapie-Zuluaga, D.; Puig-Bargués, J.; Duran-Ros, M.; Arbat, G.; de Cartagena, F.R. Bed expansion at backwashing in pressurised porous media filters for drip irrigation: Numerical simulations and analytical equations. Biosyst. Eng. 2022, 223, 277–294. [Google Scholar] [CrossRef]
  29. Hou, P.; Xiao, Y.; Wu, N. Cascade relationship between the emitter structure-sedimentationclogging behavior in drip irrigation systems with Yellow River water. J. Hydraul. Eng. 2020, 51, 1372–1382. [Google Scholar] [CrossRef]
  30. Wang, X.; Jin, B.; Fan, E.; Zhang, J.; Wang, Q.; Ding, S. Numerical simulation of water-sediment two-phase flow in emitter under high frequency pulse. Trans. Chin. Soc. Agric. Mach. 2020, 51, 277–283. [Google Scholar] [CrossRef]
  31. Song, L.; Cai, J.; Zhai, G.; Feng, J.; Zhang, W. Sediment deposition and migration feature in the filter layer of micro-irrigation sand filter. Trans. Chin. Soc. Agric. Eng. 2023, 39, 76–83. [Google Scholar] [CrossRef]
  32. Li, J.H.; Zhai, G.L.; Liu, Q.X.; Li, G.Q. Study on the method of determination of the shape coefficient of sand particle in micro-irrigation based on Ergun equation. Water Sav. Irrig. 2020, 12, 1–5. [Google Scholar] [CrossRef]
  33. Lemons, A.; Branz, A.; Kimirei, M.; Hawkins, T.; Lantagne, D. Assessment of the quality, effectiveness, and acceptability of ceramic water filters in Tanzania. J. Water Sanit. Hyg. Dev. 2016, 6, 195–204. [Google Scholar] [CrossRef]
  34. Lee, S.-I.; Choi, J.-Y.; Choi, W. Effect of Groove Shape on Head Loss and Filtration Performance of Disc Filters. Water 2021, 13, 1683. [Google Scholar] [CrossRef]
  35. del Pozo, D.F.; Ahmad, A.; Rehman, U.; Verliefde, A.; Nopens, I. A novel CFD model to predict effluent solids concentration and pressure drop in deep bed granular filters for water treatment. Sep. Purif. Technol. 2022, 295, 121232. [Google Scholar] [CrossRef]
  36. Nieto, P.J.G.; García–Gonzalo, E.; Arbat, G.; Duran–Ros, M.; de Cartagena, F.R.; Puig-Bargués, J. Pressure drop modelling in sand filters in micro-irrigation using gradient boosted regression trees. Biosyst. Eng. 2018, 171, 41–51. [Google Scholar] [CrossRef]
  37. Qin, Z.; Pletcher, R.H. A statistical model of pressure drop increase with deposition in granular filters. Adv. Powder Technol. 2015, 26, 49–55. [Google Scholar] [CrossRef]
  38. Wu, W.; Chen, W.; Liu, H.; Yin, S.; Niu, Y. A new model for head loss assessment of screen filters developed with dimensional analysis in drip irrigation systems. Irrig. Drain. 2014, 63, 523–531. [Google Scholar] [CrossRef]
Figure 1. (a) Quartz sand. (b) Crushed glass. (c) Glass beads.
Sustainability 16 03256 g001
Figure 2. (a) Layout of the equipment. (b) Picture of the equipment.
Sustainability 16 03256 g002
Figure 3. Distribution of sediment quality retained by the different filter columns (the error lines are SE).
Sustainability 16 03256 g003
Figure 4. Sediment retention quality of each filter layer in the different filter columns (the error lines are SE).
Sustainability 16 03256 g004
Figure 5. Variation in concentration of filtered water and sediment with the depth of filter layer (the error lines are SE). (a) Changes in water quality after filtration with quartz sand filter layer. (b) Changes in water quality after filtration with crushed glass filter layer. (c) Changes in water quality after filtration with glass bead filter layer.
Sustainability 16 03256 g005
Figure 6. Grain-size distribution of trapped sediment in filter layers with different grain-size ranges (the error lines are SE). (a) Sediment particle-size distribution in each filter layer of a filter column for the particle-size range of 0.90–1.25 mm. (b) Sediment particle-size distribution in each filter layer of a filter column for the particle-size range of 1.25–1.60 mm. (c) Sediment particle-size distribution in each filter layer of a filter column for the particle-size range of 1.60–2.00 mm.
Sustainability 16 03256 g006
Figure 7. Quality of sediment retained by filter columns with different particle sizes; the error lines are SE. (a) Quality of clay particles trapped by different filter columns. (b) Quality of intercepted powder in different filter columns. (c) Quality of fine sand retained by different filter columns. (d) Quality of medium sand retained in different filter columns. (e) Quality of coarse sand retained by different filter columns.
Sustainability 16 03256 g007
Figure 8. (a) Changes in filtration rate of quartz sand filter column. (b) Changes in filtration rate of crushed glass filter column. (c) Changes in filtration rate of glass microbead filter column.
Sustainability 16 03256 g008
Figure 9. (a) Pressure variation of quartz sand filter column. (b) Pressure variation of crushed glass filter column. (c) Pressure variation of glass microbead filter column.
Sustainability 16 03256 g009
Table 2. Linear fitting parameters for each filter column pressure variation with time.
Filter-Column TypeFC1BC1GC1FC2BC2GC2FC3BC3GC3
R20.98440.98160.98260.9840.98550.95390.96650.96530.9596
K (×10−3)3.393.973.282.862.11.741.150.430.67
Disclaimer/Publisher’s Note: The statements, opinions and data contained in all publications are solely those of the individual author(s) and contributor(s) and not of MDPI and/or the editor(s). MDPI and/or the editor(s) disclaim responsibility for any injury to people or property resulting from any ideas, methods, instructions or products referred to in the content.

