1. Introduction
In the context of a global economic downturn, escalating trade frictions, and the rising tide of trade protectionism, China’s sustained high-quality economic development increasingly relies on the scale economic effects of a unified domestic market. The regional integration strategy, with urban agglomeration as its carrier, serves as a crucial measure used to accelerate the formation of this unified market, harness scale economic effects, and thereby drive high-quality economic development in China. However, the long-standing development approach characterized by “beggar-thy-neighbor” policies has led to market segmentation, industrial overlap, and resource misallocation [
1], hindering regions from leveraging their comparative advantages and resulting in a substantial wastage of regional resources. Furthermore, the inefficient allocation of factors has delayed the transformation and upgrading of industrial structures, imposing significant cost and ecological environmental tolls on many cities. Accelerating the regional integration development strategy and promoting urban green economic development are imperative tasks in the context of “three new and one high” to address these critical challenges. “Three new and one high” specifically refers to the new development stage, new development concept, new development pattern, and high-quality development.
The issue of urban green economic development has become a focal point in academic discussions in recent years, with a primary focus on the pathways leading to achieving green economic growth and the impacts of policy interventions. In terms of pathways, Ma and Zhu [
2] explored the mediating role of industrial structure adjustment and green innovation technologies in enhancing urban green economic development through digital economy, elucidating the underlying mechanisms. Liu and Dong [
3] examined the relationship and transmission mechanisms between technological innovation and urban green economic efficiency from the perspectives of natural resources and urbanization, noting the presence of urban development heterogeneity in these effects. Yu et al. [
4] found that leveraging the spillover effects of foreign direct investment in urban agglomerations can enhance the green total factor productivity of surrounding cities. Tian et al. [
5] investigated the imbalances in urban agglomerations’ green development from the novel perspectives of traditional financial agglomeration and green financial clustering. From a policy impact perspective, scholars have quantitatively assessed the effects and mechanisms of various eco-friendly policies on urban green economic development. These policies include China’s Sustainable Development Planning for Resource-based Cities (SDP) [
6], the 12th Five-Year Plan for Air Pollution Prevention and Control in Key Regions of China (CEP) [
7], and the National Eco-Industrial Park Policy (EIP) [
8].
From the perspective of the relationship between regional integration and urban economic development, scholars have conducted studies through both qualitative discussions and quantitative assessments, focusing on high-quality development. In terms of qualitative research, Chen et al. [
9] examined the strategic significance of integrated development in the Yangtze River Delta, systematically elucidating the scientific connotations and interrelations of regional integration and high-quality development. They argued that higher-quality integrated development should be differentiated, efficient, sustainable, and inclusive, adhering to spatial optimization principles of economic concentration, ecological safety, and social equity. Regarding quantitative assessments, researchers have empirically discovered that regional integration positively influences economic growth [
10] and high-quality economic development [
11]. Furthermore, Huang and Zhang [
12] found that the impact of regional integration on the high-quality economic development of cities exhibits a non-linear inverted U-shaped characteristic, varying with the degree of agglomeration in the regional productive service sector. Additional studies have empirically explored the effects and driving factors of regional integration on high-quality urban economic development from unique perspectives such as expansion [
13] and openness [
14].
In summary, although there is a substantial body of research on the relationship between regional integration and urban economic development, studies from the perspective of policy evaluation revealing the impact mechanism of regional integration strategies on urban green economic development are still insufficient. Consequently, this study took the implementation of regional integration strategies, as a quasi-natural experiment, as an entry point. It aimed to establish a systematic theoretical framework for analyzing the impact of regional integration strategies on urban green economic development. Utilizing unbalanced panel data from China’s ten major urban agglomerations and non-urban agglomeration cities from 2003 to 2022, this study employed a multi-period difference-in-difference approach to empirically assess the effects of policy implementation. It also examined the heterogeneous characteristics of the data and finally used a moderating effect model to indirectly verify the mechanism of policy implementation.
2. Theoretical Mechanisms
The regional integration strategy has disrupted the insular approach of local governments, fostering a consensus on coordination and cooperation based on shared strategic objectives. The intensification of economic ties further facilitates the rational positioning of regional functions and the geographical division of industries. Moreover, these economic interconnections can alleviate bottlenecks in the flow of regional elements, while the adjustment and optimization of industrial structures can guide the direction of this flow. The efficient movement and integration of elements can significantly enhance the efficiency of regional economic growth. From the analysis above, it is evident that the strengthening of economic linkages, the transformation and upgrading of industrial structures, and the rational allocation of resources are crucial pathways through which the regional integration strategy manifests its effects. Additionally, the existing literature corroborates that these three elements are vital in driving the development of urban green economies. Therefore, this study posits that the impact of regional integration strategies on the development of urban green economies can be elucidated through three dimensions: economic linkages, industrial structure transformation and upgrading, and the rational allocation of resources.
2.1. Economic Linkage Effects
An economic linkage effect refers to the enhancement of economic connections between cities within a city cluster facilitated by regional integration strategies, thereby promoting the development of the green economy in these cities. First of all, the effect of economic connection can promote the development of green economy in various cities through factor connectivity [
15]. The endowment of natural resources can inhibit the enhancement of regional green growth efficiency. However, regional integration strategies can overcome administrative divisions, mitigate trade protectionism and border effects, and, through the integration of infrastructure networks across different regions, reduce the transaction costs of inter-regional flows. This enables the free cross-border flow of labor, capital, technology, information, and goods, ultimately weakening the constraints of regional endowments and elevating the potential for urban green economic development. In addition, the effect of economic connection can promote the development of green economy in various cities through coordinated planning [
16]. Regional integration strategies facilitate the establishment of cross-regional strategic alliances from governmental to market entities, promoting coordinated policy and economic activities across regions. This fosters the mutual complementarity of regional comparative advantages, achieving Pareto improvements in the economic system, and thus enhancing the efficiency of green economic development across regions.
Based on this, this study proposed the following hypotheses:
H1: Regional integration strategies have a promotional effect on the development of the urban green economy.
H2: Regional integration strategies can leverage economic linkage effects to foster the development of the urban green economy.
2.2. Effects of Industrial Structure Transformation and Upgrading
The effects of industrial structure transformation and upgrading refers to how regional integration strategies can coordinate the transformation and upgrading of industrial structures as well as the rational division of labor among cities within a city cluster, thereby fostering the green economic development of each city. This effect is specifically manifested in the sophistication and rationalization of the industrial structure. This means that the effect of industrial structure transformation and upgrading can promote the development of urban green economy through industrial structure sophistication [
17,
18]. Industrial structure sophistication denotes the process of establishing and realizing an efficient industrial structure, reflecting a dynamic progression where the industrial structure evolves from a lower to a higher level in accordance with the historical and logical sequence of economic development. This sophistication facilitates the replacement of leading and pillar industries, breaking the low-level equilibrium of the existing industrial structure, optimizing internal structure, and thereby inducing higher value addition, technology integration, intensification, and processing depth in industries. Such advancements propel the progress of related industries and, consequently, the overall green economic development of cities. In addition, the effect of industrial structure transformation and upgrading can promote the development of urban green economy through industrial structure rationalization [
19]. Industrial structure rationalization is a dynamic process where the coordination capability and interrelation level among industries continuously strengthen, reflecting the degree of industry coordination. Competitive relationships and self-interest considerations among local governments may lead to the neglect of economic principles and the blind development of local industries, causing the redundant construction of inefficient industries and burdening local finances or even sustainable economic development. Regional integration strategies are beneficial in breaking down local protectionism, transforming competitive relationships into mutually beneficial ones, based on the coordinated industrial planning at the city cluster level. This not only achieves a rational positioning and specialized division of labor among cities of different levels, but also fosters the targeted and scientific development of local characteristic industries, thereby significantly promoting the green economic development of cities.
Based on this analysis, this study proposed the following hypothesis:
H3: Regional integration strategies can leverage the effects of industrial structure transformation and upgrading to promote the development of the urban green economy.
2.3. Effective Allocation of Resources
An effective allocation of resources refers to the optimal utilization and distribution of resource elements in time and space by market entities, under a regional integration strategy that orchestrates regional development directions and ensures the balance of an ecological–economic system. This is achieved by strategically organizing productivity and guiding market entities, aiming for sustained economic growth and the perpetual use of resources. Consequently, this leads to optimal economic, ecological, and social benefits, facilitating the development of urban green economies. The effect of the rational allocation of resources can promote the development of urban green economy through resource integration [
20]. This process involves determining the optimal combination of resource elements based on their connectivity and spatial distribution characteristics to achieve efficient utilization. Resource integration optimizes the ratio and distribution of elements across spaces or different industrial sectors, enhancing the efficiency of resource utilization and, subsequently, promoting green economic growth. In addition, the effect of the rational allocation of resources can promote the development of urban green economy through unleashing innovation potential [
21,
22]. Innovation is a crucial element for the development of urban green economies. However, the distortion in factor markets and the resulting rent-seeking opportunities can significantly inhibit R&D investment and industrial innovation efficiency. This is a significant barrier to enhancing the efficiency of China’s innovation activities. The effective allocation of resources mitigates market distortions, thereby unlocking suppressed innovation capabilities at various levels and propelling the city toward green economic development.
Based on this discussion, the following hypothesis was proposed:
H4: The strategy of regional integration can promote urban green economic development through the effective allocation of resources.
3. Model Construction and Variable Description
3.1. Benchmark Regression Model
Given the phased rollout and promotion of the regional integration strategy, it is treated as a quasi-natural experiment. Referring to Wang et al. [
23], we employed a multi-period DID approach to empirically assess its impact on the green economic development of Chinese cities. The model is specified as follows (Equation (1)):
According to the basic principles of DID model establishment [
24], two dummy variables were established: (1) group dummy variable treat aims to describe the difference between the treatment group and the control group and (2) time dummy variable time is used to distinguish the differences before and after the implementation of policies. The interaction term treat×time of the two dummy variables is represented by DID, which is the core explanatory variable concerned in this paper. The three variables are more specifically described in the variable description section.
In the equation, represents the level of green economic development in city during period ; denotes the dummy variable for the implementation of the regional integration strategy; represents control variables; is the constant term; and are the coefficients of the variables; and , , and respectively represent city fixed effects, year fixed effects, and the random error term. According to the fundamental principles of the DID model, reflects the net policy effect of the regional integration strategy’s implementation on the green economic development of Chinese cities.
3.2. Variable Description and Data Sources
- (1)
Urban Green Economic Development (). This study employed the Green Malmquist–Luenberger (GML) index, based on the non-desirable output super-efficiency SBM model, to measure the level of green economic development in cities. The index calculation involves input variables, desirable output variables, and non-desirable output variables. Input variables include capital, labor, energy, and total water resources. Specifically, the capital stock is calculated based on the perpetual inventory method with 2003 as the base year. Labor input is measured using the number of employees in urban units at the end of the period. Energy input is determined using the total annual electricity consumption in the city, and water resource input is based on the total water supply. The desirable output is represented by the city’s GDP, adjusted for inflation using the GDP index of various years, with 2003 as the base year. Non-desirable outputs include emissions of SO2, particulate matter, and wastewater. Due to limitations in the availability of fixed asset price index data, the green economic development levels of cities can be measured for the years 2004–2022.
- (2)
Implementation of the Regional Integration Strategy (
). The implementation is represented by a binary variable, calculated by multiplying the policy grouping variable and the time grouping variable. For cities within the top ten urban clusters, the variable is assigned
; otherwise,
. The selection of these ten urban clusters and their defining planning documents is primarily based on the research findings of Chen Minghua et al. [
25]. To minimize research interference, cities from the other nine urban clusters identified during the “13th Five-Year Plan” period were excluded from the sample. The year is categorized as
if it falls after the implementation of the regional integration strategy; otherwise, it is categorized as
. For determining the specific year of implementation, this study adopted the approach proposed by Cao Qingfeng [
26], considering urban clusters approved in the first half of a year to be established in the previous year, and those approved in the second half to be established in the same year. This method accounts for the negotiation process between lower and higher levels of government during the approval of urban cluster planning documents, implying that lower-level governments may have advanced knowledge of the establishment timeline and start related construction activities accordingly.
- (3)
Control Variables. To mitigate the endogeneity issues arising from omitted variables, this study controlled a series of factors that may influence the development of the urban green economy, building upon existing research. The variables are defined as follows: Industrial Structure (struc): measured using the ratio of the tertiary industry’s added value to the secondary industry’s added value in a city; Degree of Openness (open): quantified using the proportion of a city’s total import and export trade value to its GDP; Fiscal Intervention (gov): assessed using the ratio of the sum of government revenue and expenditure to the city’s GDP; Level of Technological Development (tech): represented by the proportion of scientific and technological expenditures to total fiscal expenditures; Population Size (peop): denoted by the total population of the city, with logarithmic transformation applied to address heteroscedasticity; Infrastructure Level (infra): evaluated using the ratio of road mileage to the land area of the administrative region; and Educational Support (educ): measured using the proportion of educational expenditures to total fiscal expenditures in the city.
The data for these variables were sourced from the corresponding year’s China City Statistical Yearbook, local statistical yearbooks, and regional yearbooks. Missing data were imputed using the linear interpolation method. Descriptive statistics for each variable are presented in
Table 1.
4. Results and Analysis
4.1. Analysis of Baseline Regression Results
Table 2 presents the baseline regression results concerning the impact of regional integration strategy implementation on the development of the green economy in Chinese cities. Notably, the estimated coefficients for the core explanatory variable
are significantly positive at the 1% level across models that progressively included city fixed effects and year fixed effects. This significant positive relationship underscores the effectiveness of regional integration strategies in fostering the green economic development of Chinese cities, thereby confirming Hypothesis 1 (H1).
4.2. Robustness Tests
4.2.1. Testing for Policy Exogeneity
A fundamental prerequisite for the applicability of the DID methodology is the assurance that the policy implementation represents an exogenous shock. Therefore, it is imperative to conduct an exogeneity test of the policy implementation to validate the reliability of the DID approach. This study specifically examined whether the implementation of regional integration strategies is influenced by the green economic development of the cities. The model is specified as follows (Equation (2)):
In the model,
represents whether it is a city within the top ten city clusters;
denotes the constant term;
and
are the coefficients of the variables; and
corresponds to the control variables identical to those in Equation (1). Given that the dependent variable
does not vary over time, Equation (2) is structured as a cross-sectional data model. Furthermore, considering the gradual implementation of regional integration strategies, this study selected samples from the years before the widespread adoption of the policy in 2004, 2006, 2008, 2010, 2012, and 2013 to conduct tests for policy exogeneity. Additionally, since the dependent variable is a binary (0–1) variable, a Probit model was utilized for verification.
Table 3 reports the results of the policy exogeneity tests. It is observed that the regression coefficients of
are not significant across the years. This indicates that the implementation of regional integration strategies is not influenced by the development of the urban green economy, thereby passing the test for policy exogeneity.
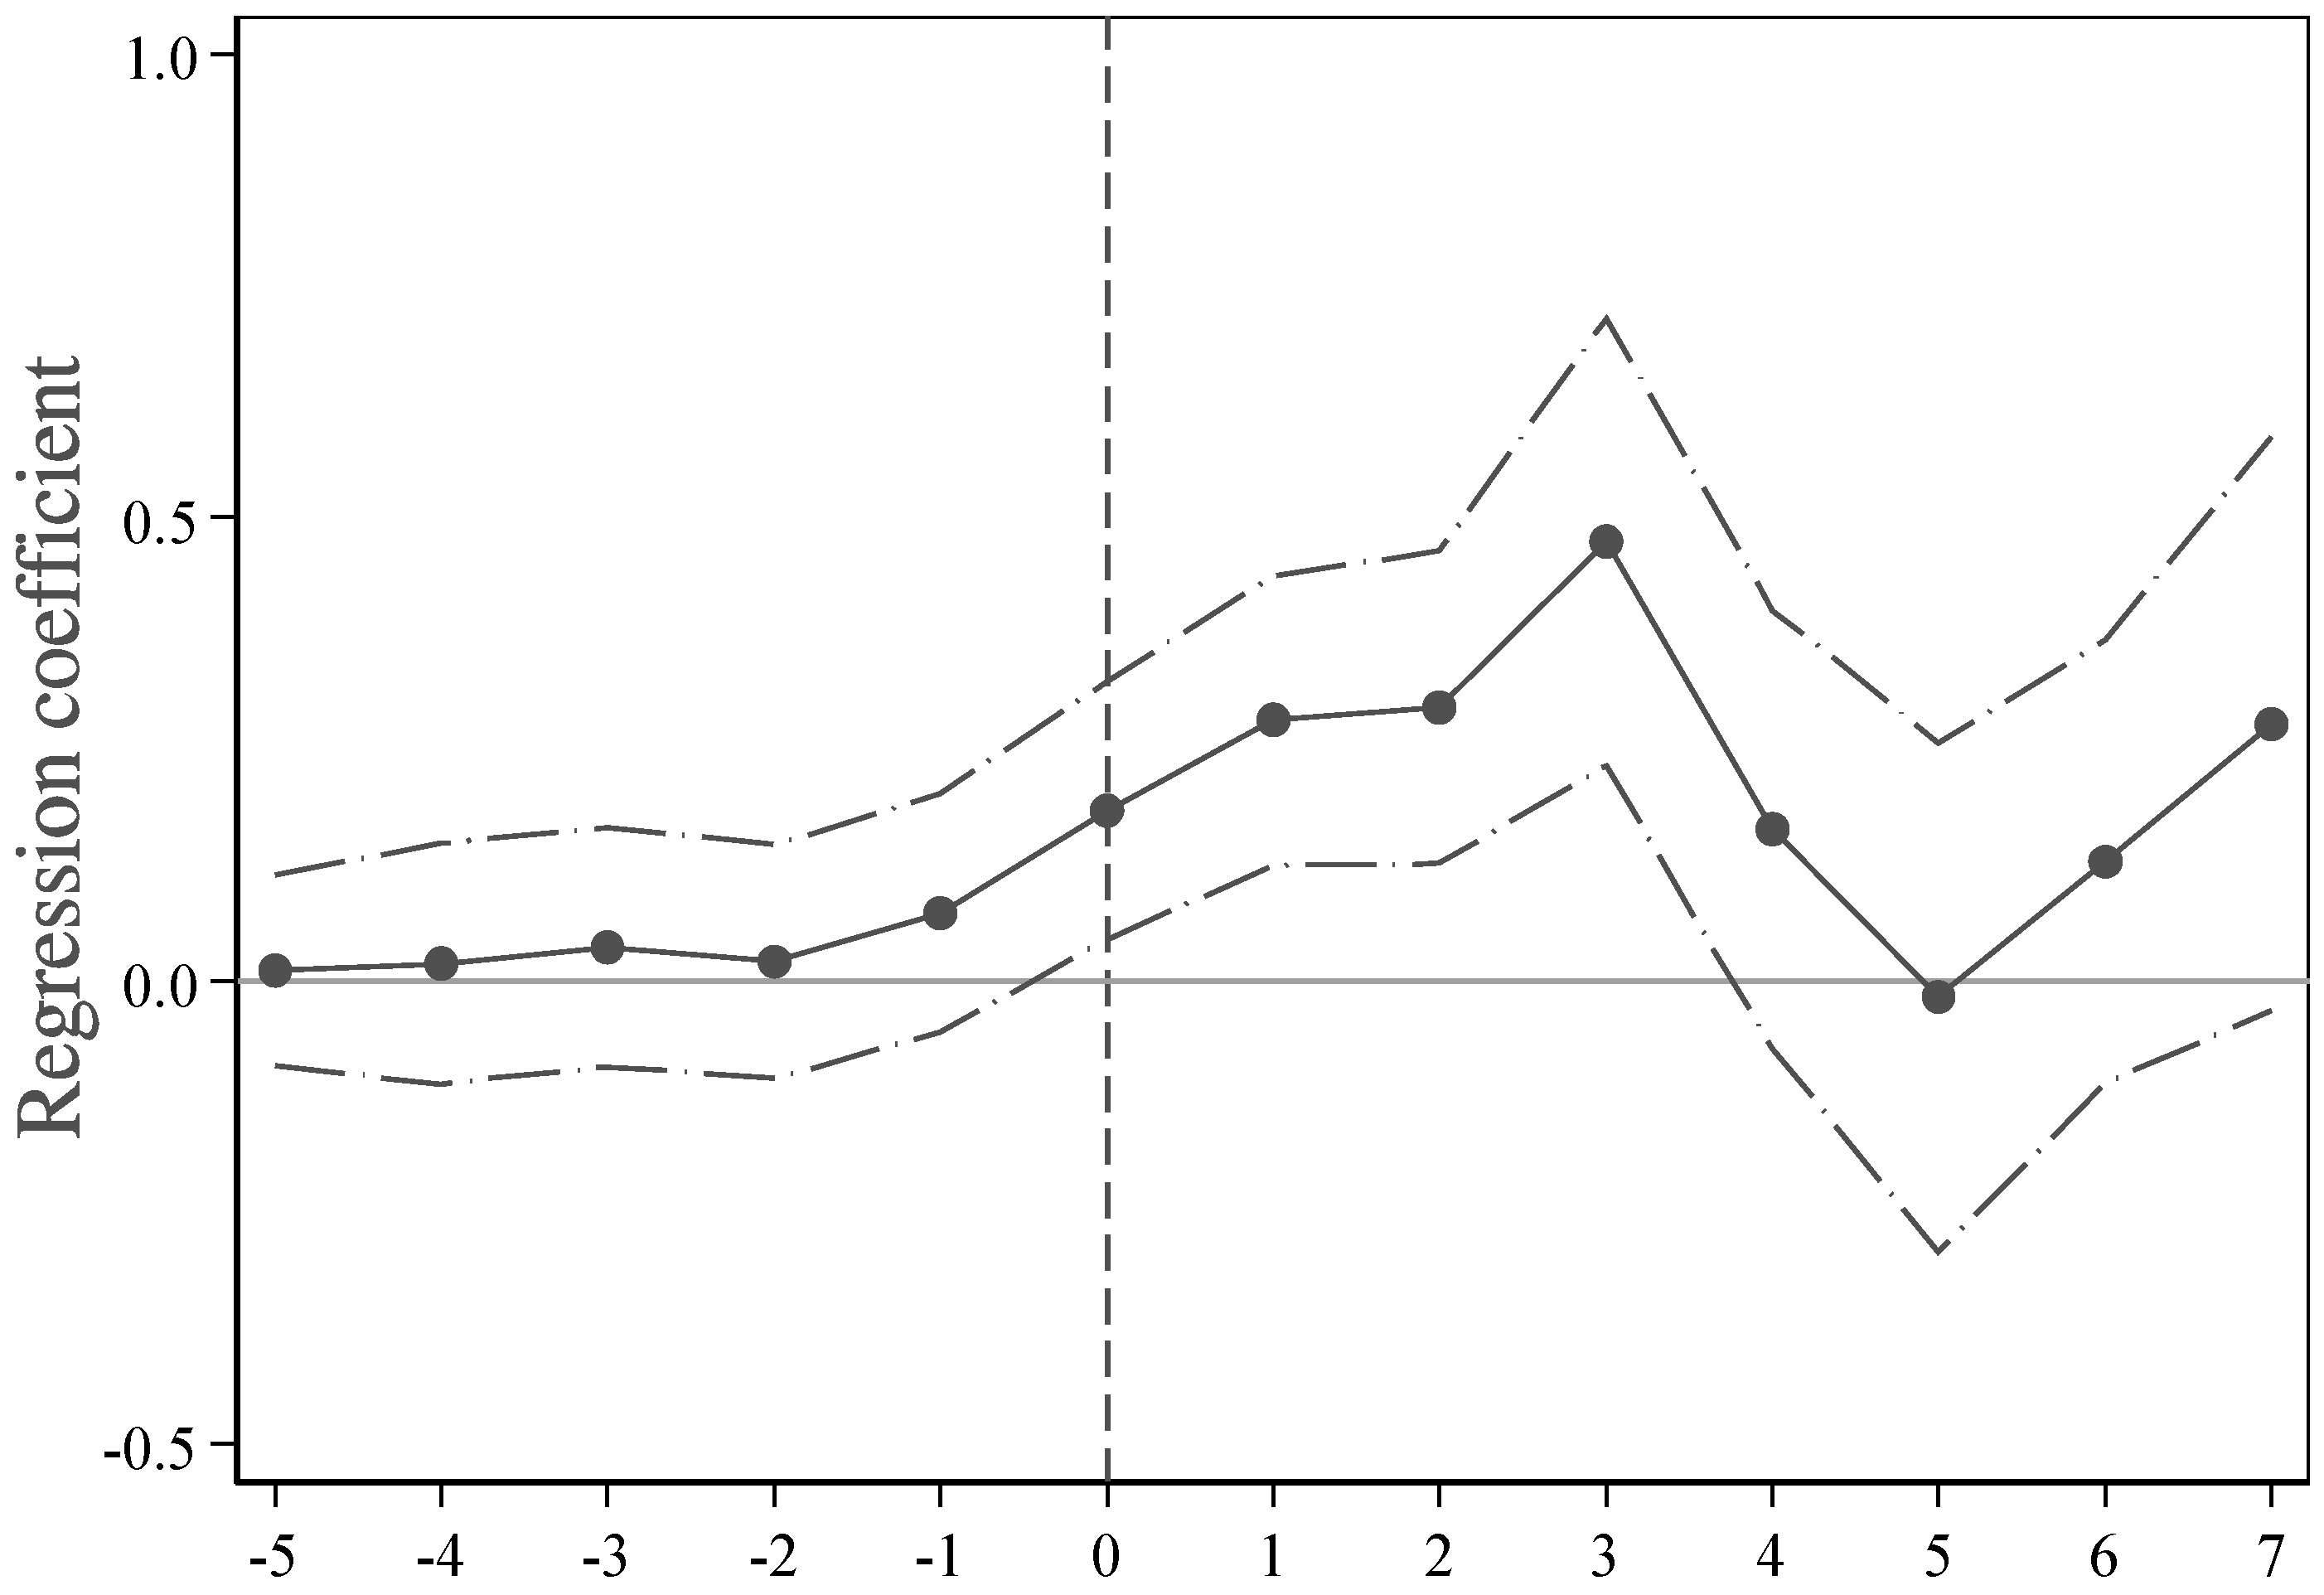
4.2.2. Parallel Trend Tests and Analysis of Dynamic Effects
A critical prerequisite for the effective evaluation of policy effects using the DID method is the “parallel trend assumption”. This assumption posits that, prior to the policy intervention, the treatment and control groups must exhibit fundamentally consistent evolutionary trends. Drawing on the approach by Sun and Abraham [
27], this study employed a dynamic event study methodology to conduct parallel trend tests based on relative timing. The specific model setup is presented in Equation (3):
In the equation, variable
represents a dummy variable for the implementation of a regional integration strategy, serving as the key explanatory variable in the parallel trend test. These variables are defined as follows:
denotes the year the regional integration strategy was implemented,
represents the specific year in question, and
signifies the time relative to the initial implementation of the policy. If condition
is met and criterion
is satisfied, then outcome
is observed; otherwise, outcome
ensues. The configuration of other variables remains consistent with that described in Equation (3). The results of the parallel trend test, illustrated in
Figure 1, reveal that the average causal effect prior to policy implementation did not meet the 5% significance level criterion. This finding suggests that the evolutionary trends in the green economic development levels of both the treatment and control groups were consistent before the policy’s enactment, thereby satisfying the parallel trend assumption. In the three years following the initiation of the policy, a significant increase in the average causal effect was observed. However, beyond this period, the average causal effect did not reach the 5% significance threshold. This indicates that while the short-term effects of the regional integration strategy are pronounced, the long-term effects warrant further observation and verification.
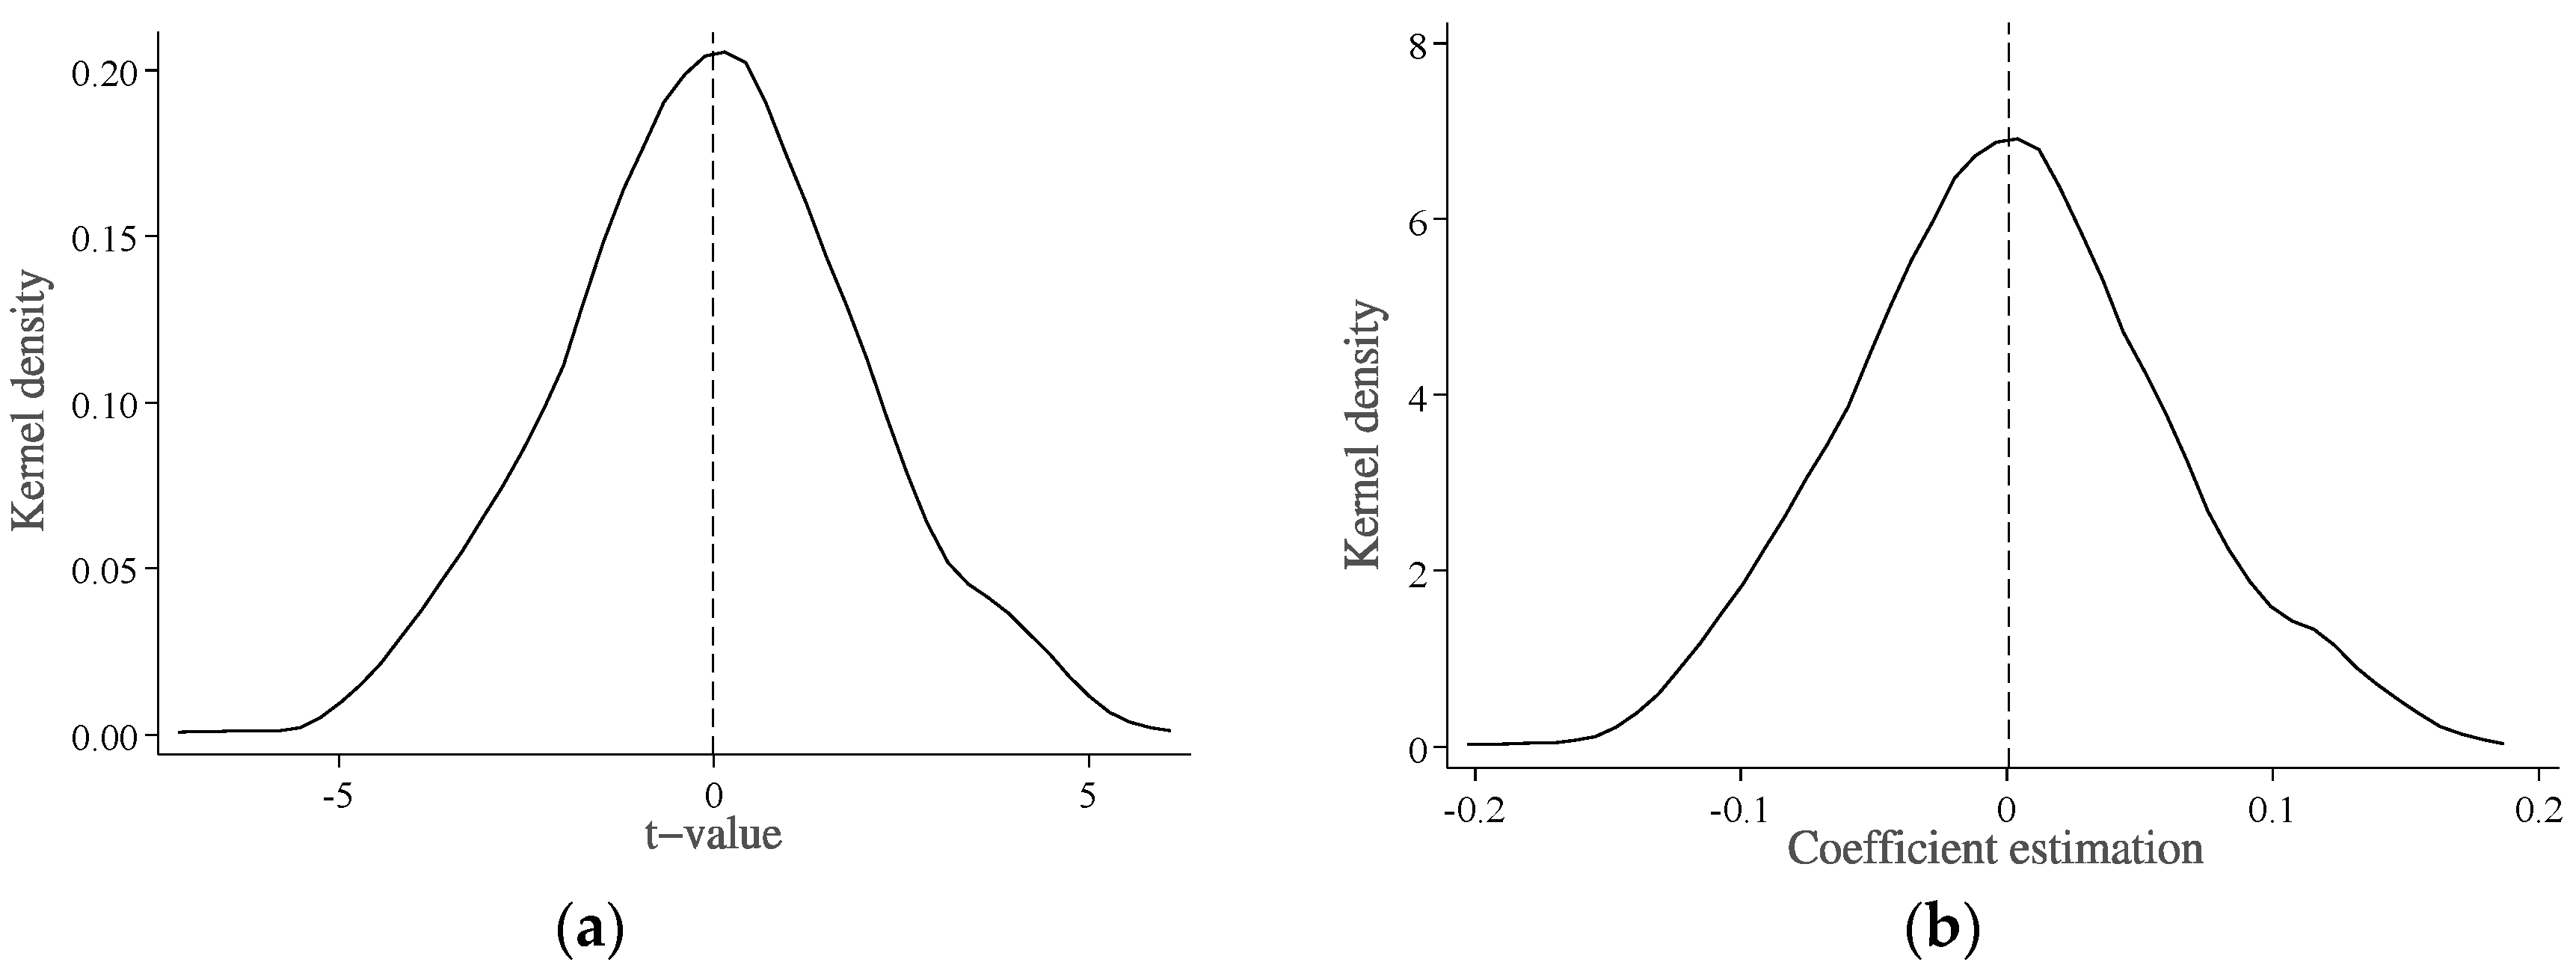
4.2.3. Placebo Test
During the observation period, it is plausible that exogenous factors unrelated to the implementation of regional integration strategies could influence the development of urban green economies. To identify the presence of such exogenous influences, this study employed a placebo test using independent repeated experiments. Given the gradual rollout of regional integration strategies, this analysis randomly selected target cities from the overall sample to serve as a pseudo-treatment group. It then randomly assigned a policy initiation date within the observation period for the pseudo-treatment group, conducting 1000 independent repeated samplings and regression according to Equation (3).
Figure 2 displays the distribution of the regression estimation coefficients and t-values from the independent repeated experiments. The concentrations of both estimation coefficients and t-values near zero, along with the distinct outlier status of the actual estimation coefficients and t-values reported in column (3) of
Table 2 during the independent experiments, suggest that the observed positive impact of regional integration strategies on the development of urban green economies is unlikely to be driven by other exogenous factors.
4.2.4. Re-Examination Using the PSM-DID Method
Although the parallel trend test had validated the appropriateness of employing the DID approach, the non-randomness of policy implementation may introduce self-selection bias. The Propensity Score Matching (PSM) method addresses this by matching each treated unit with a specific control unit, thereby approximating a quasi-random experiment. To this end, this study further employed the PSM-DID method for empirical validation. The PSM-DID method refers to the method of Yuan et al. [
28]. To ensure the reliability of the results, the analysis was conducted using samples with non-empty matching weights and those satisfying the common support assumption for regression validation. The regression outcomes, presented in
Table 4 columns (1) and (2), reveal that the estimated coefficients are significantly positive at the 1% level.
4.2.5. Reassessment Excluding Interference from Other Preferential Policies
The assessment of regional integration strategies might be biased due to the interference of other preferential policies. To address this concern, this study employed a DDD model to re-estimate the effects while excluding the influence of other preferential policies. The DDD method refers to the method of Zheng et al. [
29]. Typically, cities with higher development levels are more likely to receive various preferential policies. Accordingly, this study identified cities meeting the following criteria as the treated group affected by other preferential policies: cities whose nominal GDP exceeds the provincial average for more than half of the study period. The remaining cities served as the control group. The specification of the DDD model is presented in Equation (4):
In the equation,
denotes the likelihood of receiving preferential policies. If favorable, the outcome is
; otherwise, it is
. The settings for other variables are consistent with those in Equation (3). The results of the DDD estimation are presented in columns (3) and (4) of
Table 4, based on the matched sample from columns (1) and (2). The DDD estimation coefficient
represents the impact of regional integration strategies on the development of the urban green economy, excluding the interference of other preferential policies. This effect remains significantly positive at the 1% level. Furthermore, a comparison between the policy estimation coefficients in columns (3) and (4) with those in columns (1) and (2) reveals an increase in the coefficients. This indicates that the protectionist tendencies of various other preferential policies are relatively pronounced, and their cumulative effect offsets a portion of the policy impact of regional integration strategies.
4.3. Heterogeneity Analysis
Empirical evidence shown in
Figure 2 demonstrates significant disparities in the development levels of the green economy across different urban clusters. This suggests that the effectiveness of regional integration strategies may be closely linked to the characteristic attributes of urban clusters. Therefore, this study conducted a heterogeneity analysis focusing on the regional affiliation, scale, and development drivers of urban clusters. The classification of urban cluster scale and development models follows the methodology of Guo Rui et al. [
30]. The heterogeneity analysis methods were referenced from Xue et al. [
31].
4.3.1. Analysis of Regional Heterogeneity
Given the limitations of subsample regression for a direct comparison of policy effects across regions, this study constructed regional dummy variables, with the eastern region as the reference group, integrating these with the DID interaction terms into the benchmark regression model. To approximate the analytical effectiveness of subsample regression and ensure generality in the results, this research incorporated both regional dummy variables and the interaction terms of these dummies with control variables, based on existing controls. The results of the regional heterogeneity analysis, presented in
Table 5, reveal significant insights. The coefficient estimates for the DID interaction with a central region indicate that, at a 5% significance level, the effectiveness of the regional integration strategy in the eastern region surpasses that in the central region. Furthermore, the coefficient estimates for the DID interaction with the northeastern region indicate that, at a 1% significance level, the strategy’s effectiveness in the northeast outperforms the eastern region. To further delineate the policy effects among the three major regions, excluding the east, this study conducted a differential analysis of the DID interaction terms’ coefficient estimates and linear combination tests on these estimates, as detailed in
Table 5. The analysis uncovers that, at a 1% significance level, the policy’s effectiveness in both the central and western regions is inferior to that in the northeast. The superior outcomes in the northeast may be attributed to intensified factor flows and enhanced transportation links among cities within the Harbin–Changchun city cluster since 2015. The difference in policy effectiveness between the western, eastern, and central regions is not statistically significant, potentially due to offsetting effects arising from concurrent policy implementations across different city clusters.
4.3.2. Analysis of Heterogeneity by Urban Agglomeration Scale
In this study, non-national urban agglomerations served as the reference group for constructing a dummy variable indicating whether an urban agglomeration is of national status. Then, this study integrated the dummy variable with the DID interaction terms into the benchmark regression model. Based on the original control variables, this study introduced the interaction terms between the national urban agglomeration dummy variables and each control variable to control. The methodology mirrors that of the regional heterogeneity analysis. The findings, as shown in
Table 6, reveal significant insights. Specifically, at a 1% significance level, the coefficient estimates for the DID interaction with the national-level urban agglomeration dummy variable suggest that the policy implementation effect is more pronounced in non-national urban agglomerations.
This observed discrepancy may be attributed to the fact that national-level urban agglomerations typically commenced integration strategies earlier than their non-national counterparts. Within the study’s temporal scope, it is possible that the policy dividends in national urban agglomerations have been more thoroughly capitalized upon, whereas non-national urban agglomerations are just beginning to significantly leverage the policy’s benefits.
4.3.3. Analysis of Heterogeneity in Urban Agglomeration Development Models
This study conducted a heterogeneity analysis using a dummy variable approach to compare the effectiveness of regional integration strategies across different urban agglomeration development models. Then, this study integrated the dummy variable with the DID interaction terms into the benchmark regression model. Based on the original control variables, this study introduced the interaction terms between the dummy variables and each control variable to control. The reference group for this analysis was the monocentric (single-core) development model. The findings, presented in
Table 7, highlight significant differences in the impact of regional integration strategies based on the development model. Two coefficients in
Table 7 were subtracted, and the corresponding
t-test was conducted. As can be seen from
Table 7, at a 1% significance level, the implementation effect of the regional integration strategy is found to be superior in the bicentric (dual-core) development model compared to the monocentric model. However, at a 5% significance level, this effect is less pronounced in the polycentric (multi-center) development model when compared to the monocentric model. Moreover, at a 1% significance level, the bicentric model is more conducive to the implementation of regional integration strategies than the polycentric model.
4.4. Mechanism Analysis
To examine the mechanisms through which the implementation of regional integration strategies facilitates the development of urban green economies, this study referred to Wang et al. [
25] to incorporate moderating variables into the baseline DID model, constructing the following model to test the moderating effects:
The model includes variables
,
, and
, representing the intensity of economic linkages, the degree of industrial structure transformation and upgrading, and the level of rational resource allocation, respectively. To facilitate comparisons, the results for these variables were standardized. Except for the exclusion of the industrial structure variable from the control variables, all other variable settings are consistent with Equation (3). The analysis of moderating effects allowed for an assessment of the roles of economic linkage effects, industrial structure transformation and upgrading effects, and rational resource allocation effects in the policy dividend release process of regional integration strategies. The intensity of economic linkages (
), the degree of industrial structure transformation and upgrading (
), and the level of rational resource allocation (
) were measured following the methodologies of Liu Naiquan et al. [
32], Yuan Hang et al. [
33], and Chen Yongwei et al. [
34], respectively.
The results of the moderation effect analysis are presented in
Table 8. The coefficients of interaction terms between the strength of economic linkages and the transformation and upgrading of industrial structures are significantly positive at the 1% level, thereby confirming Hypotheses 2 (H2) and 3 (H3); however, the coefficient of the interaction term with rational resource allocation is significantly negative at the 1% level, leading to the rejection of Hypothesis 4 (H4). The mechanism analysis indicates that regional integration strategies can effectively promote urban green economic development through the effects of economic linkages and industrial structure transformation and upgrading. Nevertheless, the effect of rational resource allocation does not favor the development of the urban green economy. This suggests that under the influence of regional integration strategies, cities can mitigate the constraints on factor endowments facing the development of the green economy through factor connectivity and resource complementarity. Moreover, the rational layout, coordinated cooperation, and structural upgrading of industries have collectively fostered the green economic development of cities. However, the negative effect of rational resource allocation indicates that current green development or innovation projects may not receive sufficient factor support for implementation, and the efficiency of factor usage in green industries may still need to be improved. This area requires focused attention and improvement in the future advancement of regional integration strategies. Furthermore, by comparing the magnitudes of the three interaction coefficients, it is observed that among the three effects, the economic linkage effect plays the most crucial role in facilitating urban green economic development through the implementation of regional integration strategies, followed by the effect of industrial structure transformation and upgrading. The combined positive significance of these three effects suggests that regional integration strategies can overall effectively promote the development of the urban green economy.
The results of the moderation effect analysis are presented in
Table 8. As can be seen from column (2)–column (7), the coefficients of interaction terms between the strength of economic linkages and the transformation and upgrading of industrial structures are significantly positive at the 1% level, thereby confirming Hypotheses 2 (H2) and 3 (H3); however, the coefficient of the interaction term with rational resource allocation is significantly negative at the 1% level, leading to the rejection of Hypothesis 4 (H4). The mechanism analysis indicates that regional integration strategies can effectively promote urban green economic development through the effects of economic linkages and industrial structure transformation and upgrading. Nevertheless, the effect of rational resource allocation does not favor the development of the urban green economy. This suggests that under the influence of regional integration strategies, cities can mitigate the constraints on factor endowments facing the development of the green economy through factor connectivity and resource complementarity. Moreover, the rational layout, coordinated cooperation, and structural upgrading of industries have collectively fostered the green economic development of cities. However, the negative effect of rational resource allocation indicates that current green development or innovation projects may not receive sufficient factor support for implementation, and the efficiency of factor usage in green industries may still need to be improved. This area requires focused attention and improvement in the future advancement of regional integration strategies. Furthermore, in comparing the magnitudes of the three interaction coefficients, it is observed that among the three effects, the economic linkage effect plays the most crucial role in facilitating urban green economic development through the implementation of regional integration strategies, followed by the effect of industrial structure transformation and upgrading. In column (8), the coefficients of three interaction terms of DID are added together to obtain the sum of the three mechanism effects. The combined positive significance of these three effects [a linear combination analysis of the three interaction term coefficients in column (8) of
Table 8 yields a cumulative effect sum of 3.8102, significant at the 1% level (t-value = 8.5953). suggests that regional integration strategies can overall effectively promote the development of the urban green economy.
5. Discussion
Table 2 shows the benchmark regression results of DID, which proves that the regional integration strategy can effectively promote the development of urban green economy.
Table 3 and
Table 4 present the robustness test results, which once again verify the correctness of H1. The results in
Table 3 prove that the regional integration strategy is exogenous, so the endogenous interference is excluded. The results in
Table 4 are re-tests excluding sample self-selection bias and other policy interference aspects, which further verify that the effect of a regional integration strategy in promoting urban green economy development is robust.
Table 5,
Table 6 and
Table 7, respectively show the regional heterogeneity, the heterogeneity by scale of urban agglomerations, and heterogeneity in urban agglomeration development models. The results of regional heterogeneity indicate that we should attach importance to and consolidate the effects of the regional integration strategy in northeast and east China. The results of the scale heterogeneity analysis show that non-national urban agglomerations should narrow the gap of green economy development levels with national urban agglomerations by exploiting latecomer advantage. The heterogeneity analysis of the development driving model indicates that the regional integration strategy should pay attention to the role of the dual-core driving model in promoting the development of urban green economy.
Table 8 shows the mechanism of the regional integration strategy in promoting urban green economy development. The results of
Table 8 show that the economic links among Chinese cities, factor circulation, and industrial structure transformation and upgrading can already promote the development of urban green economy, but the rational allocation of resources needs to be further improved.
6. Conclusions and Policy Implications
This study viewed the implementation of regional integration strategies as a quasi-natural experiment. Utilizing panel data from ten major city clusters and non-cluster cities in China from 2003 to 2022, the research firstly employed the undesired-output super-efficiency SBM model and GML index to measure the green economic development levels of cities. Subsequently, it rigorously examined the impact of regional integration strategy implementation on urban green economic development using a multi-period DID approach. The investigation delved into the influence mechanisms through three distinct analytical lenses: robustness tests, heterogeneity analysis, and mechanism exploration.
Key findings include the following. (1) The regional integration strategy has a notably positive short-term effect on urban green economic development, though its long-term impact requires further empirical validation. (2) The cumulative effect of other preferential policies, aside from the regional integration strategy, exerts a negative influence on urban green economic development, indicating significant room for policy enhancement and optimization. (3) In terms of advancing urban green economic development, the implementation effectiveness of the regional integration strategy is superior in the eastern regions compared to the central ones, and more effective in the northeast compared to the east, central, and western regions. (4) The impact of regional integration strategies is more pronounced in non-national-level urban clusters than in national-level ones. (5) The influence of a regional integration strategy on urban green economic development exhibits an inverted U-shape pattern across different core driving development models. (6) Among the three effects analyzed, the economic linkage effect emerged as the most crucial pathway through which the regional integration strategy fosters urban green economic development, followed by the effect of industrial structure transformation and upgrading. Although the resource allocation effect is negative, the overall impact of these combined effects remains significantly positive.
Based on the aforementioned conclusions, the following policy implications can be derived. (1) Urban agglomerations should transcend spatial and administrative barriers to foster deep integration, promoting resource sharing and functional complementarity. This approach aims to overcome isolated efforts and mutual constraints, revitalizing the domestic economy through coordinated internal and external development, achieving quality growth over mere expansion. The strategy should not only act as a growth engine for the national unified market, but also support rural revitalization, thereby laying a solid foundation for a domestic circulation-led dual circulation strategy. (2) Non-national urban clusters are encouraged to explore their inherent strengths and untapped potential, actively catching up with national urban clusters to narrow regional development disparities. Such efforts are crucial in advancing the strategy for common prosperity. (3) Overall, a dual-core driven regional integration policy proved to be most effective, surpassing multi-core and single-core driven approaches in advantages. Urban clusters should tailor their development plans based on their unique circumstances, selecting the most suitable growth model. (4) Strengthening urban interconnectivity and advancing industrial structure transformation and upgrading are essential for steering the supply structure of factor markets toward green development. Regional integration strategies must prioritize support for green development and innovative projects, ensuring abundant resources for high-quality green initiatives. Emphasis should also be placed on encouraging the adoption and research of green technologies, enhancing the efficiency of factor use in green industries and strengthening market competitiveness. (5) Vigorously promoting digital and intelligent governance reforms to ensure policy implementation is mutually reinforcing, diligently avoiding counterproductive policy outcomes.


