Article

Assessment of the Greenery Content in Suburban Multi-Family Housing Models in Poland: A Case Study of the Poznań Metropolitan Area

Faculty of Architecture, Poznań University of Technology, ul. Jacka Rychlewskiego 2, 61-131 Poznań, Poland
*
Author to whom correspondence should be addressed.
Sustainability 2024, 16(8), 3266; https://doi.org/10.3390/su16083266
Submission received: 8 March 2024 / Revised: 9 April 2024 / Accepted: 11 April 2024 / Published: 13 April 2024

Abstract

:
(1) Contemporary approaches to sustainable housing design tend to prioritize technological solutions supporting energy efficiency and climate change mitigation. On the contrary, spatial planning of housing estates does not always address all pro-ecological aspects, such as the role of greenery. This research aimed to assess the greenery content and its environmental importance in typical housing districts in the selected study area. (2) The research methodology was based on indicators reflecting the biologically active area ratio, the length of communication routes lined with trees, the tree number per area unit, the tree canopy, and the environmental benefits delivered by the trees. The above indicators allowed us to compare selected models of suburban residential districts typical of specific timeframes. (3) The results indicated that the greenery content and its environmental benefits in suburban districts are decreasing in the study area. Another finding concerned the importance of selecting tree species for their ability to develop a canopy and provide ecosystem services. (4) The proposed methodology, based on inter-related indicators, validly compared the greenery content in the analyzed districts, giving it application value. The problems observed contributed to the proposal of a revision of Poland’s planning practices. Local zoning plans could include streetscape standards, indicating paving solutions and plantings to improve the situation.

1. Introduction

The modern paradigm of sustainable buildings emphasizes technical aspects of design, which support achieving Sustainable Development Goals (SDGs), bringing economic, social, and environmental benefits. Of all human activity on the Earth, architecture, engineering, and construction (AEC) form by far the dominant sector in terms of the total carbon footprint in our society [1], generating 36% of CO2 worldwide [2]. Moreover, the AEC sector is responsible for 40–60% of raw material extraction [3]. A transformation is needed in the construction sector to mitigate these risks [4]. The necessary changes include reducing waste and emissions, providing more efficient use of raw materials, and saving energy. However, the efforts to improve the AEC sector seem less focused on the role of greenery, which is also a subject of investment. Still, its importance, especially in multi-family housing areas, is limited to a supplementary role.

1.1. Current Paradigm of Sustainable Building

Most attempts to respond to the requirements of sustainable development in the AEC sector can be associated with a global trend combining two weighty ideas: the net-zero concept and the Circular Economy (CE). The research on the net-zero concept, considered a way to reduce greenhouse gas emissions and mitigate climate change, has centered on technologies and equipment [5], e.g., selecting proper Renewable Energy Sources (RES) technology for a specific location [6,7,8]. Such analyses have been conducted at different scales—from regional and community scales [9,10,11] to specific building types and functions [12], also considering retrofits [13]. The abundant academic literature studied the net-zero concept in the framework of specific energy sectors (e.g., electricity generation) [14,15,16] or for a specific RES technology (e.g., solar or ocean energy) [11,17], as well as their cost-competitivity [18], emissivity [19], and other parameters [20]. Life cycle analysis and multi-criteria methods gained popularity in assessing the effectiveness of diverse solutions [16,21,22,23,24]. The necessity to reduce waste, emissions, energy consumption, and the use of raw materials required by the construction sector has contributed to the applications of CE in the AEC industry [25,26]. Assessing circularity in the AEC sector involves using methods based on a general CE assessment framework [25,27].
Applying the above concepts in buildings significantly changed the design paradigm [28] and increased the use of Building Information Modeling (BIM) technologies in solving numerous issues and making the design process more effective [29,30]. Also, some new concepts related to the digitization of design have appeared, e.g., the automated greenery design with plant selection [31]. On the other hand, the question of human input in architectural design has arisen [32].
Poland’s current AEC design paradigm follows the mainstream global trends described above, prioritizing technical infrastructure, equipment, and BIM [24]. However, is this sufficient? Does the current design paradigm cover all sustainability requirements? The prominent lack of greenery in new neighborhoods in the suburban fringe of Polish cities illustrates how negligence in urban planning impedes the achievement of the SDGs despite the significant improvement in the design standards in the AEC domains. The role of urban greenery is still underrated in Poland’s AEC sector.

1.2. The Role of Urban Greenery and Its Assessment

While the current sustainable design paradigm still prioritizes the efficiency of buildings, recent research demonstrated the importance of ecosystem health in achieving SDGs, shifting global attention towards urban resilience. Vegetation plays a vital role in the contemporary vision of a green city, which derives from Ebenezer Howard’s Garden City theory. The European Commission promotes this modernized pro-environmental spatial policy under the banner of Green Cities Europe and the competition for the green capital of Europe [33]. Such actions are intended to spread knowledge of green areas’ ecological, aesthetic, and economic value and support the large-scale applications of this concept. The ideas of green cities or biourbanism, which defines a city as an ecological system that is part of nature and is connected to the surrounding landscape [34], function primarily thanks to public investments but are too often neglected in private sector projects. In Polish cities, where sustainable development ideas are implemented with a delay compared to Western Europe, positive changes occur most often in the inner-city areas. In the case of private sector investments, green areas are implemented at the last stage or even during the use phase of the investment.
The importance of urban greenery is interlinked with providing a habitat [34]. Several studies have shown a positive relationship between urban greenery and biodiversity [35,36,37,38,39,40,41,42]. This dependency appears at different scales and applies to all forms of urban greenery, comprising such small units as streetscape trees [43,44,45,46,47]. The state of knowledge obtained from many empirical studies was successfully translated into design guidelines, for example, the 3–30–300 rule developed by Konijnendijk [48] or the design method for ecological corridors proposed by Vos et al. [49].
Greenery content in urban areas was also used as a valid indicator of sustainability [50,51] and life quality standards [52,53,54,55]. Various tools were developed to assess the greenery content in urban areas. The first to mention is the Green Area Ratio (GAR) [56,57], which is used globally to measure the proportion of green vs grey surfaces. Not only the quantity of greenery but also its density and health are essential. It is measured with remote sensing techniques and expressed through indicators like the Normalized Difference Vegetation Index (NDVI).
An important strand of existing research has been devoted to the problem of soil sealing in cities and its prevention possibilities [58,59,60]. It primarily uses the Biotope Area Factor (BAF), which is a quantitative measurement utilized to assess the ecological worth of urban settlements by comparing the surface area that is ecologically effective to the area of the building site [61,62,63]. In its assumptions, BAF is analogous to the Biologically Active Area ratio (BAA), which is standardly used in spatial planning in Poland. Its definition emphasizes ensuring natural vegetation and rainwater retention (see also Section 2.2.1) [64].
The BAA ratio has an applicable character, as is legally required in Poland. The recently amended Planning Act defines thirteen types of development zones, ten of which require a minimum of 30% of the BAA [65]. Most land uses are concerned by this requirement, except for mining industry, open land (rural areas, surface waters, etc.), and communication. Having a legally defined minimal BAA indicator, why has Poland delayed in implementing urban greening policies?
It follows that the minimum BAA percentage is insufficient to achieve a resilient urban greenery system. Researchers from Polish universities and institutions have struggled to improve Poland’s planning policy for the past two decades, proposing different solutions. Recently, the valuation methods for ecosystem services have been identified as an opportunity to improve the control of the environmental risks of urbanization [66,67]. In addition to well-established methods [68], a selection of indicators was proposed to evaluate ecosystem services in urbanized areas, also considering green infrastructure’s aesthetic and cultural roles [66,69,70]. Among the indicators mentioned above, the ratio of the length of roads with greenery to their total length in the study area was proposed [66,70], as well as the number of natural monuments per number of inhabitants [66,70]. Recent publications also highlight the significant role of street trees in urban ecosystems [43,71], proving the critical role of urban greenery in sustainable spatial management. The research presented in this article will build over the above indicators to assess the greenery content as an indicator of ecosystem services in selected suburban housing estates.

1.3. Setting the Research Goal

This article discusses the efficiency of the current suburban multi-family housing design paradigm in terms of meeting sustainability requirements related to greenery content. Modern architects and engineers increasingly focus on technical solutions, infrastructure, and building equipment to achieve a satisfactory energy balance. At the same time, other design aspects are often overlooked. One of the worst manifestations is limiting greenery in current housing estate projects. In Poland, it can be observed that, while the architectural standards and engineering quality of residential buildings have increased recently, the quality of planning standards has fallen. This article compares multi-family housing design models from different decades in the XX and XXI centuries, using selected indicators of ecosystem services valuation to show how greenery planning standards for residential estates have changed over time.
The research goals can be formulated into the following questions:
Research Question 1: What is the greenery content in the typical residential districts of the study area?
Research Question 2: Has the greenery content increased or decreased in new neighborhoods compared to old ones?
Research Question 3: How does the BAA ratio translate into the environmental benefits of the greenery?
Research Question 4: What other indicators are efficient in assessing the greenery content?
The objective of addressing the questions above is to provide guidance to planning and design stakeholders on enhancing the current residential design paradigm with respect to greenery content. Our aim is to create and evaluate uncomplicated yet reliable methods for assessing the greenery content in residential complexes.

2. Materials and Methods

The research covered six case studies of multi-family housing estates in the metropolitan area of Poznań, Poland. Limiting the research to one region is intended to avoid contextual errors related to local building traditions, adjustment to the local climate, etc. The multi-family typology of suburban housing development was selected due to the semi-public nature of the shared outside spaces. Unlike single-family housing, land development in multi-family housing estates is usually carried out by the community and is not under private ownership.
The six housing estates selected are examples of urban practice from different decades of the XX and XXI centuries. The first three of them, dating from the 1930s, 1960s, and 1990s, respectively, can be considered historical patterns of multi-family suburban housing. The selected examples maintain their original layouts, and each was realized as a single project in a limited time. They provide a reference for modern design models. Three other examples are contemporary, dating from the 2000s, 2010s, and 2020s. They are treated as a representation of the current urban design paradigm.
The materials used in the research included maps obtained from the spatial information system of the Poznań metropolitan area [72]. This resource allowed the generation of updated and scaled maps, which were imported into CAD software (ArchiCAD 24 EDU). Subsequently, the greenery was inventoried and marked on the maps according to the existing state. This step used the imagery provided by Google Maps and Google Street View, Poland’s online tree information service [73], site visits, and inventories.

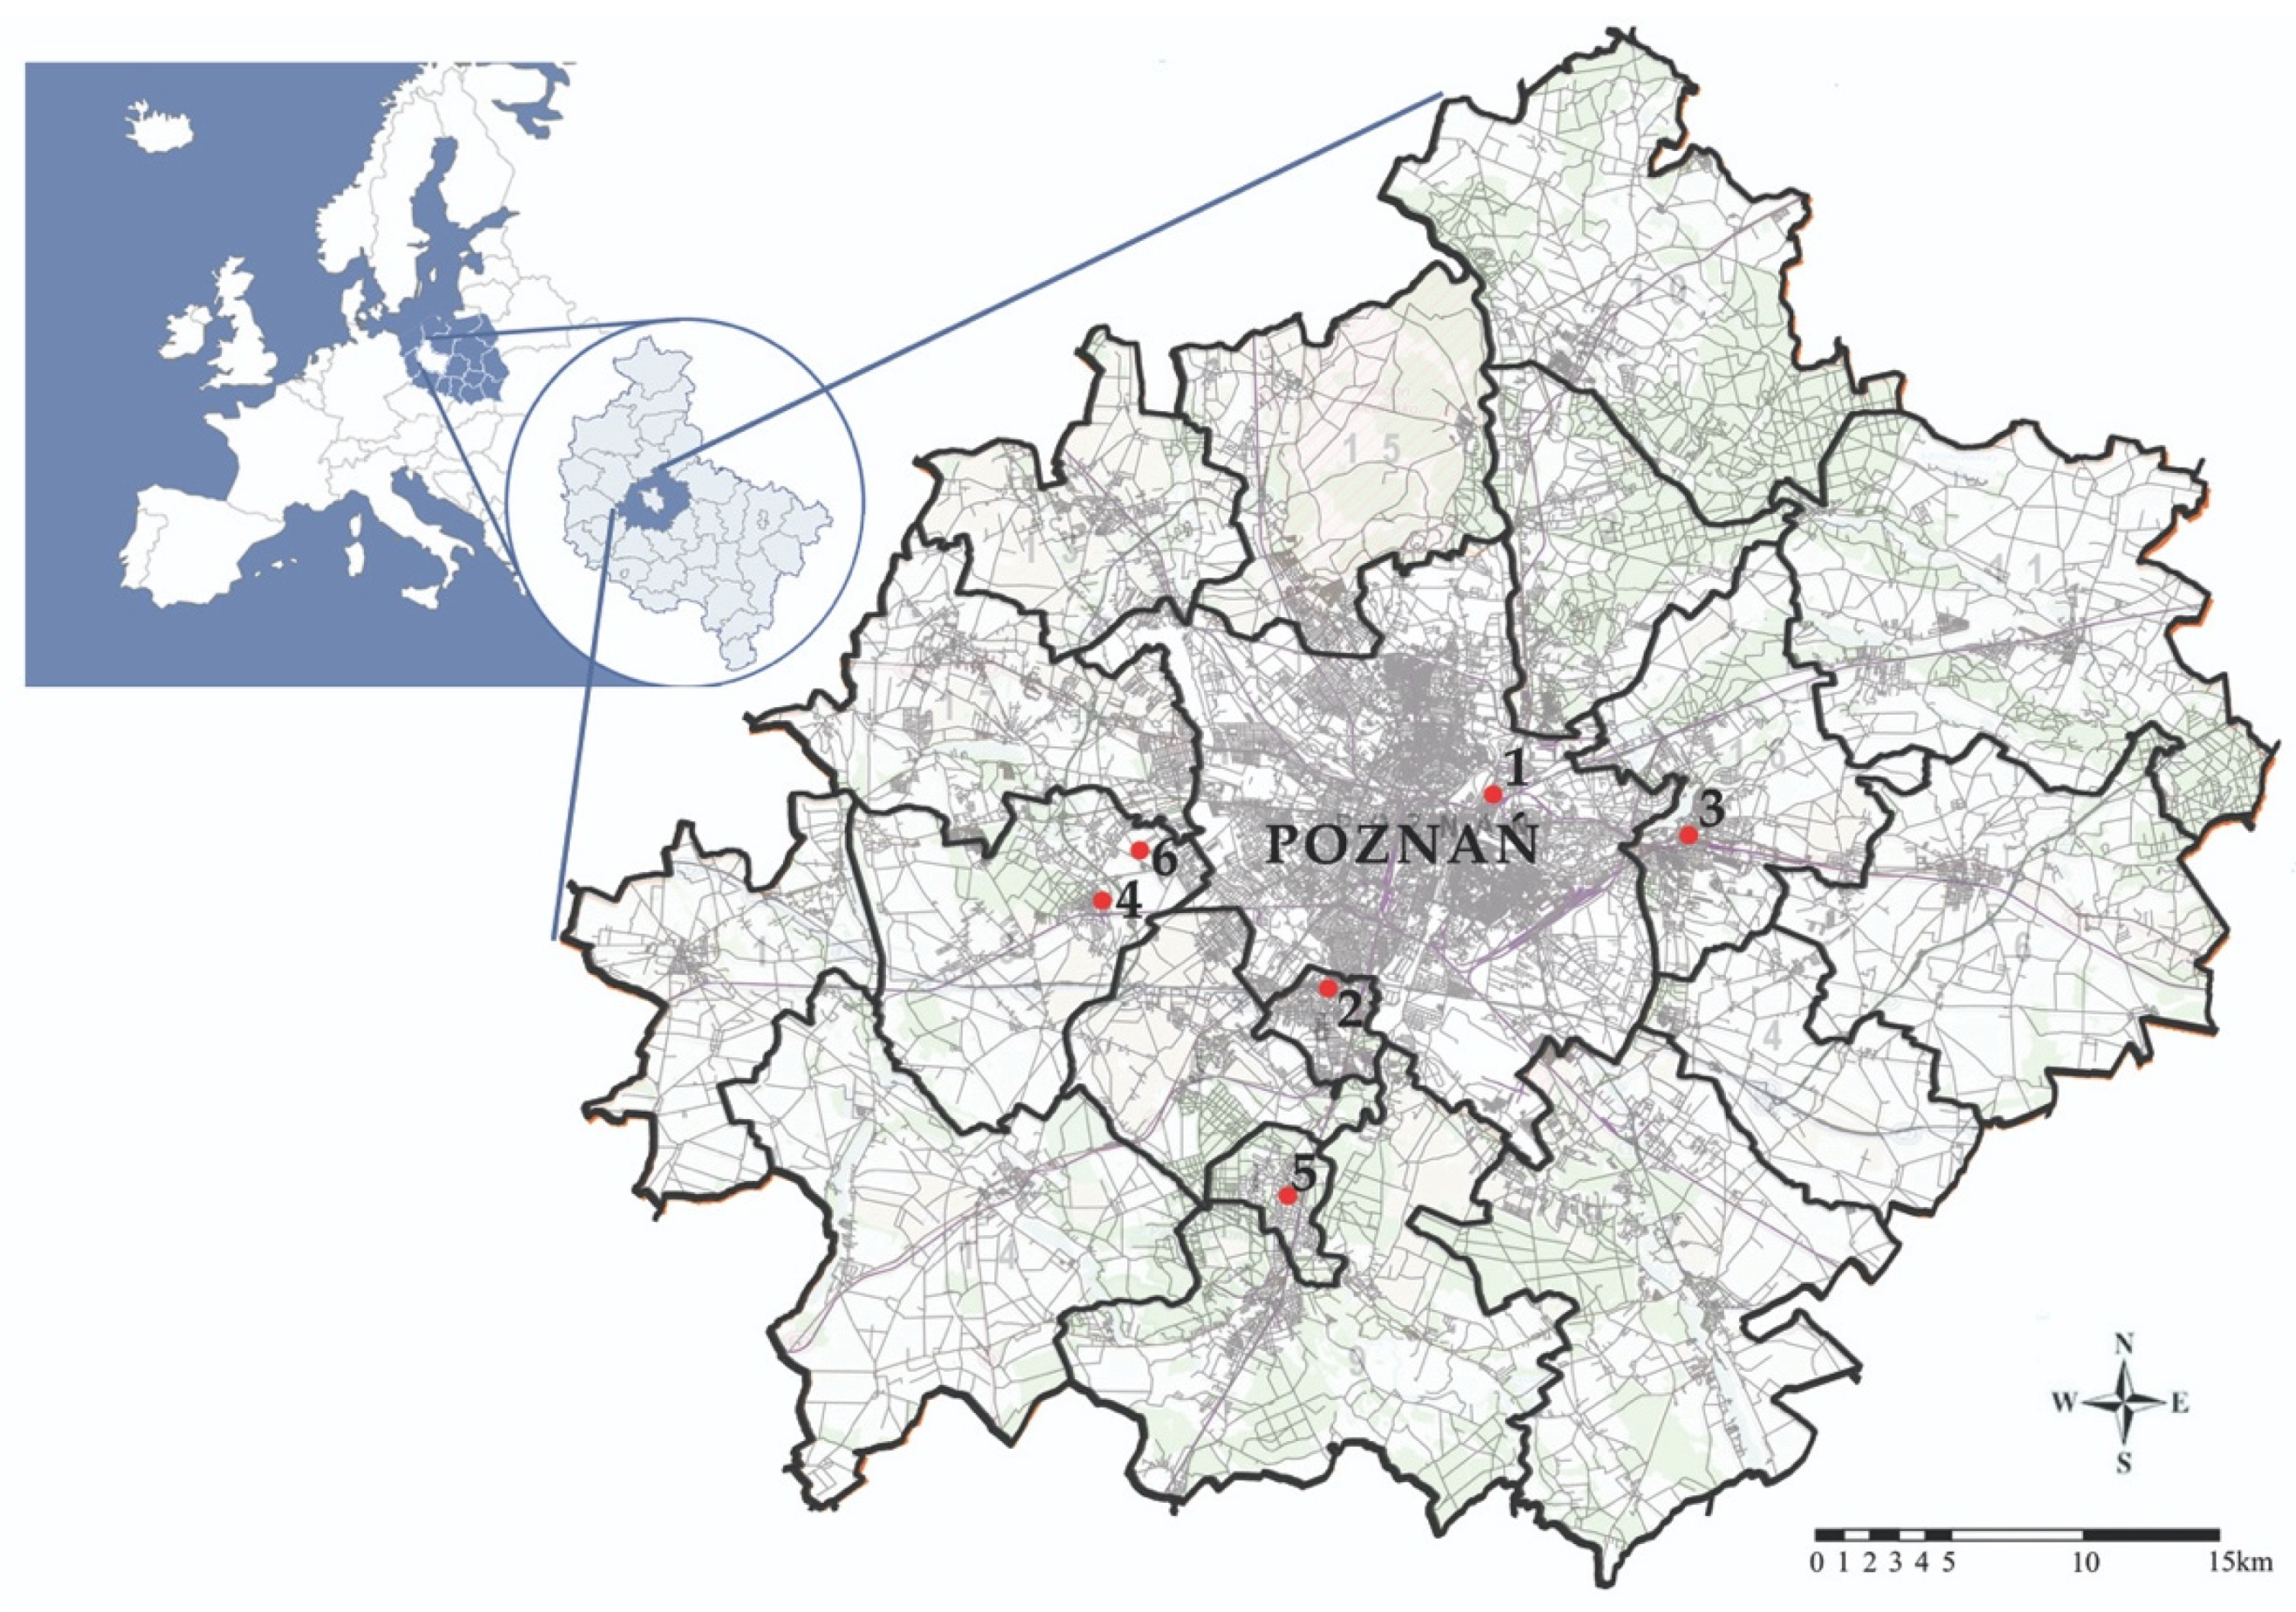
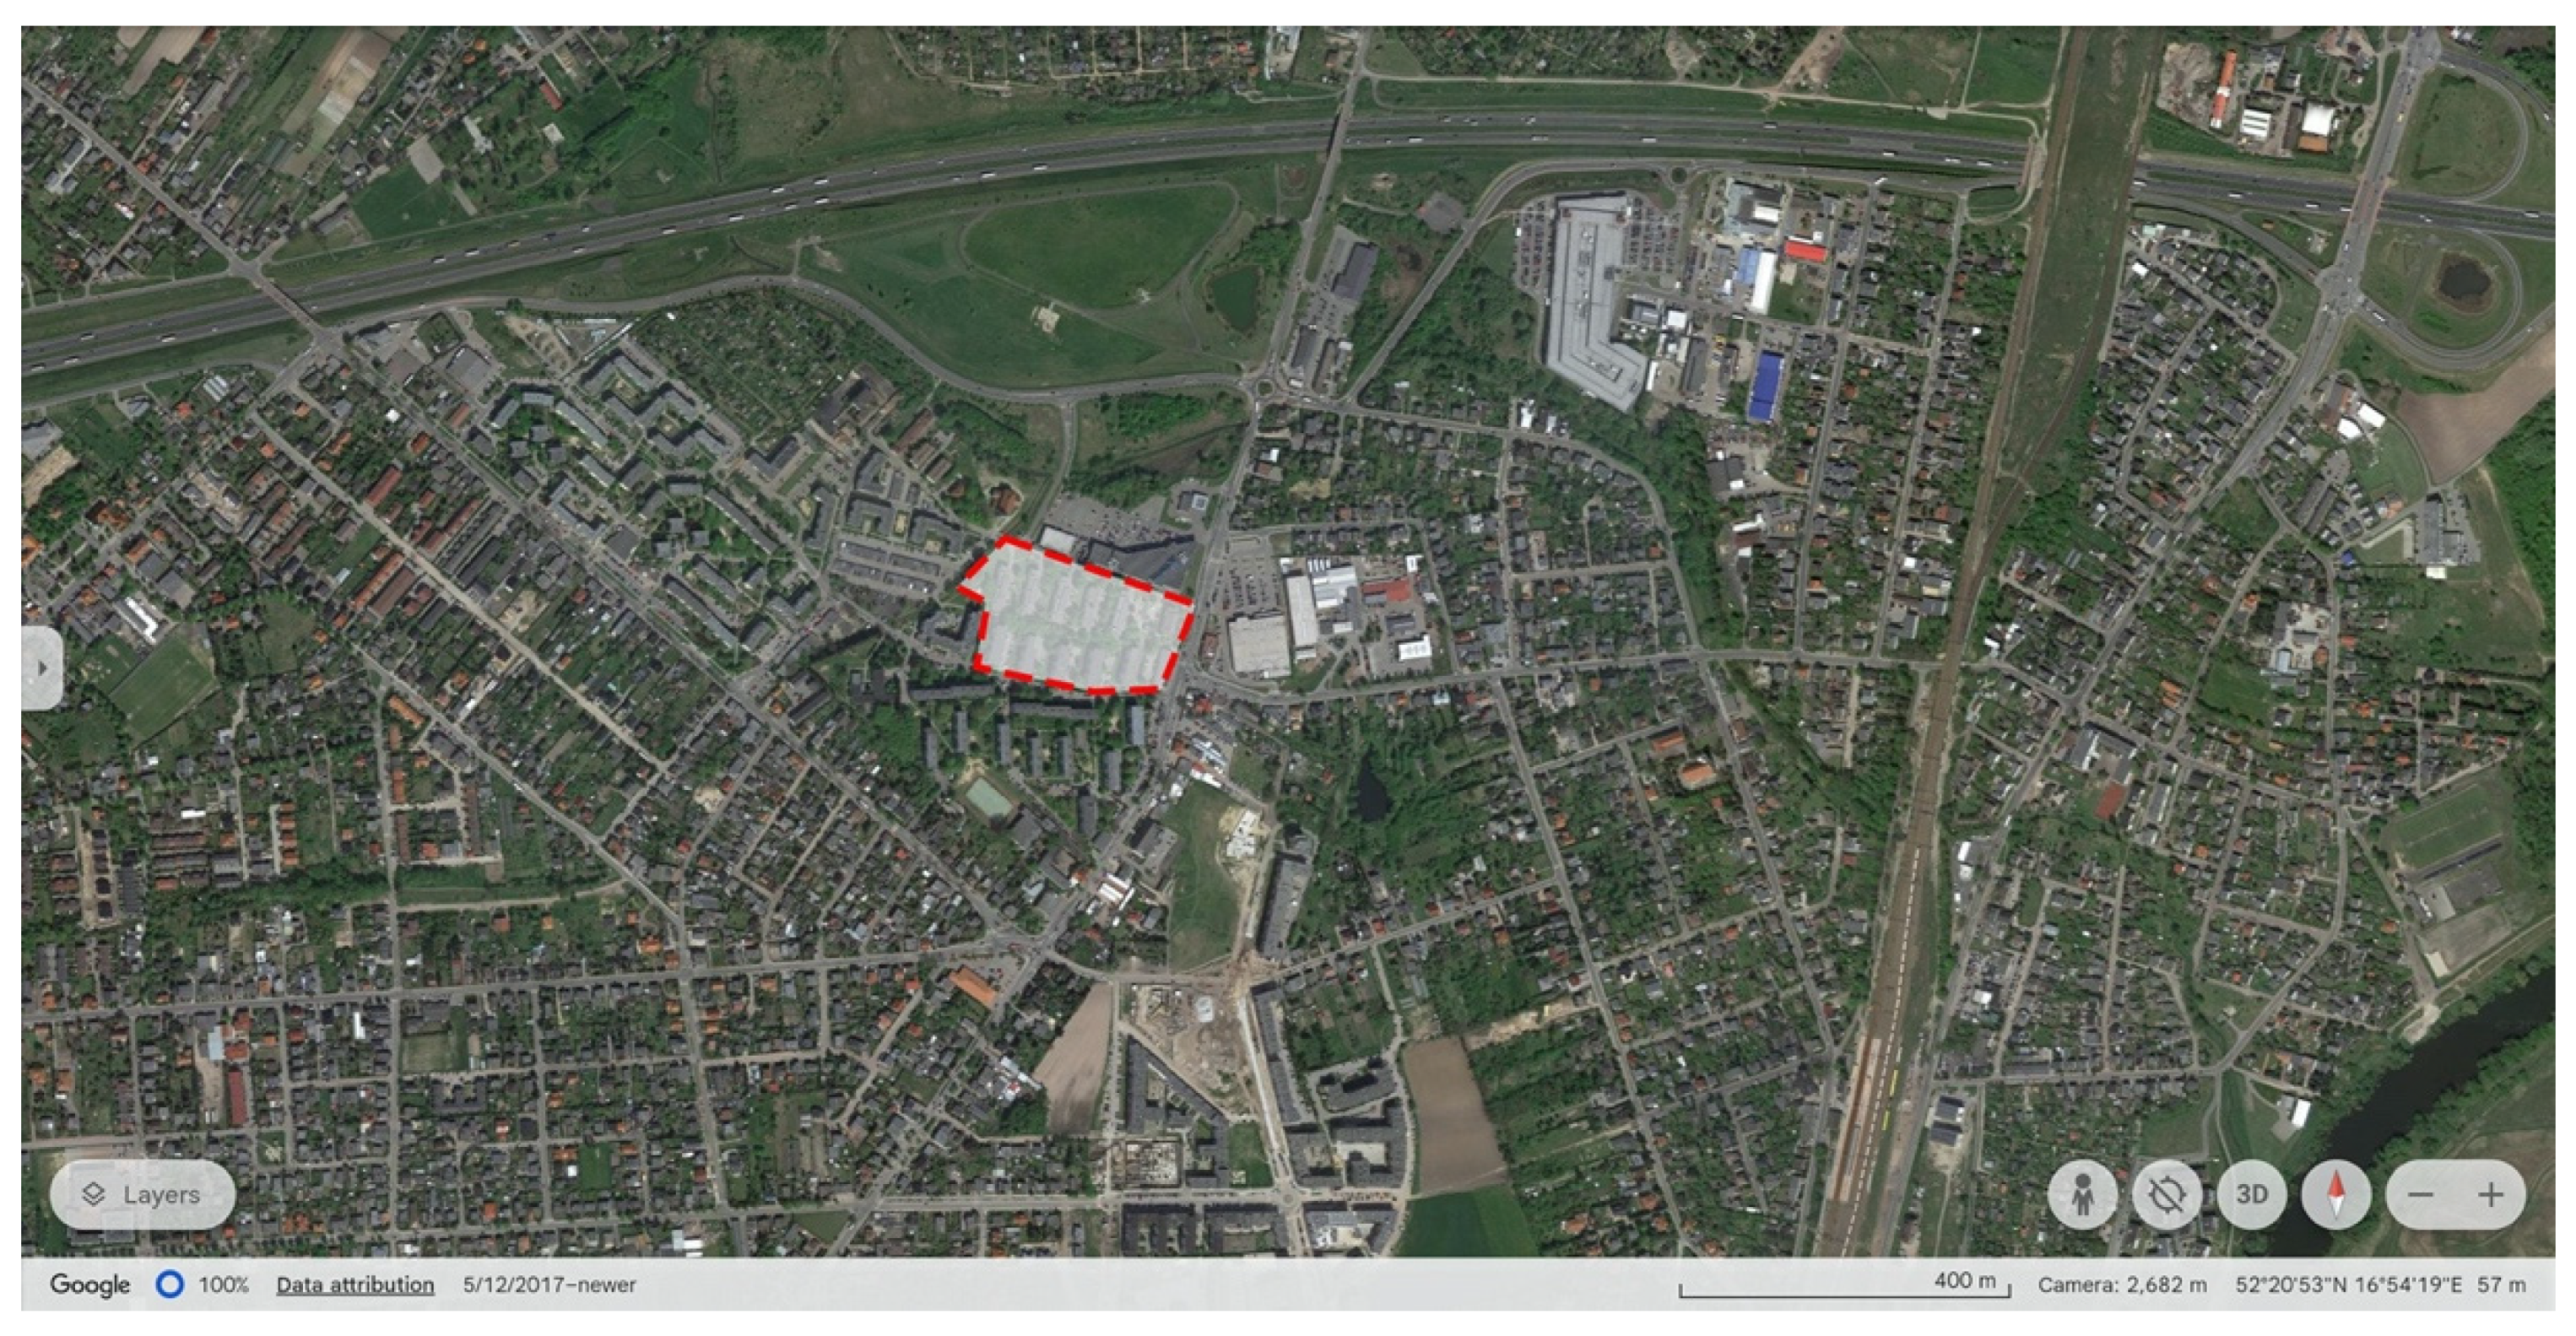
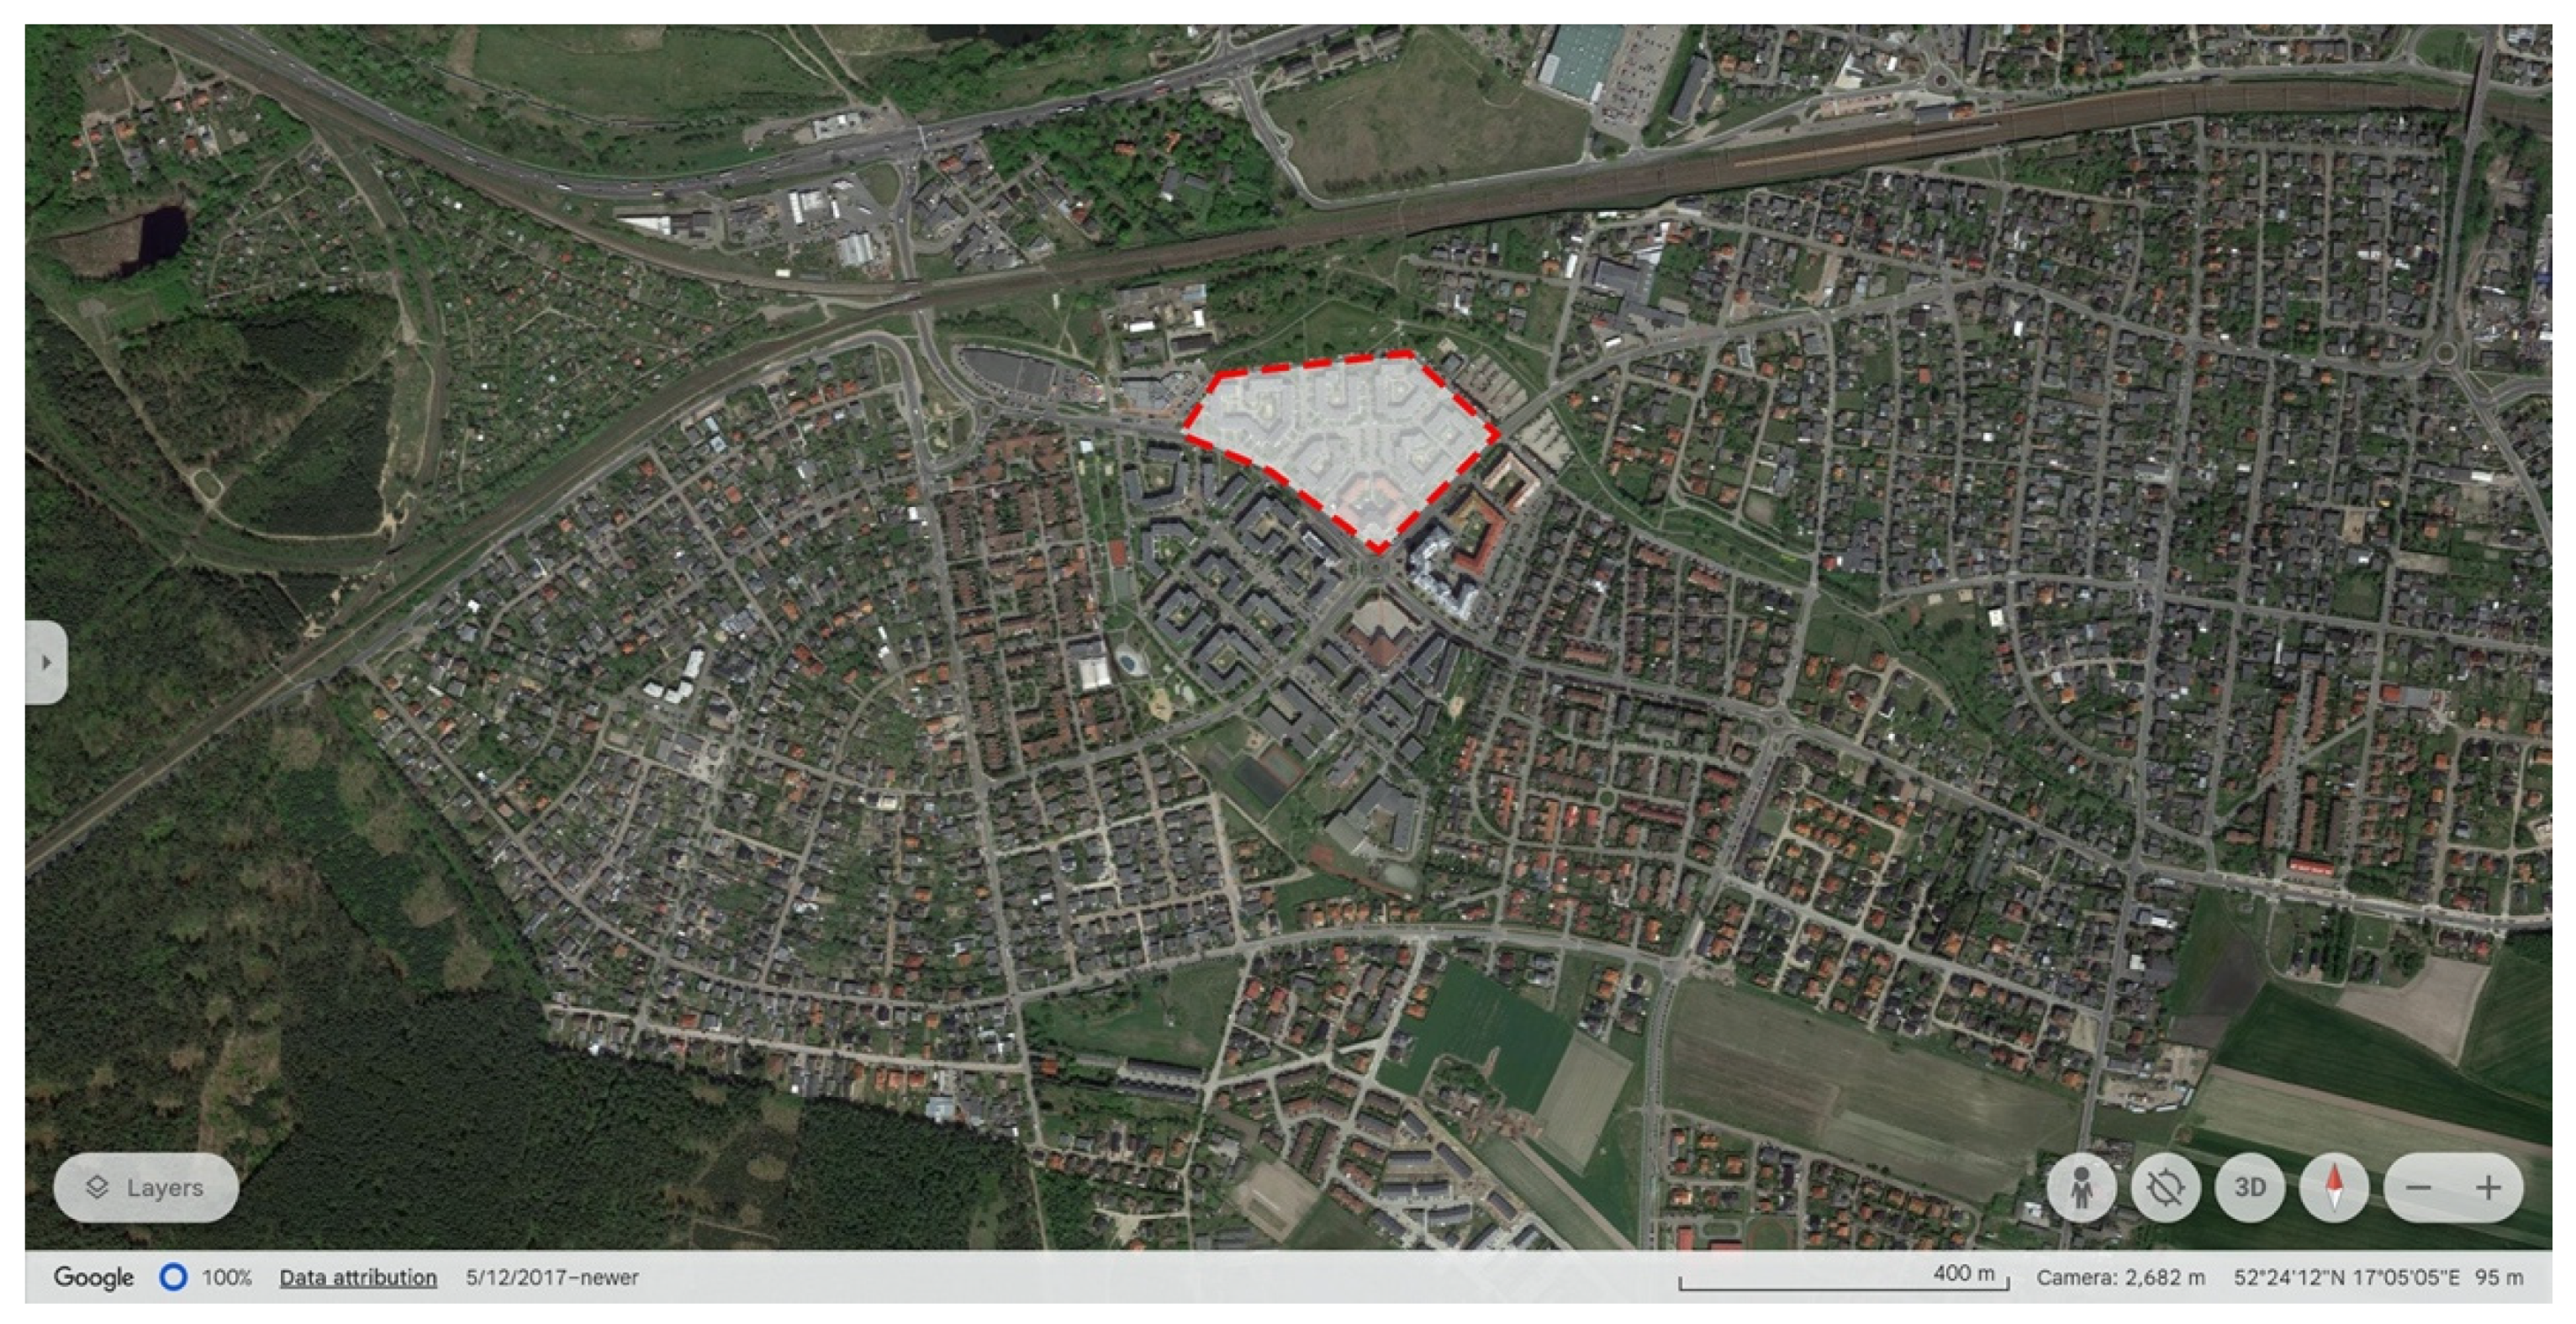
2.1. Introduction of the Six Case Studies

The six case studies include three residential estates realized in the XX century, considered historical, and three other examples erected in the XXI century, considered contemporary. They are separated by a time limit coinciding with Poland’s political and economic transformation in the 1990s. The change in the political system brought significant changes in the field of spatial planning, namely the transition from a centralized to a local government system. It had a significant impact on the way public and private spaces were shaped in residential estates.
Both groups of examples are evenly distributed in terms of chronology. The historical examples are separated by an interval of roughly thirty years and the contemporary ones by ten years. All are multi-family residential estates, possibly including commercial premises on the ground floor. All case studies are situated within the Poznań agglomeration (see Figure 1), as explained above.
In terms of population density, the six case studies are largely similar in that they all fall under the multi-family residential typology category. However, they may differ from their surrounding areas, particularly in the case of newly constructed residential satellites in suburban rural fringes. Establishing the precise number of residents is challenging due to the lack of accurate information possessed by the administrators of residential communities. Residents may not always fulfill their registration obligations, and the influx of individuals caused by migration trends resulting from the ongoing conflict in Ukraine has led to an increase in the study area’s rotation levels. Consequently, the number of residents is assessed by comparing the available data on the number of apartments and the average number of people per household in the communes. The data source for the demographic indicators used in this analysis was Statistics Poland [74]. Apartment numbers were counted based on architectural documentation, information provided by property administrators, and verified during the site visits. The calculations provided are approximate in nature and are intended for illustration purposes only.

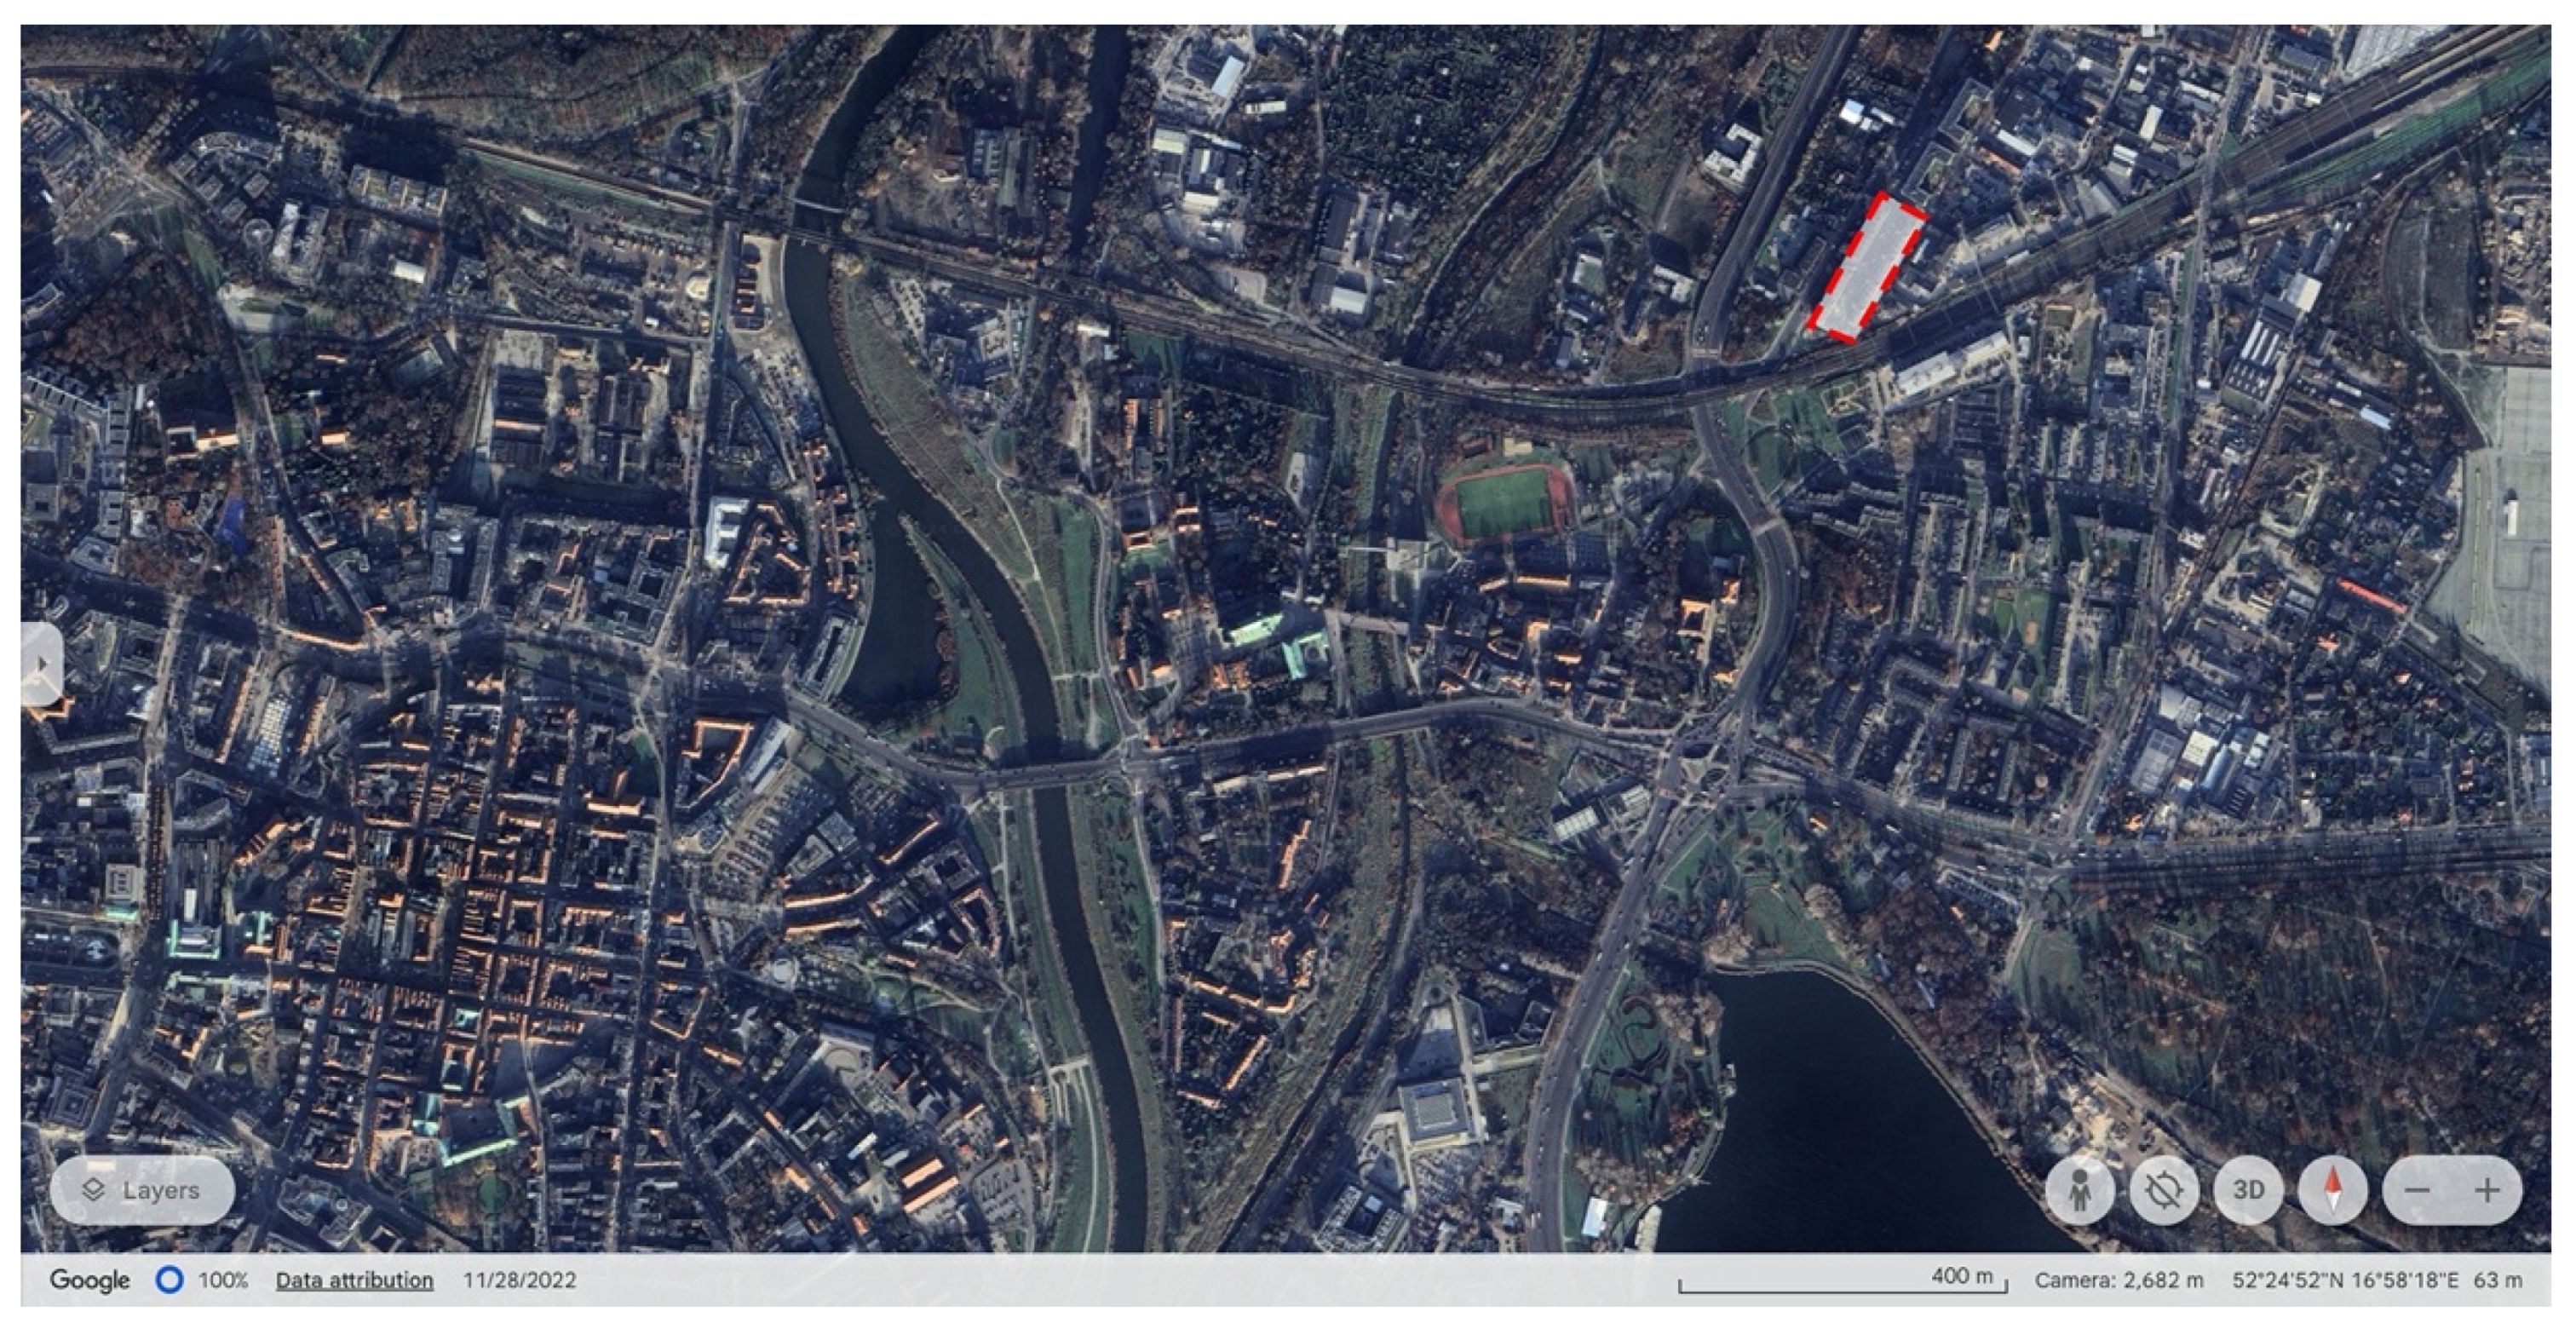
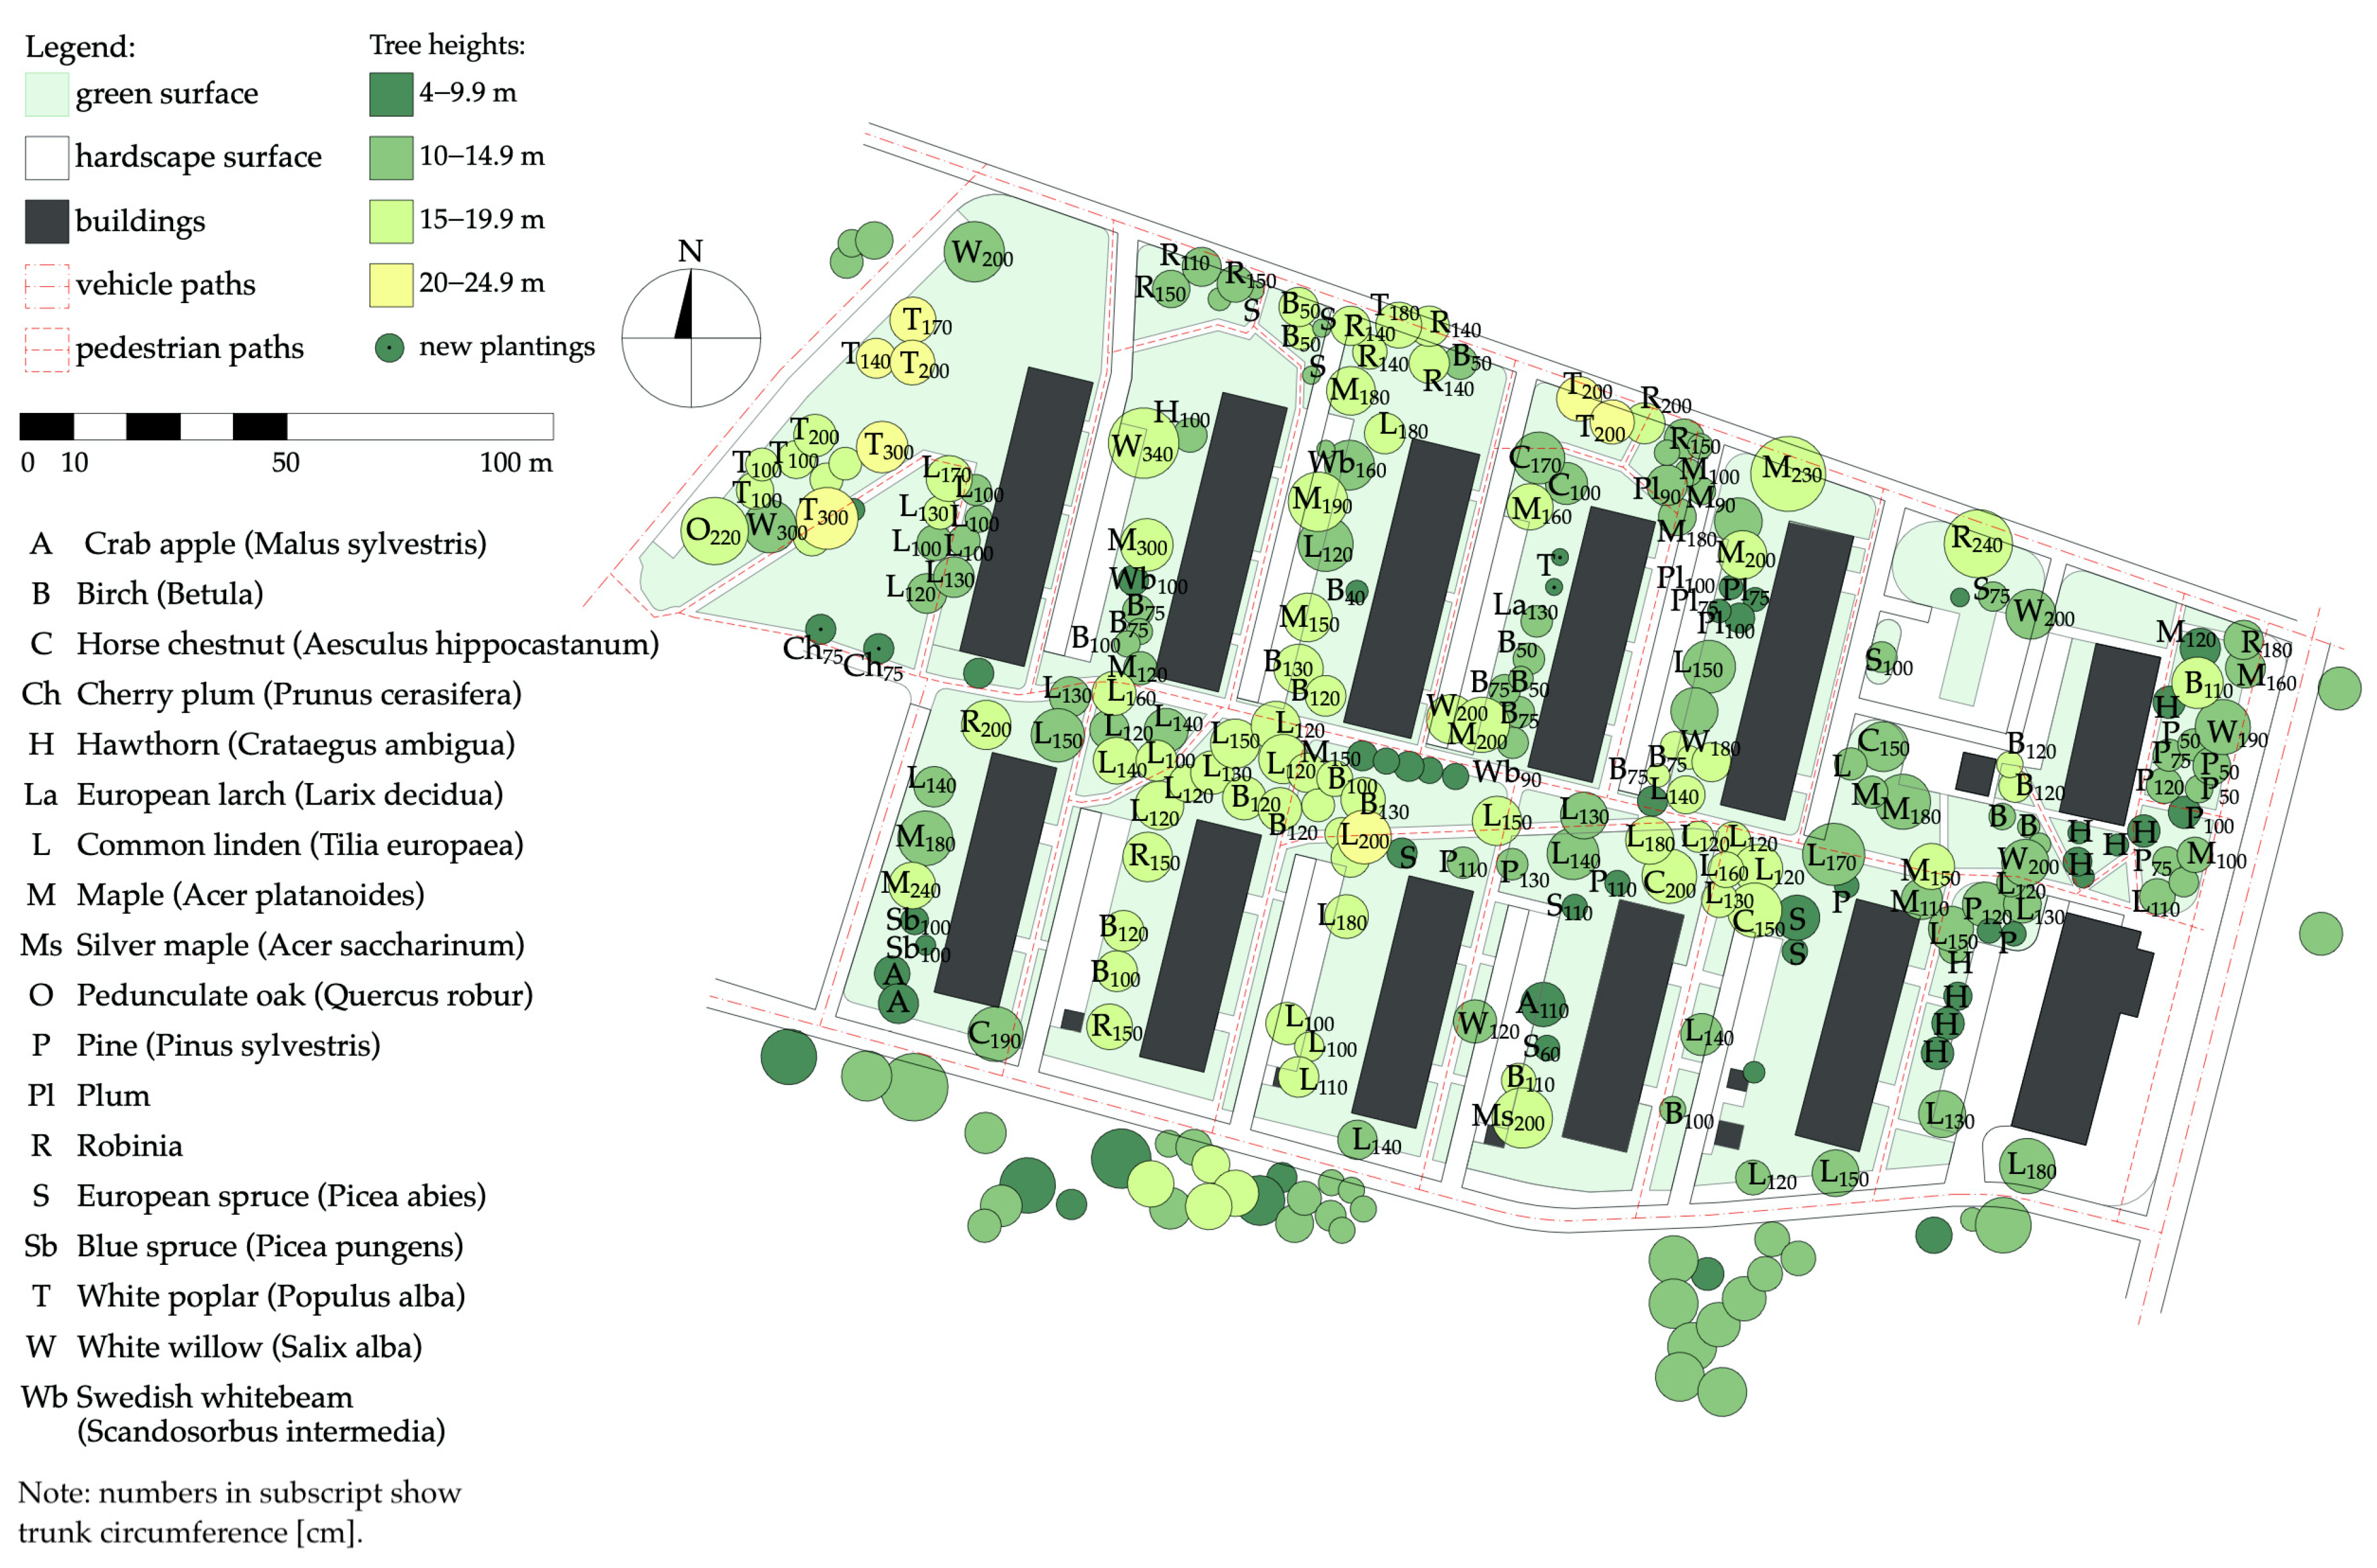
2.1.1. Zawady, Poznań, 1930s

Chronologically, the first example analyzed is a multi-family residential district situated at Zawady in Poznań (Figure 2 and Figure 3). The estate’s location, in the northeast of the contemporary agglomeration, used to have a suburban character at the time of its erection in the late 1930s. Zawady was a typical suburban working-class housing estate of the epoch, consisting of three deck-access blocks with a repetitive typology of small flats, usually below 38 m2 [75].
The property consists of three blocks, comprising a total of 176 homes, as determined through functional layout analysis by the authors. The average number of occupants per dwelling in the area was 1.82 in 2022 [74]. This suggests a total occupancy of approximately 320 individuals, with a corresponding density of around 232 people per hectare. For comparison, the average population density in the administrative unit (city of Poznań) in the same year equaled 20.67 people per hectare [74].
A typical public space in this estate consists of a sidewalk separated from the road by a green belt. The streetscape includes numerous mature and sized trees belonging to a few native species, such as ash, maple, or spruce. What is characteristic of the district is that it was designed with pedestrians in mind, not cars. For this reason, the space between the buildings is filled with more greenery than paved parking surfaces.

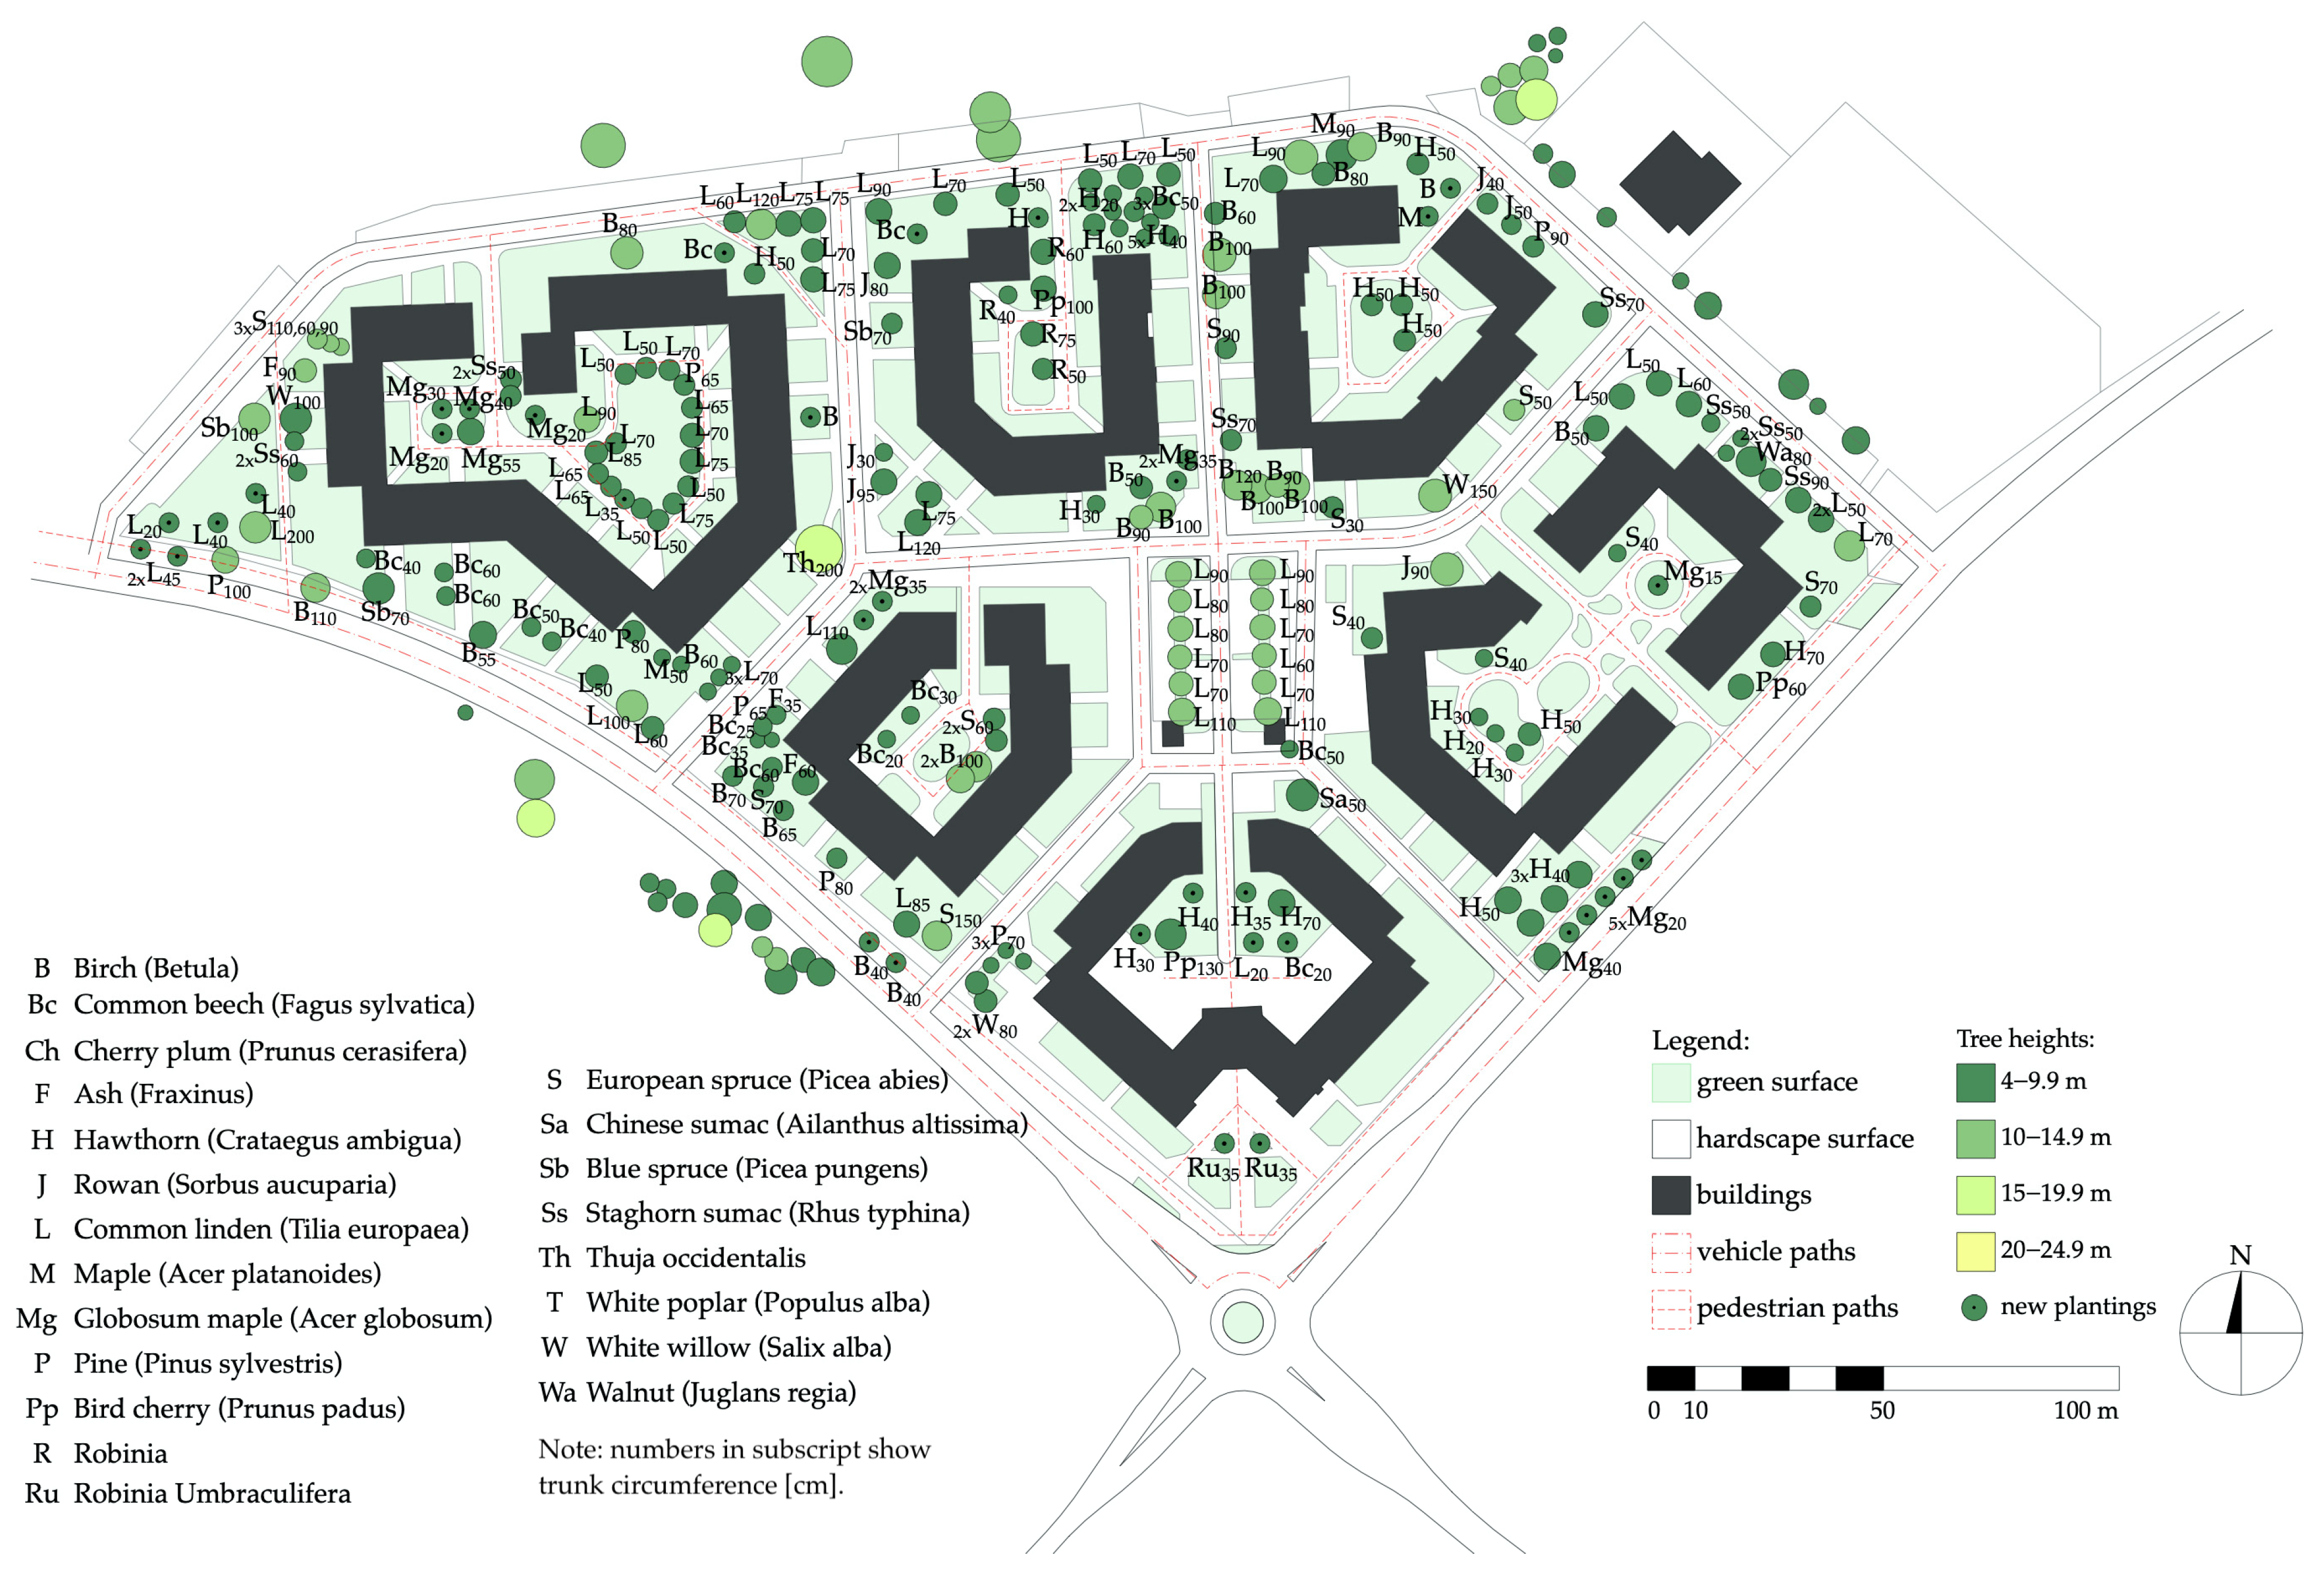
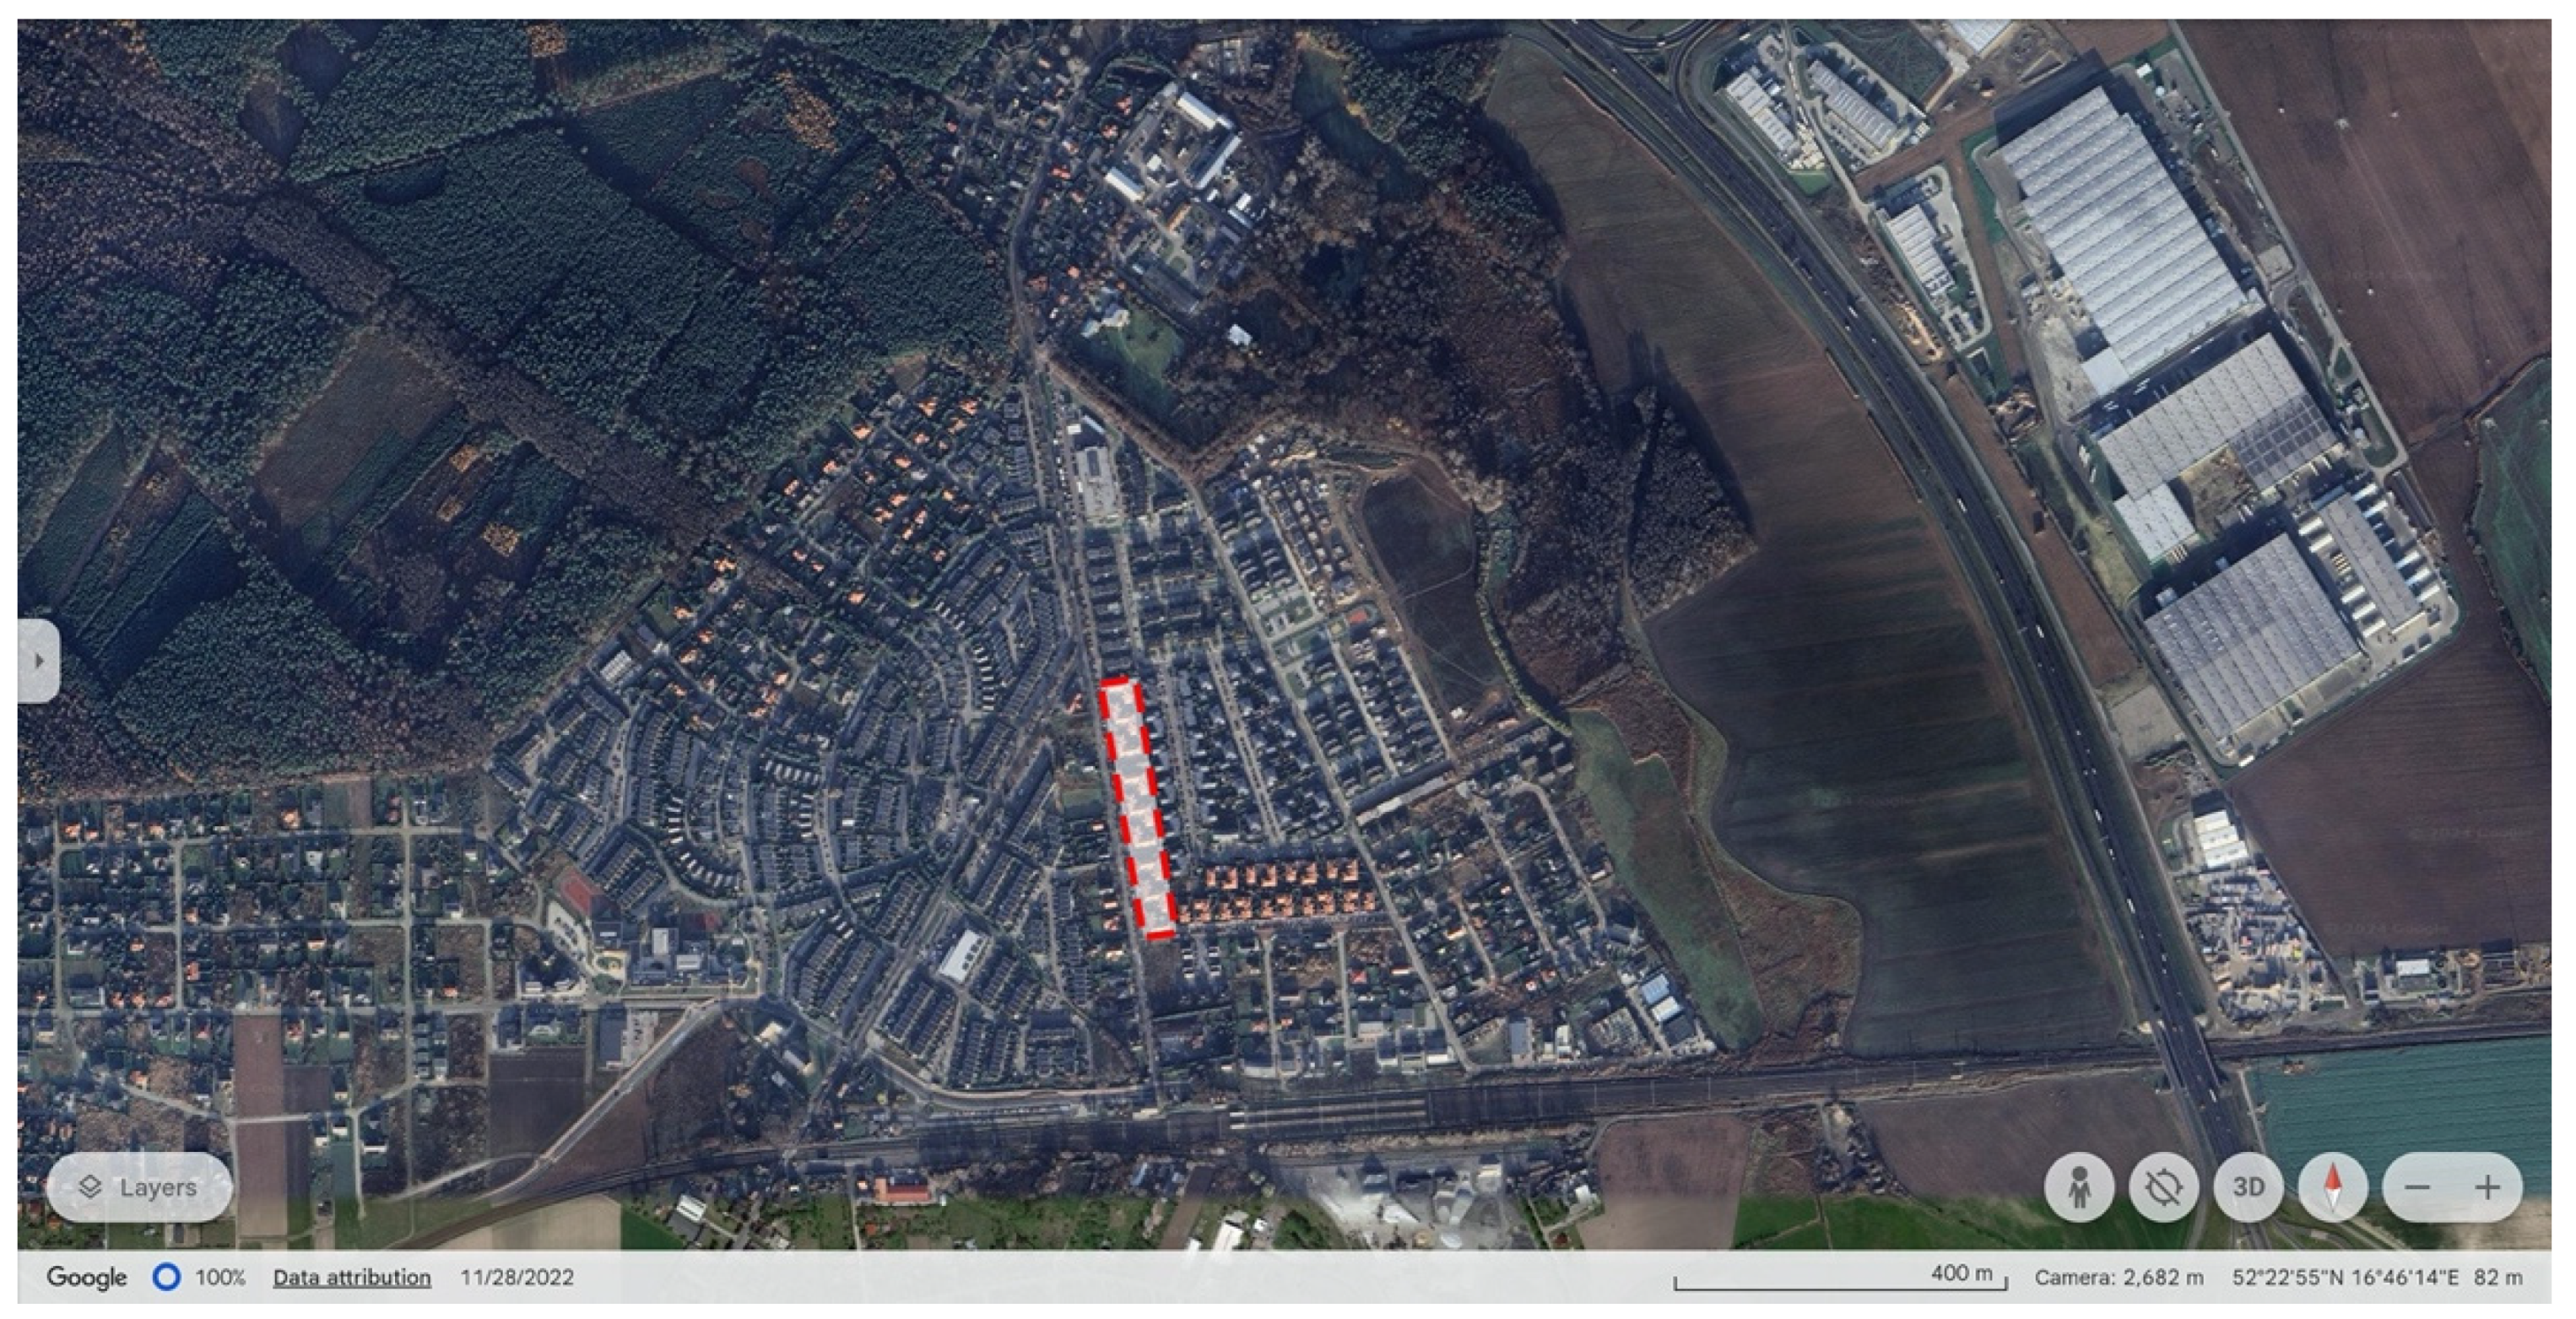
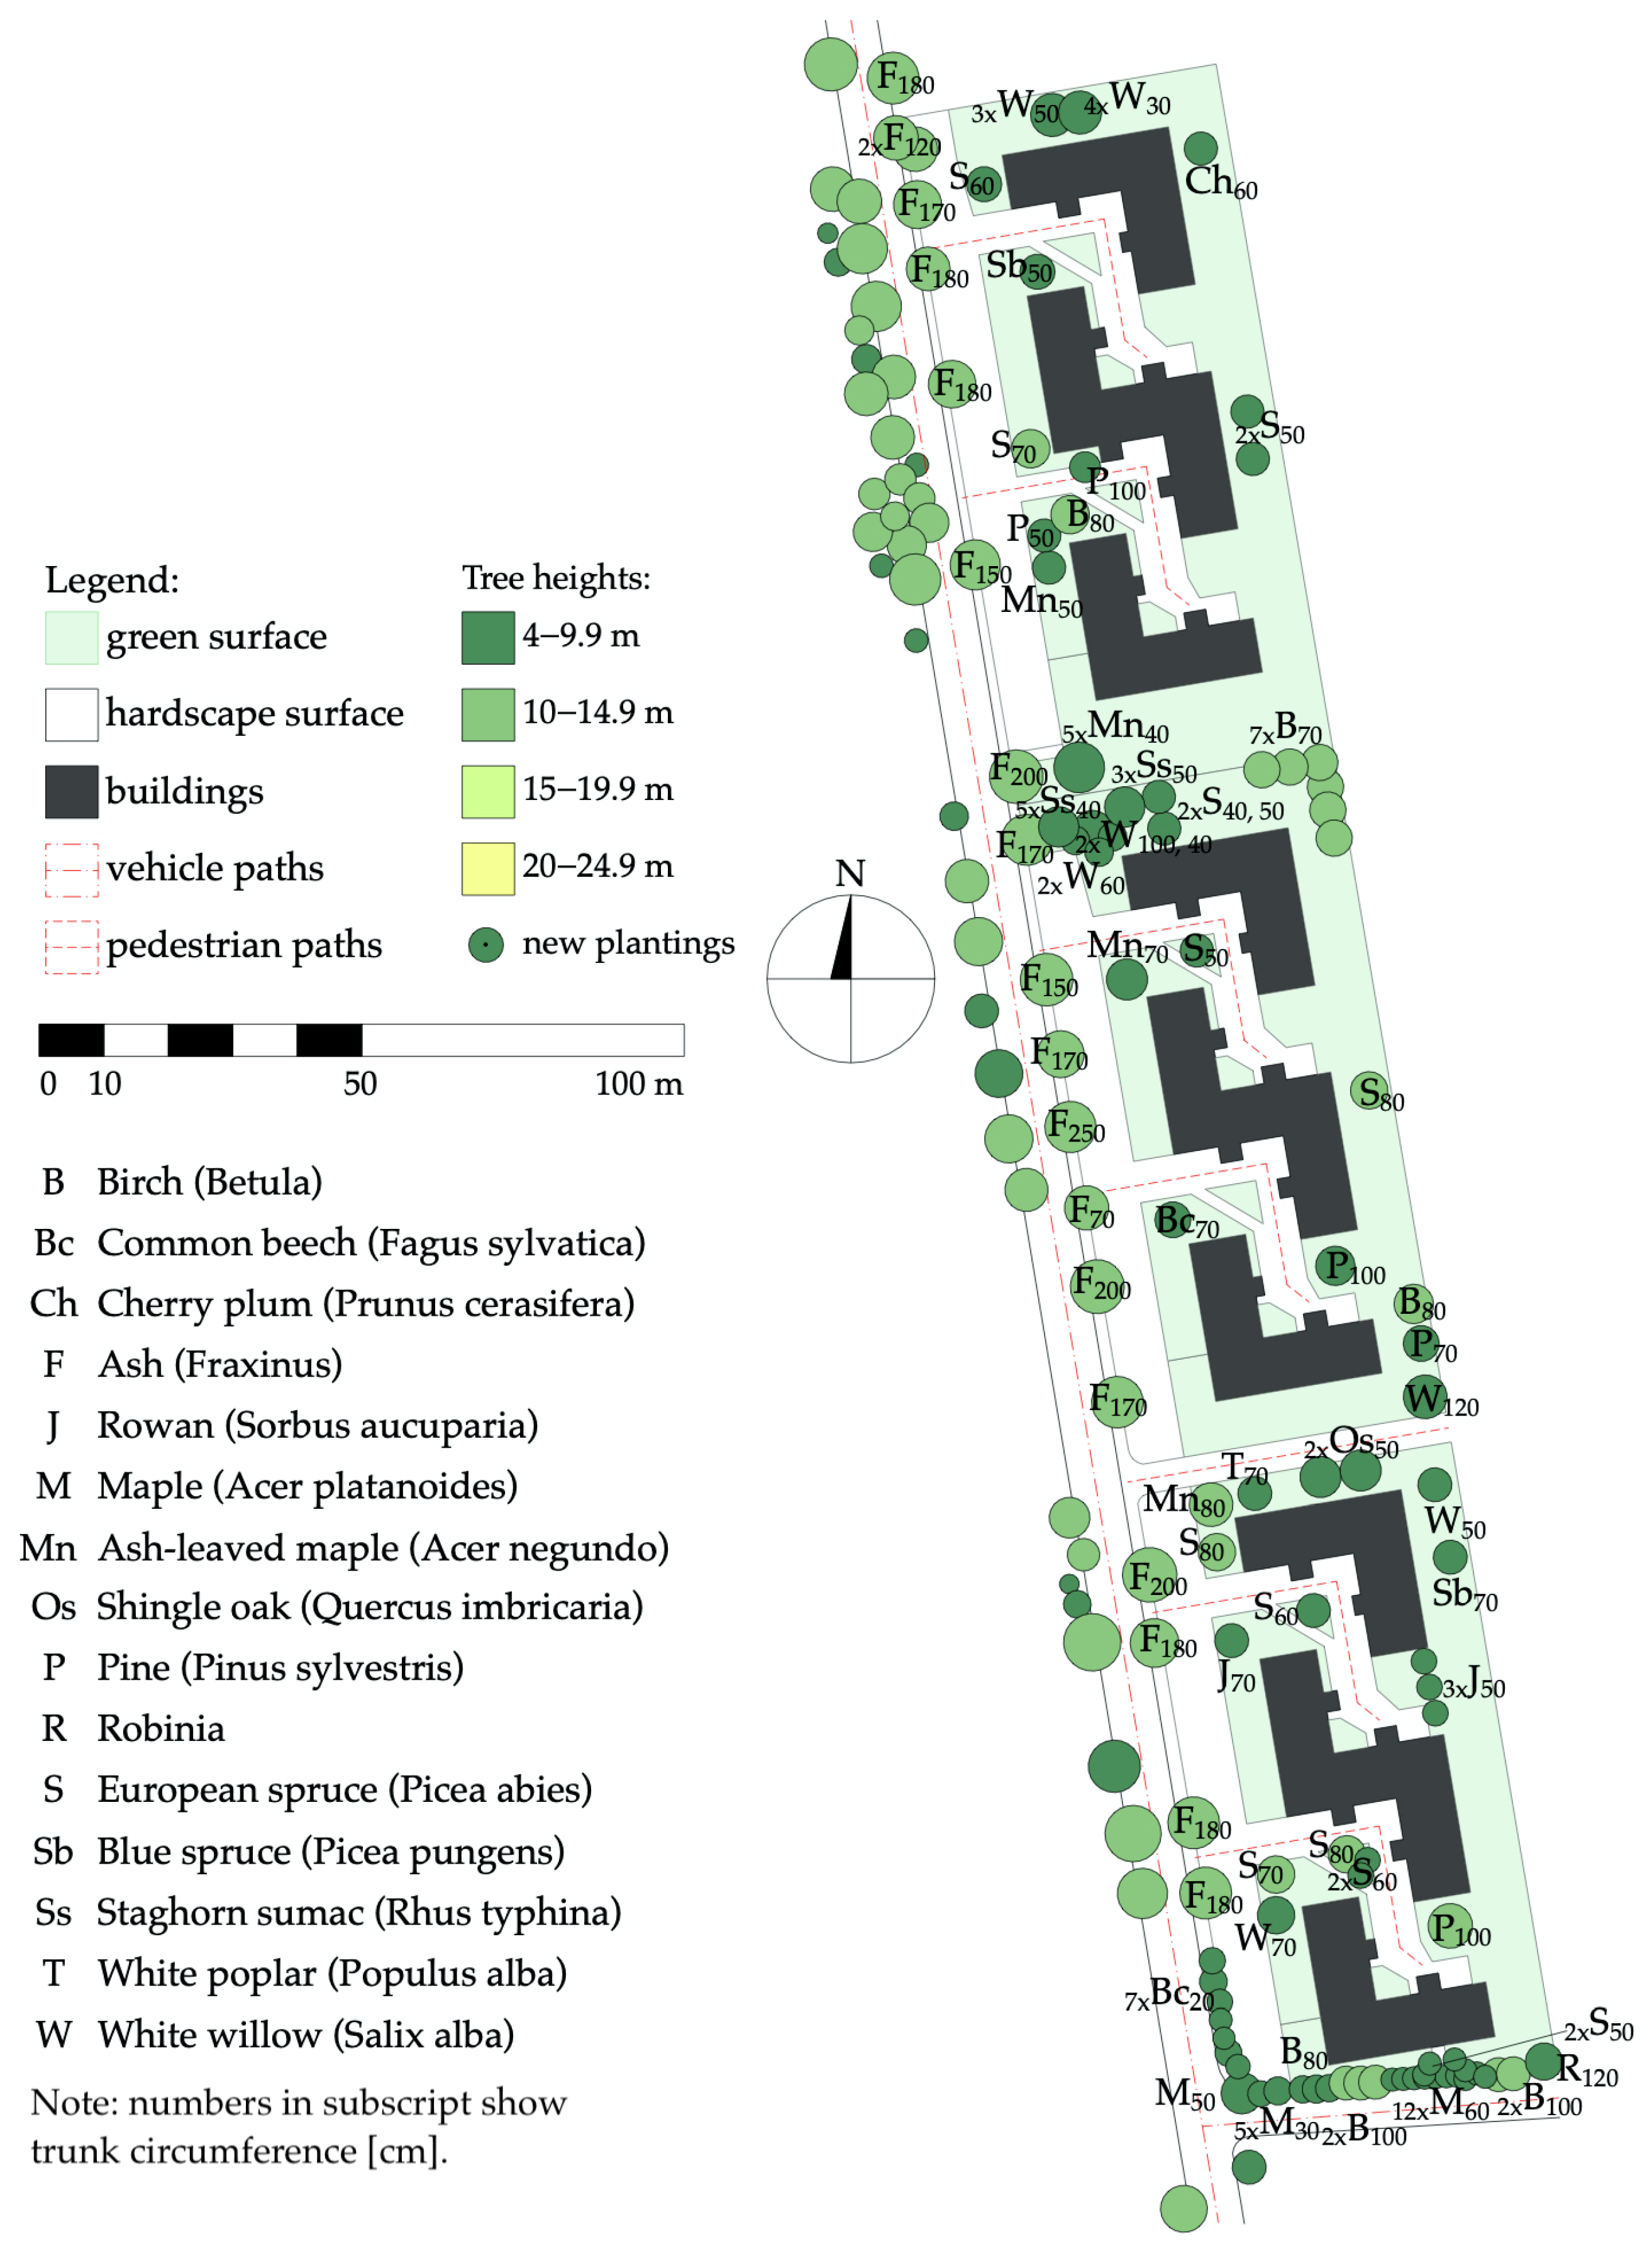
2.1.2. Lubonianka, Luboń, 1960s

As it stands nowadays, the construction of the Lubonianka housing estate (Figure 4 and Figure 5) was achieved within three decades. This study will consider its most original part, realized from 1963 until the early 1970s. The estate was erected due to the housing development strategy managed by the enterprise of the potato industry in Greater Poland. The dominating housing typology is two- and three-room apartments accessed from internal communication.
The area concerned consists of one public utility building and eleven housing blocks, comprising a total of 440 flats, as determined based on data provided by the estate’s administration. The average number of occupants per apartment in the area was 2.60 in 2022 [74]. This suggests a total occupancy of approximately 1144 individuals, with a corresponding density of around 301 people per hectare. For comparison, the average population density in the administrative unit (commune) in the same year equaled 24.31 people per hectare [74].
Both spatial planning and construction practices at the time when the Luboninka estate was built were not famous for their care for the environment. Nevertheless, a relatively large area of free land was left between the residential buildings, with only narrow pedestrian paths marked out and paved. Over time, several beautiful trees have grown here; some might be considered specimens of native tree species.

2.1.3. Cegielskiego Estate, Swarzędz, 1990s

The Cegielskiego estate in Swarzędz (Figure 6 and Figure 7), east of Poznań, was erected in the 1990s during Poland’s transformation from socialism to the democratic governance model. As a result of a complex economic and political situation, the design combines big slab technology, popular in the previous two decades, with some postmodern amendments, such as sloped roofs. The typology of the flats follows standards that were popular in previous decades, reaching typical sizes of about 50–60 m2 for a flat with 2–3 rooms. The apartments have a balcony as standard, which shapes the estate’s architecture.
The district consists of six large-scale blocks, comprising a total of 654 homes, as announced by the estate administration. The average number of occupants per dwelling in the area was 2.61 in 2022 [74]. This suggests a total occupancy of approximately 1707 individuals, with a corresponding density of around 343 people per hectare. For comparison, the average population density in the administrative unit (commune) in the same year equaled 5.52 people per hectare [74].
The estate’s layout is based on the typology of urban quarters, with semi-private interior spaces dedicated to the residents. The division into pedestrian and driving zones is rather evident and pragmatic, with vehicle communication kept on the perimeter of the urban blocks. The streetscape across the district combines formal attempts to organize the space (e.g., lime tree alley in the center) with a large number and variety of self-seeders or trees planted by residents. The result is a relatively large diversity in the tree species, but often in a deplorable biological condition.

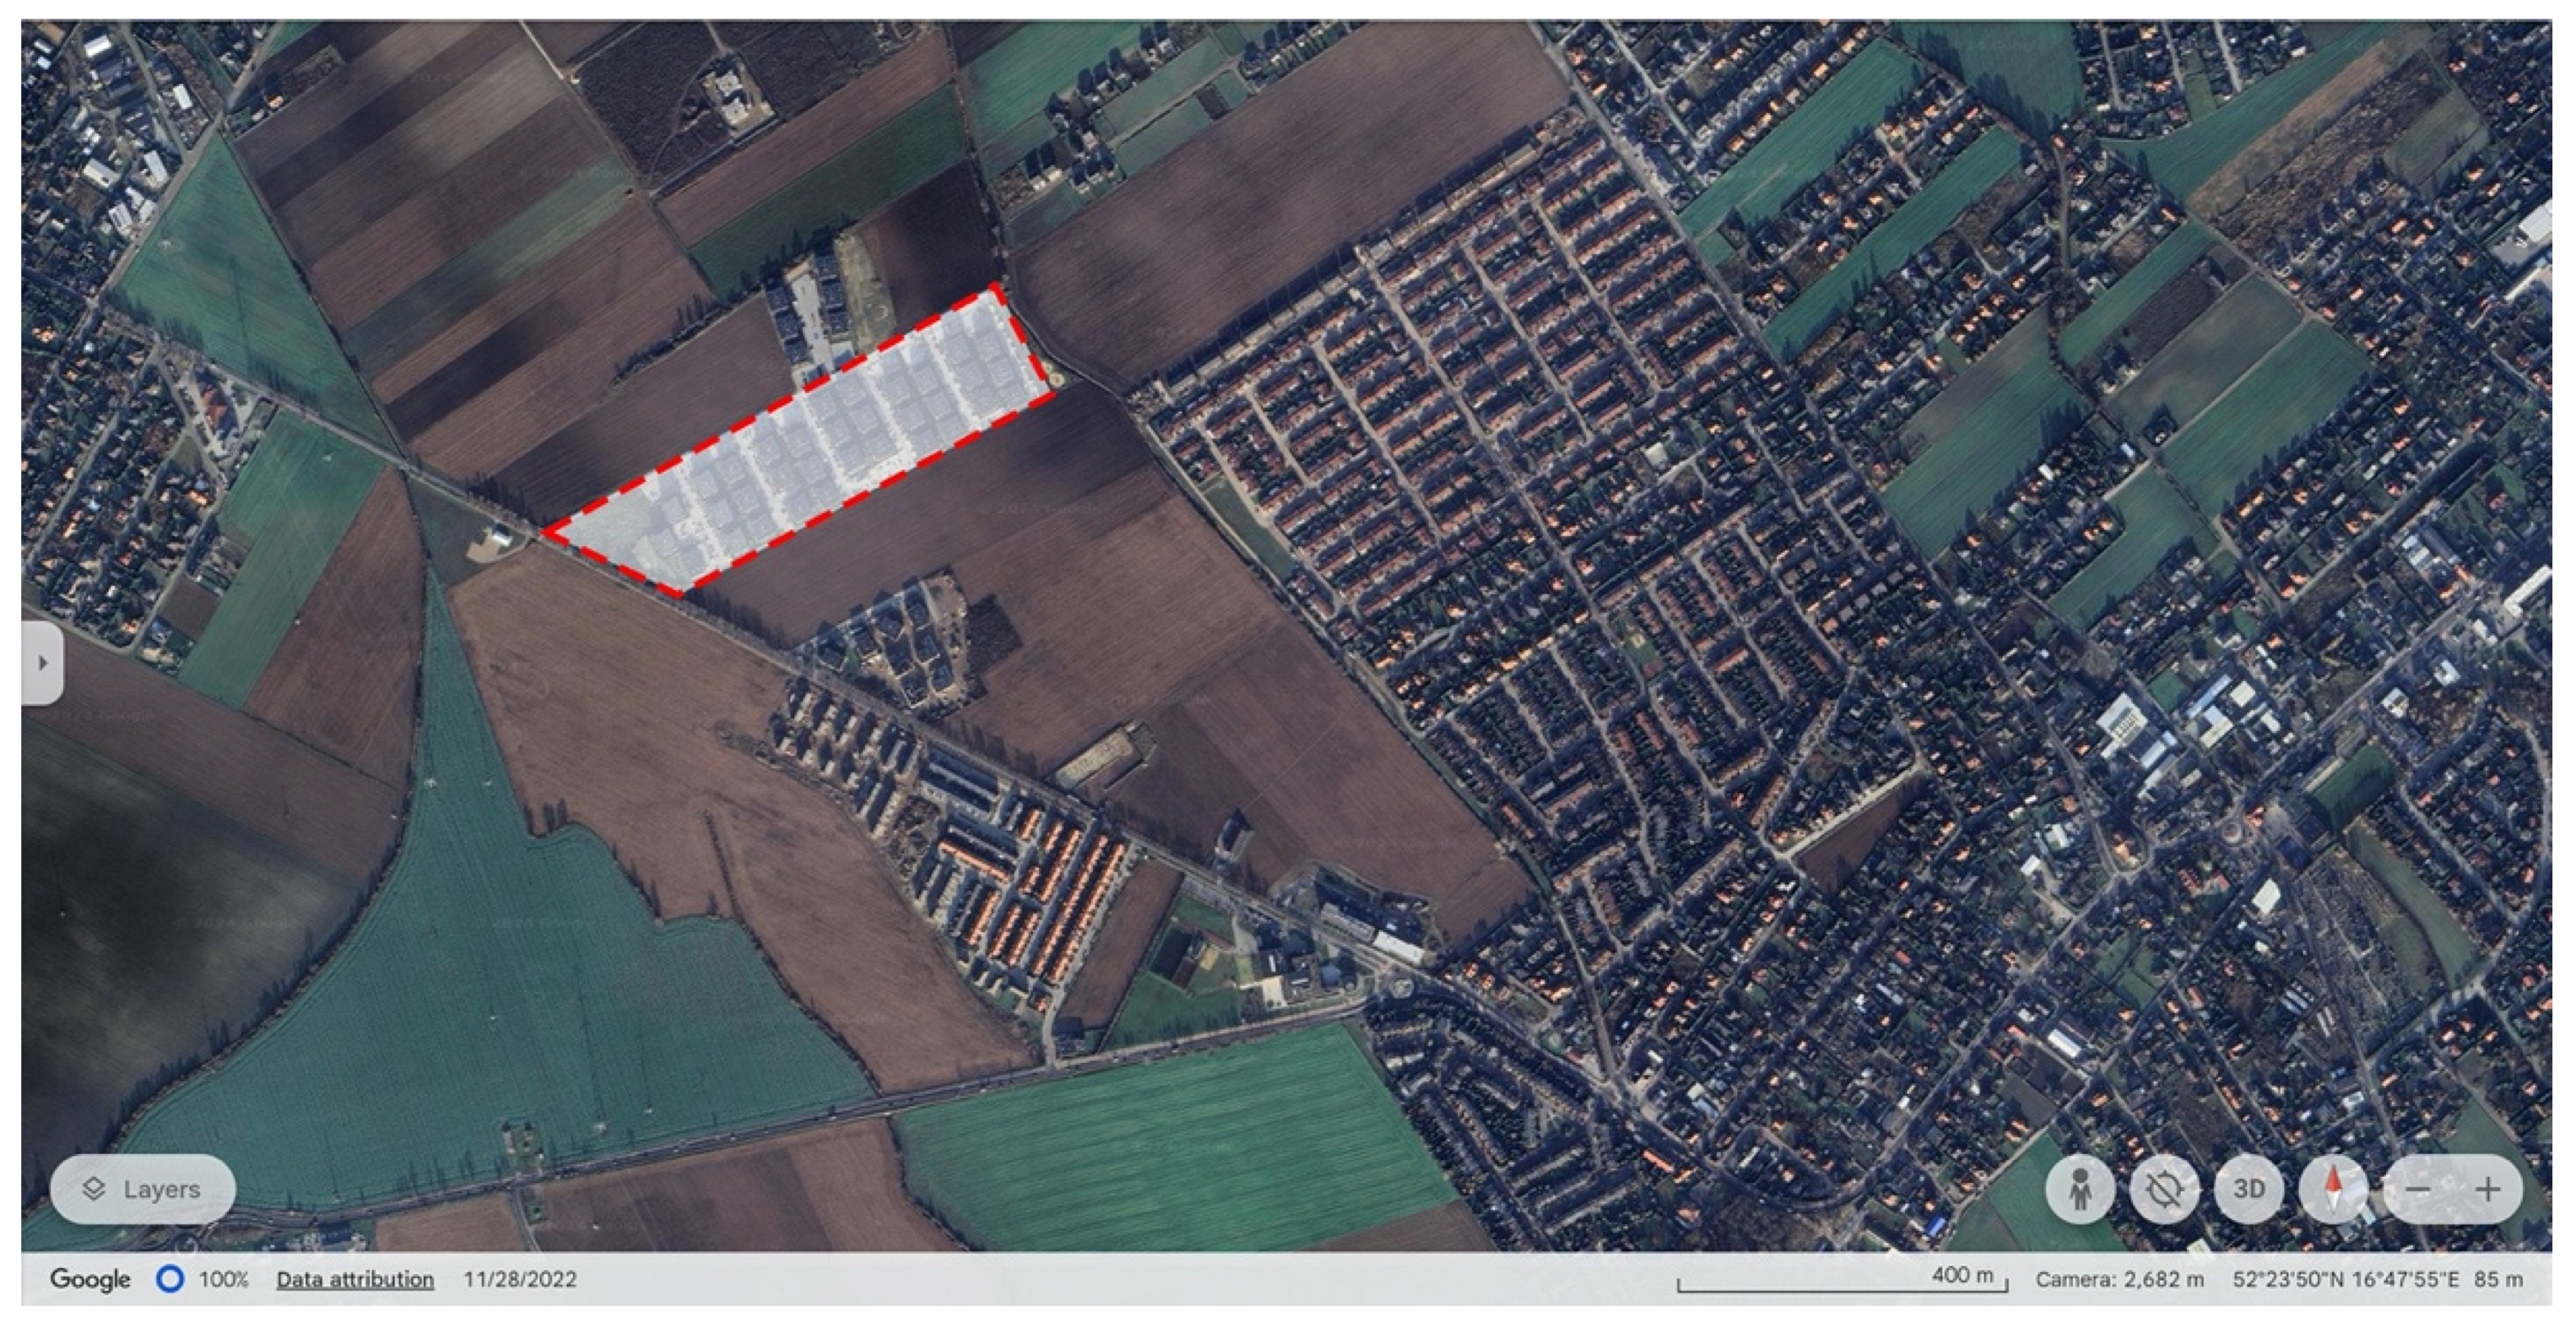
2.1.4. Kolejowa Street, Dąbrówka, 2000s

The residential estate located at Kolejowa Street (Figure 8 and Figure 9) in Dąbrówka near Poznań is the oldest part of a large-scale investment that is still under development. Because the residential blocks’ layout and design have changed over the past two decades, this study considers only the oldest part of the district, constructed in about the year 2000. This stage consists of repetitive layouts of three L- and Z-shaped low-rise buildings with sloped roofs. The buildings only have two stories, and one of the main assumptions of the concept was the direct access to the garden. The district has a fenced common area with a private access road and parking lots.
The estate consists of nine buildings, comprising a total of 120 homes, as determined through functional layout analysis by the authors. The average number of occupants per dwelling in the area was 2.82 in 2022 [74]. This suggests a total occupancy of approximately 338 individuals, with a corresponding density of around 211 people per hectare. For comparison, the average population density in the administrative unit (commune) in the same year equaled 3.23 people per hectare [74].
The district’s layout creates clear enclaves and pocket gardens reserved for residents. A characteristic feature of the urban layout is the location of fenced parking lots on the access road. From the parking lot, residents walk to their enclaves. This way of organizing and dividing space is quite characteristic of the neighborhood’s time-space when the emphasis was on privacy and ownership protection.

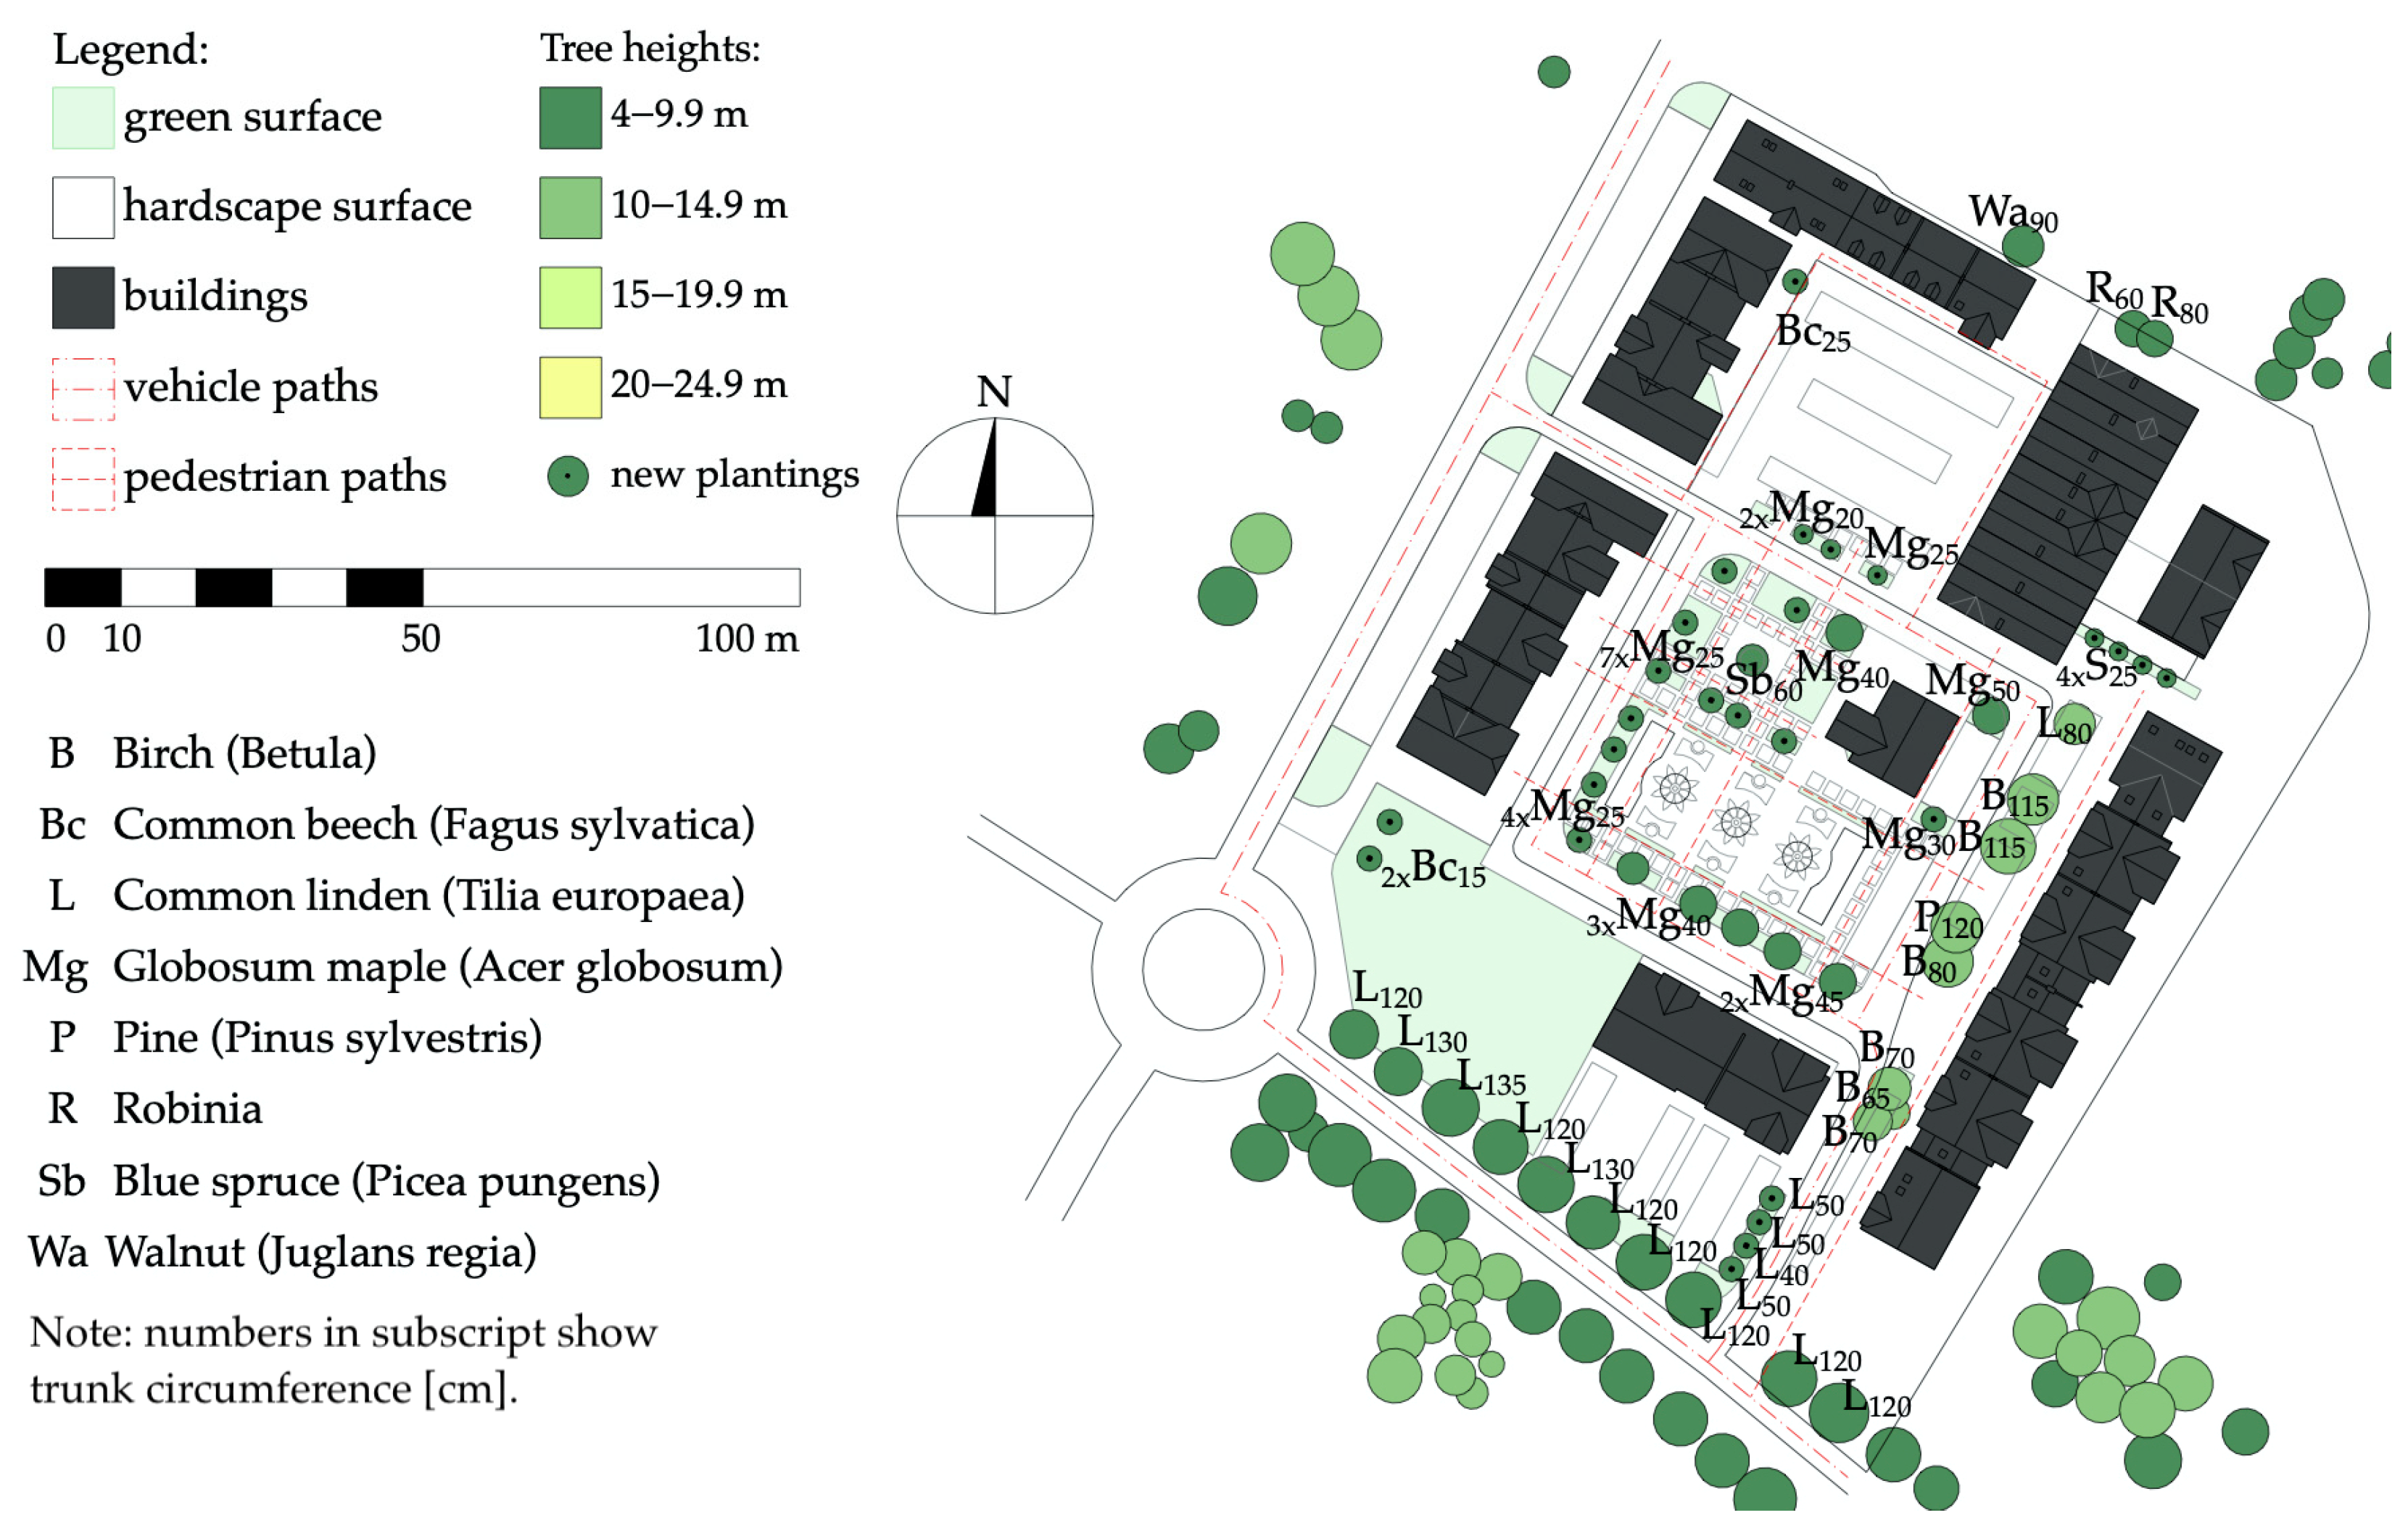
2.1.5. Rynek (Market Square), Puszczykowo, 2010s

The development of the market square in Puszczykowo (Figure 10 and Figure 11) was planned from the beginning of the XXI century. The project expressed the urban aspirations of the municipality, which, for many decades, was a popular suburban summer resort and village. The investment is a mixed-use estate, combining residential premises (flats of about 40–80 m2) with commerce and services. The ensemble was realized in a style imitating vernacular architecture at the beginning of the 2010s. This new market square in Puszczykowo is not an isolated case. Several other investments of this type have been realized in recent decades in the villages throughout Poznań’s metropolitan area [77].
The complex consists of four lines of row houses and one block of flats, comprising a total of 44 homes, as determined through functional layout analysis by the authors. The average number of occupants per dwelling in the area was 2.93 in 2022 [74]. This suggests a total occupancy of approximately 129 individuals, with a corresponding density of around 82 people per hectare. For comparison, the average population density in the administrative unit (commune) in the same year equaled 5.72 people per hectare [74].
The new market square was intended to be the town’s public salon, and its arrangement and equipment were subordinated to this intention. The surface was almost entirely paved with concrete or cobblestones, and the greenery was designed as flower beds with decorative grafted tree species. Although the space is recognized for its visual quality, it is not popular among residents [78].

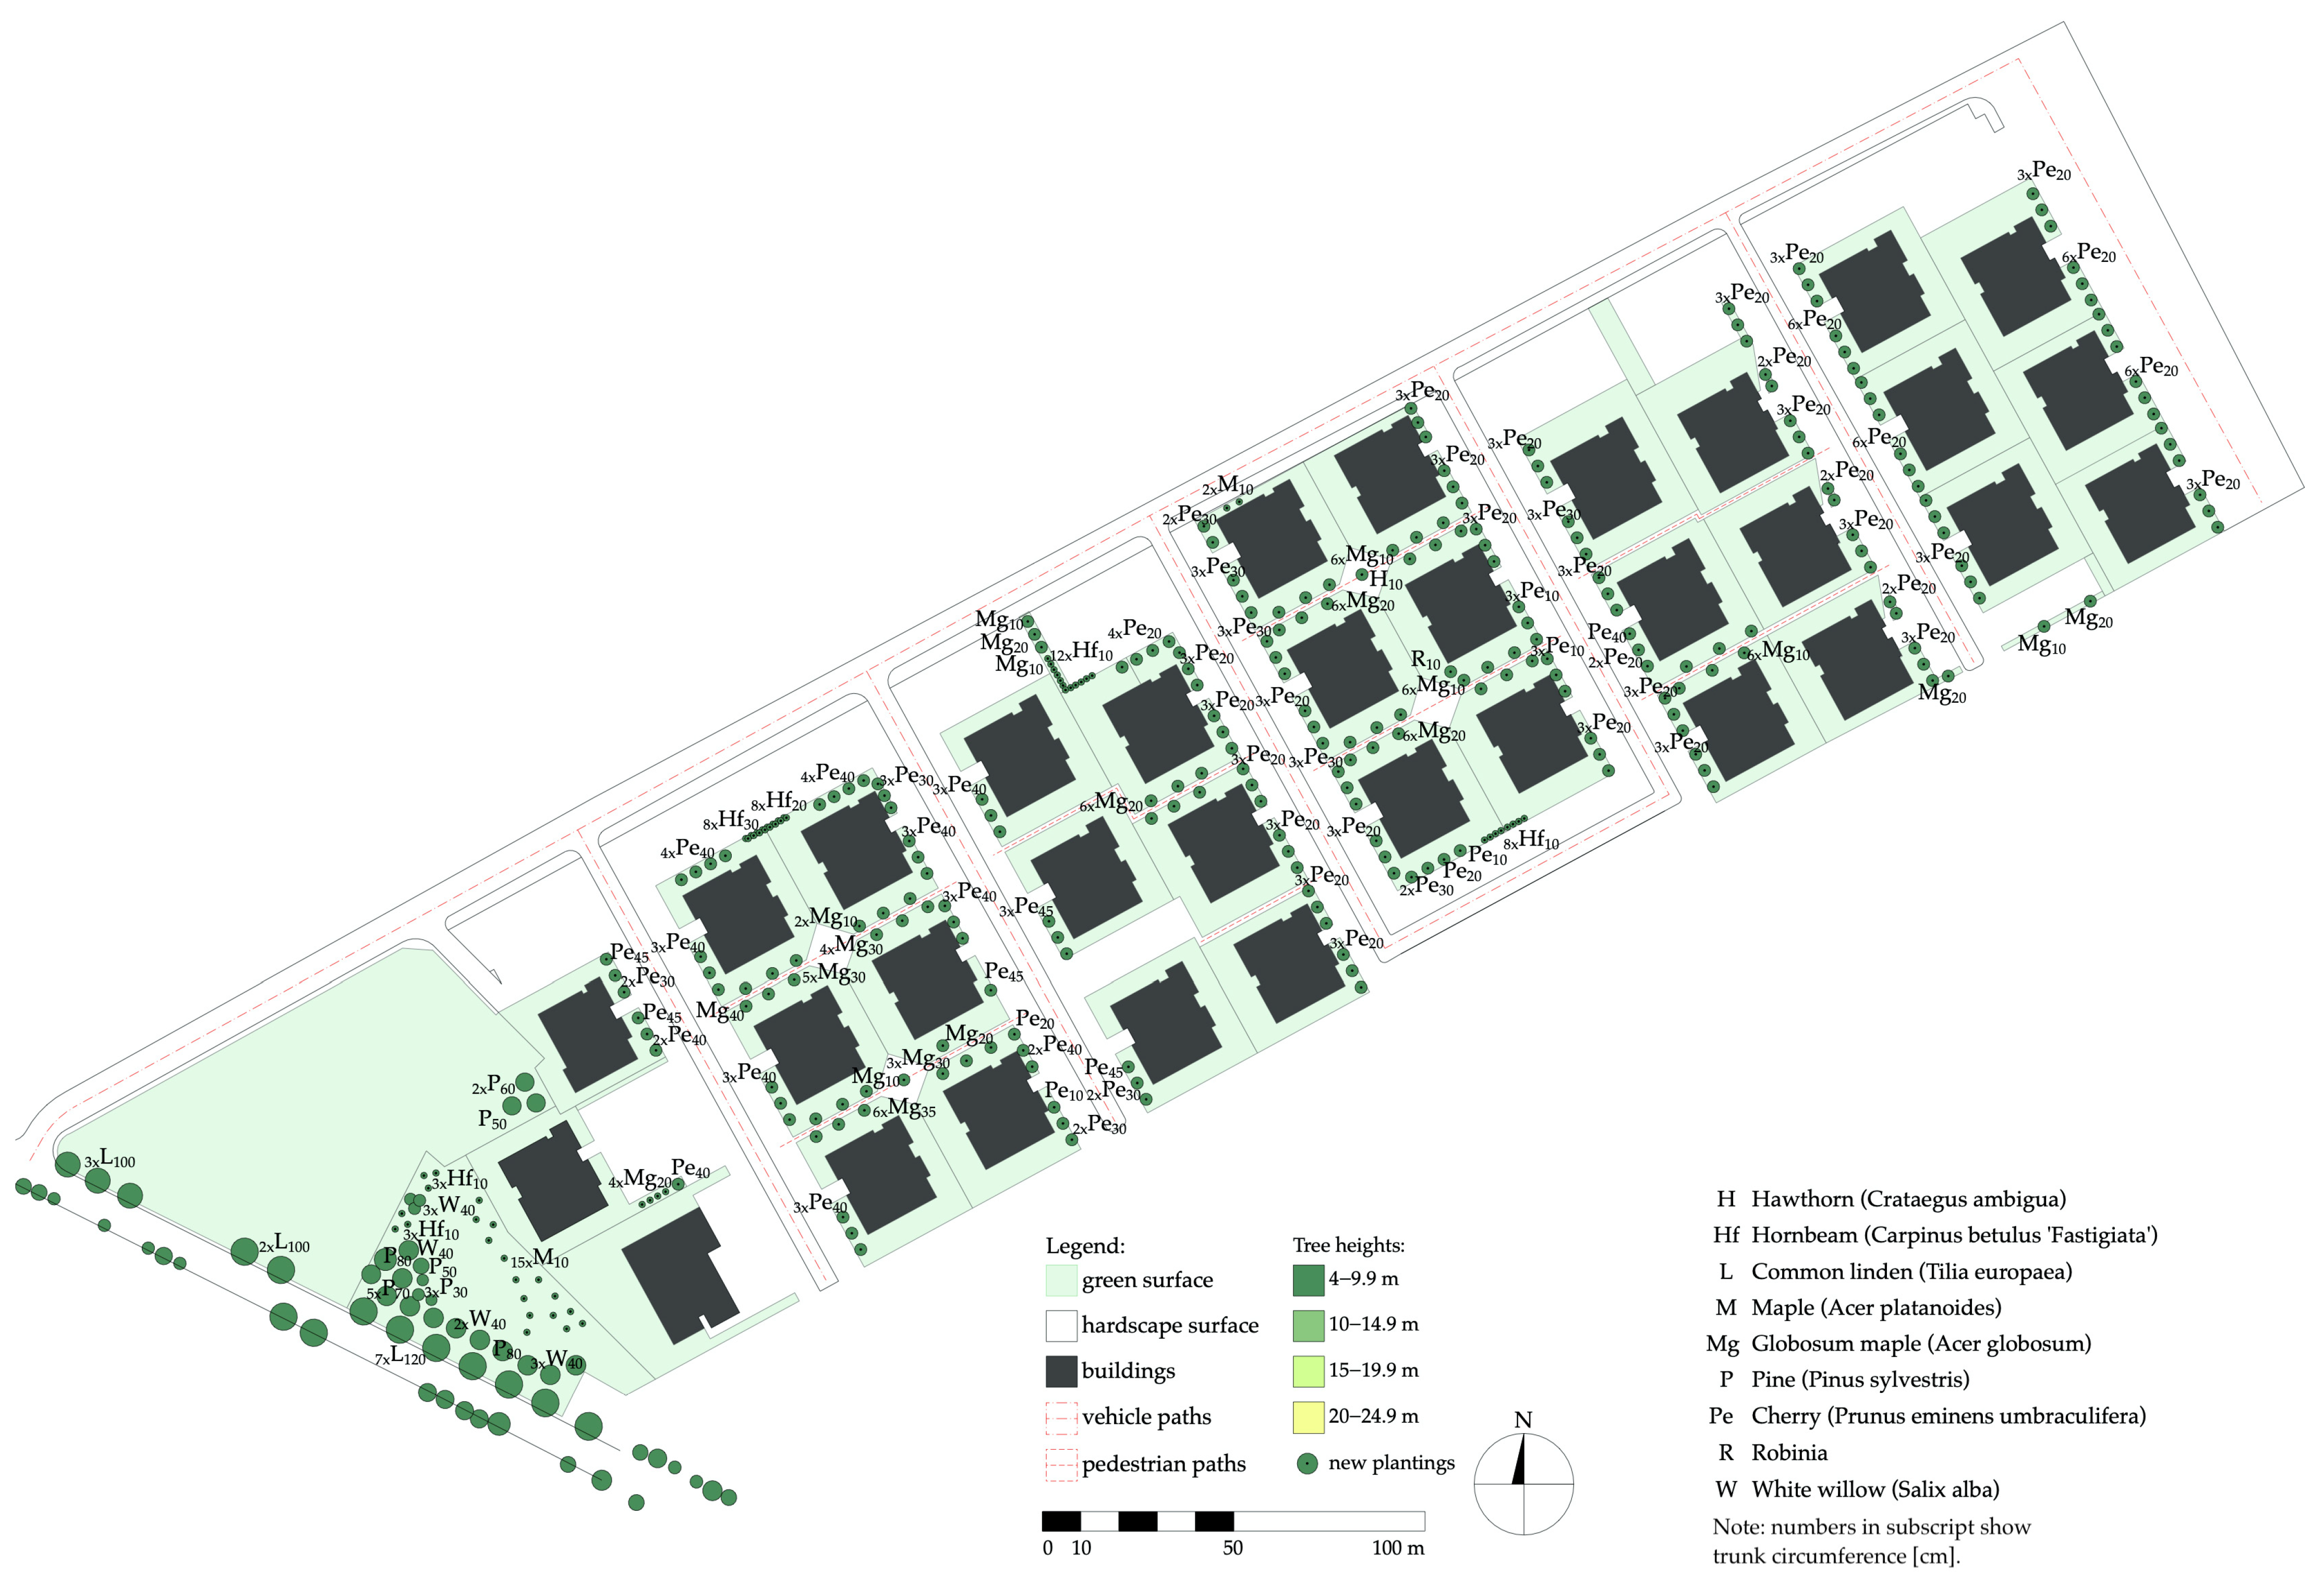
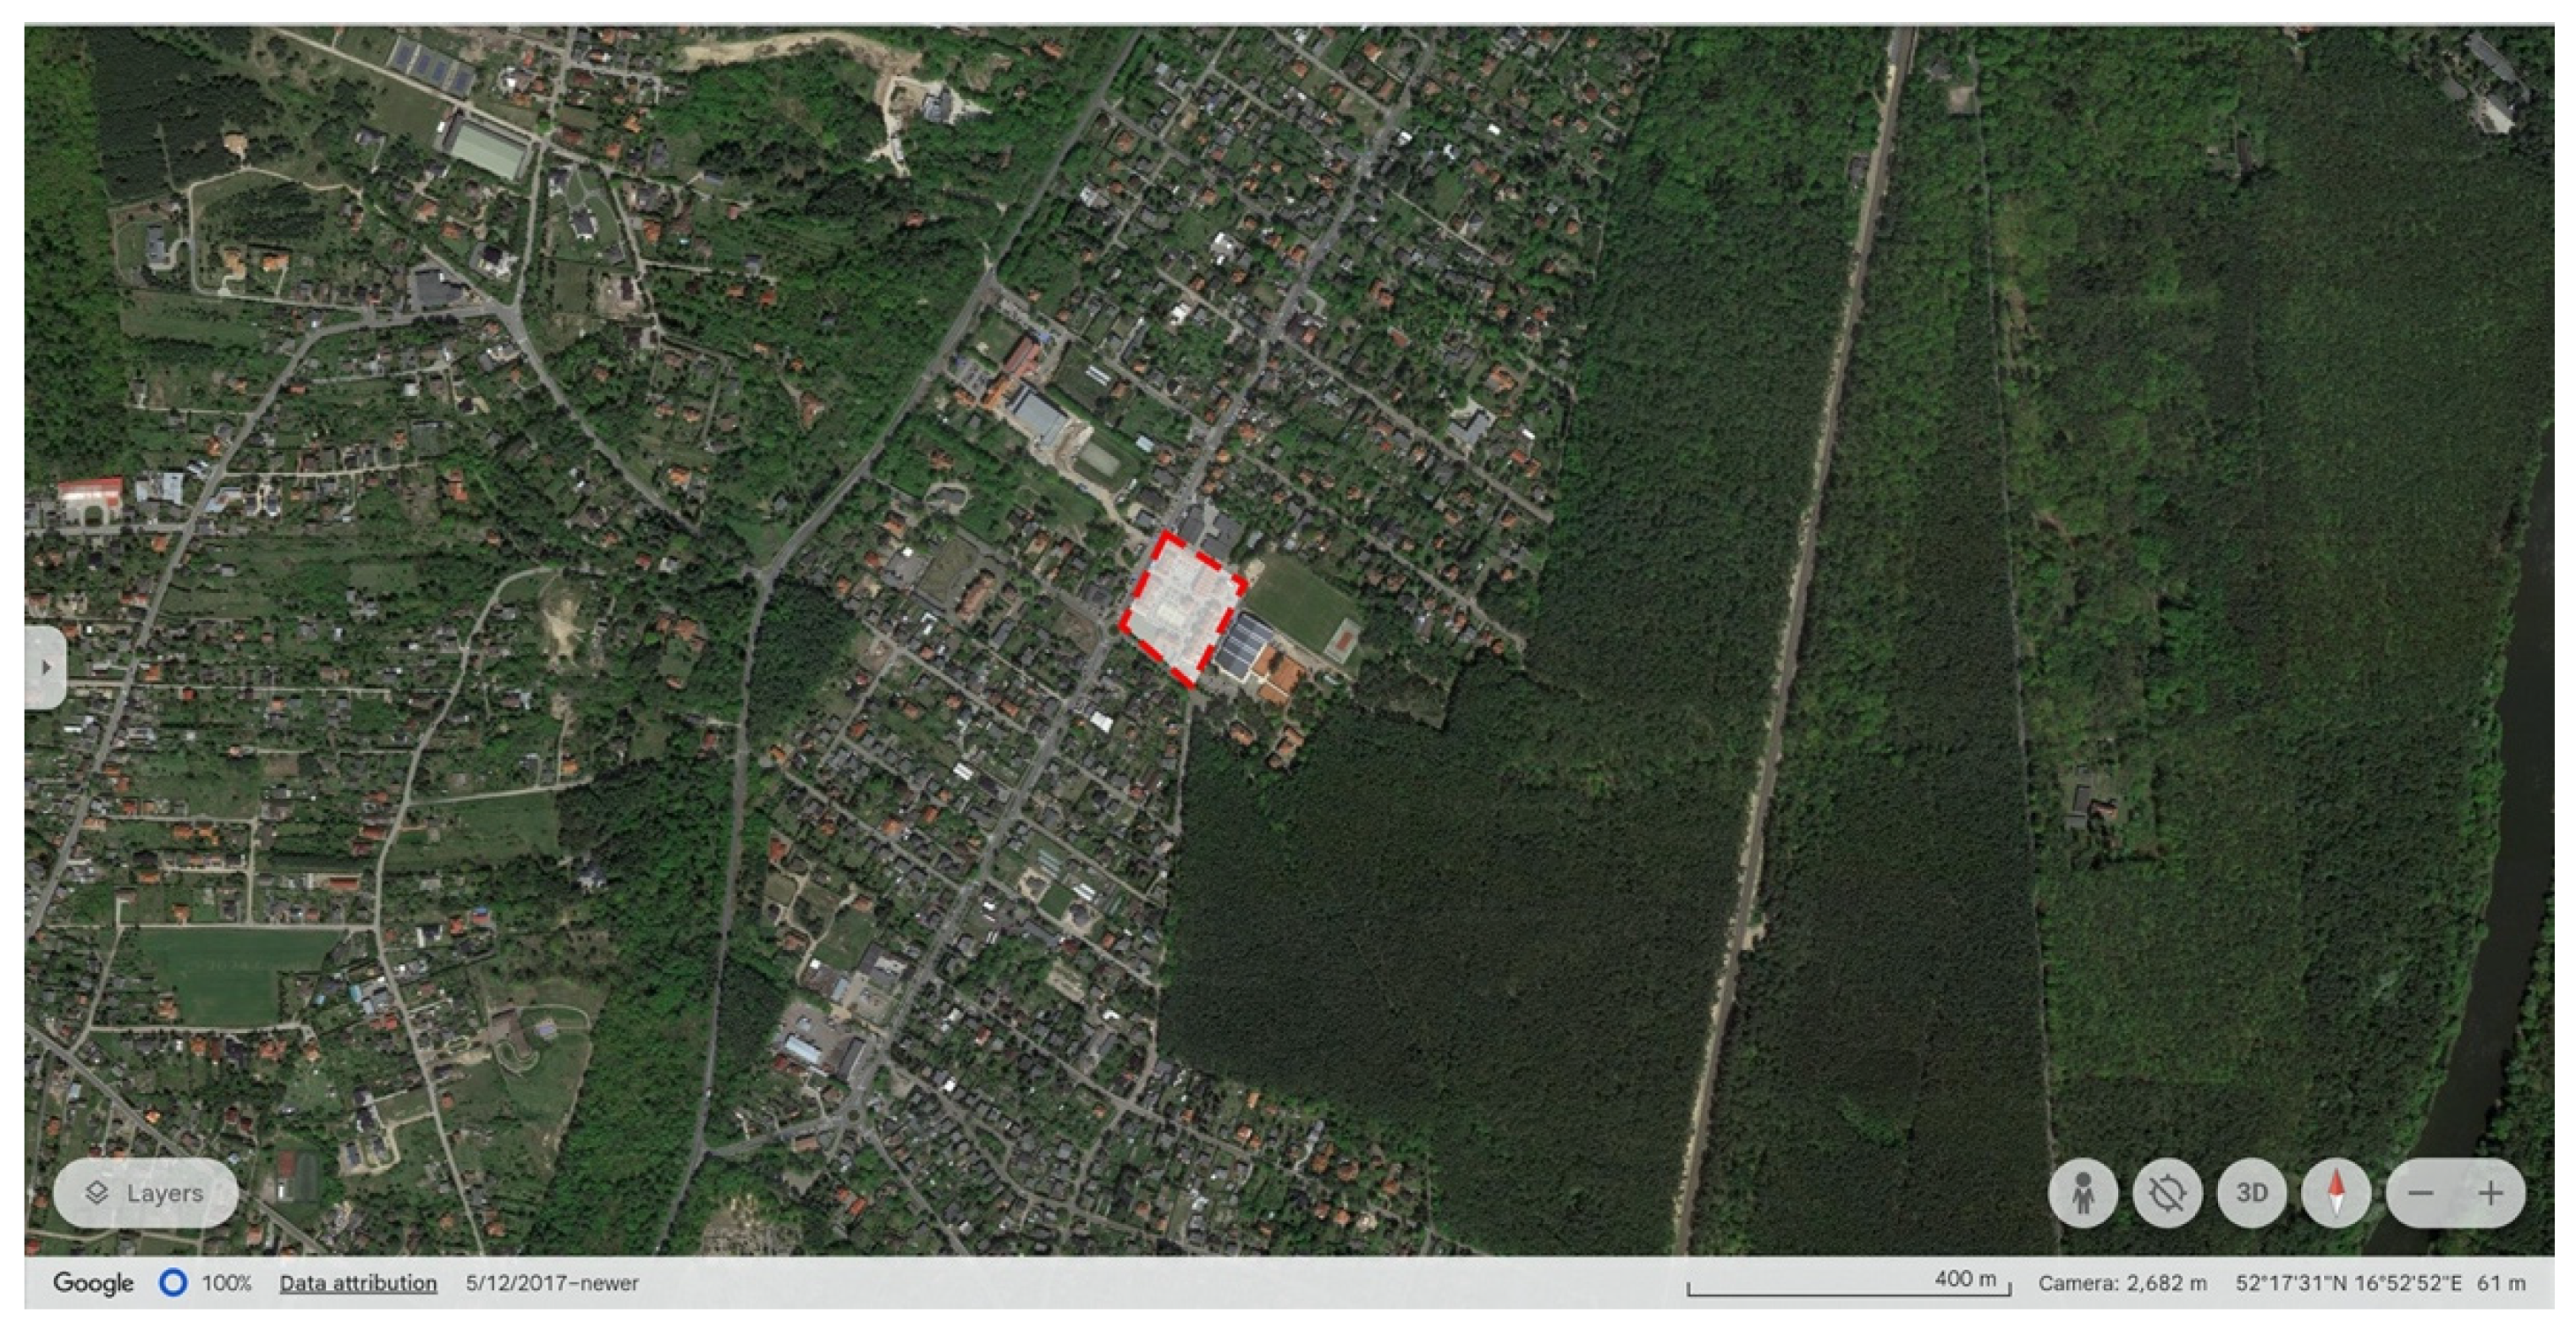
2.1.6. Grafitowe Estate, Skórzewo, 2020s

Grafitowe estate is a faithful example of the contemporary multi-family residential developments currently built in the suburban zones of Polish cities (Figure 12 and Figure 13). Buildings are still low-rise (three stories), and only the ground floor directly connects with the garden. A typical flat has a floor area of between 40 and 70 m2, and the number of rooms varies from two to four. The architecture of the blocks is minimalistic and economical.
The district consists of thirty-three blocks, comprising a total of 544 homes, as determined through functional layout analysis by the authors. The average number of occupants per dwelling in the area was 2.82 in 2022 [74]. This suggests a total occupancy of approximately 1534 individuals, with a corresponding density of around 206 people per hectare. For comparison, the average population density in the administrative unit (commune) in the same year equaled 3.23 people per hectare [74].
Like the neighborhood’s architecture, its streetscape is optimized for the economics of implementation and maintenance. The result is relatively standard and repeatable forms of greenery and a minimal selection of tree species. The district’s designers selected ornamental grafted tree species that would never grow to threaten buildings (e.g., the impact of roots on the bearing structure) or residents (e.g., falling branches). Also, this decision reduced the neighborhood’s maintenance costs. The impact of the above arguments on the decision-making process in contemporary streetscape design for suburban housing districts is a common situation in Poland. In this sense, the selected case study validly represents today’s suburban multi-family housing planning paradigm.

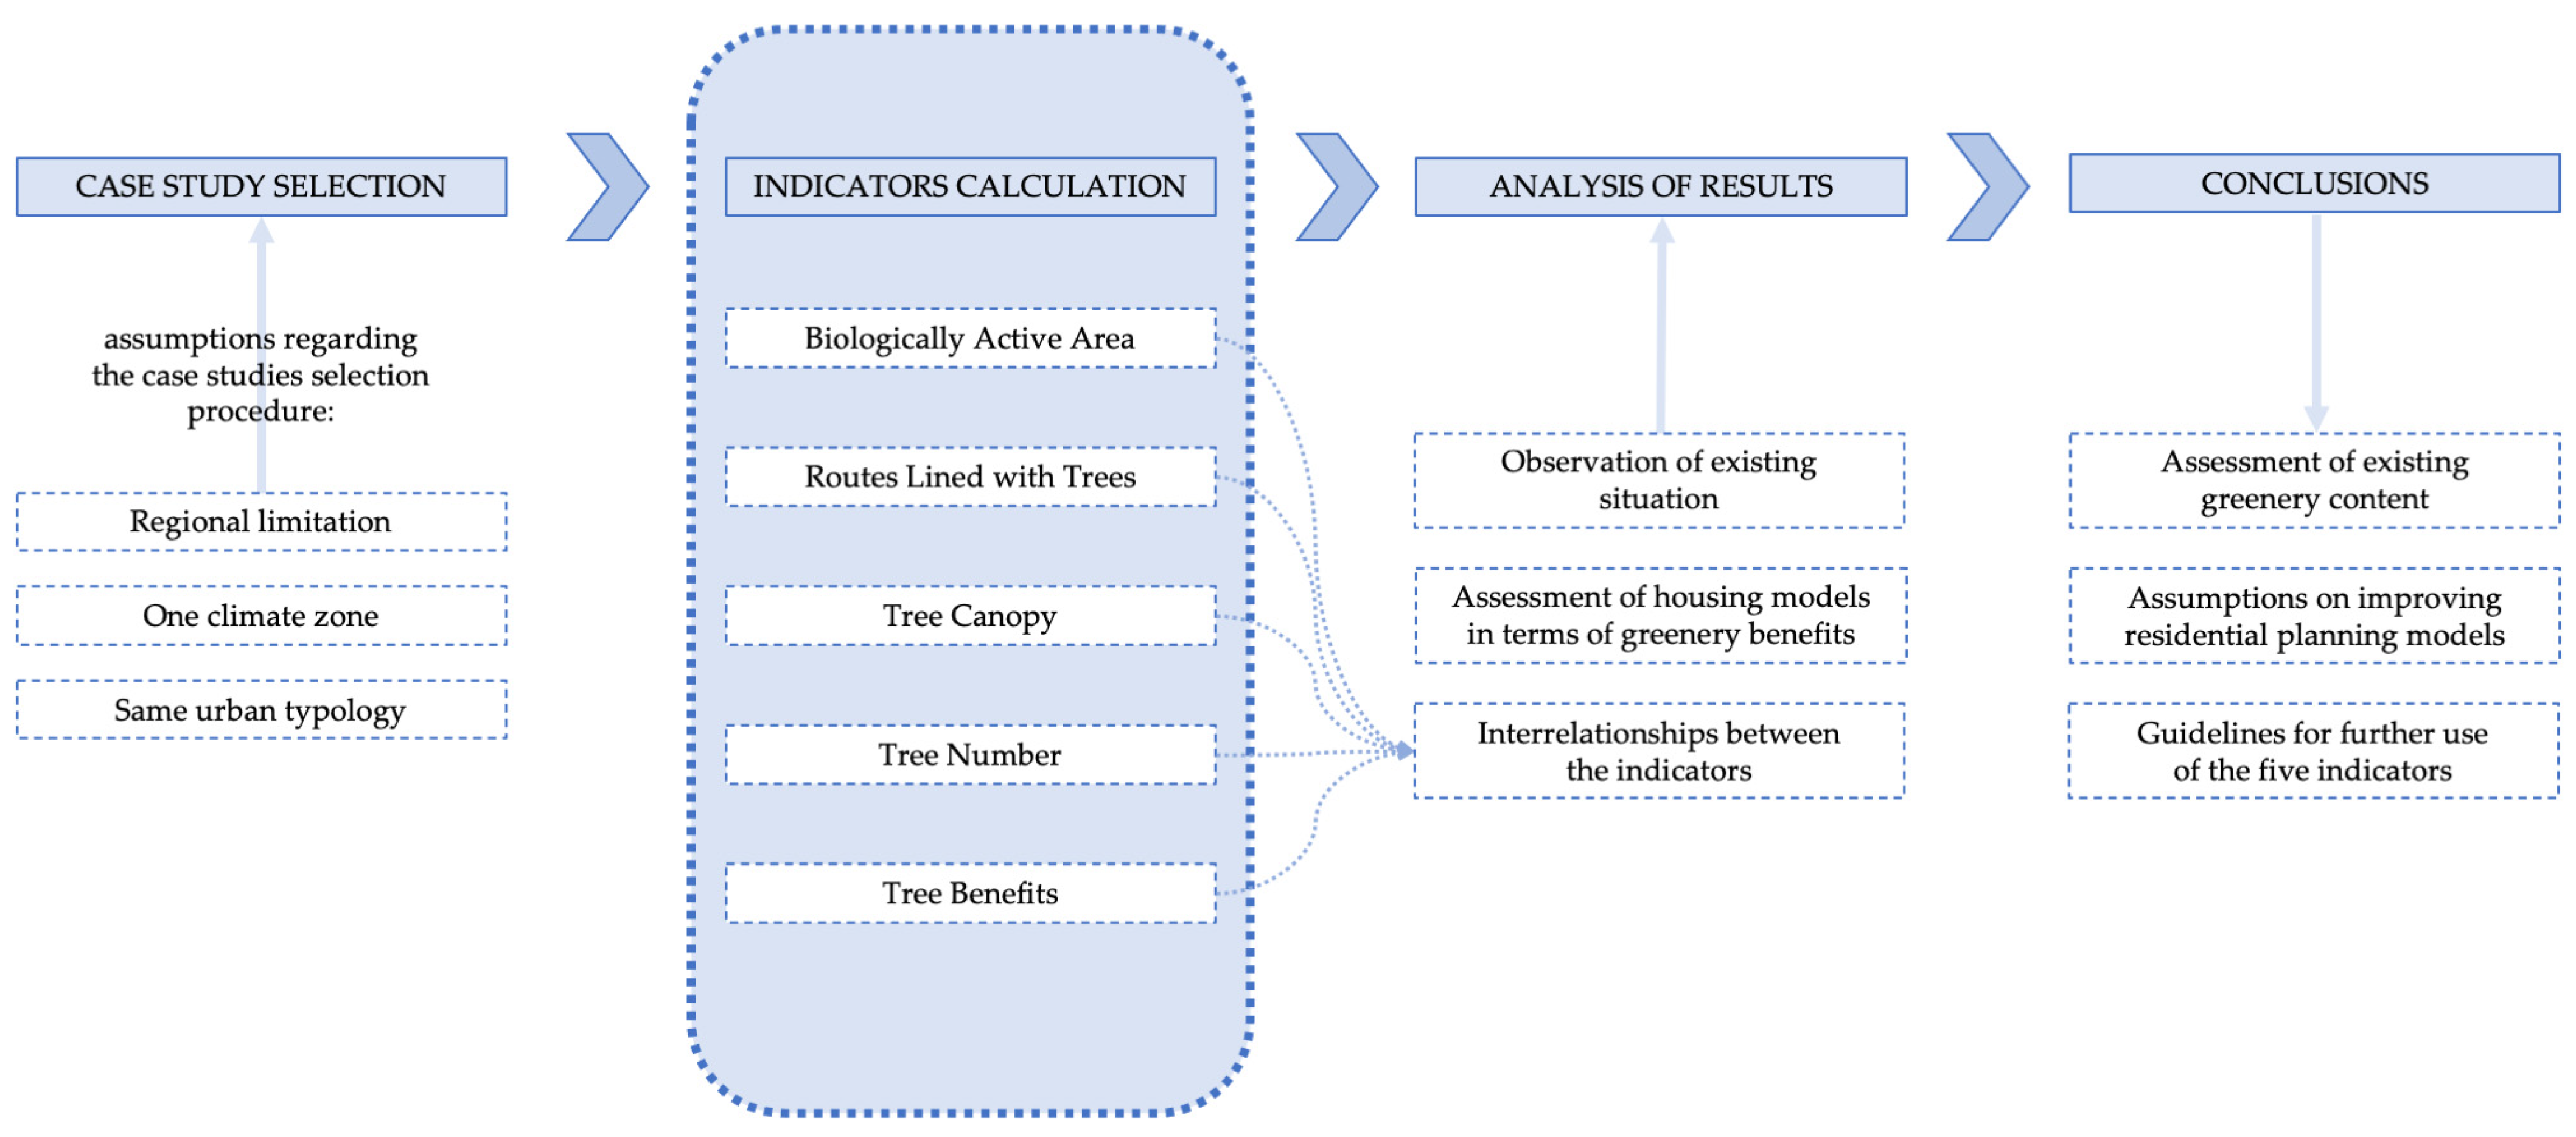
2.2. Selection of Indicators and Calculation Method

Each of the six case studies (estates) was drafted using CAD software and based on available maps (see Section 2). The settlements analyzed have different typologies and scales. For this reason, a set of indicators had to be calculated to objectively compare selected planning models regarding sustainability, here measured through standards of greenery content. The proposed method combines five indicators grounded in the existing state of knowledge, as explained below separately for each of them. The novelty of our approach lies in their joint application. In its integrity, the proposed methodology is used for the first time in this work. The methodological framework of the study is presented in Figure 14.
Based on the maps elaborated, the following indicators were assessed.

2.2.1. Biologically Active Area Indicator (BAA)

The ratio of the green area to the total investment area is one of the basic sustainability metrics for urban sites [57]. Hardscape surfaces are known to raise the ambient temperature and negatively influence the air quality. They also increase stormwater runoff and contribute to the degradation of water bodies.
The answer to the above problems is to introduce zoning regulations that set minimum lot-coverage standards for the landscape. The goal of introducing a minimum Green Area Ratio (GAR) in the zoning plan is to meet the requirements of sustainable development by promoting “greater livability, ecological function, green space accessibility and climate adaptation in the urban environment” [56].
According to Polish legislation, an investment plot’s required minimum green surface is defined as the Biologically Active Area. The concept of the Biologically Active Area is analogical to the GAR. It is understood as “an area with a surface arranged in a way that ensures natural vegetation of plants and retention of rainwater, as well as 50% of the surface of terraces and flat roofs with such a surface and other areas ensuring natural vegetation of plants, with an area of not less than 10 m2, and the surface of waterbodies in the area” [64].
For new developments, Poland’s planning policy sets the Biologically Active Area standard at 25% of the plot surface unless the local plan of the municipality states other requirements. The general practice is that this indicator may be higher in suburban municipalities than in urban areas. However, it depends on the authorities’ decision, and there are known cases of setting the Biologically Active Area at the level of 30% in rural communes subject to intense urbanization pressure. Moreover, this Biologically Active Area Indicator level (i.e., 30%) will soon be required for most planning zones, according to the currently elaborated attachments to the new Planning Act just entering power [65] and updating the former one [79].
While the minimum BAA ratio is a requirement for new developments, it is also a representative tool to assess the greenery content in the existing neighborhoods. This study will use the BAA indicator specifically in this capacity but will juxtapose it with other greenery indices.
This work will calculate the Biologically Active Area indicator for the six selected residential estates according to the following equation:
B A A = S v + S w + 1 2 S t / S i ,
where BAA is the calculated Biologically Active Area indicator, Sv is the surface area covered with vegetation, Sw is the surface area of the waterbodies (if any), St is the surface area of terraces, flat roofs, and other surfaces ensuring the natural vegetation of plants, with an area of not less than 10 m2, and Si is the total surface area of the investment, which might cover multiple plots.

2.2.2. Routes Lined with Trees Indicator

The measurement of the share of communication routes with strips of trees and tall bushes was proposed by Degórski and others [66] as an indicator of ecosystem services in urbanized areas. However, this indicator was initially intended for large-scale analysis and comparing districts, cities, and even metropolitan areas. Therefore, it does not include small greenery patches in residential areas and street sections shorter than 50 m.
Because this work aims to compare residential estate design models in terms of their adjustment to the sustainability requirements, the Routes Lined with Trees indicator is calculated for vehicle and pedestrian communication routes within the six case study areas. In situations where vehicle and pedestrian routes run parallel with no separation (i.e., a street with a sidewalk), only vehicle routes are included in calculations to avoid duplication.
The length of the communication Is measured along the axes, and the maximum distance between the trees is set at 15 m, which used to be the standard minimum planting distance along roads in Poland (historically). Current legislation in Poland sets minimum distances between trees and buildings or infrastructure, but the distance between consecutive plants in a row depends on the species.
The Routes Lined with Trees indicator is calculated as the ratio of the length of the routes lined with trees compared to the overall length of the communication, according to the following equation:
R L T = L t / L i ,
where RLT is the Routes Lined with Trees indicator, Lt is the length of the communication routes with trees on at least one side and distancing of less than 15 m, and Li is the total length of communication in the investment area.

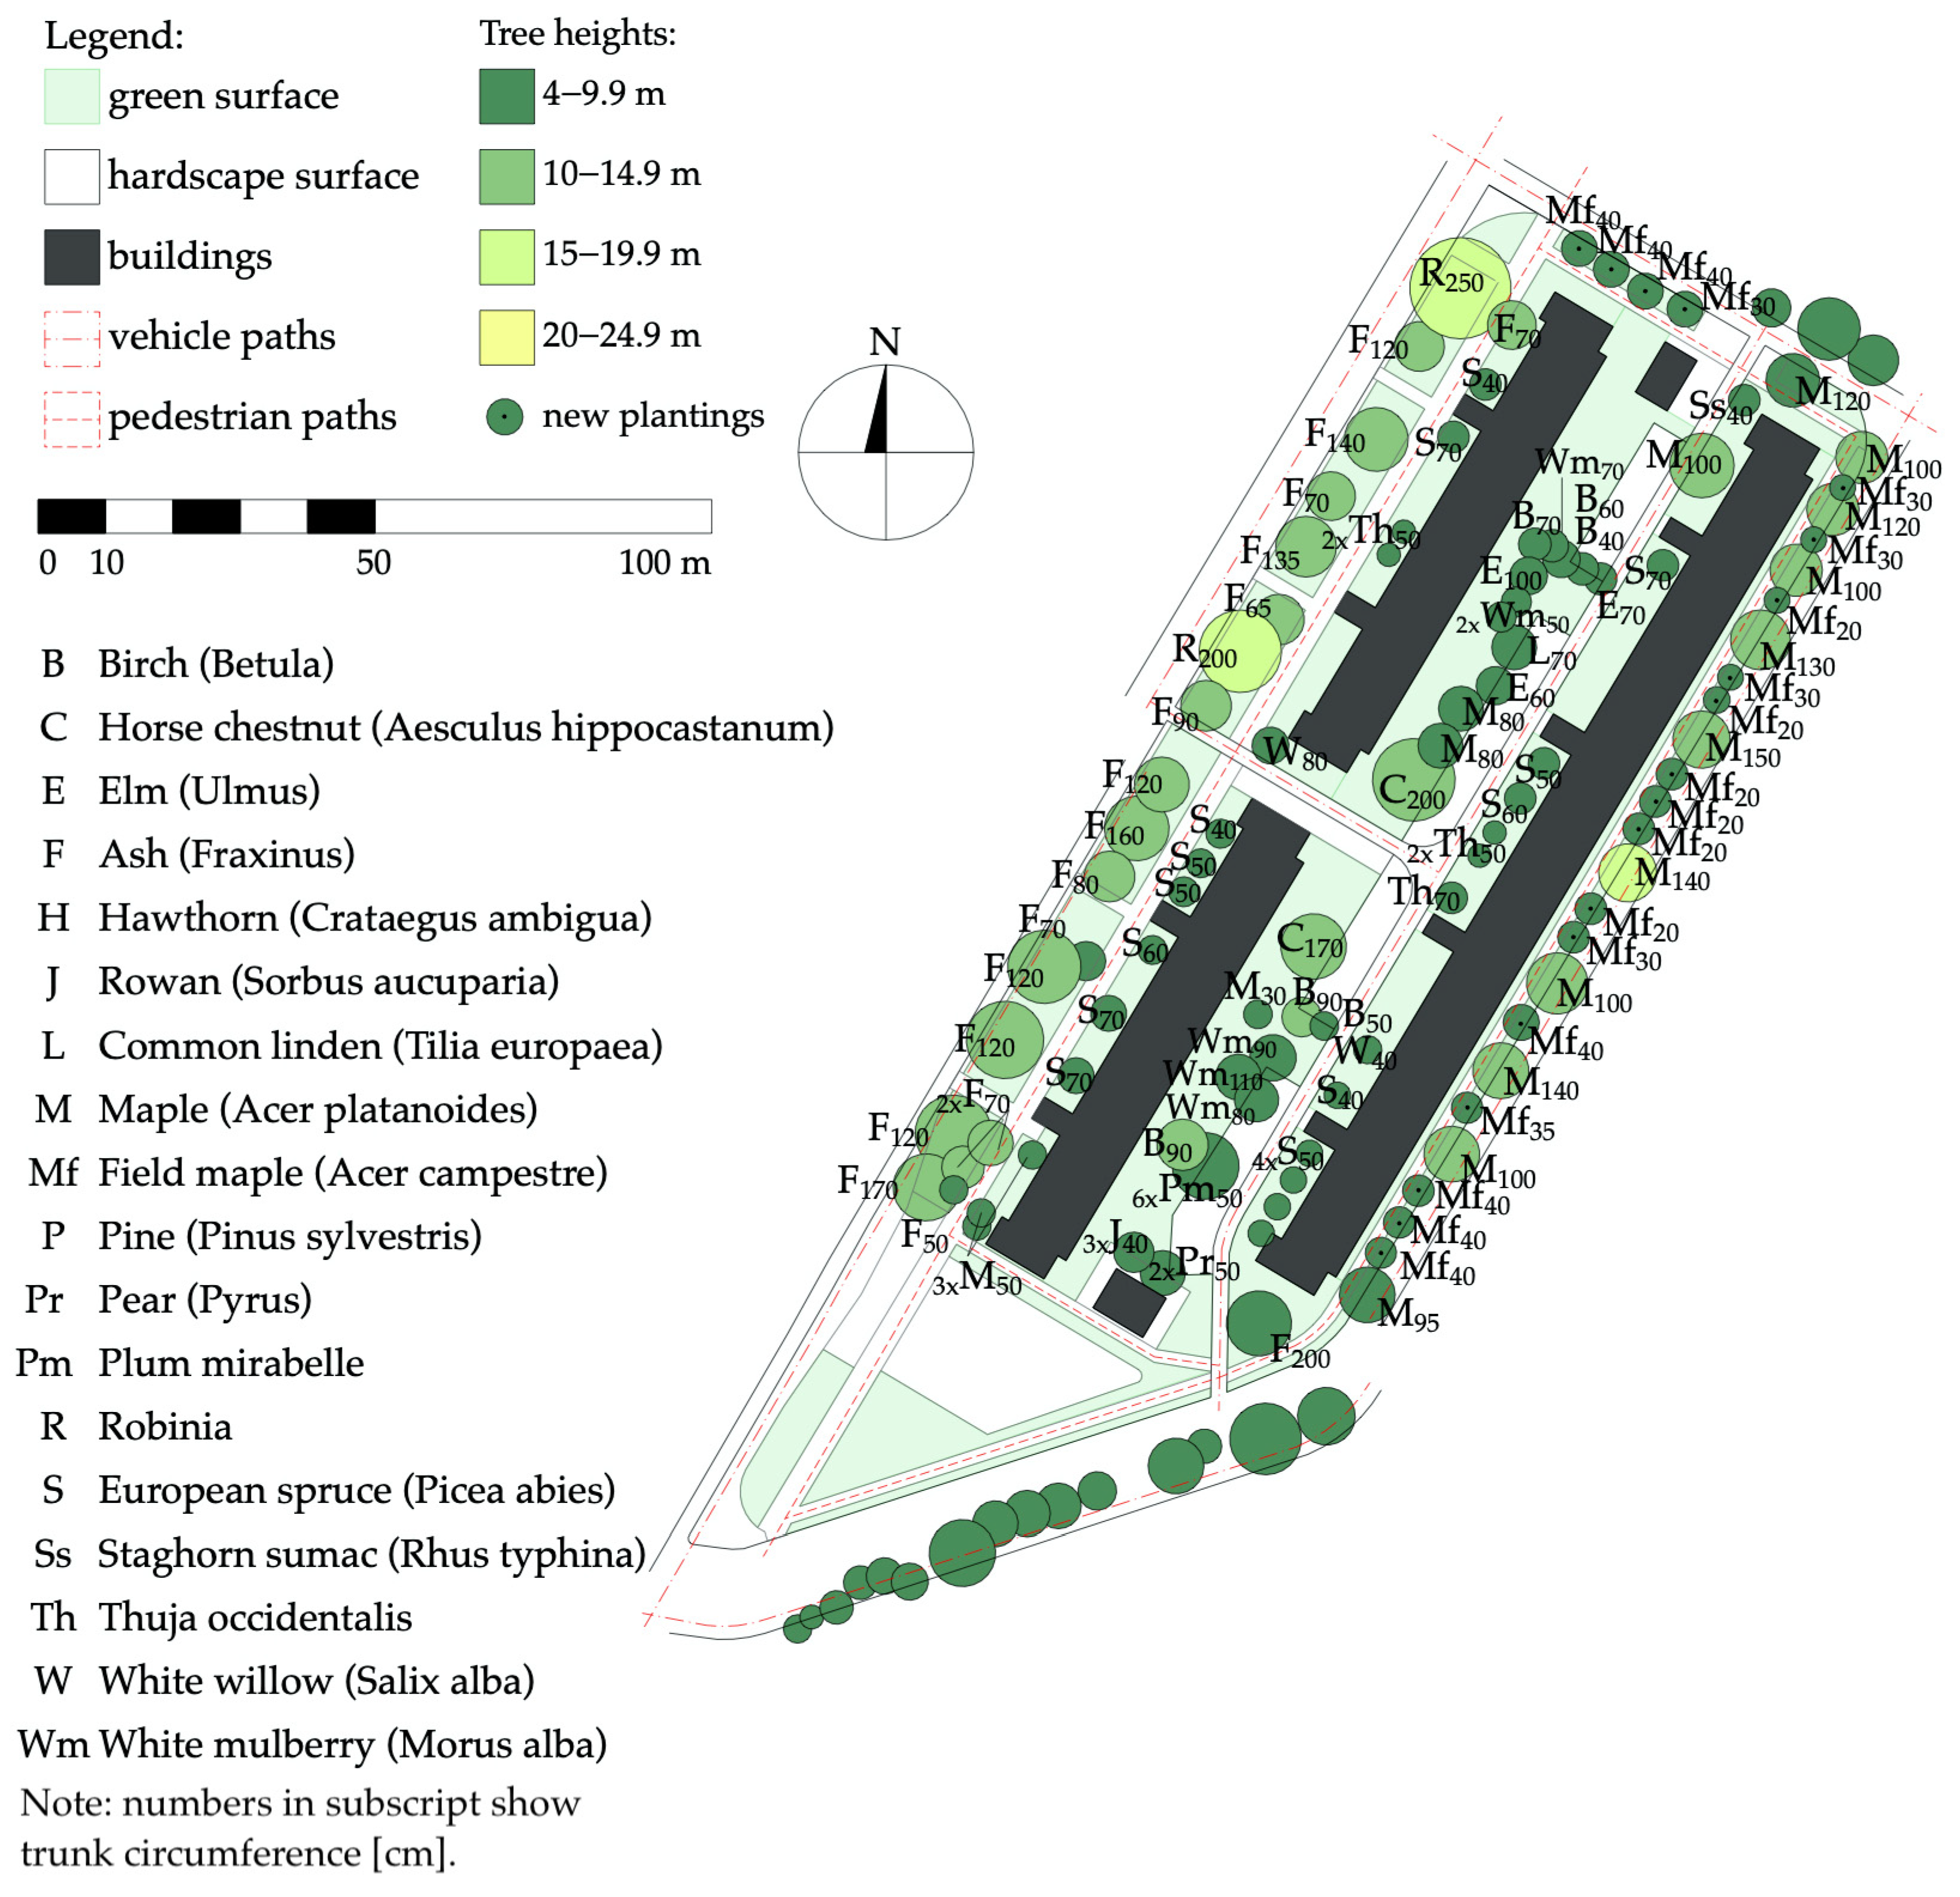
2.2.3. Tree Canopy Indicator

This indicator reflects the canopy surface of trees planted in the investment (estate) area. Due to the different ages of the six case studies, the size of the newly planted trees is defined not as they are at present, but by their typical mature canopy. Following the GAR calculation instructions provided by the Department of Energy and Environment [56], the Tree Canopy indicator considers the surface area to be calculated for each tree in the following way (Table 1):
The canopy surface assessed according to the table above is compared to the total investment area to provide the value of the Tree Canopy indicator:
T C = S c / S i ,
where TC is the Tree Canopy indicator, Sc is the canopy surface (assessed according to Table 1), and Si is the total surface area of the investment.

2.2.4. Tree Number Indicator

The Tree Number indicator is a simple ratio of the number of trees to a unit of the investment area [100 m2]. The data regarding this indicator were collected by taking into account the height of the trees and the circumference of the trunk at a height of about 1.30 m.
T N = ( N t × 100 ) / S i
Here, TN is the Tree Number indicator, Nt is the number of trees growing in the investment area, and Si is the total surface area of the investment.

2.2.5. Tree Benefits Indicator

The Tree Benefits is an indicator of three elements calculated using the online tools presented at www.itreetools.org (accessed on 19 October 2023). The three components are carbon dioxide uptake, stormwater mitigation, and air pollution removal, expressed in monetary values. Calculations of the Tree Benefits are based on USDA Forest Service research and are subject to measurement error. Nevertheless, the estimated values of the Tree Benefits allow the six case studies to be compared regarding the levels of carbon dioxide uptake, stormwater mitigation, and air pollution removal according to the investment’s surface area [m2].
T B = V b / S i
Here, TB is the Tree Benefits indicator, Vb is the monetary value of the benefits, and Si is the total surface area of the investment. This indicator is calculated for the current year (TB1) and the next 20 years (TB20).

3. Results

The research results reveal (i) general trends regarding selected aspects of suburban planning standards within the study area and over time, (ii) the level of environmental friendliness of the housing design models covered by the analysis, and (iii) the relationships between the indicators. The results also allow us to compare and discuss the indicators used in terms of their usefulness for similar research.

3.1. General Trends Regarding the Selected Aspects of Suburban Planning Standards

The first observations based on the research results concern how the selected aspects of multi-family suburban planning developed in the Poznań metropolitan area from the 1930s to the 2020s. Each indicator corresponds to a specific area of environmental problems affecting the sustainability levels of suburban residential neighborhoods.

3.1.1. Biologically Active Area Indicator (BAA)

The ratio of the Biologically Active Area to the total surface of an estate was stable from the 1930s to the 2020s in all case study districts except for one (Table 2). The value of the BAA indicator equaled 0.12 for the mixed-use enclave around the new market square of Puszczykowo (case study No. 5). At the same time, the five remaining districts had values of this indicator ranging from 0.4 to 0.49. The drop in the BAA indicator of roughly 18% from the 1960s until the present can be explained by the popularization of individual transport and the resulting need to provide sufficient vehicle space. While the general trend is that the overall BAA indicator remains above the minimum level of 30%, the diversification of surface types could further improve this result. The most popular paving solution in the study area is an impervious surface made of concrete paving stones, which also contributes to overheating.

3.1.2. Routes Lined with Trees Indicator (RLT)

The ratio of the vehicle and pedestrian paths lined with trees to the total length of communication was calculated according to Formula 2 and the rules described in Section 2.2.2. The results show a drop of 39% in the length of the communication routes lined with trees between Case Study No. 1 from the 1930s and Case Study No. 3 from the 1990s (Table 3). In the early 2000s, Case Study No. 4 showed the growth of the RLT indicator to the level of the 1930s, and the subsequent two case studies repeated the decreasing trend, with a drop of 30% between Case Study No. 4 from the 2000s and Case Study No. 6 from the 2020s.
Different percentages of communication paths lined with trees in the following decades of the 20th and 21st centuries depended heavily on the changing legal provisions. In pre-war Poland, standard cityscape solutions were popular. They frequently involved planting trees at equal intervals along the streets and roads. This trend was primarily driven by the desire to create healthier cities compared to their condition in the 19th century. At the same time, it contributed to the development of aesthetic quality preferences regarding the cityscape.
More recently, the design of housing estates has been dominated by different guidelines and regulations. For example, economic aspects contributed to the austerity of housing estates built in the 1980s and 1990s, as Case Study No. 3 exemplifies. Fire safety regulations also had a significant impact on the presence of trees in new housing estates, as they prohibit the planting of trees between buildings and the fire route, the role of which is often played by the street. Planting large trees along the street often requires additional access to buildings, which was done, for example, in Case Study No. 4. This can, therefore, lead to a high RLT indicator (Table 3).
The research results allow us to observe that the RLT indicator is case-sensitive. It depends heavily on the spatial typology of the housing estate, its location, and its connection with the communication infrastructure. Nevertheless, it can be generalized that the role of trees in shaping the character of communication paths in typical residential districts in the study area accounts for around 40 to 70% of the total. The higher the value of this indicator, the greater the share of trees in the user’s field of view, which affects their aesthetic experience of staying in a given space.

3.1.3. Tree Canopy Indicator

The Tree Canopy indicator considers both the existing mature trees and new plantings. The multipliers proposed by McGlynn and others [56] were used to reflect the real impact of newly planted trees that have not yet reached their full canopy size (see Section 2.2.3).
For this research, we assumed that all existing trees could be preserved so that the results would reflect the actual situation and not be influenced by the research team’s predictions about the fates of some trees. The canopies of existing trees were measured according to their crowns’ outlines, as projected on the district’s plan. The data regarding the canopy surface of mature trees were collected in three categories depending on the trunk diameter (< 15 cm, 15–60 cm, >60 cm) to allow for the correct use of multipliers. With the same purpose, information about new plantings was collected in two categories depending on their mature canopy spreads (<12 m, >12 m).
The results show a significant spread of the TC indicator’s value in the research area. The highest value of this indicator was calculated for Case Study No. 2, and it equaled 0.16. The lowest value, TC = 0.02, was attributed to the newest of the compared estates, Case Study No. 6, even though all new plantings were considered and included in the calculations, according to the guidelines provided by McGlynn and others [56].
The general trend concerning Tree Canopy indicator values within the research area is a decline. The study detected that this situation has a few essential causes. The first thing to mention is the selection of tree species. Most large trees in Case Studies No. 1, No. 2, and No. 4, where the TC indicator reached higher values (Table 4), were species that are native to the region, e.g., common linden, ash, maple, birch, robinia, pine, and spruce. These species can achieve their full mature size under local climate and soil conditions. On the contrary, grafted ornamental species of trees prevailed in the two latter case studies, i.e., No. 5 and No. 6, where the TC indicator was the lowest. The popularity of such tree species, e.g., Globe Norway Maple (lat. Acer platanoides ‘Globosum’) or Semi Sour Cherry (lat. Prunus eminens umbraculifera), is primarily due to their self-limiting development, ease of maintenance, and aesthetics. The TC indicator shows clearly that the choice of ornamental grafted tree species, although it may meet aesthetic needs, provides up to eight times less shading.
Another reason for the decline in the TC indicator is that too little space is allocated for trees, and they are planted too densely or too close to buildings. The typical situation is that the trees have no room to grow, often due to economic reasons. One of the essential priorities of large residential projects today is to obtain the best possible return on investment. Optimizing costs and maximizing profits while meeting the minimum Biologically Active Area ratio requirements and satisfying the client’s aesthetic needs are the most important criteria in today’s decision-making process regarding greenery in suburban residential districts. In the routine, the ecological value of large trees is not considered.

3.1.4. Tree Number Indicator

The Tree Canopy indicator and Tree Number indicator complement each other. Simple information regarding the number of trees per unit of the investment surface area (100 m2) gives an image of how many trees have been planted per unit of unified land area. The TC indicator fulfills this information by showing how efficient those trees are for providing the canopy, which is crucial from the point of view of oxygen production and the cooling effect, among other things.
The correlation between the two indicators, TC and TN, revealed nuances, for example, comparing Case Studies No. 2, No. 3, and No. 6 regarding trees’ efficiency in developing the canopy. Namely, Case Study No. 6 has a TN indicator value between those of Case Studies No. 3 and No. 2 (Table 5), but its TC indicator is five and eight times smaller, respectively (Table 4). Subsequently, Case Studies No. 1 and No. 4 have the highest TN indicator values, while their TC indicators remain similarly high. This means that the tree group in both cases has similar parameters and levels of efficiency during canopy formation. Finally, Case Study No. 2 is characterized by a medium value for the TN indicator, while its TC indicator scored the highest. This situation is explained by the significant representation of trees taller than 15 m (Table 5).
Additional information was collected regarding the number of trees in specific height and trunk diameter ranges. By comparing the results with the TC indicator, it can be observed that the number of trees higher than 15 m translates into a higher Tree Canopy indicator, as Case Study No. 2 exemplifies (Table 4 and Table 5). For Case Studies No. 1 and No. 4, the number of trees with a trunk diameter greater than 15 cm positively impacts the Tree Canopy indicator, even though the prevailing height of the trees is below 15 m. Finally, Case Study No. 6 shows that new plantings of trees with a mature canopy spread of less than 12 m result in a low Tree Canopy indicator level, even though the Tree Number indicator reaches a medium level.

3.1.5. Tree Benefits Indicator

The Tree Benefits indicator reflects the monetary value of the trees per unit of the investment area. The tools used in the study allowed the monetary value of the measurable ecosystem services delivered by the communities of trees to be assessed. The information analyzed considered the tree species, trunk diameter, exposure to the sun, distance from buildings, and the general condition. The calculated monetary value of the ecosystem services included carbon dioxide uptake, stormwater mitigation, and air pollution removal.
The results show that the Tree Benefits indicator has decreased in the study area (Table 6). The proportion of TB indicators calculated for one year (TB1) and the following twenty years (TB20) is instrumental in this assessment. Firstly, the benefits provided during the next twenty years have a value greater than the annual rate multiplied by twenty. This situation is due to the growth of trees and the increasing ecosystem service delivery efficiency. Older and larger trees are more efficient in sequestering carbon, removing air pollution, and mitigating stormwater, which explains why the highest TB indicators in the study were attributed to the oldest district, Case Study No. 1 (Table 6). At the other end of the list, Case Study No. 6 scored the lowest TB indicator values due to its young tree community.
The monetary value of the benefits delivered by the communities of trees in the six case study districts was additionally divided by the number of trees, providing the average value of the TB indicator per tree (Table 6). This supplementary information confirms the significant advantage of large, mature trees. Nonetheless, younger communities of trees showed a significant increase in their capacity to deliver benefits during the next twenty years, as exemplified by Case Study No. 6, with an average annual increase of 92%. The dynamics of the increase in the trees’ capacity to deliver the benefits fulfills the image regarding the Tree Benefits indicator. While older communities of trees have the highest efficiency in this respect, the youngest ones increase their capacity the most intensely. The critical question is whether decorative grafted trees will ever achieve efficiency levels in absorbing carbon dioxide and pollutants and stormwater mitigation equal to those of the older communities of native species.

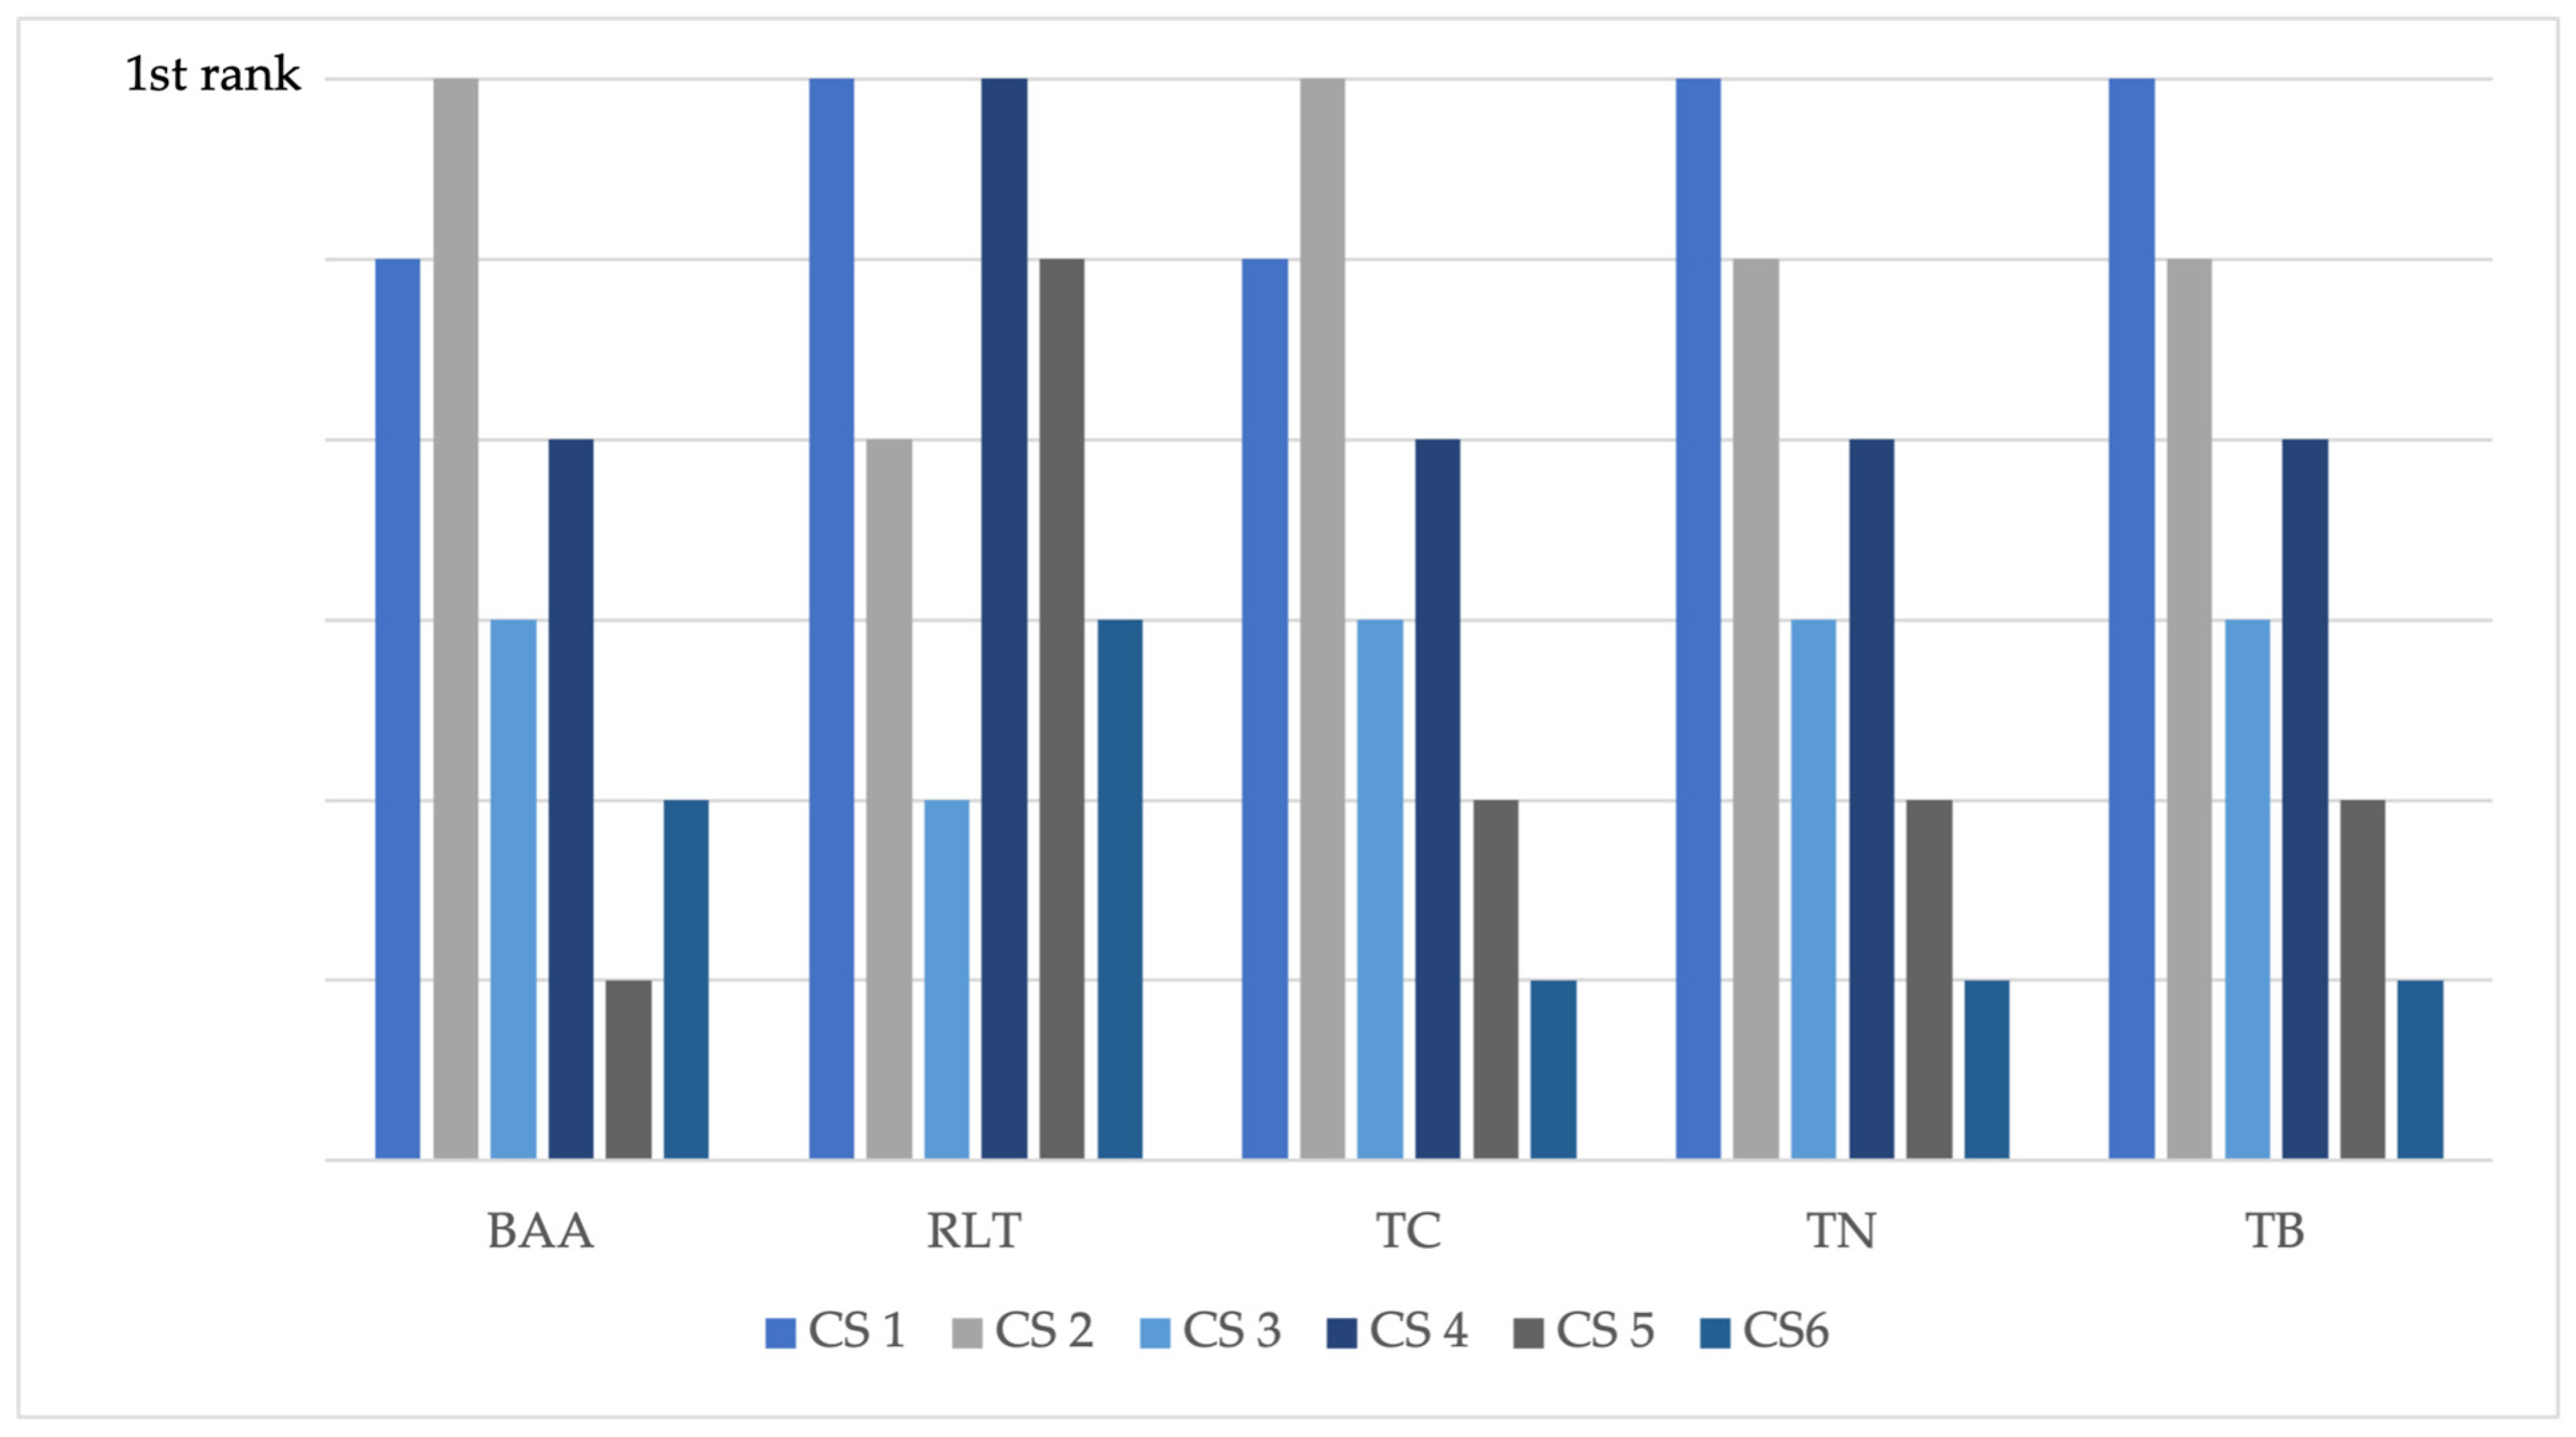
3.2. Environmental Friendliness of the Housing Design Models

The six case studies exemplify different suburban planning models typical of their time spaces. The indicators’ values illustrate the current state of greenery in the typical residential districts of the study area and respond to Research Question 1 (Figure 15).
Answer to Research Question 1: in the area covered by the research, the mean value of the BAA indicator is 0.38, with one exception being Case Study 5, which has a deficient result of 0.12; the RLT ranges from 0.43 to 0.7 with an average of 0.59; the TC ranges from 0.02 to 0.16 with a mean of 0.08; the TN ranges from 0.35 to 0.797 with an average of 0.56 trees per 100 m2; the TB1 scales from 0.005 to 0.11 with a mean of 0.03 USD/m2, and the TB20 ranges from 0.2 to 2.68 with a mean of 0.82 USD/m2.
A comparison of the results obtained from the six districts will help us to determine which one of them most closely relates to pro-ecological assumptions concerning the role of trees in spatial planning. The most environmentally friendly district will have the highest values for all indicators. Since none boast this, it was decided to create a straightforward ranking. Given that six case studies were compared, the ranking has six consecutive places, scoring from one to six points. One point is given for the first-ranked district, and six points are given for the last position: the lower the sum of the points, the closer to the leadership position the area is (Table 7 and Figure 16).
The ranking puts the oldest district, Case Study No. 1, in the leading position. The second oldest estate, Case Study No. 2, takes second place. Its second position in the ranking is surprising, given that the construction of the 1960s in Poland was not famous for being ecological in any respect.
The success of the two oldest neighborhoods is backed by the large share of native species of trees that reach full size under the local climate and soil conditions. This fact translates into high values for the Tree Canopy and Tree Benefits indicators. Moreover, both districts had a high Biologically Active Area ratio, resulting partly from the realities at the time of their creation, when public spaces were designed for pedestrians rather than cars.
Another significant finding is that the most contemporary housing design models were outclassed by the triple advantage of the hundred-year-old leader. The reasons for Case Study No. 6 earning the last rank are not limited to the low levels of the Tree Canopy and Tree Benefits indicators. The district also has one of the lowest Biologically Active Area ratios and one of the lowest Routes Lined with Trees and Tree Number indicators.
These observations answer Research Question 2: the overall greenery content in housing districts is decreasing (Figure 17).

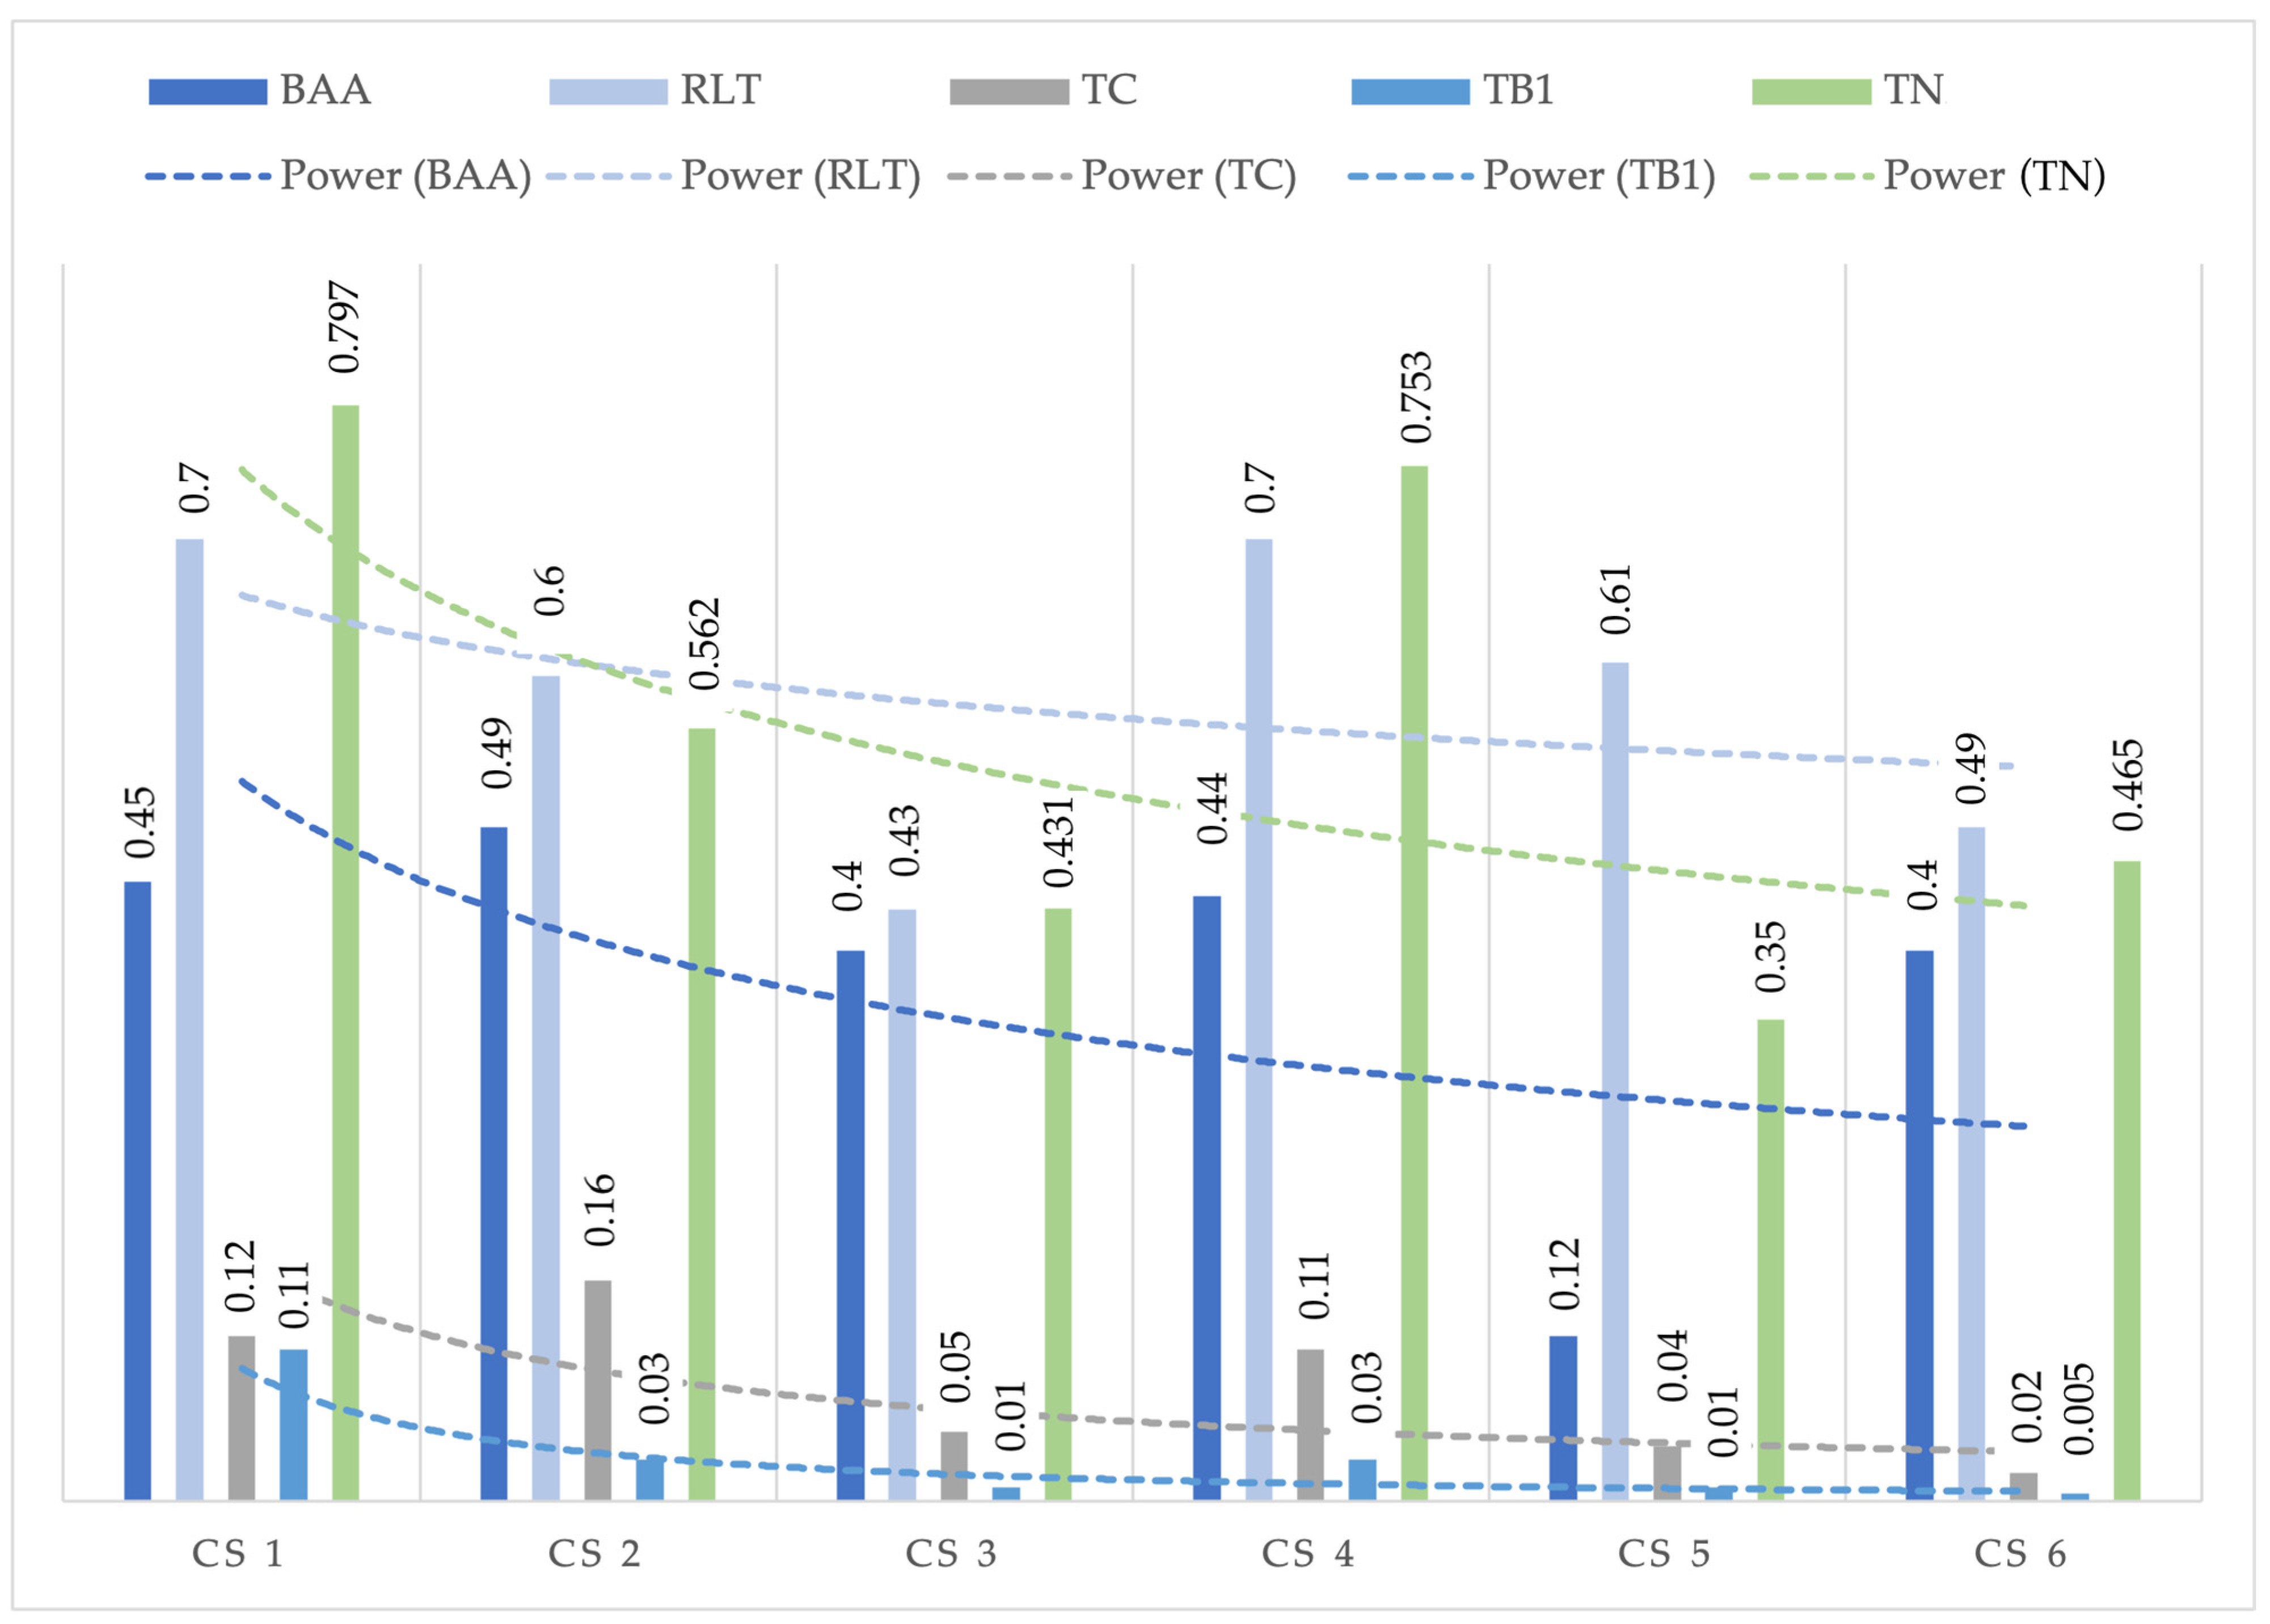
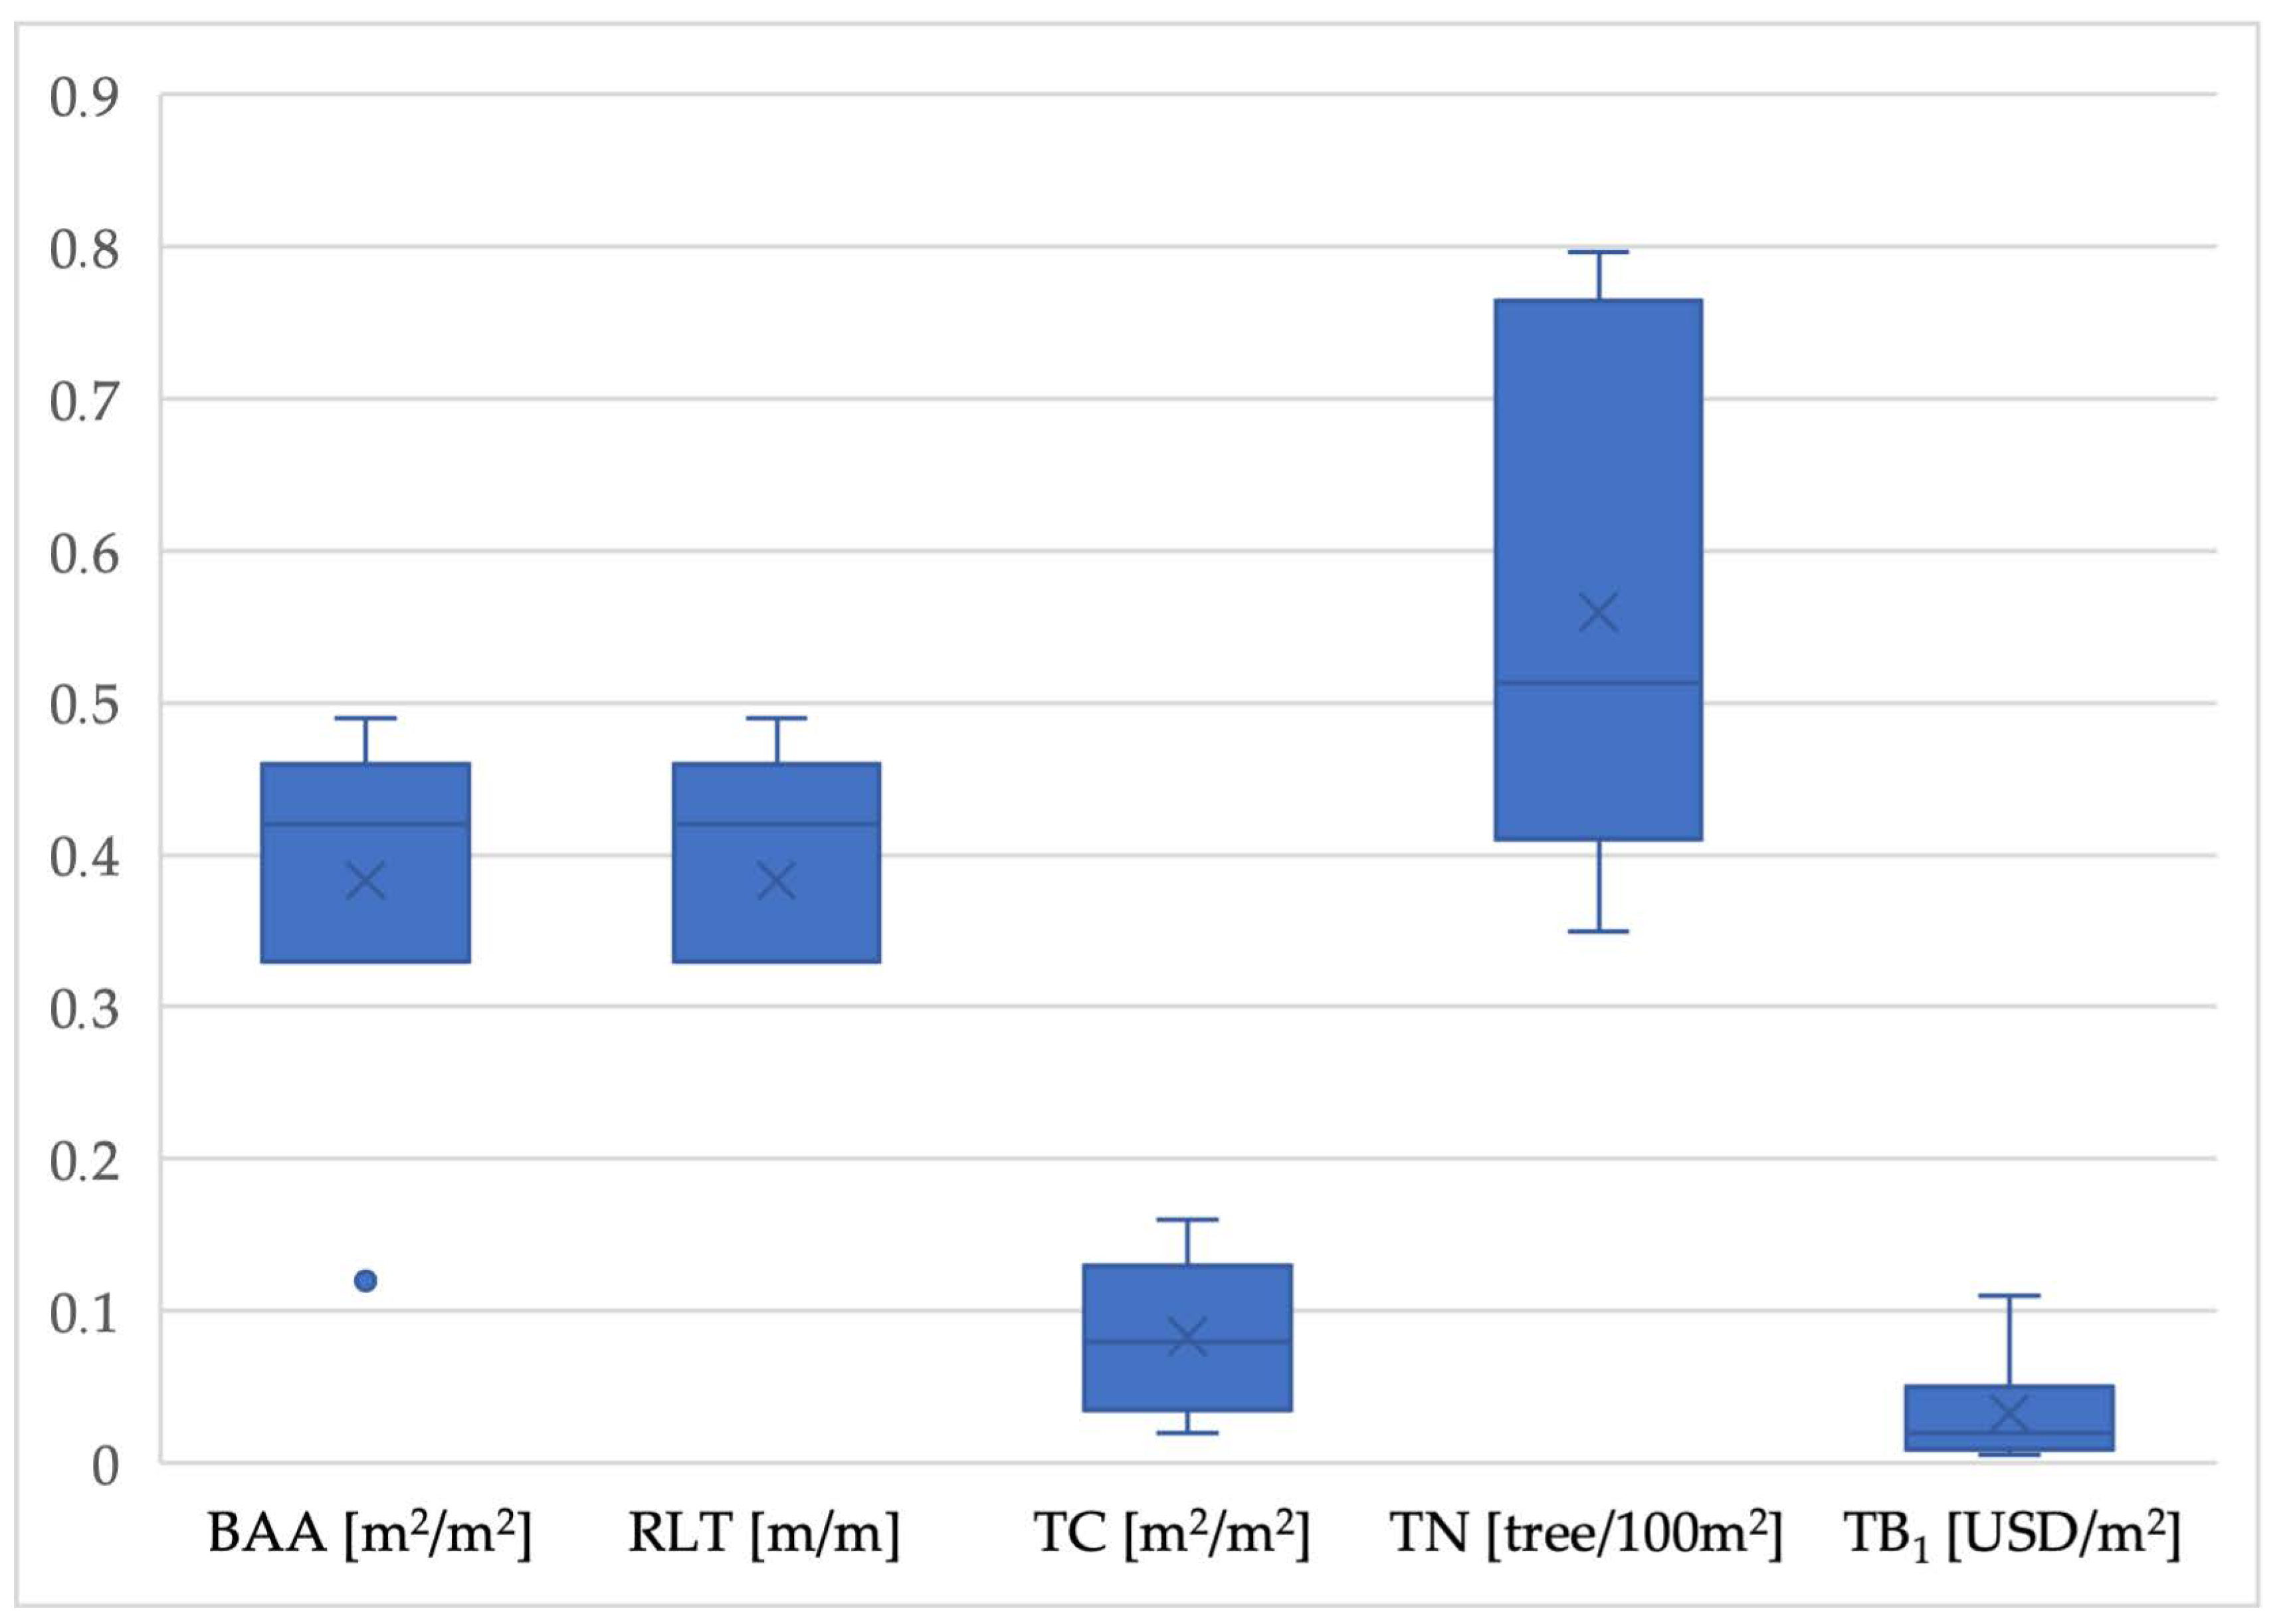
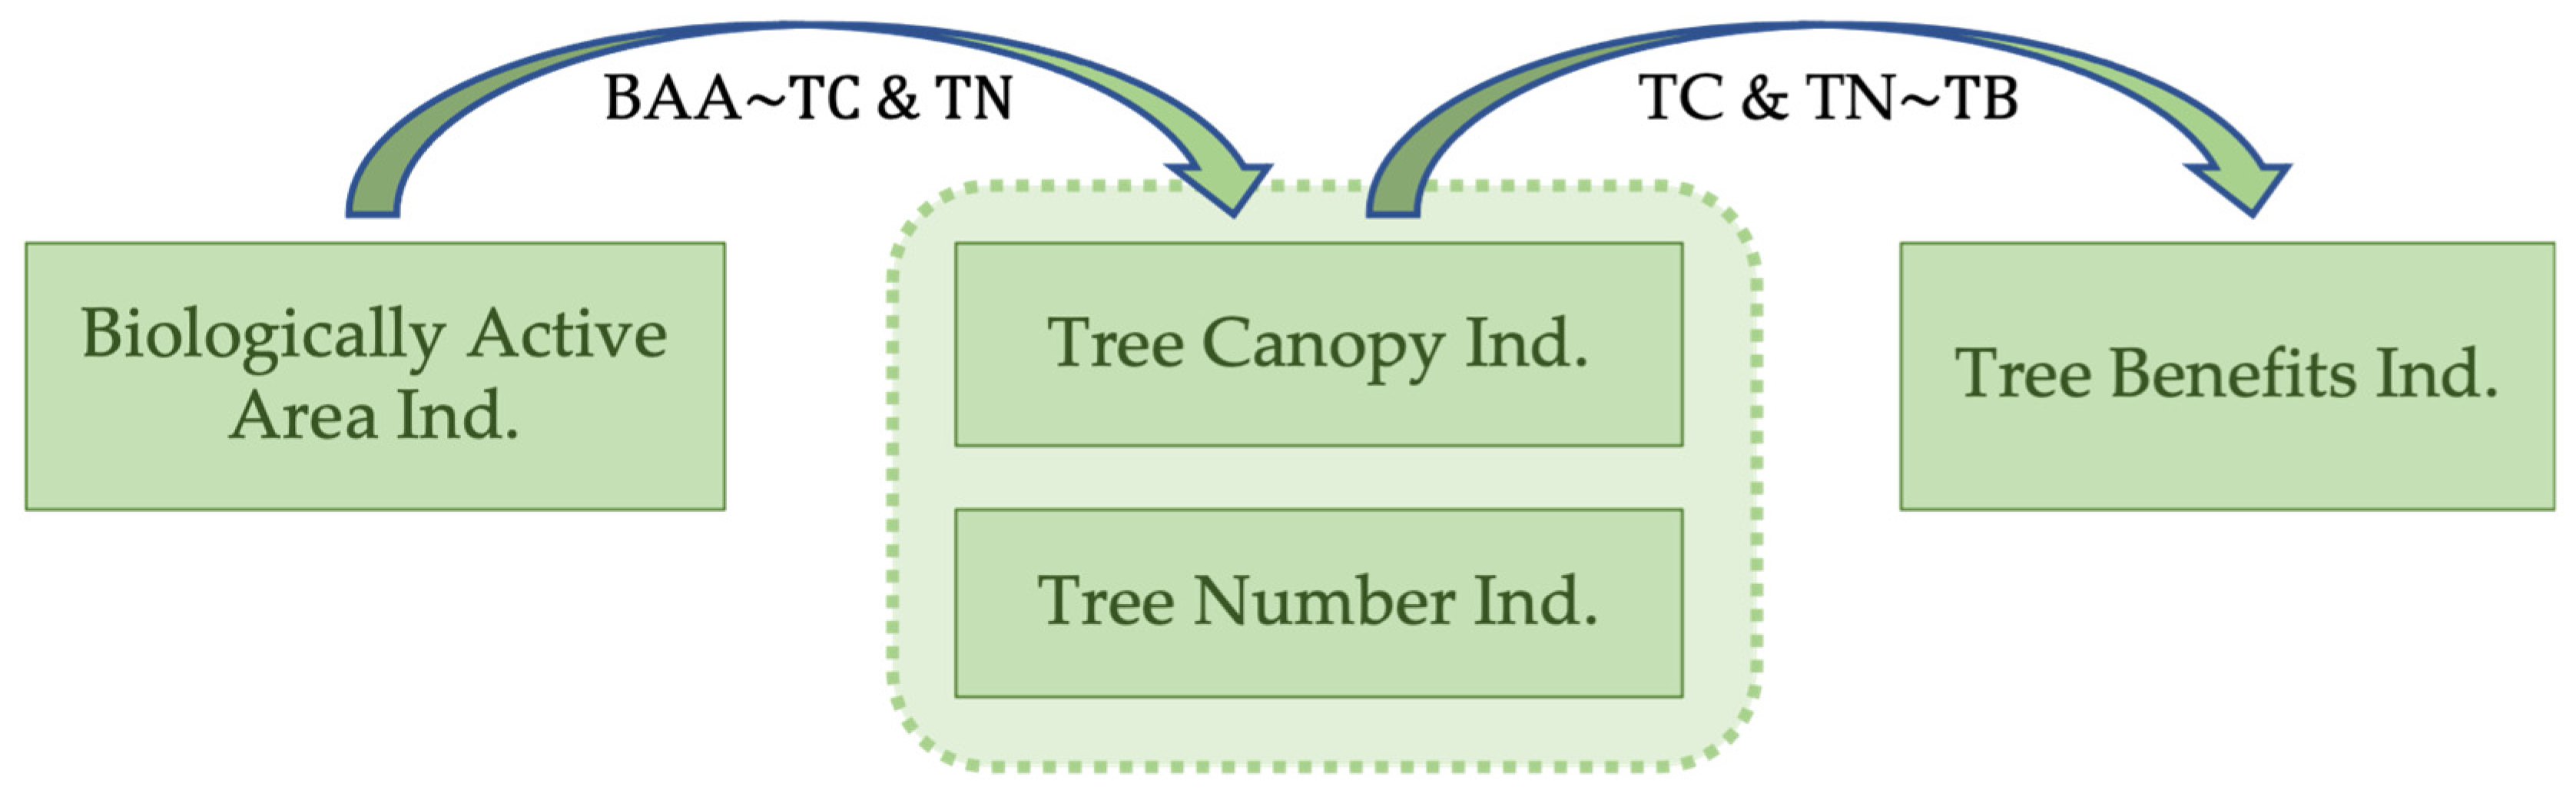
3.3. Relationships between the Indicators

The research results show specific proportions for the indicators used. The first link of this type can be observed between the Biologically Active Area and Tree Canopy indicators. In all but one case, the compared housing estates took the same place in the ranking in both categories (Table 7 and Figure 16). This convergence is most likely due to the natural requirement to provide trees with adequate space to develop. A low Biologically Active Area ratio might cause trees to be planted too close to buildings, which will disturb their development and, consequently, reduce the potential value of the Tree Canopy indicator.
An apparent convergence between the Tree Canopy and Tree Benefits indicators was also observed. Simultaneously, the Tree Number indicator was positively correlated with the other indicators. However, it could have less predictability if treated separately from the two previously mentioned. Logically, the number of trees per surface area unit might not reflect the actual situation concerning the canopy shield and the value of the ecological benefits provided by the tree community. Therefore, the Tree Number indicator should be analyzed jointly with the Tree Canopy and the Tree Benefits indicators to provide a complete image.
The research results allow us to outline a scheme of the critical connections between the indicators, responding to Research Questions 3 and 4. The Tree Canopy and Tree Number indicators are central to this system, maintaining a high inter-relationship with other indicators. The TC and TN are proportional to the BAA, and the TB is proportional to TC and TN. The correlation coefficient between indicators shows that BAA has the most robust relationship with TC and TN. The correlation between BAA and TB is less prominent than between TB and other indicators. (Table 8). Thus, the BAA translates into TB indirectly, with TC and TN as intermediaries. The Routes Lined with Trees indicator showed the weakest connection to BAA, although it was positively correlated with all other indicators. It turned out to be the most case-sensitive indicator in the study, strongly influenced by the design factors, e.g., the district’s typology and layout.
Answer to Research Question 3: BAA translates directly into TC and TN and indirectly into TB, with TC and TN as intermediaries (Figure 18).
Answer to Research Question 4: TC and TN indicators are vital for assessing and anticipating the ecological advantages provided by the tree communities in residential areas. As such, they should be employed with regular BAA calculations to optimize for environmental benefits.

4. Discussion

The research results can be discussed in two categories: (i) ascertaining the current problems related to the planning of suburban multi-family housing districts in Poland and identifying the directions for necessary improvements, and (ii) the applicability of the presented methodology in terms of evaluating the environmental friendliness of suburban housing design models.

4.1. Problems Related to the Planning of Suburban Residential Districts

The research results refer to the existing knowledge regarding Poland’s land use and land cover change dynamics. Many publications from the last decade have pointed to the problem of transforming arable land and other green areas into residential satellites in the suburban fringe of major cities [80,81,82,83,84,85]. Rapid suburban development has contributed to spatial problems such as chaos and landscape degradation, resulting in diverse socioeconomic and environmental costs [86,87,88,89]. Another study showed an upward trend in Poland regarding green areas in the following categories in 2004–2012: forested land, greenery in housing estates, recreational parks, cemeteries, street greenery, and lawns [90].
The development of new housing estates in the suburban fringe is, therefore, carried out mainly at the expense of agricultural land. Still, it contributes to an increase in urban green areas. As the total area of lawns, gardens, streetscape, urban parks, and forests increases, the size of the overall area covered with vegetation is on a downward trend.
The novelty of the presented research is the comparison of different suburban planning models in terms of their environmental friendliness, assessed through the Biologically Active Area ratio and the indicators measuring the efficiency of their tree communities in terms of delivering ecosystem benefits. The results ascertain that the residential planning standards in the study area have worsened in some respects over the last century. The Biologically Active Area ratio remained similar throughout the research time-space, but the tree canopy area and the environmental benefits of the tree communities dropped dramatically.
One of the reasons for the reported situation is the selection of tree species. As reported by a study on revitalizing post-war multi-family housing neighborhoods in Poland [91], random plantings by the residents frequently interfere with the original landscape design assumptions, also causing the threat of introducing invasive species. Also, the proper maintenance of trees is frequently an issue. In addition to improving the above, an important indication of change is a more sustainable design of new plantings, with particular emphasis on species selection. Native tree species, which can achieve their full size in the local soil and climate zone, are preferred because of their natural capacity to bring environmental benefits at a higher level.
Besides its impacts on climate change mitigation and thermal comfort [54,92,93,94,95,96], greenery has been globally proven to create an environment that promotes well-being and sets a higher quality of life standard [53,97,98,99,100]. The proximity of protected areas and landscape diversity, including urban blue spaces, might increase the property value [101,102,103]. Even a small amount of greenery reduces stress and positively influences mental health [55], while biodiversity has been proven to affect human health positively [104]. This evidence prompts a rethinking of urban horticulture towards increasing biodiversity and including more forms of urban greenery [105,106].
In response to the above-discussed problems, improving the suburban planning paradigm should include the development of streetscape design guidelines as a standard procedure. Such guidelines should consider, among other things, (i) the specification of paving solutions to maximize the Biologically Active Area ratio, (ii) the provision of space for high greenery (i.e., trees), and (iii) suggestions for the selection of tree species that will meet the requirements of various stakeholders while delivering the maximum ecosystem benefits.
The above recommendation applies to designing new housing neighborhoods and retrofitting existing ones. Case Study No. 5, a recently designed market square, corresponds to the current hot topic of the not-entirely positive revitalization of old town squares in Poland. While the renewal efforts tend to focus on the built heritage, the role of greenery is frequently overlooked or even removed—utterly and intentionally [107,108,109]. This practice harms the quality of the townscape, in which greenery constitutes a significant marker [110].
Rethinking urban greenery to provide more biodiversity should be added to other efforts to remedy the current situation in the suburban fringe of Polish cities, e.g., working against spatial chaos, acting to improve compactness, walkability, and accessibility [111,112], or developing standards of pedestrian accessibility to green spaces [113]. This study adds to the existing discussion by showing that the planning of residential areas needs to consider providing adequate space for large trees to grow.
Selecting tree species for public spaces should be optimized regarding various aspects, including climate change mitigation and aesthetics [95]. Street tree communities bring several benefits that can be expressed in terms of their monetary value, as this study also showed, proving that some of these benefits increase proportionally with the size of the trees’ mature canopy. Previous studies showed, among other things, that the canopy area impacts thermal comfort through shading [54]. This research ascertained the relationship between the tree canopy and monetary benefits related to carbon sequestration, pollution removal, and stormwater mitigation. It also proved the advantage of native tree species in this respect, e.g., common linden, oak, ash, or maple, through a greater ability to develop the canopy.
On the other hand, some contemporary research has ascertained that proper tree species selection for residential projects must also consider their allergenicity to humans [114,115]. For example, trees that promote allergies most severely, like birches, poplars, and limes (linden), should not be used for playground areas, among other areas. Therefore, the final choices of tree species to be planted in public areas of residential districts must be made based on a compromise between different points of view.
One of the highlights of this study is demonstrating the advantage of common native species of trees above the decorative grafted ones in terms of providing canopy and ecosystem benefits. Even considering the growth of trees within the timespan of twenty years, tree communities in which decorative species prevailed were still unable to achieve benefits comparable to those of tree communities dominated by native species.

4.2. Applicability of the Presented Method

The methodology used in the above research in the Poznań metropolitan area can also be applied in other locations to compare planning models regarding ecosystem benefits resulting from their greenery levels. Appropriate selection of the compared examples and the composition of the set of indicators are crucial from the point of view of the validity of the results.
The Biologically Active Area (BBA) Indicator used in this study corresponds to the Green Area Ratio (GAR) concept popularly used in contemporary research on comprehensive environmental planning. One of the main directions of this research is to assess the impacts of this indicator on climate change mitigation, thermal comfort, and reducing the Urban Heat Island effect [54,57,94,96,116]. Numerous studies have confirmed the beneficial effects of greenery on climate protection and the quality of life, and some have proposed that urban transformation should be approached by measuring the GAR per capita [117]. Another engaging concept assumed to improve the urban environment is the requirement for green infrastructure enhancements on private properties [57].
The novelty of this research is that it compares the BAA ratio with indicators that determine the environmental benefits of greenery, emphasizing the role of trees. The relationship between the BAA ratio and the Tree Canopy and Tree Benefits indicators has shown predictability, following the logic that having more green space favors the development of large trees, which create larger crowns and bring the most ecosystem benefits.
The results also confirm that the Route Lined with Trees indicator, modeled on the proposition of Degórski and others [66], is suitable for comparing larger territorial units, e.g., metropolitan areas. On the scale of a limited district, the RLT, as an indicator of ecosystem services in urbanized areas, appears to be case-sensitive.
Finally, the Tree Benefits indicator provides a measurable comparison of the environmental profits delivered by the trees, considering their growth in a twenty-year timeframe. The i-Tree tools used in the study allowed us to assess and compare the monetary value of the ecosystem services of greenery in six case studies. The same tools were used, among others, in works that assessed the monetary value of benefits brought by street trees and compared the ecosystem services of various types of urban green spaces [45,118]. This study, in turn, utilized the Tree Benefits indicator, calculated as the total monetary value of the ecosystem services delivered by the trees, including the carbon dioxide uptake, stormwater mitigation, and air pollution removal, divided per unit area, to compare the levels of environmental friendliness in the selected case studies. The results showed that older trees and native tree species bring more significant environmental advantages, even after considering the growth of new plantings. This observation provides conclusions regarding the design of plantings in newly planned residential districts.
An unavoidable limitation of the presented procedure’s applicability is the case study selection. Especially with a smaller number of selected examples, their belonging to one development typology plays a key role. For example, the above study compared only suburban multi-family housing estates while strictly defining the chronological interval. Despite this, one of the examples differed in terms of the research results from the others due to the market square typology of its main public space. Apart from promoting a rethink of the selection of paving types for public spaces, this situation restricts the method’s applicability. Namely, it can be anticipated that limiting the research to comparing two examples of a completely different nature (e.g., a single-family housing estate and a city block with tenement houses) would create an opportunity for manipulation. Correct application of the above method requires a structured selection of examples, preferably corresponding to one urban typology.

5. Conclusions

The presented research aimed to compare different suburban residential district planning models, characteristic for specific periods in the Poznań metropolitan region. The results support the formulation of conclusions concerning (1) the current state of greenery in suburban residential districts, (2) guidelines for the design of new housing estates or the retrofitting of existing ones, and (3) the application of the presented method in other locations.
(1)
The study results show that the greenery content in suburban multi-family housing districts in the study area is on a downward trend. Of all indicators used in the research, the Biologically Active Area ratio showed the smallest decrease across the period covered by the analysis, primarily because the local zoning plans require it to have a minimum level. The situation regarding the quantity and quality of trees turned out to be worse, and this was mainly expressed by drastic decreases in the canopy and ecological benefits provided by the trees. This problem is related to allocating appropriate space for the development of trees and species selection.
(2)
The problems observed during the study provided the basis for formulating recommendations on improving Poland’s suburban planning standards. The guidelines for designing new housing estates or retrofitting existing ones should indicate more frequent use of permeable surfaces and include the role of trees in setting the streetscape standards. Native and nongrafted tree species should be preferred due to their more remarkable ability to deliver environmental benefits. The above recommendations should be included in the zoning plans in the form of the applicable local laws.
(3)
The third group of conclusions refers to the feedback obtained from applying the presented method based on selected indicators. The study showed significant interconnections between the Biologically Active Area ratio, the Tree Canopy, the Tree Number, and the Tree Benefits indicators. The combination of these indicators has been proven to help assess the relationship between green space and the ability of trees to develop a canopy and provide ecosystem services. The presented method can be regularly used in planning practices to measure the ecological advantages of greenery. More importantly, the method allows fast feedback to be obtained for neighborhood projects in this respect. Considering the role of greenery in mitigating climate change, applying the presented method in spatial planning will complement ongoing efforts towards achieving sustainable development goals in the building design sector.

Author Contributions

Conceptualization, M.P.; methodology, M.P. and P.Z.; validation, J.K.; formal analysis, M.G. and M.P.; investigation, M.P., J.K. and P.Z.; resources, M.P., J.K. and P.Z.; data curation, M.P., J.K. and P.Z.; writing—original draft preparation, M.P.; writing—review and editing, M.G. and P.Z.; visualization, M.P.; supervision, M.P.; project administration, M.P. All authors have read and agreed to the published version of the manuscript.

Funding

This research was funded from statutory funds of the Poznań University of Technology, Faculty of Architecture. Funds numbers: 0111/SBAD/2309, 0111/SBAD/2408, and 0111/SBAD/2413.

Institutional Review Board Statement

Not applicable.

Informed Consent Statement

Not applicable.

Data Availability Statement

The original contributions presented in the study are included in the article; further inquiries can be directed to the corresponding author.

Conflicts of Interest

The authors declare no conflicts of interest.

References

  1. Kibert, C.J. Sustainable Construction: Green Building Design and Delivery, 4th ed.; John Wiley & Sons: Hoboken, NJ, USA, 2016. [Google Scholar]
  2. Mousa, M.; Luo, X.; McCabe, B. Utilizing BIM and Carbon Estimating Methods for Meaningful Data Representation. Procedia Eng. 2016, 145, 1242–1249. [Google Scholar] [CrossRef]
  3. Schützenhofer, S.; Kovacic, I.; Rechberger, H.; Mack, S. Improvement of Environmental Sustainability and Circular Economy through Construction Waste Management for Material Reuse. Sustainability 2022, 14, 11087. [Google Scholar] [CrossRef]
  4. The Intergovernmental Panel on Climate Change (IPCC). Climate Change 2014: Synthesis Report. Contribution of Working Groups I, II and III to the Fifth Assessment Report of the Intergovernmental Panel on Climate Change; United Nations: New York, NY, USA, 2014. [Google Scholar]
  5. Loveday, J.; Morrison, G.M.; Martin, D.A. Identifying Knowledge and Process Gaps from a Systematic Literature Review of Net-Zero Definitions. Sustainability 2022, 14, 3057. [Google Scholar] [CrossRef]
  6. Wang, J.-J.; Jing, Y.-Y.; Zhang, C.-F.; Zhao, J.-H. Review on multi-criteria decision analysis aid in sustainable energy decision-making. Renew. Sustain. Energy Rev. 2009, 13, 2263–2278. [Google Scholar] [CrossRef]
  7. Ghafghazi, S.; Sowlati, T.; Sokhansanj, S.; Melin, S. A multicriteria approach to evaluate district heating system options. Appl. Energy 2010, 87, 1134–1140. [Google Scholar] [CrossRef]
  8. Pohekar, S.D.; Ramachandran, M. Application of multi-criteria decision making to sustainable energy planning—A review. Renew. Sustain. Energy Rev. 2004, 8, 365–381. [Google Scholar] [CrossRef]
  9. Karunathilake, H.; Hewage, K.; Mérida, W.; Sadiq, R. Renewable energy selection for net-zero energy communities: Life cycle-based decision making under uncertainty. Renew. Energy 2019, 130, 558–573. [Google Scholar] [CrossRef]
  10. Denis, G.; Parker, P. Community energy planning in Canada: The role of renewable energy. Renew. Sustain. Energy Rev. 2009, 13, 2088–2095. [Google Scholar] [CrossRef]
  11. Perpiña Castillo, C.; Batista e Silva, F.; Lavalle, C. An assessment of the regional potential for solar power generation in EU-28. Energy Policy 2016, 88, 86–99. [Google Scholar] [CrossRef]
  12. Hong, T.; Koo, C.; Kwak, T.; Park, H.S. An economic and environmental assessment for selecting the optimum new renewable energy system for educational facility. Renew. Sustain. Energy Rev. 2014, 29, 286–300. [Google Scholar] [CrossRef]
  13. Ruparathna, R.; Hewage, K.; Sadiq, R. Economic evaluation of building energy retrofits: A fuzzy based approach. Energy Build. 2017, 139, 395–406. [Google Scholar] [CrossRef]
  14. Anderson, D.; Andrews, D.; Barret, M.; Cali, U.; Everett, B.; Giebel, G.; Green, T.; Gross, R.; Heptonstall, P.; Hughes, P.; et al. Renewable Electricity and the Grid. The Challenge of Variability, 1st ed.; Boyle, G., Ed.; Earthscan: London, UK, 2007. [Google Scholar]
  15. Rojas-Zerpa, J.C.; Yusta, J.M. Application of multicriteria decision methods for electric supply planning in rural and remote areas. Renew. Sustain. Energy Rev. 2015, 52, 557–571. [Google Scholar] [CrossRef]
  16. Varun, G.; Bhat, I.K.; Prakash, R. LCA of renewable energy for electricity generation systems—A review. Renew. Sustain. Energy Rev. 2009, 13, 1067–1073. [Google Scholar] [CrossRef]
  17. Magagna, D.; Uihlein, A. Ocean energy development in Europe: Current status and future perspectives. Int. J. Mar. Energy 2015, 11, 84–104. [Google Scholar] [CrossRef]
  18. Choi, D.G.; Park, S.Y.; Park, N.B.; Hong, J.C. Is the concept of ‘grid parity’ defined appropriately to evaluate the cost-competitiveness of renewable energy technologies? Energy Policy 2015, 86, 718–728. [Google Scholar] [CrossRef]
  19. Amponsah, N.Y.; Troldborg, M.; Kington, B.; Aalders, I.; Hough, R.L. Greenhouse gas emissions from renewable energy sources: A review of lifecycle considerations. Renew. Sustain. Energy Rev. 2014, 39, 461–475. [Google Scholar] [CrossRef]
  20. Guerrero-Lemus, R.; Martínez-Duart, J.M. Renewable Energies and CO2; Springer: London, UK, 2013; Volume 3. [Google Scholar] [CrossRef]
  21. Nubi, O.; Morse, S.; Murphy, R.J. Electricity Generation from Municipal Solid Waste in Nigeria: A Prospective LCA Study. Sustainability 2022, 14, 9252. [Google Scholar] [CrossRef]
  22. Rucińska, J.; Komerska, A.; Kwiatkowski, J. Preliminary Study on the GWP Benchmark of Office Buildings in Poland Using the LCA Approach. Energies 2020, 13, 3298. [Google Scholar] [CrossRef]
  23. Grygierek, K.; Ferdyn-Grygierek, J. Analysis of the Environmental Impact in the Life Cycle of a Single-Family House in Poland. Atmosphere 2022, 13, 245. [Google Scholar] [CrossRef]
  24. Ogrodnik, K. Multi-Criteria Analysis of Design Solutions in Architecture and Engineering: Review of Applications and a Case Study. Buildings 2019, 9, 244. [Google Scholar] [CrossRef]
  25. Zhang, N.; Han, Q.; de Vries, B. Building Circularity Assessment in the Architecture, Engineering, and Construction Industry: A New Framework. Sustainability 2021, 13, 12466. [Google Scholar] [CrossRef]
  26. Eberhardt, L.C.M.; Birkved, M.; Birgisdottir, H. Building design and construction strategies for a circular economy. Archit. Eng. Des. Manag. 2022, 18, 93–113. [Google Scholar] [CrossRef]
  27. Ellen MacArthur Foundation, Material Circularity Indicator (MCI). Available online: https://www.ellenmacarthurfoundation.org/material-circularity-indicator (accessed on 22 December 2023).
  28. Kapliński, O.; Bonenberg, W. Architecture and Engineering: The Challenges—Trends—Achievements. Buildings 2020, 10, 181. [Google Scholar] [CrossRef]
  29. Maskil-Leitan, R.; Gurevich, U.; Reychav, I. BIM Management Measure for an Effective Green Building Project. Buildings 2020, 10, 147. [Google Scholar] [CrossRef]
  30. Zima, K.; Plebankiewicz, E.; Wieczorek, D. A SWOT Analysis of the Use of BIM Technology in the Polish Construction Industry. Buildings 2020, 10, 16. [Google Scholar] [CrossRef]
  31. Sędzicki, D.; Cudzik, J.; Bonenberg, W.; Nyka, L. Computer-Aided Automated Greenery Design—Towards a Green BIM. Sustainability 2022, 14, 8927. [Google Scholar] [CrossRef]
  32. Kołata, J.; Zierke, P. The Decline of Architects: Can a Computer Design Fine Architecture without Human Input? Buildings 2021, 11, 338. [Google Scholar] [CrossRef]
  33. Hulicka, A. Miasto zielone—Miasto zrównoważone. sposoby kształtowania Miejskich terenów zieleni w na-wiązaniu do idei Green city (en. Green city—Sustainable city. ways of shaping urban green areas in relation to the idea of Green city). Pr. Geogr. (En. Geogr. Work.) 2015, 141, 73–85. [Google Scholar]
  34. McGregor, A.; Cowdy, M. Biourbanism|cities as nature: A resilience model for Anthromes. Sci. Talks 2023, 7, 100238. [Google Scholar] [CrossRef]
  35. Rega-Brodsky, C.C.; Aronson, M.; Piana, M.; Carpenter, E.S.; Hahs, A.K.; Herrera-Montes, A.; Knapp, S.; Johan Kotze, D.; Lepczyk, C.A.; Moretti, M.; et al. Urban biodiversity: State of the science and future directions. Urban Ecosyst. 2022, 25, 1083–1096. [Google Scholar] [CrossRef]
  36. Shwartz, A.; Turbé, A.; Simon, L.; Julliard, R. Enhancing urban biodiversity and its influence on city-dwellers: An experiment. Biol. Conserv. 2014, 171, 82–90. [Google Scholar] [CrossRef]
  37. Sattler, T.; Obrist, M.K.; Duelli, P.; Moretti, M. Urban arthropod communities: Added value or just a blend of surrounding biodiversity? Landsc. Urban Plan. 2011, 103, 347–361. [Google Scholar] [CrossRef]
  38. Norton, B.A.; Evans, K.L.; Warren, P.H. Urban Biodiversity and Landscape Ecology: Patterns, Processes and Planning. Curr. Landsc. Ecol. Rep. 2016, 1, 178–192. [Google Scholar] [CrossRef]
  39. Werner, P.; Kelcey, J.G. Urban Green and Biodiversity. In Greening Cities. Advances in 21st Century Human Settlements; Tan, P., Jim, C., Eds.; Springer: Singapore, 2017; pp. 131–154. [Google Scholar] [CrossRef]
  40. Müller, N.; Werner, P.; Kelcey, J.G. (Eds.) Urban Biodiversity and Design; Wiley: Hoboken, NJ, USA, 2010. [Google Scholar] [CrossRef]
  41. Faeth, S.H.; Saari, S.; Bang, C. Urban Biodiversity: Patterns, Processes and Implications for Conservation. In Encyclopedia of Life Sciences; Wiley: Hoboken, NJ, USA, 2012. [Google Scholar] [CrossRef]
  42. Schwarz, N.; Moretti, M.; Bugalho, M.N.; Davies, Z.G.; Haase, D.; Hack, J.; Hof, A.; Melero, Y.; Pett, T.J.; Knapp, S. Understanding biodiversity-ecosystem service relationships in urban areas: A comprehensive literature review. Ecosyst. Serv. 2017, 27, 161–171. [Google Scholar] [CrossRef]
  43. Suchocka, M.; Jarska, A. Drzewa Miejskie: Wartość i Zarządzanie (en. Urban Trees: Value and Management), 1st ed.; Wydawnictwo SGGW: Warsaw, Poland, 2020. [Google Scholar]
  44. Liu, J.; Slik, F. Are street trees friendly to biodiversity? Landsc. Urban Plan. 2022, 218, 104304. [Google Scholar] [CrossRef]
  45. Wang, X.; Yao, J.; Yu, S.; Miao, C.; Chen, W.; He, X. Street Trees in a Chinese Forest City: Structure, Benefits and Costs. Sustainability 2018, 10, 674. [Google Scholar] [CrossRef]
  46. Zhang, H.; Jim, C.Y. Contributions of landscape trees in public housing estates to urban biodiversity in Hong Kong. Urban For. Urban Green. 2014, 13, 272–284. [Google Scholar] [CrossRef]
  47. Mendonça-Santos, R.G.; Antoniazzi, R.; Camarota, F.; dos Reis, Y.T.; Viana-Junior, A.B. Scattered trees as crucial elements in maintaining urban diversity: A case study with canopy ants in a biodiversity hotspot. Acta Oecologica 2023, 118, 103894. [Google Scholar] [CrossRef]
  48. Konijnendijk, C.C. Evidence-based guidelines for greener, healthier, more resilient neighbourhoods: In-troducing the 3–30–300 rule. J. For. Res. 2023, 34, 821–830. [Google Scholar] [CrossRef]
  49. Vos, C.C.; Opdam, P.; Steingröver, E.G.; Reijnen, R. Transferring ecological knowledge into landscape planning: A design method for ecological corridors. In Key Topics and Perspectives in Landscape Ecology; Wu, J., Hobbs, R., Eds.; Cambridge University Press: New York, NY, USA, 2007; pp. 227–245. [Google Scholar]
  50. Bossel, H. Indicators for Sustainable Development: Theory, Method, Applications; International Institute for Sustainable Development: Winnipeg, MB, Canada, 1999. [Google Scholar]
  51. Kilnarová, P.; Wittmann, M. Open Space between Residential Buildings as a Factor of Sustainable Development—Case Studies in Brno (Czech Republic) and Vienna (Austria). IOP Conf. Ser. Earth Environ. Sci. 2017, 95, 052008. [Google Scholar] [CrossRef]
  52. Szczepańska, M.; Gałecka-Drozda, A.; Wilkaniec, A. Green Space at New Housing Estates: Flat Price Versus Accessibility to Good Quality Greenery. Sustainability 2023, 15, 9997. [Google Scholar] [CrossRef]
  53. Bell, S.; Hamilton, V.; Montarzino, A.; Rothnie, H.; Travlou, P.; Alves, S. Greenspace and Quality of Life: A Critical Literature Review; Greenspace Scotland: Stirling, UK, 2008; pp. 1–75. [Google Scholar]
  54. Klemm, W.; Heusinkveld, B.G.; Lenzholzer, S.; van Hove, B. Street greenery and its physical and psychological impact on thermal comfort. Landsc. Urban Plan. 2015, 138, 87–98. [Google Scholar] [CrossRef]
  55. Gu, J.; Liu, H.; Lu, H. Can Even a Small Amount of Greenery Be Helpful in Reducing Stress? A Systematic Review. Int. J. Environ. Res. Public Health 2022, 19, 9778. [Google Scholar] [CrossRef] [PubMed]
  56. McGlynn, M.; Noonan, M.; Cidlowski, L.; Stack, R.C.; Wooden, D. Green Area Ratio Guidebook; Department of Energy and Environment: Washington, DC, USA, 2017. [Google Scholar]
  57. Keeley, M. The Green Area Ratio: An urban site sustainability metric. J. Environ. Plan. Manag. 2011, 54, 937–958. [Google Scholar] [CrossRef]
  58. Artmann, M. Urban gray vs. urban green vs. soil protection—Development of a systemic solution to soil sealing management on the example of Germany. Environ. Impact Assess. Rev. 2016, 59, 27–42. [Google Scholar] [CrossRef]
  59. Tobias, S.; Conen, F.; Duss, A.; Wenzel, L.M.; Buser, C.; Alewell, C. Soil sealing and unsealing: State of the art and examples. Land Degrad. Dev. 2018, 29, 2015–2024. [Google Scholar] [CrossRef]
  60. Peroni, F.; Pristeri, G.; Codato, D.; Pappalardo, S.E.; De Marchi, M. Biotope Area Factor: An Ecological Urban Index to Geovisualize Soil Sealing in Padua, Italy. Sustainability 2019, 12, 150. [Google Scholar] [CrossRef]
  61. Förster, M.; Köppen, A.; Ferretti, J.; Köppel, J.; Kleinschmit, B. Generalisation of Planning Data as a Contribution to Strategic Environmental Assessments (SEA): The Example of a City-Wide Biotope-Type Assessment for Berlin. In Planning Support Systems for Sustainable Urban Development. Lecture Notes in Geoinformation and Cartography; Geertman, S., Toppen, F., Stillwell, J., Eds.; Springer: Berlin, Germany, 2013; Volume 195, pp. 151–165. [Google Scholar] [CrossRef]
  62. Stange, E.E.; Barton, D.N.; Andersson, E.; Haase, D. Comparing the implicit valuation of ecosystem services from nature-based solutions in performance-based green area indicators across three European cities. Landsc. Urban Plan. 2022, 219, 104310. [Google Scholar] [CrossRef]
  63. Becker, G.; Mohren, R. The Biotope Area Factor as an Ecological Parameter. Principles for Its Determination and Identification of the Target; Excerpt, Landschaft Planen & Bauen: Berlin, Germany, 1990. [Google Scholar]
  64. Obwieszczenie Ministra Inwestycji i Rozwoju z Dnia 15 Kwietnia 2022 r. w Sprawie Ogłoszenia Jednolitego Tekstu Rozporządzenia Ministra Infrastruktury w Sprawie Warunków Technicznych, Jakim Powinny Odpowiadać Budynki i ich Sytuowanie (en. Announcement of the Minister of Investment and Development of 15 April 2022 on the Announcement of the Consolidated Text of the Regulation of the Minister of Infrastructure on the Technical Conditions to be Met by Buildings and Their Location). Dziennik Ustaw (en. Journal of Laws), poz. 1225. 2022. Available online: https://isap.sejm.gov.pl/isap.nsf/DocDetails.xsp?id=WDU20220001225 (accessed on 4 April 2024).
  65. Ustawa z Dnia 7 Lipca 2023 r. o Zmianie Ustawy o Planowaniu i Zagospodarowaniu Przestrzennym oraz Niektórych Innych Ustaw (en. Act of July 7, 2023 Amending the Act on Spatial Planning and Development and Certain Other Acts). Dz. Ustaw (En. J. Laws) 2023, 1688. Available online: https://isap.sejm.gov.pl/isap.nsf/DocDetails.xsp?id=WDU20230001688 (accessed on 30 October 2023).
  66. Degórski, M.; Affek, A.; Degórska, B.; Kowalska, A.; Regulska, E.; Solon, J.; Wolski, J. Wstępna Propozycja Usług Ekosystemowych i Ich Wskaźników Istotnych dla Ekosystemów Zurbanizowanych (En. Initial Proposal of Ecosystem Services and Their Indicators Important for Urbanized Ecosystems); Institute of Geography and Spatial Organization, Polish Academy of Sciences: Warsaw, Poland, 2021. [Google Scholar]
  67. Zajączkowski, D.; Zwierzchowska, I. Urban MAES—Usługi Ekosystemowe na Obszarach Zurbanizowanych (En. Urban MAES—Ecosystem Services in Urbanized Areas); Adam Mickiewicz University: Poznań, Poland, 2017; pp. 1–15. [Google Scholar]
  68. Department for Environment, Food and Rural Affairs. An Introductory Guide to Valuing Ecosystem Services; Department for Environment, Food and Rural Affairs: London, UK, 2007. [Google Scholar]
  69. Haines-Young, R.; Potschin, M. Common International Classification of Ecosystem Services (CICES) V5.1 Guidance on the Application of the Revised Structure; Fabis Consulting Ltd.: Nottingham, UK, 2018; pp. 1–53. [Google Scholar]
  70. Affek, A.; Degórski, M.; Wolski, J.; Solon, J.; Kowalska, A.; Roo-Zielińska, E.; Grabińska, B.; Kruczkowska, B. Ecosystem Service Potentials and Their Indicators in Postglacial Landscapes; Elsevier: Amsterdam, The Netherlands; Oxford, UK; Cambridge, MA, USA, 2020. [Google Scholar]
  71. Tan, X.; Hirabayashi, S.; Shibata, S. Estimation of Ecosystem Services Provided by Street Trees in Kyoto, Japan. Forests 2021, 12, 311. [Google Scholar] [CrossRef]
  72. System Informacji Przestrzennej Powiatu Poznańskiego (en. Spatial Information System of the Poznań County). Available online: https://poznanski.e-mapa.net/ (accessed on 17 March 2023).
  73. Krajowa Mapa Drzew (en. National Tree Map). Available online: https://aplikacja.mapadrzew.com/ (accessed on 17 March 2023).
  74. Local Data Bank, Statistics Poland. Available online: https://bdl.stat.gov.pl/bdl/start (accessed on 4 April 2024).
  75. Grzeszczuk-Brendel, H.; Klause, G. Domy socjalne na Zawadach (en. Social Housing at Zawady). Kron. Miasta Pozn. 2002, 2, 190–193. [Google Scholar]
  76. Google Earth. Available online: https://earth.google.com/web/ (accessed on 4 April 2024).
  77. Bonenberg, W.; Zierke, P. Dobra Kultury Współczesnej Jako Element Krajobrazu Powiatu Poznańskiego (En. Contemporary Cultural Goods as An Element of the Landscape of the Poznań County); Poznań University of Technology: Poznań, Poland, 2014. [Google Scholar]
  78. Pieczara, M. Truth and falsehood in contemporary design of public spaces on the example of the market square in Puszczykowo. In Defining the Architectural Space—The Truth and Lie of Architecture; Kozłowski, T., Ed.; Oficyna Wydawnicza ATUT—Wrocławskie Wydawnictwo Oświatowe: Wrocław, Poland, 2020; pp. 115–131. Volume 6. [Google Scholar]
  79. Ustawa z Dnia 27 Marca 2003 r. o Planowaniu i Zagospodarowaniu Przestrzennym (en. Act of March 27, 2003 on Spatial Planning and Development), Dziennik Ustaw (en. Journal of Laws), Nr 80, poz. 717. Mar. 27, 2003. Available online: https://isap.sejm.gov.pl/isap.nsf/download.xsp/WDU20030800717/U/D20030717Lj.pdf (accessed on 22 February 2022).
  80. Popławski, Z.S. Zmiany użytkowania ziemi w Polsce w ostatnich dwóch stuleciach (en. Land use changes in Poland during last two centuries). Teledetekcja Sr. (En. Remote Sens. Environ.) 2009, 42, 69–82. [Google Scholar]
  81. Lityński, P. The Intensity of Urban Sprawl in Poland. ISPRS Int. J. Geoinf. 2021, 10, 95. [Google Scholar] [CrossRef]
  82. Wnęk, A.; Kudas, D.; Stych, P. National Level Land-Use Changes in Functional Urban Areas in Poland, Slovakia, and Czechia. Land 2021, 10, 39. [Google Scholar] [CrossRef]
  83. Pieczara, M. Sustainable Land-Use Planning: Between Investment and Ecological Value of Suburban Areas. Teka Komisji Urban. Archit. Oddziału Pol. Akad. Nauk Krakowie, 2022; L, 163–188. [Google Scholar] [CrossRef]
  84. Kazak, J.K.; Błasik, M.; Świąder, M. Land use change in suburban zone: European context of urban sprawl. J. Water Land Dev. 2022, Special Issue, 92–98. [Google Scholar] [CrossRef]
  85. Szmytkie, R. Suburbanisation processes within and outside the city: The development of intra-urban suburbs in Wrocław, Poland. Morav. Geogr. Rep. 2021, 29, 149–165. [Google Scholar] [CrossRef]
  86. Śleszyński, P.; Markowski, T.; Kowalewski, A.; Nowak, M.J. Studia nad Chaosem Przestrzennym (En. Studies on Spatial Chaos); Committee for Spatial Economy and Regional Planning, Polish Academy of Sciences: Warsaw, Poland, 2018. [Google Scholar]
  87. Petelenz, M. Local spatial development plans—Threats or opportunities? Teka Komisji Urban. Archit. Oddziału Pol. Akad. Nauk Krakowie 2021, XLIX, 163–170. [Google Scholar]
  88. Mełges, H.; Mełges, M. Z rozważań o planowaniu przestrzeni wiejskiej na przykładzie Małopolski (en. From considerations on planning rural space on the example of Małopolska). Teka Komisji Urban. Archit. Oddziału Pol. Akad. Nauk Krakowie 2020, XLVIII, 251–266. [Google Scholar]
  89. Śleszyński, P.; Kowalewski, A.; Markowski, T.; Legutko-Kobus, P.; Nowak, M. The Contemporary Economic Costs of Spatial Chaos: Evidence from Poland. Land 2020, 9, 214. [Google Scholar] [CrossRef]
  90. Szymańska, D.; Lewandowska, A.; Rogatka, K. Temporal trend of green areas in Poland between 2004 and 2012. Urban For. Urban Green. 2015, 14, 1009–1016. [Google Scholar] [CrossRef]
  91. Przesmycka, E.; Napieralska, Z. Re-naturalization of post-war housing estates in Poland. The value of residential green space. In Architectural Research Addressing Societal Challenges; Taylor & Francis Group, CRC Press: Boca Raton, FL, USA, 2017; pp. 575–580. [Google Scholar] [CrossRef]
  92. Emmanuel, R.; Loconsole, A. Green infrastructure as an adaptation approach to tackling urban overheating in the Glasgow Clyde Valley Region, UK. Landsc. Urban Plan. 2015, 138, 71–86. [Google Scholar] [CrossRef]
  93. Spyrou, G.; Ioannou, B.; Souliotis, M.; Savvides, A.L.; Fokaides, P.A. The Adaptability of Cities to Climate Change: Evidence from Cities’ Redesign towards Mitigating the UHI Effect. Sustainability 2023, 15, 6133. [Google Scholar] [CrossRef]
  94. Saito, I.; Ishihara, O.; Katayama, T. Study of the effect of green areas on the thermal environment in an urban area. Energy Build. 1990, 15, 493–498. [Google Scholar] [CrossRef]
  95. Woodward, A.; Hinwood, A.; Bennett, D.; Grear, B.; Vardoulakis, S.; Lalchandani, N.; Lyne, K.; Williams, C. Trees, Climate Change, and Health: An Urban Planning, Greening and Implementation Perspective. Int. J. Environ. Res. Public Health 2023, 20, 6798. [Google Scholar] [CrossRef] [PubMed]
  96. Oliveira, S.; Andrade, H.; Vaz, T. The cooling effect of green spaces as a contribution to the mitigation of urban heat: A case study in Lisbon. Build. Environ. 2011, 46, 2186–2194. [Google Scholar] [CrossRef]
  97. Ambrey, C.; Fleming, C. Public Greenspace and Life Satisfaction in Urban Australia. Urban Stud. 2014, 51, 1290–1321. [Google Scholar] [CrossRef]
  98. Bertram, C.; Rehdanz, K. The role of urban green space for human well-being. Ecol. Econ. 2015, 120, 139–152. [Google Scholar] [CrossRef]
  99. Ma, B.; Zhou, T.; Lei, S.; Wen, Y.; Htun, T.T. Effects of urban green spaces on residents’ well-being. Environ. Dev. Sustain. 2019, 21, 2793–2809. [Google Scholar] [CrossRef]
  100. Stangierska, D.; Kowalczuk, I.; Juszczak-Szelągowska, K.; Widera, K.; Ferenc, W. Urban Environment, Green Urban Areas, and Life Quality of Citizens—The Case of Warsaw. Int. J. Environ. Res. Public Health 2022, 19, 10943. [Google Scholar] [CrossRef]
  101. Sylla, M.; Lasota, T.; Szewrański, S. Valuing Environmental Amenities in Peri-Urban Areas: Evidence from Poland. Sustainability, 2019; 11, 570. [Google Scholar] [CrossRef]
  102. Xiao, Y.; Li, Z.; Webster, C. Estimating the mediating effect of privately-supplied green space on the relationship between urban public green space and property value: Evidence from Shanghai, China. Land Use Policy 2016, 54, 439–447. [Google Scholar] [CrossRef]
  103. Peng, C.; Xiang, Y.; Chen, L.; Zhang, Y.; Zhou, Z. The Impact of the Type and Abundance of Urban Blue Space on House Prices: A Case Study of Eight Megacities in China. Land 2023, 12, 865. [Google Scholar] [CrossRef]
  104. Aerts, R.; Honnay, O.; van Nieuwenhuyse, A. Biodiversity and human health: Mechanisms and evidence of the positive health effects of diversity in nature and green spaces. Br. Med. Bull. 2018, 127, 5–22. [Google Scholar] [CrossRef]
  105. Savard, J.-P.L.; Clergeau, P.; Mennechez, G. Biodiversity concepts and urban ecosystems. Landsc. Urban Plan. 2000, 48, 131–142. [Google Scholar] [CrossRef]
  106. Ljubojević, M.; Narandžić, T.; Ostojić, J.; Tanjga, B.B.; Grubač, M.; Kolarov, R.; Greksa, A.; Pušić, M. Rethinking Horticulture to Meet Sustainable Development Goals—The Case Study of Novi Sad, Serbia. Horticulturae 2022, 8, 1222. [Google Scholar] [CrossRef]
  107. Kamińska, W.; Mularczyk, M. Attractiveness of Central Public Spaces in Small Polish Towns Based on a Spatial Order Analysis. Land 2021, 10, 1327. [Google Scholar] [CrossRef]
  108. Cichocki, M. Współczesne przestrzenie publiczne w małych miastach na przykładzie miasta Tłuszcz. Urban Dev. Issues 2020, 66, 197–206. [Google Scholar] [CrossRef]
  109. Dymek, D.; Jóźwik, J. Shaping Town Squares on the Example of the Towns of Lubelskie Voivodeship. Ann. Univ. Mar. Curie-Sklodowska Sect. B—Geogr. Geol. Mineral. Petrogr. 2021, 76, 1–28. [Google Scholar] [CrossRef]
  110. Bardzińska-Bonenberg, T.; Sobczyńska, K. Greenery, a Historical Townscape Marker and Stimulator. Poznan as a Case Study. Space Form 2018, 33, 9–42. [Google Scholar] [CrossRef]
  111. Mantey, D.; Pokojski, W. New Indicators of Spatial Chaos in the Context of the Need for Retrofitting Suburbs. Land 2020, 9, 276. [Google Scholar] [CrossRef]
  112. Majewska, A.; Denis, M.; Krupowicz, W. Urbanization Chaos of Suburban Small Cities in Poland: ‘Tetris Development’. Land 2020, 9, 461. [Google Scholar] [CrossRef]
  113. Rubaszek, J.; Gubański, J.; Podolska, A. Do We Need Public Green Spaces Accessibility Standards for the Sustainable Development of Urban Settlements? The Evidence from Wrocław, Poland. Int. J. Environ. Res. Public Health 2023, 20, 3067. [Google Scholar] [CrossRef]
  114. Kuchcik, M.; Dudek, W.; Błażejczyk, K.; Milewski, P.; Błażejczyk, A. Two faces to the greenery on housing estates–mitigating climate but aggravating allergy. A Warsaw case study. Urban For. Urban Green. 2016, 16, 170–181. [Google Scholar] [CrossRef]
  115. Eisenman, T.S.; Churkina, G.; Jariwala, S.P.; Kumar, P.; Lovasi, G.S.; Pataki, D.E.; Weinberger, K.R.; Whitlow, T.H. Urban trees, air quality, and asthma: An interdisciplinary review. Landsc. Urban Plan. 2019, 187, 47–59. [Google Scholar] [CrossRef]
  116. Yi, P.; Liu, L.; Huang, Y.; Zhang, M.; Liu, H.; Bedra, K.B. Study on the Coupling Relationship between Thermal Comfort and Urban Center Spatial Morphology in Summer. Sustainability 2023, 15, 5084. [Google Scholar] [CrossRef]
  117. Polat, H.I. An Approach to the Green Area Parameter in Urban Transformation. Civ. Eng. J. 2017, 3, 1020. [Google Scholar] [CrossRef]
  118. Song, P.; Kim, G.; Mayer, A.; He, R.; Tian, G. Assessing the Ecosystem Services of Various Types of Urban Green Spaces Based on i-Tree Eco. Sustainability 2020, 12, 1630. [Google Scholar] [CrossRef]
Figure 1. Poznań metropolitan area with the six case studies selected. 1: Case Study 1 (Zawady, Poznań); 2: Case Study 2 (Lubonianka, Luboń); 3: Case Study 3 (Cegielskiego Estate, Swarzędz); 4: Case Study 4 (Kolejowa Street, Dąbrówka); 5: Case Study 5 (Rynek, Puszczykowo); 6: Case Study 6 (Grafitowe Estate, Skórzewo).
Sustainability 16 03266 g001
Figure 2. Location of the housing district at Zawady, Poznań (red frame). Map source: Google Earth [76].
Sustainability 16 03266 g002
Figure 3. Housing district at Zawady, Poznań. Surface area: 13,814 m2; number of blocks: 3; approx. surface area of the blocks: 3180 m2.
Sustainability 16 03266 g003
Figure 4. Location of the Lubonianka housing district in Luboń (red frame). Map source: Google Earth [76].
Sustainability 16 03266 g004
Figure 5. Lubonianka housing estate, Luboń. Surface area: 38,026 m2; number of blocks: 12; approx. surface area of the blocks: 7277 m2.
Sustainability 16 03266 g005
Figure 6. Location of the Cegielskiego housing district in Swarzędz (red frame). Map source: Google Earth [76].
Sustainability 16 03266 g006
Figure 7. Cegielskiego estate, Swarzędz. Surface area: 49,891 m2; number of blocks: 7; approx. surface area of the blocks: 12,673 m2.
Sustainability 16 03266 g007
Figure 8. Location of the Kolejowa housing district in Dąbrówka (red frame). Map source: Google Earth [76].
Sustainability 16 03266 g008
Figure 9. Kolejowa Street, Dąbrówka. Surface area: 16,064 m2; number of blocks: 9; approx. surface area of the blocks: 3913 m2.
Sustainability 16 03266 g009
Figure 10. Location of Rynek in Puszczykowo (red frame). Map source: Google Earth [76].
Sustainability 16 03266 g010
Figure 11. Rynek in Puszczykowo. Surface area: 15,710 m2; number of blocks: 8; approx. surface area of the blocks: 3769 m2.
Sustainability 16 03266 g011
Figure 12. Location of the Grafitowe housing district in Skórzewo (red frame). Map source: Google Earth [76].
Sustainability 16 03266 g012
Figure 13. Grafitowe estate, Skórzewo. Surface area: 74,628 m2; number of blocks: 33; approx. surface area of the blocks: 16,380 m2.
Sustainability 16 03266 g013
Figure 14. Methodological framework diagram.
Sustainability 16 03266 g014
Figure 15. Values of indicators illustrating the current state of greenery content in the six case studies (CS 1–CS 6). The dot in the first column represents low BAA value in CS 5. The cross symbol is the mean of each indicator values.
Sustainability 16 03266 g015
Figure 16. Graphical visualization of the ranking of six case study districts (CS 1–CS 6).
Sustainability 16 03266 g016
Figure 17. Graph representing the values of selected indicators for the six case studies (CS 1–CS 6) and their trendlines.
Sustainability 16 03266 g017
Figure 18. Scheme of the relationships between the indicators.
Sustainability 16 03266 g018
Table 1. Multipliers for different tree sizes. Source: [56].
Landscape ElementMultiplier
Tree canopy for all trees with a mature canopy spread of 12 m (40 feet) or less calculated at 4.6 m2 (50 square feet) per tree.0.5
Tree canopy for all new trees with a mature canopy spread of greater than 12 m (40 feet) calculated at 23 m2 (250 square feet) per tree.0.6
Tree canopy for the preservation of existing trees, 15 cm (6 inches) to 60 cm (24 inches) in diameter.0.7
Tree canopy for the preservation of existing trees, 60 cm (24 inches) in diameter or larger.0.8
Table 2. Biologically Active Area Indicators (BAAs) calculated for the six case studies.
Case Study(1) Zawady 1930s(2) Luboń
1960s
(3) Swarzędz
1990s
(4) Dąbrówka
2000s
(5) Puszczykowo
2010s
(6) Skórzewo
2020s
BAA0.450.490.40.440.120.4
Table 3. Routes Lined with Trees indicator (RLT).
Case Study(1) Zawady 1930s(2) Luboń
1960s
(3) Swarzędz
1990s
(4) Dąbrówka
2000s
(5) Puszczykowo
2010s
(6) Skórzewo
2020s
RLT0.70.60.430.70.610.49
Table 4. Tree Canopy indicator (TC).
Case Study(1) Zawady 1930s(2) Luboń
1960s
(3) Swarzędz
1990s
(4) Dąbrówka
2000s
(5) Puszczykowo
2010s
(6) Skórzewo
2020s
TC0.120.160.050.110.040.02
Table 5. Tree Number indicator (TN).
Case Study(1) Zawady 1930s(2) Luboń
1960s
(3) Swarzędz
1990s
(4) Dąbrówka
2000s
(5) Puszczykowo
2010s
(6) Skórzewo
2020s
TN0.7970.5620.4310.7530.350.465
TN (h < 10)0.5650.180.3490.5040.2990.465
TN (h 10–14.9)0.210.2390.080.2490.051-
TN (h 15–19.9)0.0220.1940.002---
TN (h > 20)-0.021----
TN (d < 15)0.0650.0240.0620.1550.0380.016
TN (d 15–60)0.5650.4680.2950.5730.1460.031
TN (d > 60)0.0290.060.0040.025--
New plantings w/mature canopy <12 m0.1380.0050.04-0.1210.395
New plantings w/mature canopy >12 m-0.0050.03-0.0450.023
Note TN (h…)—Tree Number indicator for trees in a specific height range [m]; TN (d…)—Tree Number indicator for trees in a specific diameter range [cm].
Table 6. Tree Benefits Indicator (TB).
Case Study(1) Zawady 1930s(2) Luboń
1960s
(3) Swarzędz
1990s
(4) Dąbrówka
2000s
(5) Puszczykowo
2010s
(6) Skórzewo
2020s
TB1 [USD/m2]0.110.030.010.030.010.005
TB20 [USD/m2]2.680.750.310.710.290.20
TB1 per tree13.735.782.573.572.771.13
TB20 per tree336.03133.8270.8694.6882.6843.42
TB1 per tree x 20274.6115.651.471.455.422.6
Medium annual increase [%]22.3617.7437.7432.4949.192.04
Table 7. Ranking chart for the six case study districts according to the values of the indicators.
Case Study(1) Zawady 1930s(2) Luboń
1960s
(3) Swarzędz
1990s
(4) Dąbrówka
2000s
(5) Puszczykowo
2010s
(6) Skórzewo
2020s
BAA214354
RLT135124
TC214356
TN135264
TB124356
Score71022122324
Table 8. The correlation coefficient between indicators.
BAARLTTCTNTB1
BAA*0.070.600.650.37
RLT**0.620.740.65
TC***0.680.56
TN****0.79
TB1*****
* The correlation coefficient (Pearson’s R) was calculated using the built-in correlation tool in Excel.
Disclaimer/Publisher’s Note: The statements, opinions and data contained in all publications are solely those of the individual author(s) and contributor(s) and not of MDPI and/or the editor(s). MDPI and/or the editor(s) disclaim responsibility for any injury to people or property resulting from any ideas, methods, instructions or products referred to in the content.

