Article

Are Regions Conducive to Photovoltaic Power Generation Demonstrating Significant Potential for Harnessing Solar Energy via Photovoltaic Systems?

1
Faculty of Land Resources Engineering, Kunming University of Science and Technology, Kunming 650093, China
2
Key Laboratory of Ecological Safety and Sustainable Development in Arid Lands, Xinjiang Institute of Ecology and Geography, Chinese Academy of Sciences, Urumqi 830011, China
3
Advanced Blasting Technology Engineering Research Center of Yunnan Provincial Department of Education, Kunming 650093, China
4
School of Geography and Tourism, Chongqing Normal University, Chongqing 401331, China
*
Author to whom correspondence should be addressed.
Sustainability 2024, 16(8), 3281; https://doi.org/10.3390/su16083281
Submission received: 26 February 2024 / Revised: 28 March 2024 / Accepted: 8 April 2024 / Published: 15 April 2024
(This article belongs to the Special Issue Advances in Renewable Energy: Photovoltaic System and Solar System)

Abstract

:
To achieve the goals of carbon peak and carbon neutrality, Xinjiang, as an autonomous region in China with large energy reserves, should adjust its energy development and vigorously develop new energy sources, such as photovoltaic (PV) power. This study utilized data spatiotemporal variation in solar radiation from 1984 to 2016 to verify that Xinjiang is suitable for the development of PV power generation. Then, the averages of the solar radiation, sunshine duration, and other data in the period after 2000 were used to assess the suitability of Xinjiang, based on spatial principal component analysis (SPCA). Finally, the theoretical power generation potential, fossil fuel reduction, and CO2 emissions reduction were estimated. The results are as follows: (1) In terms of temporal variation, the solar radiation in Xinjiang decreased (1984–2002), increased (2002–2009), and decreased again (2009–2016), but the fluctuations were not statistically significant. In terms of spatial distribution, the Kunlun Mountains in southern Xinjiang had the highest solar radiation during the span of the study period. Hami and Turpan, in eastern Xinjiang, had sufficiently high and stable solar radiation. (2) The area in Xinjiang classed as highly suitable for solar PV power generation is about 87,837 km2, which is mainly concentrated in eastern Xinjiang. (3) In the situation where the construction of PV power plants in Xinjiang is fully developed, the theoretical potential of annual solar PV power generation in Xinjiang is approximately 8.57 × 10⁶ GWh. This is equivalent to 2.59 × 10⁹ tce of coal. Furthermore, 6.58 × 10⁹ t of CO2 emissions can be reduced. PV power generation potential is approximately 27 times the energy consumption of Xinjiang in 2020. Through the suitability assessment and calculations, we found that Xinjiang has significant potential for PV systems.

1. Introduction

Since the 18th National Congress of the Communist Party of China (CPC) in 2012, a new strategy on energy has been put forward. The consumption, supply, technology, and institutions of energy in China were required to change. Later, in 2020, the goals of ‘carbon peak’ and ‘carbon neutrality’ were put forward by General Secretary Xi Jinping. Thus, energy development routes need to be adjusted while achieving the goals of ‘carbon peak’ and ‘carbon neutrality’. The promotion of renewable energy from green and low-carbon sources is a top priority. Solar energy is in the midst of a period of rapid growth [1,2], as there is a great need to develop photovoltaic (PV) power generation. Therefore, monitoring spatiotemporal variations in solar radiation and the potential of PV power generation are important steps in the promotion of renewable energy at a regional or even national level.
Solar radiation is one of the most important indicators of solar energy resources. In the past, a large number of studies have been conducted on the dynamics of solar radiation. For most studies of solar radiation, the data for these studies come from reanalyzing the data from stations [3]. Cluster analysis, innovative trend analysis, and other methods of analysis have been applied to study the variations in solar radiation [4,5]. However, trends or causes of past solar radiation changes are not complete enough to describe solar energy resources. Previous studies have lacked predictions of future trends in solar radiation. The future of various types of human activities affected by solar radiation can also be studied. There are both long-term and short-term effects in the study of solar radiation. Most long-term solar radiation studies span ten to twenty-five years, and short-term studies span months or seasons [4,6]. These periods of study are sufficient if researchers are only studying the short-term status of solar radiation. To analyze the total variations in solar radiation for a given area more comprehensively, more than 30 years’ worth of solar radiation data is required, but the latest available dataset for solar resources is from 2016. Therefore, only large time series solar radiation datasets prior to 2016 could be selected.
In previous studies, most of the study areas were well-known, such as Africa and Tibet [5,7]. Southern Xinjiang is also a region known for its high and stable solar radiation, but it is not convincing to study solar radiation in southern Xinjiang only. Solar radiation is difficult for people to utilize in many areas of southern Xinjiang, due to geographical or economic reasons, such as in the Karakoram–Pamir area and the center of the Taklamakan Desert. We finally analyzed the solar energy resources of all areas in Xinjiang with a larger time series dataset.
High-quality solar energy resources are the most fundamental necessity for suitability assessments of PV power generation. An analytical hierarchy process (AHP) and geographical information systems (GIS) were widely used to assess the suitability of PV power generation [8,9]. Compared with other methods of assessment, AHP is not sufficiently objective. The results of the assessment can easily be influenced by personal cognitions and thoughts [10]. Previous studies did not reveal the theoretical benefits of PV power generation based on the results of the suitability assessment. The majority of individuals are primarily concerned with decreasing carbon emissions using PV power generation. Thus, many studies have concentrated on economically developed regions or the Tibetan Plateau [7,11]. Few studies have made a more comprehensive assessment of the overall PV power generation potential in Xinjiang. Xinjiang has a variety of landscapes, a slightly less developed economy, and a lack of water resources. Indicators for suitability assessments that have been used in other regions may not be suitable to apply in Xinjiang. A comprehensive assessment method and some suitable indicators for Xinjiang are the focus of this suitability assessment of Xinjiang’s PV power generation.
As a region with rich fossil fuel energy resources, Xinjiang’s coal consumption for coal-fired power generation in 2020 was approximately 1.49 × 10⁸ t. The main source of annual carbon emissions in Xinjiang is fossil fuel combustion. According to the Outline of the 14th Five-Year Plan (2021–2025) for National Economic and Social Development and Vision 2035 of the Xinjiang Uygur Autonomous Region, Xinjiang is promoting the development of PV power generation to reduce carbon emissions from fossil fuel combustion. Xinjiang’s vast area, small population, and long sunshine duration make it an excellent location for PV power plants. Therefore, it is necessary to analyze the potential of PV power generation in Xinjiang, which would be very helpful for the green and low-carbon transformation of Xinjiang. PV power plants offer greater benefits in emission reductions than afforestation [12]. Xinjiang was chosen as the study area because it has more bare land and a longer sunshine duration, which are more suitable for the development of PV power plants [13]. The broad components of this study are shown below: (1) The dynamics of solar radiation in Xinjiang were analyzed based on solar radiation data from 1984 to 2016. This ensured the stability of solar energy resources in Xinjiang for the development of photovoltaic power generation. (2) For the results of the suitability assessment, which were informative over a longer period, this study used the average of the data from 2000 onwards as the criteria. Assessing the suitability of PV power generation in the whole region of Xinjiang, based on the objective method of spatial principal component analysis (SPCA), made it possible to determine the most suitable areas for the establishment of PV power plants. (3) This study estimated the theoretical PV power generation potential in Xinjiang and calculated potential reductions in carbon emissions based on its development.

2. Materials and Methods
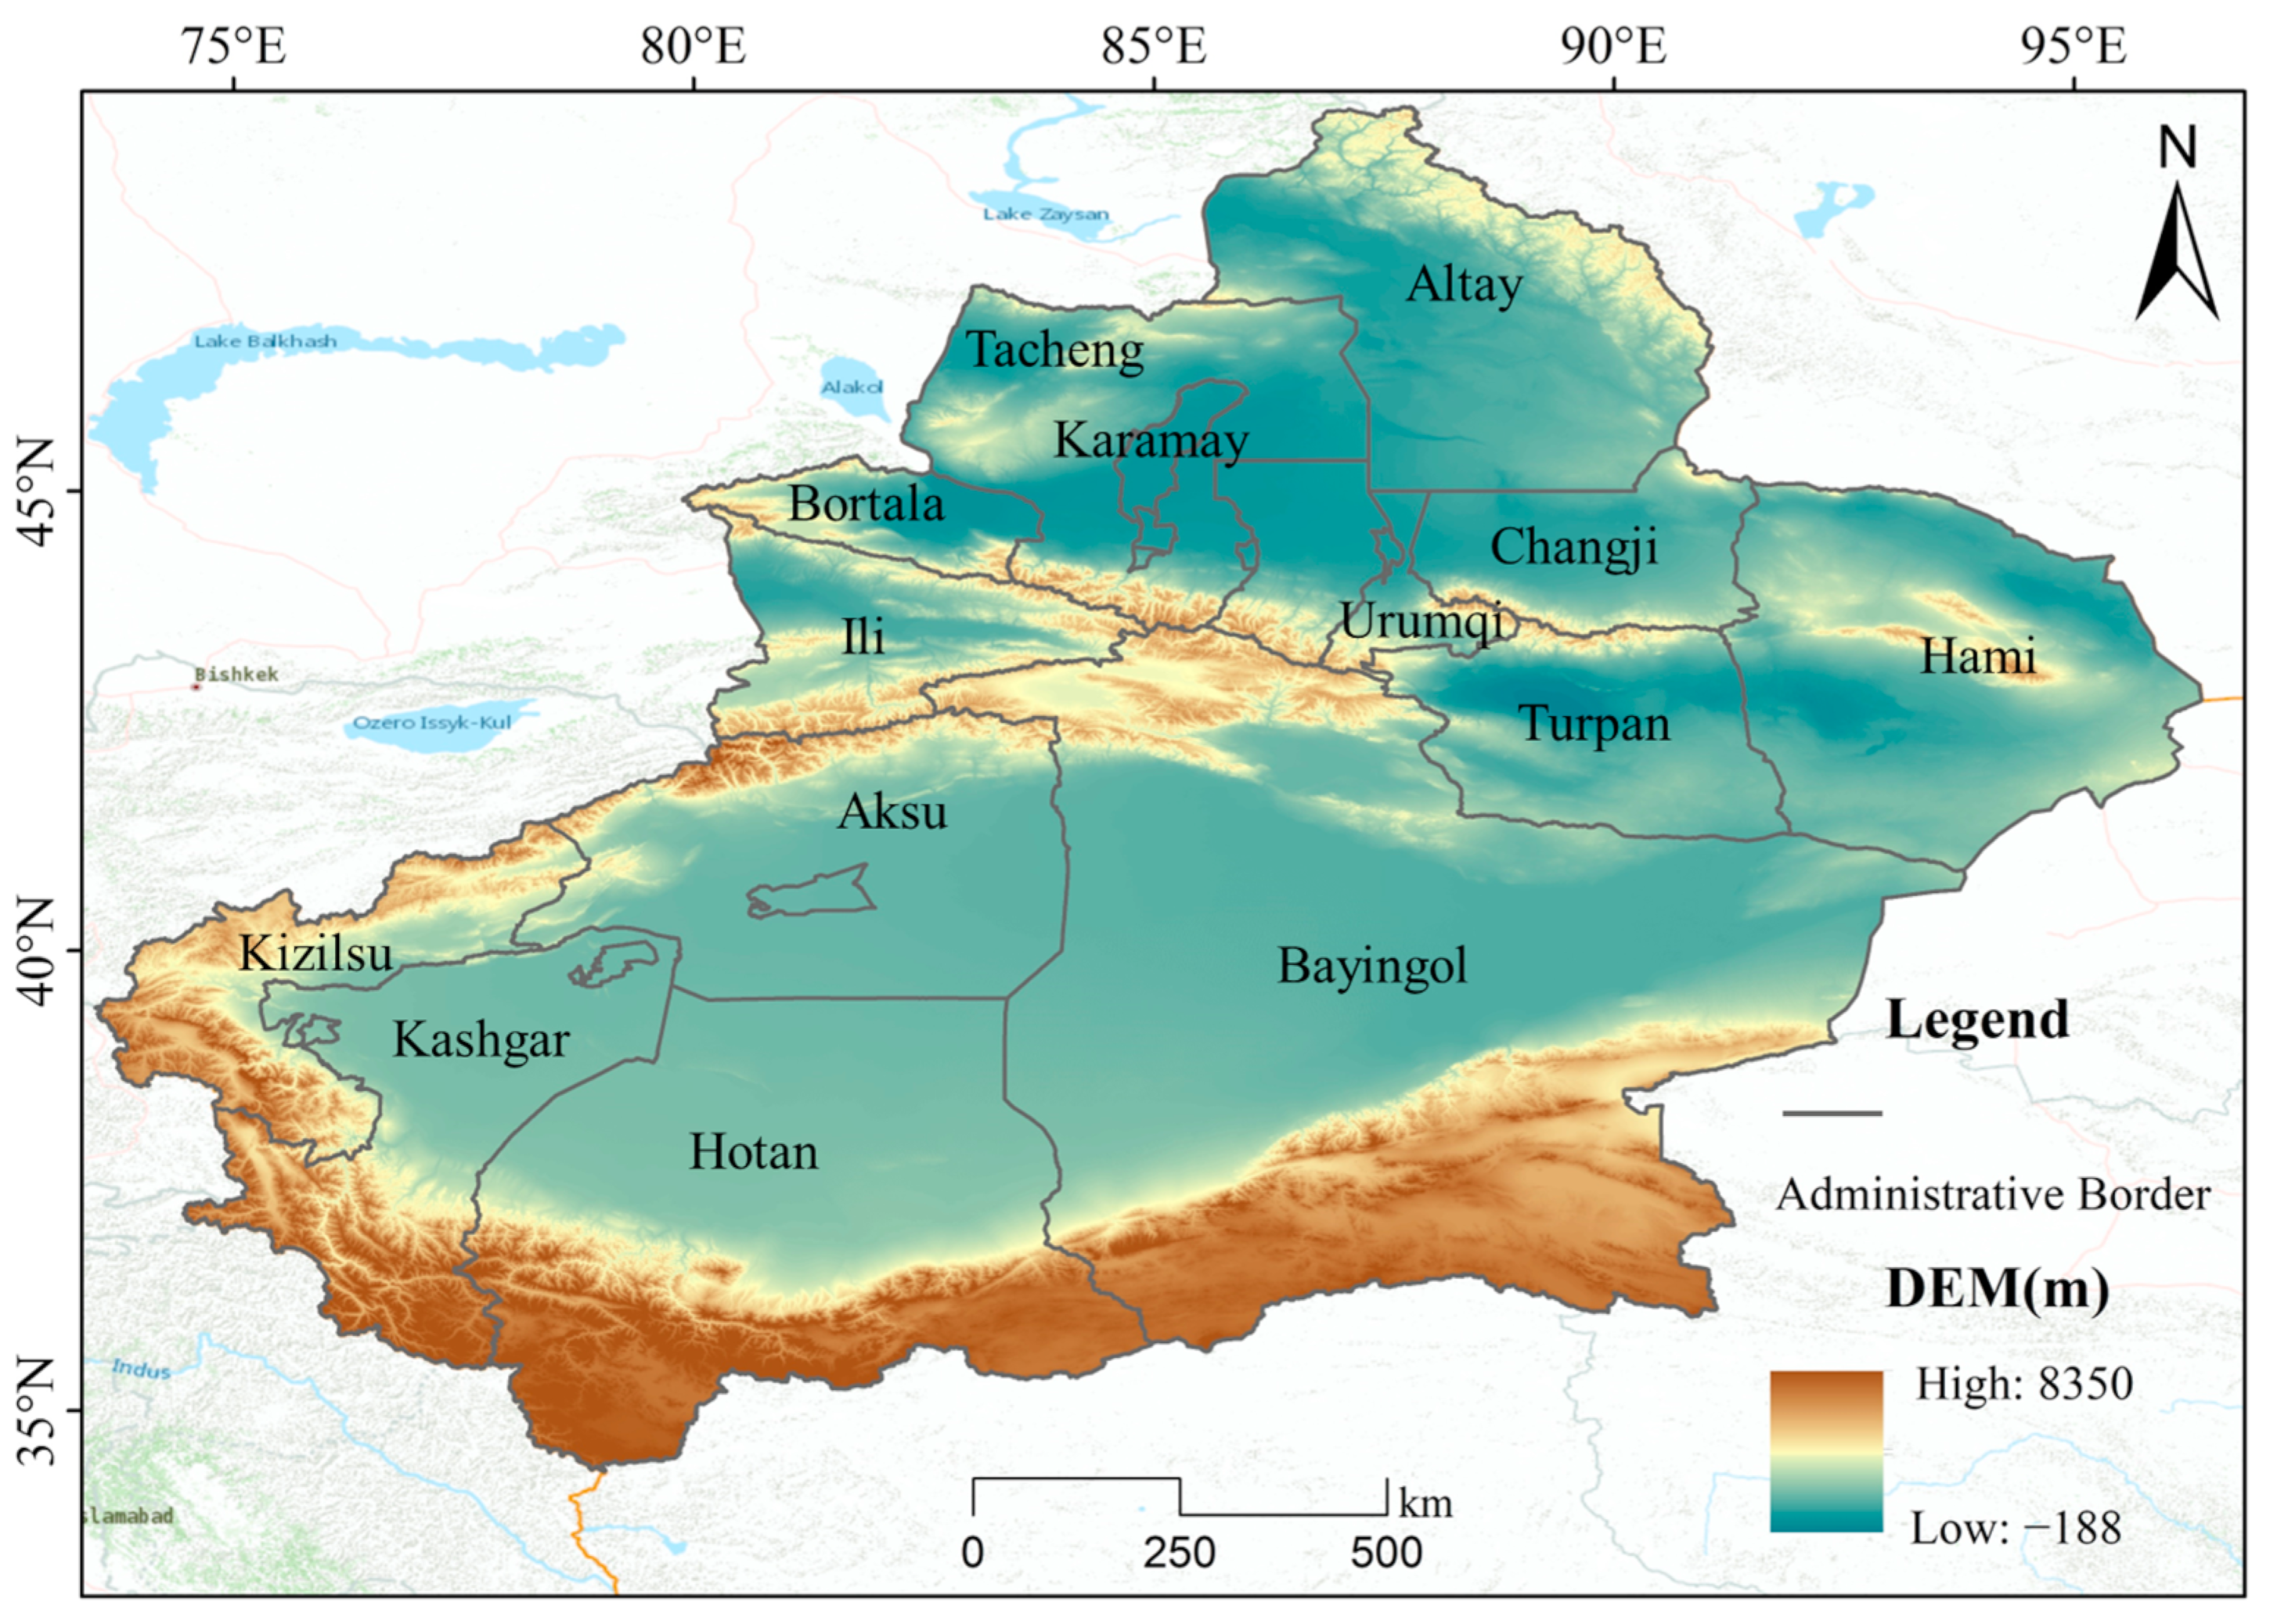
2.1. Study Area

Xinjiang is located in the border regions of northwest China and is geographically situated between 34.22 and 49.10 north latitude and 73.40 and 96.23 east longitude. Xinjiang covers an area of 1,664,900 km2, making it the largest provincial-level administrative region in China [14]. The study area has a land border of more than 5600 km and borders eight countries. It also includes 14 autonomous prefectures and prefecture-level cities. As shown in Figure 1, the terrain of Xinjiang is dominated by basins, and it can be characterized by three mountains and two basins. Junggar Basin is located in northern Xinjiang, and Tarim Basin is located in southern Xinjiang. Xinjiang spans from the Altai Mountains in the north to the Kunlun Mountains in the south, and the Tien Shan lies in the center of Xinjiang [15]. Xinjiang lies in the temperate continental climate zone. This area has large sunshine duration measurements and an abundance of annual solar radiation. These significant features provide certain support for the regional power supply [16]. “Three bases and one channel” is defined as the main approach to energy development in Xinjiang. “Three bases” refers to the large coal, oil/gas, and wind power bases, and “one channel” refers to the national land energy channel. Thus, the development of solar and wind energy is particularly important for Xinjiang.

2.2. Data Acquisition and Processing

The data used to study the spatiotemporal variation in solar radiation and assess the suitability of PV power generation are shown in Table 1. Solar radiation was used, not only to analyze the temporal and spatial variations in solar resources but also to assess the suitability of PV power generation. It is better to select approximately 30 years’ worth of solar radiation data when studying solar resources. Therefore, this study selected data on solar radiation from 1984 to 2016, to study solar resources. Solar radiation from 2000 to 2016 was selected to ensure that the results of the assessment were long-lasting and had high accuracy. The data were taken from the National Tibetan Plateau Data Center (https://data.tpdc.ac.cn/) (accessed on 20 October 2023). This dataset has less bias and greater performance in reanalysis [17,18]. Sunshine duration data (from 2000 to 2014) were from the Geographic Data Sharing Infrastructure, a global resources data cloud (www.gis5g.com) (accessed on 22 October 2023). Each weather station contributes to this dataset, and it is therefore subject to a small margin of error. The digital elevation model was from the JAXA Earth Observation Research Center (http://earth.jaxa.jp/en/) (accessed on 21 November 2023). This dataset is widely used because of its high level of precision. Land use data (2015) are highly time-sensitive and came from the Resource and Environment Science and Data Center (http://www.resdc.cn/) (accessed on 28 October 2023). The roads dataset (2015) includes all primary and secondary roads in Xinjiang. It is from OpenStreetMap (https://www.openstreetmap.org) (accessed on 21 December 2023). To improve the reliability of the results, the solar radiation data, sunshine duration data, and digital elevation model were resampled to 968.37 m for further analysis using bilinear interpolation. The Asia North Lambert conformal conic was the coordinate system for this study.

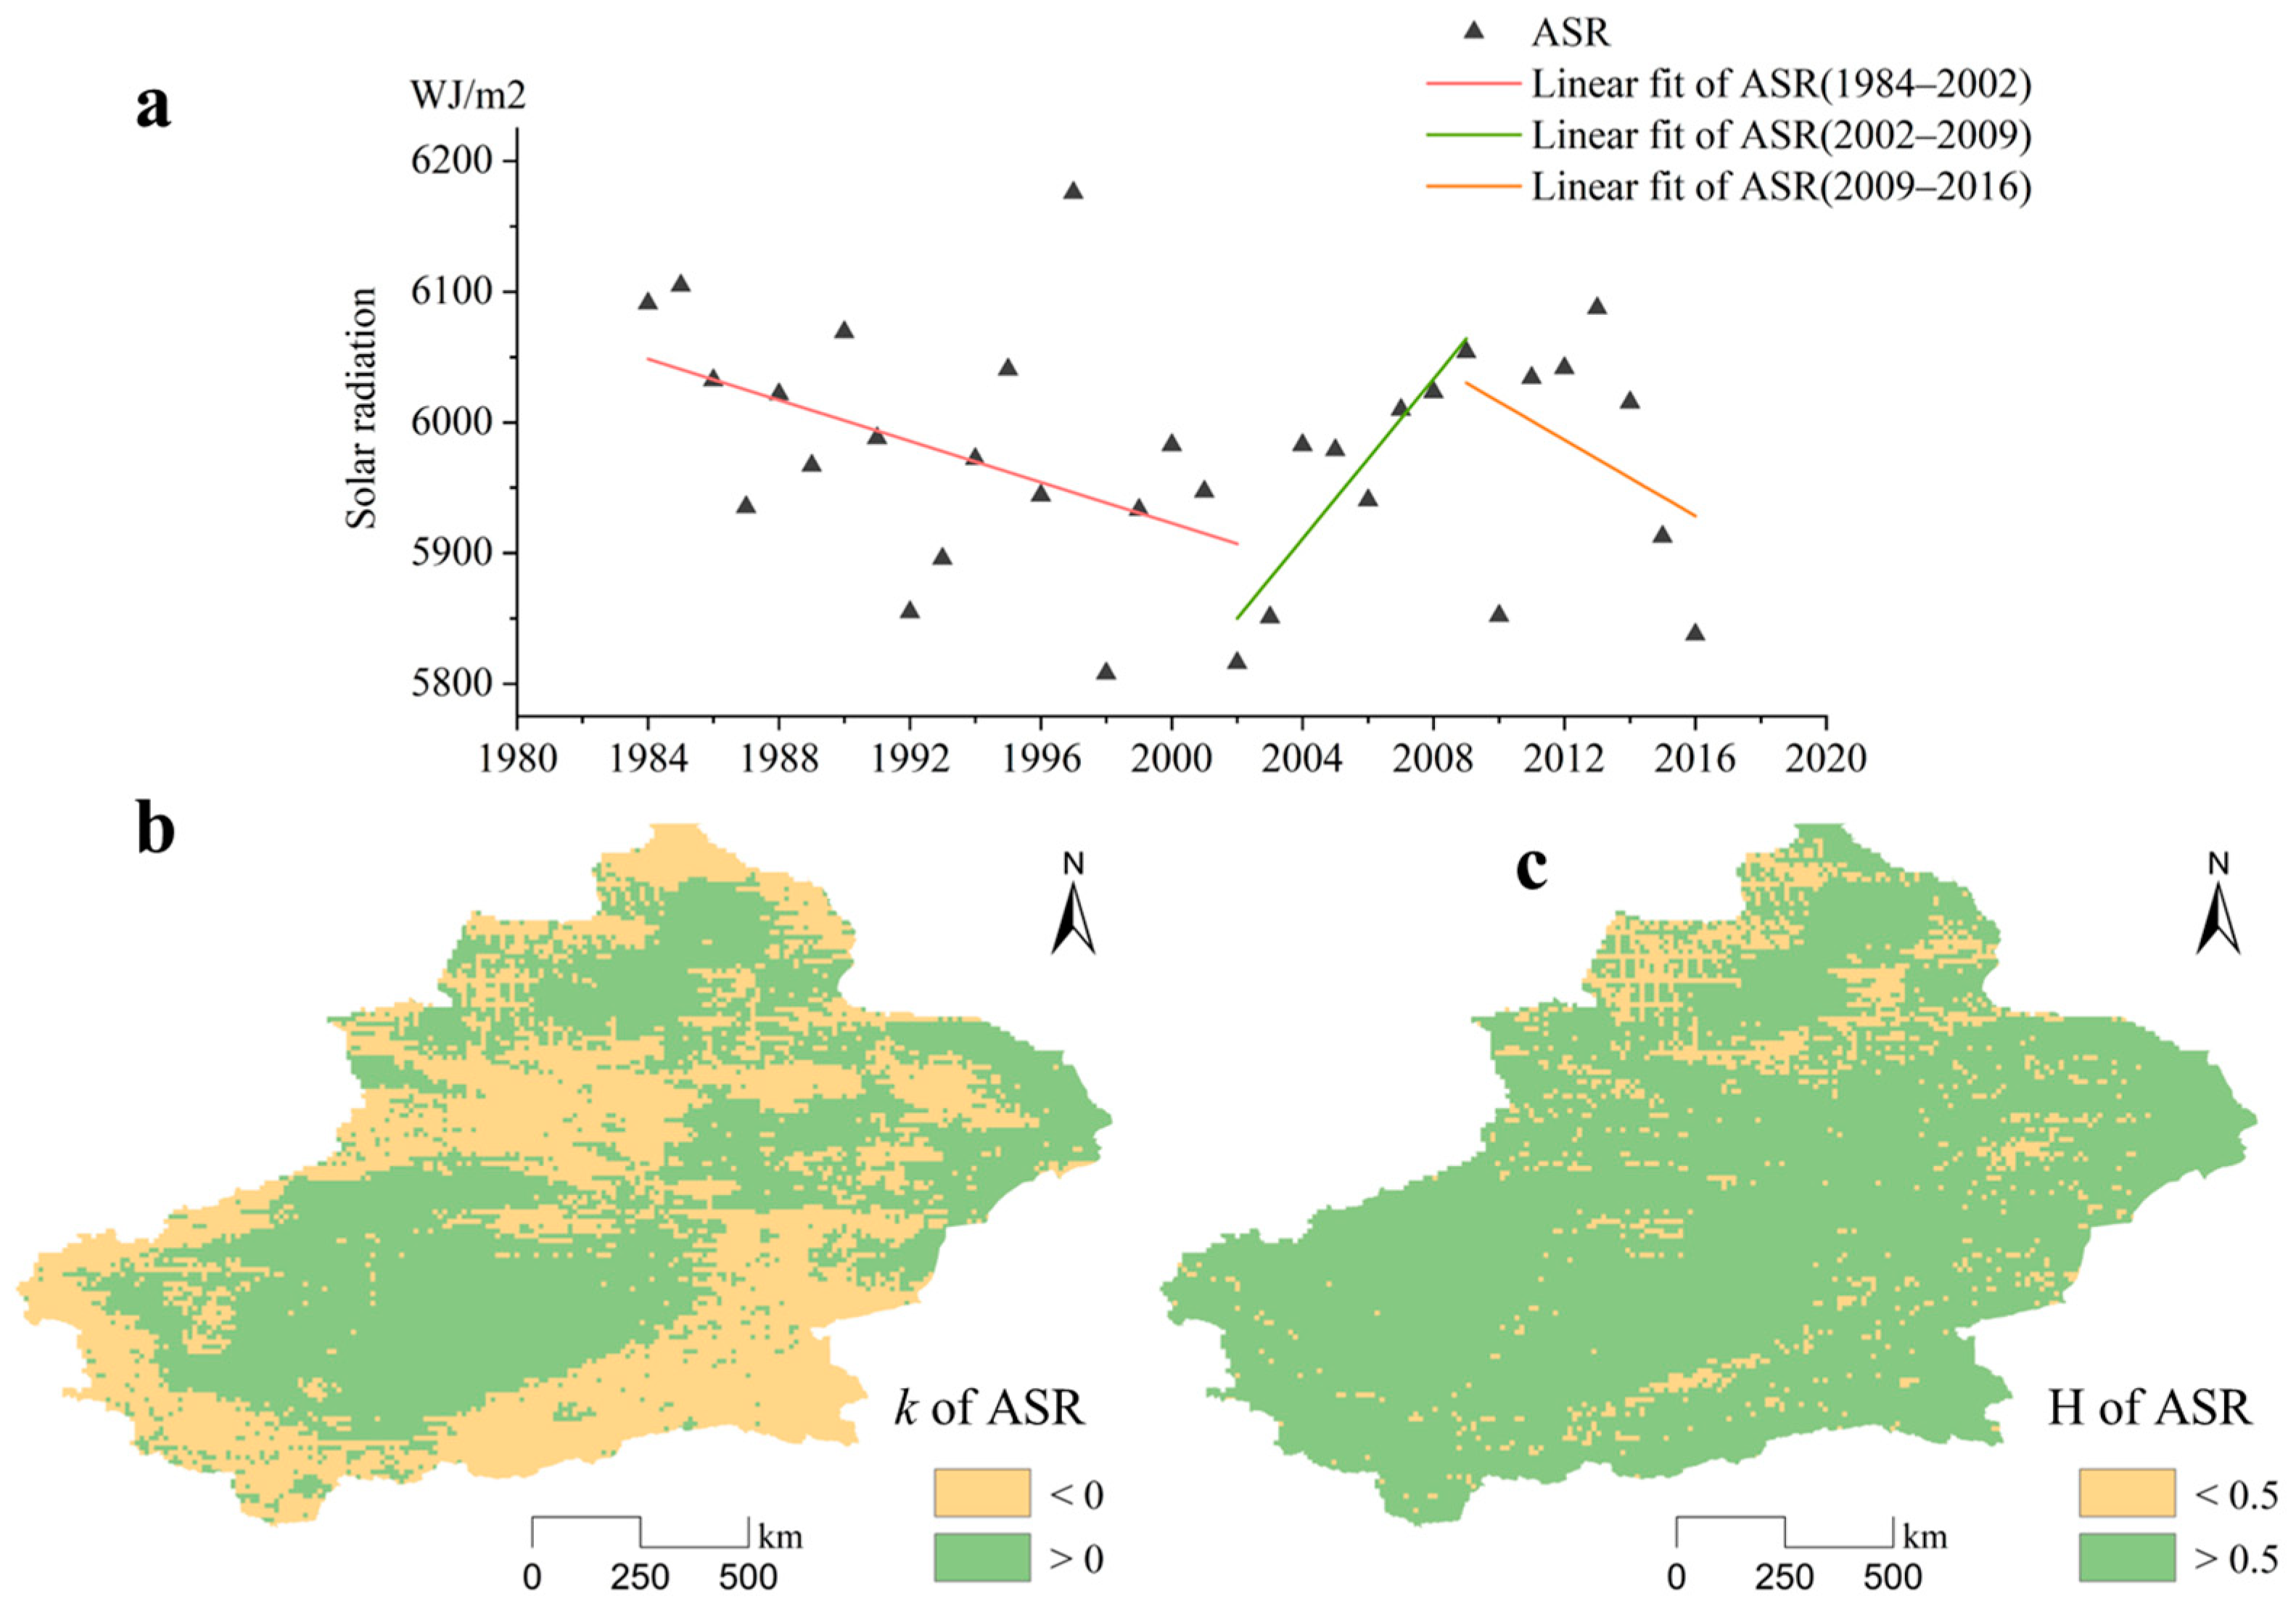
2.3. Spatiotemporal Variation in Solar Radiation

Solar energy resources are a critical factor in a region’s PV power generation. The theoretical PV power generation is determined by solar radiation and other parameters [19]. Thus, it was necessary to analyze the spatiotemporal variation in solar radiation in Xinjiang. In this section, changes in trends in solar radiation and the long-term memory of solar radiation are calculated. The temporal variation in solar energy resources in Xinjiang was calculated through the analysis of these factors by averaging annual solar radiation at each spatial point to examine spatial variation in solar energy resources [20], in order to ensure that Xinjiang’s solar energy resources are sufficiently abundant and stable.

2.3.1. Linear Regression Model

The linear regression model was used to calculate the trends in the variation in solar energy resources. The classification of annual solar radiation was carried out with reference to the classification of solar energy resources—global radiation with No. GB/T 31155–2014 [21]. There are four levels of solar radiation: extremely high, high, relatively high, and low. The average values of the annual solar radiation from 1984 to 2016 were used to create a linear regression model. As per the methodology presented by Bedim Godoy et al. in 2021, the temporal variation in trends in solar energy resources can be calculated as follows [22]:
k = n i = 1 n i × R i i = 1 n i × i = 1 n R i n i = 1 n i 2 i = 1 n i 2
where k represents the slope of a linear regression equation, i represents the year number, Ri represents the solar radiation in the year i (MJ·m−2), and n represents the time step. If k < 0, the variation in solar radiation is classed as negative growth. If k > 0, the variation in solar radiation is classed as positive growth.

2.3.2. Rescaled Range Analysis

The rescaled range (R/S) analysis was expected to provide distributional features and autocorrelation at all time intervals. The Hurst exponent (H) is an index based on R/S analysis. To analyze and compare the variation in a time series solar radiation dataset, the Hurst exponent was used in the study [18]. According to the study of Garcia-Gutierrez et al., H is calculated as follows [23]:
e ( a ) = 1 m · t = 1 m N ( t , a )
where {N(t), t = 1, 2, , N} represents the time series, N(t,a) represents the element of the subset of N, m represents the length of each subset, and e(a) represents the average of each subset. The factor X(t, a) represents the accumulated deviation of the e(a). X(t,a) is calculated as follows [24]:
X ( t , a ) = t = 1 m N ( t , a ) e ( a )
R(a) represents the range of each subset. R(a) is calculated by Equation (4) [25], as follows:
R ( a ) = max 1 t m X t , a min 1 t m X t , a
where maxX(t,a) represents the maximum value of X(t,a), minX(t,a) represents the minimum value of X(t,a), and S(a) represents the standard deviation of the subset. S(a) is calculated by Equation (5) [26], as follows:
S ( a ) = 1 n t = 1 m N ( t , a ) e ( a ) 2
H is between zero and one, and it is calculated using the expected value (E[x]) of Equation (6), as follows [25]:
E R a S a a H   a s   a
where H ∈ (0,1). If H < 0.5, future trends of the time series data are completely inconsistent with past trends. If H = 0.5, future trends of the time series data are completely random. If H > 0.5, future trends of the time series data are similar to the past trends.

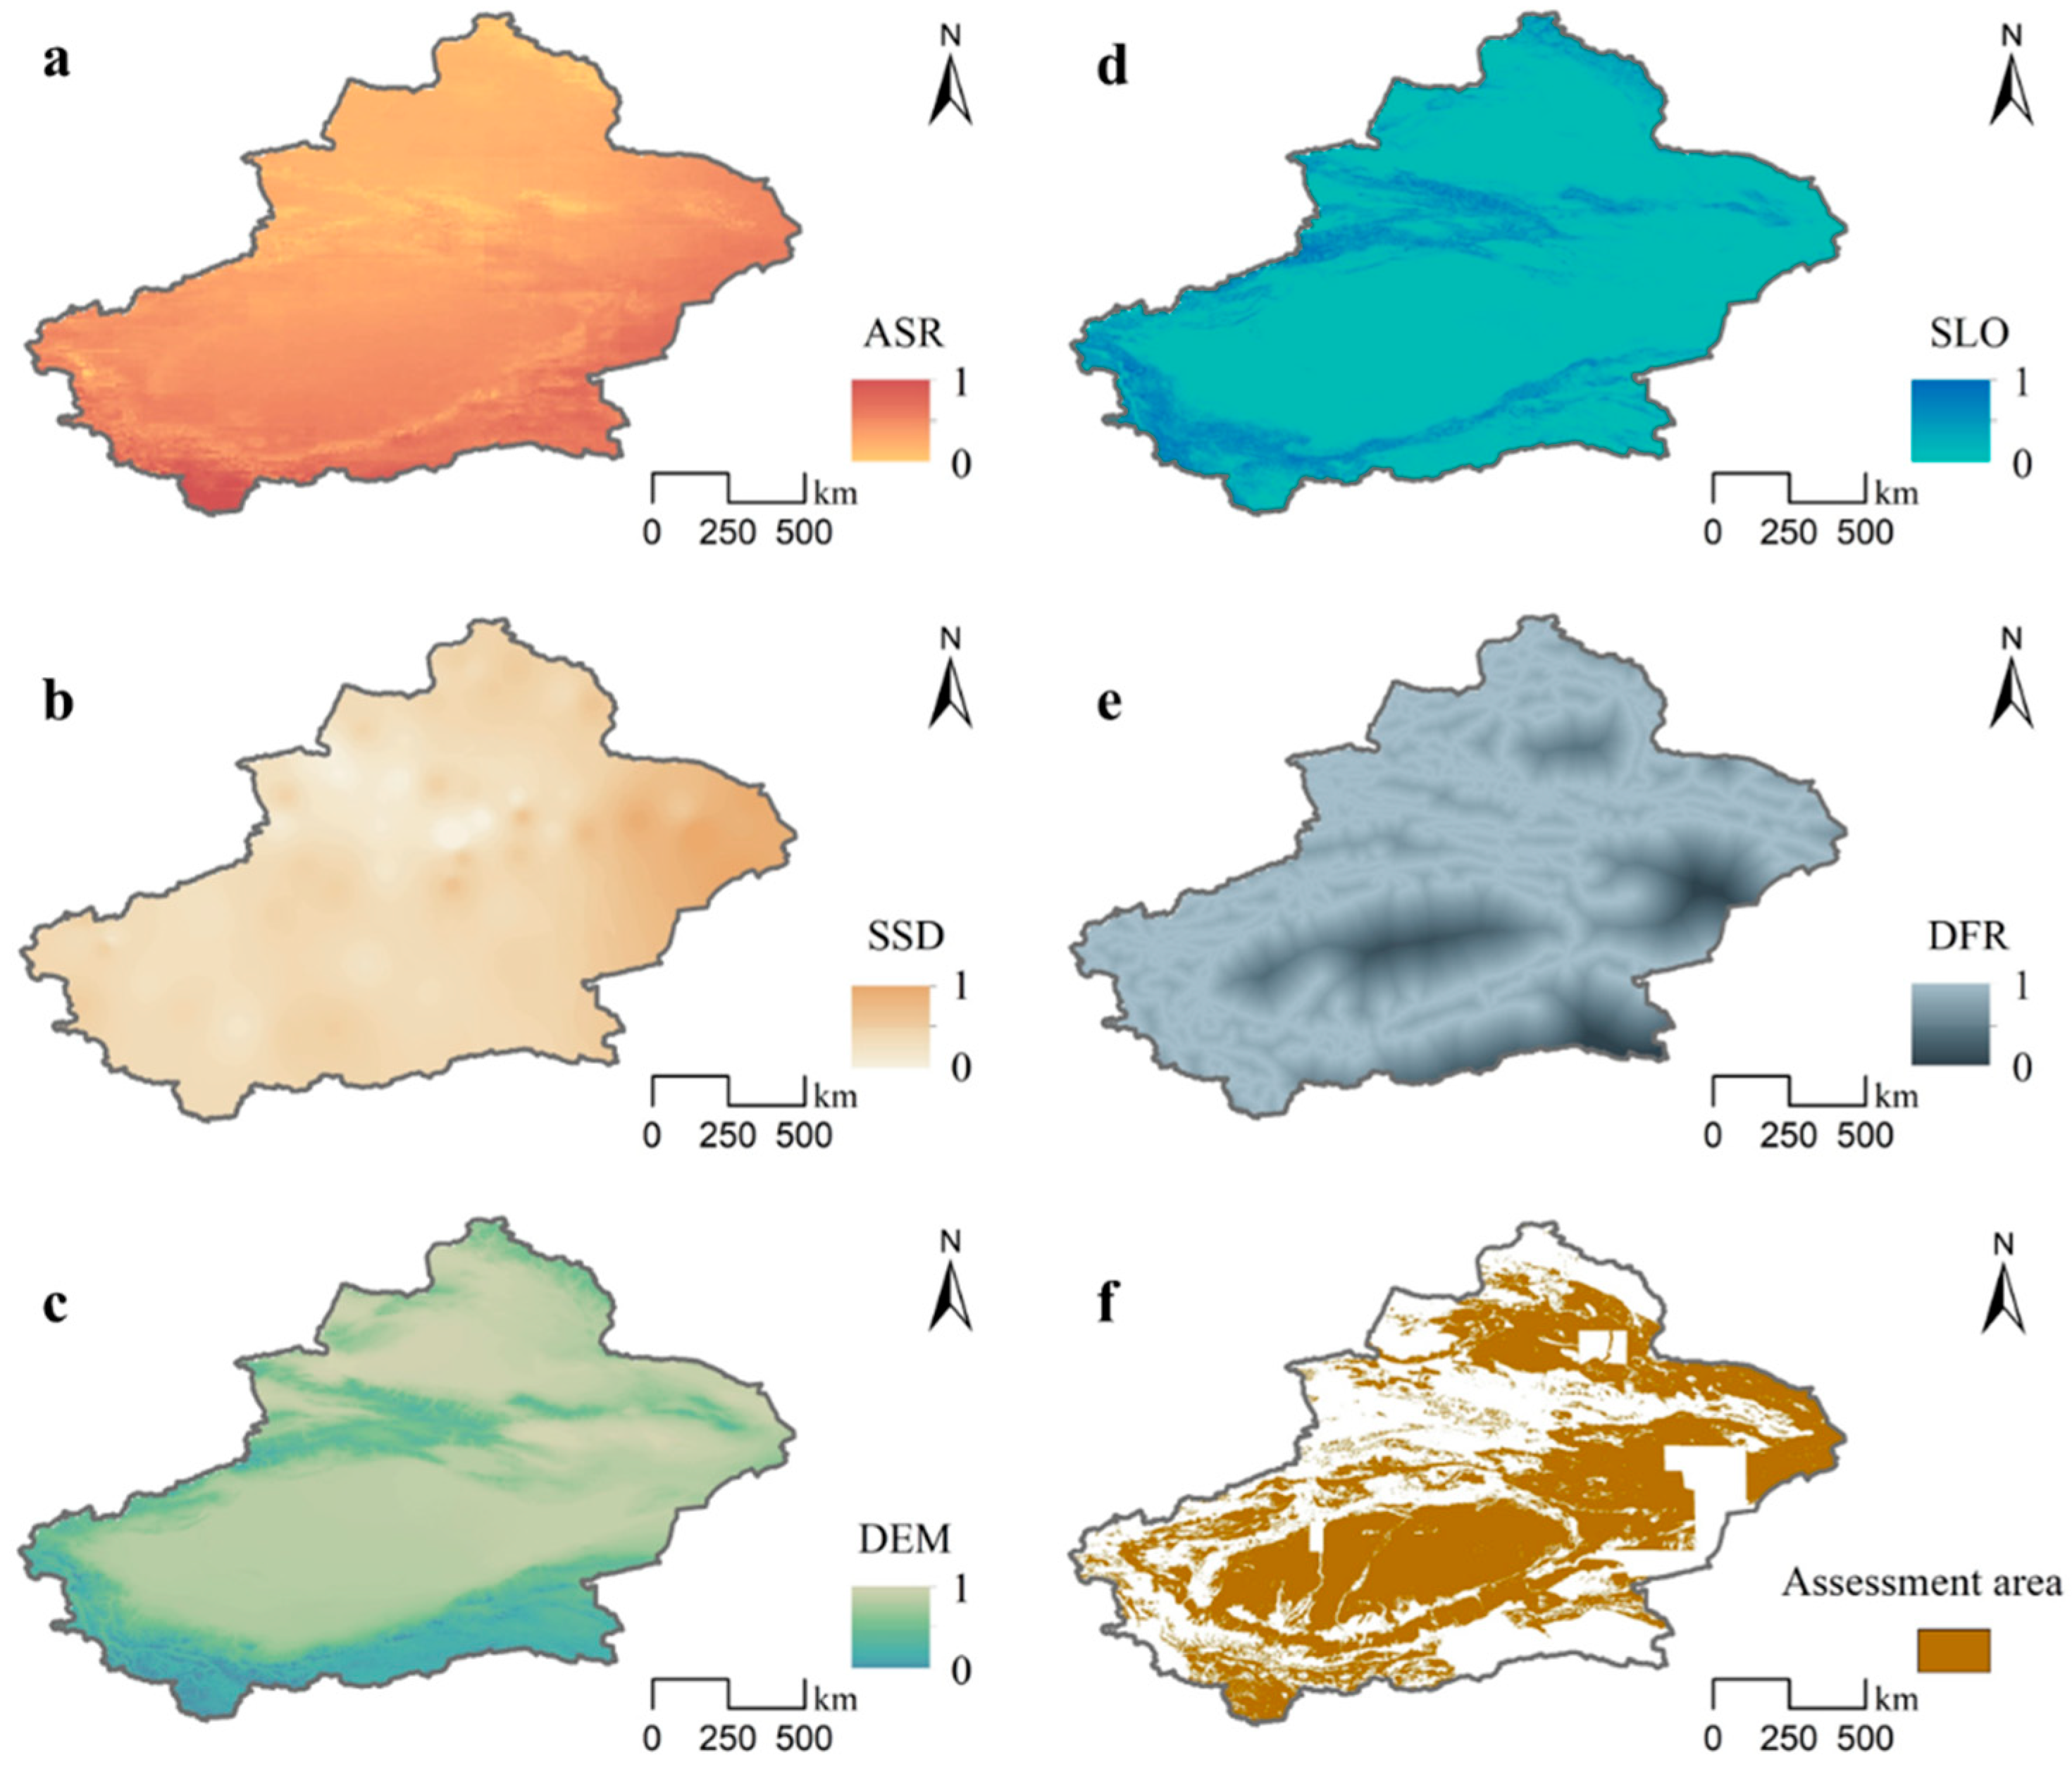
2.4. Criteria Selection for Suitability

The protected area should not be altered in any way [19]. Cultivated land, forests, and other types of used lands should also be protected. To protect the natural environment without affecting human activities, this study selected bare land and excluded the protected area as our assessment area for assessing its suitability [27,28].
Climatic criteria, geographical criteria, and economic criteria were considered to assess the suitability of PV power generation in Xinjiang [29]. Solar radiation and sunshine duration were selected as climatic criteria. Elevation and slope were geographical criteria. Furthermore, distance from roads was an economic criterion. However, some criteria were excluded from this study for different reasons. For instance, some researchers have maintained that excessive humidity is a barrier to PV power generation [30]. Most of Xinjiang is in an arid region. Therefore, humidity does not have a significant effect on the suitability assessment. Distance from the power grid is a criterion that can affect the cost of transmitting electricity. However, a new grid can be built together with PV power plants [31].
(1)
Solar radiation
Solar radiation is the fundamental basis for PV power generation. Areas with plenty of solar radiation are more suitable for PV power generation. Experts in the field consider solar radiation to be an important indicator [32]. In this study, the average annual solar radiation (ASR) from 2000 to 2016 is used as a criterion.
(2)
Sunshine duration
A study by Zhipeng Zhang shows that the indicator sunshine duration has a significant influence on PV power generation [31]. Researchers from relevant studies have proposed that sunshine duration is the most important criterion [33]. The observed sunshine duration data from stations in Xinjiang (2000–2014) were calculated and interpolated. This study used the average annual sunshine duration (SSD) as a criterion.
(3)
Elevation
Elevated regions receive more solar radiation than lower regions, but building PV power plants in elevated regions costs a lot [34]. The elevation of the earth’s surface can be represented using the digital elevation model (DEM). So, this study selected the DEM of Xinjiang (in 2015) as the criteria.
(4)
Slope
Large-scale PV power plants require relatively flat areas [35]. Excessive slopes make the construction of PV power plants more difficult. Many studies in China have set the upper limit of the slope below a certain angle [36]. Slope (SLO) can be calculated using the DEM and is used to assess the suitability of the area.
(5)
Distance from roads
Operation and maintenance costs are a key consideration when building PV power plants [37]. The distance from roads largely determines the cost and accessibility [38]. Distance from roads must therefore be considered as an indicator of suitability. Thus, Euclidean distance was used to calculate each pixel’s distance from roads (DFR) in this section. DFR was used as an indicator for this assessment.

2.5. Suitability Assessment in Photovoltaic (PV) Power Generation

In this study, each criterion was tested and standardized. The suitability of PV power generation was assessed using spatial principal component analysis (SPCA).

2.5.1. Multicollinearity Test

To minimize the collinearity between the five criteria, the highly correlated variables, with R values of >0.7, were removed from the study [39]. Furthermore, the variance inflation factors (VIF) between the five criteria were calculated. A high VIF value, exceeding 10, indicates a concerning level of multicollinearity. This suggests that the variance of the estimated regression coefficients is notably inflated in the model [40]. The results of the multicollinearity test (Table 2) show the VIF of each criterion. All the criteria selected in this study passed the multicollinearity test.

2.5.2. Data Normalization

Except for the constrained areas, each criterion needed to be normalized (Figure 2). The data of criteria that had a positive impact on suitability were normalized using Equation (7), as follows [41]:
I = I I m i n I m a x I m i n
The data of criteria that had a negative impact on suitability were normalized using Equation (8), as follows [41]:
I = I m a x I I m a x I m i n
where I′ represents the results of the normalization, I represents the pixel, Imin represents the minimum of the pixel, and Imax represents the maximum of the pixel.

2.5.3. Method of Assessment (Spatial Principal Component Analysis—SPCA) and Assessment of Suitability

SPCA is a spatial way of performing principal component analysis (PCA). It can rotate the original space and transform the original data into new multi-band spatial data in the rotated space. SPCA has an advantage over other orthogonal functions because it does not have a specific form; therefore, SPCA is a flexible and effective method for this study [42]. This study developed a suitability assessment, using SPCA, for the construction of PV power plants. Several criteria from different sources can be integrated by SPCA, such as solar radiation, sunshine duration, elevation, slope, and distance to roads. Weights can be calculated by combining eigenvalues, contribution ratios (Table 3), and eigenvectors (Table 4). The results of the weights are shown in Table 4. If some principal components (PC) of the resulting data represent over 90% of the total variance, the remaining components can be ignored. The value of the suitability assessment was obtained using Equation (9), as follows [38]:
S P U = α 1 X 1 + α 2 X 2 + α 3 X 3 + + α n X n
where SPU represents the suitability assessment index, α represents the corresponding weight of the PC, X represents the PC, and n represents the number of principal components that remain.
To calculate the potential of PV power generation, the suitability assessment must be classified into different levels [43]. Natural break classification (NBC) was employed to classify the suitability into five levels [28]. The five levels and their suitability scores were classed as highly suitable (0.75–0.87), suitable (0.68–0.75), moderately suitable (0.61–0.68), marginally suitable (0.51–0.61), and not suitable (0.29–0.51). The area classed as highly suitable was the most efficient for PV power generation and the least expensive in which to build PV power plants.

2.6. Theoretical Potential of Photovoltaic (PV) Power Generation

The electricity generation capacity can be approximated by considering the yearly solar radiation per unit area, the available land area for solar exploitation, and the efficiency of the technology used to convert solar energy into electricity. This calculation has been widely used in previous studies [31,38,44]. The theoretical potential of annual PV power generation can be calculated as follows [31]:
S G P = S R × C A × A F × η
where SGP represents the theoretical potential of annual PV power generation (GWh); SR represents the annual solar radiation received per unit horizontal area (GWh/km2); CA represents the area of highly suitable land (km2); AF represents the fraction of the highly suitable areas that can be covered by solar panels; and η represents the efficiency of the PV power plants in converting sunlight into electricity. Of these, η and AF in this study were derived from measured data from three PV power plants in Xinjiang; η is 23.5%, and AF was calculated to be 24.37%.
The total consumption of standard coal was calculated based on the national standard, with No. DB21/1620–2008 [45], as follows:
A D = b × S G P
where AD represents the total consumption of standard coal (tce), and b represents the standard coal consumption for power generation (g/kWh). According to the “2021 National Power Industry Statistics”, b is 302.5 g/kWh [46].
CO2 emissions are highly correlated with the combustion of fossil fuels and with carbon emission factors in different regions. According to the IPCC guidelines, CO2 emissions from standard coal consumption can be calculated as follows [47]:
C E = A D × E F
where CE represents the carbon emissions (tCO2). EF represents the emission factor, which is 2.54 tons of CO2 per ton of standard coal burned [46].

3. Results

3.1. Analysis of Spatiotemporal Variation in Solar Radiation

The spatiotemporal variation in annual solar radiation in Xinjiang between 1984 and 2016 was investigated. The linear fit of ASR (Figure 3a) shows that the overall solar radiation demonstrated a decreasing trend, with a decrease of 253.33 MJ/m2 during the study period. In addition, taking 2002 and 2009 as the interval points, through fitting analysis, it was found that solar radiation only increased significantly during 2002–2009, with an increase of 237.87 MJ/m2, at an average annual increase rate of 33.98 MJ/m2/year. The solar radiation in the other two time periods decreased significantly. In 2009–2016, the average annual decline rate of solar radiation was 1.8 times that in the period 1984–2002, and the solar radiation decreased by 216.18 and 275.02 MJ/m2, respectively. However, Xinjiang’s solar radiation was still at a high level. The main causes of the solar radiation variations in Xinjiang were the changes in cloud coverage, aerosol optical depth (AOD), and water vapor content [48,49]. Figure 3b shows the trends of total solar radiation in Xinjiang from 1984 to 2016. During the study period, approximately 45.81% of Xinjiang had a negative growth in solar radiation (k < 0), which were generally high-altitude areas. The other areas (approximately 54.19%) had experienced positive growth in solar radiation for the past 33 years. The future trends in solar radiation in most areas of Xinjiang were similar to the past (H > 0.5). This means that future trends for more than 90% of areas remained as they had been in 1984–2016 (Figure 3c). Only a small number of regions had a future trend that was opposite to their past trends (H < 0.5), and these regions were largely concentrated in northern Xinjiang. This may be due to the fact that the climate in northern Xinjiang has become very different from that of the last 30 years [50].
In general, solar radiation in Xinjiang decreased between 1984 and 2002, increased between 2002 and 2009, and decreased between 2009 and 2016. From 1984 to 2016, solar radiation in Xinjiang decreased by 253.33 MJ/m2. The regions with increasing trends and those with decreasing trends were evenly split. Furthermore, the future trends of more than 90% of the areas in Xinjiang were significantly related to the past.
The average solar radiation (1984–2016) in Xinjiang is shown in Figure 4a. The average shows that most of Xinjiang has a high level of solar radiation (5040 MJ/m2 < solar radiation < 6300 MJ/m2). Only about 18% of the area is exposed to extremely high levels of radiation (solar radiation > 6300 MJ/m2). Extremely high solar radiation areas are mainly concentrated around the Kunlun Mountains in southern Xinjiang, mainly due to the area’s low latitude and high altitude. Figure 4b shows that the average solar radiation for the whole of Xinjiang in 1984 exceeded 5040 MJ/m2. The proportion of the Kunlun Mountains in southern Xinjiang with extremely high solar radiation levels reached 26.3% of the whole region. However, the area with extremely high solar radiation levels decreased to 21.1% in 2000 (Figure 4c). The area with extremely high solar radiation decreased by approximately 8.87 × 10¹⁰ m2. At the same time, a relatively high solar radiation area of approximately 8.8 × 10⁸ m2 was observed (3780 MJ/m2 < solar radiation < 5040 MJ/m2) in central Xinjiang. Figure 4d shows that the area of relatively high solar radiation in northern Xinjiang gradually expanded, in 2016 to 3.12 × 10¹⁰ m2, which is approximately 1.8% of the total area of Xinjiang. In the same year, areas with low levels of solar radiation appeared, accounting for less than 0.1% of the total area of Xinjiang. Areas with solar radiation below 5040 MJ/m2 were largely concentrated in the Altai Mountains and the Tien Shan.

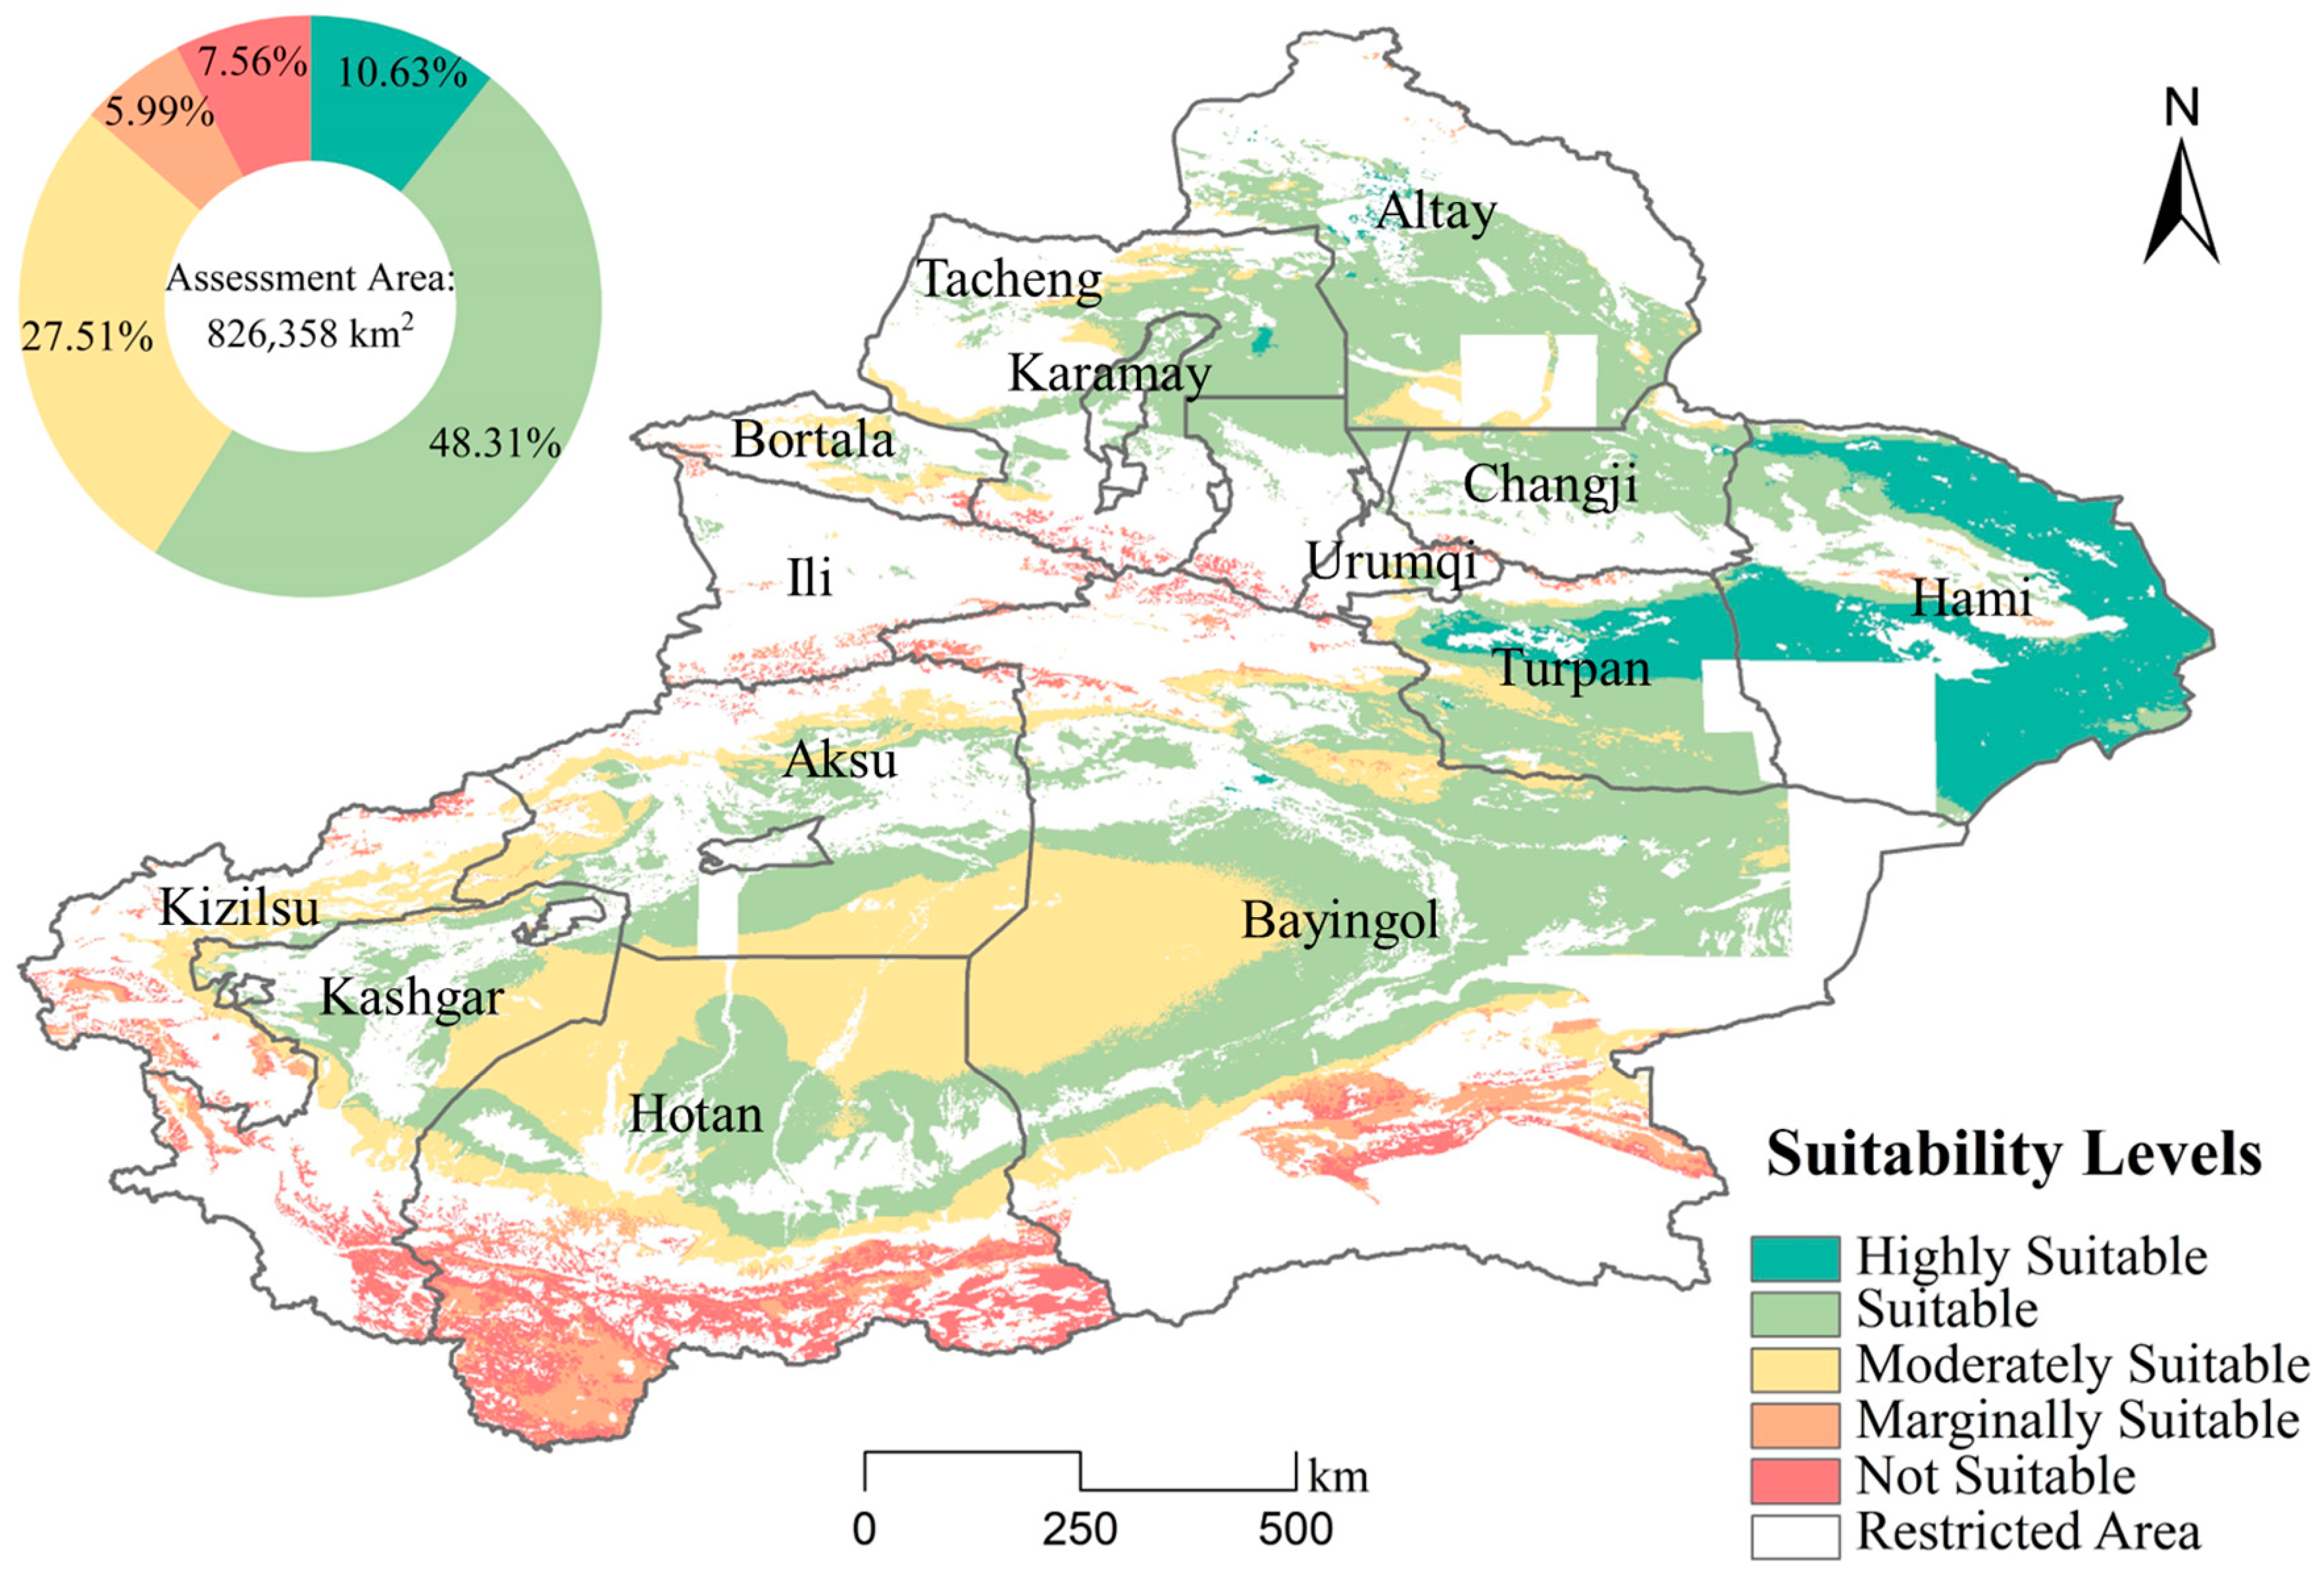
3.2. Suitability Assessment in Photovoltaic (PV) Power Generation

The suitability assessment was used to analyze and calculate the different suitable levels of the total area. This study only assessed areas of bare land, known as assessment areas. Other areas were collectively referred to as restricted areas. The total surface area of the restricted areas was 826,358 km2, which is approximately 50% of the total area of Xinjiang.
From the results of the suitability assessment (Figure 5), the surface area of the highly suitable areas was calculated at 87,837 km2, which accounted for 10.63% of the assessment area, and the highly suitable areas were concentrated in Hami and Turpan, both located in eastern Xinjiang. There were a few highly suitable areas in Bayingol, Tacheng, and Altay. Stable solar resources and easy transportation were the advantages of these highly suitable areas. The most expansive of the five levels of suitability was the suitable area. The total surface area of the suitable area was 399,212 km2, representing 48.31% of the assessment area. Suitable areas were distributed in almost every city or autonomous region of Xinjiang and were often centrally distributed as large sheets. Most of these areas were in the Tarim Basin and the Junggar Basin. The moderately suitable areas had a total surface area of 227,295 km2, representing 27.51% of the assessment area, and they were sporadically distributed. Most of the moderately suitable areas were in the center of the basins or close to the mountains. Areas in the center of the Taklamakan Desert are not easily accessible, and the areas close to the mountains are not rich in solar resources; thus, these areas were not considered for construction. The surface areas of marginally suitable areas and not suitable areas were 49,530 km2 and 62,483 km2, respectively. The marginally suitable area accounted for 5.99% of the assessment area, and the not suitable area accounted for 7.56%. The terrains in these two types of areas were mostly mountainous, characterized by high altitudes and large slope differences. This increases the cost of construction, making these areas unsuitable for PV power plants.
Considering the fact that the construction period should not be too long, only a highly suitable area was selected for calculating the PV power potential in this section. Based on the results of the suitability assessment, there was approximately 87,837 km2 in Xinjiang that can be developed as PV power plants, mainly concentrated in Hami and Turpan. By combining these findings with the spatiotemporal variations in solar resources, it was possible to conclude that the distribution of highly suitable areas was due to the stable and abundant solar resources in these areas, which are beneficial for the development of PV power generation. In addition, there was a high distribution of roads, a low elevation, and a gentle slope.

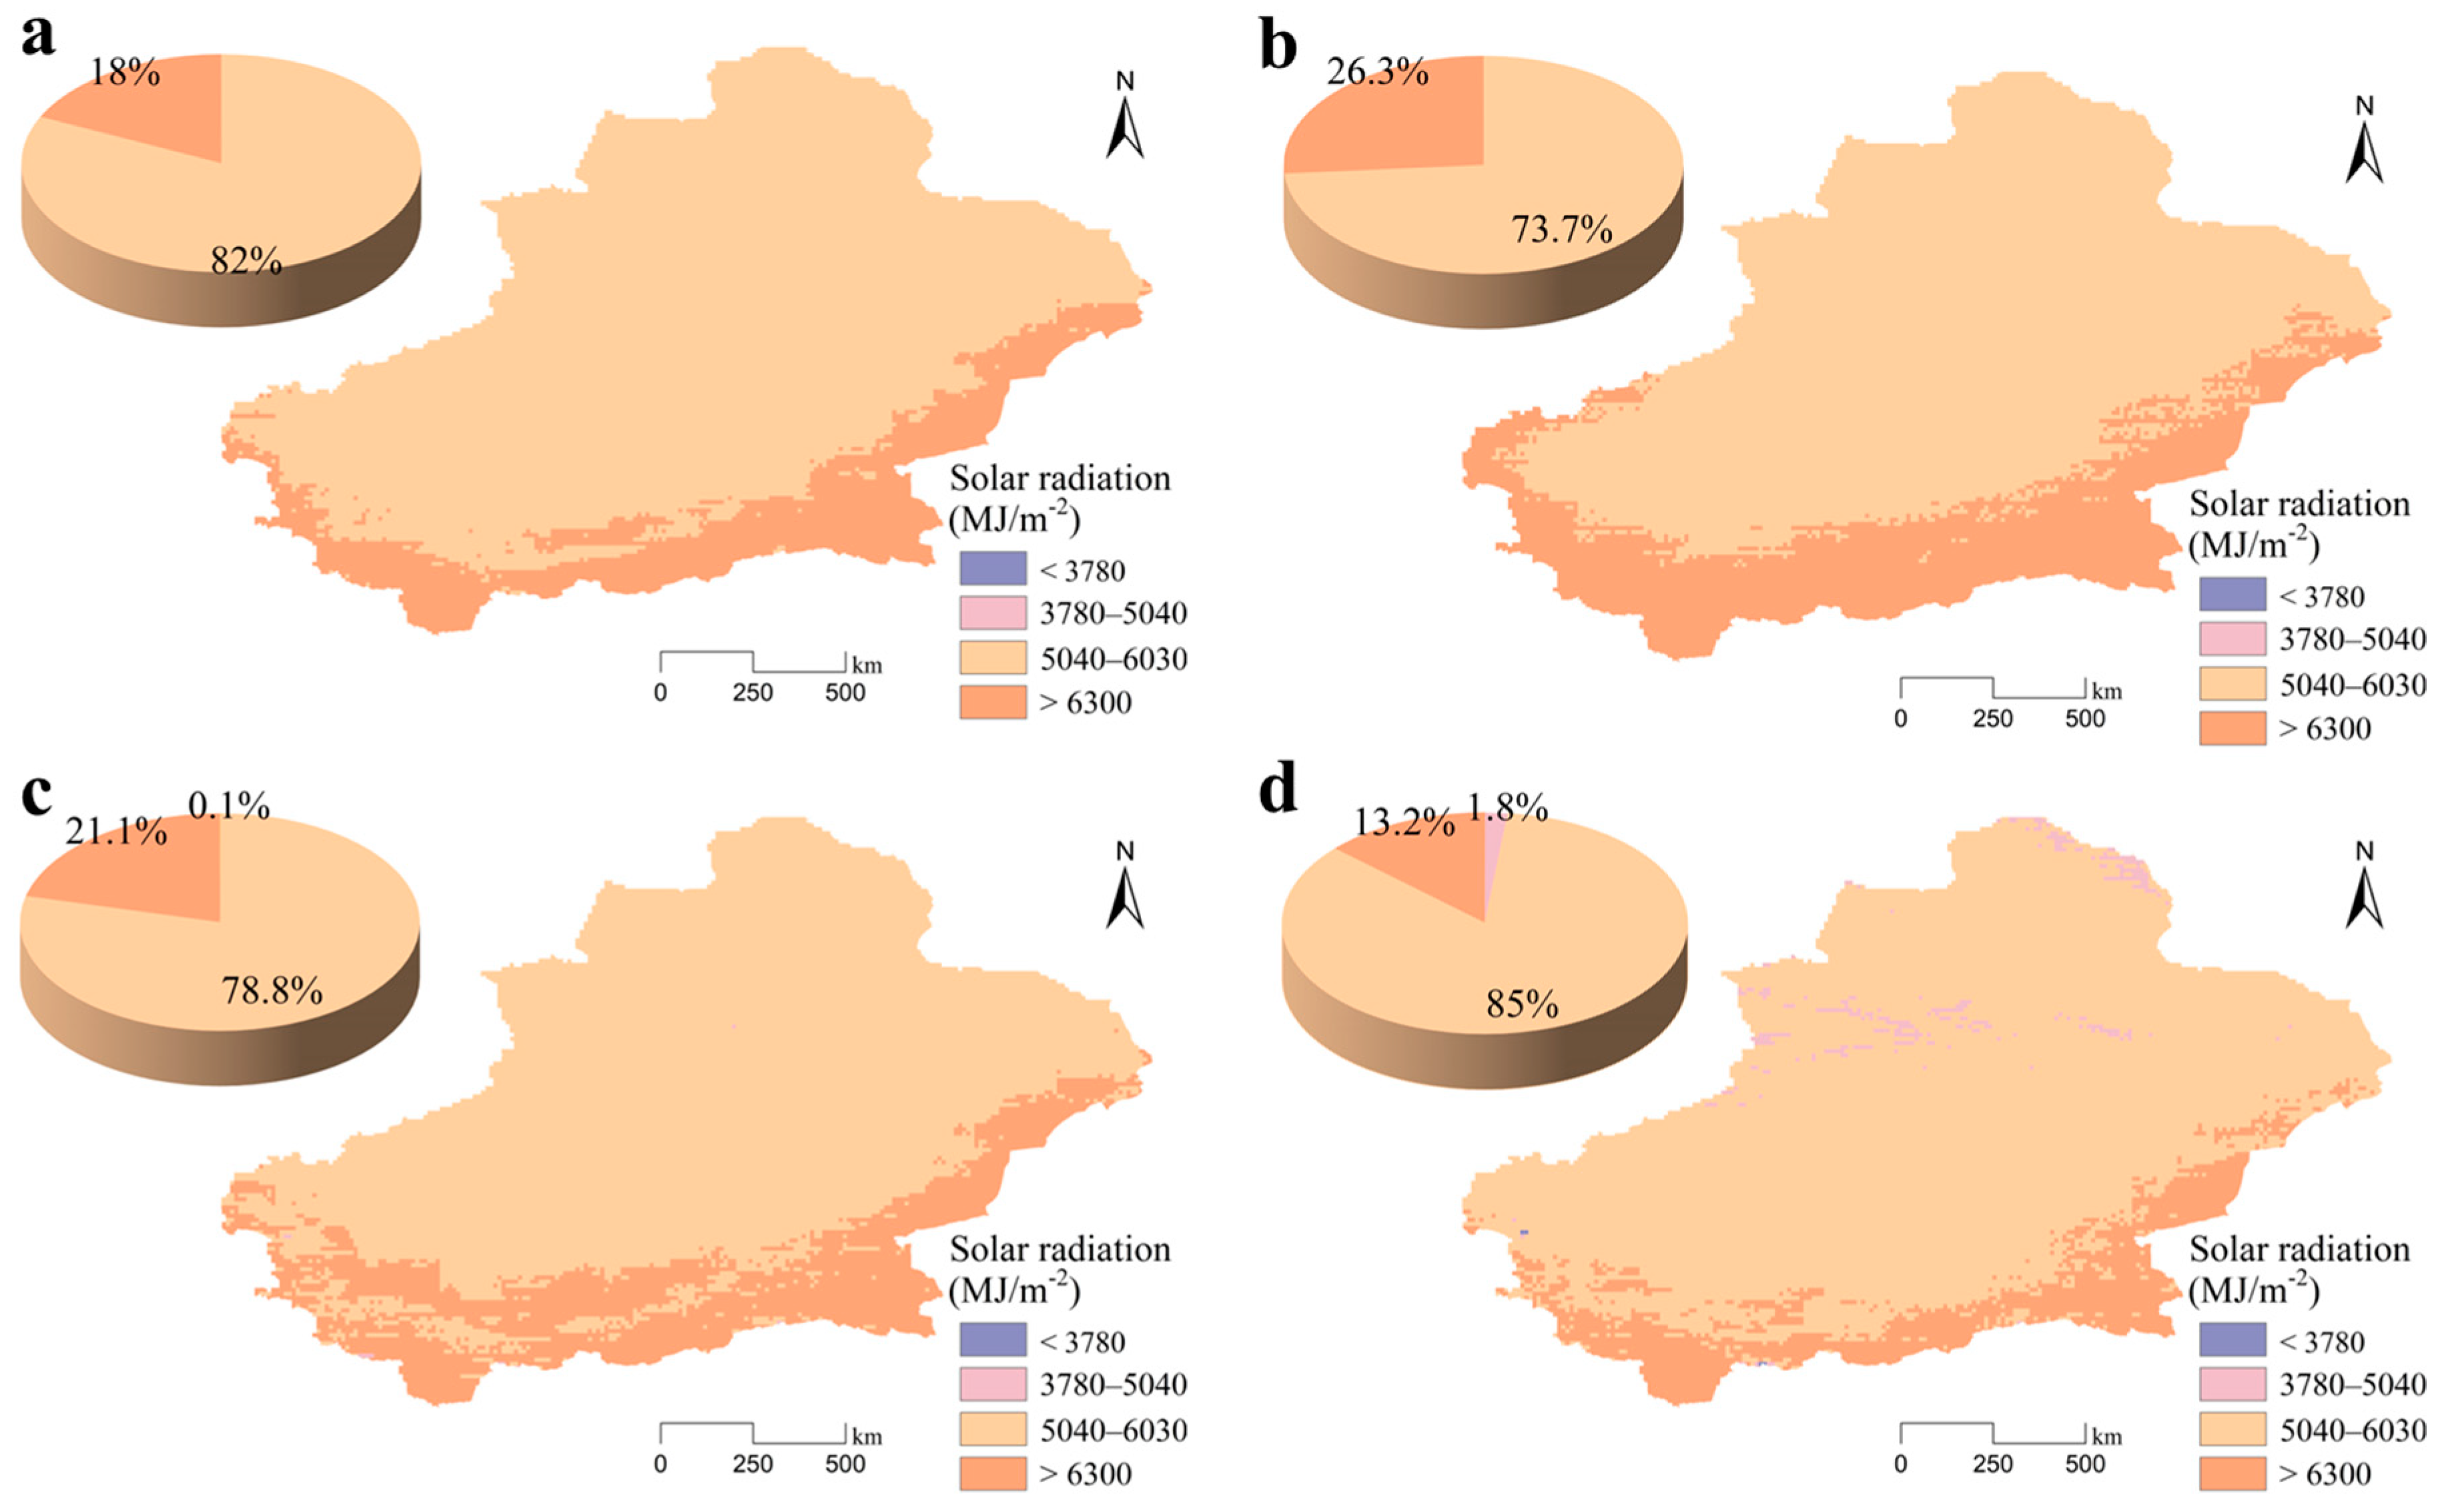
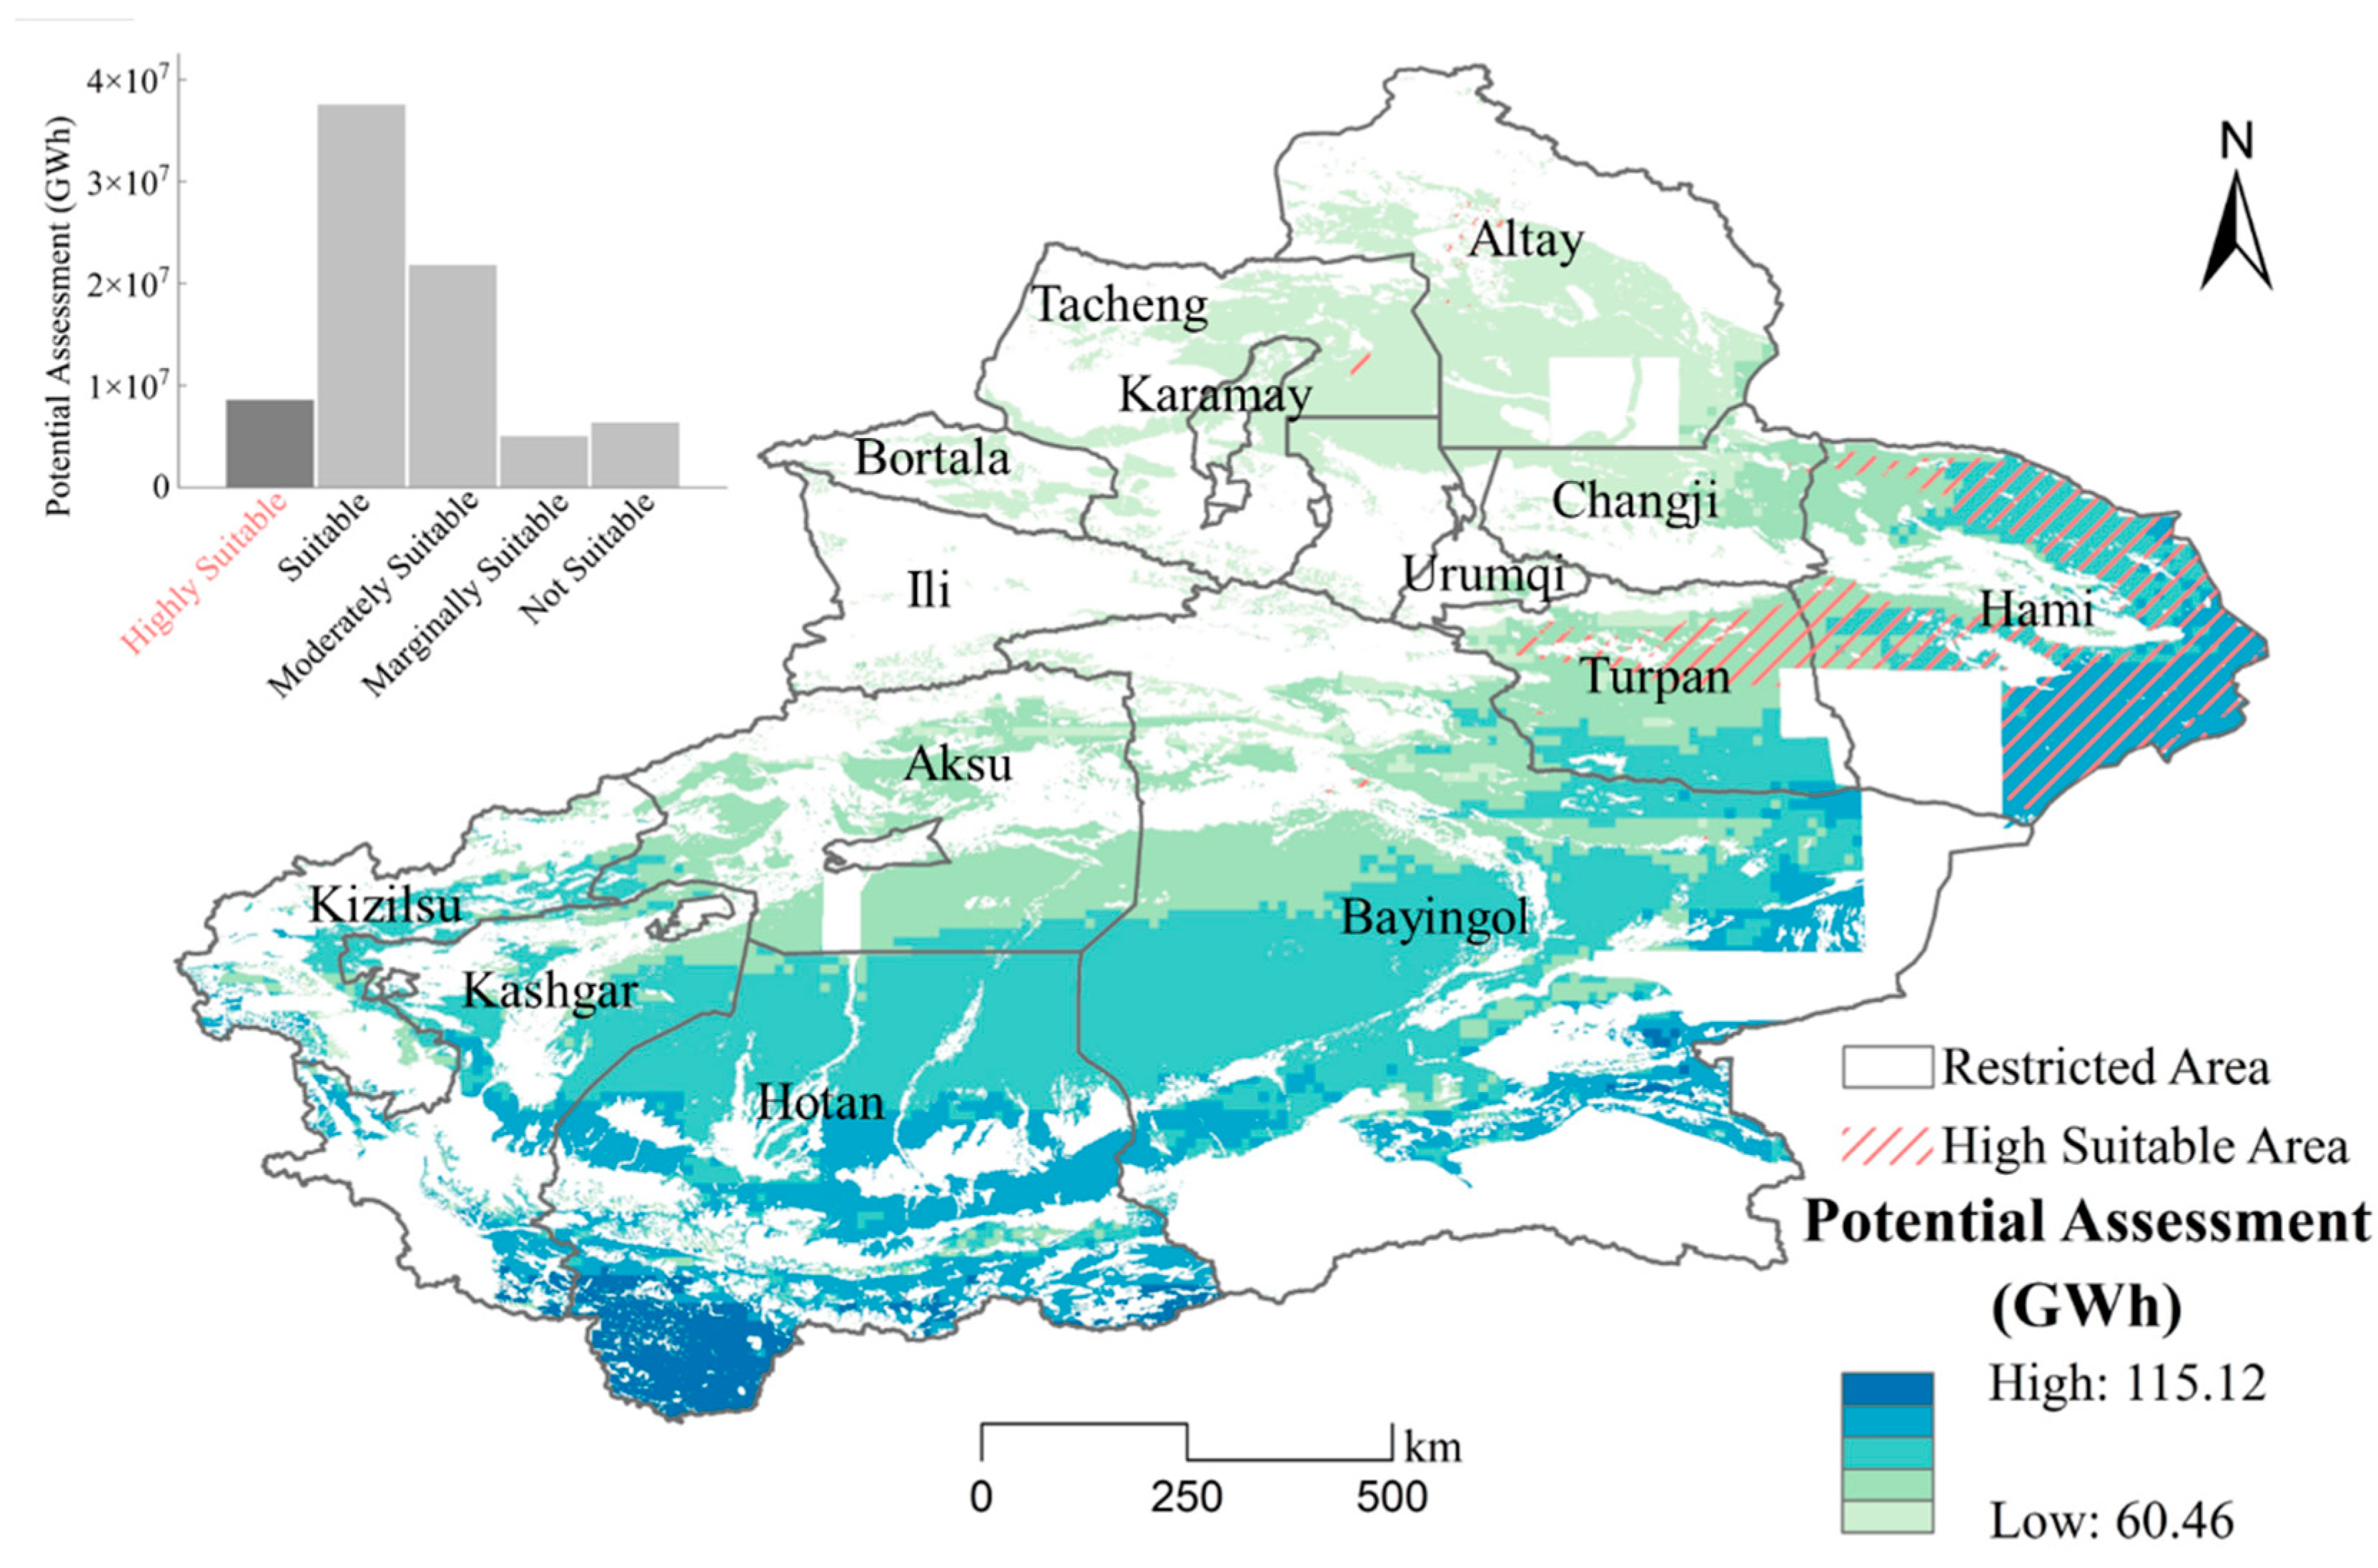
3.3. Assessment of Photovoltaic (PV) Power Generation Potential

The PV power generation potential was investigated, and the total PV power generation potential of different suitability levels is summarized in Figure 6. In addition, this study focused on analyzing the prospects for PV power generation in highly suitable areas.
In this study, SGP is mainly influenced by SR and CA. Solar radiation is the dominant factor in the potential for PV power generation in each grid. The results show that the theoretical potential of PV power generation increases as we move from northern Xinjiang to southern Xinjiang (Figure 6). Most of Hami is in a high suitability area, so the potential of PV power generation in Hami was compared to other areas at the same latitude. Theoretically, the suitable areas can generate a total of 3.75 × 10⁷ GWh of electricity every year, which is the highest amount of electricity among all suitability levels, which is because the suitable area is the largest type of area. On the contrary, marginally suitable areas had the lowest power generation (5 × 10⁶ GWh). The PV power generation potential of moderately suitable and not suitable areas was 2.18 × 10⁷ GWh and 6.31 × 10⁶ GWh, respectively. In highly suitable areas, the theoretical annual potential of PV power generation was 8.57 × 10⁶ GWh.
Overall, although the potential of PV power generation in highly suitable areas was not the highest, the theoretical potential of highly suitable areas was also very impressive.
The result of Xinjiang’s PV power generation potential reveals that Xinjiang has great potential for the development of PV power generation. However, the construction of PV power plants is a long process and is affected by a variety of factors, including national policies and development costs. The potential of PV power generation was calculated under different conditions. The total amount of coal combusted and carbon emissions reduced that are offset by solar power can also be calculated. In this study, the suitability was assessed by a large time series dataset. The results of PV potential can be applied to each year. In this section, the recent electricity consumption in 2020 was selected for comparison, to make the results more convincing. The developmental progress of PV power plants in the highly suitable areas of Xinjiang was divided into the following four situations: S1: 25%; S2: 50%; S3: 75%; and S4: 100% construction progress (Table 5). In the S1 situation, the theoretical potential of the annual PV power generation of Xinjiang is approximately 2.14 × 10⁶ GWh. The total electricity consumption of Xinjiang in 2020 was 3.17 × 10⁵ GWh. Therefore, a progress level of 25% in Xinjiang was fully capable of satisfying Xinjiang’s annual electricity demand. In terms of PV power generation, 2.14 × 10⁶ GWh of PV power generation is equivalent to 6.48 × 10⁸ tce of coal combustion for coal-fired power generation. A reduction of 2.14 × 10⁶ GWh in coal-fired power generation can reduce CO2 emissions by 1.65 × 10⁹ t. In the S2 and S3 situations, the annual PV power generation potential of Xinjiang could reach 4.28 × 10⁶ GWh and 6.42 × 10⁶ GWh, respectively. The generation potential of S2 was about 14 times higher than the 2020 energy consumption levels of Xinjiang. The generation potential of S3 was about 20 times higher than the 2020 energy consumption levels. In theory, 1.30 × 10⁹ and 1.94 × 10⁹ tce of coal, and 3.29 × 10⁹ t and 4.94 × 10⁹ t of CO2, could be reduced, respectively. In the situation with fully developed PV power plants (S4), the theoretical potential of annual PV power generation in Xinjiang was calculated as 8.57 × 10⁶ GWh, which is equivalent to 2.59 × 10⁹ tce of coal; therefore, 6.58 × 10⁹ t of CO2 emissions could be reduced. The generation potential of the S4 is about 27 times higher than Xinjiang’s total energy consumption in 2020.
Therefore, the huge potential of PV power generation in Xinjiang (about 8.57 × 10⁶ GWh per year) is shown in the result. The construction of PV power plants would help a lot in reducing the consumption of fossil fuels. Additionally, it could provide significant benefits by reducing CO2 emissions. Even if only 25% of PV power plant development is completed, the potential output would be enough to cover Xinjiang’s annual electricity demand.

4. Discussion

The spatiotemporal variation in solar radiation was explored, to better investigate the potential of PV power generation. In this study, a longer time scale (1984–2016) was selected when analyzing the spatiotemporal variations in solar radiation, as the results of short-term spatiotemporal studies cannot be accurately used to study future trends. In addition, this study synthesized the solar radiation changes in the whole of Xinjiang, rather than focusing only on the southern part of the region, where solar radiation is higher. Only studying higher radiation areas or several cities is not representative. However, the original resolution of the dataset was 10 km. This dataset needed to be preprocessed before it could be used to study the spatial distribution of solar resources. The final variations in solar radiation in this study were less different from the results of Zhang’s study [51]. Solar radiation in Xinjiang increased from the north to the south, showing the highest value in the Kunlun Mountains. Compared with the solar radiation in southern Xinjiang, the solar radiation in northern Xinjiang decreased more obviously. Solar radiation in eastern Xinjiang was relatively stable. Topography plays a crucial role in meso- and small-scale climate patterns [52]. Compared to plains, basins, and hills, mountainous areas with complex topography were more prone to climate change. From 1984 to 2016, the climate of northern Xinjiang became increasingly humid. In addition, the precipitation in high mountainous areas increased the most [53]. Increased precipitation led to increased cloud coverage and water vapor content; thus, solar radiation was reduced. An increase in AOD led to a decrease in solar radiation; however, AOD did not have as great an effect on solar radiation as water vapor content in northern Xinjiang, because it is difficult for most of the fine dust to cross the Tien Shan [54]. Compared with the solar energy resources of other provinces in China, Xinjiang is one of the richest regions in China in terms of solar energy resources. In particular, the solar radiation in the south of Xinjiang is similar to that in Tibet [55].
The method used in this study provided a more objective and accurate suitability assessment of PV power generation in Xinjiang. Previous studies have argued that southwestern Xinjiang, especially the Taklamakan Desert, is more suitable for constructing power plants [56]. The Taklamakan Desert has the advantages of abundant solar energy resources, a small population, and a large area [57]. However, only considering the advantages of regions leads to incomplete conclusions. Before the construction of photovoltaic power plants, economic costs and the difficulty of maintenance at a later stage need to be considered. The disadvantages of the Taklamakan Desert are the scarcity of water resources and the low number of roads. These drawbacks may have an impact on the cost of constructing the PV power plants in this region. Thus, this study integrated climatic, geographic, and economic factors. Solar radiation and sunshine duration were climatic factors, essential references for the suitability assessment of PV power generation. The DEM and slope were geographic factors, which greatly limited site selection. Finally, due to the high maintenance requirements of PV power plants, their distance from roads is an economic factor. With regard to the range of factors it examined and the suitability assessment results it produced, this study was more comprehensive and scientific than previous research. In addition, most studies used only one year of data for the suitability assessment. Data for one year cannot fully represent the long-term situation in an area. The averages of multi-time scales for solar radiation and sunshine duration were selected as the assessment criteria, to ensure a longer validity period for the assessment results of this study.
The investment in PV power is huge [58]. It is possible to divide the highly suitable area into different parts; for example, according to the results, Hami and Turpan had larger highly suitable areas because of their rich and stable solar resources. Hami and Turpan are therefore recommended as priority development zones for harnessing solar energy via photovoltaic systems. Adjusting power loads can reduce the costs of operation by reducing the failure rate of PV plants [59]. The development of PV power generation can also promote the economic development of Xinjiang [58]. Therefore, it is feasible to gradually develop PV power generation, in terms of investment in Xinjiang. The population of Xinjiang is not sporadically distributed [60]; therefore, the impact of PV power generation on communities can be reduced by selecting bare land with low population densities in Hami and Turpan. Xinjiang lacks water resources and its available water resources are spatially unevenly distributed [61]. Similarly, choosing a region far away from the bodies of water in Hami and Turpan in which to build PV power plants could reduce the impact on water resources.
The study’s findings indicated areas with significant potential performance for PV power generation. The development of PV power generation is beneficial to the reduction in CO2 emissions. However, there are still some issues that need to be solved. For instance, the establishment of the power grid plays an important role in the storage, transportation, and distribution of electricity. According to the Xinjiang Statistical Yearbook, the amount of power generated in 2020 was 4.12 × 10⁵ GWh, and total electricity consumption in 2020 reached 3.17 × 10⁵ GWh. Xinjiang’s PV power generation in 2020 was 1.57 × 10⁴ GWh. Based on the results of other PV potential studies in China [19,35], it can be concluded that the PV potential in Xinjiang calculated in this study was reasonable. The problem of an electricity surplus is obvious, previous studies also show that the phenomenon of abandoned PV rates in Xinjiang is serious [62]; electricity transmission over long distances faces challenges of electricity losses. Alternatively, we could use the Power-to-Gas (PtG) processes used in Poland and Germany [63]. PtG processes can effectively reduce power waste. The amount of coal-fired power generated in Xinjiang in 2020 was 3.26 × 10⁵ GWh. Currently, coal-fired power generation is still the dominant form of power generation because it is the most stable form of power generation. The potential of PV power generation is random, however, as climate factors can easily affect its efficiency; therefore, PV power generation cannot completely replace thermal power generation. Only a part of the fossil fuel power generation can be gradually replaced, and this requires more time. For areas where coal-fired power generation is the main source of energy, inadequate power reserves may lead to threats to the safety of electricity. Power delivery technology also requires modernization to protect the power plants and electricity grids [59]. Furthermore, improvements in the storage and transportation of electricity could increase the local income from PV plants [62]. Thus, it is relevant to resolve the problems of the surplus, shortage, and deployment of electricity.
Accelerating the development of PV power generation and reducing the use of fossil fuels is an effective approach to promoting green and low-carbon development. In addition, studying the spatiotemporal variation in solar radiation and the potential assessment of PV power generation contributes toward the goals of ‘carbon peak’ and ‘carbon neutrality’. This study used its results to recommend developing PV power generation in Xinjiang and reducing the use of fossil fuels and CO2 emissions, based on the good solar resources and geographical conditions of Xinjiang. It is expected that the electricity generated by the PV power plants in Xinjiang will be popularized in Xinjiang and other provinces in eastern China. According to the study’s findings, PV power generation in Hami and Turpan should be actively developed. The highly suitable areas in these two regions will bring great benefits if they are completely constructed as PV power plants. However, this study has some shortcomings, such as the late introduction of an idea for technological innovations. Also, PV power generation does not fully represent a new energy source; there is not enough research on wind power, for example. A further study of the shortcomings will help Xinjiang to increase the feasibility of the development of new energy sources.

5. Conclusions

The main purpose of this study was to analyze the spatiotemporal variation in Xinjiang’s solar radiation levels and estimate the suitability and potential of PV power generation in Xinjiang. The main findings of this study were as follows:
(1)
The solar radiation in Xinjiang decreased from 1984 to 2002, increased from 2002 to 2009, and decreased from 2009 to 2016. More than half of the area’s overall radiation has increased. Additionally, over 90% of future trends in Xinjiang were similar to past trends. In terms of spatial distribution, solar radiation was lower in northern Xinjiang and higher in southern Xinjiang. Furthermore, solar radiation levels in eastern Xinjiang were relatively stable.
(2)
The highly suitable area in Xinjiang for PV power generation totaled approximately 87,837 km2, which accounted for 10.63% of the assessment area. The potential of PV power generation in a highly suitable area was 8.57 × 10⁶ GWh, which was lower than in a suitable or moderately suitable area, but higher than in a marginally suitable or not suitable area. The highly suitable areas were mainly concentrated in eastern Xinjiang. Areas with low suitability scores were mostly in the Kunlun Mountains, the Tien Shan, and the Altai Mountains.
(3)
The theoretical PV power generation after 25% development progress in the highly suitable areas is high enough to supply enough power to fulfill the annual consumption of electricity in Xinjiang. In the situation where the construction of PV power plants is fully developed, the theoretical potential of annual PV power generation in Xinjiang would be approximately 8.57 × 10⁶ GWh, which is equivalent to 2.59 × 10⁹ t of coal. Moreover, 6.58 × 10⁹ t of CO2 emissions could be reduced.

Author Contributions

X.L. and L.J. designed the research. J.B. processed the data and wrote the manuscript. T.Y., J.Z., F.S. and W.X. provided the analysis tools and technical assistance. All authors have read and agreed to the published version of the manuscript.

Funding

This work was supported by the Tianshan Talent Training Program of the Xinjiang Uygur Autonomous Region (2023TSYCCX0087), and Regional Collaborative Innovation Project of Xinjiang (No. 2020E01044).

Institutional Review Board Statement

Not applicable.

Informed Consent Statement

Informed consent was obtained from all subjects involved in the study.

Data Availability Statement

Data are contained within the article.

Acknowledgments

We are very grateful to the National Tibetan Plateau Data Center for the solar radiation dataset and the climate data, the Resource and Environment Science and Data Center (http://www.resdc.cn/) (accessed on 20 December 2023) for LUCC data, and the OpenStreetMap for road data. We are grateful to the editor and anonymous reviewers for their constructive comments and suggestions for improving the manuscript.

Conflicts of Interest

The authors declare no conflicts of interest.

References

  1. Liu, L.; He, G.; Wu, M.; Liu, G.; Zhang, H.; Chen, Y.; Shen, J.; Li, S. Climate change impacts on planned supply–demand match in global wind and solar energy systems. Nat. Energy 2023, 8, 870–880. [Google Scholar] [CrossRef]
  2. Desideri, U.; Zepparelli, F.; Morettini, V.; Garroni, E. Comparative analysis of concentrating solar power and photovoltaic technologies: Technical and environmental evaluations. Appl. Energy 2013, 102, 765–784. [Google Scholar] [CrossRef]
  3. Zang, H.; Jiang, X.; Cheng, L.; Zhang, F.; Wei, Z.; Sun, G. Combined empirical and machine learning modeling method for estimation of daily global solar radiation for general meteorological observation stations. Renew. Energy 2022, 195, 795–808. [Google Scholar] [CrossRef]
  4. Kambezidis, H.D. The solar radiation climate of Athens: Variations and tendencies in the period 1992–2017, the brightening era. Sol. Energy 2018, 173, 328–347. [Google Scholar] [CrossRef]
  5. Diabaté, L.; Blanc, P.; Wald, L. Solar radiation climate in Africa. Sol. Energy 2004, 76, 733–744. [Google Scholar] [CrossRef]
  6. Gu, W.; Guli, J.; Yin, H.; Jiang, L.; Zang, X. Spatial and temporal distribution characteristic and division research of solar energy resources in southern Xinjiang. Arid. Land Geogr. 2021, 44, 1665–1675. [Google Scholar]
  7. Li, R.; Zhao, L.; Wu, T.; Ding, Y.; Xin, Y.; Zou, D.; Xiao, Y.; Jiao, Y.; Qin, Y.; Sun, L. Temporal and spatial variations of global solar radiation over the Qinghai–Tibetan Plateau during the past 40 years. Theor. Appl. Climatol. 2013, 113, 573–583. [Google Scholar] [CrossRef]
  8. Sun, Y.; Hof, A.; Wang, R.; Liu, J.; Lin, Y.; Yang, D. GIS-based approach for potential analysis of solar PV generation at the regional scale: A case study of Fujian Province. Energy Policy 2013, 58, 248–259. [Google Scholar] [CrossRef]
  9. Alami Merrouni, A.; Elwali Elalaoui, F.; Mezrhab, A.; Mezrhab, A.; Ghennioui, A. Large scale PV sites selection by combining GIS and Analytical Hierarchy Process. Case study: Eastern Morocco. Renew. Energy 2018, 119, 863–873. [Google Scholar] [CrossRef]
  10. Tavana, M.; Soltanifar, M.; Santos-Arteaga, F.J. Analytical hierarchy process: Revolution and evolution. Ann. Oper. Res. 2023, 326, 879–907. [Google Scholar] [CrossRef]
  11. Bao, Z.; Shi, R.; Huang, Y.; Song, X. Photovoltaic generation potential and developmental suitability in southern Hebei. Energy Rep. 2023, 9, 795–805. [Google Scholar] [CrossRef]
  12. Stern, R.; Muller, J.D.; Rotenberg, E.; Amer, M.; Segev, L.; Yakir, D. Photovoltaic fields largely outperform afforestation efficiency in global climate change mitigation strategies. PNAS Nexus 2023, 2, pgad352. [Google Scholar] [CrossRef] [PubMed]
  13. Xiong, J.; Wang, Z.; Lai, C.; Liao, Y.; Wu, X. Spatiotemporal variability of sunshine duration and influential climatic factors in mainland China during 1959–2017. Int. J. Climatol. 2020, 40, 6282–6300. [Google Scholar] [CrossRef]
  14. Xia, N.; Hai, W.; Tang, M.; Song, J.; Quan, W.; Zhang, B.; Ma, Y. Spatiotemporal evolution law and driving mechanism of production–living–ecological space from 2000 to 2020 in Xinjiang, China. Ecol. Indic. 2023, 154, 110807. [Google Scholar] [CrossRef]
  15. Yao, J.; Chen, Y.; Guan, X.; Zhao, Y.; Chen, J.; Mao, W. Recent climate and hydrological changes in a mountain–basin system in Xinjiang, China. Earth-Sci. Rev. 2022, 226, 103957. [Google Scholar] [CrossRef]
  16. Li, Y.; Dai, M.; Hao, S.; Qiu, G.; Li, G.; Xiao, G.; Liu, D. Optimal generation expansion planning model of a combined thermal–wind–PV power system considering multiple boundary conditions: A case study in Xinjiang, China. Energy Rep. 2021, 7, 515–522. [Google Scholar] [CrossRef]
  17. Zhang, Z.; Chen, M.; Zhong, T.; Zhu, R.; Qian, Z.; Zhang, F.; Yang, Y.; Zhang, K.; Santi, P.; Wang, K.; et al. Carbon mitigation potential afforded by rooftop photovoltaic in China. Nat. Commun. 2023, 14, 2347. [Google Scholar] [CrossRef]
  18. Feng, F.; Wang, K. Merging High-Resolution Satellite Surface Radiation Data with Meteorological Sunshine Duration Observations over China from 1983 to 2017. Remote Sens. 2021, 13, 602. [Google Scholar] [CrossRef]
  19. Qiu, T.; Wang, L.; Lu, Y.; Zhang, M.; Qin, W.; Wang, S.; Wang, L. Potential assessment of photovoltaic power generation in China. Renew. Sustain. Energy Rev. 2022, 154, 111900. [Google Scholar] [CrossRef]
  20. Wang, Y.; Walter, R.K.; White, C.; Kehrli, M.D.; Hamilton, S.F.; Soper, P.H.; Ruttenberg, B.I. Spatial and temporal variation of offshore wind power and its value along the Central California Coast. Environ. Res. Commun. 2019, 1, 121001. [Google Scholar] [CrossRef]
  21. GB/T 31155-2014; Classification of Solar Energy resources—Global Radiation. Standardization Administration of China (SAC): Beijing, China, 2014.
  22. Bedim Godoy, R.F.; Crisiogiovanni, E.L.; Trevisan, E.; Dias Radomski, F.A. Spatial and temporal variation of water quality in a watershed in center-west Paraná, Brazil. Water Supply 2021, 21, 1718–1734. [Google Scholar] [CrossRef]
  23. Li, Z.; Xu, R. An early-warning method for rock failure based on Hurst exponent in acoustic emission/microseismic activity monitoring. Bull. Eng. Geol. Environ. 2021, 80, 7791–7805. [Google Scholar] [CrossRef]
  24. Cadenas, E.; Campos Amezcua, R.; Rivera, W.; Espinosa Medina, M.A.; Méndez Gordillo, A.R.; Rangel, E.; Tena, J. Wind speed variability study based on the Hurst coefficient and fractal dimensional analysis. Energy Sci. Eng. 2019, 7, 361–378. [Google Scholar] [CrossRef]
  25. Garcia-Gutierrez, L.; Voyant, C.; Notton, G.; Almorox, J. Evaluation and Comparison of Spatial Clustering for Solar Irradiance Time Series. Appl. Sci. 2022, 12, 8529. [Google Scholar] [CrossRef]
  26. Liu, J.; Cheng, C.; Yang, X.; Yan, L.; Lai, Y. Analysis of the efficiency of Hong Kong REITs market based on Hurst exponent. Phys. A Stat. Mech. Its Appl. 2019, 534, 122035. [Google Scholar] [CrossRef]
  27. Perpiña Castillo, C.; Batista e Silva, F.; Lavalle, C. An assessment of the regional potential for solar power generation in EU-28. Energy Policy 2016, 88, 86–99. [Google Scholar] [CrossRef]
  28. Uyan, M. GIS-based solar farms site selection using analytic hierarchy process (AHP) in Karapinar region, Konya/Turkey. Renew. Sustain. Energy Rev. 2013, 28, 11–17. [Google Scholar] [CrossRef]
  29. Guaita-Pradas, I.; Marques-Perez, I.; Gallego, A.; Segura, B. Analyzing territory for the sustainable development of solar photovoltaic power using GIS databases. Environ. Monit. Assess. 2019, 191, 764. [Google Scholar] [CrossRef] [PubMed]
  30. Aryanfar, A.; Gholami, A.; Pourgholi, M.; Shahroozi, S.; Zandi, M.; Khosravi, A. Multi-criteria photovoltaic potential assessment using fuzzy logic in decision-making: A case study of Iran. Sustain. Energy Technol. Assess. 2020, 42, 100877. [Google Scholar] [CrossRef]
  31. Charabi, Y.; Gastli, A. PV site suitability analysis using GIS-based spatial fuzzy multi-criteria evaluation. Renew. Energy 2011, 36, 2554–2561. [Google Scholar] [CrossRef]
  32. Fang, H.; Li, J.; Song, W. Sustainable site selection for photovoltaic power plant: An integrated approach based on prospect theory. Energy Convers. Manag. 2018, 174, 755–768. [Google Scholar] [CrossRef]
  33. Zhang, Z.; Li, R.; Zhao, C.; Li, F. Cross-characterization of PV and Sunshine Profiles Based on Hierarchical Classification. Energy Procedia 2016, 103, 15–21. [Google Scholar] [CrossRef]
  34. Reza Hosseini, S.M. Large utility scale PV power plant optimum site selection in Iran using GIS analysis. In Proceedings of the 2019 Iranian Conference on Renewable Energy & Distributed Generation (ICREDG), Tehran, Iran, 11–12 June 2019; IEEE: Piscataway, NJ, USA, 2019; pp. 1–14. [Google Scholar]
  35. Yang, Q.; Huang, T.; Wang, S.; Li, J.; Dai, S.; Wright, S.; Wang, Y.; Peng, H. A GIS-based high spatial resolution assessment of large-scale PV generation potential in China. Appl. Energy 2019, 247, 254–269. [Google Scholar] [CrossRef]
  36. Luan, C.; Liu, R.; Peng, S. Land-use suitability assessment for urban development using a GIS-based soft computing approach: A case study of Ili Valley, China. Ecol. Indic. 2021, 123, 107333. [Google Scholar] [CrossRef]
  37. Ibrahim, J.K. Nuclear power plant development. In Nuclear Reactor Technology Development and Utilization; Woodhead Publishing: Sawston, UK, 2020; pp. 363–405. [Google Scholar]
  38. Licheng, L.; Zhongxiao, S.; Feng, W.U.; Xueliang, Z.; Qian, Z. Evaluation of suitability and emission reduction benefits of photovoltaic development in Beijing-Tianjin-Hebei region. Acta Geogr. Sin. 2022, 77, 665–678. [Google Scholar]
  39. Dormann, C.F.; Elith, J.; Bacher, S.; Buchmann, C.; Carl, G.; Carré, G.; Marquéz, J.R.G.; Gruber, B.; Lafourcade, B.; Leitão, P.J.; et al. Collinearity: A review of methods to deal with it and a simulation study evaluating their performance. Ecography 2013, 36, 27–46. [Google Scholar] [CrossRef]
  40. Cheng, J.; Sun, J.; Yao, K.; Xu, M.; Cao, Y. A variable selection method based on mutual information and variance inflation factor. Spectrochim. Acta Part A Mol. Biomol. Spectrosc. 2022, 268, 120652. [Google Scholar] [CrossRef]
  41. Guo, Z.; Wei, W.; Pang, S.; Li, Z.; Zhou, J.; Xie, B. Spatio-Temporal evolution and motivation analysis of ecological vulnerability in Arid Inland River Basin based on SPCA and remote sensing index: A case study on the Shiyang River Basin. Acta Ecol. Sin. 2019, 39, 2558–2572. [Google Scholar]
  42. Zou, T.; Yoshino, K. Environmental vulnerability evaluation using a spatial principal components approach in the Daxing’anling region, China. Ecol. Indic. 2017, 78, 405–415. [Google Scholar] [CrossRef]
  43. Clifton, J.; Boruff, B.J. Assessing the potential for concentrated solar power development in rural Australia. Energy Policy 2010, 38, 5272–5280. [Google Scholar] [CrossRef]
  44. Gastli, A.; Charabi, Y. Solar electricity prospects in Oman using GIS-based solar radiation maps. Renew. Sustain. Energy Rev. 2010, 14, 790–797. [Google Scholar] [CrossRef]
  45. DB21/T 1620–2008; Standard Coal Consumption Rate and Calculation Method for Thermal Power Plants. Liaoning Provincial Quality and Technology Supervision Bureau: Shenyang, China, 2008.
  46. Zhang, N.; Jiang, Y.; Zhao, X.; Deng, J.; Mi, Q.; Li, J. How much carbon dioxide has the Chinese PV manufacturing industry emitted? J. Clean. Prod. 2023, 425, 138904. [Google Scholar] [CrossRef]
  47. Shan, Y.; Huang, Q.; Guan, D.; Hubacek, K. China CO2 emission accounts 2016–2017. Sci. Data 2020, 7, 54. [Google Scholar] [CrossRef]
  48. Jin, L.; Li, Z.; He, Q.; Abbas, A. Variation in Surface Solar Radiation and the Influencing Factors in Xinjiang, Northwestern China. Adv. Meteorol. 2022, 2022, 1999997. [Google Scholar] [CrossRef]
  49. Zhang, Y.; Ren, J.; Pu, Y.; Wang, P. Solar energy potential assessment: A framework to integrate geographic, technological, and economic indices for a potential analysis. Renew. Energy 2020, 149, 577–586. [Google Scholar] [CrossRef]
  50. Xu, C.; Li, J.; Zhao, J.; Gao, S.; Chen, Y. Climate variations in northern Xinjiang of China over the past 50 years under global warming. Quat. Int. 2015, 358, 83–92. [Google Scholar] [CrossRef]
  51. Zhang, X.; Lu, N.; Jiang, H.; Yao, L. Evaluation of Reanalysis Surface Incident Solar Radiation Data in China. Sci. Rep. 2020, 10, 3494. [Google Scholar] [CrossRef]
  52. Chen, S.; Ma, M.; Wu, S.; Tang, Q.; Wen, Z. Topography intensifies variations in the effect of human activities on forest NPP across altitude and slope gradients. Environ. Dev. 2023, 45, 100826. [Google Scholar] [CrossRef]
  53. He, B.; Sheng, Y.; Cao, W.; Wu, J. Characteristics of Climate Change in Northern Xinjiang in 1961–2017, China. Chin. Geogr. Sci. 2020, 30, 249–265. [Google Scholar] [CrossRef]
  54. Ren, G.; Pan, B.; Wang, J.; An, D.; Yang, M.; Liu, H. Spatiotemporal distribution of dust aerosol optical properties from CALIPSO and CATS observations in Xinjiang, China. J. Atmos. Sol.-Terr. Phys. 2023, 243, 106006. [Google Scholar] [CrossRef]
  55. Wang, Y.; Chao, Q.; Zhao, L.; Chang, R. Assessment of wind and photovoltaic power potential in China. Carbon Neutrality 2022, 1, 15. [Google Scholar] [CrossRef]
  56. Lu, S.; Ma, S.; Liu, M. On the development of the hybrid energy storage system that enhance the frequency stability of Southern Xinjiang power system. In Proceedings of the Eighth International Symposium on Advances in Electrical, Electronics, and Computer Engineering (ISAEECE 2023), Hangzhou, China, 31 May 2023; Volume 127041. [Google Scholar]
  57. Xia, Z.; Li, Y.; Zhang, W.; Chen, R.; Guo, S.; Zhang, P.; Du, P. Solar photovoltaic program helps turn deserts green in China: Evidence from satellite monitoring. J. Environ. Manag. 2022, 324, 116338. [Google Scholar] [CrossRef]
  58. Wang, Y.; Wang, R.; Tanaka, K.; Ciais, P.; Penuelas, J.; Balkanski, Y.; Sardans, J.; Hauglustaine, D.; Liu, W.; Xing, X.; et al. Accelerating the energy transition towards photovoltaic and wind in China. Nature 2023, 619, 761–767. [Google Scholar] [CrossRef]
  59. Kut, P.; Pietrucha-Urbanik, K. Most Searched Topics in the Scientific Literature on Failures in Photovoltaic Installations. Energies 2022, 15, 8108. [Google Scholar] [CrossRef]
  60. Dong, D.; Tao, H.; Zhang, Z. Projected population exposure to heatwaves in Xinjiang Uygur autonomous region, China. Sci. Rep. 2024, 14, 4570. [Google Scholar] [CrossRef]
  61. Luo, M.; Liu, T.; Meng, F.; Duan, Y.; Bao, A.; Xing, W.; Feng, X.; De Maeyer, P.; Frankl, A. Identifying climate change impacts on water resources in Xinjiang, China. Sci. Total Environ. 2019, 676, 613–626. [Google Scholar] [CrossRef]
  62. Fan, X.; Wang, W.; Shi, R.; Cheng, Z. Hybrid pluripotent coupling system with wind and photovoltaic-hydrogen energy storage and the coal chemical industry in Hami, Xinjiang. Renew. Sustain. Energy Rev. 2017, 72, 950–960. [Google Scholar] [CrossRef]
  63. Kut, P.; Pietrucha-Urbanik, K. Bibliometric Analysis of Renewable Energy Research on the Example of the Two European Countries: Insights, Challenges, and Future Prospects. Energies 2024, 17, 176. [Google Scholar] [CrossRef]
Figure 1. Elevation map of the study area. The digital elevation model (DEM) dataset was obtained from the following website: http://earth.jaxa.jp/en/ (accessed on 27 October 2023).
Sustainability 16 03281 g001
Figure 2. Normalization of indicators. (a) Normalization of ASR. The solar radiation dataset was obtained from the website https://data.tpdc.ac.cn/ (accessed on 20 October 2023). (b) Normalization of SSD. The sunshine duration dataset was obtained from the website www.gis5g.com (accessed on 22 October 2023). (c) Normalization of DEM. The DEM dataset was obtained from the website http://earth.jaxa.jp/en/ (accessed on 21 November 2023). (d) Normalization of SLO. (e) Normalization of DFR. The roads dataset was obtained from the website https://www.openstreetmap.org (accessed on 21 December 2023). (f) Definition of the assessment area.
Sustainability 16 03281 g002
Figure 3. Temporal variation in solar radiation in Xinjiang. (a) Linear fit of solar radiation during different time intervals. (b) Trends of total solar radiation in Xinjiang from 1984 to 2016. (c) The future trends of solar radiation in Xinjiang. The solar radiation dataset was obtained from the website https://data.tpdc.ac.cn/ (accessed on 20 October 2023).
Sustainability 16 03281 g003
Figure 4. Spatial variation in solar radiation in Xinjiang. (a) Average solar radiation from 1984 to 2016. (b) Solar radiation in 1984. (c) Solar radiation in 2000. (d) Solar radiation in 2016. The solar radiation dataset was obtained from the website: https://data.tpdc.ac.cn/ (accessed on 20 October 2023).
Sustainability 16 03281 g004
Figure 5. Suitability assessment for photovoltaic (PV) power generation in Xinjiang.
Sustainability 16 03281 g005
Figure 6. Potential of photovoltaic (PV) power generation in Xinjiang.
Sustainability 16 03281 g006
Table 1. Attribute information for different data.
DataData SourceSpatial ResolutionTime Period
Solar radiationHigh spatial resolution surface solar radiation dataset, created by merging sunshine hours over China.10 km1984–2016
Sunshine durationChina Surface Climate Data Daily Value Dataset V3.0. 2000–2014
Digital elevation modelALOS DSM: Global 30 m v3.2. 30 m
Land useLUCC (Resource Environment Data Cloud).1 km2015
RoadsOpenStreetMap. 2015
Protected areaSpatial distribution data of nature reserves in Xinjiang, constructed according to the directory of nature reserves and the functional zoning map of nature reserves from the National Forestry and Grassland Administration and Ministry of Natural Resources.
Table 2. Results of the multicollinearity test.
CriteriaVariance Inflation Factor (VIF)
Solar radiation2.022
Sunshine duration1.272
Elevation2.526
Slope1.851
Distance to roads1.164
Table 3. Eigenvalues and contribution ratio.
PC LayerEigenvalueContribution Ratio (%)Cumulative Contribution (%)
10.02040.27040.270
20.01732.56772.837
30.00816.24489.081
40.0047.72296.803
50.0023.197100.000
Table 4. Principal component load matrix.
CriterionPC1PC2PC3PC4PC5Weight (%)
ASR−0.3780.0720.3940.646−0.5280.074
DEM0.7120.553−0.0500.036−0.4270.398
DFR0.569−0.6860.4150.1790.0280.098
SLO0.1430.3290.0390.6040.7110.243
SSD−0.0700.3310.818−0.4290.1810.187
Table 5. Power generation potential and emission reduction effects.
SituationsArea of Highly
Suitable Land (km2)
Theoretical
Potential (GWh)
Consumption of Standard Coal (tce)Carbon Emissions (tCO2)
25% of construction progress21,959.4542,141,305.118647,744,798.3001,645,271,788.000
50% of construction progress43,918.9084,282,610.2371,295,489,597.0003,290,543,575.000
75% of construction progress65,878.3616,423,915.3551,943,234,395.0004,935,815,363.000
100% of construction progress 87,837.8158,565,220.4732,590,979,193.0006,581,087,151.000
Disclaimer/Publisher’s Note: The statements, opinions and data contained in all publications are solely those of the individual author(s) and contributor(s) and not of MDPI and/or the editor(s). MDPI and/or the editor(s) disclaim responsibility for any injury to people or property resulting from any ideas, methods, instructions or products referred to in the content.

