Article

Application of Multi-Criteria Decision-Making (MCDM) to Select the Most Sustainable Power-Generating Technology

Construction Engineering and Management, Department of Civil and Environmental Engineering, University of Alberta, Edmonton, AB T6G 1H9, Canada
*
Author to whom correspondence should be addressed.
Sustainability 2024, 16(8), 3287; https://doi.org/10.3390/su16083287
Submission received: 28 January 2024 / Revised: 30 March 2024 / Accepted: 8 April 2024 / Published: 15 April 2024
(This article belongs to the Section Sustainable Management)

Abstract

:
In response to the growing importance of sustainability and regulatory pressures, companies are increasingly engaging in sustainable projects to mitigate environmental and social harm. Therefore, it is crucial to incorporate sustainability considerations during selecting construction projects in the feasibility phase. This study aims to identify a comprehensive set of sustainability criteria and sub-criteria to help the owners of power-generating plants to select the most sustainable technology for their new projects. Sixteen criteria are identified and categorized under the pillars of sustainability: economic, social, and environmental, plus the technical category. To illustrate practical application, a case study demonstrates the use of these essential sustainability criteria through a hybrid multi-criteria decision-making (MCDM) model for power-generating technology ranking. The results suggest that when stakeholders’ perspectives are weighted approximately equally, considering all sustainability pillars, natural gas with carbon capture is favored for sustainability. A three-scenario sensitivity analysis was performed involving expert opinions from one of the largest power-generating companies in Canada. This integrated generic model can be utilized by industry experts to apply multi-dimensional rational decision-making techniques to solve the complex problem of selecting the most sustainable alternative in construction projects.

1. Introduction

Due to population growth, resource scarcity, and climate change, sustainability is seen as a solution to numerous environmental and social problems in the world, and today’s society faces a significant challenge in this area [1]. The United Nations’ Brundtland Commissions report, written in 1987, defined sustainable development as meeting the needs of the present without compromising the needs of future generations. This interest in sustainability has been reflected in economic strategies like the triple bottom line, a concept introduced less than a decade later, which places social and environmental concerns alongside economic goals as part of sustainable business practices [2].
Within construction management, sustainability similarly seeks to address environmental and social issues while preserving economic prosperity [3]. Global pressures, reflected in increased regulations, urge companies to integrate sustainability into their project decision-making processes, as exemplified by Canada’s 2030 emission reduction plan [1,4]. This plan outlines a sector-by-sector approach to reduce emissions by 40% from 2005 levels by 2030, with a net-zero emissions target for 2050. Governments, businesses, non-profit organizations, and communities in Canada collaborate to achieve these objectives, underscoring sustainability’s importance in the construction industry, where it is viewed as a tripartite approach encompassing the environment, society, and the economy [5].
Implementing sustainable development starts with selecting a sustainable project portfolio (project portfolio selection—PPS) [6,7]. Effective PPS requires choosing projects that maximize the portfolio’s value while working within constraints such as resources, workforce, and time [8,9]. Its key significance is assigning limited resources to competing projects that will achieve corporate goals and objectives [10]. PPS is one of the most efficient and constant activities in each organization as modern societies require identifying various construction projects to improve their residents’ convenience [11].
It has become increasingly important to promote sustainability in any business sector and at every level of business and investment, especially in the construction industry. The construction industry’s role in societal and economic development is undeniable. Economics-wise, it contributes 13% to the world’s gross domestic product (GDP) [12]. A total of USD 10 trillion of the world’s GDP was generated by construction projects in 2018 and this is projected to be USD 14 trillion by 2025 [13]. The global construction industry’s revenue is projected to experience consistent growth in the coming years. In 2023, the global construction market reached a value of USD 11.9 trillion. Projections indicate that it will rise to USD 17.2 trillion by 2030, with a Compound Annual Growth Rate (CAGR) of 5.4% from 2024 to 2030 [14]. Moreover, employment-wise, the industry supports around 7% of the global workforce [12].
However, despite its economic significance, the construction industry faces criticism for its environmental and social impact, consuming substantial resources, emitting GHG, and lacking employee-friendly practices [3]. This is particularly relevant in the industrial sector, where projects such as power-generating plants have substantial environmental and social implications. Construction projects consume 60% of raw material, 36% of global energy, and 12% of water and produce more than 37% of energy-related carbon dioxide (CO2) and greenhouse gas (GHG) emissions [5,15,16]. Since the construction industry has huge economic significance with a strong environmental and social impact as well, the importance of this industry based on sustainability elements cannot be ignored [1].
Given that numerous industrial projects, while crucial for economic development, often result in adverse long-term environmental and social consequences [16], this study specifically targets the industrial sector within the construction industry, particularly focusing on power-generating plants. The development of industrial projects is inevitable due to their significance in the global energy supply. They accounted for 32.9% of global energy needs in 2015; however, these projects also significantly contribute to issues like global warming and toxic gas emissions [17,18,19]. Also, power-generating plants are of immense importance for the economy, society, and the environment. They provide essential electricity for industries, businesses, and homes, supporting economic growth, job creation, and investments. Socially, these plants ensure access to vital services like lighting, heating, communication, and healthcare, improving living standards and promoting education. Environmentally, the choice of energy sources and technologies in these plants impacts air quality and climate change, with cleaner and renewable options reducing pollution and GHG emissions. With increasing energy demand, a global shift to sustainable sources and the need for energy access, developing such plants is unavoidable. They play a pivotal role in economic productivity, energy transition, social well-being, and environmental preservation [20,21,22].
On the other side, many organizations are project-oriented these days, but they often deal with resource constraints (workforce, time, etc.) that require them to carefully select projects. Choosing the wrong project can lead to resource waste, potential legal issues, lost profits, and harm to reputation. Moreover, within growing environmental and social global challenges, organizations recognize the need for change. Picking the right projects is a way to drive change effectively. The initial step to selecting the right projects is identifying significant primary and secondary evaluation criteria. Although some scholars recognize the significance of incorporating sustainability criteria into the decision-making process, this remains a complex and unresolved challenge, because sustainable decision-making is inherently complex due to the involvement of social, economic, and environmental factors. Therefore, it demands further attention and exploration.
The construction project life cycle includes various phases: feasibility phase, design and engineering phase, procurement phase, construction phase, closing phase, operation and maintenance phase [23]. Although each of them plays a distinct role, this research, with a specific focus on the feasibility phase, aims to identify effective criteria for integration into the project selection process. This targeted approach enables decision-makers to make strategic and proactive choices with a sustainability focus.
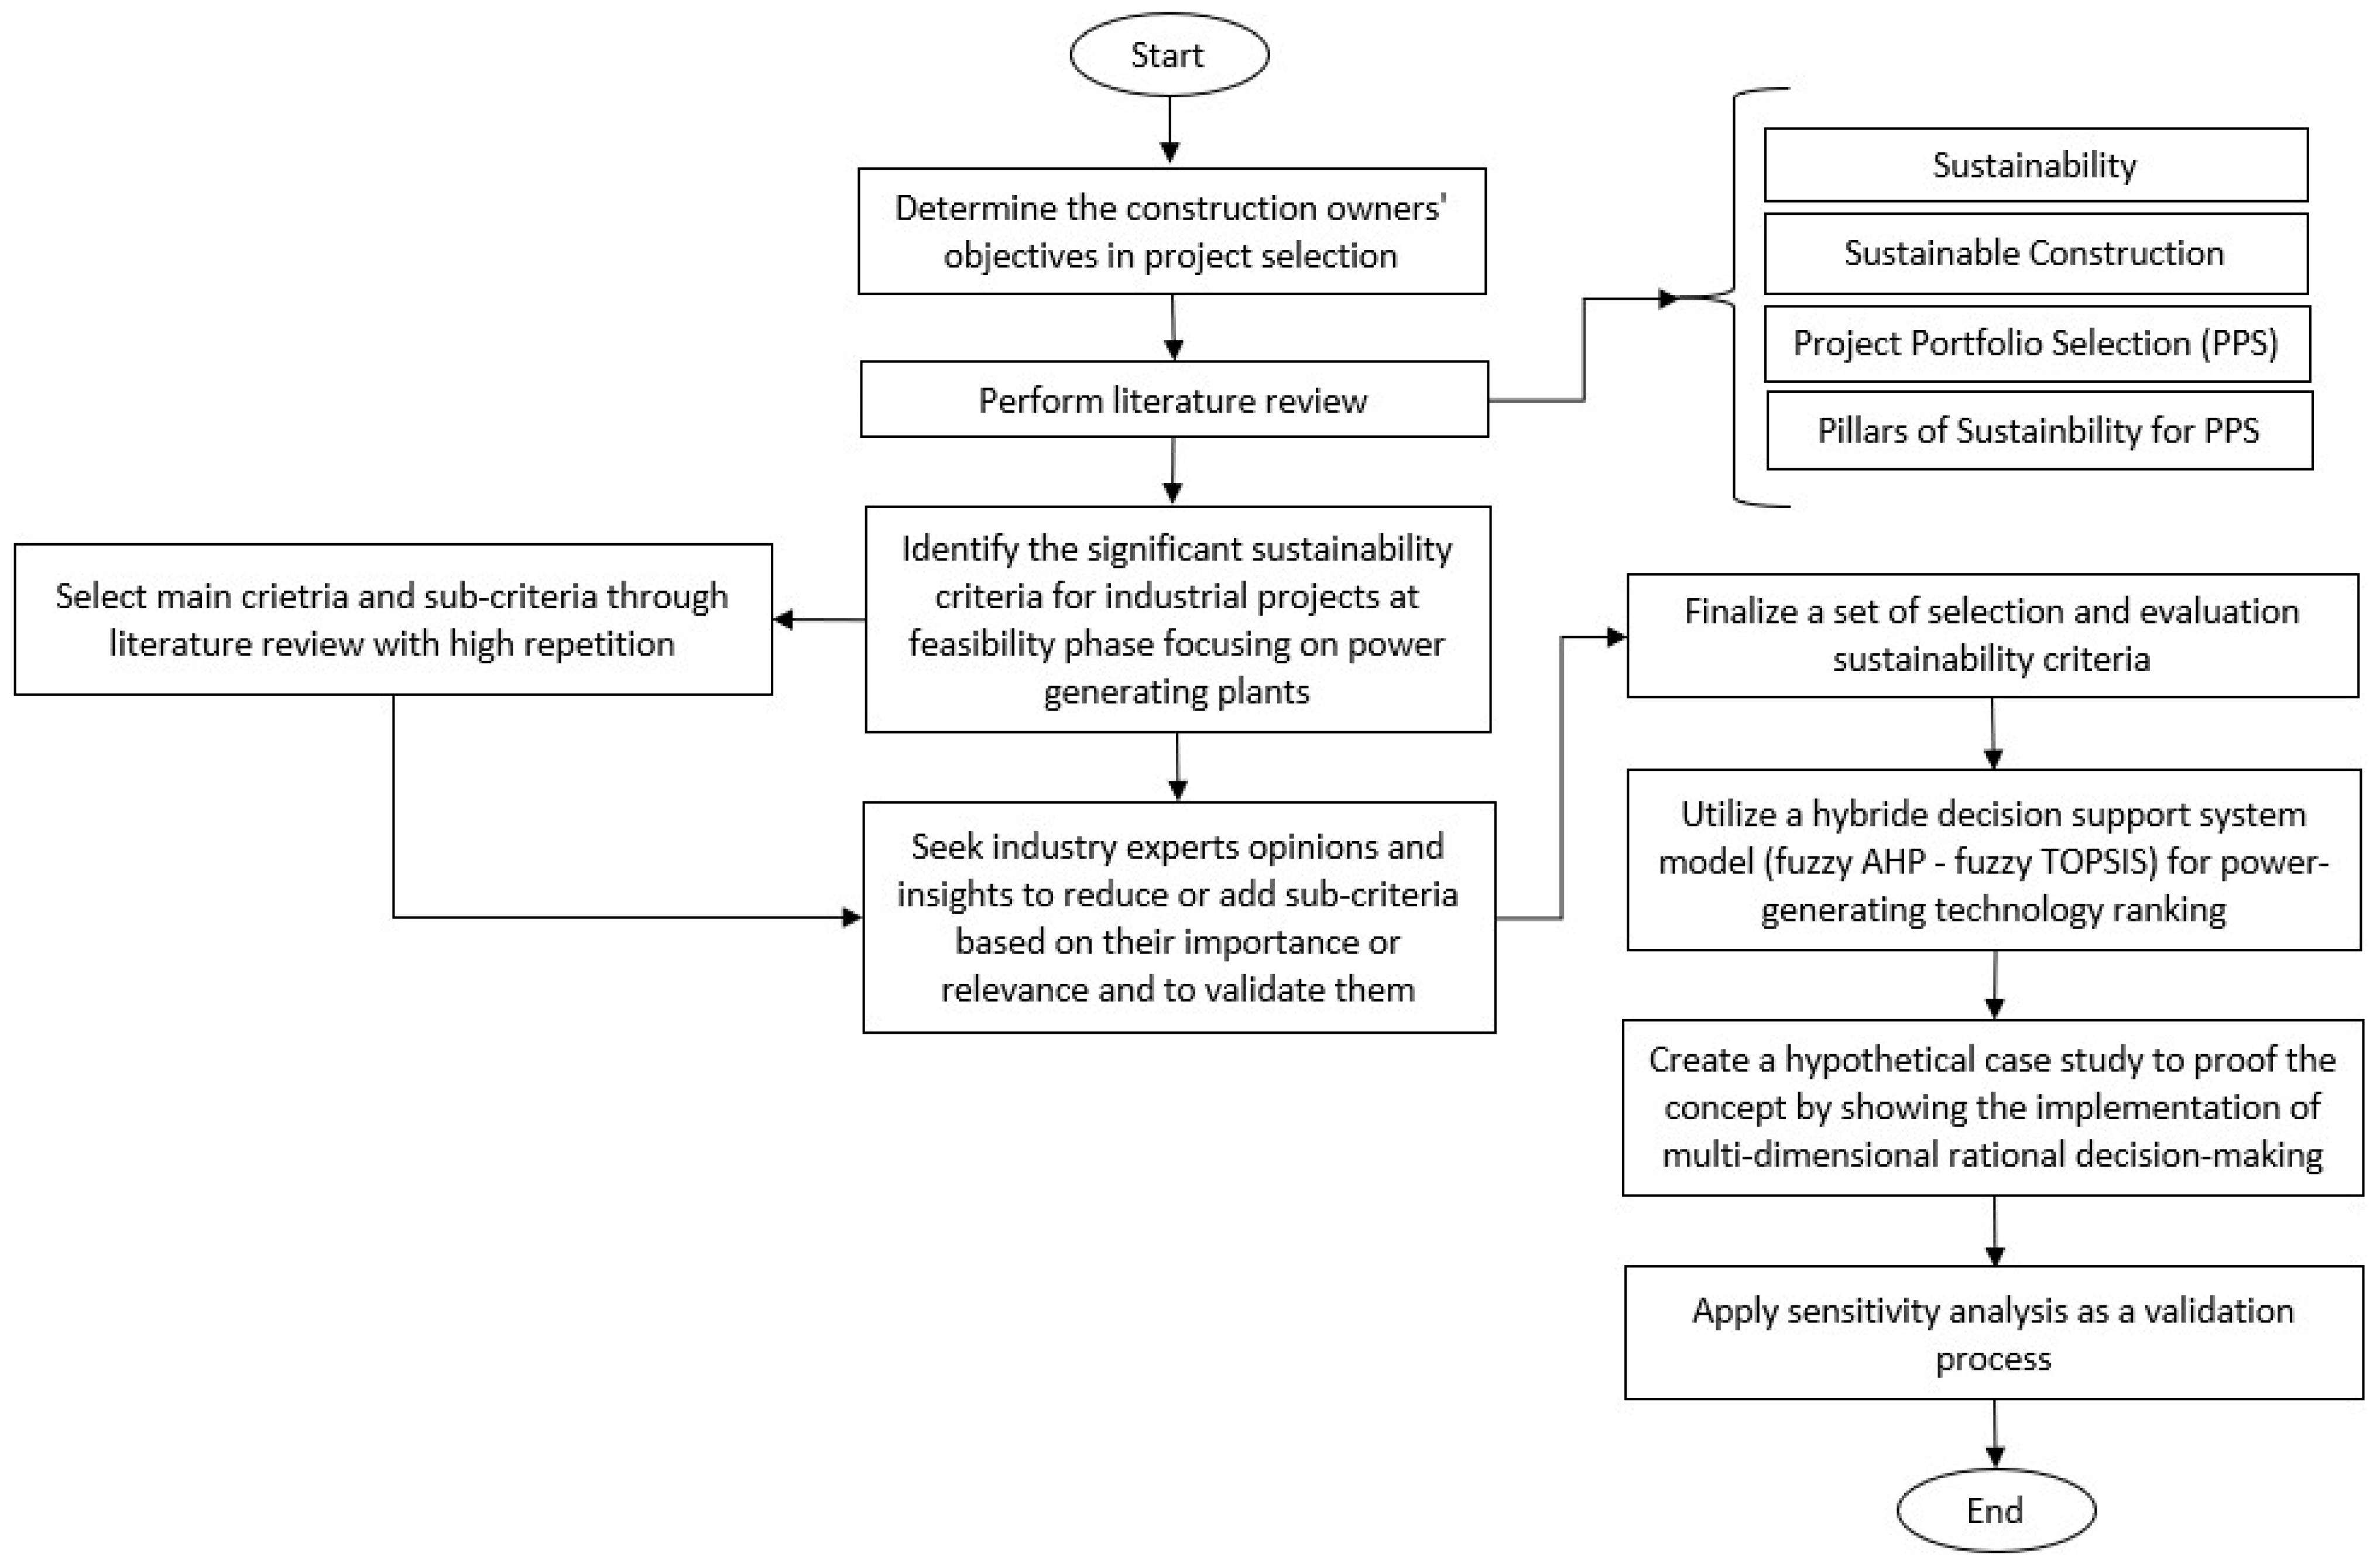
Existing research primarily emphasizes financial metrics in PPS, with limited attention to criteria across all pillars of sustainability. Moreover, the meetings held by the authors with industry experts in Canada reveal that project selection is characterized by an unstructured nature, with a primary emphasis on economic aspects. Thus, there is a lack of a comprehensive set of sustainability criteria for industrial projects, particularly power-generating plants in Canada during the feasibility phase; and a clear need for a more structured approach to sustainable decision-making in PPS. Given the focus of this research on power-generating plants, it is essential to emphasize the initial step of selecting the most sustainable power-generating technology before getting onto the development of a sustainable PPS. Thus, this study aims to identify the sustainability criteria and sub-criteria necessary for selecting the most sustainable power-generating technology, by drawing insights from existing literature reviews and input from industry experts (a mixed-methods approach). First, it utilizes a literature review to establish primary and sub-criteria for sustainability pillars, which is subsequently validated and enhanced through insights from industry experts.
This paper introduces a novel approach to the selection of power-generating technology by considering the three pillars of sustainability (economic, social, and environmental) along with a technical category. The technical category is included because construction projects have to be technically feasible. The current practices focus only on cost–benefit analysis, which is not acceptable in the era of decarbonization and there is extreme pressure from the general public to reduce GHG emissions for the power-generating industry. This holistic approach provides a unique practical framework for sustainable decision-making that has not been previously explored in existing literature and real life. This proposed approach can be easily utilized by decision-makers in the industry to make sure they pay attention to social and environmental factors, not only economics, prior to selecting the power-generating techniques. It comprehensively improves current practices.
The expected academic contribution of this research is the introduction of an integrated model to apply multi-dimensional rational decision-making techniques to solve complex problems. Systematic integration of a technical category with the commonly used three pillars (economic–social–environmental) is used as a methodical approach for overall sustainability assessment. In this integrated model, we proposed a comprehensive set of sustainability decision-making sub-criteria; this set is obtained through a comprehensive literature review and meeting with industry experts.
The expected industrial contribution of this study is enabling power-plant owners to change their mindset from single-dimensional thinking (money-driven) to multi-dimensional thinking (technical–economic–social–environmental). This model will support the power-generating industry to achieve their sustainability and corporate responsibility goals. The developed model is generic and can be used by any owner. The owner experts can utilize the proposed sub-criteria or replace it with other sub-criteria if needed. The model also allows the experts to reflect their preferences and priorities by assigning different weights to each of the four proposed decision-making categories. It is important to highlight that our industry partners expressed interest in integrating some of these criteria into their future decision-making processes, indicating the practical relevance and potential utility of our approach.
This research comprises nine sections: Section 1 introduces the study; Section 2 and Section 3 provide a thorough literature review emphasizing research gaps; Section 4 details research methods and methodology, while Section 5 presents significant criteria findings from literature and expert discussions; Section 6 discusses the description and application of the hybrid decision support system (DSS); Section 7 and Section 8 illustrate the application of significant sustainability criteria with a hypothetical case study along with sensitivity analysis. Lastly, Section 9 summarizes the study’s findings and outlines limitations with directions for future research.

2. Literature Review

This section of the paper presents a review of the relevant literature on sustainability, sustainable construction, project portfolio selection (PPS), and the selection and evaluation criteria for PPS of construction projects to justify the above-mentioned purpose/aim and discuss the contribution of this research.

2.1. Sustainability

Sustainability has become a significant topic in organizational management discussions [24], indicating that organizations might view sustainability as a strategic imperative throughout the organization; however, achieving sustainable outcomes might not always be possible through project activity alone [5]. According to experts, any human action that affects the environment should consider more than just economic factors [5]. Farrell in 1996 said that the concept of sustainability is complex and involves conflicting values, scientific uncertainties, diverse interest groups, long-term time horizons, and a challenge to established norms and institutions [25].
In the past two decades, research has been conducted on the integration of sustainability into project management, categorized into themes such as motivations, stakeholder orientation, organizational context, benefits, barriers, and risks [16]. While some organizations adopt sustainable construction practices without external pressure, the government and society play important roles as facilitators and affected stakeholders in construction projects. Therefore, to fully integrate sustainability into organizations at a strategic level and overcome obstacles, it is important to consider the motivations of various stakeholders, both inside and outside the organization. This goes beyond just focusing on technical and economic aspects [5].
The application of sustainability is challenging due to the range of opinions regarding its meaning. This creates difficulties for organizations that need to evaluate project proposals and select those that align with their strategic goals, while also considering sustainability issues. Decision-makers are being asked to focus on a goal that is highly debated and not well-defined [25]. When making economic decisions from a sustainability perspective, social and environmental factors should also be considered. As a result, incorporating these factors into sustainability can be an effective tool for economic decision-making [24].

2.2. Sustainable Construction

The sustainable construction concept has become increasingly significant since the First International Conference on Sustainable Construction took place in Tampa, FL, USA in 1994 [5]. It has become increasingly crucial in the construction industry as a means of mitigating the industry’s adverse impacts on the natural environment, including global warming, environmental degradation, and resource depletion [26].
Sustainable construction practices involve methods that aim to minimize environmental harm by reducing waste and promoting reuse of materials (waste management). These practices also seek to benefit society (e.g., job creation due to recycling and repurposing activities, health and well-being of the community due to reduces health hazards associated with untreated construction waste) and be economically profitable for companies. However, conflicts may arise in the construction industry between long-term environmental goals (e.g., minimizing pollution, reducing the carbon footprint) and short-term economic objectives (e.g., upfront costs, lack of immediate financial return) [27]. Construction projects must incorporate all sustainability pillars, but the construction industry faces various barriers to adopting sustainable practices, such as technological complexity, knowledge gaps, high initial costs, and adverse environmental conditions. This may explain why sustainability adoption rates in the construction industry differ across countries [28,29].
A structured workflow that integrates sustainability-focused components must be established to achieve sustainable construction outcomes. This will help to pave the way for future project processes and practices that consider and integrate a sustainable framework [5]. The 2019 report titled “The Future is Now: Science for Achieving Sustainable Development” shows that the current development model is fundamentally unsustainable (e.g., continually increasing waste-generating, increasing in greenhouse gas emissions and industrial water withdrawals, etc.), which puts the present sustainability achievements at risk due to growing social inequalities (e.g., human well-being—world poverty due to not having access to safely managed drinking water and energy) and natural resource depletion. The report suggests that achieving a more sustainable and optimistic future is possible through significant changes in sustainability-focused development policies, incentives, and actions [30].
To conduct sustainable construction projects successfully, it is crucial to understand the principles of sustainable development and the challenges and barriers, as well as the drivers and goals associated with them. For instance, a variety of challenges and barriers impact sustainability in construction in developing countries, including insufficient knowledge about sustainability, inadequate research on improving sustainability, technological shortcomings, cultural factors, limited awareness of sustainable practices, lack of top management support, and inadequate legal enforcement by the government [31,32,33].
Sustainability drivers and goals can sometimes be intertwined and difficult to differentiate [34]. The drivers are the factors that motivate companies to implement sustainability into construction projects, whereas goals are the outcomes that firms aim to achieve through the incorporation of sustainability [35]. Several drivers of sustainability in the construction industry include implementing ISO 14000 certification [36], enhancing employee comfort and welfare, improving energy efficiency, exploring new marketing opportunities, strengthening partnerships, promoting business innovation, developing organizational capabilities, and fostering technology orientation, the behavior of individual team members, and their interpersonal relationships [5,37,38,39,40,41].

2.3. Project Portfolio Selection (PPS)

Because of resource constraints like workforce, time, and other factors, construction project owners have to make strategic selections about which projects to pursue among all the possible project alternatives [3,9]. This selection process is typically called project portfolio selection (PPS). The main objective of PPS is to select an appropriate set of projects (an optimal portfolio) from several competing projects and develop a proper implementation program that simultaneously achieves the company’s strategic objectives by considering the process’s constraints [42]. PPS is therefore an important method of multi-project management designed to enable organizations to reach their strategic goals.
PPS is a challenging strategic decision-making process and problem that has gained significant attention in both practical and academic scopes [43,44,45,46]. This is because it represents a crucial and ongoing activity within organizations, particularly in modern societies where the identification of diverse construction projects is vital for enhancing peoples’ convenience [11]. The repercussions of choosing the wrong projects can lead to resource wastage and missed opportunities for reaping benefits [47]. The complexity of project selection arises from the competing interests of multiple goals, such as organizational objectives and priorities, as well as the considerations of numerous attributes like financial benefits, intangible benefits, resource availability, and project portfolio risk levels [48].
In general, there are two main prevalent alternative approaches for PPS which are project evaluation (first approach) and portfolio evaluation (second approach). Almost all methods in the literature use these two approaches to determine the optimal portfolio. The first approach specializes in the assessment of individual projects while the second approach targets the assessment of feasible portfolios. In the first approach, an optimal or best portfolio is determined by individually evaluating projects based on criteria and subsequently creating the ideal portfolio. Conversely, the second approach involves obtaining an optimal portfolio by generating all possible portfolios, assessing them, and selecting the most suitable option. Importantly, no assumptions are made regarding the preferences of the decision-makers in identifying the most appropriate, efficient, or feasible portfolios [49].

2.4. Pillars of Sustainbility for PPS

Various approaches have been used to determine selection criteria for project selection in research. Early studies focused on financial criteria like the net present value (NPV), return on investment (ROI), and cash flow, while some later studies emphasized non-financial criteria such as social benefits, technical aspects, and environmental impacts in light of the growing importance of sustainability. The papers that are in line with this research are summarized in below Table 1 as follows:

3. Main Findings and Research Gap

Since this research focuses on power-generating plants, it is important to note that it is essential to first start with selecting the most sustainable power-generating technology before we can build a sustainable PPS. Therefore, to select the most sustainable power-generating technology, this study is going to focus on finding the sustainability criteria and sub-criteria based on existing literature reviews and industry experts’ opinions.
Based on the literature review, current research tends to focus less on comprehensive sustainability in construction and more on financial factors that contribute to project success. Furthermore, the research on sustainable construction and project selection covers various areas and themes. As shown in Table 1, some studies focus on one or two aspects of sustainability and others address all pillars of sustainability, but the criteria are not specified under each category/pillar clearly (e.g., technical, economic, social, environmental) except two articles. This means that the researchers did not identify these criteria categories clearly in their research. Moreover, while sustainability criteria have received some consideration across different stages of the construction lifecycle, including design, operation, and maintenance (refer to Table 1), there is still a lack of a comprehensive set of sustainability criteria for industrial projects, particularly power-generating plants in Canada, during the feasibility phase. The majority of these studies in Table 1 did not indicate the specific project phase for which the criteria are applicable. It is important to note that selection and evaluation criteria may vary depending on the project phase, as they are highly sensitive and dependent on the specific phase of the project.
Furthermore, meetings with industry experts confirmed that project selection processes are often unstructured, emphasizing economic factors with some consideration for the environment only. Moreover, PPS based on sustainability pillars for industrial projects in the context of power-generating plants is not only a research problem but also a critical issue within the industry. Many large-scale projects, worth billions of dollars, are often developed without adequate consideration for social and environmental factors in the feasibility phase as per our discussions with the industry experts. Therefore, it is essential to integrate technical, economic, social, and environmental considerations comprehensively.
To address these gaps and challenges, this paper proposes a novel approach with a hybrid model that embraces multi-dimensional thinking in the selection of power-generating technology. By integrating the three pillars of sustainability (economic, social, and environmental) alongside a technical category, this approach offers a comprehensive decision-making framework. It not only provides valuable insights for researchers, practitioners, and policymakers involved in sustainable project selection but also serves as a practical and user-friendly tool to drive meaningful change within the industry.

4. Methodology

Various methodologies exist to identify significant sustainability criteria. In this research, a multi-step approach is utilized to determine the most important criteria describing sustainable development. The chosen research methodology to determine significant sustainability criteria for PPS of power-generating plants during the feasibility phase combines an analysis of the scientific literature with insights and opinions from industry experts. Therefore, industry experts were engaged to validate and finalize the identified criteria and sub-criteria derived from the literature review, ensuring their relevance and significance in the context of PPS for power-generating plants during the feasibility phase. They had the opportunity to add or remove sub-criteria based on their expertise. This process ensured that the final set of criteria was comprehensive and representative of industry standards. Thus, based on their input, the final set of selection and evaluation criteria was established. The last phase entails developing a hypothetical case study and applying a hybrid DSS model (Fuzzy AHP—Fuzzy TOPSIS) to prioritize the projects based on the established evaluation criteria. This demonstration showcases the practical application of the identified significant criteria. The case study is just a proof of concept to show how multi-dimensional rational decision-making can be implemented in power-generating plants which has never been carried out before. Figure 1 provides a visual representation of the research framework:

5. Significant Sustainability Evaluation Criteria

5.1. Identifying a Set of Significant Sustainability Evaluation Criteria through Literature Review

The sustainability selection and evaluation criteria used to assess the technical, economic, social, and environmental pillars of sustainable project selection can vary based on the type, nature, location, and phase of the construction projects. Different sets of evaluation criteria were observed from the literature review which was mainly based on user preferences. In this study, the primary and secondary criteria with the highest frequency of occurrence in the literature were initially selected as shown below in Table 2.
The main criteria and sub-criteria are summarized in Table 2 based on our overall findings of the literature review only and the frequency percentage is calculated based on a total of 36 articles in PPS (frequency % = number of sources × 100/total number of articles). The primary criteria identified are categorized into four groups: technical, economic, social, and environmental. Through a literature review, a total of 17 sub-criteria have been identified. Among these, the technical, economic, social, and environmental groups have two, five, four, and six sub-criteria, respectively. It is important to note that the naming of sub-criteria may differ from those found in the literature review, as some adjustments are made to better categorize them and convey their overall meaning. Also, it should be noted that this list may not fit every situation, and users have the flexibility to adjust it based on factors like location, project phase, nature of the construction, and personal preferences.
Table 2 highlights the criteria with the highest frequencies, underscoring their significance in project portfolio selection (PPS). The criteria with a frequency percentage exceeding 30% across 36 scholarly articles are as follows: In the technical category, “Previous Experiences and Skills” emerge as notably significant. Within the economic category, both “ROI” and “ROR” stand out prominently. In the social category, the criterion of “Potential for Health and Safety” is particularly noteworthy. Lastly, in the environmental aspect, “GHG emissions” and “Energy Consumption” are highlighted as important factors.

5.2. Validating and Finalizing Significant Sustainability Evaluation Criteria through Industry Experts’ Opinions

Table 2 was presented to a panel of industry experts from one of the largest owners of power-generation plants in Canada. They have more than 20 years of experience in power-plant projects and were asked to validate and refine Table 2 based on their experience. The experts provided valuable contributions by removing some criteria and introducing new criteria based on their assessment of significance, importance, and relevancy, including validating the type, definition, and measurement method for each sub-criterion. Table 3 shows the conclusive list of main criteria and sub-criteria, incorporating the experts’ comments and insights. It consists of 16 sub-criteria, with each primary criterion (technical, economic, social, and environmental) having four, five, three, and four sub-criteria, respectively.
These defined main criteria and sub-criteria will be applied in a hypothetical case study (Section 7) to demonstrate their practical utility.

6. Hybrid DSS Model

This paper utilizes the hybrid DSS model developed by Alam Bhuiyan and Hammad [62] with minor modifications in a hypothetical case study for illustrative purposes and to validate the findings of this paper. The hybrid model combines two multi-criteria decision-making (MCDM) methods, including FAHP (fuzzy analytic hierarchy process), fuzzy TOPSIS (technique for order performance by similarity to an ideal solution), within a fuzzy environment. In this model, the criteria’s weights are determined employing FAHP, utilizing a trapezoidal membership function. Subsequently, fuzzy TOPSIS methodology is employed to rank the alternatives, incorporating the weights derived from the FAHP analysis.

6.1. Techniques Description

AHP and TOPSIS stand out as the prevailing MCDM techniques within the construction industry for complex decision issues (e.g., resource allocation) and ranking challenges [82,83,84,85]. AHP aims to determine the weights of criteria and priorities of alternatives while TOPSIS aims to choose the alternatives closest to the positive ideal solution (PIS) and furthest away from the negative ideal solution (NIS). Both methods use fuzzy numbers to accommodate uncertainties. Their efficiency is further enhanced when integrated with fuzzy theory, which serves to replace crisp values with fuzzy sets [84,86,87,88].
FAHP appears as a prominent tool for criteria weighting in MCDM, thus serving as essential in our research to assign weights to the sixteen chosen criteria. While the triangular membership function is commonly employed in FAHP for its simplicity, the trapezoidal function is favored for its superior ability to manage uncertainties and imprecision. Hence, the trapezoidal membership function takes priority in our research. For the ranking of alternatives, fuzzy TOPSIS is utilized as the preferred choice due to its widespread acceptance, simplicity, and utility in both industry and academia, making it a reliable tool for decision-making purposes.
Fuzzy set theory introduces a level of ambiguity that adeptly and effectively mirrors human thought processes and handles uncertainties/imprecision/information gaps [84,86,87,88]. It improves decision-making comprehensiveness and rationality. The fuzzy logic used in FAHP and fuzzy TOPSIS methods with trapezoidal fuzzy numbers and membership functions is a type of multi-valued logic that deals with approximate reasoning rather than precision. It is closer to reality and allows for reasoning with linguistic terms and handling uncertainty by representing vague or imprecise information. Therefore, it provides a powerful framework for decision-making in situations where traditional binary logic may be inadequate due to uncertainty and vagueness in the available information.
Fuzzy logic employs fuzzy sets with elements that have degrees of membership rather than strictly being members or non-members. The rules used in fuzzy logic include the following: fuzzy inference rules that define how fuzzy input variables are planned as fuzzy output variables using linguistic terms and membership functions; and membership function rules which determine the degree of membership of elements in fuzzy sets based on their values with respect to defined linguistic terms. The characteristics of fuzzy logic include flexibility, linguistic representation, and approximate reasoning. It enables flexible modeling of real-world systems and linguistic representation of variables, facilitating decision-making with uncertain or incomplete information.
The approach chosen in our study was based on the need to incorporate both qualitative and quantitative inputs, including user preferences from industry experts. The integration of FAHP-fuzzy TOPSIS offers a more interpretable, domain-aware, and robust approach for sustainability assessment in power-generating plants. This is particularly beneficial when transparency in decision-making, expert participation, and uncertainty handling are crucial considerations. In scenarios where user preferences and qualitative inputs play a significant role, such as in our study, it is essential to use an approach that can effectively integrate these aspects into the decision-making process.

6.2. Model and Software Description and Modification

The software utilized in this research was developed within our research group at the University of Alberta. This software serves as an interface for conducting mathematical calculations based on FAHP and fuzzy TOPSIS techniques, which are widely recognized decision-making methods. This software has been rigorously tested and validated. A detailed description of its development, verification, and validation process can be found in the publication in the journal Sustainability [62].
The software is a desktop application designed to operate on the Windows platform. It is developed using the Microsoft dot-net framework and coded in C sharp within a Windows form application. The algorithm is based on the fuzzy TOPSIS technique for ranking alternatives, and a graphical user interface was created using the Windows form application. Microsoft Management Visual Studio version 16.11 was utilized for database management, with SQL Server Management Studio version 20.1 and the Windows database server employed for this purpose.
Users interact with the software through a user-friendly interface, where they can create new projects or retrieve data from previous projects. Inputs include evaluation criteria, preferences for alternatives, and stakeholders’ opinions, which are assigned as percentages using text fields and dropdown menu options. The software processes both qualitative and quantitative inputs, ultimately providing the ranking of alternatives as the output. This software was developed to facilitate decision-making processes in the context of project selection, offering users a comprehensive and efficient tool for evaluating and ranking alternatives based on multiple criteria.
The developed model and software underwent minor adjustments to accommodate the number of criteria identified through the literature review and experts’ input in this study. Initially, the model was designed with four main criteria, each having four sub-criteria, totaling 16 sub-criteria. However, in the updated model, while the number of sub-criteria remained at 16, we made slight modifications to address the lack of symmetry among the sub-criteria. For instance, in the earlier model, the “Social” category had four sub-criteria, but in the new model, it consists of three sub-criteria. Similarly, the “Economic” category previously had four sub-criteria but was expanded to include five sub-criteria. These changes were made to ensure consistency, even though the core and fundamental calculation processes remained unchanged. Furthermore, some non-technical adjustments were made to the user interface. An additional input box and a dropdown menu were introduced for the economic section, while one input section was removed from the social aspect.
The modified and employed tool also allows users, particularly experts, to reflect their preferences and allocate different weights to the main criteria and sub-criteria based on their opinions. However, it is important to note that the weights are adjustable by different panels of experts according to their specific contexts and priorities. This flexibility enhances the applicability and robustness of the model, as it accommodates diverse perspectives and ensures that the results are tailored to each user’s unique circumstances.
In the following case study (Section 7), this model and software are used for ranking the power-generating technologies as alternatives to validate the identified criteria and provide proof of the multi-dimensional decision-making concept.

6.3. Model Phases and Processes

The process for ranking alternatives using this model (combined FAHP-fuzzy TOPSIS approach) involves several phases as explained below:
Phase 1: Normalizing Objective Values into Subjective Inputs
In this phase, subjective weights for qualitative criteria are determined by decision-makers. Additionally, subjective weights based on objective values (quantitative criteria) are derived using Shannon’s entropy as a foundation [89,90].
Step 1: To calculate objective weights through the entropy measure, the decision matrix must first be normalized for each criterion (denoted as   C j , j = 1 , 2 n ;   n = number of criteria). This normalization process yields the projection value p i j for each criterion:
p i j = x i j i = 1 m x i j
where m = number of alternatives.
Step 2: After normalizing the decision matrix, the Shannon diversity index is calculated as follows:
H = i = 1 m p i j ln p i j
Step 3: The following equation is utilized to determine the Shannon Equitability Index, or entropy, which measures the evenness of values within specific criteria. This entropy value is represented as e j :
e j = H / ln ( m )
where m = the total number of alternatives considered in the decision-making process.
Step 4: The degree of divergence can now be computed as d j = 1 e j . A higher value of d j signifies a greater degree of divergence. Within the matrix, criteria values with higher degrees of divergence are selected for the range distribution of subjective values.
Phase 2: Fuzzy AHP
In this phase, we employ fuzzy numbers as a pairwise comparison scale to establish the relative priorities of various selection criteria and sub-categories. The calculations involved in the FAHP method are outlined in the following steps [83,91,92]:
Step 1: Generating a Comparison Matrix
We define the details of pairwise comparison criteria in Table 4, and the formula for pairwise comparisons is as follows:
a i j = w i w j ,
where i , j = 1 , 2 , 3 , n , n represents the number of criteria being compared, w i is the weight for criterion i , and a i j is the ratio of the weights of criteria i and j .
Step 2: Normalizing the Matrix
After determining the comparison values in Table 4, the next step is to normalize the matrix. This is achieved by dividing each cell by the sum of the column values:
x i j = a i j a i j
Step 3: Determining Criteria Weightage
Criteria weightage is calculated as the average weightage of each row:
a ~ i j = 1 n x i j
Step 4: Checking for Consistency
Saaty introduced a set of values for comparing the consistency index (CI) with a random generator (RI) value, which varies with the matrix order n. The following equation is used to calculate the eigenvector ( w c r i i ) :
w c r i i = 1 n a ~ i j ,   i
The λ (lambda) value is then determined, and after obtaining the maximum lambda value, the consistency index (CI) can be assessed:
λ m a k s = 1 n [ 1 w c r i i w c r i i ×   w i ]
CI = λ m a k s n n 1
The CI is acceptable when it is smaller than 10% (0.1), indicating tolerance for inconsistency in each opinion.
Step 5: Fuzzification
The given weights are fuzzified based on Table 5, as provided below:
Step 6: Calculating Fuzzified Normalized Weight and Global Ranking
Finally, the normalized fuzzy weight is calculated as
w f n i = ( l j , m j , n j , p j ) / 4 ;   i , j = 1 , 2 , 3   m   ( number   of   criteria ) ,
where,
l i = ( l i 1 x l i 2 x l i 3 x . . l i n ) 1 / n ,
m i = ( m i 1 x m i 2 x m i 3 x . . m i n ) 1 / n ,
n i = ( n i 1 x n i 2 x n i 3 x . . n i n ) 1 / n ,
p i = ( p i 1 x p i 2 x p i 3 x . . p i n ) 1 / n ;
l j = l i x ( p i ) ,   m j = m i x ( n i ) ,   n j = n i x ( m i ) ,   p j = p i x l i
Phase 3: Decision Matrix
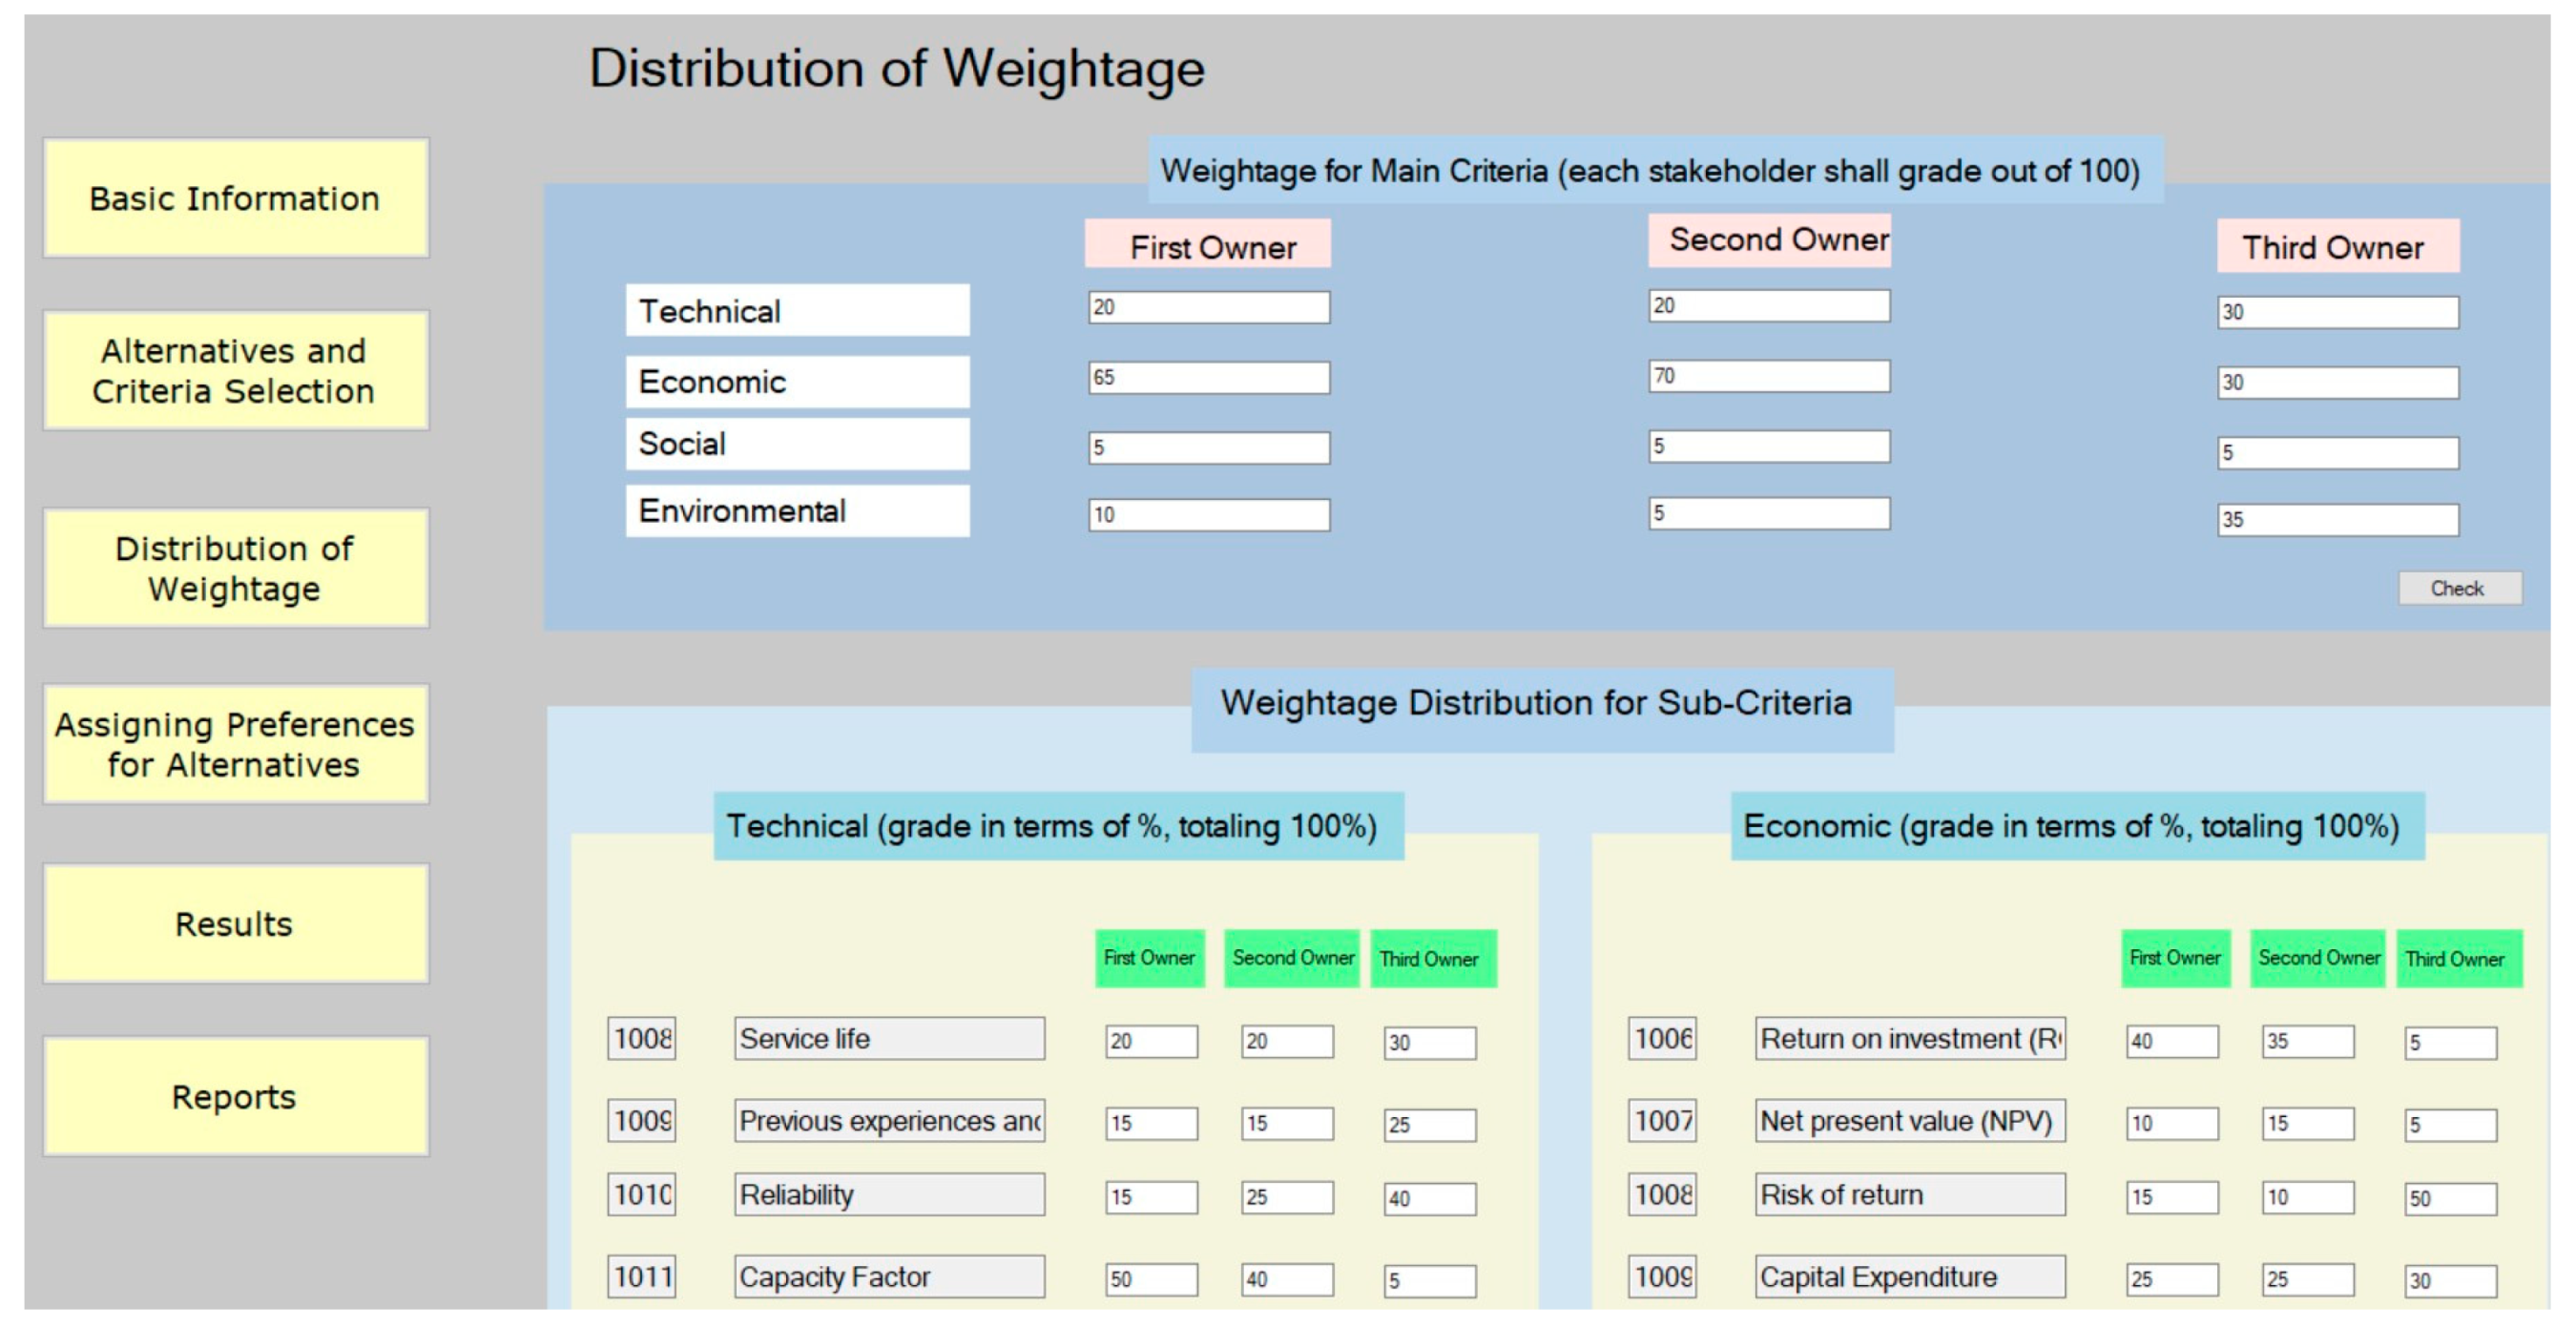
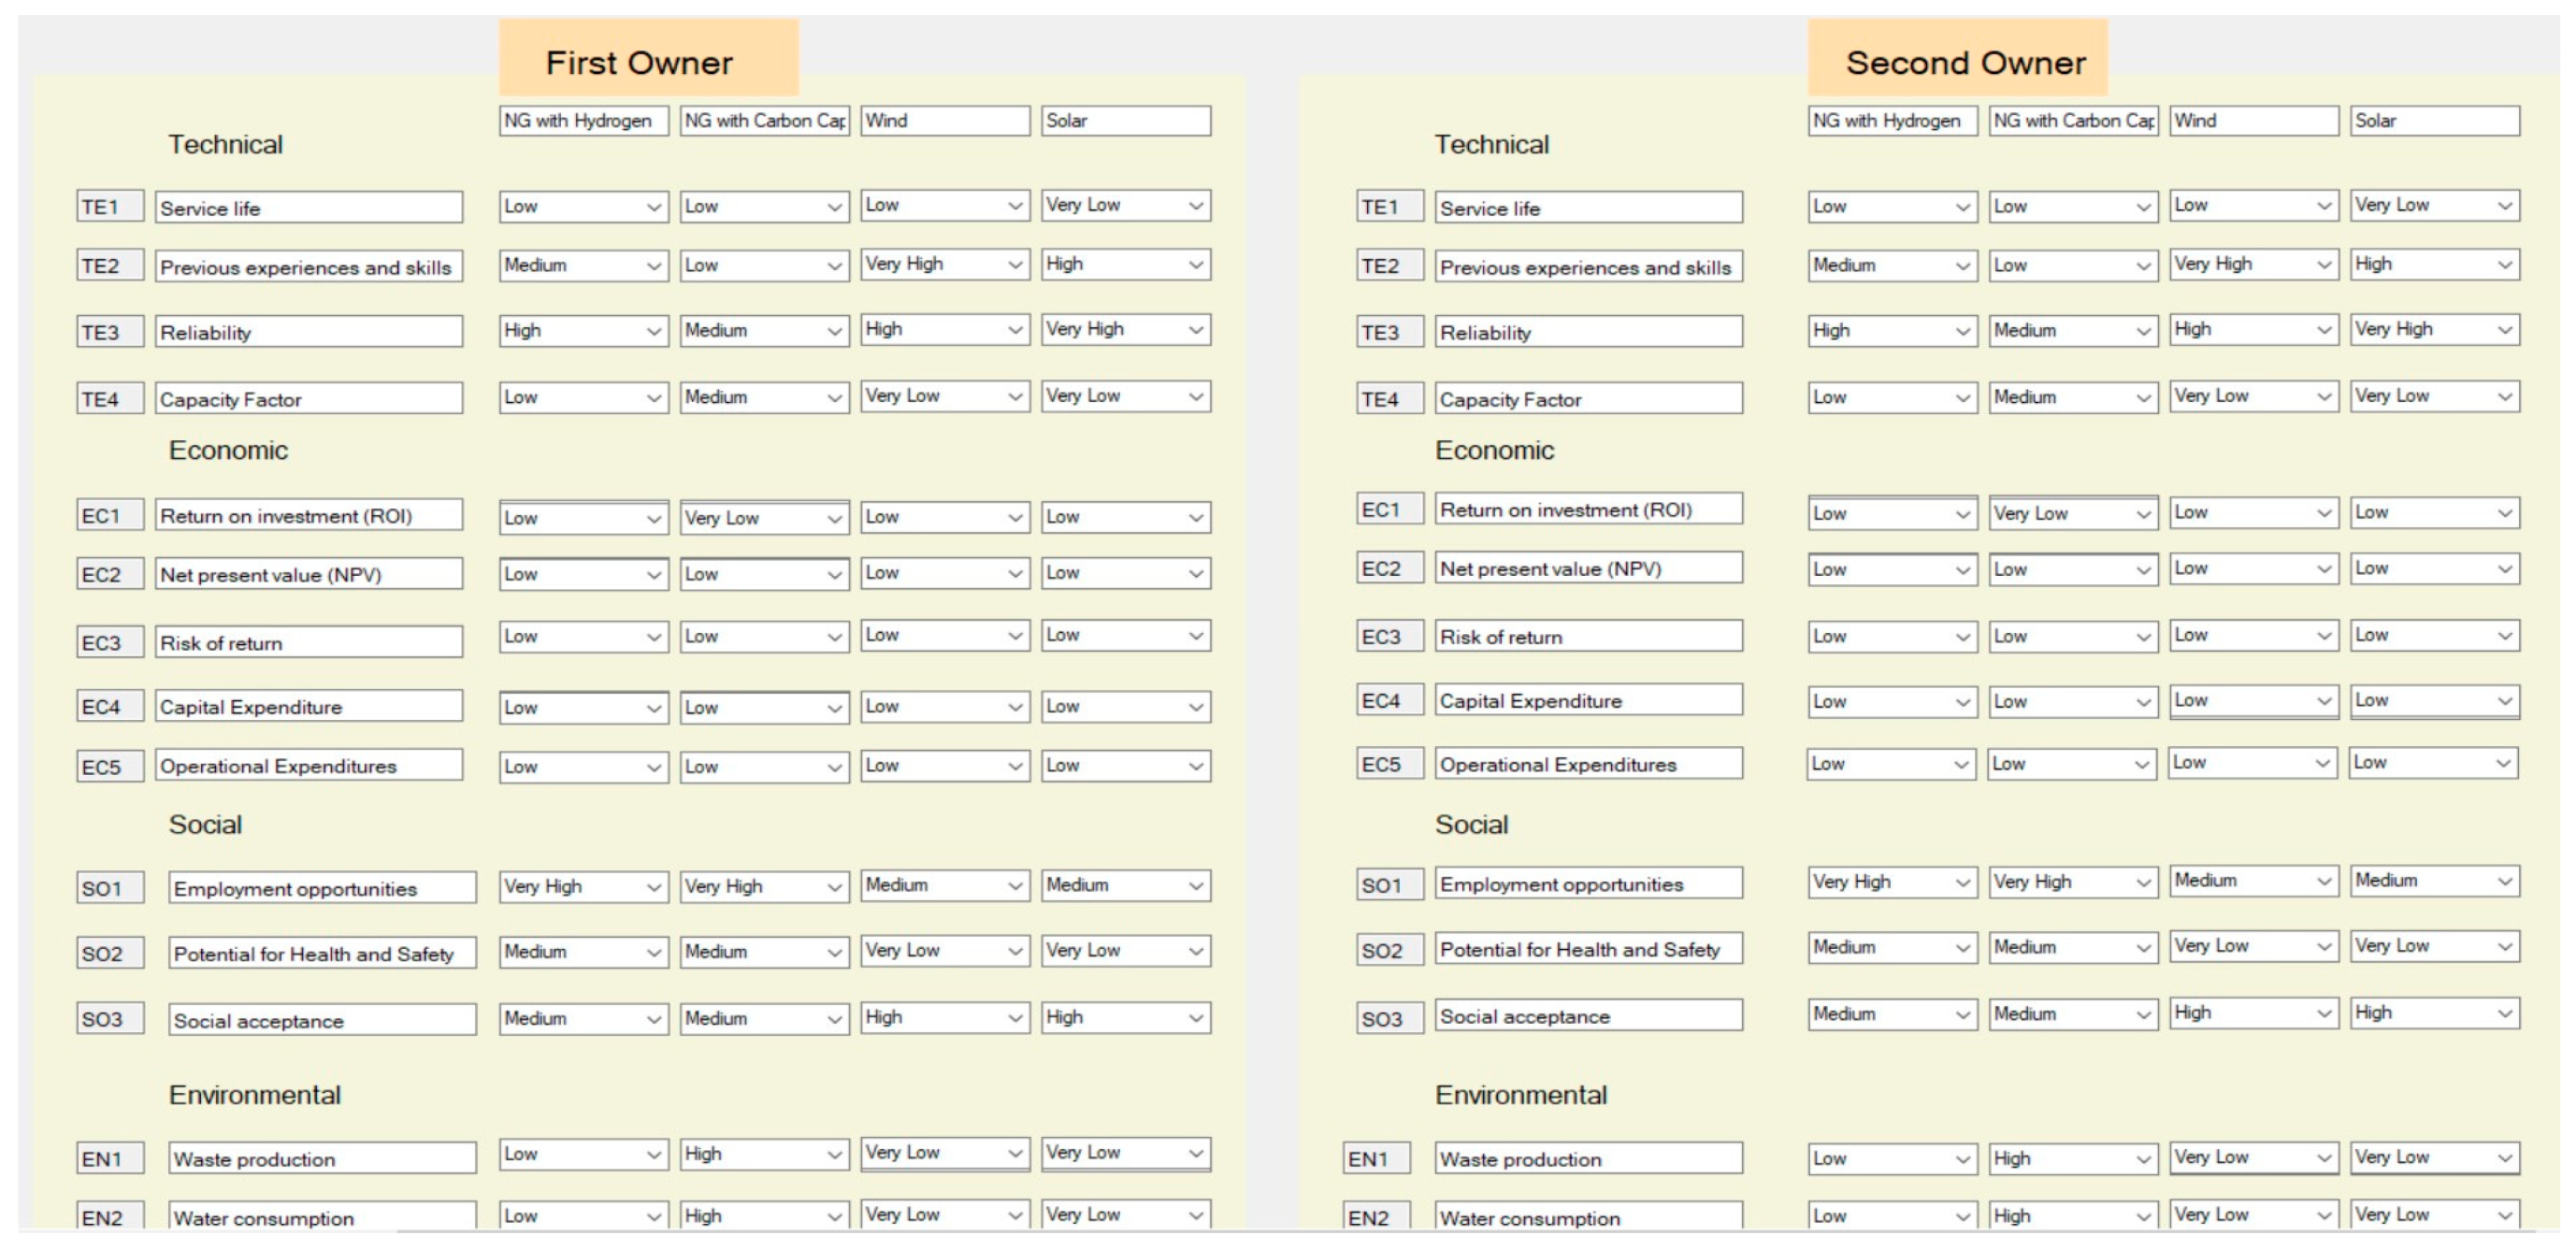
In addition to fuzzy AHP for criteria weightage calculations, this model involves assigning percentages to reflect users’ preferences for various options. It offers a simple and convenient way for users to allocate importance to different evaluation criteria. An interface screenshot illustrating this process is provided in Figure 2.
This process involves two steps: first, assigning weightage to each pillar of sustainable criteria, ensuring the total equals 100; second, allocating a percentage to each evaluation criteria (sub-criteria) under different pillars, with each pillar making a sum of 100 as well. Higher preference or importance corresponds to a higher percentage of weightage.
Phase 4: Fuzzy TOPSIS
In this phase, we incorporate the insights of decision-makers and the numerical input into the decision-making process. The steps of these calculations are outlined as follows [84,87,88,92,93]:
Step 1: Collecting Users Preferences
In this initial step, we compile user preferences to create a matrix (Table 6).
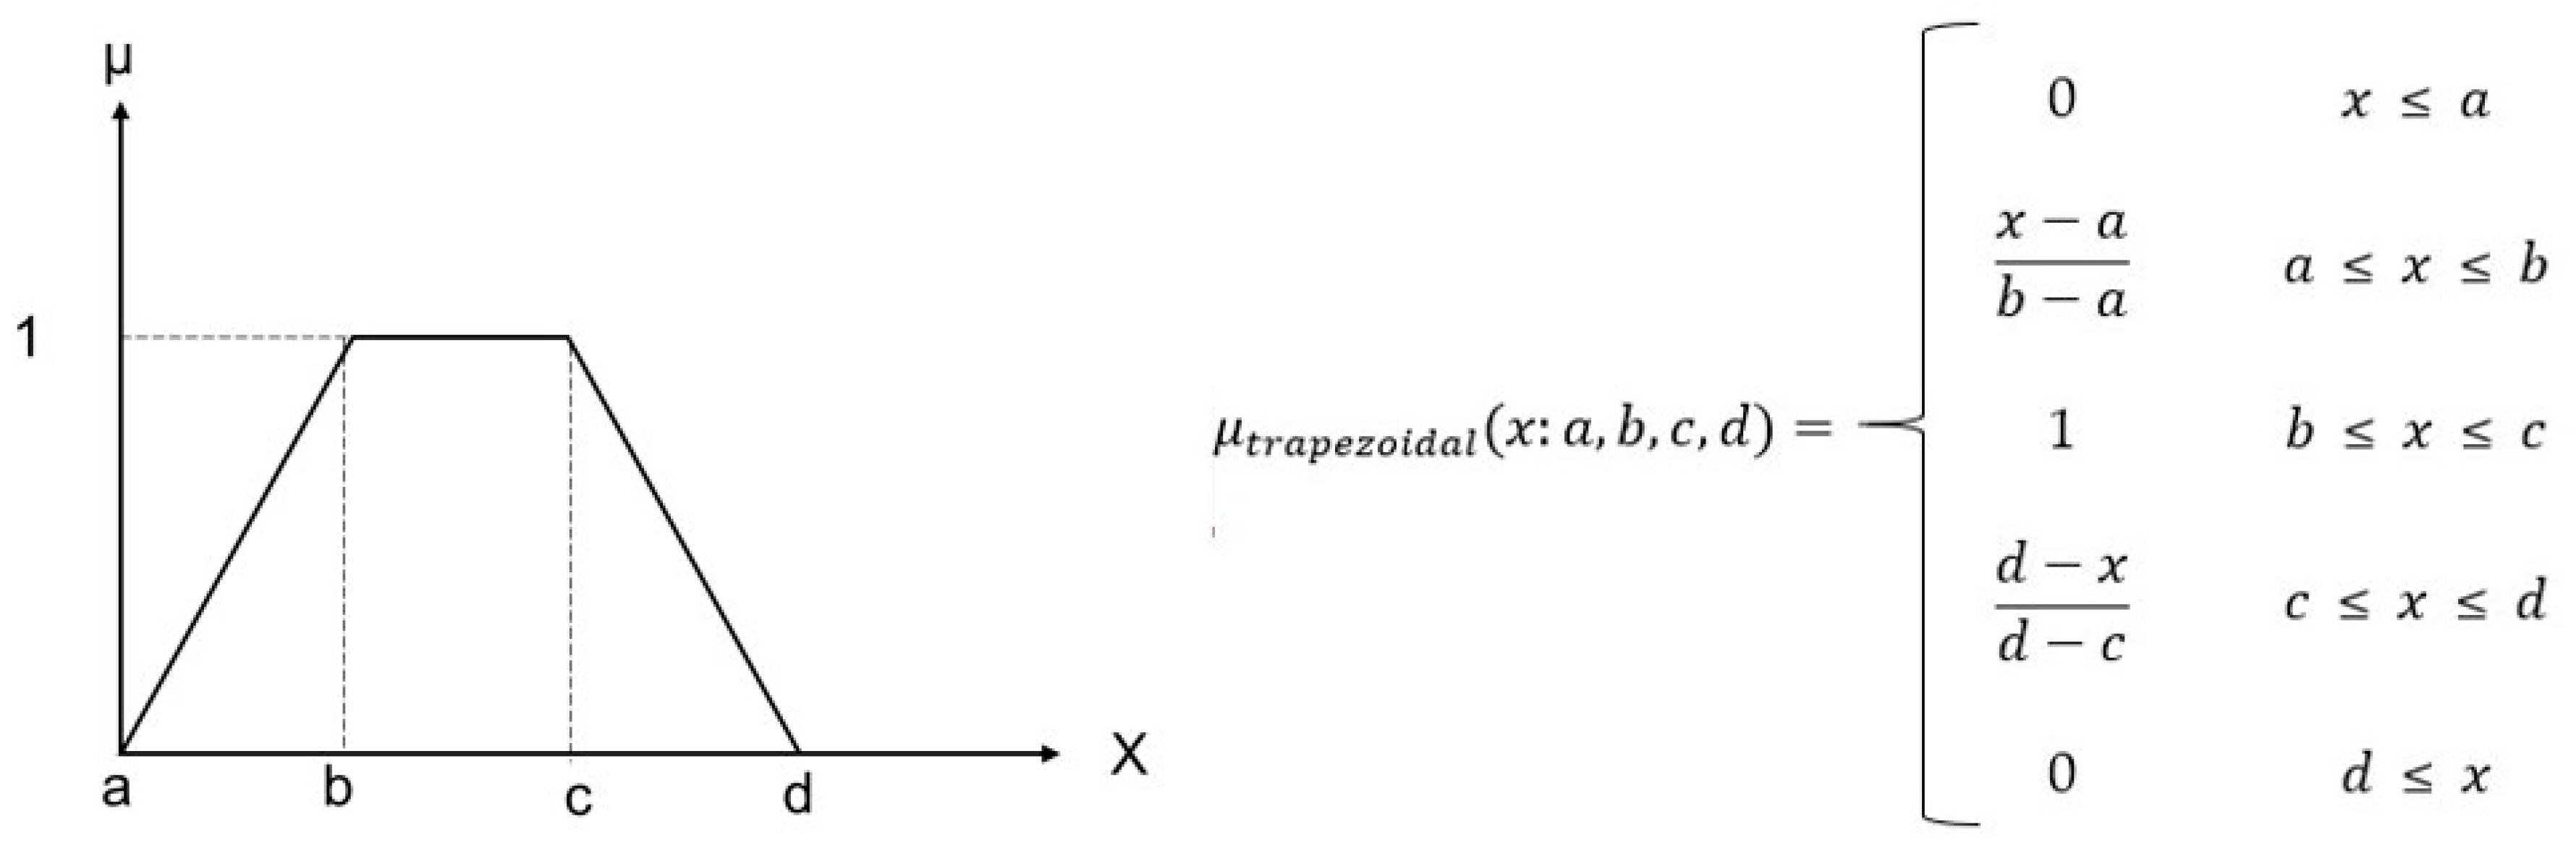
Step 2: Defining Trapezoidal Fuzzy Numbers (TrFN) and Transform User Input into the Fuzzy Decision Matrix
Within the FAHP framework, the TrFN encompass four boundary values: a, b, c, and d. The degree of membership increases between a and b, remains constant between b and c with a degree of 1 (indicating full membership between c and d), and decreases between c and d (as illustrated in 
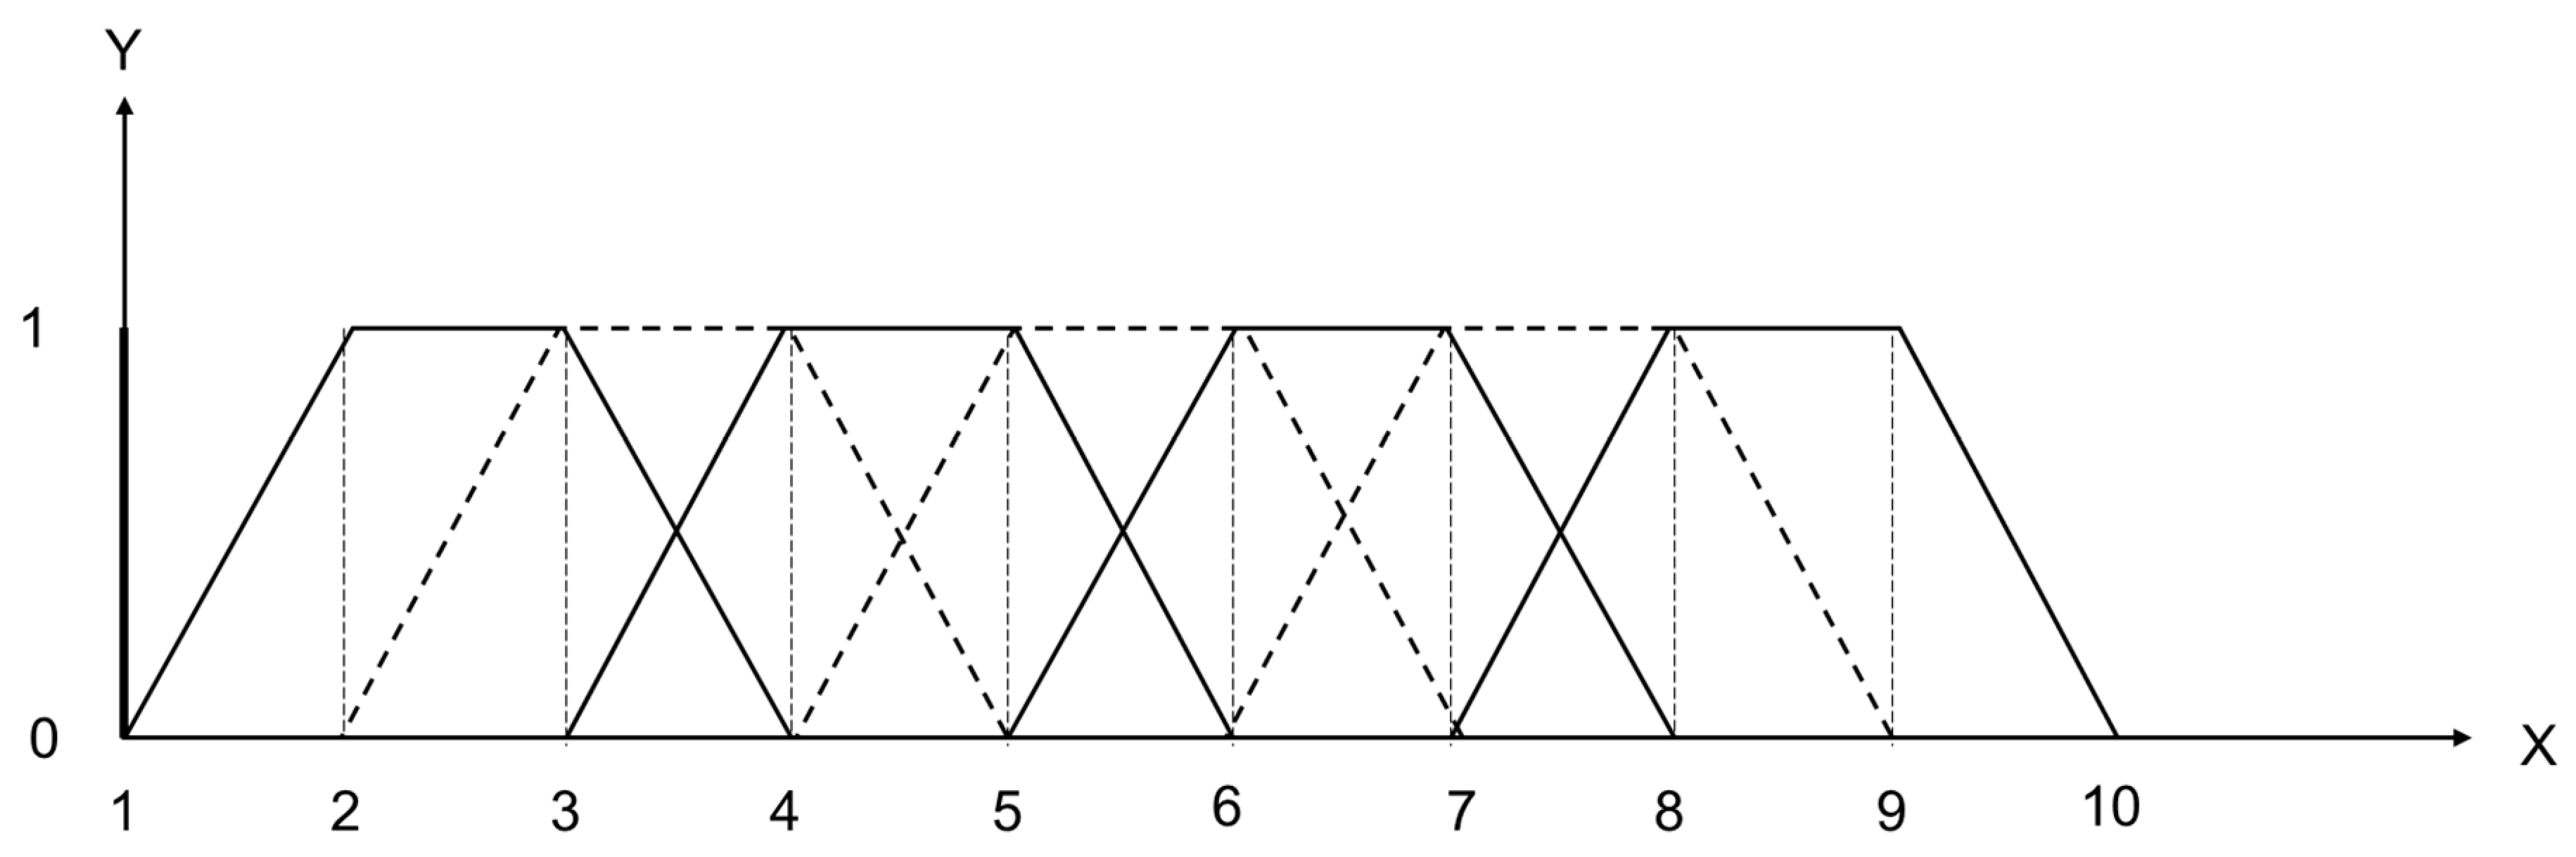
Figure 3). Each fuzzy set representing the categories detailed in Table 7 is depicted by trapezoidal membership functions (as shown in Table 5 and Figure 4).
Step 3: Calculating the Combined Fuzzy Decision Matrix
After transforming the AHP comparison values into FAHP scale values, a combined decision matrix is constructed. This process is depicted through the following formula:
x ~ i j = ( a i j , b i j , c i j , d i j )
where a i j = m i n k { a k i j } , b i j = 1 K k = 1 k b k i j , c i j = 1 K k = 1 k c k i j , a n d   d i j = m a x k { d k i j } ,
Step 4: Normalizing the Fuzzy Decision Matrix Based on Positive and Negative Criteria
The positive and negative criteria are identified to calculate the fuzzy decision matrix as follows:
r ~ i j = ( a i j d * j ,   b i j d * j ,   c i j d * j ,   d i j d * j ) ;   c * j   =   m a x i { d i j } ,   for   benefit   criteria
r ~ i j =   ( a j a i j ,   a j b i j ,   a j c i j ,   a j d i j ) ;   a j   =   m i n i { a i j } ,   for   cost   criteria
Next, the decision matrix is normalized using the provided equation:
v ~ i j = r ~ i j   ×   w j ;   w j = f u z z y   w i g h t a g e .
Step 5: Normalizing the Fuzzy Decision Matrix According to a Single User’s Input
Subsequently, the matrix value is adjusted by multiplying it by the fuzzy normalized weight of each criterion, obtained from fuzzy AHP.
u ~ i j = v ~ i j ×   w f n i
Step 6: Deriving Fuzzy Ideal Solution, Fuzzy Positive Ideal Solution (FPIS), and Fuzzy Negative Ideal Solution (FNIS)
From the fuzzy decision matrix, fuzzy ideal solutions are obtained using the specified method.
Fuzzy Positive Ideal Solution (FPIS):
A * = ( u ~ * 1 , u ~ * 2 , u ~ * 3 , . . u ~ * n ) ,
where u ~ * j = m a x i { u i j ( 4 ) }
Fuzzy Negative Ideal Solution (FNIS):
A = ( u ~ 1 , u ~ 2 , u ~ 3 , . . u ~ n ) ,
where u ~ * j = m i n i { u i j ( 1 ) } .
Step 7: Calculating Distance from FPIS and FNIS
The distance from each alternative is computed using the following formula:
d ( x ~ , y ~ ) = 1 4 [ a 1 a 2 2 + b 1 b 2 2 + c 1 c 2 2 + d 1 d 2 2 ]
where a 1 , b 1 , c 1 , d 1 = u ~ i j ; a 2 , b 2 , c 2 , d 2 = A *   f o r   t h e   p o s i t i v e   d i s t a n c e   a n d   A   f o r   t h e   n e g t i v e   d i s t a n c e .
Step 8: Determining Closeness Coefficient
The closeness coefficient ( C C i ) of each alternative is calculated as follows where a higher C C i   value indicates a higher-ranking order.
C C i = d i d i + d i *   ;   d i * = j = 1 n d ( u ~ i j , u ~ * j )   and   d i = j = 1 n d ( u ~ i j , u ~ j )
Step 9: Ranking and Selecting Decisions
The combined decision for each alternative is computed based on the number of team members (N) as follows:
C C t e a m   i = 1 n C C N   i   x   N i m p o r t a n c e
where Nimportance = the importance of the Nth member in the team, and N = the total number of members.
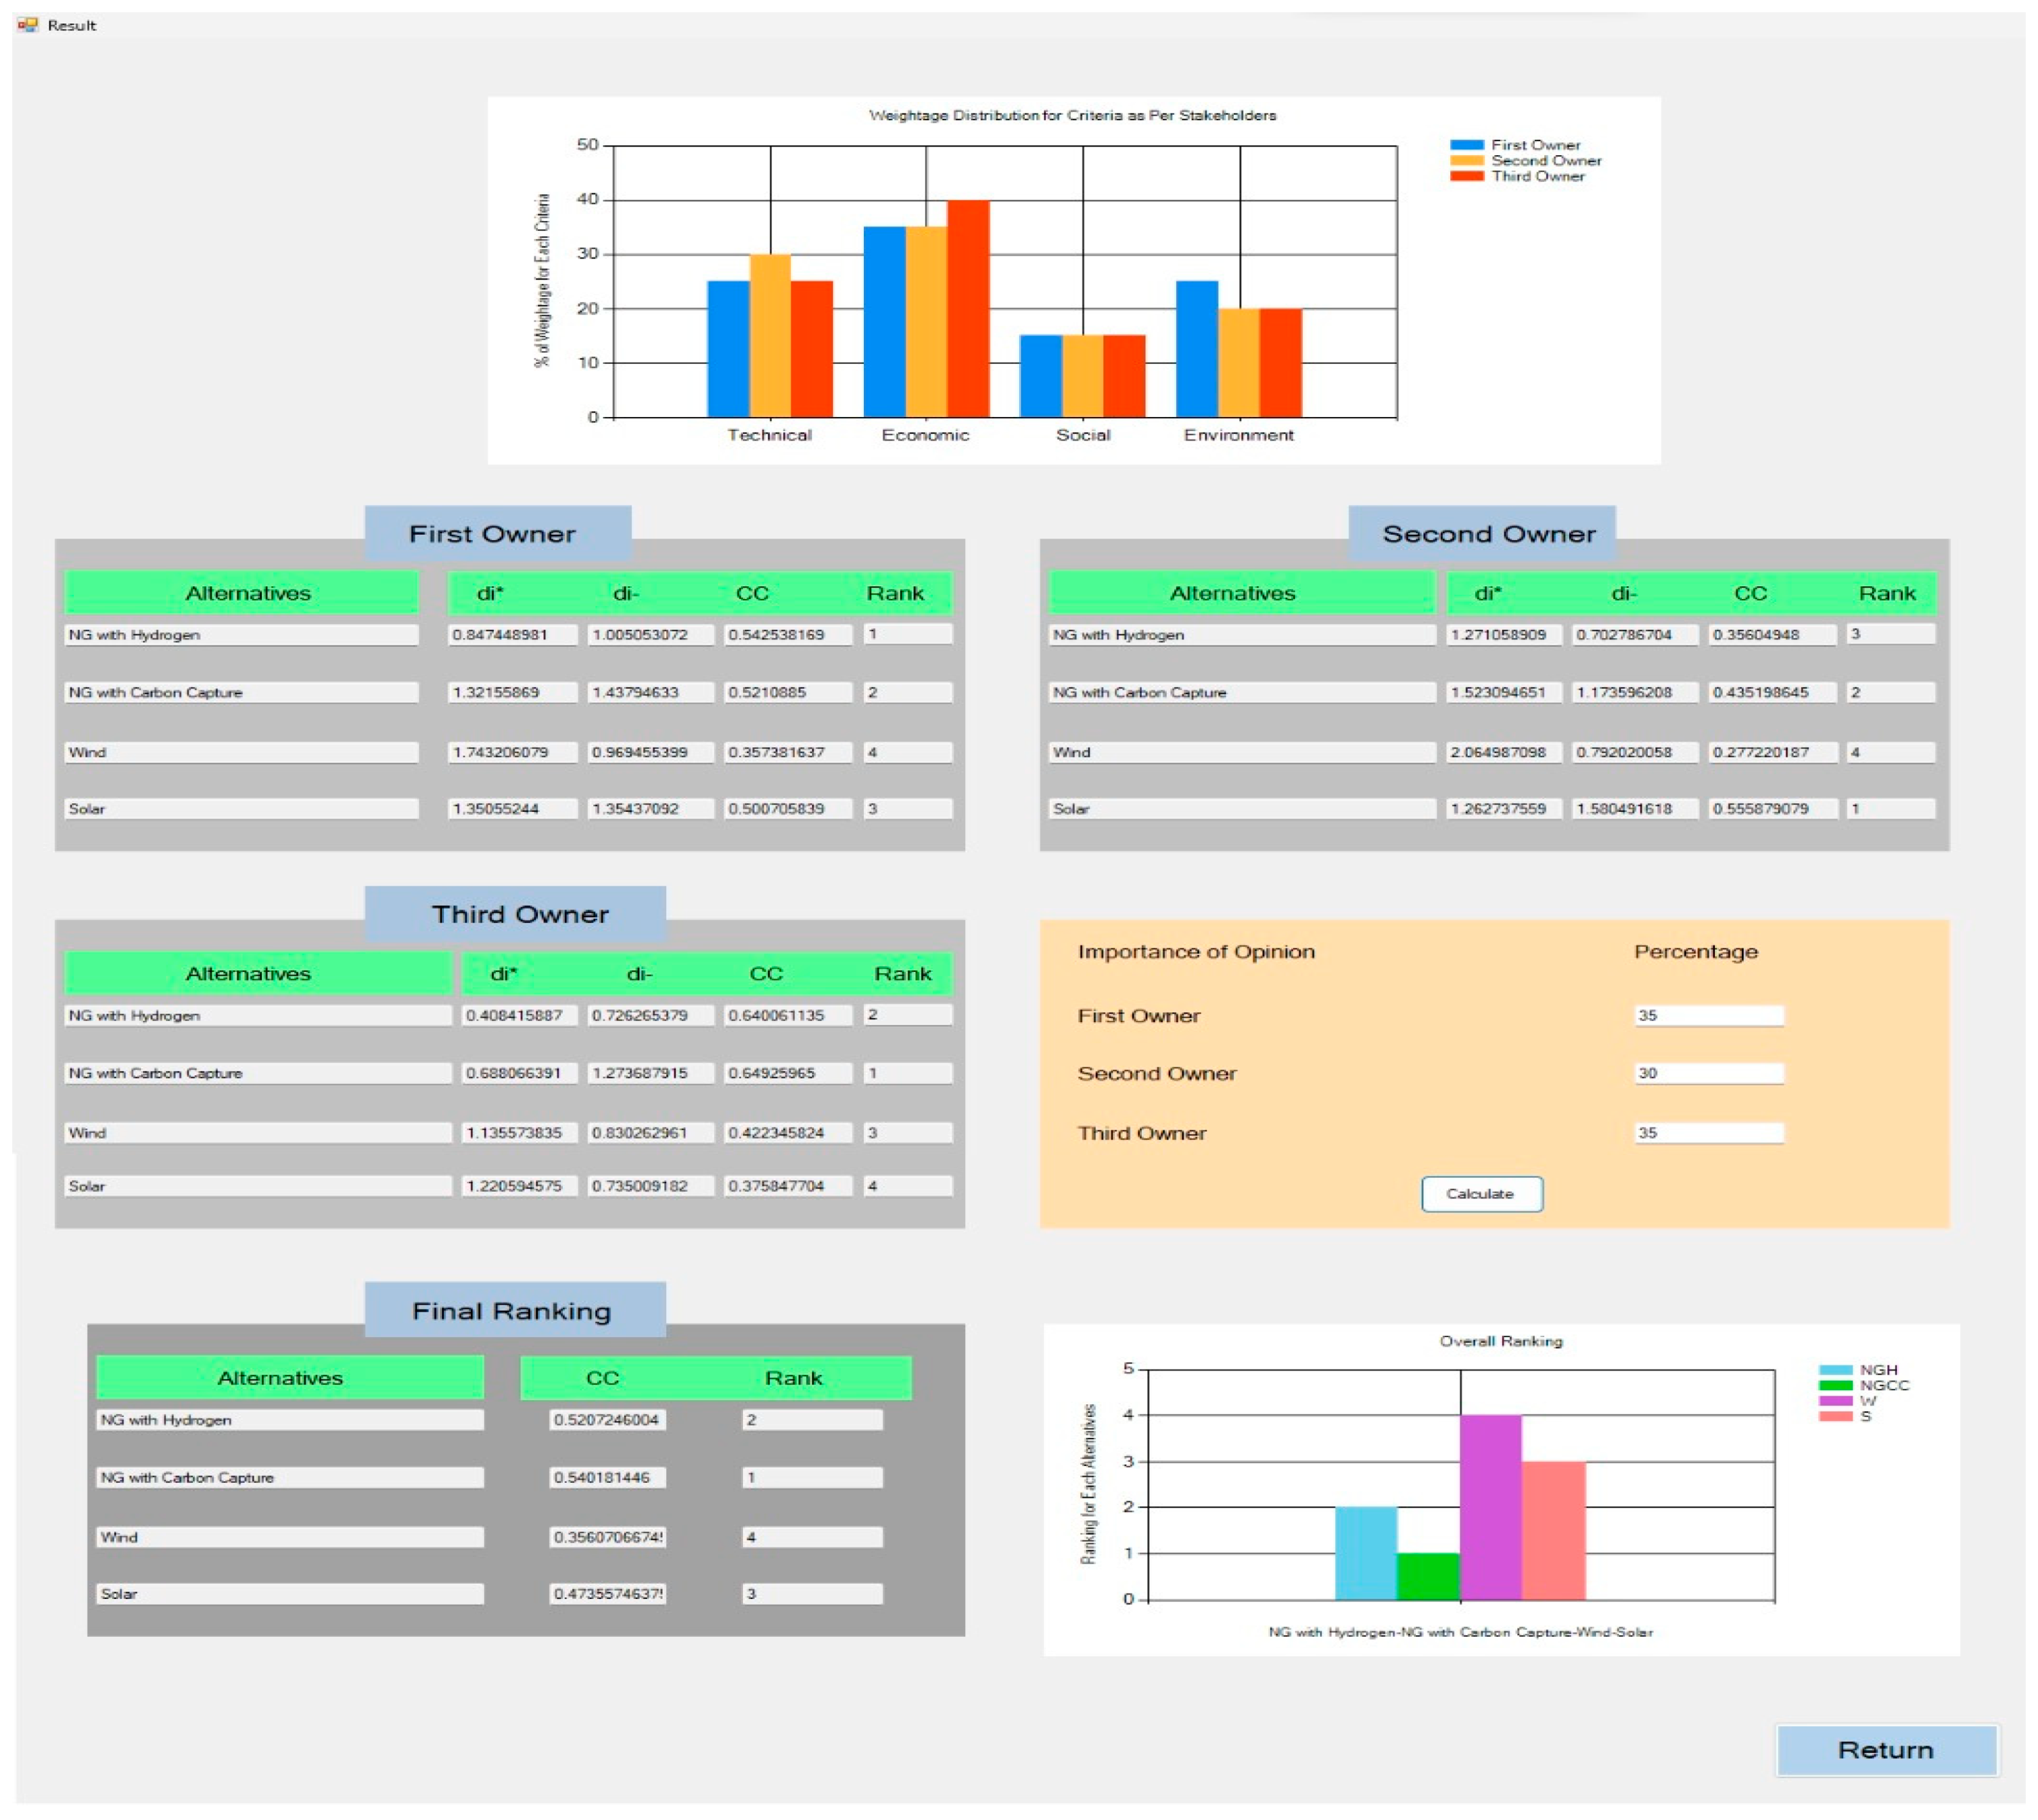
An interface screenshot of this phase is given in below Figure 5 where the fuzzy TOPSIS algorithm analyzes these inputs to rank the alternatives.

7. Hypothetical Case Study

Edmonton is a rapidly growing city, facing a rising demand for electricity to meet its burgeoning population’s needs. The existing power infrastructure is struggling to keep up, causing frequent blackouts and energy shortages. The local government recognizes the urgency to establish a new power plant to ensure a reliable and sustainable energy supply for the city’s development. Therefore, a government agency is planning to construct a new 200-megawatt (200 MW) power plant to meet the increasing electricity demand of the growing urban area. The agency is committed to sustainable development and aims to select the most suitable power plant alternative that aligns with their goals. They need to consider various technical, economic, social, and environmental criteria to make an informed decision.
The local government asks a government agency to convene a team of experts from various fields to evaluate each alternative against the established criteria. The goal is to comprehensively assess these alternatives, considering both their advantages and challenges, to arrive at an informed decision that aligns with Edmonton’s sustainability and energy goals. Among the four alternatives presented below, traditional natural gas and nuclear technologies have been excluded from consideration due to their inherent lack of sustainability, as expressed by experts in the meeting discussion. The following paragraphs provide information and details about the hypothetical case study.

7.1. Description and Assumption of the Hypothetical Case Study

Here are the descriptions of four alternatives, each accompanied by a set of assumptions outlined in Table 8. These assumptions are based on the criteria specified in Table 3 and are considered within the context of a 200 MW power plant project in Edmonton, Alberta, Canada. Although these descriptions and assumptions are hypothetical, they have been partially validated by experts in terms of correctness and accuracy.
  • Natural Gas (NG) with Hydrogen: This alternative proposes the establishment of a hybrid power plant that integrates both natural gas and hydrogen as fuel sources. The intention behind this approach is to significantly lower emissions compared to traditional natural gas power plants. By blending hydrogen with natural gas, the combustion process produces fewer greenhouse gases, thus contributing to more environmentally friendly energy production. The project involves setting up the infrastructure for hydrogen production, storage, and utilization within the power generation process. This alternative aims to address concerns about carbon emissions and aligns with the growing emphasis on transitioning to cleaner energy sources.
  • Natural Gas (NG) with Carbon Capture: In this alternative, a power plant is designed to operate using natural gas while integrating advanced carbon capture technology. This technology captures a significant portion of the carbon dioxide produced during the combustion process and stores it securely. By doing so, the plant aims to drastically reduce its carbon footprint, making it a more environmentally sustainable option. The technology’s effectiveness in capturing carbon emissions will be a crucial factor in assessing this alternative’s viability.
  • Wind: The wind power plant option involves harnessing the region’s wind resources to generate electricity. Wind turbines are strategically positioned to capture kinetic energy from the wind, converting it into electrical power. The plant’s capacity factor, which measures its efficiency in utilizing wind energy for consistent electricity generation, will be a key consideration.
  • Solar: In the solar power plant alternative, the focus is on utilizing the abundant sunlight available in the area to generate electricity. Photovoltaic (PV) panels capture solar energy and convert it directly into electricity. This alternative is characterized by its potential for clean and renewable energy generation.

7.2. Hypothetical Datasets and Normalization

Below, Table 9 and Table 10 showcase hypothetical numerical values based on assumption list (Table 8) and linguistic assessments for each qualitative criterion (for the different alternatives, respectively.
The data in Table 9 are normalized (Phase 1 of Section 6.3) by dividing each cell value by the sum of each column, representing all criteria values for the various alternatives. The resultant normalized decision matrix is presented in Table 11.
To transform the objective value into a linguistic term, we employ the Shannon diversity index, which assesses the breadth of range values for each criterion across the available alternatives. Furthermore, we utilize Shannon’s equitability index, which is the Shannon diversity index divided by the logarithm of the total number of considered alternatives, referred to as the entropy value. The outcomes are presented in Table 12, with the lowest land usage values registering at 0.892 and 0.644, respectively.
Table 13 illustrates the degree of divergence obtained by subtracting the Shannon equitability index from the unit value. These range values serve as the basis for converting all other criteria values within the matrix from objective to subjective values. Lastly, the values from Table 9 were normalized and organized in Table 14, ensuring alignment with the ranges detailed in Table 13.

7.3. Ranking of Alternatives with Fuzzy TOPSIS

By merging the data from Table 10 and Table 14, we create a comprehensive linguistic dataset (Table 15) that will be integrated into the hybrid DSS model. This process is repeated to generate Table 16 and Table 17, both of which capture user inputs, encompassing the converted subjective values for both quantitative and qualitative criteria.
In addition to assigning user preferences for various alternatives (as seen in Table 15, Table 16 and Table 17), it is essential to establish the weight distribution for both the main criteria and sub-criteria before proceeding with the ranking of alternatives. The weight distribution for the primary criteria is presented in Table 18, and the weight distribution for the sub-criteria is presented in Table 19.
After integrating the final linguistic datasets from Table 15, Table 16 and Table 17 along with the weightage distribution (Table 18 and Table 19) into the hybrid DSS model, the alternatives are ranked utilizing the fuzzy TOPSIS method, based on the calculated values of closeness coefficient ( C C i ), as presented in Table 20.
Subsequently, we compute the ultimate composite outcomes as demonstrated in Table 21 by weighing the inputs of the three owners. Each owner’s perspective carries approximately equal significance, with a weightage of 35%, 30%, and 35% allotted to Owner 1, Owner 2, and Owner 3, respectively. These weights are multiplied by their respective C C i values.

7.4. Results and Discussion

The interpretation of the results is based on the closeness coefficient ( C C i ), where a higher CCi value corresponds to a higher ranking, as indicated in Table 21. To derive the team’s weighted C C i , each owner’s opinion is accorded approximately equal importance, accounting for 35%, 30%, and 35% of the group decision-making process. Consequently, the final weighted C C i s for the alternatives for: NG with hydrogen, NG with carbon capture, wind, and solar are 0.5207, 0.5402, 0.3561, and 0.4735, respectively. As a result, the ranking of the alternatives is as follows: NG with carbon capture takes first priority, followed by NG with hydrogen, solar, and wind, in that order. In conclusion, based on the available dataset and expert opinions, NG with carbon capture emerges as the most sustainable project to be selected.
Figure 6 presents a snapshot of the output. The weightage distribution graph provides a concise overview of the weightage assigned by various stakeholders, illustrating their varying emphasis on technical, economic, social, and environmental aspects. Additionally, three tables present the results for the prioritization of alternatives based on stakeholders’ perspectives. In the final step, stakeholders were given the chance to ascribe importance to their opinions, contributing to the determination of the overall ranking of the alternatives.

8. Sensitivity Analysis

Sensitivity analysis serves as a validation process, ensuring that the system meets its intended objectives by scrutinizing the output results as input parameters vary. In this study, sensitivity analysis is conducted by subjecting the hybrid model to three scenarios, confirming its responsiveness to input changes and the meaningfulness of its output. The same group of industry experts from one of the largest power-generation companies in Canada, who initially validated and refined the sub-criteria list, were presented with the hypothetical case study described above. They were specifically consulted for their input on the weightage of criteria and user preferences for alternatives related to the qualitative criteria.

8.1. Criteria Weightage

In the initial scenario, changes were made to the criteria weightage for sustainability pillars (main criteria) and sub-criteria based on expert input as shown in Table 22 and Table 23. However, the user preferences for alternatives remained consistent with the case study, allowing us to assess the impact on the decision-making process. Additionally, we adjusted the importance of the owner’s perspective to 50%, 25%, and 25% based on their experiences.
This scenario was then examined to understand how these changes influenced the C C i   values within the hybrid DSS model, which determine the ranking of the alternatives. The results for this scenario are presented in Table 24.
In this scenario, adjusting the criteria weightage for the main and sub-criteria based on expert input had a notable impact on the ranking. Owner 1 shifted NG with hydrogen to the third priority, with solar taking the lead for both the first and second owners. For the third owner, NG with CC claimed the top spot. However, considering the combined opinions and overall ranking, solar emerged as the first priority. This demonstrates that the developed model is sensitive to the input as criteria weightage.

8.2. User Preferences for Alternatives

In the second scenario, we adjusted the user preferences for alternatives related to qualitative criteria based on expert recommendations (refer to Table 25 and Table 26). This modification aimed to evaluate its influence on the decision-making process. The criteria weightage for all criteria and user preferences for quantitative criteria remained constant from the case study. Additionally, we maintained the distribution of importance for the owner’s perspective at 50%, 25%, and 25%, as specified in the first scenario.
Subsequently, we reevaluated this scenario to analyze the impact of these adjustments on the C C i values within the hybrid DSS model, influencing the ranking of alternatives. The outcomes for this scenario are detailed in Table 27.
In this scenario, altering user preferences for qualitative criteria based on expert input influences the ranking of alternatives. There appears to be a consensus among the experts that solar is their first priority, both in individual and composite results. Furthermore, their second, third, and fourth priorities are identified as wind, NG with CC, and NG with hydrogen, respectively. This illustrates the sensitivity of the developed model to input variations in user preferences as well.

8.3. Criteria Weightage and User Preferences for Alternatives

In the third and final scenario, we integrated adjustments from both the first and second scenarios by modifying user preferences for alternatives related to qualitative criteria and criteria weightage for main criteria and sub-criteria based on expert input. This scenario incorporated aspects of both the first and second scenarios comprehensively. Subsequently, we assessed the impact of these combined changes on the C C i values and the ranking of alternatives. The results of this integrated scenario are presented in Table 28.
The combined scenario output closely resembles the second scenario in terms of values. The solar option retains its position as the first priority. Following that, wind, NG with CC, and NG with hydrogen are ranked as the second, third, and fourth priorities, respectively.

8.4. Result and Discussion

The results are interpreted based on the closeness coefficient ( C C i ), where a higher C C i value indicates a higher ranking, as explained previously. The sensitivity analysis, conducted through three scenarios involving expert opinions, leads to the conclusion that decisions from this model are notably influenced by user inputs. This impact is evident in the ranking of alternatives, with the solar option consistently securing the top position in all three scenarios.
The analysis of hypothetical data revealed that decisions from this model heavily rely on user inputs, specifically criteria weightage and preferences for different alternatives. This underscores the importance of stakeholders shifting from traditional, short-term economic perspectives to embrace sustainable solutions for effective decision-making. In this study, industry experts, actively involved in sustainable construction, exhibited a pronounced focus on economic and environmental aspects, allocating a majority of the weightage. Nevertheless, they also acknowledged the significance of social and technical aspects, dedicating approximately one-third of the total weightage.

9. Conclusions

This research emphasized that sustainable choices require construction projects’ owners to move beyond traditional economic analyses and consider all aspects of sustainable construction to maximize value and minimize harm. Incorporating sustainability considerations from the beginning of construction projects, especially during the feasibility phase, is essential. To achieve this goal, a variety of research methods were employed, combining an extensive literature review, meetings with industry experts, and decision-making techniques to comprehensively improve current practices.
This paper presented an innovative approach to rationalize decision-making for sustainable projects, specifically selecting power-generating technology, by integrating the three pillars of sustainability (economic, social, and environmental) along with a technical category. It identified a comprehensive set of sixteen sustainability criteria and sub-criteria under the pillars of sustainability to assist power-generating plant owners in selecting the most sustainable technology for their projects. A case study illustrated the practical application of these criteria through a hybrid DSS model for ranking power-generating technology. The MCDM techniques utilized in this model were FAHP with fuzzy TOPSIS. The results indicated that when stakeholders’ perspectives are weighted equally across all sustainability pillars, NG with carbon capture appears as the preferred option for sustainability. Additionally, a sensitivity analysis, incorporating expert opinions from a leading power-generating company in Canada, consistently ranked solar technology as the top priority across three different scenarios. This highlights the substantial influence of user inputs on decisions derived from this model.
Overall, this model enables users to customize the criteria and weights to suit their needs, thereby making the model more powerful and adaptable. While the findings of the case study have been verified by industry experts, it is acknowledged that other users may have different preferences or requirements, and the tool allows for easy modification to accommodate these variations.
The associated interest of this study’s contributions lies in its potential to revolutionize decision-making processes in the construction industry at the feasibility phase, especially in the context of power-generating plants. By incorporating technical feasibility alongside economic, social, and environmental considerations, our approach offers a holistic perspective that aligns with the growing emphasis on sustainability in project selection. The industrial sector of the construction industry never looked at all these factors at the same time under one umbrella in the feasibility phase. This approach leads to major changes in the ways that our industry partners make their decisions. This contribution is of interest to stakeholders involved in project selection, management, and policy formulation, as it provides a practical framework for integrating sustainability into project decision-making.
The limitations and future recommendations of this study are as follows:
  • Our analysis focused on technologies relevant to our industry partner’s portfolio. Future studies may explore other power-generating owners and additional renewable sources of electricity and technologies such as geothermal, hydropower, “nuclear”, bioenergy, etc. Our research utilized fuzzy AHP-TOPSIS, but future researchers may check the impact of utilizing other decision-making techniques (e.g., VIKOR, PROMETHEE, etc.) on the ranking of the alternatives.
  • Although our study primarily addressed GHG emissions (CO2 and CH4) as a representation of air pollution in the construction industry, we recognize the significance of other pollutants like SOx, NOx, and fine dust, which can impact human health and the ecosystem. Future research should consider incorporating these additional air pollutants to provide a more comprehensive assessment of sustainability criteria.
  • The percentages in Table 19 were provided by industry experts, reflecting their current perspectives and practices. While these weightings may not fully prioritize environmental factors, such as waste disposal’s impact on greenhouse gas emissions and public health, future researchers may address these concerns and explore the impact of changing the allocated weights on the ranking of the analyzed alternatives.
  • Future scholars can utilize the developed tool to build a sustainable project portfolio of various technologies power-generating plants, and they may obtain data from real projects for further testing of the developed model.

Author Contributions

Conceptualization, F.P. and A.H.; methodology, F.P.; validation, F.P. and A.H.; analysis, F.P.; writing—original draft preparation, F.P.; writing—review and editing, A.H.; visualization, F.P.; supervision, A.H. All authors have read and agreed to the published version of the manuscript.

Funding

This research is funded by NSERC, application number ALLRP 577032-2022.

Institutional Review Board Statement

Not applicable.

Informed Consent Statement

Not applicable.

Data Availability Statement

The data presented in this study are available on request from the corresponding author.

Conflicts of Interest

The authors declare no conflicts of interest.

References

  1. Dobrovolskienė, N.; Tamošiūnienė, R. An Index to Measure Sustainability of a Business Project in the Construction Industry: Lithuanian Case. Sustainability 2015, 8, 14. [Google Scholar] [CrossRef]
  2. Mohagheghi, V.; Mousavi, S.; Vahdani, B. A New Multi-Objective Optimization Approach for Sustainable Project Portfolio Selection: A Realworld Application under Interval-Valued Fuzzy Environment. Iran. J. Fuzzy Syst. 2016, 13, 41–68. [Google Scholar] [CrossRef]
  3. Bektur, G. A Hybrid Fuzzy MCDM Approach for Sustainable Project Portfolio Selection Problem and an Application for a Construction Company. Afyon Kocatepe Üniversitesi İktisadi ve İdari Bilim. Fakültesi Derg. 2021, 23, 182–194. [Google Scholar] [CrossRef]
  4. Kudratova, S.; Huang, X.; Zhou, X. Sustainable project selection: Optimal project selection considering sustainability under reinvestment strategy. J. Clean. Prod. 2018, 203, 469–481. [Google Scholar] [CrossRef]
  5. Kiani Mavi, R.; Gengatharen, D.; Kiani Mavi, N.; Hughes, R.; Campbell, A.; Yates, R. Sustainability in Construction Projects: A Systematic Literature Review. Sustainability 2021, 13, 1932. [Google Scholar] [CrossRef]
  6. Alyamani, R.; Long, S. The Application of Fuzzy Analytic Hierarchy Process in Sustainable Project Selection. Sustainability 2020, 12, 8314. [Google Scholar] [CrossRef]
  7. Mohagheghi, V.; Mousavi, S.M.; Vahdani, B. A New Optimization Model for Project Portfolio Selection Under Interval-Valued Fuzzy Environment. Arab. J. Sci. Eng. 2015, 40, 3351–3361. [Google Scholar] [CrossRef]
  8. Morton, A.; Keisler, J.M.; Salo, A. Multicriteria Portfolio Decision Analysis for Project Selection. In International Series in Operations Research & Management Science; Springer: Berlin/Heidelberg, Germany, 2016; pp. 1269–1298. [Google Scholar] [CrossRef]
  9. RezaHoseini, A.; Ghannadpour, S.F.; Hemmati, M. A comprehensive mathematical model for resource-constrained multi-objective project portfolio selection and scheduling considering sustainability and projects splitting. J. Clean. Prod. 2020, 269, 122073. [Google Scholar] [CrossRef]
  10. Medaglia, A.L.; Graves, S.B.; Ringuest, J.L. A multiobjective evolutionary approach for linearly constrained project selection under uncertainty. Eur. J. Oper. Res. 2007, 179, 869–894. [Google Scholar] [CrossRef]
  11. Abbasianjahromi, H.; Rajaie, H. Developing a project portfolio selection model for contractor firms considering the risk factor. J. Civ. Eng. Manag. 2012, 18, 879–889. [Google Scholar] [CrossRef]
  12. Bamgbade, J.A.; Kamaruddeen, A.M.; Nawi, M.N.M. Malaysian construction firms’ social sustainability via organizational innovativeness and government support: The mediating role of market culture. J. Clean. Prod. 2017, 154, 114–124. [Google Scholar] [CrossRef]
  13. RYFAN. Construction Conundrum. Available online: https://www.ryfan.ca/company/construction-connundrum#:~:text=The%20Global%20Construction%20Industry%20Represents,in%20the%20past%202%20decades (accessed on 5 September 2023).
  14. STATISTA. Statista Research Department. Available online: https://www.nextmsc.com/report/construction-market (accessed on 7 April 2024).
  15. Goel, A.; Ganesh, L.S.; Kaur, A. Sustainability integration in the management of construction projects: A morphological analysis of over two decades’ research literature. J. Clean. Prod. 2019, 236, 117676. [Google Scholar] [CrossRef]
  16. UNEP 2021 Global Status Report for Buildings and Construction|Globalabc. Available online: https://globalabc.org/resources/publications/2021-global-status-report-buildings-and-construction (accessed on 6 April 2023).
  17. Hasheminasab, H.; Gholipour, Y.; Kharrazi, M.; Streimikiene, D. A quantitative sustainability assessment framework for petroleum refinery projects. Environ. Sci. Pollut. Res. 2020, 28, 15305–15319. [Google Scholar] [CrossRef]
  18. Hasheminasab, H.; Gholipour, Y.; Kharrazi, M.; Streimikiene, D. A novel Metric of Sustainability for petroleum refinery projects. J. Clean. Prod. 2018, 171, 1215–1224. [Google Scholar] [CrossRef]
  19. Hasheminasab, H.; Gholipour, Y.; Kharrazi, M.; Streimikiene, D. Life cycle approach in sustainability assessment for petroleum refinery projects with fuzzy-AHP. Energy Environ. 2018, 29, 1208–1223. [Google Scholar] [CrossRef]
  20. Akella, A.K.; Saini, R.P.; Sharma, M.P. Social, economical and environmental impacts of renewable energy systems. Renew. Energy 2009, 34, 390–396. [Google Scholar] [CrossRef]
  21. Oyedepo, S.O. Energy and sustainable development in Nigeria: The way forward. Energy Sustain. Soc. 2012, 2, 15. [Google Scholar] [CrossRef]
  22. Madurai Elavarasan, R.; Shafiullah, G.M.; Kannadasan, R.; Mudgal, V.; Arif, M.T.; Jamal, T.; Subramaniam, S.; Balaguru, V.S.; Reddy, K.S.; Subramaniam, U. COVID-19: Impact Analysis and Recommendations for Power Sector Operation. Appl. Energy 2020, 279, 115739. [Google Scholar] [CrossRef]
  23. Klinger, M.; Susong, M. Phases of the construction project. In The Construction Project: Phases, People, Terms, Paperwork, Processes; American Bar Association: Chicago, IL, USA, 2006; pp. 4–36. [Google Scholar]
  24. Marcelino-Sádaba, S.; González-Jaen, L.F.; Pérez-Ezcurdia, A. Using project management as a way to sustainability. From a comprehensive review to a framework definition. J. Clean. Prod. 2015, 99, 1–16. [Google Scholar] [CrossRef]
  25. Farrell, A. Making decisions about sustainability: Joining social values with technical expertise. In Proceedings of the International Symposium on Technology and Society Technical Expertise and Public Decisions, Princeton, NJ, USA, 21 June 1996; pp. 188–197. [Google Scholar] [CrossRef]
  26. Ahn, Y.H.; Pearce, A.R.; Wang, Y.; Wang, G. Drivers and barriers of sustainable design and construction: The perception of green building experience. Int. J. Sustain. Build. Technol. Urban Dev. 2013, 4, 35–45. [Google Scholar] [CrossRef]
  27. Shen, L.; Tam, V.W.Y.; Tam, L.; Ji, Y. Project feasibility study: The key to successful implementation of sustainable and socially responsible construction management practice. J. Clean. Prod. 2010, 18, 254–259. [Google Scholar] [CrossRef]
  28. Opoku, D.-G.J.; Ayarkwa, J.; Agyekum, K. Barriers to environmental sustainability of construction projects. Smart Sustain. Built Environ. 2019, 8, 292–306. [Google Scholar] [CrossRef]
  29. Chang, R.-D.; Zuo, J.; Zhao, Z.-Y.; Soebarto, V.; Lu, Y.; Zillante, G.; Gan, X.-L. Sustainability attitude and performance of construction enterprises: A China study. J. Clean. Prod. 2018, 172, 1440–1451. [Google Scholar] [CrossRef]
  30. Messerli, P.; Murniningtyas, E.; Eloundou-Enyegue, P. The Future is Now: Science for Achieving Sustainable Development; United Nations: New York, NY, USA, 2019. [Google Scholar]
  31. Arif, M.; Egbu, C.; Haleem, A.; Kulonda, D.; Khalfan, M. State of green construction in India: Drivers and challenges. J. Eng. Des. Technol. 2009, 7, 223–234. [Google Scholar] [CrossRef]
  32. Ojo, E.; Mbowa, C.; Akinlabi, E.T. Barriers in implementing green supply chain management in construction industry. In Proceedings of the International Conference on Industrial Engineering and Operations Management, Bali, Indonesia, 7–9 January 2014; pp. 1974–1981. [Google Scholar]
  33. Zuofa, T.; Ochieng, E. Sustainability in Construction Project Delivery: A Study of Experienced Project Managers in Nigeria. Proj. Manag. J. 2016, 47, 44–55. [Google Scholar] [CrossRef]
  34. Boons, F.; Mendoza, A. Constructing sustainable palm oil: How actors define sustainability. J. Clean. Prod. 2010, 18, 1686–1695. [Google Scholar] [CrossRef]
  35. Opoku, D.-G.J.; Agyekum, K.; Ayarkwa, J. Drivers of environmental sustainability of construction projects: A thematic analysis of verbatim comments from built environment consultants. Int. J. Constr. Manag. 2019, 22, 1033–1041. [Google Scholar] [CrossRef]
  36. ISO 14000; Environmental Management. International Organization for Standardization: Geneva, Switzerland, 2015.
  37. Opoku, D.G.J.; Ayarkwa, J.; Agyekum, K. A conceptual framework of push factors for implementing environmentally sustainable construction practices. In Proceedings of the ICIDA—6th International Conference on Infrastructure Development in Africa, Kumasi, Ghana, 12–14 April 2017; pp. 12–20. [Google Scholar]
  38. Aktas, B.; Ozorhon, B. Green Building Certification Process of Existing Buildings in Developing Countries: Cases from Turkey. J. Manag. Eng. 2015, 31, 05015002-1–05015002-9. [Google Scholar] [CrossRef]
  39. Andelin, M.; Sarasoja, A.-L.; Ventovuori, T.; Junnila, S. Breaking the circle of blame for sustainable buildings—Evidence from Nordic countries. J. Corp. Real Estate 2015, 17, 26–45. [Google Scholar] [CrossRef]
  40. Babiak, K.; Trendafilova, S. CSR and environmental responsibility: Motives and pressures to adopt green management practices. Corp. Soc. Responsib. Environ. Manag. 2011, 18, 11–24. [Google Scholar] [CrossRef]
  41. Bamgbade, J.A.; Nawi, M.N.M.; Kamaruddeen, A.M.; Adeleke, A.Q.; Salimon, M.G. Building sustainability in the construction industry through firm capabilities, technology and business innovativeness: Empirical evidence from Malaysia. Int. J. Constr. Manag. 2019, 22, 473–488. [Google Scholar] [CrossRef]
  42. Better, M.; Glover, F. Selecting Project Portfolios by Optimizing Simulations. Eng. Econ. 2006, 51, 81–97. [Google Scholar] [CrossRef]
  43. Meskendahl, S. The influence of business strategy on project portfolio management and its success—A conceptual framework. Int. J. Proj. Manag. 2010, 28, 807–817. [Google Scholar] [CrossRef]
  44. Teller, J.; Kock, A. An empirical investigation on how portfolio risk management influences project portfolio success. Int. J. Proj. Manag. 2013, 31, 817–829. [Google Scholar] [CrossRef]
  45. Dixit, V.; Tiwari, M.K. Project portfolio selection and scheduling optimization based on risk measure: A conditional value at risk approach. Ann. Oper. Res. 2019, 285, 9–33. [Google Scholar] [CrossRef]
  46. Martinsuo, M.; Geraldi, J. Management of project portfolios: Relationships of project portfolios with their contexts. Int. J. Proj. Manag. 2020, 38, 441–453. [Google Scholar] [CrossRef]
  47. Siew, R.Y.J. Integrating sustainability into construction project portfolio management. KSCE J. Civ. Eng. 2015, 20, 101–108. [Google Scholar] [CrossRef]
  48. Enea, M.; Piazza, T. Project Selection by Constrained Fuzzy AHP. Fuzzy Optim. Decis. Mak. 2004, 3, 39–62. [Google Scholar] [CrossRef]
  49. Kandakoglu, M.; Walther, G.; Ben Amor, S.B. The use of multi-criteria decision-making methods in project portfolio selection: A literature review and future research directions. Ann. Oper. Res. 2023, 332, 807–830. [Google Scholar] [CrossRef]
  50. Huang, X. Portfolio selection with a new definition of risk. Eur. J. Oper. Res. 2008, 186, 351–357. [Google Scholar] [CrossRef]
  51. Amiri, M.P. Project selection for oil-fields development by using the AHP and fuzzy TOPSIS methods. Expert Syst. Appl. 2010, 37, 6218–6224. [Google Scholar] [CrossRef]
  52. Nandi, S.; Paul, S.; Phadtare, M. An AHP-based construction project selection method. Decision (0304-0941) 2011, 38, 91. [Google Scholar]
  53. Higham, A.P.; Fortune, C.; Boothman, J.C. Sustainability and investment appraisal for housing regeneration projects. Struct. Surv. 2016, 34, 150–167. [Google Scholar] [CrossRef]
  54. Siew, R.Y.J.; Balatbat, M.C.A.; Carmichael, D.G. A proposed framework for assessing the sustainability of infrastructure. Int. J. Constr. Manag. 2016, 16, 281–298. [Google Scholar] [CrossRef]
  55. Chatterjee, K.; Hossain, S.A.; Kar, S. Prioritization of project proposals in portfolio management using fuzzy AHP. Opsearch 2018, 55, 478–501. [Google Scholar] [CrossRef]
  56. AbouHamad, M.; Abu-Hamd, M. Framework for construction system selection based on life cycle cost and sustainability assessment. J. Clean. Prod. 2019, 241, 118397. [Google Scholar] [CrossRef]
  57. Ibrahim, A.; Surya, R.A. The Implementation of Simple Additive Weighting (SAW) Method in Decision Support System for the Best School Selection in Jambi. J. Phys. Conf. Ser. 2019, 1338, 012054. [Google Scholar] [CrossRef]
  58. Ma, J.; Harstvedt, J.D.; Jaradat, R.; Smith, B. Sustainability driven multi-criteria project portfolio selection under uncertain decision-making environment. Comput. Ind. Eng. 2020, 140, 106236. [Google Scholar] [CrossRef]
  59. Jurík, L.; Horňáková, N.; Šantavá, E.; Cagáňová, D.; Sablik, J. Application of AHP method for project selection in the context of sustainable development. Wirel. Netw. 2022, 28, 893–902. [Google Scholar] [CrossRef]
  60. Dobrovolskienė, N.; Pozniak, A.; Tvaronavičienė, M. Assessment of the Sustainability of a Real Estate Project Using Multi-Criteria Decision Making. Sustainability 2021, 13, 4352. [Google Scholar] [CrossRef]
  61. Abdullah, A.G.; Shafii, M.A.; Pramuditya, S.; Setiadipura, T.; Anzhar, K. Multi-criteria decision making for nuclear power plant selection using fuzzy AHP: Evidence from Indonesia. Energy AI 2023, 14, 100263. [Google Scholar] [CrossRef]
  62. Alam Bhuiyan, M.M.; Hammad, A. A hybrid multi-criteria decision support system for selecting the most sustainable structural material for a multistory building construction. Sustainability 2023, 15, 3128. [Google Scholar] [CrossRef]
  63. Rahimi, F.; Davari-Ardakani, H.; Ameli, M.; Beheshtkhah, M.K. A Sustainable Resource-Constrained Project Selection and Scheduling Model using Scenario-Based Stochastic Programming: A case study of industrial projects. Res. Sq. 2023. [Google Scholar] [CrossRef]
  64. San Cristóbal, J.R. Multi-criteria decision-making in the selection of a renewable energy project in Spain: The VIKOR method. Renew. Energy 2011, 36, 498–502. [Google Scholar] [CrossRef]
  65. Bandaru, S.H.; Becerra, V.; Khanna, S.; Espargilliere, H.; Torres Sevilla, L.; Radulovic, J.; Hutchinson, D.; Khusainov, R. A general framework for multi-criteria based feasibility studies for solar energy projects: Application to a real-world solar farm. Energies 2021, 14, 2204. [Google Scholar] [CrossRef]
  66. Barin, A.; Canha, L.N.; da Rosa Abaide, A.; Magnago, K.F. Selection of storage energy technologies in a power quality scenario—The AHP and the fuzzy logic. In Proceedings of the 35th Annual Conference of IEEE Industrial Electronics, Porto, Portugal, 3–5 November 2009; pp. 3615–3620. [Google Scholar] [CrossRef]
  67. Cheng, E.W.; Li, H. Analytic network process applied to project selection. J. Constr. Eng. Manag. 2005, 131, 459–466. [Google Scholar] [CrossRef]
  68. Khan, I. Power generation expansion plan and sustainability in a developing country: A multi-criteria decision analysis. J. Clean. Prod. 2019, 220, 707–720. [Google Scholar] [CrossRef]
  69. Kumar, A.; Sah, B.; Singh, A.R.; Deng, Y.; He, X.; Kumar, P.; Bansal, R.C. A review of multi criteria decision making (MCDM) towards sustainable renewable energy development. Renew. Sustain. Energy Rev. 2017, 69, 596–609. [Google Scholar] [CrossRef]
  70. Tavana, M.; Khosrojerdi, G.; Mina, H.; Rahman, A. A Hybrid Mathematical Programming Model for Optimal Project Portfolio Selection using Fuzzy Inference System and Analytic Hierarchy Process. Eval. Program Plan. 2019, 77, 101703. [Google Scholar] [CrossRef]
  71. Parvaneh, F.; El-Sayegh, S.M. Project selection using the combined approach of AHP and LP. J. Financ. Manag. Prop. Constr. 2016, 21, 39–53. [Google Scholar] [CrossRef]
  72. Henriksen, A.D.; Traynor, A.J. A practical R&D project-selection scoring tool. IEEE Trans. Eng. Manag. 1999, 46, 158–170. [Google Scholar] [CrossRef]
  73. Fasanghari, M.; Roudsari, F.H. Optimized ICT project selection utilizing fuzzy system. World Appl. Sci. J. 2008, 4, 44–49. [Google Scholar]
  74. Shadabfar, M.; Cheng, L. Probabilistic approach for optimal portfolio selection using a hybrid Monte Carlo simulation and Markowitz model. Alex. Eng. J. 2020, 59, 3381–3393. [Google Scholar] [CrossRef]
  75. Marcondes, G.A.B.; Vilela, M.D.S. Project Selection with Uncertainty Using Monte Carlo Simulation and Multi-criteria Decision Methods. In Proceedings of the International Conference on Operations Research and Enterprise Systems, Valetta, Malta, 22 February 2020; pp. 152–170. [Google Scholar] [CrossRef]
  76. Stein, E.W. A comprehensive multi-criteria model to rank electric energy production technologies. Renew. Sustain. Energy Rev. 2013, 22, 640–654. [Google Scholar] [CrossRef]
  77. Dobrovolskienė, N.; Tamošiūnienė, R. Sustainability-Oriented Financial Resource Allocation in a Project Portfolio through Multi-Criteria Decision-Making. Sustainability 2016, 8, 485. [Google Scholar] [CrossRef]
  78. Lai, K.K.; Wang, S.Y.; Xu, J.P.; Zhu, S.S.; Fang, Y. A class of linear interval programming problems and its application to portfolio selection. IEEE Trans. Fuzzy Syst. 2002, 10, 698–704. [Google Scholar] [CrossRef]
  79. Dobrovolskienė, N.; Tamošiūnienė, R.; Banaitis, A.; Ferreira, F.A.; Banaitienė, N.; Taujanskaitė, K.; Meidutė-Kavaliauskienė, I. Developing a composite sustainability index for real estate projects using multiple criteria decision making. Oper. Res. 2019, 19, 617–635. [Google Scholar] [CrossRef]
  80. Elena Arce, M.; Saavedra, Á.; Míguez, J.L.; Granada, E. The use of grey-based methods in multi-criteria decision analysis for the evaluation of sustainable energy systems: A review. Renew. Sustain. Energy Rev. 2015, 47, 924–932. [Google Scholar] [CrossRef]
  81. Katal, F.; Fazelpour, F. Multi-criteria evaluation and priority analysis of different types of existing power plants in Iran: An optimized energy planning system. Renew. Energy 2018, 120, 163–177. [Google Scholar] [CrossRef]
  82. Danso, H. Dimensions and Indicators for Sustainable Construction Materials: A Review. Res. Dev. Mater. Sci. 2018, 3, 1–9. [Google Scholar] [CrossRef]
  83. Dağdeviren, M.; Yavuz, S.; Kılınç, N. Weapon selection using the AHP and TOPSIS methods under fuzzy environment. Expert Syst. Appl. 2009, 36, 8143–8151. [Google Scholar] [CrossRef]
  84. Ertuğrul, İ.; Karakaşoğlu, N. Comparison of fuzzy AHP and fuzzy TOPSIS methods for facility location selection. Int. J. Adv. Manuf. Technol. 2008, 39, 783–795. [Google Scholar] [CrossRef]
  85. Forman, E.H.; Gass, S.I. The Analytic Hierarchy Process—An Exposition. Oper. Res. 2001, 49, 469–486. [Google Scholar] [CrossRef]
  86. Akadiri, P.O.; Olomolaiye, P.O.; Chinyio, E.A. Multi-criteria evaluation model for the selection of sustainable materials for building projects. Autom. Constr. 2013, 30, 113–125. [Google Scholar] [CrossRef]
  87. Chen, T.Y.; Tsao, C.Y. The interval-valued fuzzy TOPSIS method and experimental analysis. Fuzzy Sets Syst. 2008, 159, 1410–1428. [Google Scholar] [CrossRef]
  88. Gligoric, Z.; Beljic, C.; Simeunovic, V. Shaft location selection at deep multiple orebody deposit by using fuzzy TOPSIS method and network optimization. Expert Syst. Appl. 2010, 37, 1408–1418. [Google Scholar] [CrossRef]
  89. Jost, L. Entropy and Diversity. Oikos 2006, 113, 363–375. [Google Scholar] [CrossRef]
  90. Wang, T.C.; Lee, H.D. Developing a Fuzzy TOPSIS Approach Based on Subjective Weights and Objective Weights. Expert Syst. Appl. 2009, 36, 8980–8985. [Google Scholar] [CrossRef]
  91. Sirisawat, P.; Kiatcharoenpol, T. Fuzzy AHP-TOPSIS Approaches to Prioritizing Solutions for Reverse Logistics Barriers. Comput. Ind. Eng. 2018, 117, 303–318. [Google Scholar] [CrossRef]
  92. Büyüközkan, G.; Çifçi, G. A Combined Fuzzy AHP and Fuzzy TOPSIS Based Strategic Analysis of Electronic Service Quality in Healthcare Industry. Expert Syst. Appl. 2012, 39, 2341–2354. [Google Scholar] [CrossRef]
  93. Kahraman, C.; Yasin Ate¸s, N.; Çevik, S.; Gülbay, M.; Ayça Erdŏgan, S. Hierarchical Fuzzy TOPSIS Model for Selection among Logistics Information Technologies. J. Enterp. Inf. Manag. 2007, 20, 143–168. [Google Scholar] [CrossRef]
Figure 1. Research framework.
Sustainability 16 03287 g001
Figure 2. The interface of the decision matrix used for criteria weightage calculation.
Sustainability 16 03287 g002
Figure 3. Four parameters describe the trapezoidal membership function [62].
Sustainability 16 03287 g003
Figure 4. Trapezoidal membership functions [62]. The dotted line follows the trapezoidal distribution rules and shows overlapping with different sets of trapezoidal fuzzy numbers. Solid lines represent the trapezoidal fuzzy number in Table 5 and Table 7.
Sustainability 16 03287 g004
Figure 5. The interface of assigning preferences for alternatives.
Sustainability 16 03287 g005
Figure 6. Visual output and graphical representation of weight distribution and alternative ranking.
Sustainability 16 03287 g006
Table 1. Summary of the relevant literature review.
Author(s)Application Field Application PhaseConsideration of All Pillars of Sustainability
TechnicalEconomicSocialEnvironment
Better and Glover [42]Not specifiedNot specifiedNoYesNo No
Huang [50]Not specifiedNot specifiedNoYesNo No
Amiri [51]Industrial projectsNot specifiedYesYesNo No
Nandi et al. [52]Construction projectsConstruction phaseYesYesNo No
Dobrovolskiene and Tamošiuniene [1]Construction projectsNot specifiedNoYesYesYes
Siew [47]Infrastructure projectsNot specifiedNoYesYesYes
Higham et al. [53]Housing regeneration projectsNot specifiedNoYesYesYes
Siew et al. [54]Infrastructure projectsNot specifiedNoYesYes Yes
Chatterjee et al. [55] Infrastructure and industrial projectsNot specifiedYesYesNoNo
Kudratova et al. [4]Not specifiedNot specifiedNoYesNo Yes
AbouHamad and Abu-Hamd [56]Residential and commercial projectsDesign phaseNoYesNo Yes
Ibrahim and Surya [57]Residential and commercial projectsNot specifiedYesYesNoNo
RezaHoseini et al. [9]Not specifiedNot specifiedYesYesYesYes
Ma et al. [58]Manufacturing industryNot specifiedNoYesYesYes
Alyamani and Long [6]Not specifiedNot specifiedYesYesNo No
Jurik et al. [59]Production projectsNot specifiedNoYesYesYes
Dobrovolskiene et al. [60]Real Estate ProjectsNot specifiedYesYesYesYes
Abdullah et al. [61]Industrial projectsConstruction phaseNoYesYesYes
Alam Bhuiyan and Hammad [62]Residential projectsDesign and engineering phaseYesYesYesYes
Rahimi et al. [63]Industrial projectsConstruction and operation phaseNoYesYesYes
Table 2. Summary of sustainability evaluation criteria based on literature review (high repetition).
Primary CriteriaSecondary Criteria (Sub-Criteria)TypeSource(s)Frequency Percentage
Technical Service lifeQuantitative[18,53,56,62,64,65,66]19.4%
Previous experiences and skillsQualitative[6,9,18,52,55,60,67,68,69,70,71]30.5%
EconomicReturn on investment (ROI)Quantitative[4,18,52,55,59,67,70,72,73,74,75,76,77]36.1%
Net present value (NPV)Quantitative[4,18,42,58,65,67,71]19.4%
Profit Quantitative[47,52,56,67,69,71]16.7%
Internal rate of return (IRR)Quantitative[9,18,65,67,71]13.9%
Risk of return (ROR)Quantitative[18,47,50,55,56,67,70,72,74,75,77,78]33.3%
SocialEmployment opportunities/Job opportunity creationQualitative[1,18,58,61,62,63,68,76]22.2%
Potential for health and safety Qualitative[1,9,18,47,52,58,60,67,68,71,79]30.5%
Community development/improving the life quality Qualitative[9,60,65,68]11.1%
Social acceptance Qualitative[9,61,67,80]11.1%
EnvironmentalEnergy consumption Qualitative or Quantitative[1,9,18,47,52,56,60,67,71,79,80]30.5%
Waste production Qualitative or Quantitative[9,18,47,52,56,60,63,67] 22.2%
Water consumptionQualitative or Quantitative[1,9,18,47,56,58,65,67,68,79]27.8%
GHG emissionsQualitative or Quantitative[1,9,18,47,58,60,62,64,65,67,68,69,79,80,81]41.7%
Land usage (footprint) Qualitative or Quantitative[47,58,61,67,68,81]16.7%
Biodiversity and habitat lossQualitative or Quantitative[4,18,61,65,67]13.9%
Table 3. The final list of sustainability evaluation criteria.
Main CriteriaSub-CriteriaTypeDefinitionMethod of Measurement (Unit)
Technical Service lifeQuantitative (positive) The expected duration or operational lifespan of the project before major refurbishments, replacements, or decommissioning are required. It represents the period during which the project is designed to operate efficiently and reliably.Number of years
Previous experiences and skillsQualitative (positive)The number of previous similar projects conducted plus the knowledge, expertise, and practical understanding developed by individuals through their past work or involvement in the same project or related fields.User input (very high, high, medium, low, very low)
Reliability Qualitative (positive)The overall system reliability—the ability and probability of the project system to continuously operate without interruptions or failures.User input (very high, high, medium, low, very low)
Capacity factorQuantitative (positive)The electrical energy produced by a generating unit for a period of time. It is a measure of how efficiently the plant operates and produces electricity over a specific period, typically a year, and represents the ratio of the actual electrical output of the plant to its maximum potential output.MWhactual/MWhnameplate
EconomicReturn on investment (ROI)Quantitative (positive)The profit or loss generated on an investment relative to the amount of money invested.Amount of USD/MW
Net present value (NPV)Quantitative (positive)The profitability of an investment by calculating the difference between the present value of the expected cash inflows and the present value of the expected cash outflows over a given time period including maintenance and operation cost.Amount of USD/MW
Risk of return (ROR)Quantitative (negative)The expected risk of return is the possibility of earning a lower return on investment than expected or losing part or all of the invested capital.Amount of USD/MW
Capital expenditureQuantitative (negative)The expected cost of capital investment to field development and plant construction prior to Commercial Operation. It refers to the initial investment or spending required to establish, construct, and commission the power-generating plant.Amount of USD/MW
Operational expendituresQuantitative (negative)The fixed and variable expenditures to maintain generation facility output. In other words, it encompasses the ongoing day-to-day expenses associated with operating and maintaining the power-generating plant. These expenses (typically on a monthly or yearly basis) are incurred to keep the plant running, generate electricity, and ensure its reliability and performance over its operational lifespan.Amount of USD/MW
SocialEmployment opportunities/Job opportunity creationQualitative (positive) The potential for the project to create jobs or employment opportunities during the construction phase (rate of recruitment).User input (very high, high, medium, low, very low)
Potential for health and safety Qualitative (positive)The measures to promote and protect public health for the local surrounding area include positive mental and physical health.User input (very high, high, medium, low, very low)
Social acceptance Qualitative (positive)The degree to which a community accepts or supports a project, and their willingness to participate in it or live with its consequences (positive feedback for executing the project in the society).User input (very high, high, medium, low, very low)
EnvironmentalWaste production Quantitative (negative)The total amount of waste produced (water waste and solid waste) by projects for various purposes, such as manufacturing, processing, etc.Amount of waste (m3 of wastewater or ton of solid waste)/MW
Water consumptionQuantitative (negative)The amount of water required by the plant for its operational processes and cooling systems. Amount of water (m3 or gal)/MW
GHG emissionsQuantitative (negative)The total amount of GHG emissions (carbon dioxide (CO2) and methane (CH4) produced by projects and released into the atmosphere contribute to climate change by trapping heat and warming the Earth’s surface. GHG emissions primarily come from the combustion of fossil fuels such as coal, oil, and natural gas. Amount of GHG emission (kg or ton)/MW
Land usage (footprint) Quantitative (negative)The amount of land area affected by human activity or the amount of land occupied by projects including the area used for the plant itself, as well as any associated infrastructure, such as transmission lines and substations.Square meters (m2)
Table 4. Pairwise comparison of criteria.
Importance IndexDefinition of Importance Index
1Equally important preferred
Equally to moderately important preferred
3Moderately important preferred
Moderately to strongly important preferred
5Strongly importantly preferred
Strongly to very strongly important preferred
7Very strongly important preferred
Very strongly to extremely important preferred
9Extremely important preferred
Table 5. Importance index and fuzzy numbers.
Importance IndexCrisp Number Fuzzy   Number   ( l , m , n , p )
Extremely more important97, 8, 9, 10
Very strongly more important75, 6, 7, 8
Strongly more important53, 4, 5, 6
Moderately more important31, 2, 3, 4
Equal importance11, 1, 1, 1
Moderately less important1/31/4, 1/3, 1/2, 1
Strongly less important1/51/6, 1/5, 1/4, 1/3
Very strongly less important1/71/8, 1/7, 1/6, 1/5
Extremely less important1/91/10, 1/9, 1/8, 1/7
Table 6. User preferences matrix.
CriteriaAlternative 1Alternative 2Alternative n
Criteria 1HighHigh M e d i u m
Criteria 2 L o w V e r y   L o w L o w
Criteria 3 M e d i u m M e d i u m M e d i u m
Criteria nVery HighHighVery L o w
Table 7. Trapezoidal membership functions.
NumberLinguistic VariableTrapezoidal Fuzzy Number
abcd
1Very Low1111
3Low1234
5Medium3456
7High5678
9Very High78910
Table 8. Assumption list/hypothetical dataset.
AlternativesQuantitative Criteria
Serv. LifeCap. Fac.ROINPVRORCap. Exp.Oper. Exp. Waste Pro.Water Con.GHG EmissionLand Usage
yrMWh/MWhUSD/MWUSD/MWUSD/MWUSD/MWUSD/MWUSD/MWUSD/MWUSD/MWm2/MW
NG with Hydrogen300.555005000501000400.1 m3/MW × USD 10/m32 m3/MW × USD 5/m320 kg/MW × USD 50/kg 800
NG with Carbon Capture350.75400450055900450.15 m3/MW × USD 10/m33 m3/MW × USD 5/m315 kg/MW × USD 50/kg1200
Wind250.35600620060800350.05 m3/MW × USD 10/m31 m3/MW × USD 5/m35 kg/MW × USD 50/kg2000
Solar200.30700650065700300.02 m3/MW × USD 10/m30.5 m3/MW × USD 5/m32 kg/MW × USD 50/kg10,000
Table 9. A hypothetical numerical dataset for quantitative criterion only for a 200-megawatt power plant.
AlternativesQuantitative Criteria
Serv. LifeCap. Fac.ROINPVRORCap. Exp.Oper. Exp. Waste Pro.Water Con.GHG EmissionLand Usage
yrMWh/MWhUSD/MWUSD/MWUSD/MWUSD/MWUSD/MWUSD/MWUSD/MWUSD/MWm2/MW
NG with Hydrogen300.555005000501000401101000800
NG with Carbon Capture350.75400450055900451.5157501200
Wind250.35600620060800350.552502000
Solar200.30700650065700300.22.510010,000
Table 10. A hypothetical linguistic dataset for qualitative criterion only for a 200-megawatt power plant.
AlternativesQualitative Criteria
Previous Experience and SkillsReliabilityEmployment OpportunitiesPotential for Health and SafetySocial Acceptance
NG with HydrogenHighMediumMediumLowHigh
NG with Carbon CaptureVery highHighLowMediumMedium
WindMediumLowHighHighMedium
SolarLow Very lowVery highVery highVery high
Table 11. Normalized matrix of the hypothetical dataset.
AlternativesQuantitative Criteria
Serv. LifeCap. Fac.ROINPVRORCap. Exp.Oper. Exp. Waste Pro.Water Con.GHG EmissionLand Usage
yrMWh/MWhUSD/MWUSD/MWUSD/MWUSD/MWUSD/MWUSD/MWUSD/MWUSD/MWm2/MW
NG with Hydrogen0.2730.2820.2270.2250.2170.2940.2670.3130.3080.4760.057
NG with Carbon Capture0.3180.3850.1820.2030.2390.2650.3000.4690.4620.3570.086
Wind0.2270.1790.2730.2790.2610.2350.2330.1560.1540.1190.143
Solar0.1820.1540.3180.2930.2830.2060.2000.0630.0770.0480.714
Table 12. Shannon diversity and equitability index.
Quantitative Criteria
Serv. LifeCap. Fac.ROINPVRORCap. Exp.Oper. Exp. Waste Pro.Water Con.GHG EmissionLand Usage
yrMWh/MWhUSD/MWUSD/MWUSD/MWUSD/MWUSD/MWUSD/MWUSD/MWUSD/MWm2/MW
Shannon diversity index1.3651.3211.3651.3751.3821.3781.3751.1821.2051.1190.892
Shannon equitability index0.9850.9530.9850.9920.9970.9940.9920.8530.8690.8070.644
Table 13. Range determination.
Linguistic TermConversion Scale in the Normalized Matrix
Very High (VH)x > 0.583
High (H)0.451 < x < 0.583
Medium (M)0.320 < x < 0.451
Low (L)0.189 < x < 0.320
Very Low (VL)x < 0.189
Table 14. Output of subjective result.
AlternativesQuantitative Criteria
Serv. LifeCap. Fac.ROINPVRORCap. Exp.Oper. Exp. Waste Pro.Water Con.GHG EmissionLand Usage
yrMWh/MWhUSD/MWUSD/MWUSD/MWUSD/MWUSD/MWUSD/MWUSD/MWUSD/MWm2/MW
NG with HydrogenLLLLLLLLLHVL
NG with Carbon CaptureLMVLLLLLHHMVL
WindLVLLLLLLVLVLVLVL
SolarVLVLLLLLLVLVLVLVH
Table 15. Final linguistic dataset (user inputs) for Owner 1.
Main CriteriaSub-CriteriaAlternatives
NG with HydrogenNG with Carbon CaptureWindSolar
Technical Service lifeLowLowLowVery Low
Previous experiences and skillsHighVery HighMediumLow
Reliability MediumHighLowVery Low
Capacity factorLowMediumVery LowVery Low
EconomicReturn on investment (ROI)LowVery LowLowLow
Net present value (NPV)LowLowLowLow
Risk of return (ROR)LowLowLowLow
Capital expenditureLowLowLowLow
Operational expendituresLowLowLowLow
SocialEmployment opportunities MediumLowHighVery High
Potential for health and safety LowMediumHighVery High
Social acceptance HighMediumMediumVery High
EnvironmentalWaste production LowHighVery LowVery Low
Water consumptionLowHighVery LowVery Low
GHG emissionsHigh MediumVery LowVery Low
Land usage Very LowVery LowVery LowVery High
Table 16. Final linguistic dataset (user inputs) for Owner 2.
Main CriteriaSub-CriteriaAlternatives
NG with HydrogenNG with Carbon CaptureWindSolar
Technical Service lifeLowLowLowVery Low
Previous experiences and skillsVery HighHighMediumMedium
Reliability HighVery HighMediumLow
Capacity factorLowMediumVery LowVery Low
EconomicReturn on investment (ROI)LowVery LowLowLow
Net present value (NPV)LowLowLowLow
Risk of return (ROR)LowLowLowLow
Capital expenditureLowLowLowLow
Operational expendituresLowLowLowLow
SocialEmployment opportunities MediumMediumHighHigh
Potential for health and safety LowMediumMediumHigh
Social acceptance MediumHighMediumVery High
EnvironmentalWaste production LowHighVery LowVery Low
Water consumptionLowHighVery LowVery Low
GHG emissionsHigh MediumVery LowVery Low
Land usage Very LowVery LowVery LowVery High
Table 17. Final linguistic dataset (user inputs) for Owner 3.
Main CriteriaSub-CriteriaAlternatives
NG with HydrogenNG with Carbon CaptureWindSolar
Technical Service lifeLowLowLowVery Low
Previous experiences and skillsHighHighMediumLow
Reliability HighHighMediumMedium
Capacity factorLowMediumVery LowVery Low
EconomicReturn on investment (ROI)LowVery LowLowLow
Net present value (NPV)LowLowLowLow
Risk of return (ROR)LowLowLowLow
Capital expenditureLowLowLowLow
Operational expendituresLowLowLowLow
SocialEmployment opportunities LowLowMediumMedium
Potential for health and safety MediumMediumHighHigh
Social acceptance MediumMediumLowHigh
EnvironmentalWaste production LowHighVery LowVery Low
Water consumptionLowHighVery LowVery Low
GHG emissionsHigh MediumVery LowVery Low
Land usage Very LowVery LowVery LowVery High
Table 18. Weightage distribution for main criteria.
Main CriteriaOwner 1Owner 2Owner 3
Technical 30%25%20%
Economic30%25%40%
Social10%25%20%
Environmental30%25%20%
Table 19. Weightage distribution for sub-criteria.
Main CriteriaSub-CriteriaOwner 1Owner 2Owner 3
Technical Service life25%20%15%
Previous experiences and skills30%30%30%
Reliability 30%30%25%
Capacity factor15%20%30%
EconomicReturn on investment (ROI)30%35%25%
Net present value (NPV)30%35%35%
Risk of return (ROR)10%10%15%
Capital expenditure15%10%10%
Operational expenditures15%10%15%
SocialEmployment opportunities 30%25%20%
Potential for health and safety 40%50%50%
Social acceptance 30%25%30%
EnvironmentalWaste production 15%10%10%
Water consumption15%20%15%
GHG emissions40%45%50%
Land usage 30%25%25%
Table 20. Ranking of one stakeholder (Owner 1) using fuzzy TOPSIS (di* is distance from FPIS and di- is distance from FNIS).
Alternativesdi*di-CCiRank
NG with Hydrogen0.84741.00500.54251
NG with Carbon Capture1.32151.43790.52112
Wind1.74430.96940.35744
Solar1.35051.35440.50073
Table 21. The ultimate composite results of the three owners based on CCi.
CCi (Owner 1)CCi (Owner 2)CCi (Owner 3)Weighted CCiRank
Importance of Opinion0.350.300.35
Alternatives
NG with Hydrogen0.54250.35600.64010.52072
NG with Carbon Capture0.52110.43520.64920.54021
Wind0.35740.27720.42230.35614
Solar0.50070.55590.37580.47353
Table 22. Weightage distribution for main criteria for the first scenario.
Main CriteriaOwner 1Owner 2Owner 3
Technical 20%20%30%
Economic65%70%30%
Social5%5%5%
Environmental10%5%35%
Table 23. Weightage distribution for sub-criteria for first scenario.
Main CriteriaSub-CriteriaOwner 1Owner 2Owner 3
Technical Service life20%20%30%
Previous experiences and skills15%15%25%
Reliability 15%25%40%
Capacity factor50%40%5%
EconomicReturn on investment (ROI)40%35%5%
Net present value (NPV)10%15%5%
Risk of return (ROR)15%10%50%
Capital expenditure25%25%30%
Operational expenditures10%15%10%
SocialEmployment opportunities 10%15%5%
Potential for health and safety 50%45%85%
Social acceptance 40%40%10%
EnvironmentalWaste production 10%10%1%
Water consumption10%10%20%
GHG emissions60%55%70%
Land usage 20%25%9%
Table 24. The individual and ultimate composite results of the three owners based on CCi for first scenario.
Owner 1Owner 2Owner 3Weighted CCiRank
Importance of Opinion0.500.250.25
CCiRankCCi RankCCiRank
Alternatives
NG with Hydrogen0.364830.297630.431930.36483
NG with Carbon Capture0.506120.408020.522510.48572
Wind0.346940.260840.340040.32374
Solar0.515310.582210.498020.52781
Table 25. User preferences for qualitative criteria based on expert opinions (first and second owners).
AlternativesQualitative Criteria
Previous Experience and SkillsReliabilityEmployment OpportunitiesPotential for Health and SafetySocial
Acceptance
NG with HydrogenMediumHighVery HighMediumMedium
NG with Carbon CaptureLowMediumVery HighMediumMedium
WindVery HighHighMediumVery LowHigh
SolarHighVery HighMediumVery LowHigh
Table 26. User preferences for qualitative criteria based on expert opinions (third owner).
AlternativesQualitative Criteria
Previous Experience and SkillsReliabilityEmployment OpportunitiesPotential for Health and SafetySocial
Acceptance
NG with HydrogenVery LowMediumVery HighMediumMedium
NG with Carbon CaptureVery LowHighVery highMediumVery High
WindVery HighVery HighMediumHighLow
SolarVery HighVery HighLowHighLow
Table 27. The individual and ultimate composite results of the three owners based on CCi for the second scenario.
Owner 1Owner 2Owner 3Weighted CCiRank
Importance of Opinion0.500.250.25
CCiRankCCi RankCCiRank
Alternatives
NG with Hydrogen0.389640.276940.262340.32964
NG with Carbon Capture0.396730.307730.413030.37853
Wind0.442420.363620.481520.43252
Solar0.557610.640310.581810.58431
Table 28. The individual and ultimate composite results of the three owners based on CCi for the third scenario.
Owner 1Owner 2Owner 3Weighted CCiRank
Importance of Opinion0.500.250.25
CCiRankCCi RankCCiRank
Alternatives
NG with Hydrogen0.389640.262340.276940.32964
NG with Carbon Capture0.396730.413030.307730.37853
Wind0.442420.481520.363620.43252
Solar0.557610.581810.640310.58431
Disclaimer/Publisher’s Note: The statements, opinions and data contained in all publications are solely those of the individual author(s) and contributor(s) and not of MDPI and/or the editor(s). MDPI and/or the editor(s) disclaim responsibility for any injury to people or property resulting from any ideas, methods, instructions or products referred to in the content.

