
Spatiotemporal Differences in Marine Environment Quality in China and the Influencing Factors

 ,
,
Abstract
:1. Introduction
2. Study Design and Methods
2.1. Study Area
2.2. Indicator System Construction
2.3. Research Methods
2.3.1. Data Standardization Processing
2.3.2. Entropy Method
2.3.3. Theil Index
2.3.4. Geographic Detector
3. Empirical Analysis
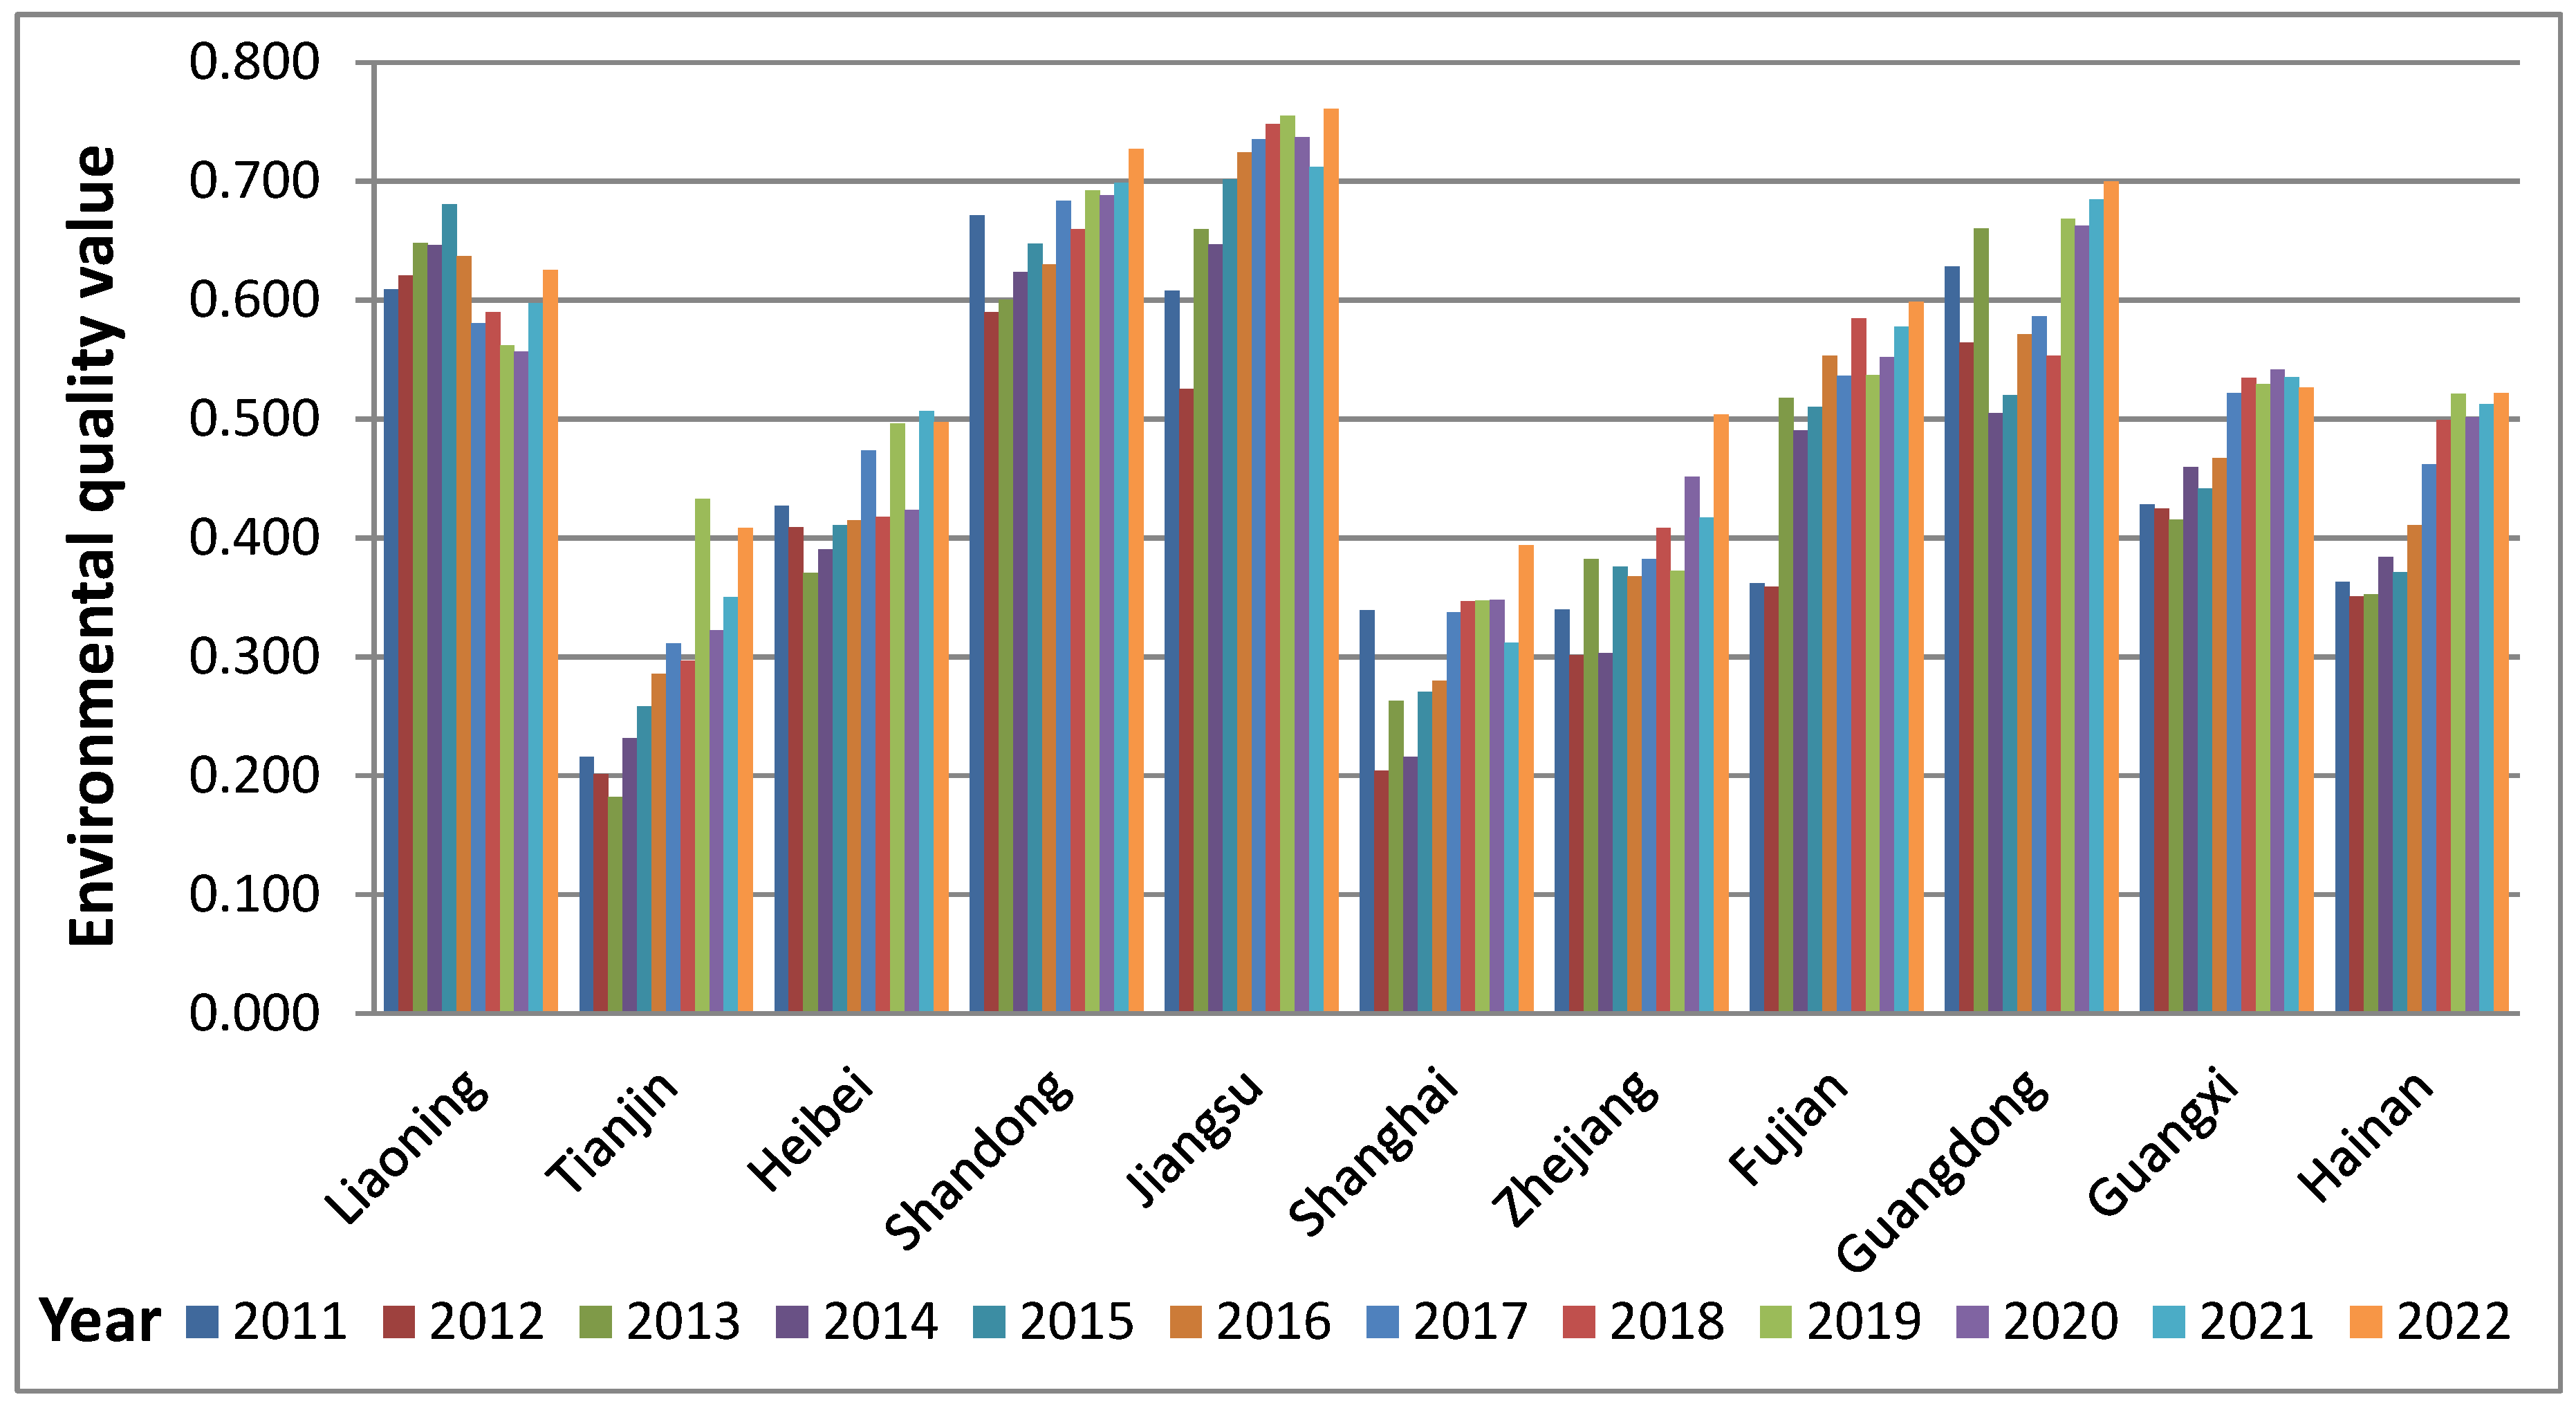
3.1. Analysis of Temporal Evolution of MEQ
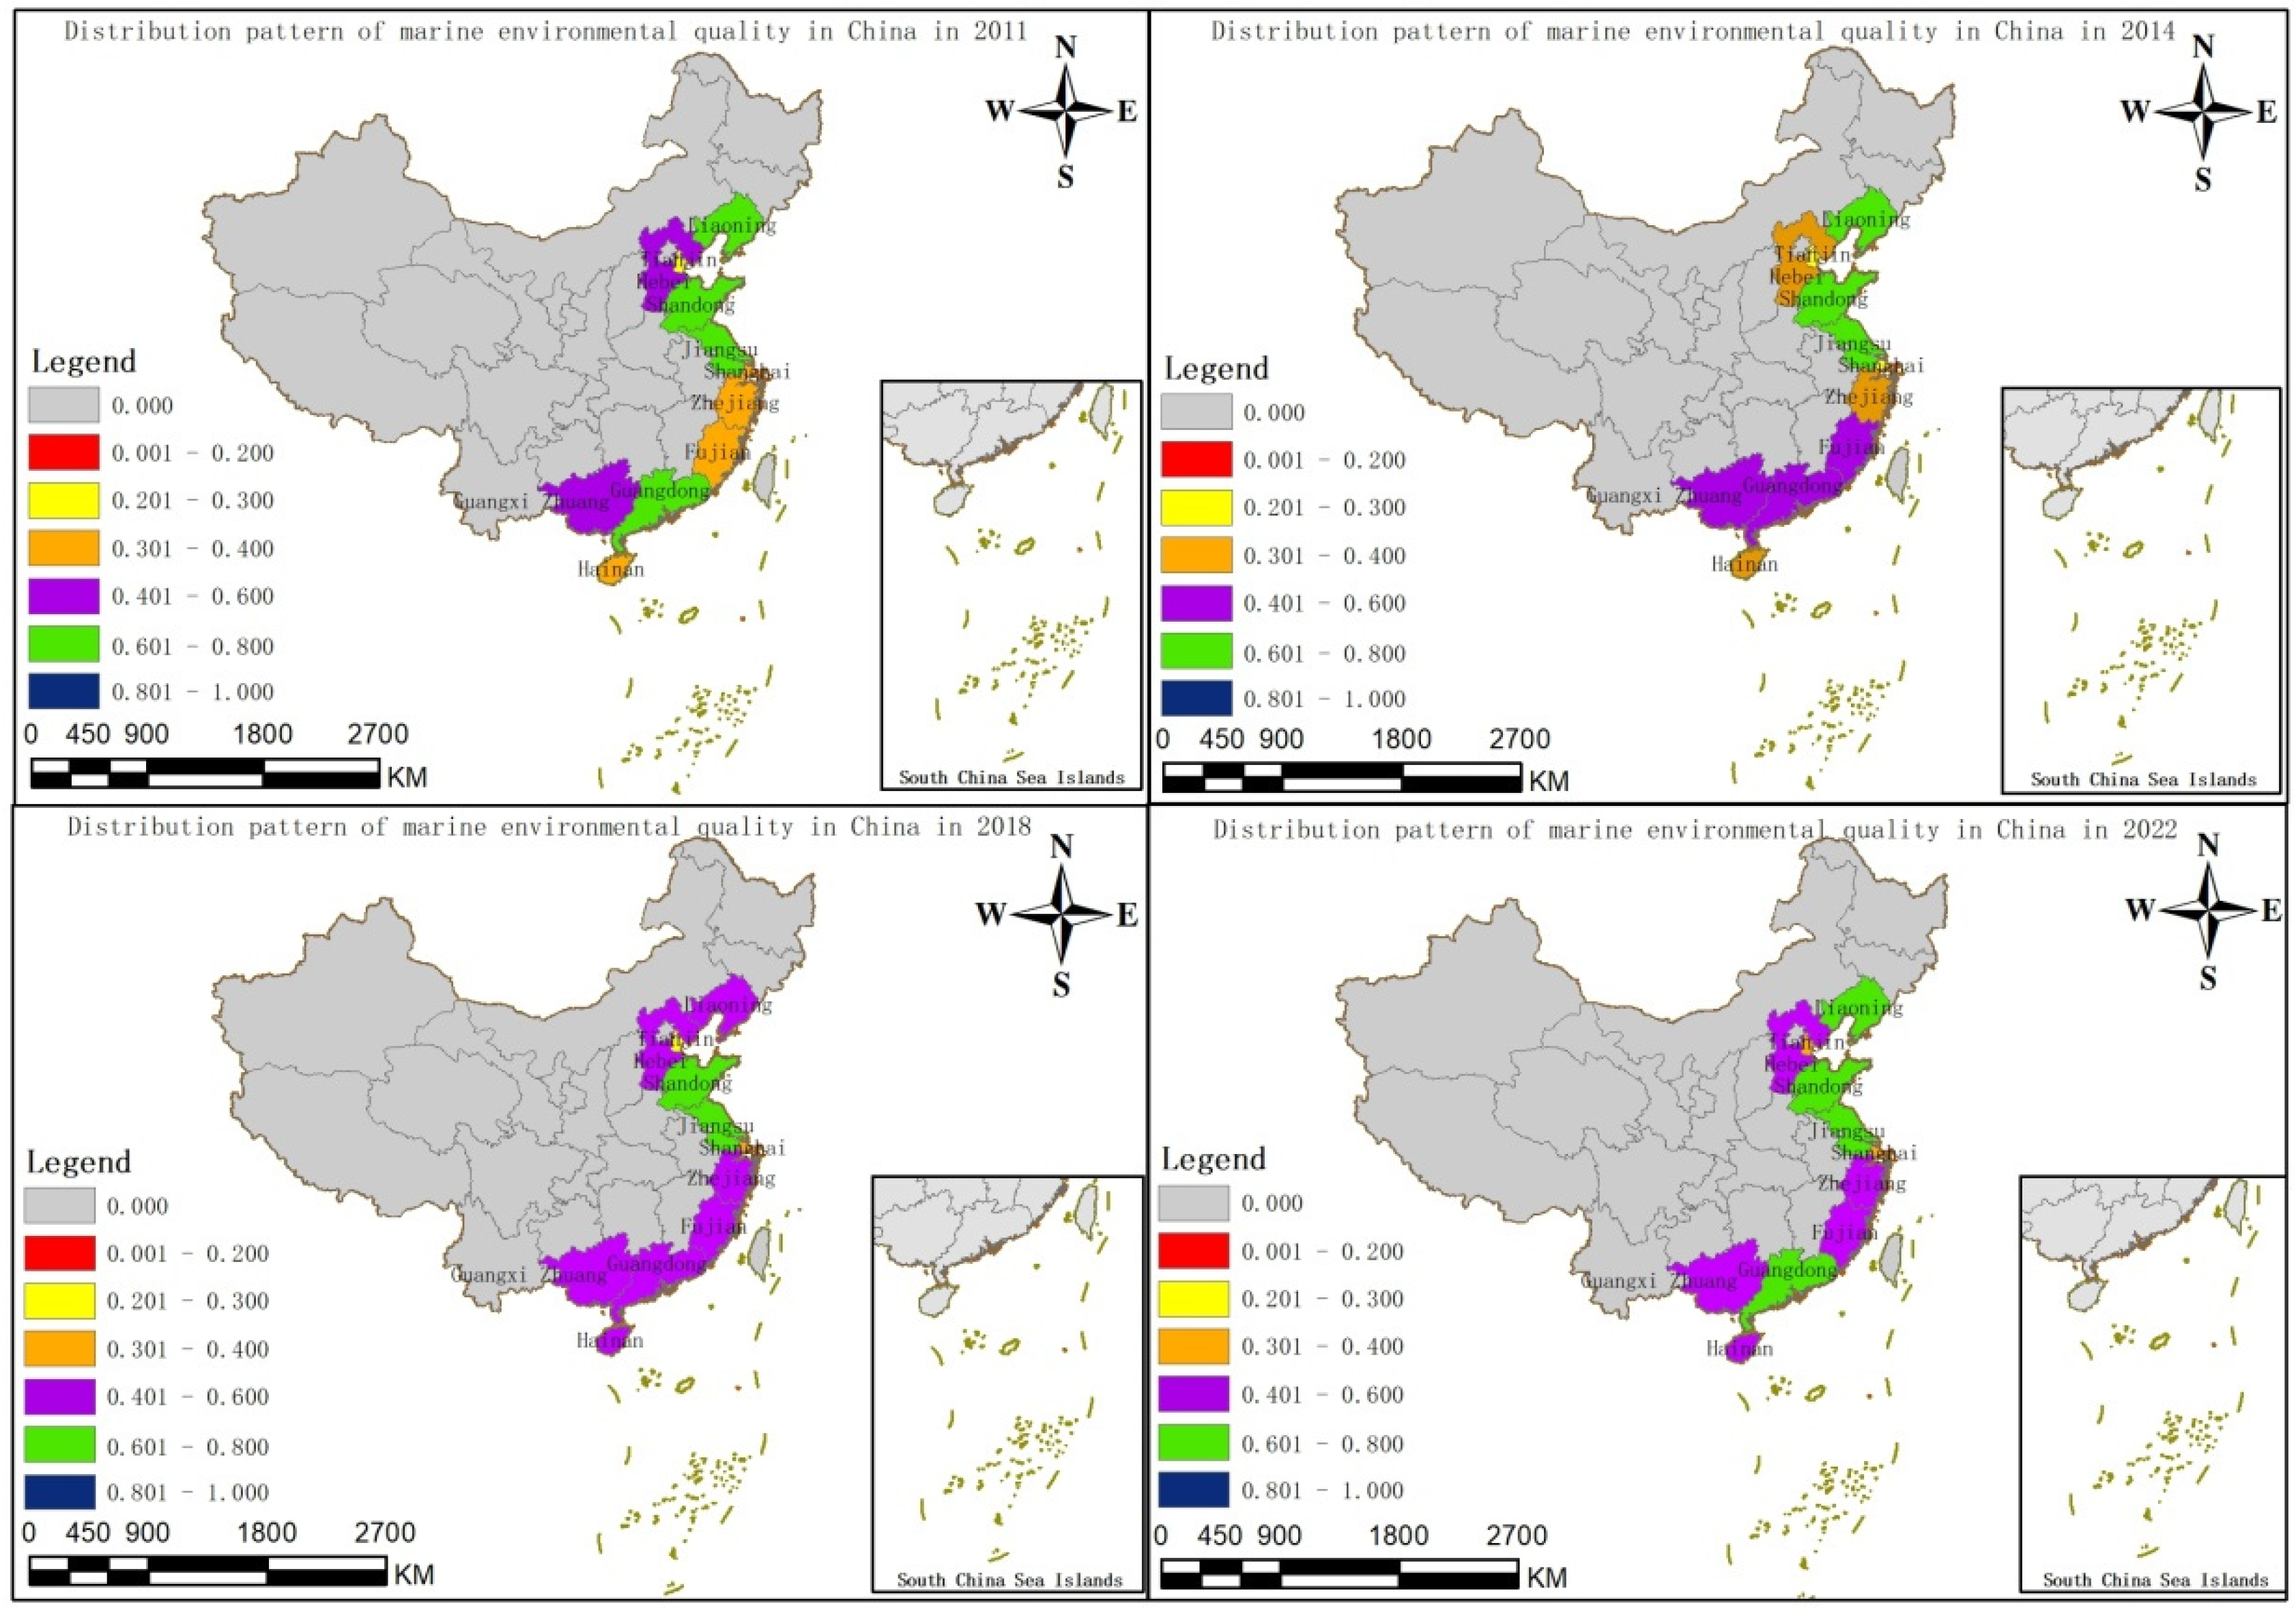
3.2. Analysis of Spatial Differences in MEQ
4. Differences in Regional MEQ
5. Factors Affecting MEQ
5.1. Indicator Selection
5.2. Driving Factor Analysis
5.3. Driver Interaction Detection
6. Discussion
7. Conclusions and Suggestions
7.1. Conclusions
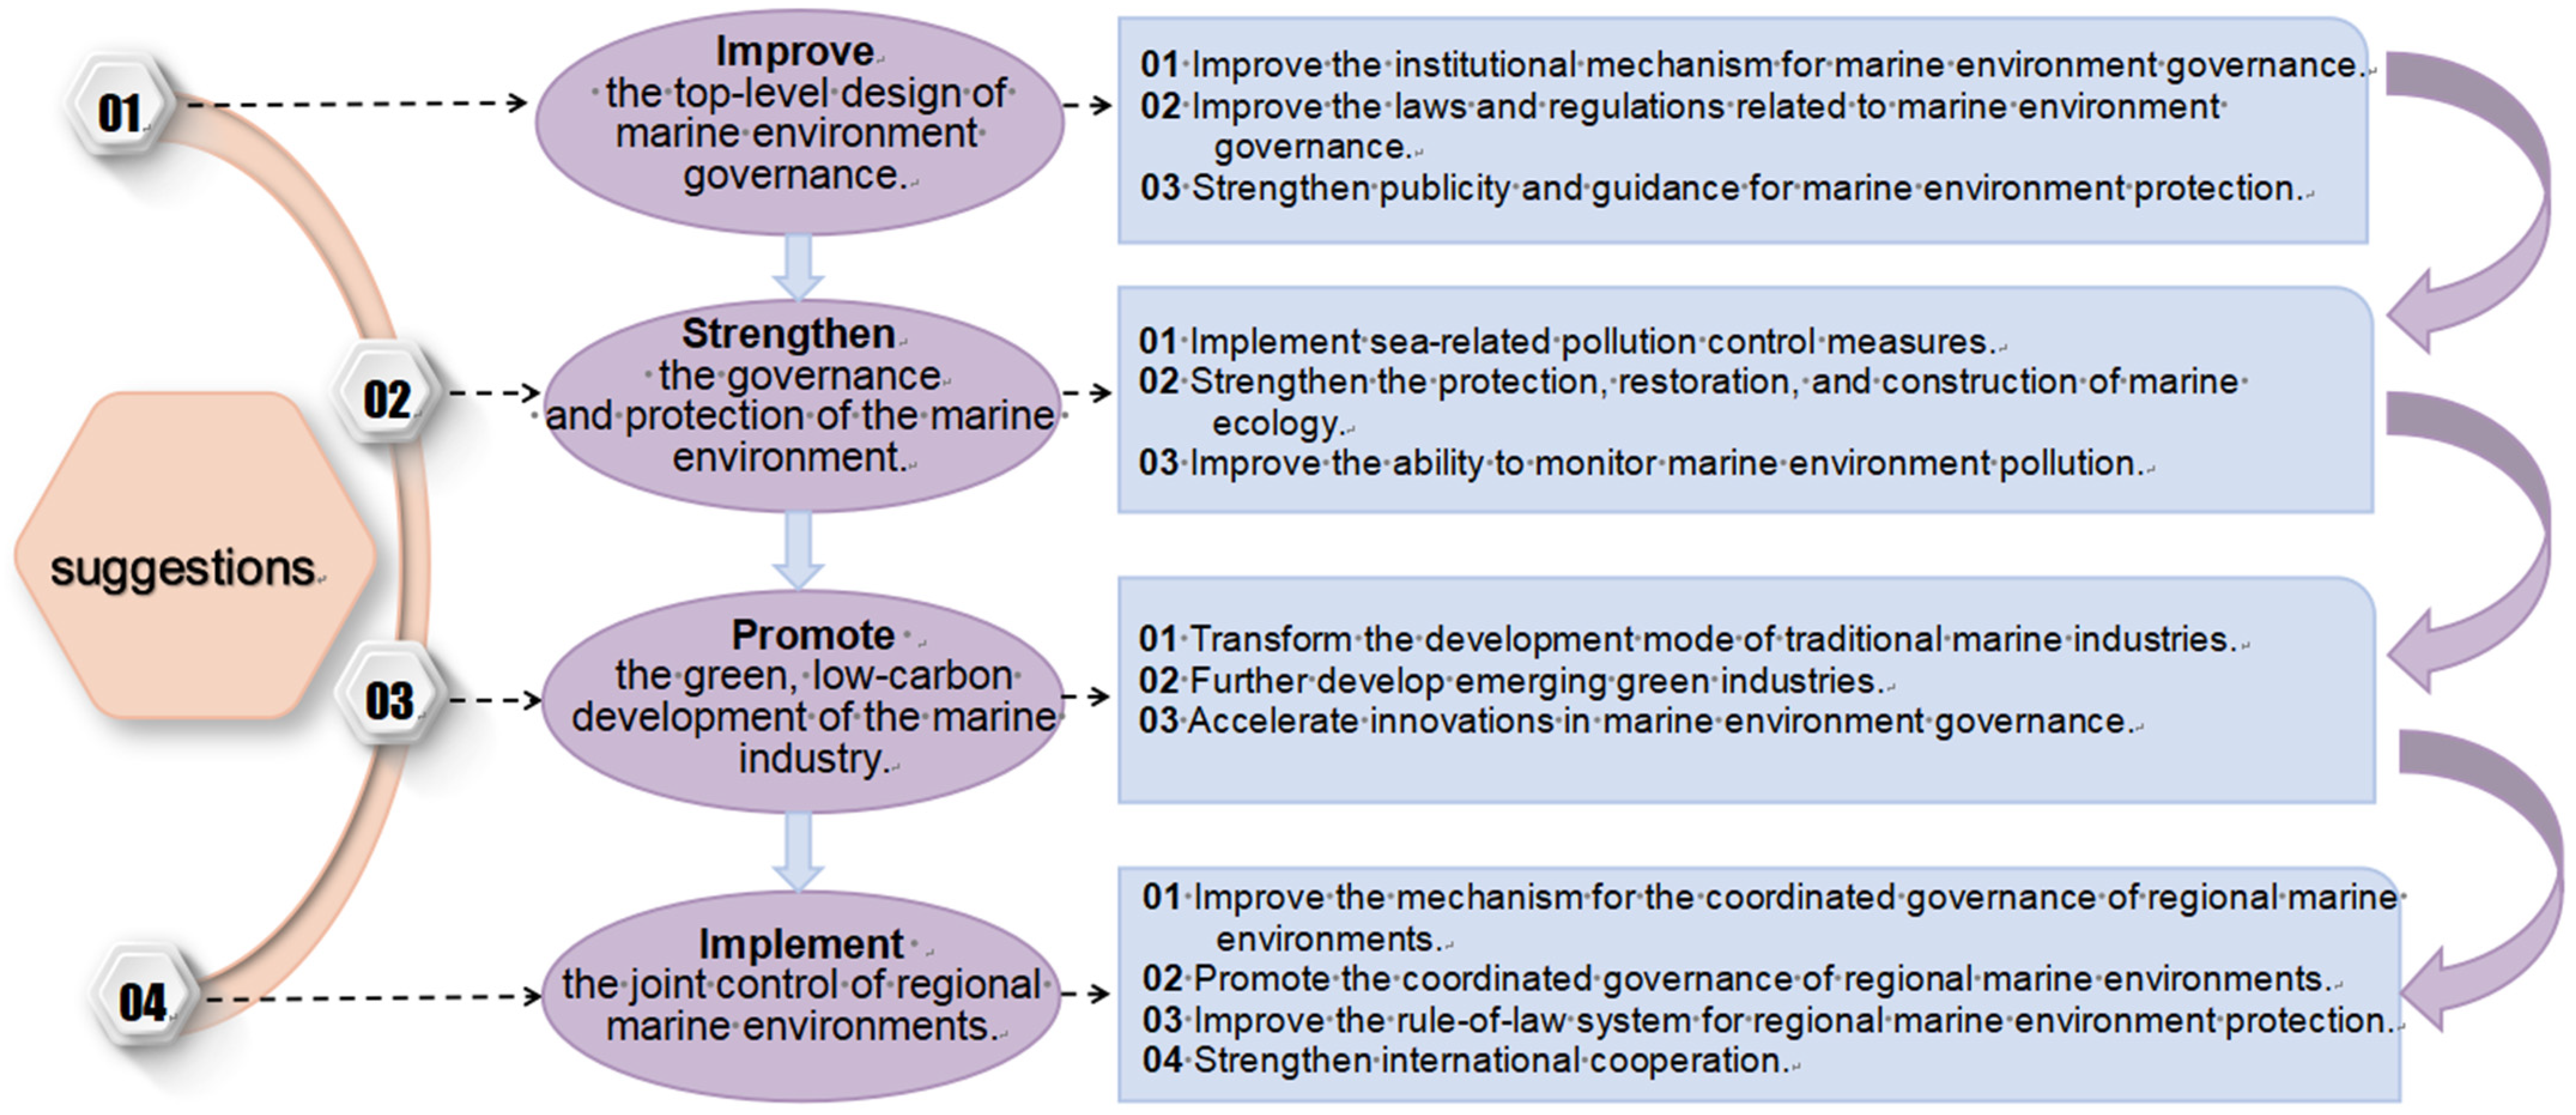
7.2. Suggestions
Author Contributions
Funding
Institutional Review Board Statement
Informed Consent Statement
Data Availability Statement
Acknowledgments
Conflicts of Interest
References
- WOA. The Second Global Marine Comprehensive Assessment Report [EB/OL]. Available online: https://www.un.org/regularprocess/ (accessed on 20 January 2024).
- United Nations Environment Programme News Office. United Nations Environment Programme: The Severity of Marine Plastic Pollution Urgently Requires Global Emergency Action [EB/OL]. Available online: https://huanbao.bjx.com.cn/news/20211022/1183227.shtml (accessed on 10 March 2024).
- Zhang, Z.; Gen, S.; Xu, S.; Dong, M.; Song, X.; Fan, Z. Design and Realization of Statistical Analysis System of Marine Environment Based on GIS. Geospat. Inf. 2023, 21, 130–133. [Google Scholar]
- Li, Z.; Zuo, X.; Teng, J. GIS-based temporal and spatial patterns of red tieds in the coastal waters of China from 1950–2020. Acta Sci. Circumstantiae 2023, 43, 203–214. [Google Scholar] [CrossRef]
- Roselli, L.; Caroppo, C.; Bevilacqua, S.; Ciciriello, P.C.; Ungaro, N.; Vadrucci, M.R. Harmful algae and pressure-impact relationship: Noxious blooms and toxic microalgae occurrence from coastal waters of the Apulia region (Adriatic and Ionian Seas, Mediterranean). Mar. Environ. Res. 2022, 183, 105791. [Google Scholar] [CrossRef] [PubMed]
- He, X.; Chen, C.; Lu, C.; Wang, L.; Chen, H. Spatial-temporal distribution of red tide in coastal China//IOP Conference Series: Earth and Environmental Science. In Proceedings of the 2nd International Conference on Geology, Mapping and Remote Sensing, Zhangjiajie, China, 23–25 April 2021; IOP Publishing Ltd.: Bristol, UK, 2021; Volume 783, p. 012141. [Google Scholar]
- Ke, L.; Zhang, Y.; Han, X.; Wang, H.; Wang, Q.; Eang, L. Variable Fuzzy Recognition Model of Seawater Environmental Quality Based on GIS Modeling Technique. Sci. Geogr. Sin. 2017, 37, 1251–1258. [Google Scholar] [CrossRef]
- Ke, L.; Wang, Q.; Sun, X.; Sun, C.; Zhou, H.; Wang, F. The seawater environment quality evaluation research base on variable fuzzy pattern recognition model. Acta Ecol. Sin. 2013, 33, 1889–1899. [Google Scholar] [CrossRef]
- Gao, S.; Zhao, L.; Sun, H.; Gao, G.; Liu, W. Evaluation and Driving Force Analysis of Marine Sustainable Development based on the Grey Relational Model and Path Analysis. J. Resour. Ecol. 2020, 11, 570–579. [Google Scholar] [CrossRef]
- Shen, S.; Niu, E.; Meng, B. Evaluation of ecological environment carrying capacity in coastal waters of Liaoning based on Grey relation. J. Dalian Marit. Univ. 2017, 43, 112–118. [Google Scholar] [CrossRef]
- Rand, P.S.; Berejikian, B.A.; Bidlack, A.; Bottom, D.; Gardner, J.; Kaeriyama, M.; Lincoln, R.; Nagata, M.; Pearsons, T.N.; Schmidt, M.; et al. Ecological interactions between wild and hatchery salmonids and key recommendations for research and management actions in selected regions of the North Pacific. Environ. Biol. Fishes 2012, 94, 343–358. [Google Scholar] [CrossRef]
- Wang, F.; Xia, Z.; Guo, Y.; Yang, Z.; Li, J.; Chen, Y. Water quality inversion and eutrophication assessment of The South China Sea based on GEE. China Environ. Sci. 2022, 42, 826–833. [Google Scholar] [CrossRef]
- Shan, V.; Singh, S.K.; Haritash, A.K. Evaluation of water quality and potential metal contamination in ecologically important Bhindawas bird sanctuary, India. Appl. Water Sci. 2021, 11, 8. [Google Scholar] [CrossRef]
- Shi, W.; Huang, S.; Li, X. Efficiency Evaluation of Rural Domestic Wastewater Treatment Based on SBM-DEA and Cloud Model: An Analysis of Panel Data from 27 Provinces in China (2011–2020). Ecol. Econ. 2024. Available online: https://link.cnki.net/urlid/53.1193.f.20240201.1038.002 (accessed on 20 March 2024).
- Tone, K. A slacks-based measure of super-efficiency in data envelopment analysis. Eur. J. Oper. Res. 2002, 143, 32–41. [Google Scholar] [CrossRef]
- Thushari, G.G.N.; Senevirathna, J.D.M. Plastic pollution in the marine environment. Heliyon 2020, 6, e04709. [Google Scholar] [CrossRef] [PubMed]
- Kildow, J.T.; Mcllgorm, A. The importance of estimating the contribution of the oceans to national economies. Mar. Policy 2010, 2, 367–374. [Google Scholar] [CrossRef]
- Qin, H.; Tang, N. EKC Model Testing of the Relationship between Marine Economic Growth and Marine Environmental Pollution. Contemp. Econ. 2009, 17, 158–159. [Google Scholar]
- Zheng, Y. Evaluation and Analysis of Marine Economic and Environmental Performance in Coastal Areas of China. Mar. Econ. 2014, 4, 13–19. [Google Scholar]
- Luo, Y.; Chen, X. Research on the Performance Evaluation of Marine Economy and Environment in the Eastern Coastal Areas of China. Ocean Dev. Manag. 2016, 51–54. [Google Scholar]
- Lei, F.; Chen, X. Evaluation of summer marine environmental quality in the coastal waters of the Beibu Gulf. Guangxi Sci. 2014, 21, 84–88. [Google Scholar]
- Wang, H.; Zhu, J. Assessment of Marine Environmental Quality in the Yalong Bay Area. Environ. Dev. 2017, 10, 30–31. [Google Scholar]
- Wang, Y.; Mou, X. Preliminary Study on the Status of Marine Ecological Environment and Pollution Prevention and Control Strategies in Laizhou Bay. Mar. Environ. Sci. 2020, 40, 824–831. [Google Scholar]
- Du, Y.-W.; Fang, J.; Wang, P. Ecological Security Evaluation of Marine Ranching Based on DEMATEL-Fuzzy Comprehensive Evaluation. Math. Probl. Eng. 2021, 2021, 6688110. [Google Scholar] [CrossRef]
- Vincent, C.; Heinrich, H.; Edwards, A.; Nygaard, K.; Haythornthwaite, J. Guidance on typology, reference conditions and classification systems for transitional and coastal waters. CIS Work. Group 2002, 2, 119. [Google Scholar]
- Office of Research and Development, Office of Water, U.S. Environmental Protection Agency. National Coastal Condition Report IV(EPA-842-R-10-003); U.S. Environmental Production Agency: Washington, DC, USA, 2012.
- Abid, N.; Ikram, M.; Wu, J.; Ferasso, M. Towards environmental sustainability: Exploring the nexus among ISO 14001, governance indicators and green economy in Pakistan. Sustain. Prod. Consum. 2021, 27, 653–666. [Google Scholar] [CrossRef]
- Sanfilippo, M.; Albano, M.; Manganaro, A.; Capillo, G.; Spanò, N.; Savoca, S. Spatiotemporal Organic Carbon Distribution in the Capo Peloro Lagoon (Sicily, Italy) in Relation to Environmentally Sustainable Approaches. Water 2022, 14, 108. [Google Scholar] [CrossRef]
- Yang, Y.; Wang, Y.; Gao, W. Research on the Coupling Relationship between Land Economic Development and Marine Environment in Hebei Province. Ecol. Sci. 2010, 3, 102–109. [Google Scholar]
- Gou, L.; Wang, H.; Wang, Y. Study on the Coupling between the Evolution of Marine Industrial Structure and Ecological Environment System in Shandong Province. East China Econ. Manag. 2015, 4, 29–33. [Google Scholar]
- Hoagland, K. Accounting for Marine Economic Activities in Large Marine Ecosystems. Ocean Coast. Manag. 2008, 51, 246–258. [Google Scholar] [CrossRef]
- Zhao, X.; Zhao, R.; Chen, H. Analysis of the spatiotemporal pattern evolution of China’s marine green economy efficiency based on the NSBM-Malmquist model. Mar. Environ. Sci. 2018, 37, 175–181. [Google Scholar]
- He, L.; Chen, X. Empirical Study on the Impact of Marine Environmental Pollution on Marine Economic Development Based on Panel Data. Ocean. Dev. Manag. 2018, 35, 17–21. [Google Scholar]
- Garmendia, E.; Gamboa, G.; Franco, J.; Garmendia, J.M.; Liria, P.; Olazabal, M. Social multicriteria evaluation as a decision support tool for integrated coastal zone management. Ocean Coast. Manag. 2010, 7, 385–403. [Google Scholar] [CrossRef]
- Wang, L.; Li, J. Research on the use of GIS technology for marine environmental quality assessment. Mar. Environ. Sci. 2003, 22, 43–49. [Google Scholar]
- Khim, J.S.; Hong, S.; Yoon, S.J.; Nam, J.; Ryu, J.; Kang, S.-G. A comparativereview and analysis of tentative ecological quality objectives (EcoQOs) for protection of marine environments in Korea and China. Environ. Pollut. 2018, 242, 2027–2039. [Google Scholar] [CrossRef] [PubMed]
- Han, B.; Wang, B. Evaluation of comprehensive evaluation methods for ecological environment quality in estuaries and coastal waters. Prog. Mar. Sci. 2006, 2, 254–258. [Google Scholar]
- Song, H. Analysis of Marine Planktonic and Benthic Biodiversity in Laizhou Bay. Mar. Environ. Sci. 2015, 3, 66–70. [Google Scholar]
- Han, J. Study on the Evolution and Driving Factors of Environmental Quality in China’s Coastal Waters. Resour. Environ. 2019, 35, 1133–1143. [Google Scholar]
- Gai, M.; Zhan, Y. Spatial Evolution of Marine Ecological Efficiency and Its Influential Factors in China Coastal Regions. Sci. Geogr. Sin. 2019, 39, 616–625. [Google Scholar] [CrossRef]
- Di, Q.; Liang, Q. Spatio-temporal Difference of Marine Eco-efficiency and Identification of Its Response Relationship with Marine Industrial Structure in China. Scientia Geogr. Sin. 2018, 38, 1606–1615. [Google Scholar] [CrossRef]
- Caizhi, S.; Song, W.; Wei, Z. Eatimating the efficiency of complex marine systems in China’s coastal regions using a nework Data Envelope Analysis model. Ocean Coast. Manag. 2017, 139, 77–91. [Google Scholar]
- Yang, Y. Study on the spatiotemporal evolution and influencing factors of marine ecological environment efficiency in coastal areas of China. J. Ocean Univ. China (Soc. Sci. Ed.) 2021. [Google Scholar]
- Ying, W.; Chen, X. Natural resource endowment and ecological efficiency in China: Revisiting resource curse in the context of ecological efficiency. Resour. Policy 2020, 66, 101610. [Google Scholar] [CrossRef]
- Shannon, C.E. A mathematical theory of communication. Bell Syst. Tech. J. 1948, 27, 379–423. [Google Scholar] [CrossRef]
- Barberi, E.; Cucinotta, F.; Forssén, P.-E.; Sfravara, F. DECI: A Differential Entropy-Based Compactness Index for Point Clouds Analysis: Method and Potential Applications. Eng. Proc. 2023, 56, 273. [Google Scholar] [CrossRef]
- Gupta, M.; Srivastava, S. Parametric Bayesian Estimation of Differential Entropy and Relative Entropy. Entropy 2010, 12, 818–843. [Google Scholar] [CrossRef]
- Carrazana-Escalona, R.; Sánchez-Hechavarría, M.E.; Ávila, A. Theil Entropy as a Non-Lineal Analysis for Spectral Inequality of Physiological Oscillations. Entropy 2022, 24, 370. [Google Scholar] [CrossRef] [PubMed]
- Wang, J.; Xu, C. Geographic Detectors: Principles and Prospects. J. Geogr. 2017, 72, 116–134. [Google Scholar]
- Ning, L.; Zheng, W.; Zeng, L. Evaluation of Carbon Emission Efficiency and Analysis of Influencing Factors in China’s Provinces from 2007 to 2016- Two Stage Analysis Based on Superefficiency SBM-Tobit Model. J. Peking Univ. (Nat. Sci. Ed.) 2021, 57, 181–188. [Google Scholar] [CrossRef]
- Wang, K.; Li, Z.; Zhou, J. The effects of environmental regulation on spatio-temporal carbon emissions patterns: Empirical analysis of prefecture-level cities in Northeast China. J. Nat. Resour. 2020, 35, 343–357. [Google Scholar] [CrossRef]
- Song, Z.; Ning, L. Evaluation and obstacle factors of marine resources and environment carrying capacity of coastal provinces and cities in China based on DPSIR-TOPSIS model. Ecol. Econ. 2020, 36, 154–160. [Google Scholar]
- Chen, X.; Qian, W. Effect of marine environmental regulation on the industrial structure adjustment of manufac- turing industry: An empirical analysis of China’s eleven coastal provinces. Mar. Policy 2020, 113, 103797. [Google Scholar] [CrossRef]
- Christopher, P.; Ian, O. Developing marine historic environment management policy: The English Heritage experience. Mar. Policy 2014, 45, 342–348. [Google Scholar] [CrossRef]
- Rubashkina, Y.; Galeotti, M.; Verdolini, E. Environmental regulation and competitiveness: Empirical evidence on the Porter Hypothesis from European manufacturing sectors. Energy Policy 2015, 83, 288–300. [Google Scholar] [CrossRef]
- Shafiei, S.; Salim, R.A. Non-renewable and renewable energy consumption and CO2 emissions in OECD countries: A comparative analysis. Energy Policy 2014, 66, 547–556. [Google Scholar] [CrossRef]
- United Nations Environment Programme. From Pollution to Solution: A Global Assessment of Marine Litter and Plastic Pollution; United Nations Environment Programme: Nairobi, Kenya, 2022; ISBN 978-92-807-3881-0. Available online: https://www.unep.org/ (accessed on 2 March 2024).
- Shahzad SJ, H.; Kumar, R.R.; Zakaria, M.; Hurr, M. Carbon emission, energy consumption, trade openness and financial development in Pakistan: A revisit. Renew. Sustain. Energy Rev. 2017, 70, 185–192. [Google Scholar] [CrossRef]
- Zhang, Y.; Lin, X. Research on the Development Trend of South Africa’s Marine Economy. Mar. Econ. 2021, 113–123. [Google Scholar] [CrossRef]
- European Environment Agency. Europe’s Seas Face Uncertain Future If Urgent, Coherent Action Not Taken. 25 June 2020. Available online: https://www.eea.europa.eu/highlights/europes-seas-face-uncertain-future (accessed on 7 April 2024).
- Caroline, K.; Zafar, A. Strategies for Sustainable coastal management in Asia and the Pacific-perspectives from a regional initiative. UNU Mon. Glob. Environ. Change 2002, 12, 139–142. [Google Scholar]
- UNEP. Valuing Plastics: The Business Case for Measuring, Managing and Disclosing Plastic Use in the Consumer Goods Industry. 2014. Available online: https://wedocs.unep.org/handle/20.500.11822/9238 (accessed on 7 April 2024).


| Target Layer | Rule Layer | Weight | Index Layer | Index (Positive/Negative) | Weight |
|---|---|---|---|---|---|
| MEQ level | Marine water environment quality (MWEQ) | 0.4311 | Relative perennial changes in sea level (millimeters) | Negative | 0.0835 |
| Proportion of nearshore Class I and II water quality (%) | Positive | 0.1039 | |||
| Nearshore and coastal areas (km2) | Positive | 0.1860 | |||
| Seawater-rich oxidation index | Negative | 0.0451 | |||
| Annual average number of fecal coliform bacteria in water bodies (number/liter) | Negative | 0.0126 | |||
| Marine ecological environment quality (MEEQ) | 0.5689 | The proportion of the first type of marine sediment quality standard (%) | Positive | 0.0431 | |
| Phytoplankton diversity index | Positive | 0.0826 | |||
| Zooplankton diversity index | Positive | 0.0370 | |||
| Benthic biodiversity index | Positive | 0.1652 | |||
| Coastal wetland area (1000 hectares) | Positive | 0.2409 |
| Interaction Type | Judgment Criteria |
|---|---|
| Single-factor nonlinear attenuation | |
| Double-factor enhancement | |
| Nonlinear attenuation | |
| Nonlinear enhancement | |
| Mutual independence |
| Province | Liaoning | Tianjin | Hebei | Shandong | Jiangsu | Shanghai | Zhejiang | Fujian | Guangdong | Guangxi | Hainan | Mean Value | |
|---|---|---|---|---|---|---|---|---|---|---|---|---|---|
| Year | |||||||||||||
| 2011 | 0.609 | 0.216 | 0.427 | 0.671 | 0.608 | 0.339 | 0.340 | 0.362 | 0.628 | 0.429 | 0.363 | 0.454 | |
| 2012 | 0.620 | 0.202 | 0.409 | 0.590 | 0.525 | 0.204 | 0.301 | 0.359 | 0.564 | 0.425 | 0.351 | 0.414 | |
| 2013 | 0.648 | 0.182 | 0.370 | 0.600 | 0.659 | 0.263 | 0.382 | 0.518 | 0.660 | 0.416 | 0.353 | 0.459 | |
| 2014 | 0.646 | 0.231 | 0.390 | 0.624 | 0.647 | 0.216 | 0.303 | 0.490 | 0.505 | 0.460 | 0.384 | 0.445 | |
| 2015 | 0.681 | 0.259 | 0.411 | 0.647 | 0.702 | 0.271 | 0.376 | 0.510 | 0.520 | 0.442 | 0.371 | 0.472 | |
| 2016 | 0.637 | 0.286 | 0.415 | 0.630 | 0.724 | 0.280 | 0.368 | 0.553 | 0.571 | 0.467 | 0.411 | 0.486 | |
| 2017 | 0.580 | 0.311 | 0.473 | 0.683 | 0.735 | 0.337 | 0.382 | 0.536 | 0.587 | 0.522 | 0.462 | 0.510 | |
| 2018 | 0.590 | 0.297 | 0.418 | 0.660 | 0.748 | 0.347 | 0.409 | 0.584 | 0.553 | 0.534 | 0.499 | 0.513 | |
| 2019 | 0.562 | 0.433 | 0.496 | 0.692 | 0.755 | 0.347 | 0.372 | 0.537 | 0.669 | 0.529 | 0.521 | 0.538 | |
| 2020 | 0.557 | 0.322 | 0.423 | 0.688 | 0.737 | 0.348 | 0.451 | 0.552 | 0.663 | 0.541 | 0.502 | 0.526 | |
| 2021 | 0.598 | 0.350 | 0.507 | 0.699 | 0.712 | 0.312 | 0.417 | 0.577 | 0.684 | 0.535 | 0.512 | 0.537 | |
| 2022 | 0.625 | 0.409 | 0.497 | 0.727 | 0.761 | 0.394 | 0.504 | 0.598 | 0.700 | 0.526 | 0.522 | 0.569 | |
| Mean value | 0.613 | 0.291 | 0.436 | 0.659 | 0.693 | 0.305 | 0.384 | 0.515 | 0.609 | 0.486 | 0.438 | 0.493 | |
| Year | Group | Between-Column | ||||||
|---|---|---|---|---|---|---|---|---|
| Northern Marine Economy Circle | Eastern Marine Economy Circle | Southern Marine Economy Circle | ||||||
| Theil Index | Contribution Rate (%) | Theil Index | Contribution Rate (%) | Theil Index | Contribution Rate (%) | Theil Index | Contribution Rate (%) | |
| 2011 | 0.0290 | 57.15 | 0.0106 | 20.97 | 0.0100 | 19.71 | 0.0011 | 2.17 |
| 2012 | 0.0301 | 49.89 | 0.0169 | 28.03 | 0.0073 | 12.03 | 0.0061 | 10.05 |
| 2013 | 0.0340 | 52.88 | 0.0184 | 28.60 | 0.0108 | 16.82 | 0.0011 | 1.70 |
| 2014 | 0.0274 | 46.75 | 0.0260 | 44.40 | 0.0020 | 3.42 | 0.0032 | 5.42 |
| 2015 | 0.0248 | 49.83 | 0.0208 | 41.93 | 0.0031 | 6.18 | 0.0010 | 2.05 |
| 2016 | 0.0177 | 41.03 | 0.0216 | 49.99 | 0.0032 | 7.42 | 0.0007 | 1.56 |
| 2017 | 0.0138 | 42.98 | 0.0165 | 51.20 | 0.0013 | 4.17 | 0.0005 | 1.64 |
| 2018 | 0.0153 | 46.86 | 0.0157 | 48.12 | 0.0006 | 1.92 | 0.0010 | 3.11 |
| 2019 | 0.0056 | 21.48 | 0.0169 | 64.67 | 0.0021 | 8.13 | 0.0015 | 5.72 |
| 2020 | 0.0133 | 43.98 | 0.0133 | 43.78 | 0.0021 | 7.05 | 0.0016 | 5.20 |
| 2021 | 0.0107 | 35.27 | 0.0147 | 48.08 | 0.0025 | 8.21 | 0.0026 | 8.44 |
| 2022 | 0.0084 | 39.09 | 0.0100 | 46.65 | 0.0028 | 12.89 | 0.0003 | 1.37 |
| Mean value | 0.0192 | 43.93 | 0.0168 | 43.04 | 0.0040 | 9.00 | 0.0017 | 4.04 |
| Code Number | Influencing Factor | Driving Factors |
|---|---|---|
| X1 | Aquaculture pollution | Marine aquaculture area (hectares) |
| X2 | Agricultural pollution | Agricultural fertilizer usage (10,000 tons) |
| X3 | Industrial pollution | Total assets of industrial enterprises above designated size (CNY 100 million) |
| X4 | Marine engineering pollution | Port cargo throughput (10,000 tons) |
| X5 | Carbon emission index | Carbon dioxide emissions (100 million tons) |
| X6 | Marine technology capabilities | Number of marine projects R&D (items) |
| X7 | Environmental regulation intensity | Completed investment in industrial pollution control (CNY 10,000) |
| 2011–2022 | 2011–2016 | 2017–2022 | ||||||
|---|---|---|---|---|---|---|---|---|
| Driving Factors | H-Value | p-Value | Driving Factors | H-Value | p-Value | Driving Factors | H-Value | p-Value |
| X1 | 0.570 | 0.000 | X1 | 0.707 | 0.000 | X1 | 0.532 | 0.000 |
| X2 | 0.594 | 0.000 | X2 | 0.649 | 0.000 | X2 | 0.674 | 0.000 |
| X3 | 0.323 | 0.000 | X3 | 0.312 | 0.000 | X3 | 0.525 | 0.000 |
| X4 | 0.295 | 0.004 | X4 | 0.263 | 0.000 | X4 | 0.483 | 0.000 |
| X5 | 0.389 | 0.000 | X5 | 0.443 | 0.000 | X5 | 0.401 | 0.000 |
| X6 | 0.435 | 0.000 | X6 | 0.346 | 0.000 | X6 | 0.667 | 0.000 |
| X7 | 0.175 | 0.003 | X7 | 0.221 | 0.010 | X7 | 0.210 | 0.067 |
| X1 | Type | X2 | Type | X3 | Type | X4 | Type | X5 | Type | X6 | Type | X7 | |
|---|---|---|---|---|---|---|---|---|---|---|---|---|---|
| X1 | 0.707 | ||||||||||||
| X2 | 0.814 | DE | 0.649 | ||||||||||
| X3 | 0.849 | DE | 0.912 | DE | 0.312 | ||||||||
| X4 | 0.903 | DE | 0.829 | DE | 0.746 | NE | 0.263 | ||||||
| X5 | 0.792 | DE | 0.789 | DE | 0.859 | NE | 0.633 | DE | 0.443 | ||||
| X6 | 0.880 | DE | 0.908 | DE | 0.776 | NE | 0.735 | NE | 0.757 | DE | 0.346 | ||
| X7 | 0.825 | DE | 0.871 | DE | 0.4981 | DE | 0.615 | NE | 0.702 | NE | 0.783 | NE | 0.221 |
| X1 | Type | X2 | Type | X3 | Type | X4 | Type | X5 | Type | X6 | Type | X7 | |
|---|---|---|---|---|---|---|---|---|---|---|---|---|---|
| X1 | 0.532 | ||||||||||||
| X2 | 0.758 | DE | 0.674 | ||||||||||
| X3 | 0.821 | DE | 0.908 | DE | 0.525 | ||||||||
| X4 | 0.933 | DE | 0.817 | DE | 0.863 | DE | 0.483 | ||||||
| X5 | 0.717 | DE | 0.810 | DE | 0.754 | DE | 0.753 | DE | 0.401 | ||||
| X6 | 0.862 | DE | 0.920 | DE | 0.854 | DE | 0.862 | DE | 0.746 | DE | 0.667 | ||
| X7 | 0.710 | DE | 0.827 | DE | 0.704 | DE | 0.727 | NE | 0.652 | NE | 0.734 | DE | 0.210 |
Disclaimer/Publisher’s Note: The statements, opinions and data contained in all publications are solely those of the individual author(s) and contributor(s) and not of MDPI and/or the editor(s). MDPI and/or the editor(s) disclaim responsibility for any injury to people or property resulting from any ideas, methods, instructions or products referred to in the content. |
© 2024 by the authors. Licensee MDPI, Basel, Switzerland. This article is an open access article distributed under the terms and conditions of the Creative Commons Attribution (CC BY) license (https://creativecommons.org/licenses/by/4.0/).
Share and Cite
Jiang, Y.; Liu, Y.; Pei, Z.; Kang, J.; Wang, Y.; Xia, N.; Wang, Z. Spatiotemporal Differences in Marine Environment Quality in China and the Influencing Factors. Sustainability 2024, 16, 3298. https://doi.org/10.3390/su16083298
Jiang Y, Liu Y, Pei Z, Kang J, Wang Y, Xia N, Wang Z. Spatiotemporal Differences in Marine Environment Quality in China and the Influencing Factors. Sustainability. 2024; 16(8):3298. https://doi.org/10.3390/su16083298
Chicago/Turabian StyleJiang, Yiying, Yang Liu, Zhaobin Pei, Jia Kang, Yongzheng Wang, Na Xia, and Zirui Wang. 2024. "Spatiotemporal Differences in Marine Environment Quality in China and the Influencing Factors" Sustainability 16, no. 8: 3298. https://doi.org/10.3390/su16083298