Within this subdivision, the findings from a study focused on assessing the perception of a cohort of the Portuguese population regarding the economic impacts of the utilization of biotechnological solutions in various fields are disclosed. Out of the 600 questionnaires circulated, 41 (6.8%) were excluded from the analysis due to the lack of responses in the second/third sections. Consequently, the ensuing results rely on the input from 559 participants.
3.1. Frequency of Responses Analysis
The data presented in
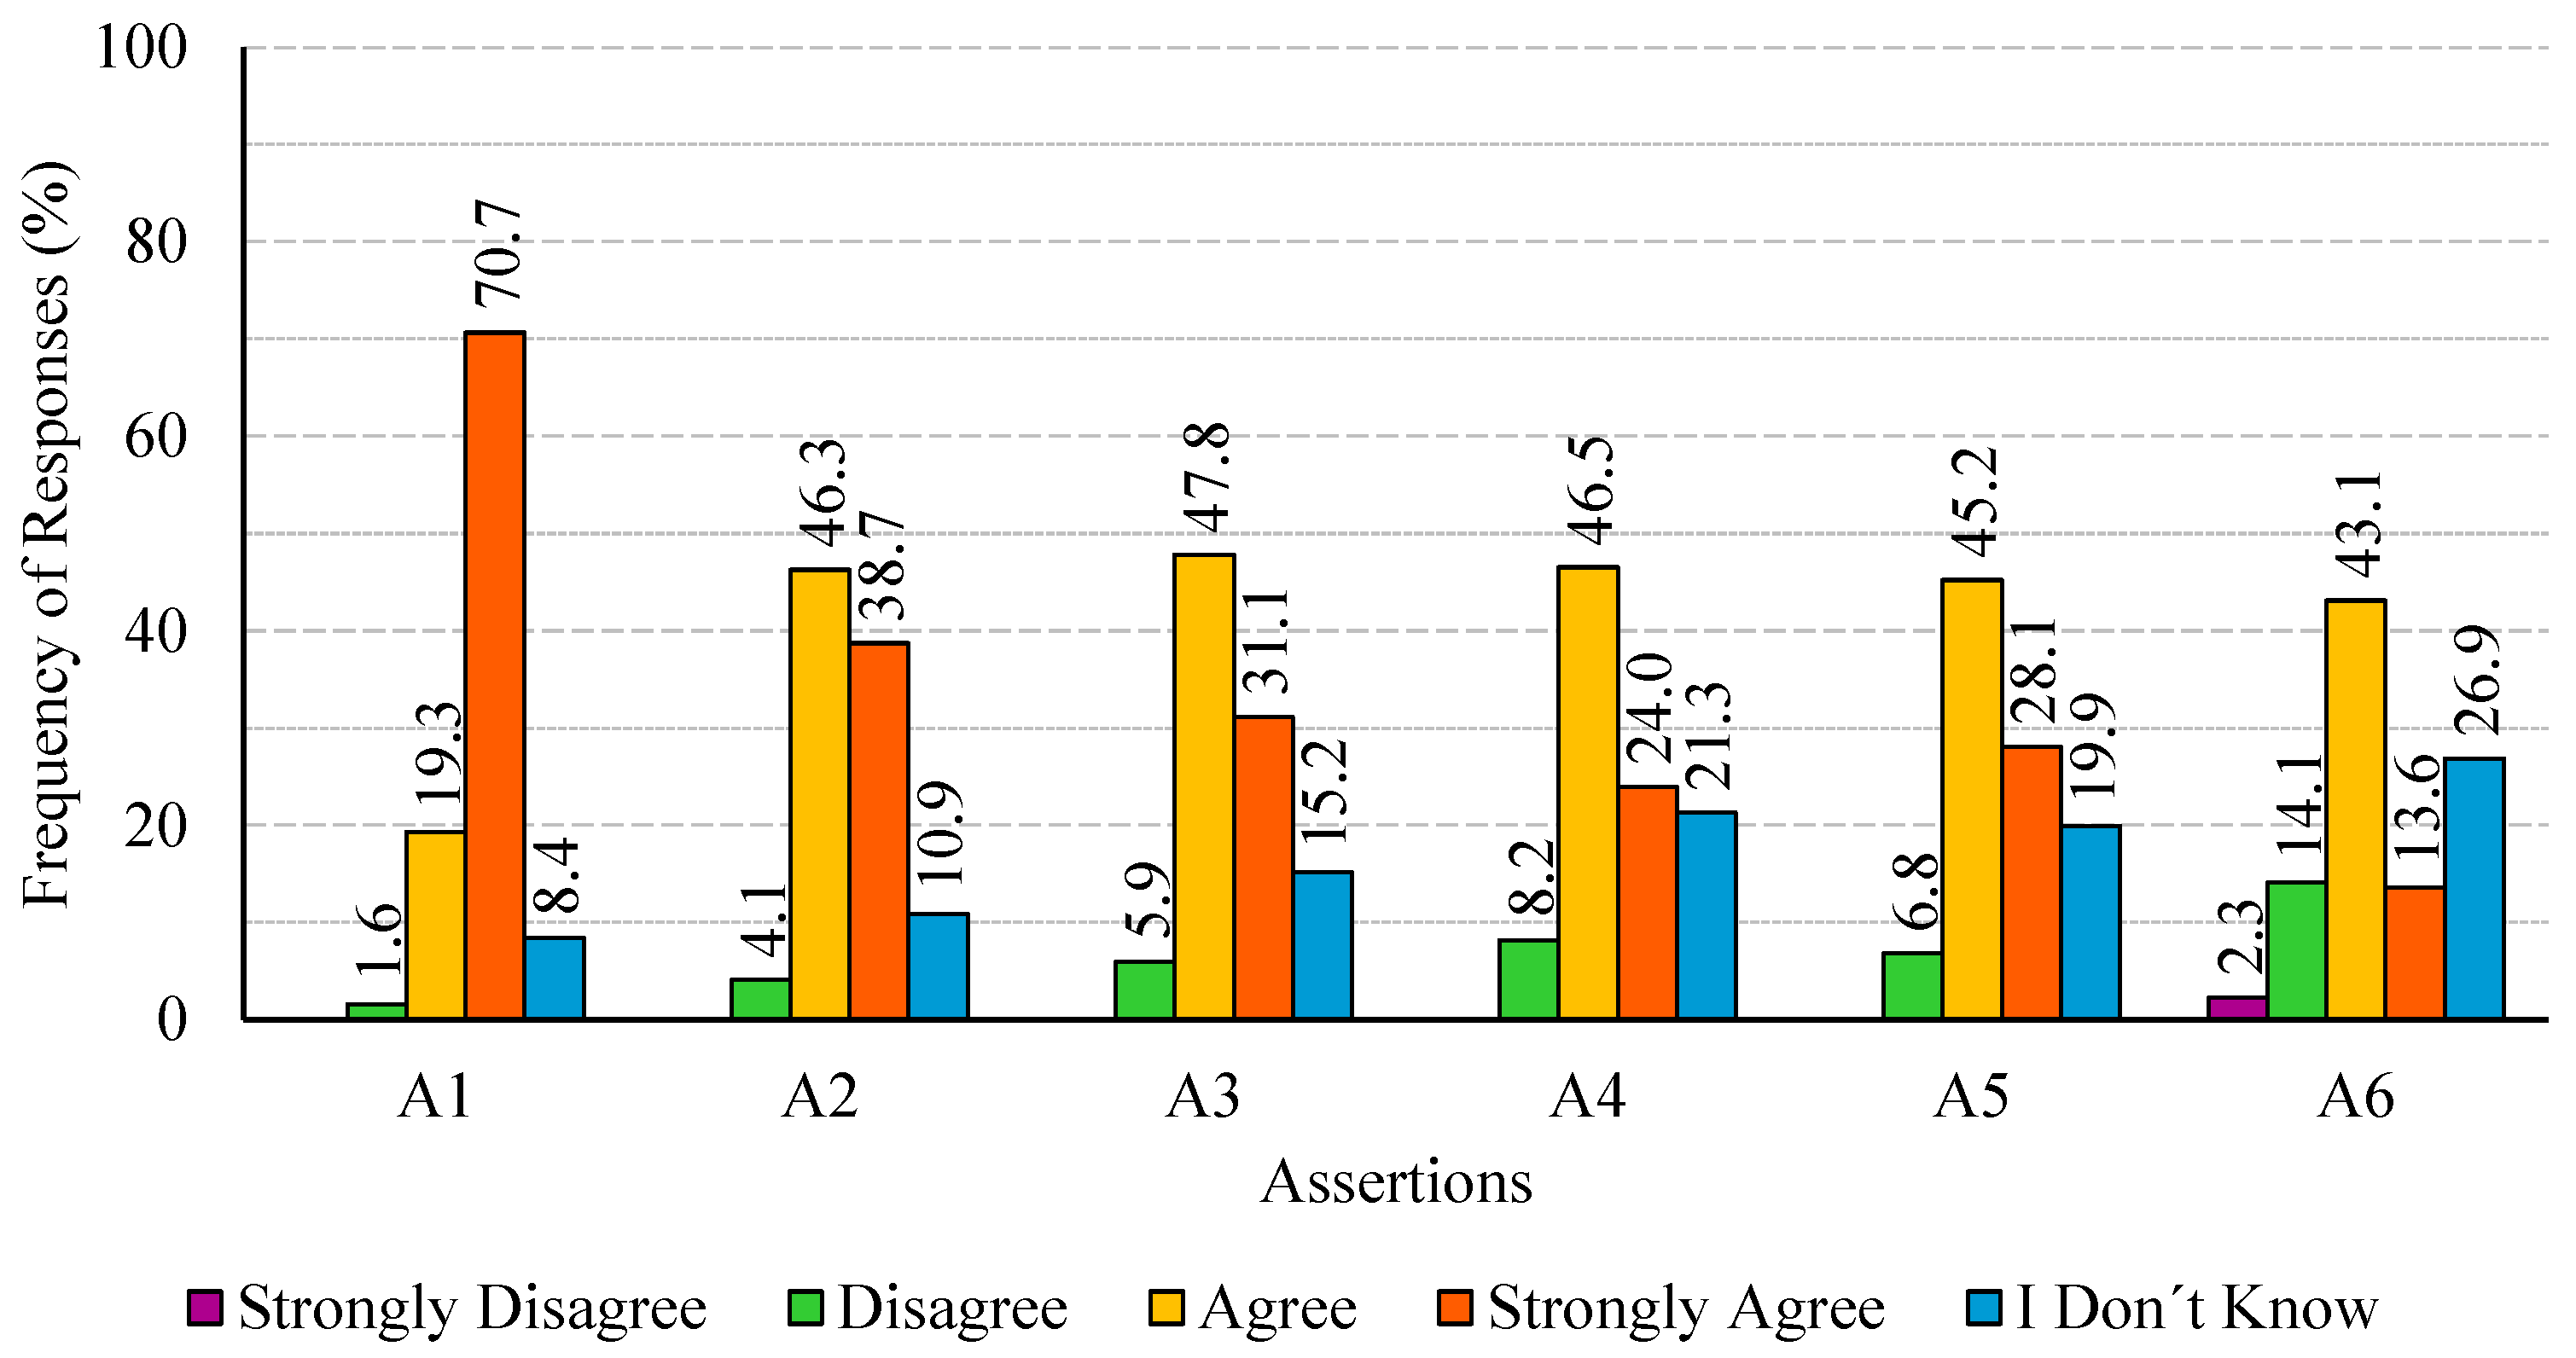
Figure 1 illustrates the distribution of response frequencies related to the assertions on the theme of the impact of biotechnology on the environment. Its reading indicates that the most common response given to assertions 2, 3, 4, 5, and 6 was
agree. Concerning assertion 2 (relating to climate change mitigation), the response frequency was 46.3%. In the case of assertion 3 (relating to sustainable research management), the corresponding frequency was 47.8%. Regarding assertion 4 (relating to biodiversity conservation), the
agree option was chosen by 46.5% of participants, whereas for assertions 5 (relating to environmental sustainability) and 6 (relating to environmental regulations), the same option was chosen by 45.2% and 43.1% of participants, respectively. In assertion 1 (relating to environmental pollution), the option
strongly agree emerged as the most chosen (70.7%), followed by the option
agree (19.3%).
Participants chose the strongly disagree option solely for assertion 6, though the percentage was low (2.3%). The disagree option was ticked by less than 5% of participants for assertions 1 and 2. For assertions 3, 4, and 5, this percentage ranged between 5% and 10%. Only for assertion 6, more than 10% of participants selected this option.
Finally, it is important to emphasize that the I don’t know option was chosen for all assertions. The largest percentage of I don’t know responses was recorded for assertion 6 (26.9%), followed by assertion 4 with 21.3%, assertion 5 with 19.9%, and assertion 3 with 15.2%. Relating to assertions 2 and 1, this percentage was less than 15% (i.e., 10.9% and 8.4%, respectively).
The outcomes depicted in
Figure 1 reveal that a considerable percentage of participants are unfamiliar with matters concerning legislation, biodiversity, and sustainability. Conversely, there is a prevalence of positive responses (i.e.,
strongly agree and
agree) for the issues relating to environmental pollution and climate change mitigation. These results align with those documented in Special Eurobarometer 516 [
28]. As per the report, across the EU, 89% of respondents express interest (i.e., “
very interested” or “
moderately interested”) in environmental issues, such as climate change. Additionally, the percentage of respondents expressing being “
very interested” in environmental concerns varies from 15% in Bulgaria and Lithuania to 71% in Portugal, with an EU average of 42%.
The results presented in
Figure 1 align with those reported by Woźniak-Gientka et al. [
29], indicating that 69% of Poles expressed support for using microorganisms to treat sewage and other wastes, while 54% believed they could potentially pose a threat to human health and the environment. Concerning the genetic alteration of microorganisms for environmental purification purposes, 55% of Poles found it beneficial, 54% supported such research, and 55% deemed it acceptable.
The data presented in
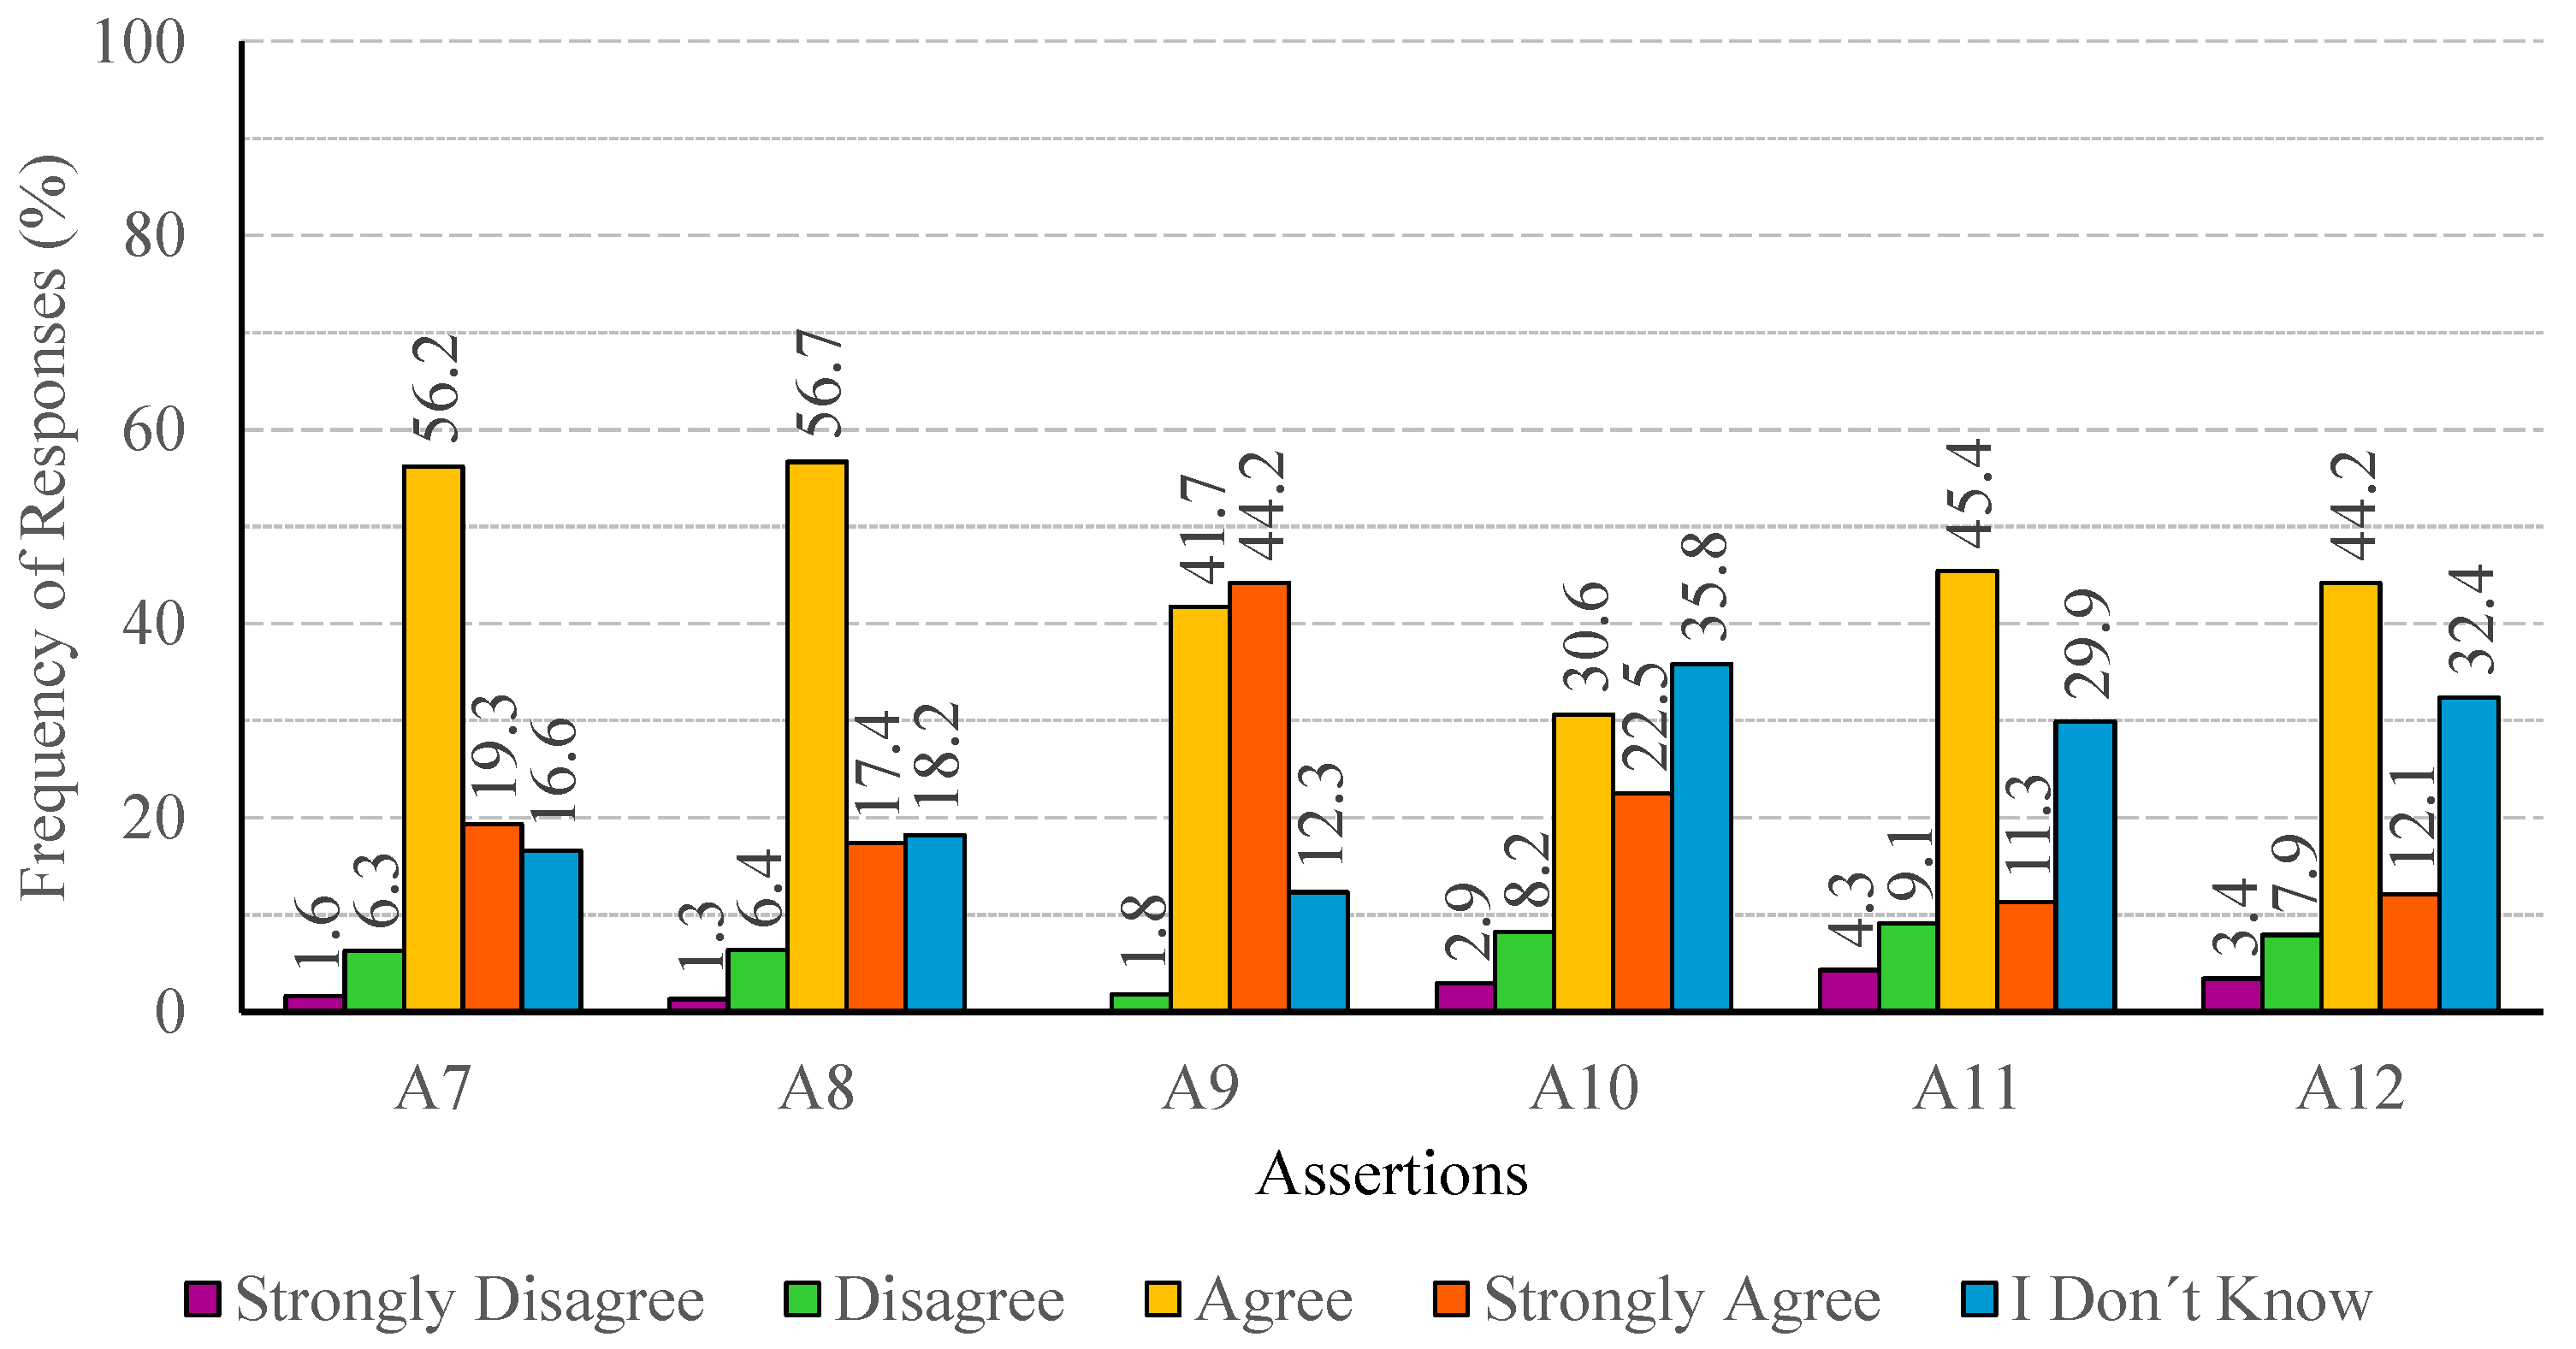
Figure 2 illustrates the distribution of response frequencies related to assertions on the theme of the impact of biotechnology on energy resources. Its reading indicates that the most common response given to assertions 7, 8, 11, and 12 was
agree. Concerning assertion 7 (relating to sustainable energy sources), the response frequency was 56.2%. In the case of assertion 8 (relating to clean and green energies), the corresponding frequency was 56.7%. Regarding assertion 11 (relating to decentralization of energy production), the
agree option was chosen by 45.4% of participants, whereas for assertion 12 (relating to energy security) this option was chosen by 44.2% of participants. In assertion 9 (relating to carbon dioxide emissions), the option
strongly agree emerged as the most chosen (44.2%), followed by the option
agree (41.7%).
Apart from assertion 9, participants chose the strongly disagree option for all the remaining assertion of this theme, though the percentage was low, ranging between 1.3% and 4.3%. The disagree option was ticked in all assertions by a small percentage of participants, varying between 1.8% and 9.1%.
Finally, it is important to emphasize that the I don’t know option was chosen for all assertions, being the most chosen in assertion 10 (relating to energy storage) with 35.8% of responses. The largest percentage of I don’t know responses was recorded for assertions 10, 11, and 12, ranging between 29.9% and 35.8%. Relating to assertions 7, 8, and 9, this percentage was less, varying between 12.3% and 18.2%.
The outcomes depicted in
Figure 2 reveal that a considerable percentage of participants are unfamiliar with matters concerning energy storage, energy security, and decentralization of energy production. Conversely, there is a prevalence of positive responses (i.e.,
strongly agree and
agree) for the issues relating to carbon dioxide emissions, sustainable energy sources, and clean and green energies. These results may have been influenced by the progressive increase in energy costs caused by the instability experienced in Europe during the study period. The aforementioned price hike may have positively influenced participants’ perception regarding the importance of seeking alternative energy sources independent of geopolitical issues, which is not the case for traditional energy sources.
The results present in
Figure 2 align with those reported by Sasa et al. [
52] that undertook a study to evaluate the environmental literacy of students enrolled at Applied Science Private University in Jordan. The findings of this study unveiled that the students exhibited a considerable level of environmental knowledge concerning energy, pollution, and recycling. Furthermore, the Special Eurobarometer 516 [
28] highlights that Portugal has the highest percentage of respondents (74%) who disagree with the assertion “
Thanks to scientific and technological advances, the Earth’s natural resources will be inexhaustible”.
The data presented in
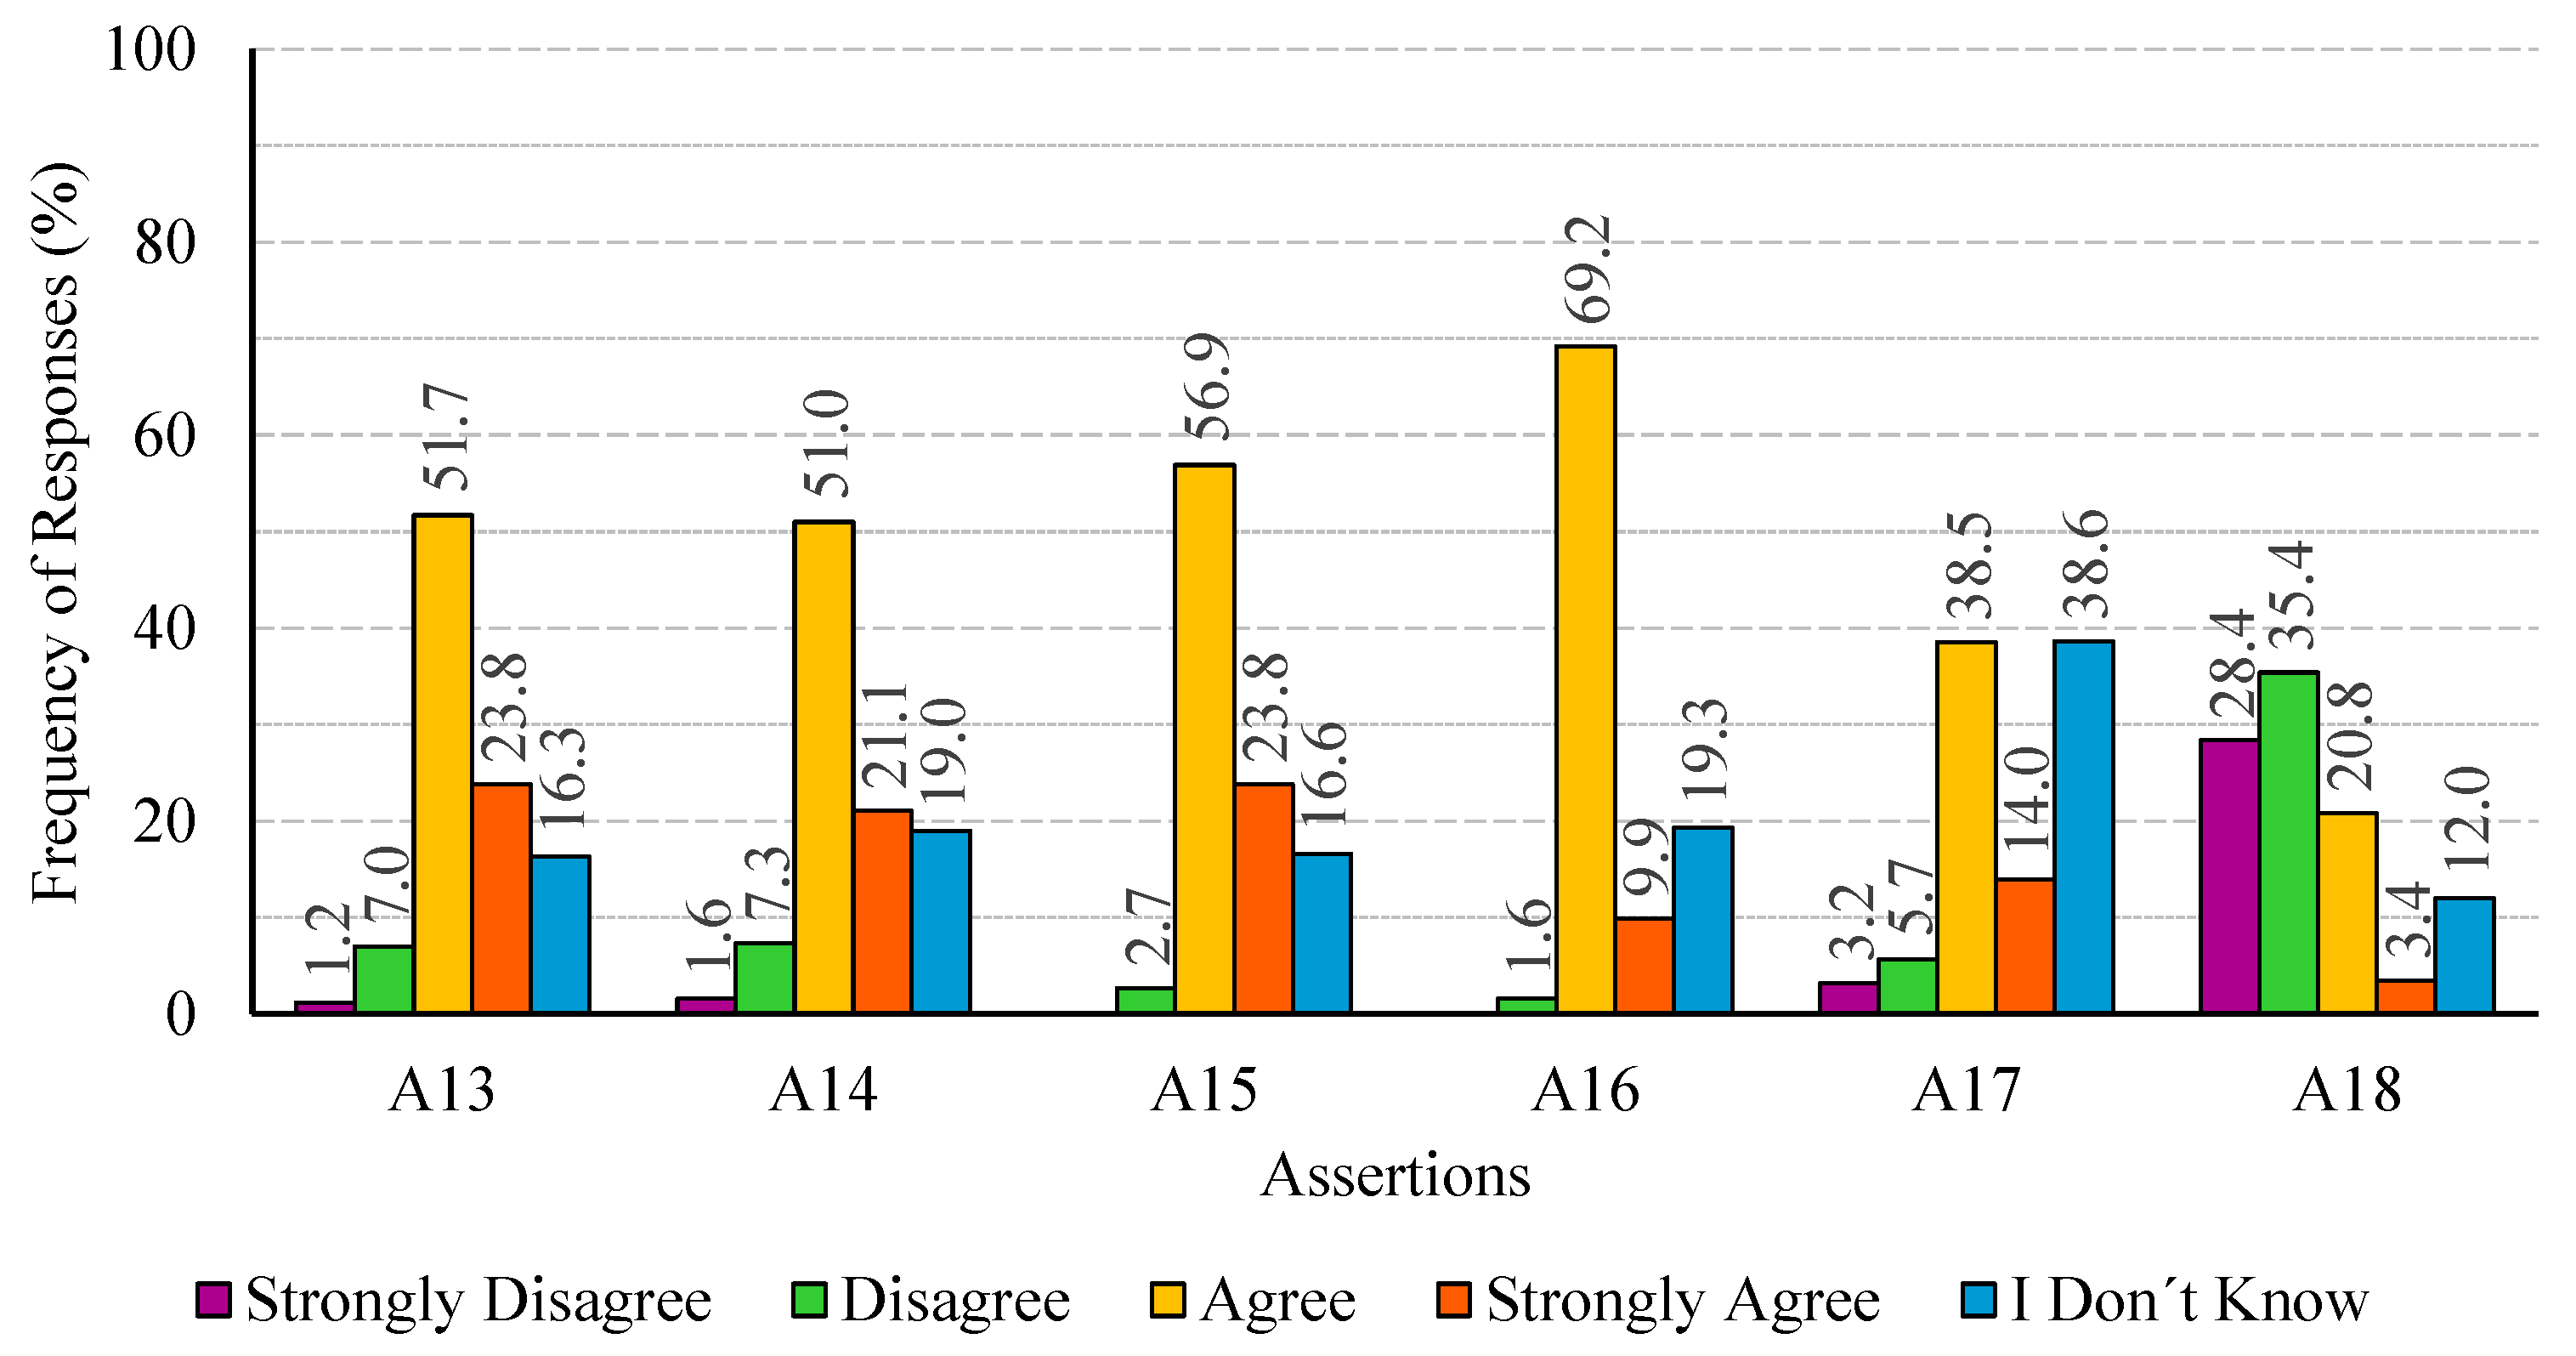
Figure 3 illustrates the distribution of response frequencies related to assertions on the theme of the impact of biotechnology on agriculture. Its reading indicates that the most common response given to assertions 13, 14, 15, and 16 was
agree. Concerning assertion 13 (relating to crop yield and food production), the response frequency was 51.7%. In the case of assertion 14 (relating to pest-resistant and drought-tolerant crop varieties), the corresponding frequency was 51.0%. Regarding assertion 15 (relating to soil health/fertility), the
agree option was chosen by 56.9% of participants, whereas for assertion 16 (relating to environmentally friendly pesticides) this option was chosen by 69.2% of participants. In this theme, the option
strongly agree never emerged as the most chosen.
Apart from assertions 15 and 16, participants chose the strongly disagree option for all the remaining assertion of this theme, though the percentage was low, ranging between 1.2% and 3.2% for assertions 13, 14, and 17. Conversely, for assertion 18, 28.4% of participants selected this option. The disagree option was ticked in all assertions by a small percentage of participants, varying between 1.6% and 7.3%, except for assertion 18 (relating to genetic modification for enhancing nutritional content in crops), for which this option was ticked by 35.4% of participants.
Finally, it is important to emphasize that the I don’t know option was chosen for all assertions. The response frequency ranges between 12.0% and 38.6%, being the most chosen option in assertion 17 (relating to precision farming).
The outcomes depicted in
Figure 3 reveal that a considerable percentage of participants are unfamiliar with matters concerning precision farming. Conversely, there is a prevalence of positive responses (i.e.,
strongly agree and
agree) for the issues relating to soil health/fertility, environmentally friendly pesticides, crop yield/food production, and pest-resistant/drought-tolerant crop varieties. Regarding the use of genetic modification for enhancing nutritional content in crops (assertion 18) there is a prevalence of negative responses (i.e.,
strongly disagree and
disagree). These results align with those reported by Woźniak-Gientka et al. [
29], indicating that 60% of Poles would remain unconvinced by various features of transgenic food (e.g., lower price, improved nutritional value, enhanced taste and appearance, and increased durability). Moreover, 45% of Poles assert that the use of biotechnology in food production is harmful, while 46% advocated for its prohibition, and 46% consider it unacceptable. Concerning the utilization of biotechnology to improve drought, pest, and insect resistance, 44% of Poles affirm its utility, while 44% advocate for supporting research in this area, and 45% find it acceptable. Conversely, 26% of respondents are convinced of its harmfulness, 26% seek its prohibition, and 25% consider it unacceptable.
The data presented in
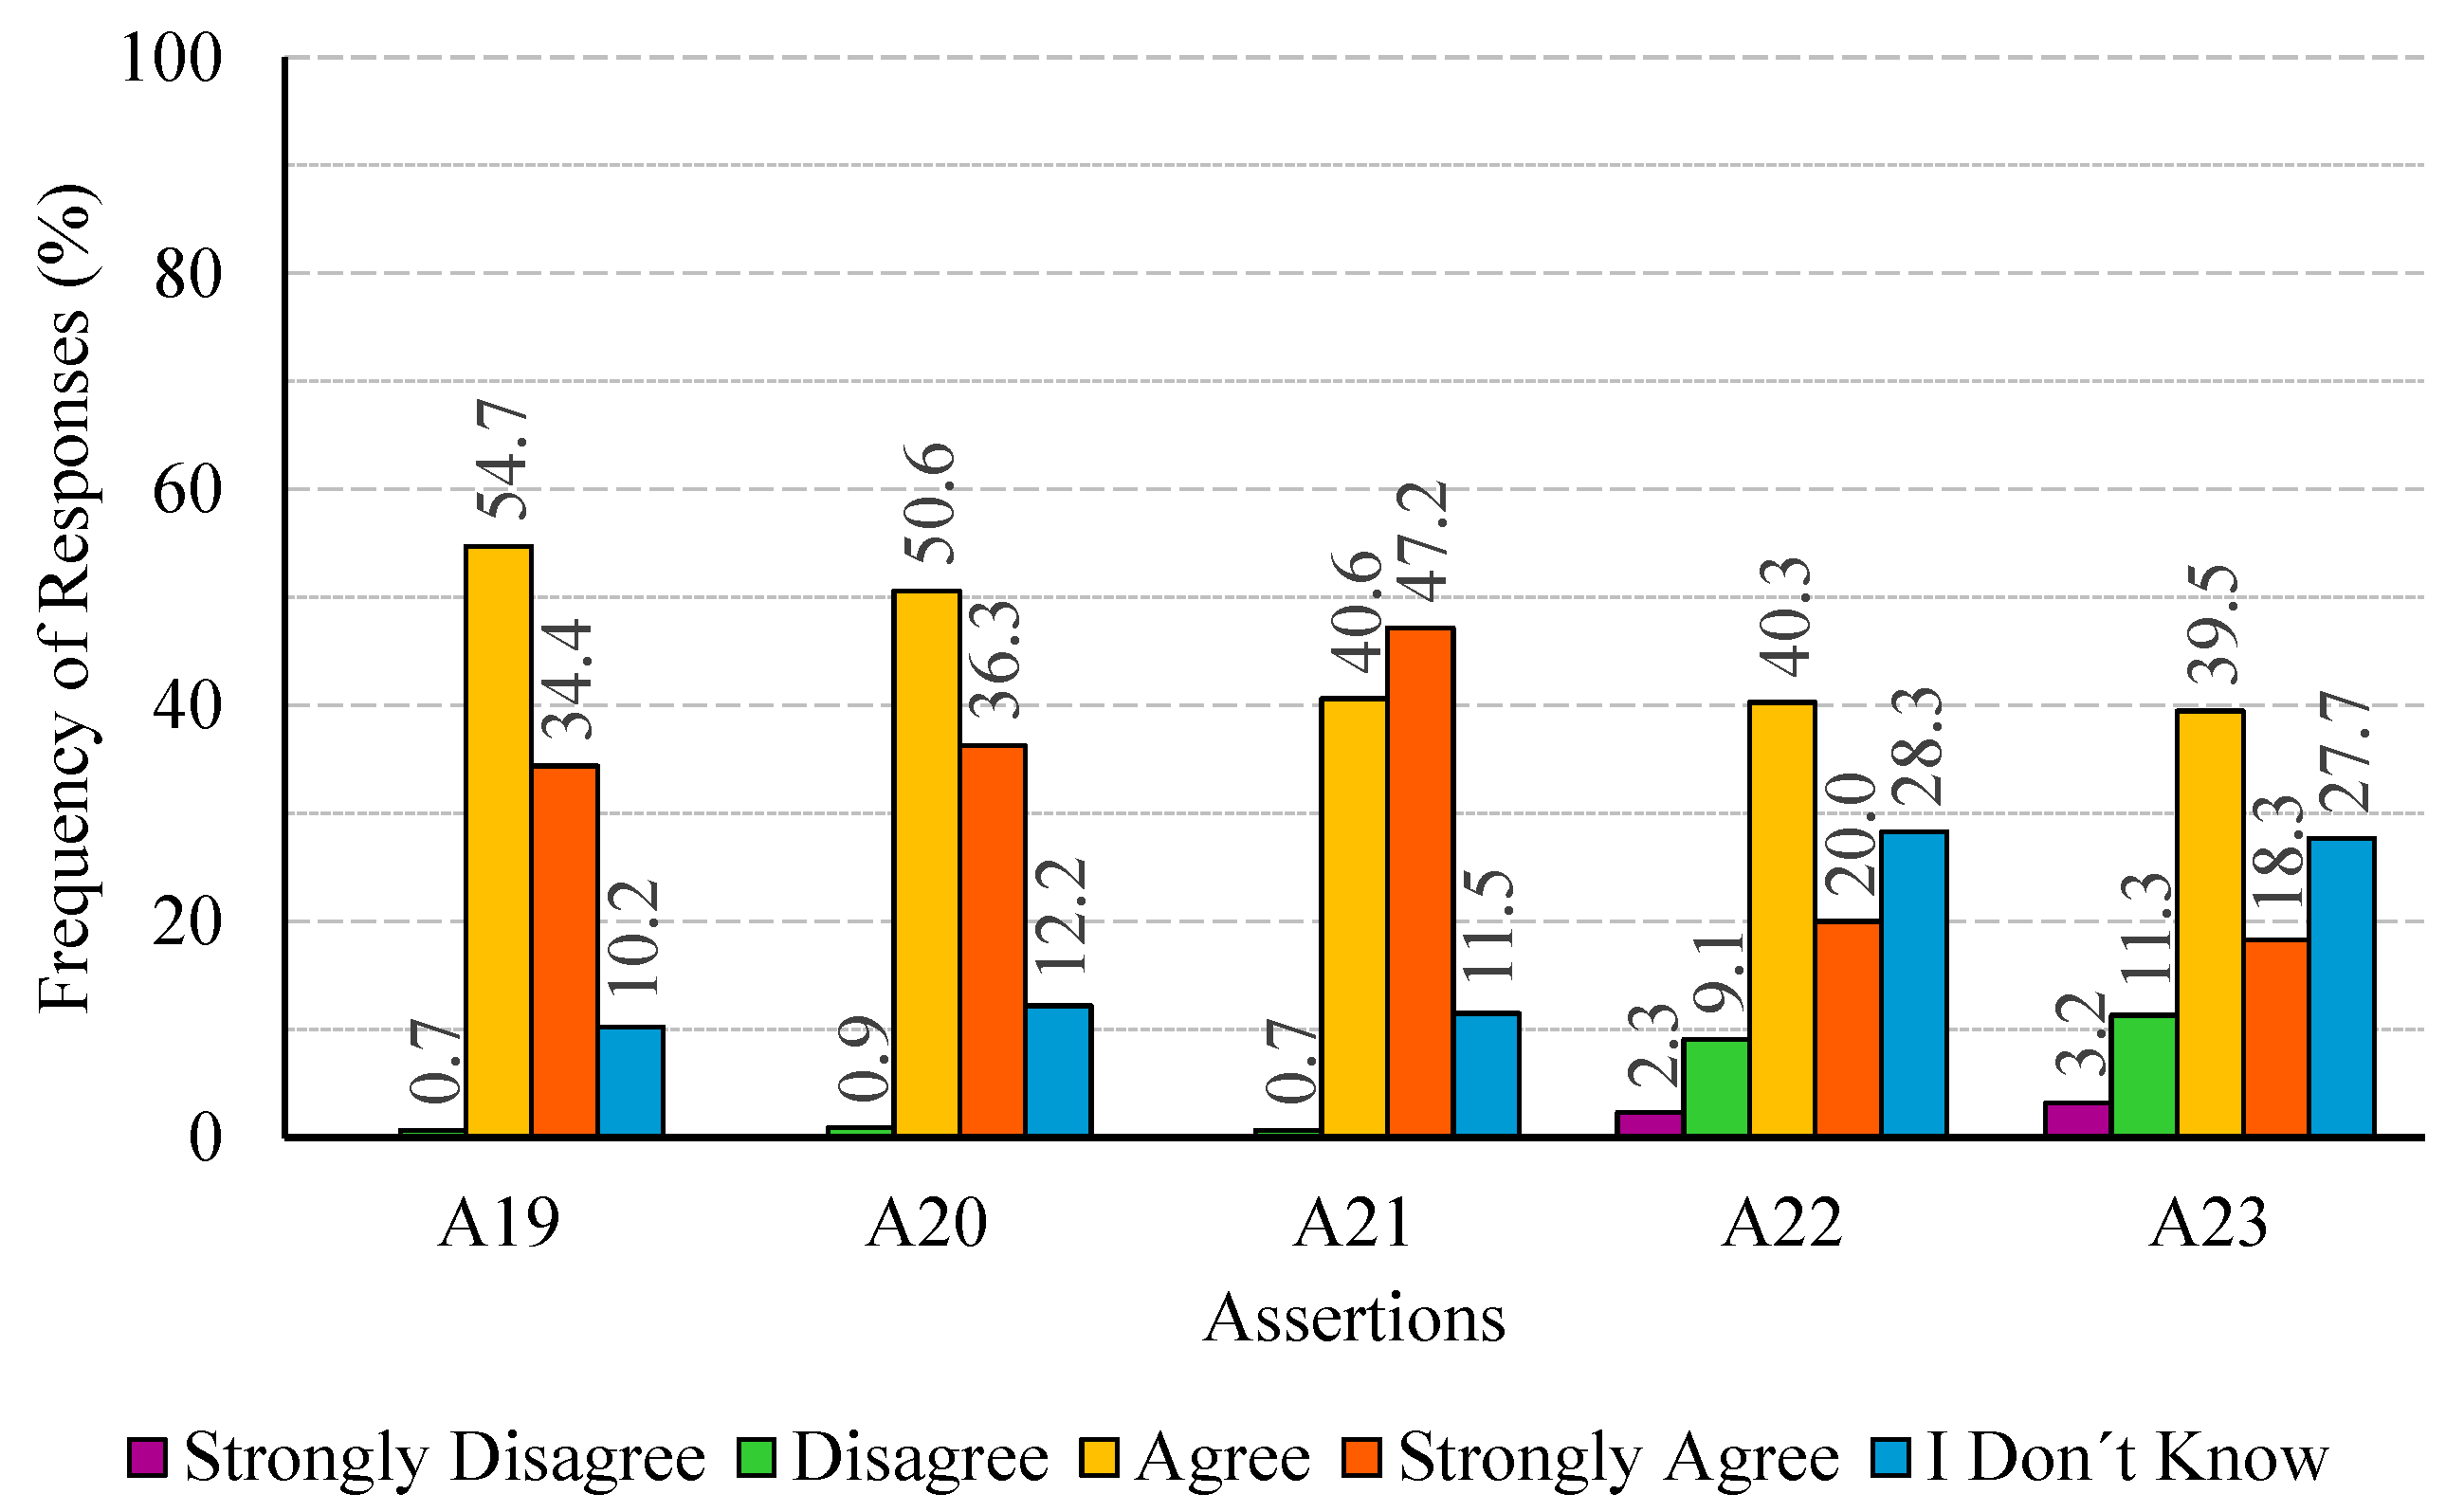
Figure 4 illustrates the distribution of response frequencies related to assertions on the theme of the impact of biotechnology on industry. Its reading indicates that the most common response given to assertions 19, 20, 22, and 23 was
agree. Concerning assertion 19 (relating to sustainable product design), the response frequency was 54.7%. In the case of assertion 20 (relating to the development of eco-friendly materials), the corresponding frequency was 50.6%. Regarding assertion 22 (relating to carbon footprint of industrial processes), the
agree option was chosen by 40.3% of participants, whereas for assertion 23 (relating to circular economy), this option was chosen by 39.5% of participants. In assertion 21 (relating to industrial waste), the option
strongly agree emerged as the most chosen (47.2%), followed by the option
agree (40.6%).
Participants chose the strongly disagree option solely for assertions 22 and 23, though the percentage was low (2.3% and 3.2%, respectively). The disagree option was ticked by less than 1% of participants for assertions 19, 20, and 21. For assertions 22 and 23, this percentage were 9.1% and 11.3%, respectively.
Finally, it is important to emphasize that the I don’t know option was chosen for all assertions. The largest percentage of I don’t know responses was recorded for assertion 22 (28.3%), followed by assertion 23 with 27.7%, assertion 20 with 12.2%, assertion 21 with 11.5%, and assertion 19 with 10.2%.
The outcomes depicted in
Figure 4 reveal that a considerable percentage of participants are unfamiliar with matters concerning the carbon footprint of industrial processes and circular economy. Conversely, there is a prevalence of positive responses (i.e.,
strongly agree and
agree) for the issues relating to sustainable product design, industrial waste, and development of eco-friendly materials. These findings align with those of Woźniak-Gientka et al. [
29], indicating that 59% of respondents consider biotechnology important in the food industry, pointing out the use of microorganisms in the production of food products (e.g., bread, beer, and yogurt). Additionally, 69% of Poles support the use of microorganisms for waste treatment, while 55% believe that genetic modification of microorganisms for environmental purification purposes is beneficial. Furthermore, 64% of Poles view the use of biotechnology and genetic engineering positively in the pharmaceutical industry, especially in the development of new vaccines and drugs.
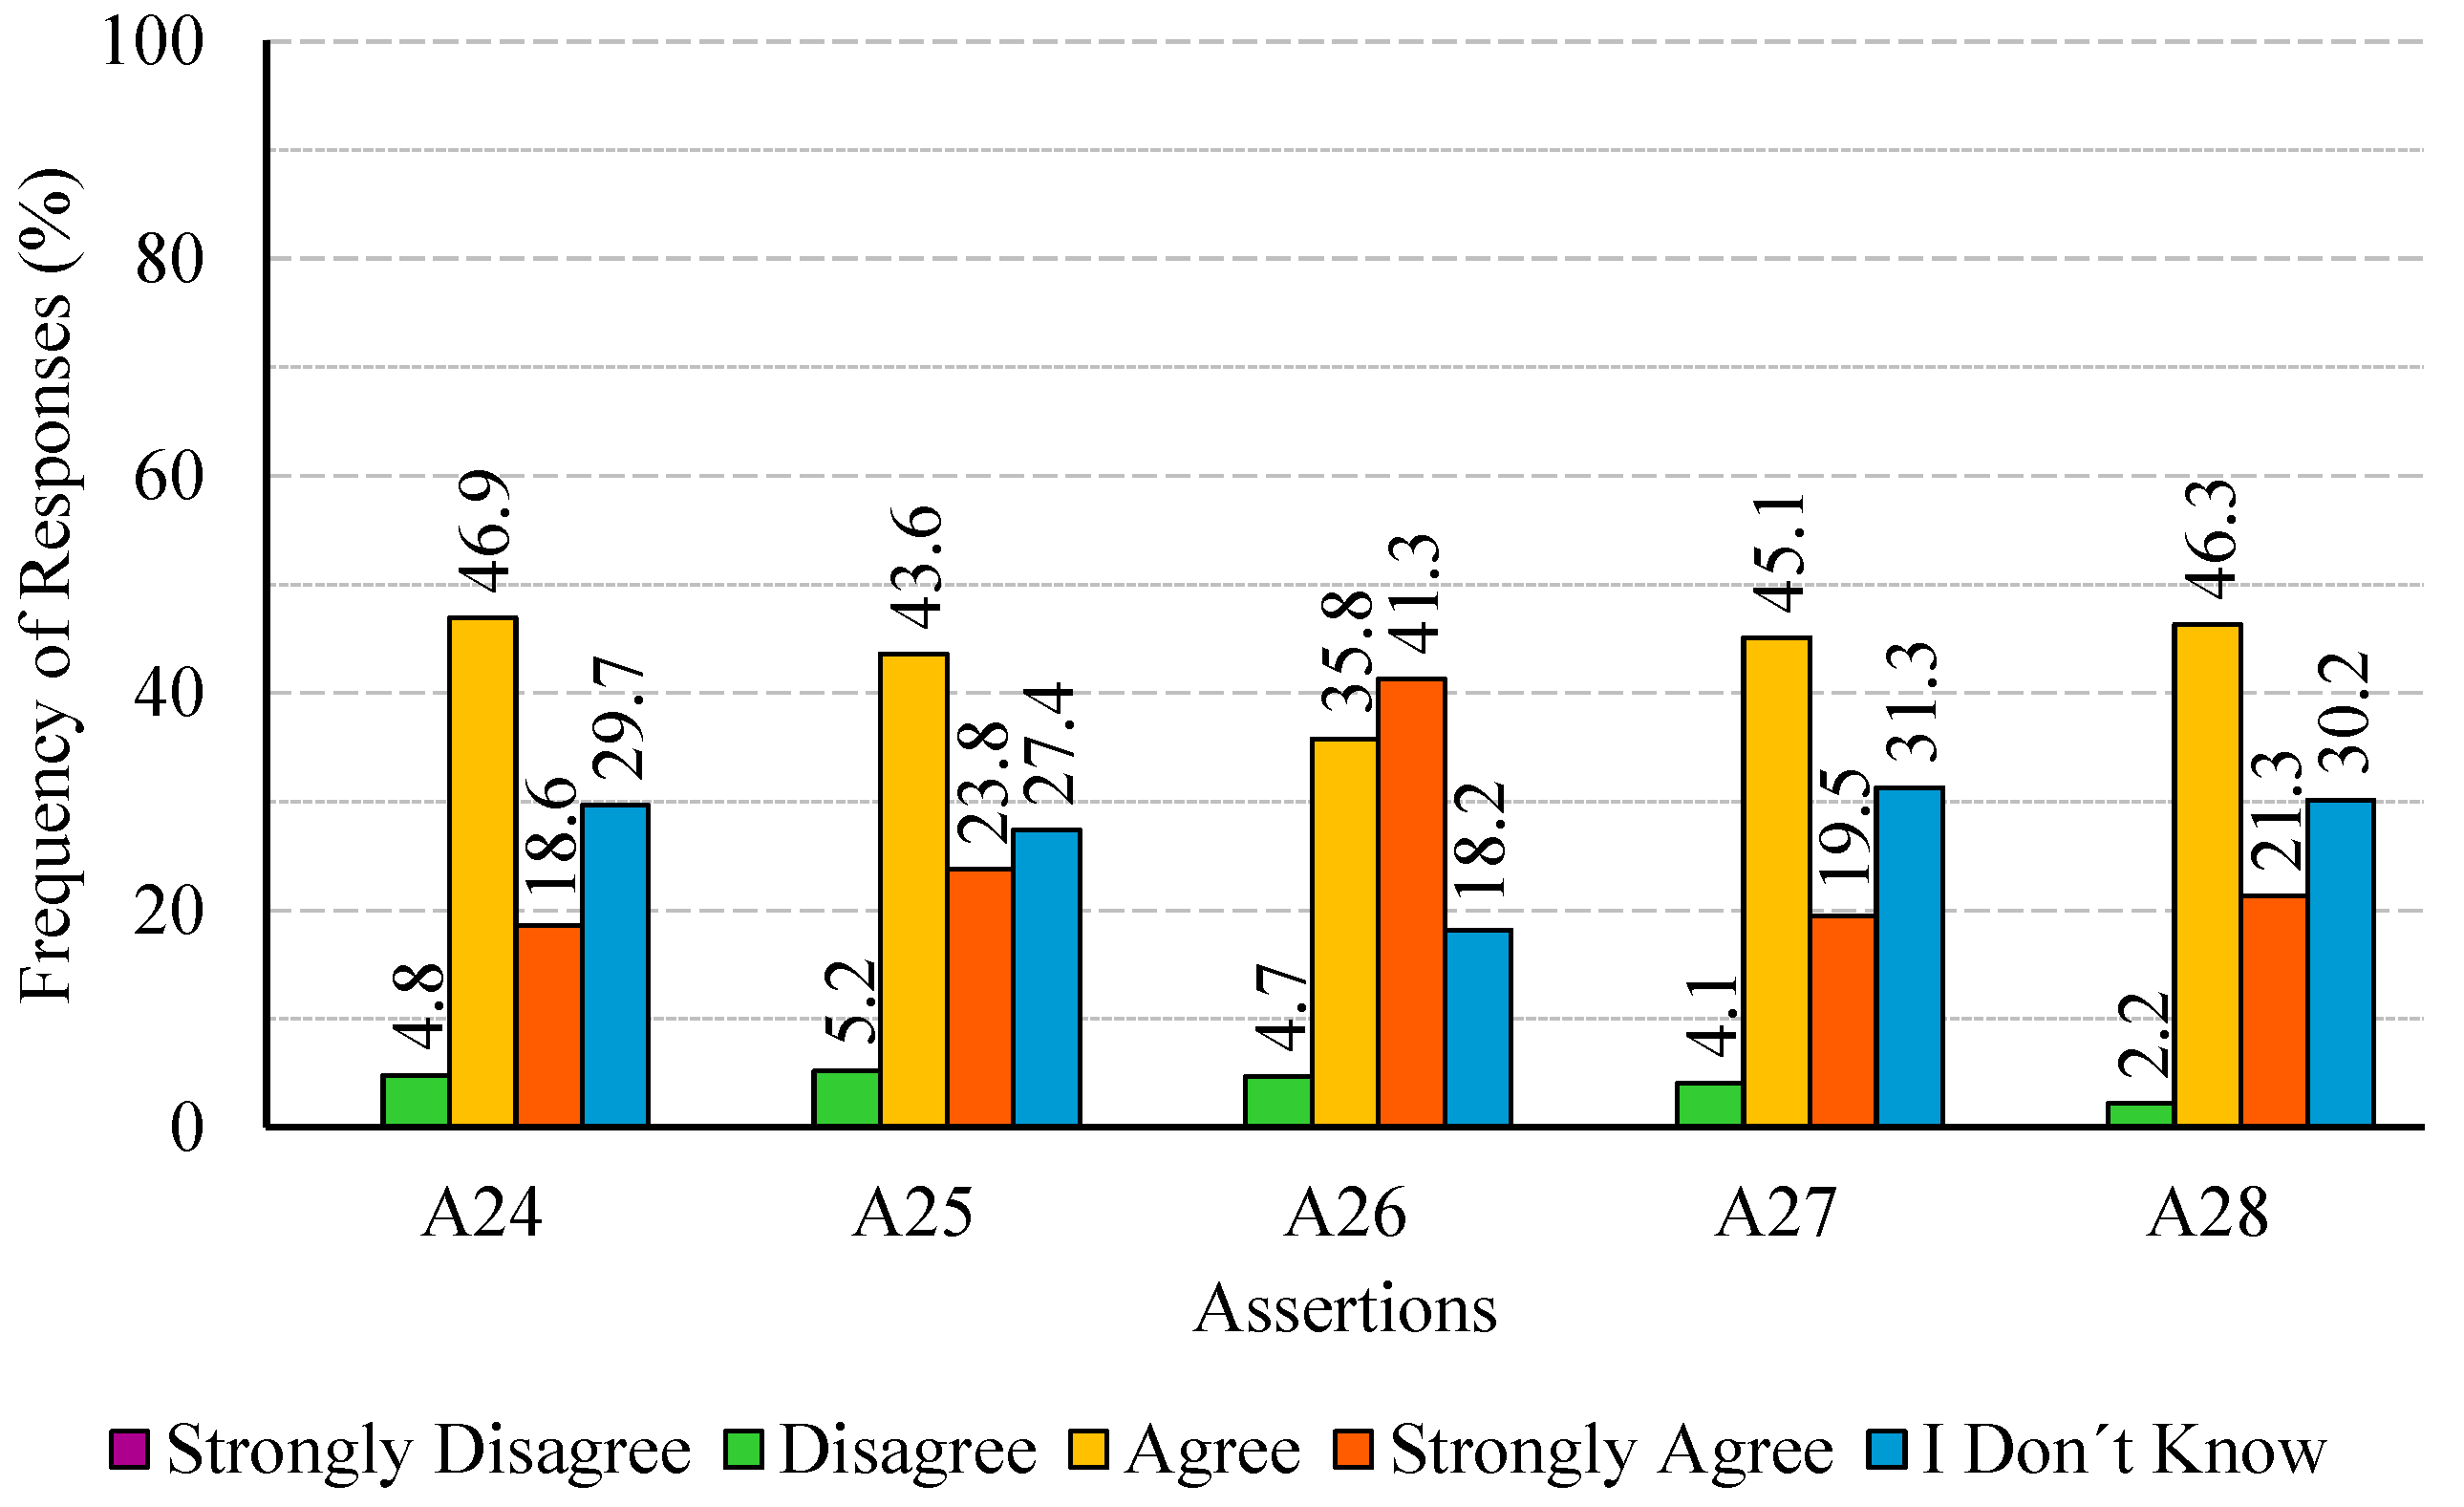
The data presented in
Figure 5 illustrates the distribution of response frequencies related to the assertions on the theme of the impact of biotechnology on health. Its reading indicates that the most common response given to assertions 24, 25, 27, and 28 was
agree. Concerning assertion 24 (relating to personalized and targeted healthcare solutions), the response frequency was 46.9%. In the case of assertion 26 (relating to preventive healthcare), the corresponding frequency was 43.6%. Regarding assertion 27 (relating to the accessibility and affordability of pharmaceuticals), the
agree option was chosen by 45.1% of participants, whereas for assertion 28 (relating to sustainable healthcare solutions), those option was chosen by 46.3% of participants. In assertion 26 (relating patients’ safety and well-being), the option
strongly agree emerged as the most chosen (41.3%), followed by the option
agree (35.8%).
None of the participants chose the option strongly disagree. The disagree option was ticked in all assertions by a small percentage of participants, varying between 2.2% and 5.2%.
Finally, it is important to emphasize that the I don’t know option was ticked in all assertions, varying between 18.2% and 31.3%.
Despite the prevalence of positive responses in all assertions, the outcomes depicted in
Figure 5 reveal that a considerable percentage of participants (higher than 18.2%) are unfamiliar with those matters.
The results presented in
Figure 5 align with those reported by Woźniak-Gientka et al. [
29], indicating that 64% of Poles expressed positivity towards utilizing biotechnology and genetic engineering in the development of new vaccines and drugs, advocating for their continued support and implementation. Conversely, 58% of respondents held concerns that such research could potentially compromise human health and the environment.
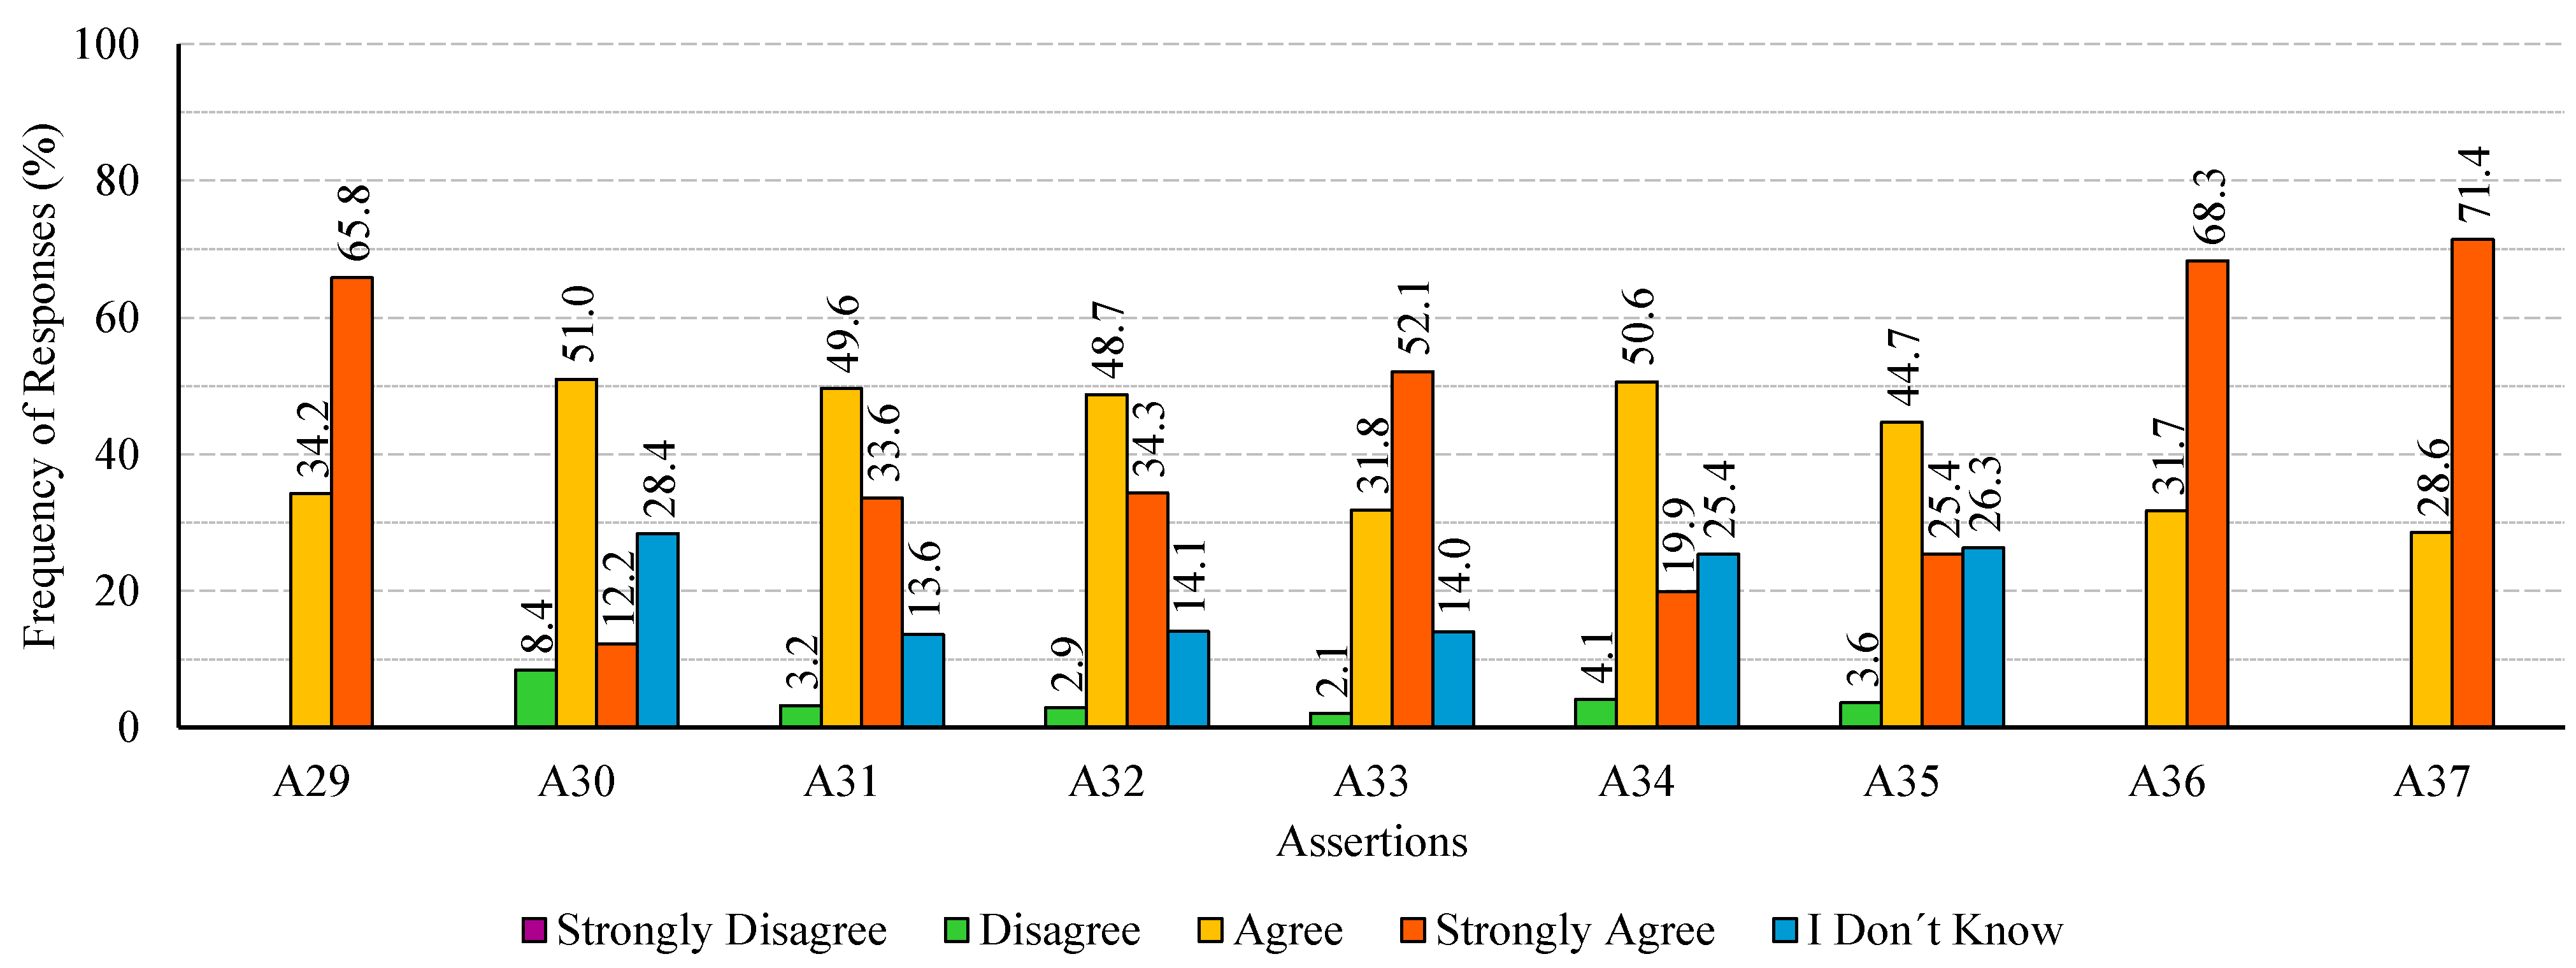
The data presented in
Figure 6 illustrates the distribution of response frequencies related to the assertions relating to the impact of biotechnology on the economy. Its reading indicates that the most common response given to assertions 30, 31, 32, 34, and 35 was
agree. Concerning assertion 30 (relating to the development of socially responsible business), the response frequency was 51.0%. In the case of assertion 31 (relating to economic grow), the corresponding frequency was 49.6%. Regarding assertion 32 (relating to reduction of social and economic disparities), the
agree option was chosen by 48.7% of participants, whereas for assertions 34 (relating to long-term economic sustainability) and 35 (relating to sustainable and inclusive economic development), this option were chosen by 50.6% and 44.7% of participants, respectively. In assertions 29 (relating to job creation), 33 (relating to poverty reduction), 36 (relating to reinvestment of the economic benefits in environmental and social initiatives), and 37 (relating to assessment and monitorization of economic impacts) the option
strongly agree emerged as the most chosen, ranging between 52.1% and 71.4%, followed by the option
agree, varying between 28.6% and 34.2%.
None of the participants chose the option strongly disagree. The disagree option was ticked in assertions 30, 31, 32, 33, 34, and 35 by a small percentage of participants, varying between 2.1% and 8.4%.
Finally, it is important to emphasize that the I don’t know option was chosen for assertions 30, 31, 32, 33, 34 and 35. The largest percentage of I don’t know responses was recorded for assertion 30 (28.4%), followed by assertion 35 with 26.3%, assertion 34 with 25.4%, assertion 32 with 14.1%, assertion 33 with 14.0%, and assertion 31 with 13.6%.
Despite the prevalence of positive responses in all assertions, the outcomes depicted in
Figure 6 reveal that a considerable percentage of participants are unfamiliar with matters concerning development of socially responsible business, long-term economic sustainability, sustainable/inclusive economic development. Conversely, it is important to highlight there are only positive responses (i.e.,
strongly agree and
agree) for the issues relating to job creation, reinvestment of the economic benefits in environmental and social initiatives, and assessment and monitorization of economic impacts.
The results presented in
Figure 6 highlight the positive perception of participants regarding the economic impacts of biotechnology-based technologies. These positive impacts has been emphasized by other authors. Wei et al. [
2] assert that the bioeconomy is undergoing both enrichment as an economic activity and evolution as an interdisciplinary concept. The authors highlight the necessity of expediting the diffusion and transfer of biotechnology, integrating the industrial chain of biotechnology–bioindustry–bioeconomy with the innovation chain, and achieving organic connection and simultaneous development from practice to theory. The European Parliament proposed allocating EUR 52.7 billion to address societal challenges from 2021 to 2027, with around 60% designated directly for the bioeconomy [
53]. Indeed, the advancements in biotechnology provide solutions to numerous development challenges that society faces today, from the provision of energy for a growing population to the emissions reduction and carbon neutrality, guaranteeing food security and food safety, and addressing the widespread occurrence of chronic diseases worldwide. By fostering public–private partnerships in the delivery of technical cooperation programs, the transformative power of industrial biotechnology can be unlocked to facilitate the inclusive and sustainable industrial development of developing countries. Additionally, the utilization of biotechnology for inclusive and sustainable industrial development can aid in achieving the Sustainable Development Goals, namely Goal 2—Zero hunger, Goal 3—Good health and well-being, Goal 9—Industry, innovation, and infrastructure, and Goal 12—Responsible consumption and production [
3].
3.3. Predictive Model of Participants’ Perceptions
The values found in
Table 4 were employed as input data for training ANNs to perform predictions on the perceptions of the participants on the economic impacts of biotechnology-based technologies. ANNs are computational models that draw inspiration from the human brain. A commonly used network architecture is the unidirectional configuration, featuring layers of artificial neurons or nodes interconnected directly [
32,
33,
34].
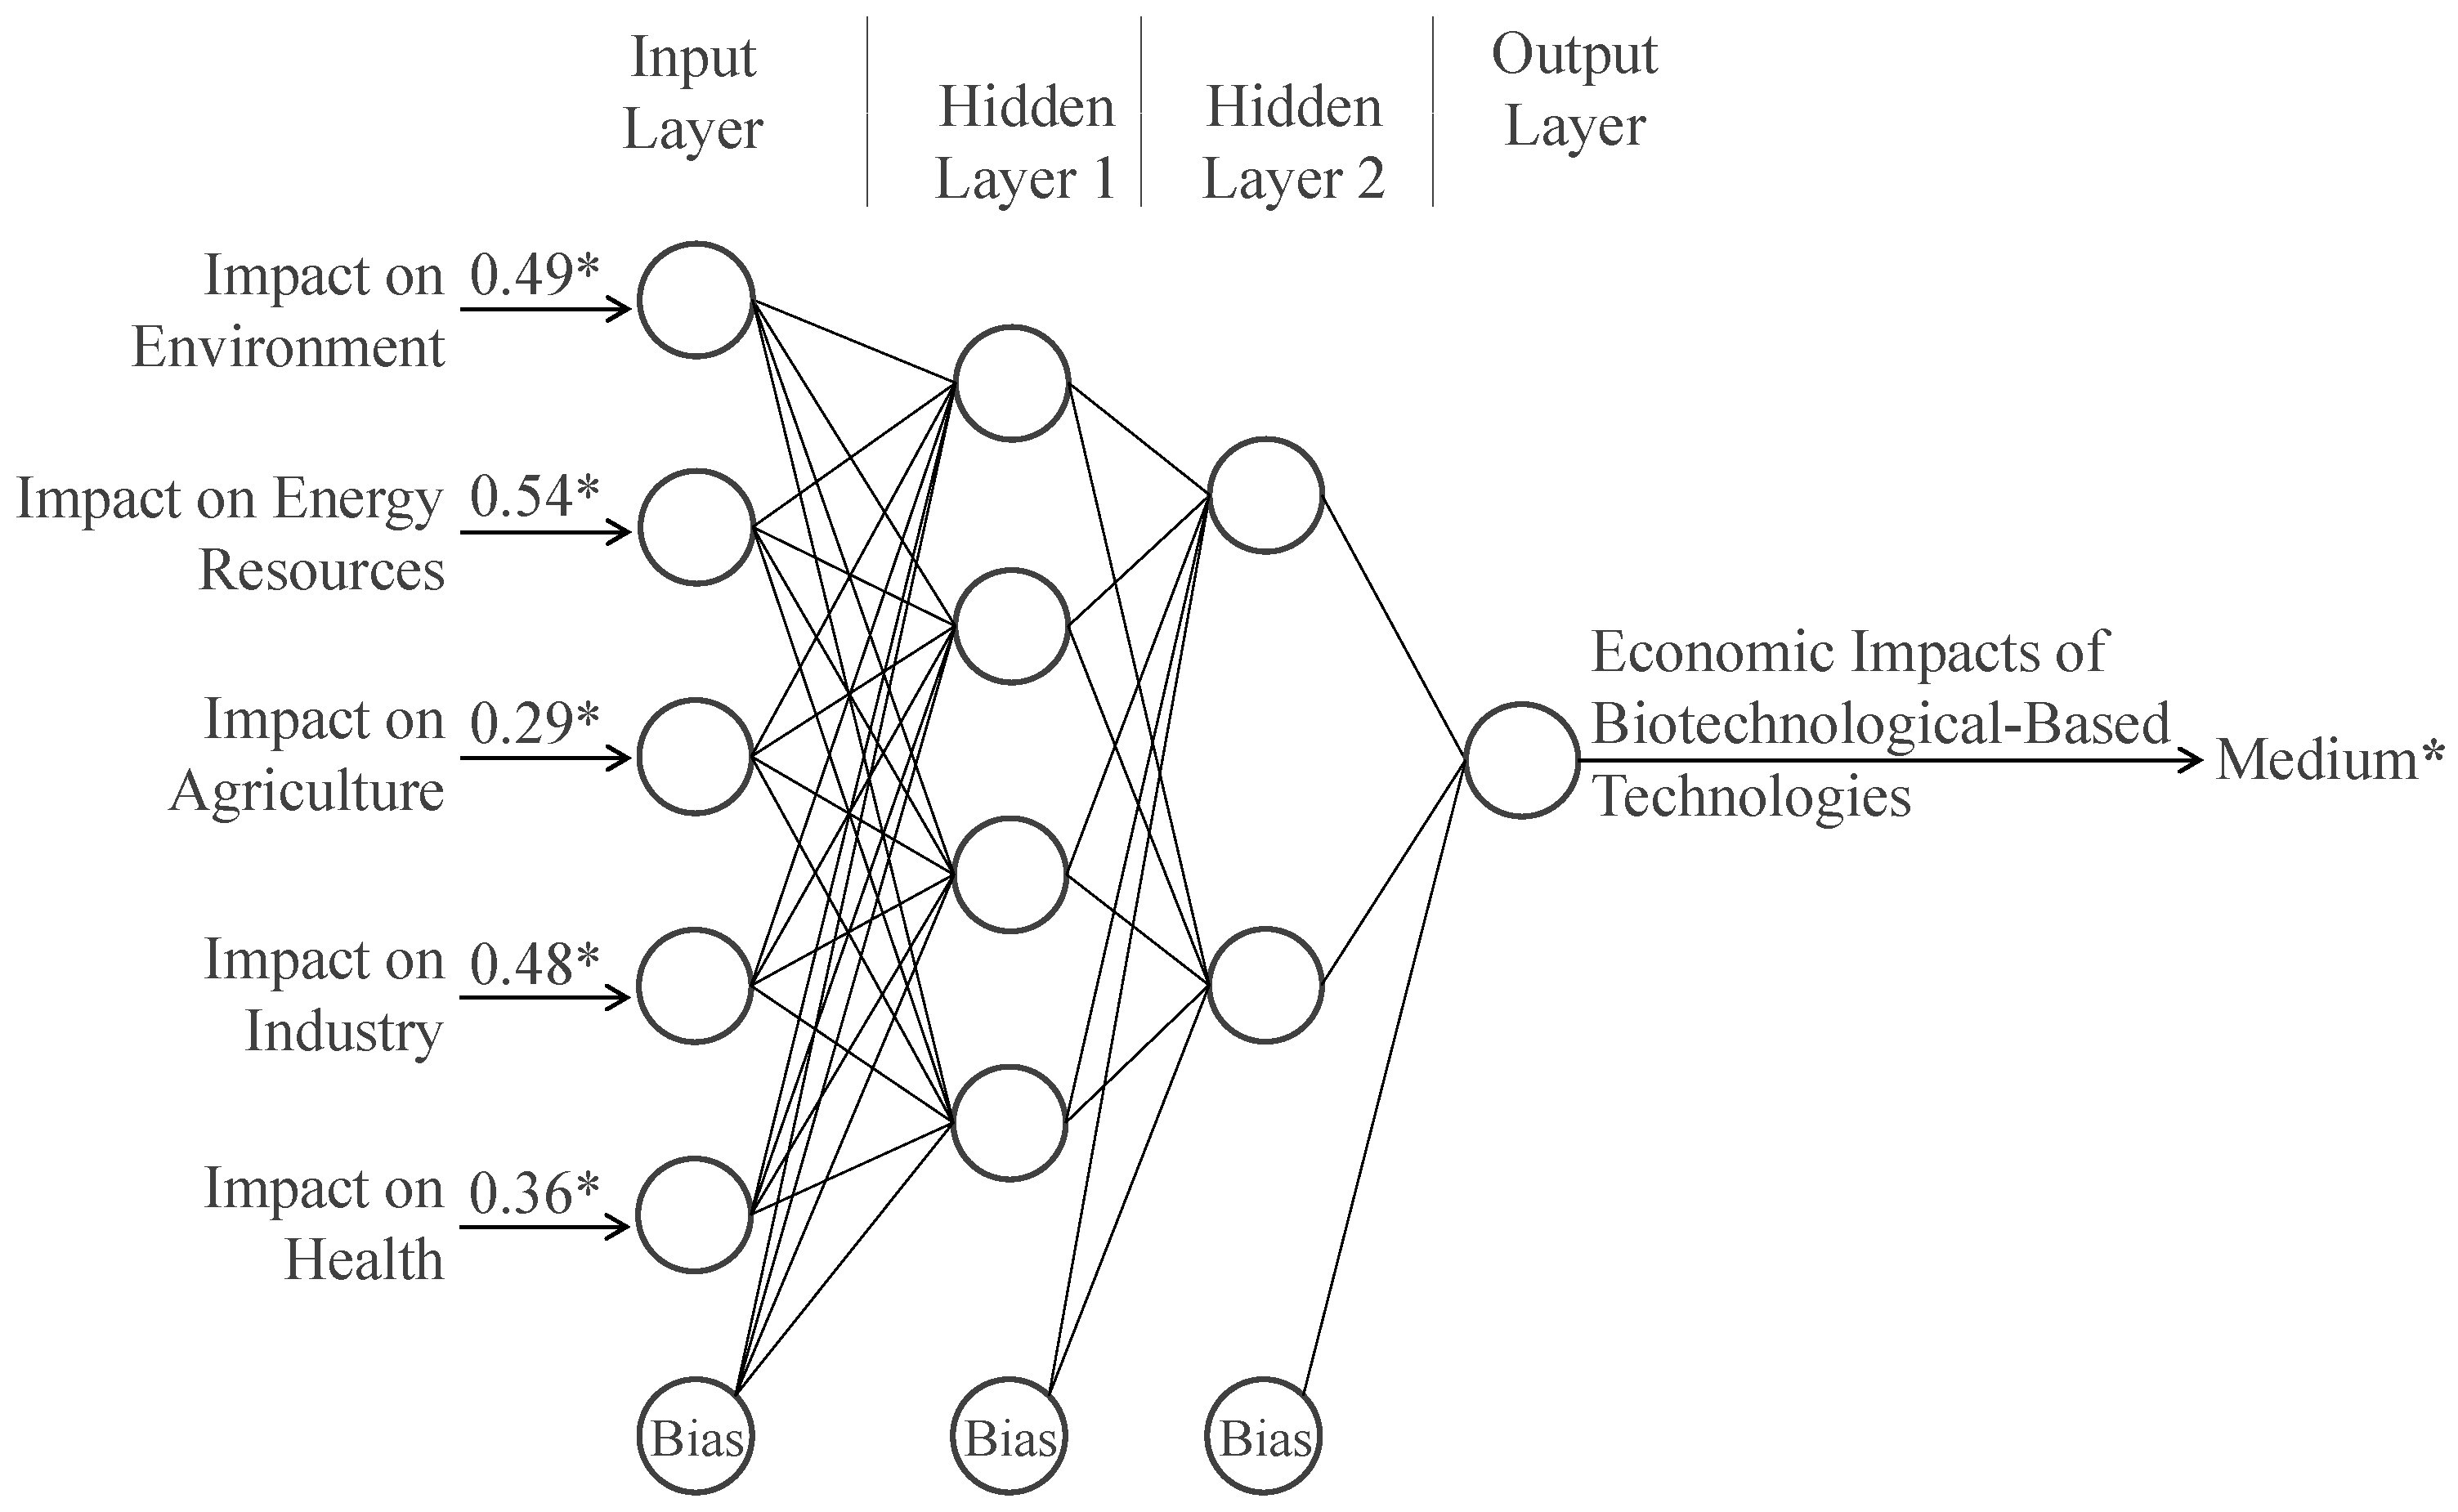
Various ANNs structures were developed and assessed to ascertain the most efficient model for evaluating the perceptions of the participants on the economic impacts of biotechnology-based technologies. The comparison of ANN models’ performance was carried out using confusion matrices. The ANN with architecture 5-4-2-1 (
Figure 9) emerged with the most favorable response among the diverse network topologies considered for the evaluation of the perceptions of the Portuguese population on the economic impacts of biotechnology-based technologies. The ANN model illustrated in
Figure 9 is accompanied by its confusion matrix (
Table 5), showcasing average values derived from 30 experiments. In each experiment, the dataset was randomly divided into two mutually exclusive partitions. The training set, used for constructing the model, including 372 cases, and the test set, comprising the remaining 187 examples, was used to assess the model performance. From the data displayed in
Table 5, one can quantify the model’s accuracy for the training set (93.0%, equivalent to 346 successfully identified from 372) and for the test set (90.9%, equivalent to 170 successfully identified from 187). Thus, the 5-4-2-1 ANN model reveals a high effectiveness in the evaluation of the perceptions of the Portuguese population on the economic impacts of biotechnology-based technologies, achieving precision levels beyond 90%. The similar values obtained for the model’s accuracy for training and test set suggest the absence of overfitting issues. Overfitting occurs when the model learns to memorize the training data too well, capturing noise and random fluctuations in the data rather than the underlying patterns or relationships. This can lead to poor generalization performance, where the model performs well in the training data but fails to accurately predict outcomes in a test set.
Through a column-oriented analysis of
Table 5, one can gauge how well the model identifies the different strata of participants’ perception (i.e., low, medium, or high). A total of 113 participants were identified by the model as appraising the economic impact of biotechnology-based technologies as
low, corresponding to 20.2% of the cohort. Among these cases, 101 were correctly classified, while the remaining 12 were incorrectly classified as they considered the economic impacts to be
medium. Considering the 281 participants identified by the model as appraising the economic impact of biotechnology-based technologies as
medium (50.3% of the cohort), 260 were properly assigned, whereas 21 were incorrectly classified, as 13 of them considered the economic impacts to be
low and the remaining 8 considered the economic impacts as
high. Lastly, 165 participants were identified by the model as appraising the economic impact of biotechnology-based technologies as
high, corresponding to 29.5% of the cohort. Among these cases, 155 were correctly classified, while the remaining 10 were incorrectly classified, as they considered the economic impacts to be
medium. From these data it is viable to quantify the confidence one can have in the predictions generated by the model. Therefore, the confidence levels stand at 89.4%, 92.5%, and 93.9% for
low,
medium, and
high, respectively.
Moreover, through a row-oriented analysis of
Table 5, one can assess the model’s ability to identify the number of participants within each distinct stratum. Thus, from the 114 participants that praise the economic impact of biotechnology-based technologies as
low (20.4% of the cohort), the model successfully identified 101, whereas 13 were incorrectly labeled as
medium. Considering the 282 participants that praise the economic impact of biotechnology-based technologies as
medium (50.4% of the cohort), 260 were properly assigned, whereas 22 were incorrectly classified (12 as
low and 10 as
high). Lastly, from the 163 participants that praise the economic impact of biotechnology-based technologies as
high (29.2% of the cohort), the model successfully identified 155, whereas 8 were incorrectly labeled as
medium.
In order to assess the sensitivity, specificity, positive predictive value (PPV), and negative predictive value (NPV) of the model depicted in
Figure 9, a confusion matrix for each output was generated, as outlined in
Table 6. Sensitivity indicates the fraction of positive cases (
Low,
Medium, or
High) correctly identified as positive, while specificity indicates the fraction of negative cases (
No-Low,
No-Medium, or
No-High) correctly identified as negative. PPV represents the ratio of correctly classified
Low,
Medium, or
High cases, in contrast with NPV which represents the ratio of correctly classed as
No-Low,
No-Medium, or
No-High [
54,
55].
Table 7 provides the computed values for the metrics outlined previously. The model demonstrates a strong performance in evaluating the perceptions of the Portuguese population on the economic impacts of biotechnology-based technologies, as evidenced by high sensitivity and specificity values varying from 0.82 to 0.98. This fact is reinforced by high PPV and NPV values, varying from 0.89 to 0.98.
The variance-based sensitivity analysis [
56] was carried out to explore the influence of ANN inputs on the outputs. This relative importance (RI) analysis aids in comprehending the contributions of the inputs in determining the outputs. The findings indicate that the perceptions of the Portuguese population on the economic impacts of biotechnology-based technologies is most strongly influenced by the themes
Impact on Health (RI = 0.26),
Impact on Industry (RI = 0.24), and
Impact on Energy Resources (RI = 0.21), whereas the themes
Impact on Agriculture (RI = 0.16) and
Impact on Environment (RI = 0.13) have a reduced impact. These outcomes align with those expressed in
Section 3.1. Undeniably, the frequency of
I don’t know responses concerning
Impact on Health,
Impact on Industry, and
Impact on Energy Resources themes indicates that even small differences in these responses can lead to great effects on the perception of the economic impacts of biotechnology-based technologies.


