Abstract
Public parks play an important role in determining the quality of life in any modern city. A close and accessible public park is considered to be an important feature of a city as it has many positive impacts on people’s health, as well as offering a sustainable environment. As one of the Middle East’s largest capital cities, Riyadh is growing and expanding rapidly in terms of area and population. To date, little research has been conducted to determine the accessibility and adequacy of public parks, particularly in those areas that do not have ready access to them. This study develops a new measurement approach that examines this issue in terms of the various administrative areas and suburbs of Riyadh. The results of spatial data analysis may benefit the development of areas that have inadequate public parks, among other issues, taking into consideration their geographic location, administrative areas, suburb sizes, and population density. The features of the various administrative areas and suburbs will be compared and conclusions drawn.
1. Introduction
In recent years, with the rapid increase in its size and population, Riyadh, the capital of Saudi Arabia, has become one of the fastest-growing cities in the world [1]. Knowing how to improve people’s quality of life and the sustainable environment of this city is one of the central concerns of city administrators [1,2]. Urban parks are crucial to enhancing people’s quality of life since they serve as locations for many types of recreational and social activities such as daily walking and social interaction with neighbors. Moreover, parks can improve the air quality in urban areas [2]. To the best of our knowledge, no existing research has investigated the accessibility of Riyadh’s city parks. This paper addresses this gap by developing a new measurement approach to examine the adequacy of public parks in different areas of Riyadh.
People’s work patterns and crowded schedules can have a negative effect on the social interactions among urban dwellers [3,4,5]. The establishment of urban parks could be one way to encourage and strengthen the social connection among the many community groups by providing a venue for planned activities, including health campaigns, sports, leisure, daily walks, and planting initiatives, as well as creating a sustainable environment. In addition to encouraging socialization, urban parks can offer pleasant locations for family gatherings and leisure activities, strengthening social connections. Furthermore, parks can serve as a hub for social gatherings and promote harmony amongst neighbors and family members [6]. Earlier research found that people residing in communities with greater amounts of greenery and public open spaces develop stronger social relationships [4].
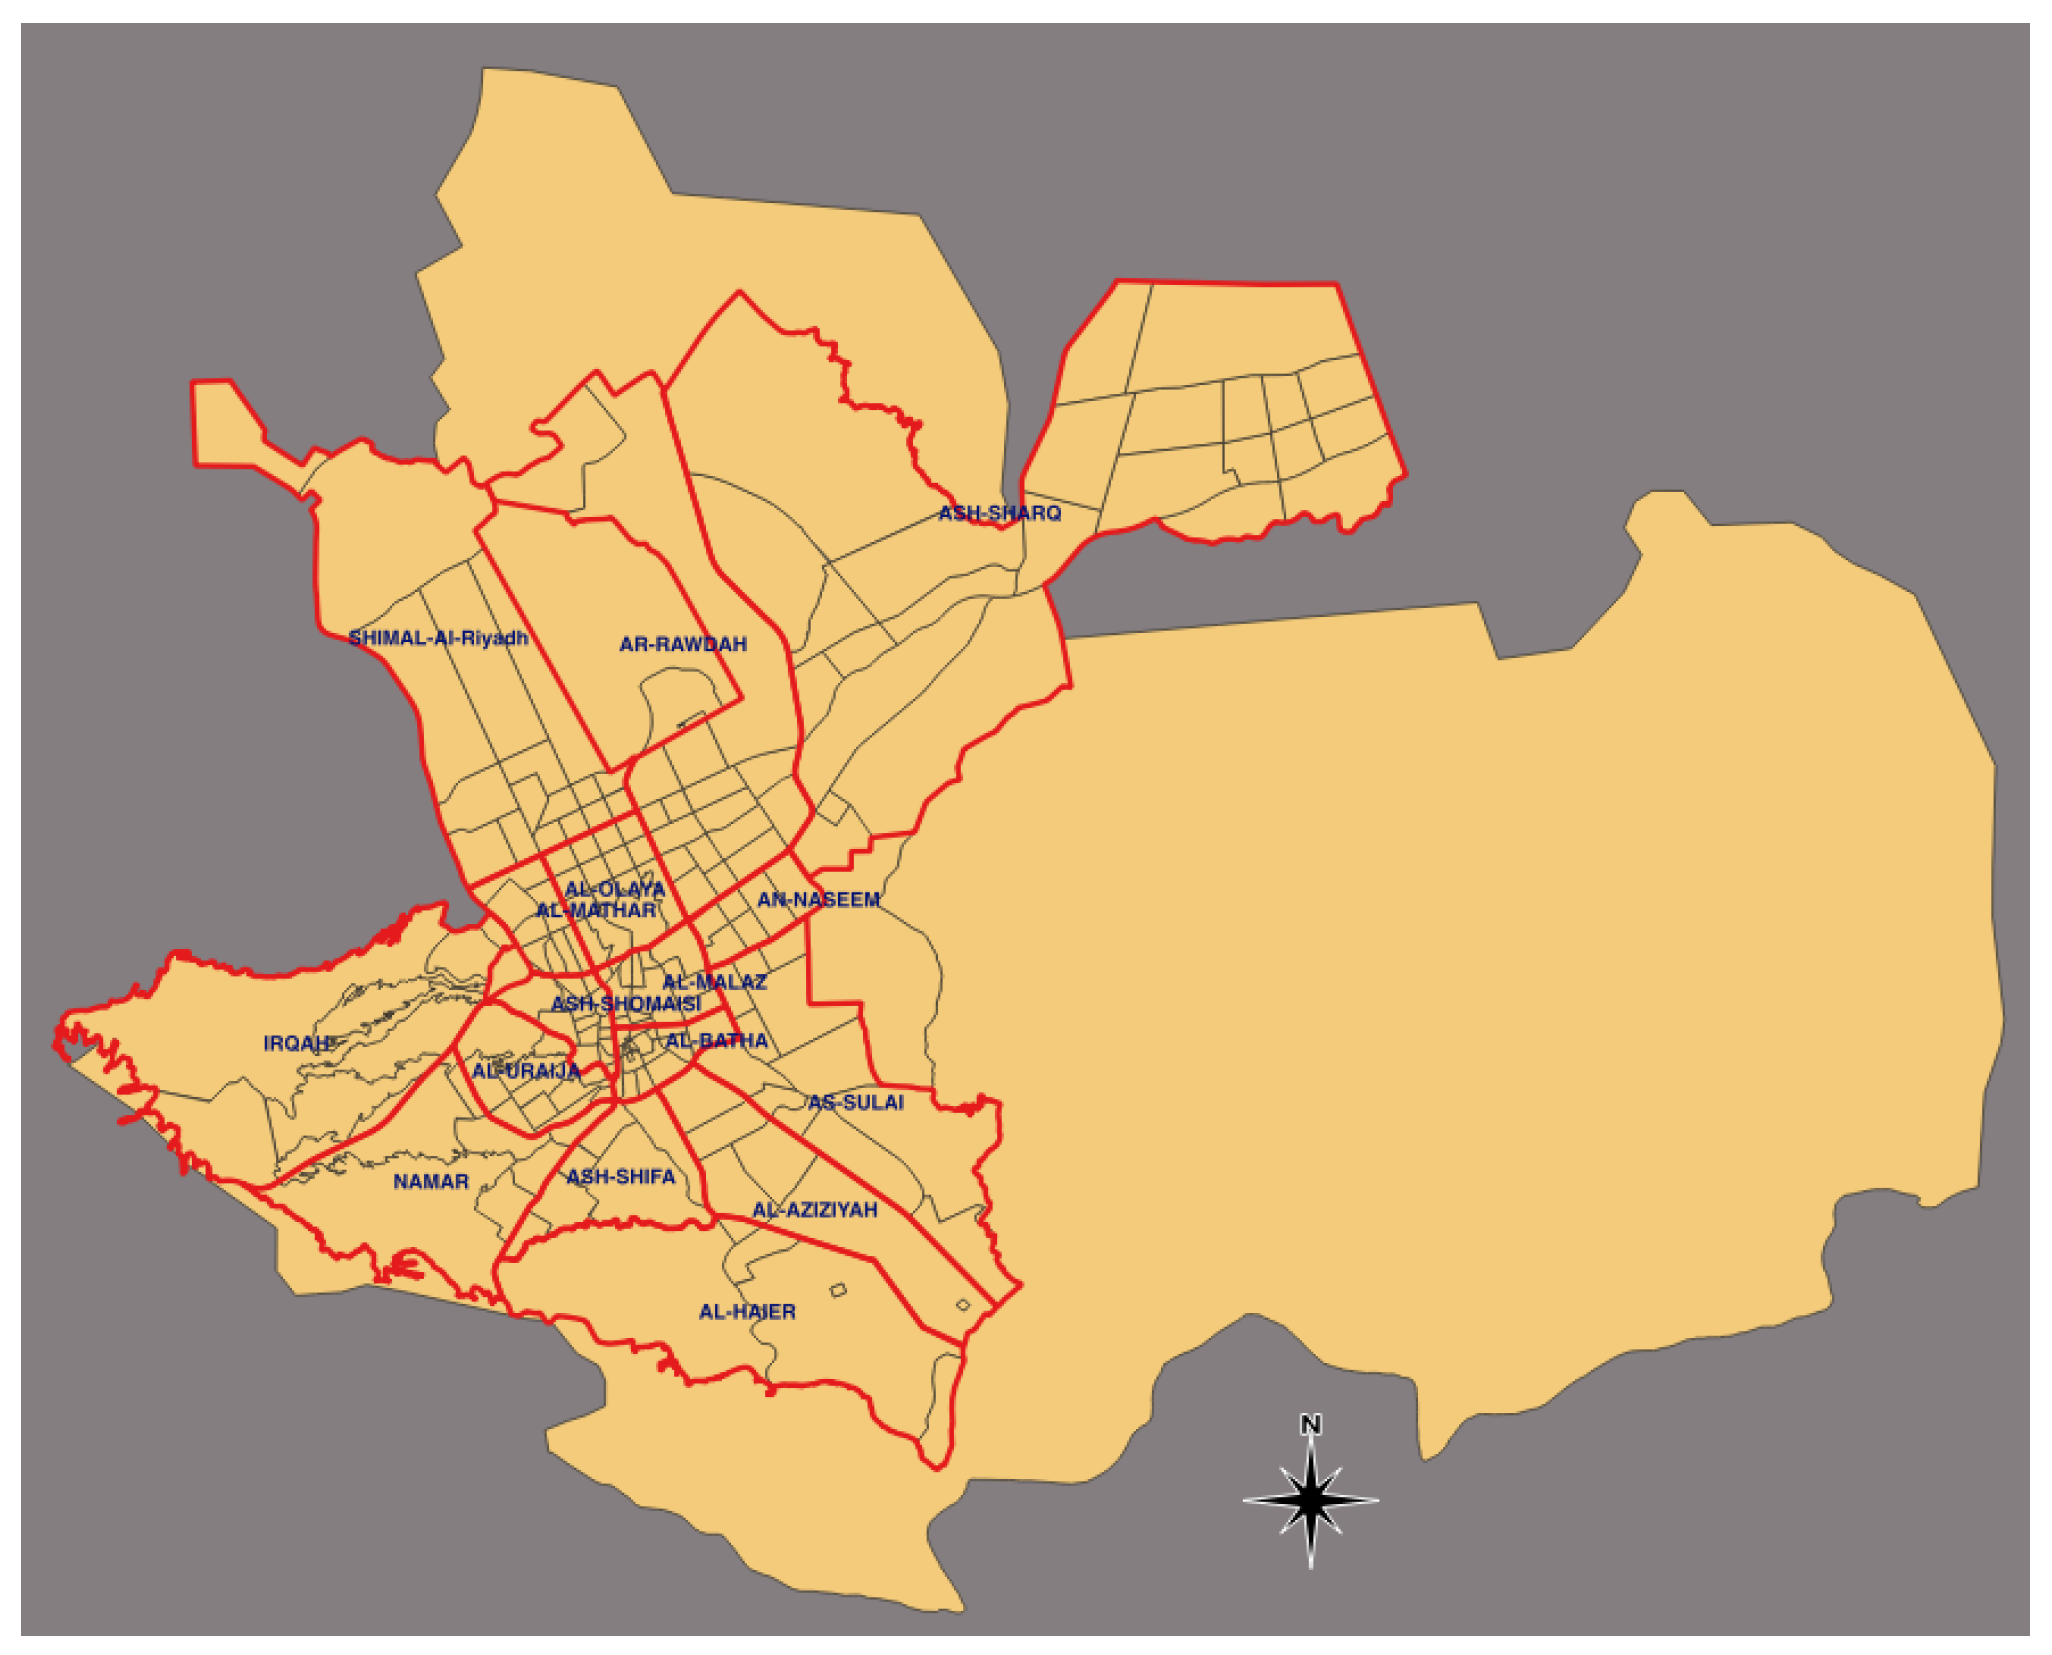
Saudi Arabia’s Vision 2030, which aims to diversify the economy and reduce its reliance on oil, emphasizes the importance of Riyadh [1] as it is a major center for commerce, banking, and administration. Hence, it plays a crucial role in the nation’s economic growth strategy [1]. According to Vision 2030, the city is a significant hub for development and investment. It will be home to new industries such as technology, healthcare, education, and tourism. With plans to create train links to other cities in the area and expand its airport, Riyadh will also serve as a significant center for logistics and transportation. Within the next ten years, it is expected that the population will reach 15 million [1]. Therefore, in this city, access to an adequate number of parks and leisure sites is essential as these facilities will help to improve the quality of life of its current and future residents. Figure 1 provides a visual representation of Riyadh, detailing the city’s municipalities and the specific neighborhoods located within each administrative division.
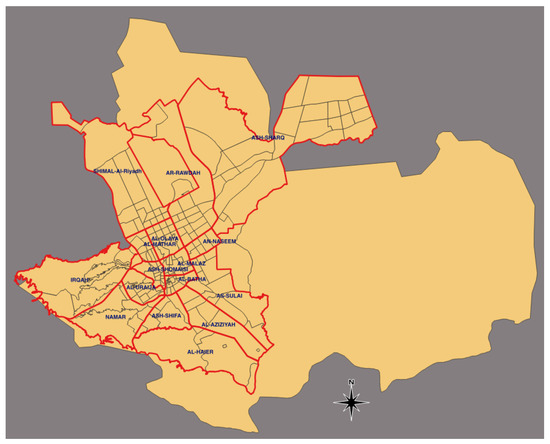
Figure 1.
Riyadh city and its municipalities and neighborhood boundaries.
In this paper, we examine the accessibility of public parks in Riyadh’s suburbs and administrative regions, taking into account the various features of this city. We create a new model for measuring public park accessibility and use these indices to improve our comprehension and understanding of the accessibility of parks in Riyadh. Section 2 describes various types of parks and their function and presents the literature review. Section 3 begins with the datasets and population statistics being examined. Section 4 introduces the proposed methodologies (including availability calculations) for determining catchment areas and blank areas. Section 5 presents a detailed discussion of our findings, summarizing and evaluating the principal accessibility trends and their impact on suburbs. Section 6 concludes the study and offers suggestions for future research in this area.
2. Background
Public parks play an important role in improving the quality of life in urban areas and sustainable environments [3,7]. These parks provide spaces where people of all ages can come together to relax, exercise, and reconnect with nature [8]. Urban parks serve as public spaces that can offer a wide range of activities such as tourism, recreation, scientific exploration, and physical exercise [4,9,10]. The main focus of Vision 2030 is on economic and social development, but it also recognizes the importance of sustainable urban development; environmental protection; and improved public facilities, including public parks. Public parks play an important role and contribute to several aspects of the plan. Moreover, one of the aims of Vision 2030 is to build a more vibrant society with diverse cultural, entertainment, and sporting opportunities. Therefore, public parks can support these goals by providing spaces for such activities and events. In addition, parks can contribute to the Vision’s environmental sustainability goals by making cities greener, improving air quality, and mitigating urban heat island effects [1,11]. Additionally, well-designed parks help manage stormwater, protect biodiversity, and provide habitat for native species [11,12]. In addition to health and well-being, the Vision emphasizes the importance of promoting healthy lifestyles and improving public health.
Public parks play an important role in improving the quality of life in urban areas and creating sustainable environments [3,7]. These parks provide spaces where people of all ages can come together to relax, exercise, and reconnect with nature [8]. Urban parks serve as public spaces that can offer a wide range of activities such as tourism, recreation, scientific exploration, and physical exercise [4,9,10]. The main focus of Vision 2030 is on economic and social development while also recognizing the importance of sustainable urban development; environmental protection; and improvement of public facilities, including public parks. Public parks play an important role in urban life and reflect several aspects of Vision 2020. Moreover, one of the aims of Vision 2030 is to build a more vibrant society with diverse cultural, entertainment, and sporting opportunities. Public parks can help to achieve these goals by providing spaces for such activities and events. In addition, parks can contribute to the Vision’s environmental sustainability goals by making cities greener, improving air quality, and mitigating urban heat island effects [1,11]. Additionally, well-designed parks help manage stormwater, protect biodiversity, and provide habitat for native species [11,12]. In addition to individual health and well-being, the Vision emphasizes the importance of promoting healthy lifestyles and improving public health overall.
Regarding park size, there is no generally accepted minimum size for public parks as the appropriate size will depend on factors such as the purpose of the park, the surrounding urban conditions, and the needs of the community [12,13]. Parks range from small parks and parklets to large regional parks spanning several acres. For example, parklets (small parks often less than an acre in size) serve local neighborhoods and are designed for passive recreation and small gatherings. They provide green spaces, seating, and respite from the urban environment. Iit is interesting to note that the majority of public parks in Riyadh city are parklets. On the other hand, neighborhood parks are generally larger, ranging in size from 1 acre to 10 acres. They can include playgrounds, picnic areas, and hiking trails. Community parks typically range in size from 10 to 50 acres, serve multiple areas, and offer a wide variety of recreational facilities including sports fields and community centers [13]. The largest type of park is the regional park that covers an area of 50 hectares or more and may include extensive natural landscapes, long trail networks, and special facilities such as golf courses and botanical gardens [12,13,14]. The current study examined all these types of parks, as well as playgrounds, athletic fields, picnic areas, and walking paths.
There is no universally agreed-upon “acceptable” walking distance from a park as it depends on many factors, including personal preference, physical ability, and urban planning [2,15,16]. However, a commonly used guideline in the planning and design of city parks is the “five or ten-minute walk” rule. This suggests that, ideally, residents should have access to a park within a 5- to 10-min walk from their home. This distance is usually around 400–800 m. It must be noted that these distances are general guidelines and individual circumstances may vary. Factors such as local climate, topography, and the availability of convenient pedestrian routes can also affect optimal walking distances to parks [17,18,19]. Therefore, in this research, we adopt 500 m as an acceptable walking distance to public parks. This research necessitates accounting for Riyadh’s distinctive urban characteristics. Notably, the city experiences high temperatures for a significant portion of the year. Therefore, ideally and to ensure walkability, a planning strategy should aim for shorter distances to parks. Furthermore, the accessibility model was applied, considering a 1000-m walking radius to assess its effectiveness and identify any substantial reduction in areas lacking park access. Additionally, Riyadh’s urban design indicates the heavy dependence on vehicles, with most pedestrian infrastructure still under development. These factors collectively suggest that shorter walking distances to facilities must be prioritized. An investigation of the city’s intricate pattern of varying population densities is also crucial for a comprehensive analysis.
3. Literature Review
Numerous studies have emphasized the importance of having accessible city parks, especially in terms of sustainable urban growth. The interconnection of property types, neighborhoods, and parkland is highlighted in these studies as a key element to be considered when improving access to various areas of the city. There are many differences between areas in terms of access to parks, which are not dispersed equitably among communities and suburbs.
For example, a study was conducted by [20], who used GIS (Geographic Information Systems) to examine the distribution of parks in Los Angeles, California and their accessibility by different demographic groups. The research found that high-income and predominantly white neighborhoods had better access to large public parks, while low-income and minority communities had limited access. This highlights the importance of ensuring equity in park planning and development. In another study [21], the distance between residential areas and green spaces throughout the roadway network was calculated by the researchers as part of their network-based method of measuring accessibility. Additionally, they used statistical analysis to investigate the connections between various socioeconomic and demographic variables and the accessibility of green spaces. The study’s main conclusions are as follows: Phoenix has an unequal distribution of urban green areas, with some communities having much better access to green space than others. Compared to low-income neighborhoods and those with a higher percentage of minority people, high-income neighborhoods have better access to urban green spaces. Another study examined the acceptability of public parks in Seoul, in which “accessibility” is not merely about the Euclidean (i.e., straight-line) distance; it includes other urban features such as crossroads and park entrances [22]. These results have important implications for the economic impact of urban parks in Seoul. The study also confirmed that access to parks was influenced by people’s socioeconomic status [22].
Previous research has also focused on various other factors related to public park accessibility. For example, the health factor has been considered in the research by [9,23]. Other research considered the availability and openness of urban green spaces, including parks, in numerous European cities [24]. The findings portray a variegated image of the EU. Cities in Southern Europe have below-average availability ratings, which may be explained by their sparse forest and tree cover and reflect the region’s urban past. Other research has examined the effects of park size, accessibility, and amenities on levels of physical activity [2,13,25]. The findings suggest that bigger parks and parks with certain amenities (such as trails) can encourage higher levels of physical activity. However, the aim of this current research is to investigate the availability and accessibility of parks in Riyadh, one of the world’s largest cities.
The analysis of GIS spatial data pertaining to various public services has been the subject of numerous research studies. For instance, ref. [18] investigated methods used to determine the ease with which the residents in the metropolitan area of Melbourne (Australia) can access public transportation. This involves factors such as distance to public transport stops, travel time using public transport, and regularity of service. GIS-based spatial analysis offers tools for visualizing patterns, determining underserved areas, and developing strategies to improve the delivery of services for the benefit of diverse communities. An additional illustration is provided by a study carried out in the Chinese city of Xiamen, which depends largely on buses for public transit. The study investigated the relationship between real estate prices and the accessibility of public transportation [26]. The study examined the relationship between two aspects of bus accessibility and housing prices: by-bus accessibility (measured by the frequency and length of bus travel to city centers) and to-bus accessibility (measured by the number of nearby bus stops). Both accessibility measures, according to the research, have a favorable impact on housing prices. It is interesting to note that the impact of bus frequency is higher in the periphery than in the center.
4. Dataset and Method
4.1. Dataset
4.1.1. Public Parks Dataset
The public services dataset provides information about Riyadh city and its public parks, which is the main focus of this research. This dataset is available on the Riyadh Region Municipality open data portal, (https://www.alriyadh.gov.sa/en/content/K2RKNGpINitnSkU9, accessed on 2 February 2023). Unlike some cities where park types are often separate, many of Riyadh’s public parks frequently comprise playgrounds, athletic fields, picnic areas, and walking paths within a single location. Therefore, this research considered all types of parks (including all sizes, and those with or without playgrounds, athletic fields, picnic areas, and walking paths). The OpenStreetMap (OSM) from the PlanetOSM was also used to obtain the location of public parks within Riyadh’s road network (https://planet.openstreetmap.org/, accessed on 10 March 2023). Despite being a crowd-sourced dataset and therefore susceptible to mistakes, the data from OpenStreetMap (OSM) demonstrates a high level of alignment with other digital map platforms such as Google Maps and Riyadh GIS portal. Also, population and density were obtained from the general authority for statistics via the open data portal (https://www.stats.gov.sa/en/statistics-overview, accessed on 20 October 2023).
4.1.2. Neighborhood Boundaries Dataset
The neighborhood boundaries dataset, which is provided by the Riyadh Region Municipality, is a data format that shows the boundaries between the 196 suburbs of Riyadh and the administrative areas to which each of these suburbs belongs and for which each municipal administrative authority is responsible. The neighborhood boundaries dataset and the scope of the administrative municipalities dataset are provided by the open data system of Riyadh Region Municipality via their GIS Portal (https://www.alriyadh.gov.sa/en/content/K2RKNGpINitnSkU9, accessed on 2 February 2023).
4.2. Method
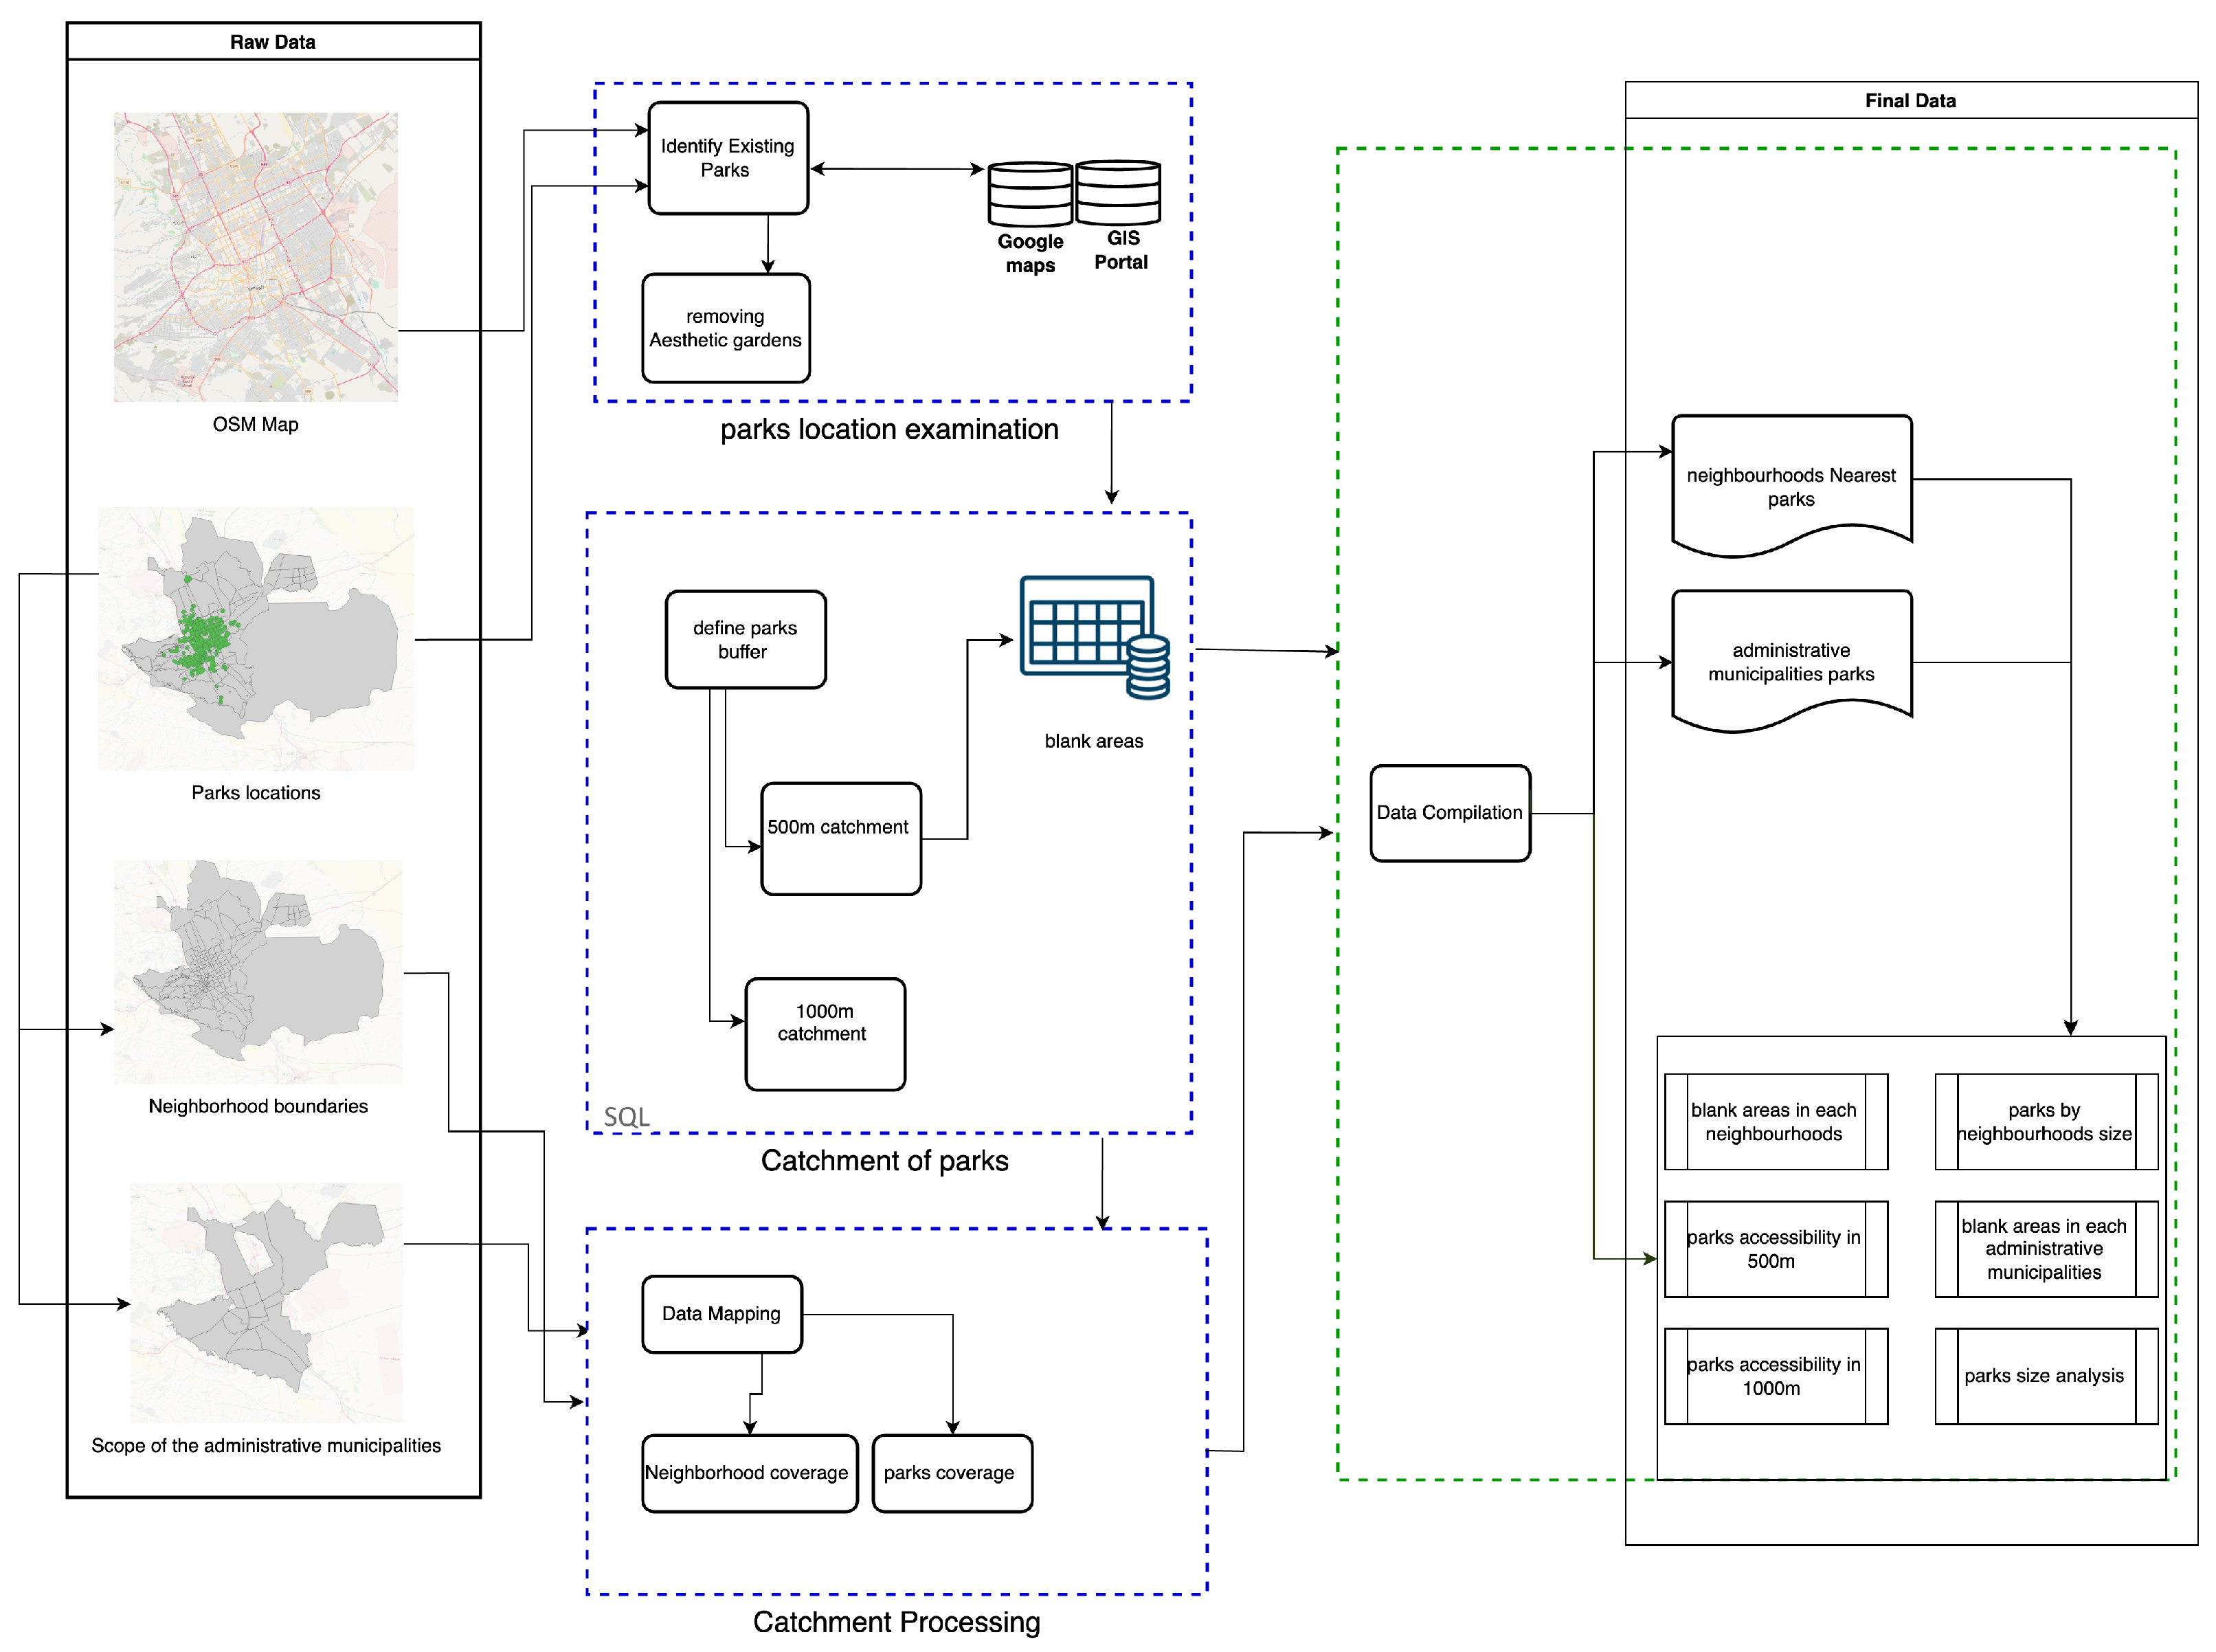
Our framework comprises three main steps: (i) data pre-processing and determination of park locations; (ii) query processing; and (iii) catchments processing (see Figure 2). The details of each step are discussed separately below. We implemented this framework in PostgreSQL 14 with the PostGIS extension, and the visualizations (for better clarity, the complete interactive maps are provided https://mega.nz/folder/A0Bn1aZa#qUsC0l20DT6DrKLhNjM8Mw/, accessed on 8 April 2024) were produced using QGIS 3.18 in the Windows 11 Professional platform using i7-1355U with 16 GB of RAM.
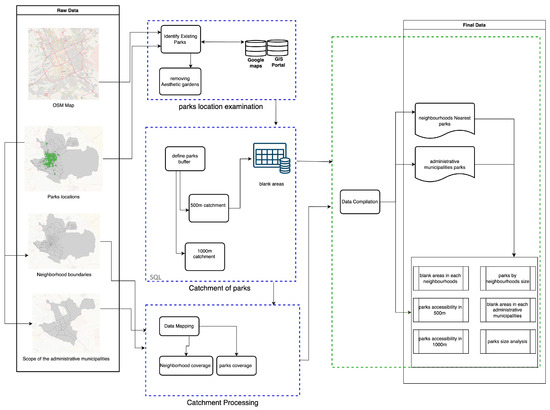
Figure 2.
The processing framework of data catchment.
4.2.1. Examination of Park Locations
Determining the locations and types of parks was an essential first step involving the preparation of datasets for further processing in subsequent steps. This first step involved the examination of the parks and the use of the GIS portal and Google Maps to verify the parks.
As shown in Figure 2, we used four data sources in this work: OSM, neighborhood boundaries, park locations, and the scope of the administrative municipalities. For the park locations, we needed to reconstruct the spatial objects, which are the park locations and the route design. Once the parks’ locations were verified, we mapped each park’s location and objects to the appropriate neighborhood.
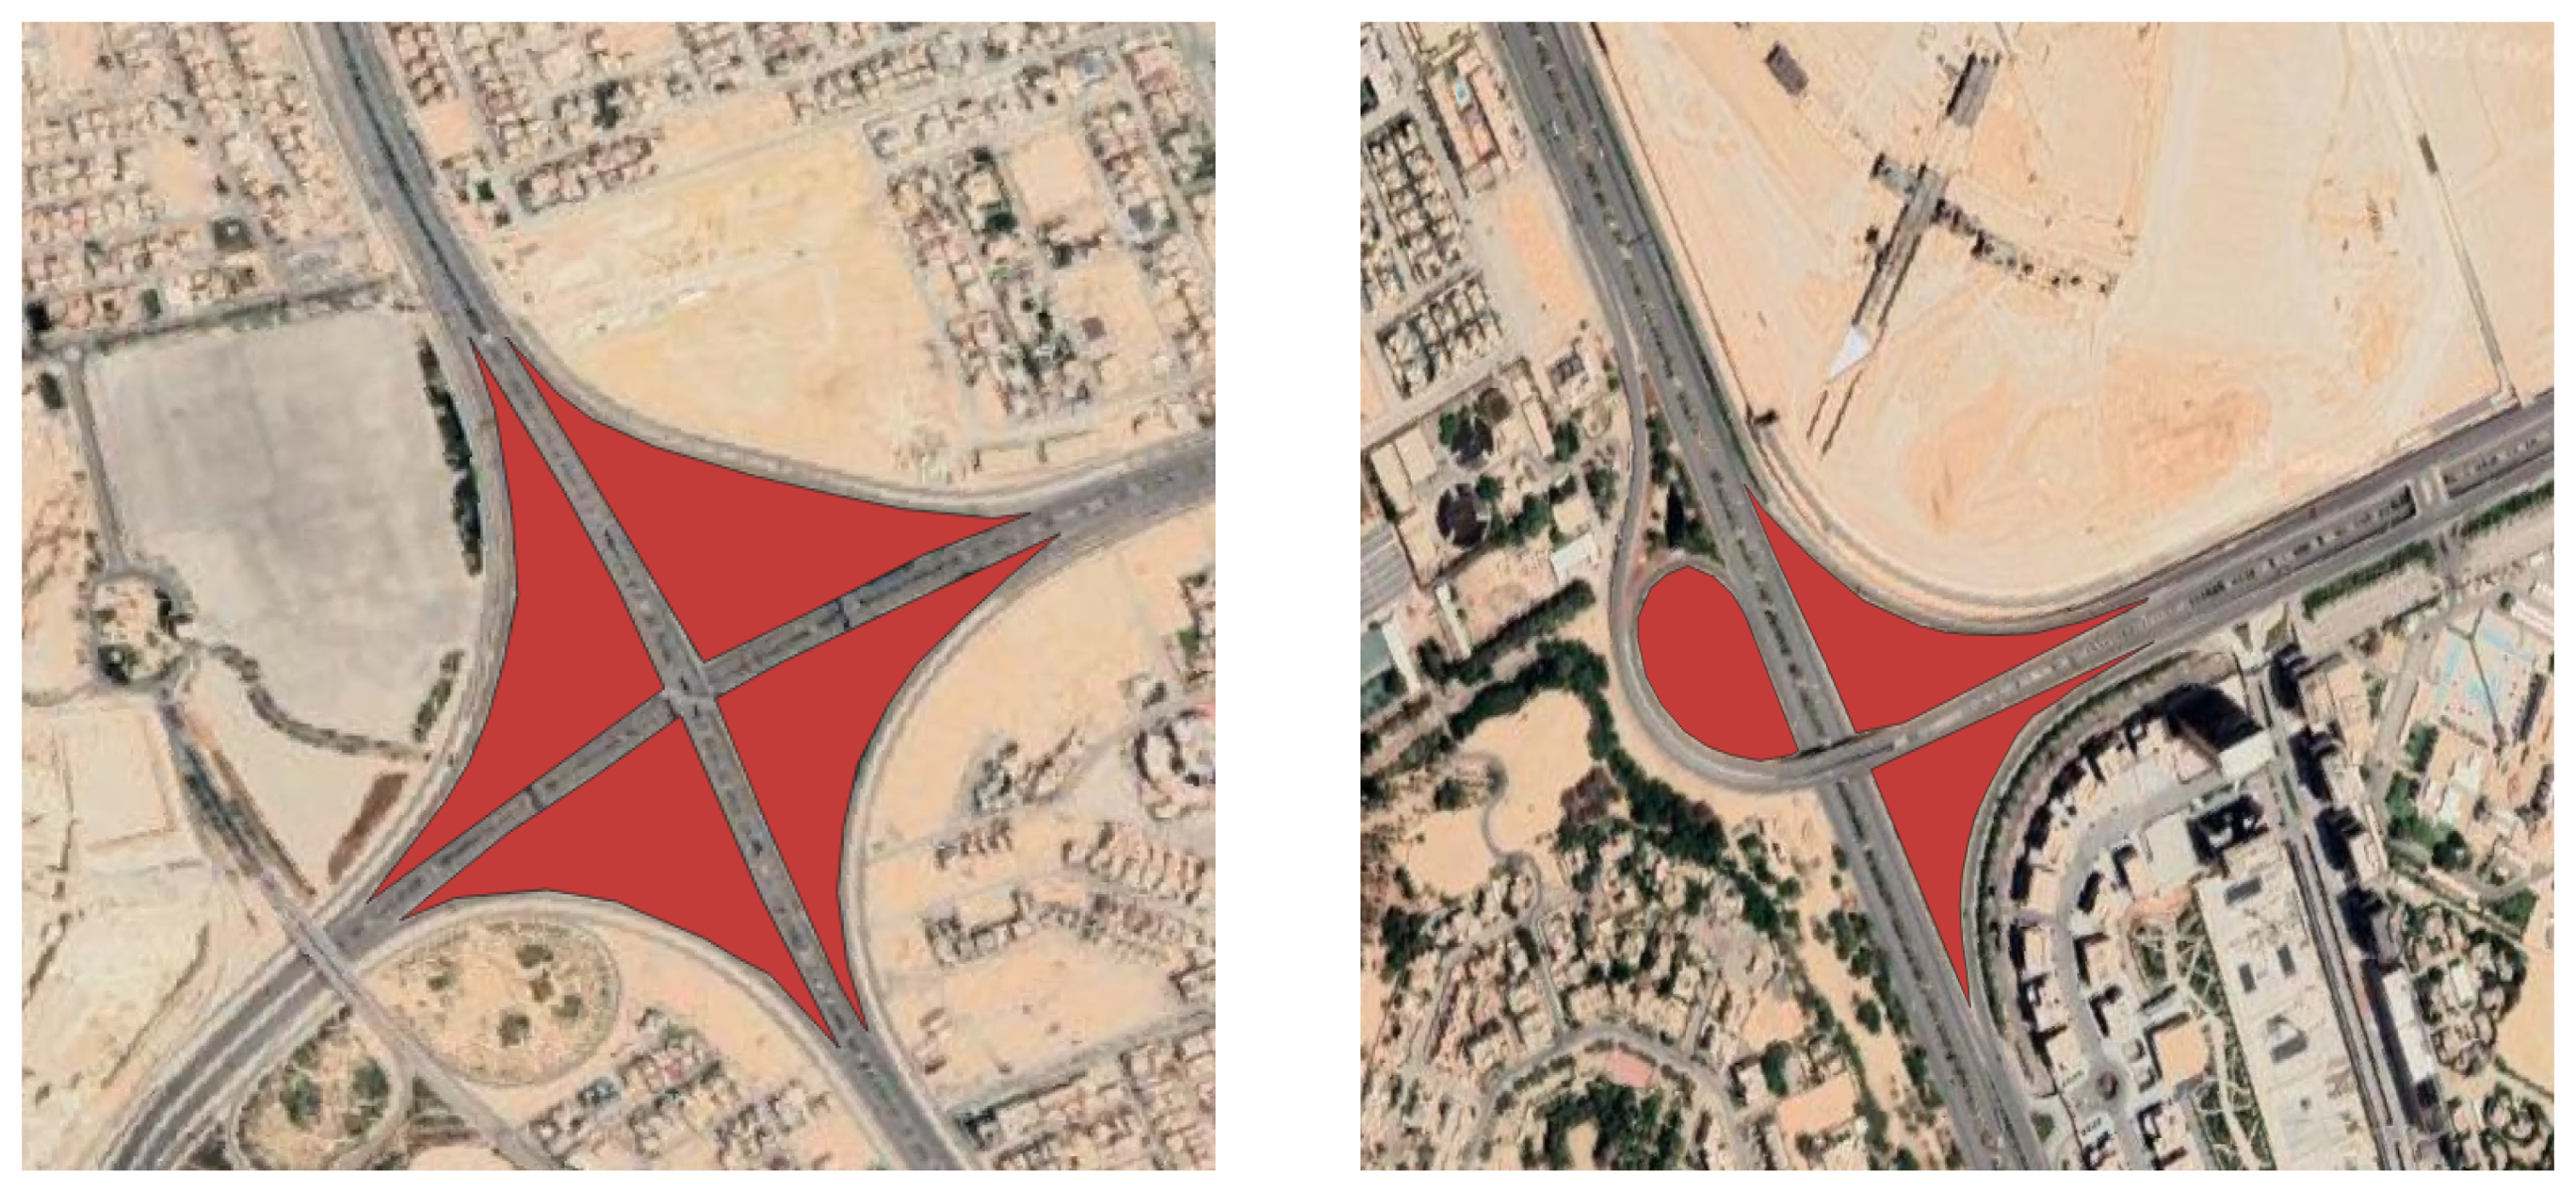
The framework verified the parks by mapping each park’s location and checking the OSM road network. Although some parks are listed as public parks in the dataset, they are associated with the highway and are therefore usually considered as aesthetic parks not accessible to the public. Because this study is concerned with the usability of parks, these aesthetic parks were not considered under our framework. Figure 3 shows an example of aesthetic parks.

Figure 3.
An example of removed the aesthetic parks.
4.2.2. Query Processing
The query processing step consisted of two main phases: defining the buffer or catchment range for all parks and identifying the area’s containment in every park catchment. Unfortunately, since the dataset did not include the mesh blocks, the analysis was based on areas not on smaller units such as mesh blocks.
In this study, we used a 500 m walking distance to public parks. Riyadh has high temperatures throughout most of the year. Therefore, residents should have to walk shorter distances. We also increased the walking distance to 1000 m to examine how the accessibility model performed and to determine whether there was a substantial decrease in the number of blank areas (areas that do not have access to any parks).
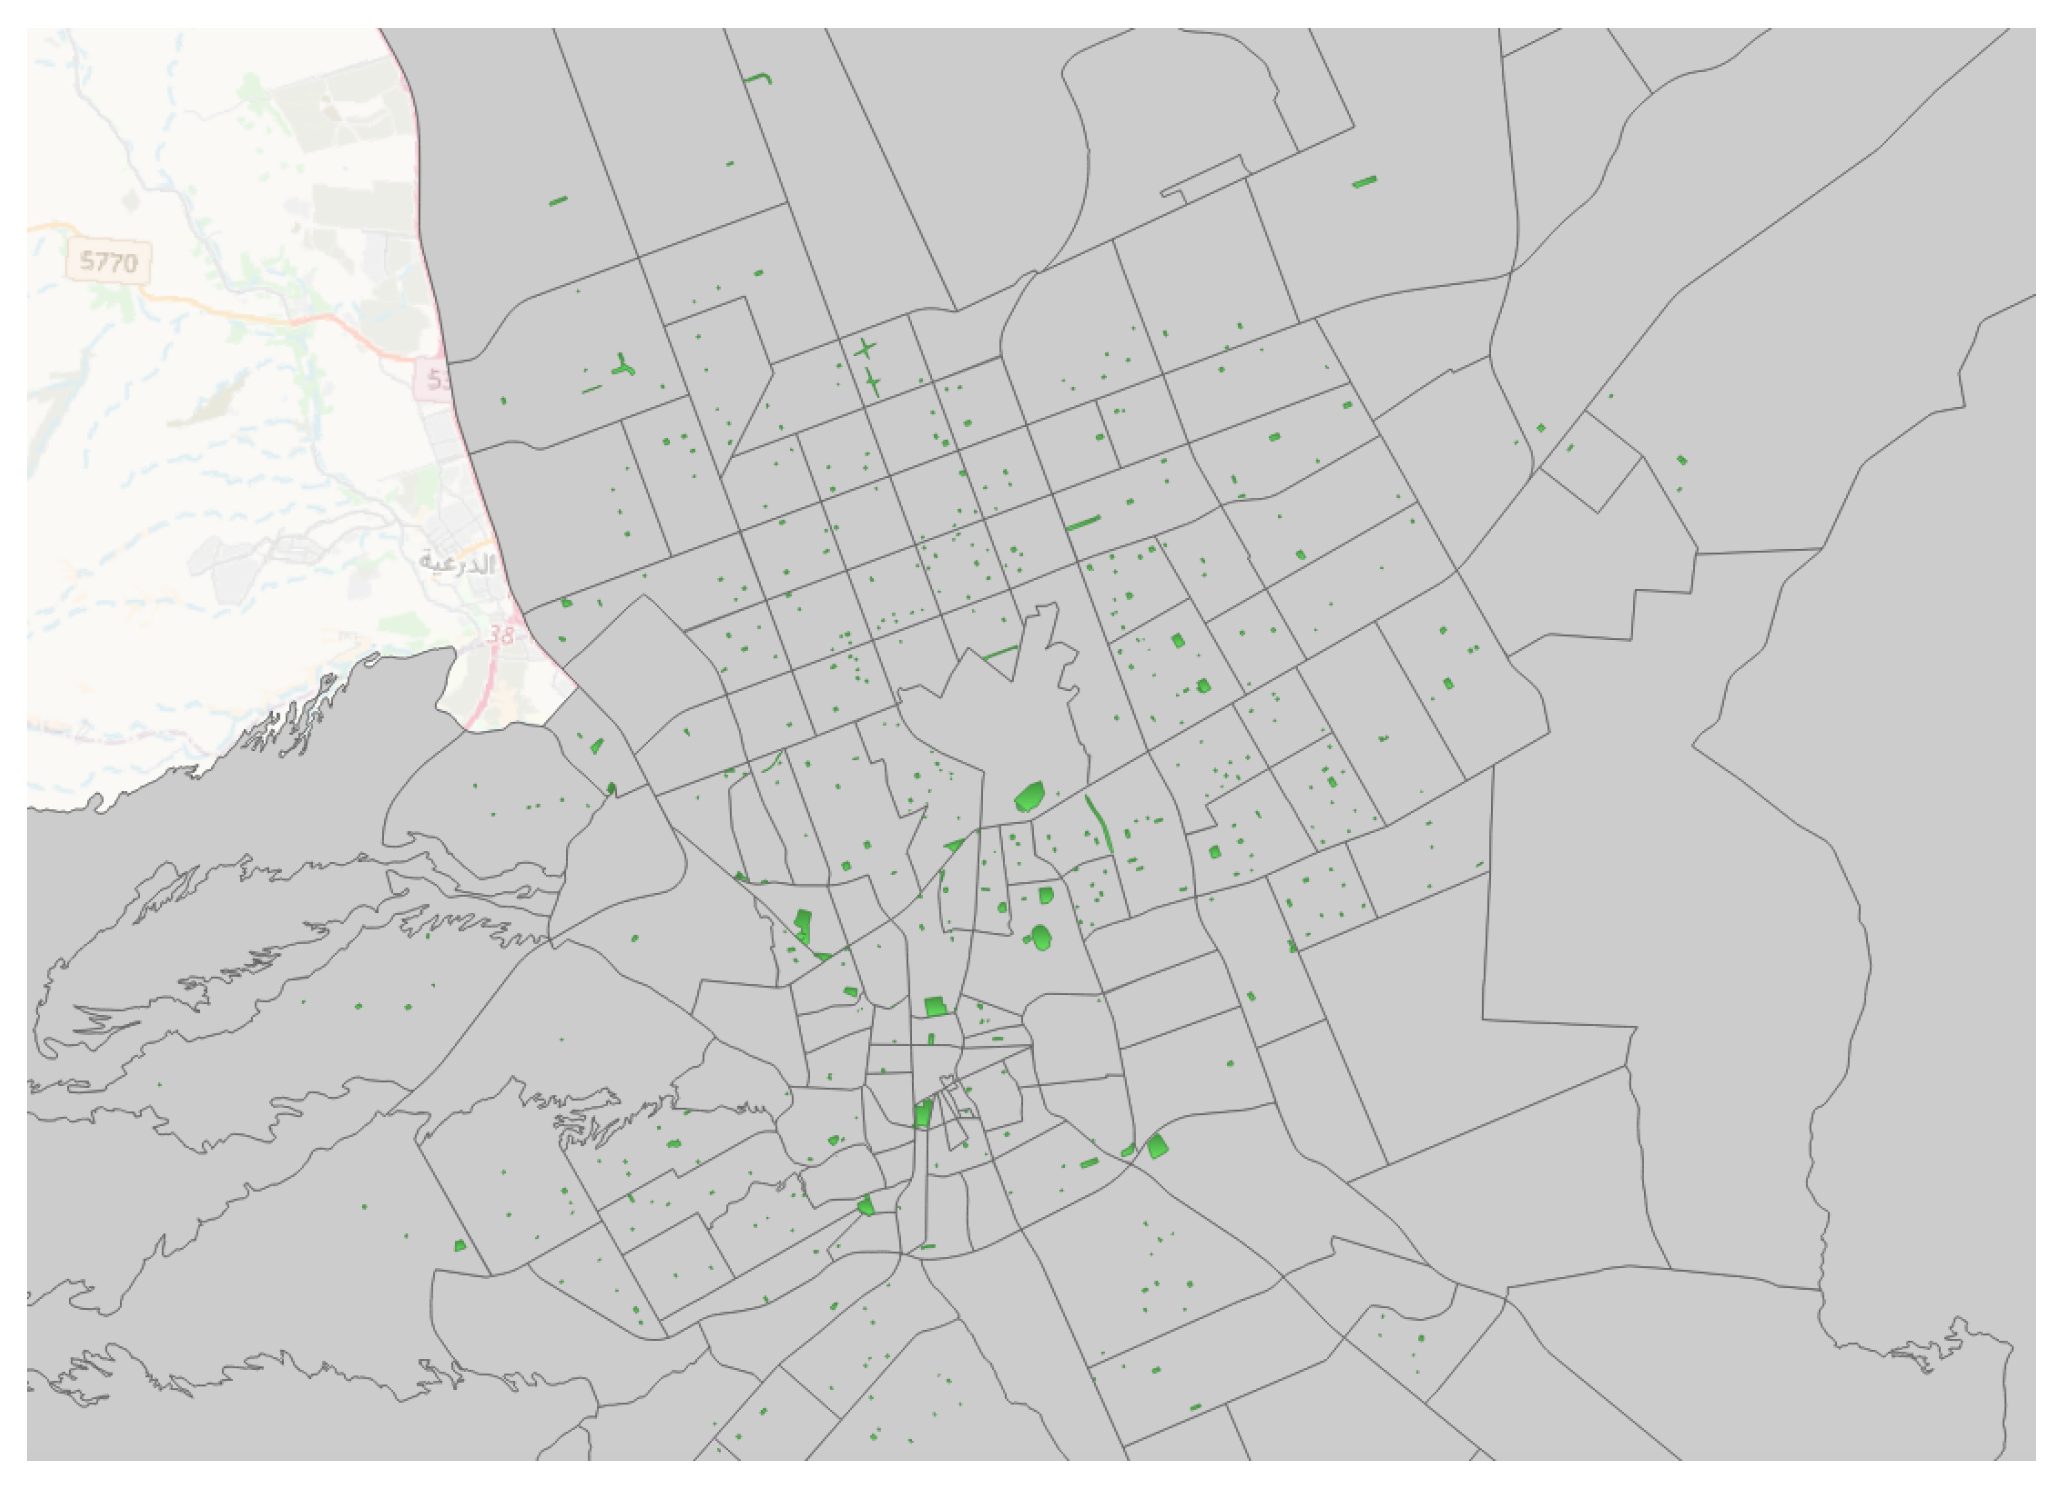
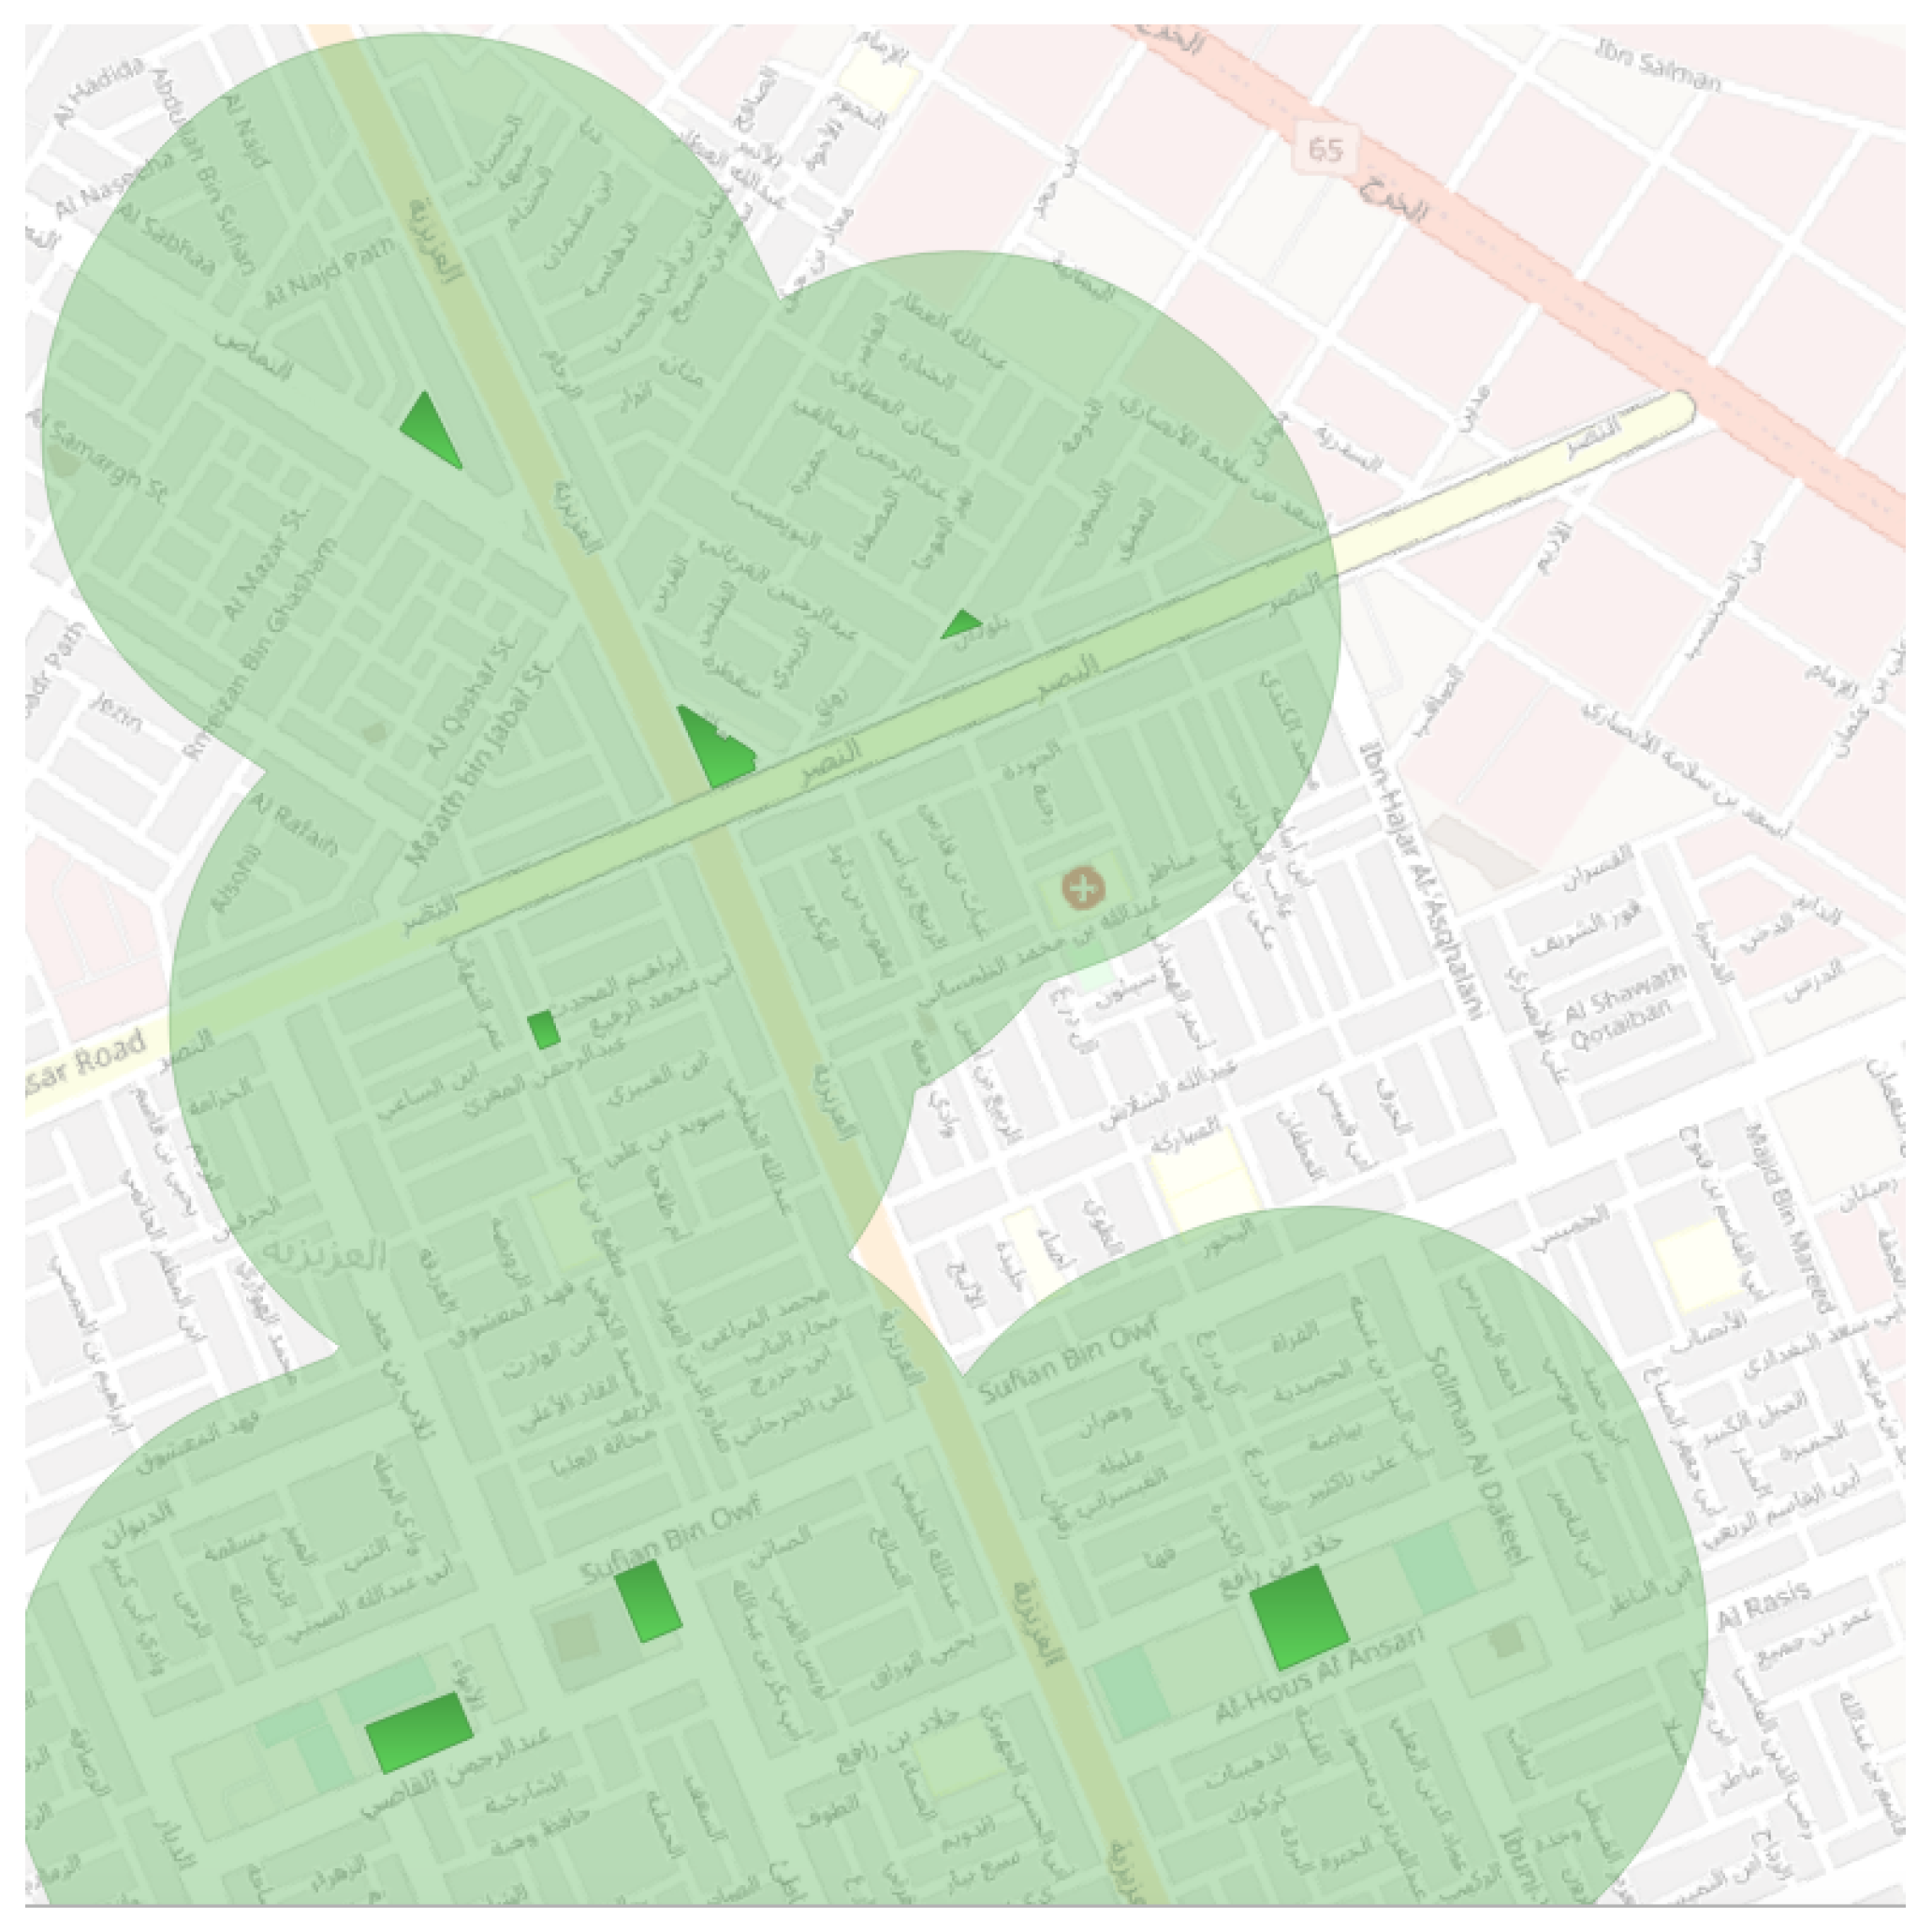
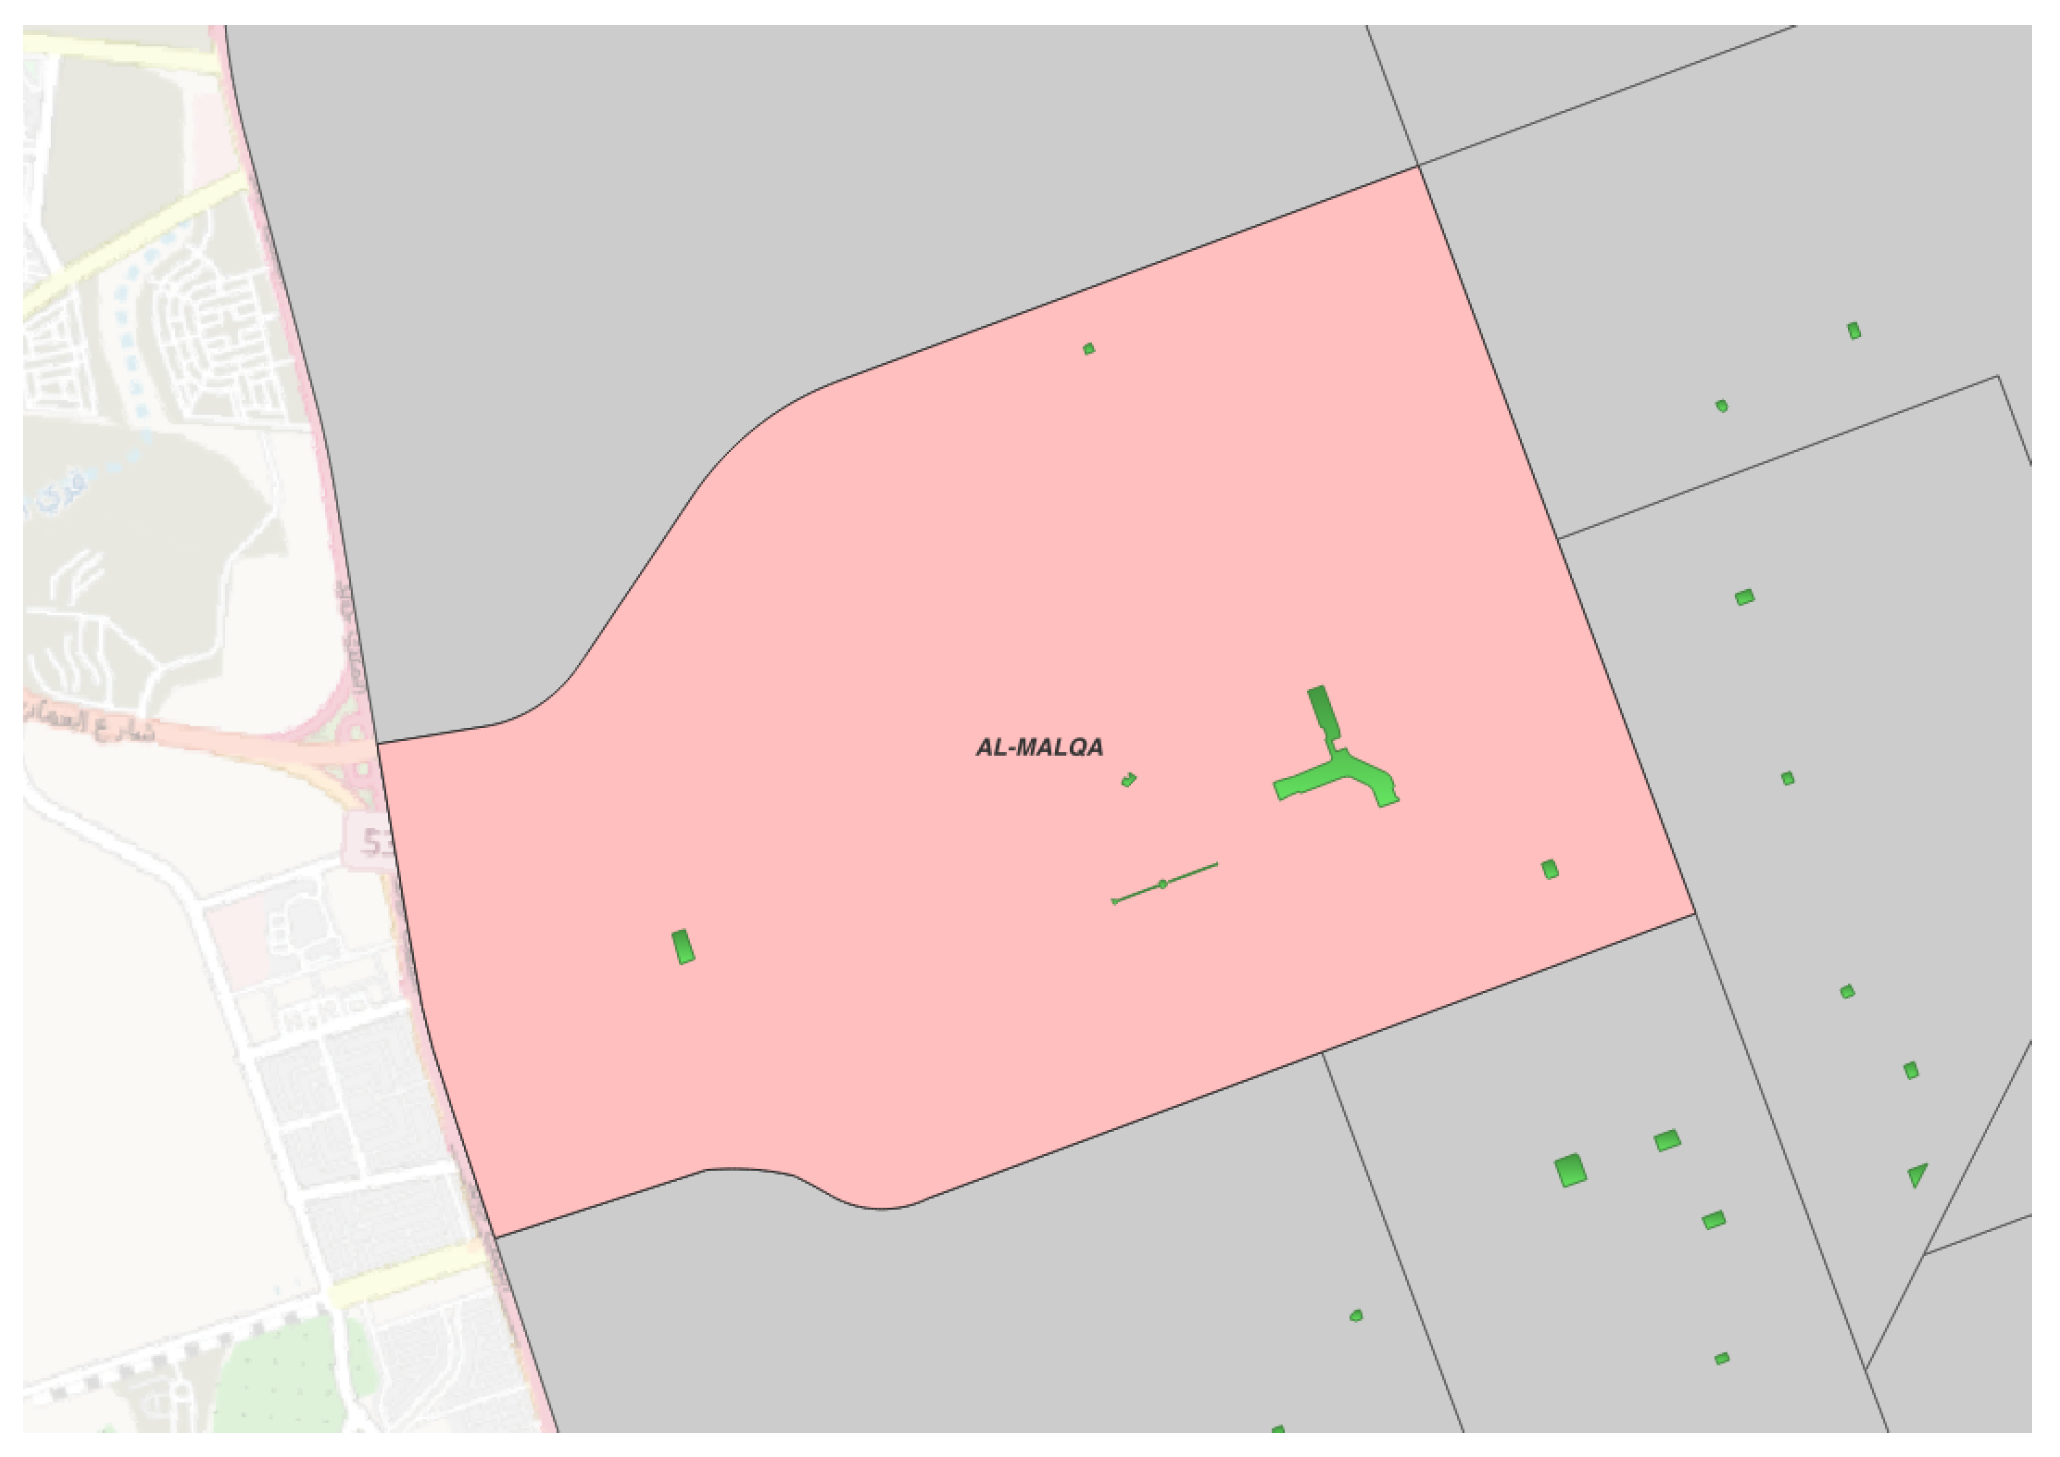
In this section, we explain the methodology used to identify the areas where parks are not accessible (known as blank areas). In Figure 4, we show the park’s locations; all of the park sizes; and the playgrounds, athletic fields, picnic areas, and walking paths. The park catchment is created in order to determine the mesh block that intersects with the park center park’s point buffer, taking into consideration the walking distance as explained above. Note that we consider any area intersecting with the park’s point buffer. Figure 5 shows the buffer of a park point and how it intersects with the surrounding areas. Figure 6 shows the blank areas (grey areas) identified between several catchments. Figure 7 shows the park count in the Almalqa Neighborhood, Riyadh. Note that this process addresses the overlapping of any type of park. Spatial SQL is used for this analysis. The current dataset for urban areas lacks the granularity needed to drill down to the mesh block level. Consequently, the catchment intersections of our approach are approximated. However, since they affect areas with short-distance walking scenarios, the catchment intersections remain unaffected. Algorithm 1 is used to determine the catchment for each park.
| Algorithm 1 Parks catchment algorithm |
|
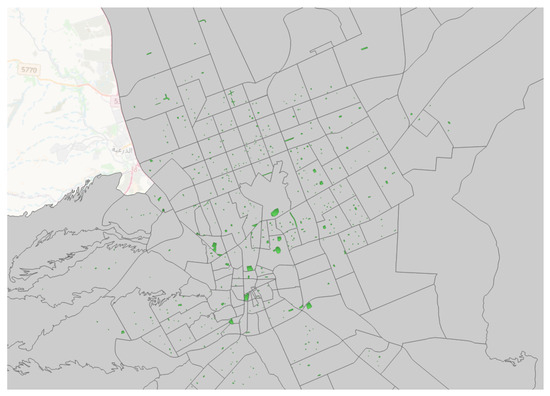
Figure 4.
All park sizes’ park locations and types.
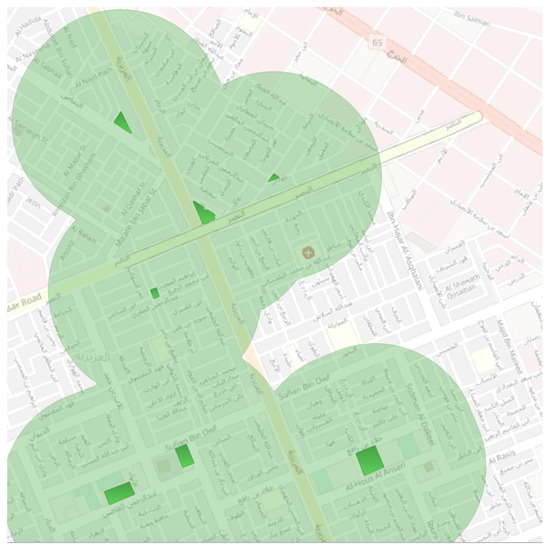
Figure 5.
Catchment Areas for 7 Parks.
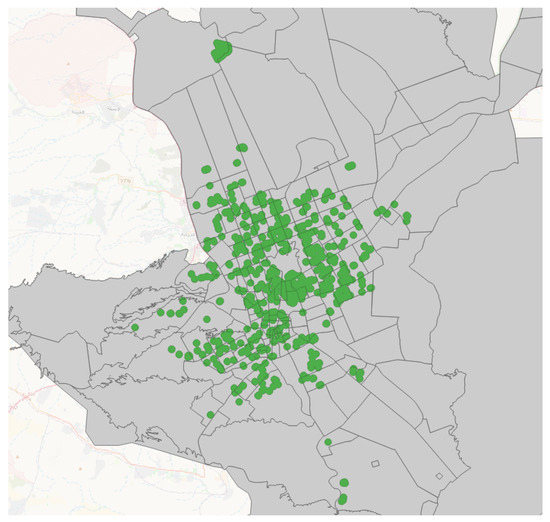
Figure 6.
Parks catchments.
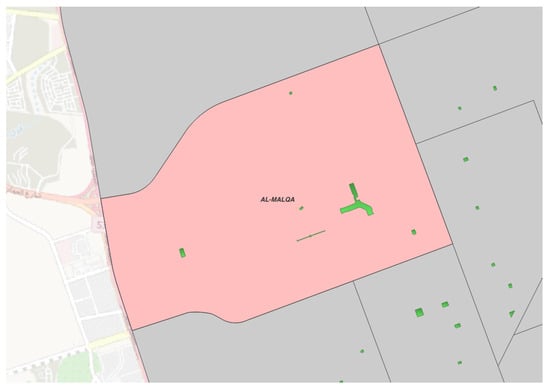
Figure 7.
Parks count in each neighborhood.
4.2.3. Catchment Processing
After determining the catchment of the parks, data mapping and neighborhood identification were performed to map the blank areas within each neighborhood. Note that the processing was carried out for 500-m catchments, and the distance was increased to examine the 1000-m catchments as well. The blank areas were identified using Algorithm 2.
| Algorithm 2 Blank areas algorithm |
|
5. Results
This section is divided into two sub-sections: Coverage and Blank Areas, and Discussion.
5.1. Coverage and Blank Areas
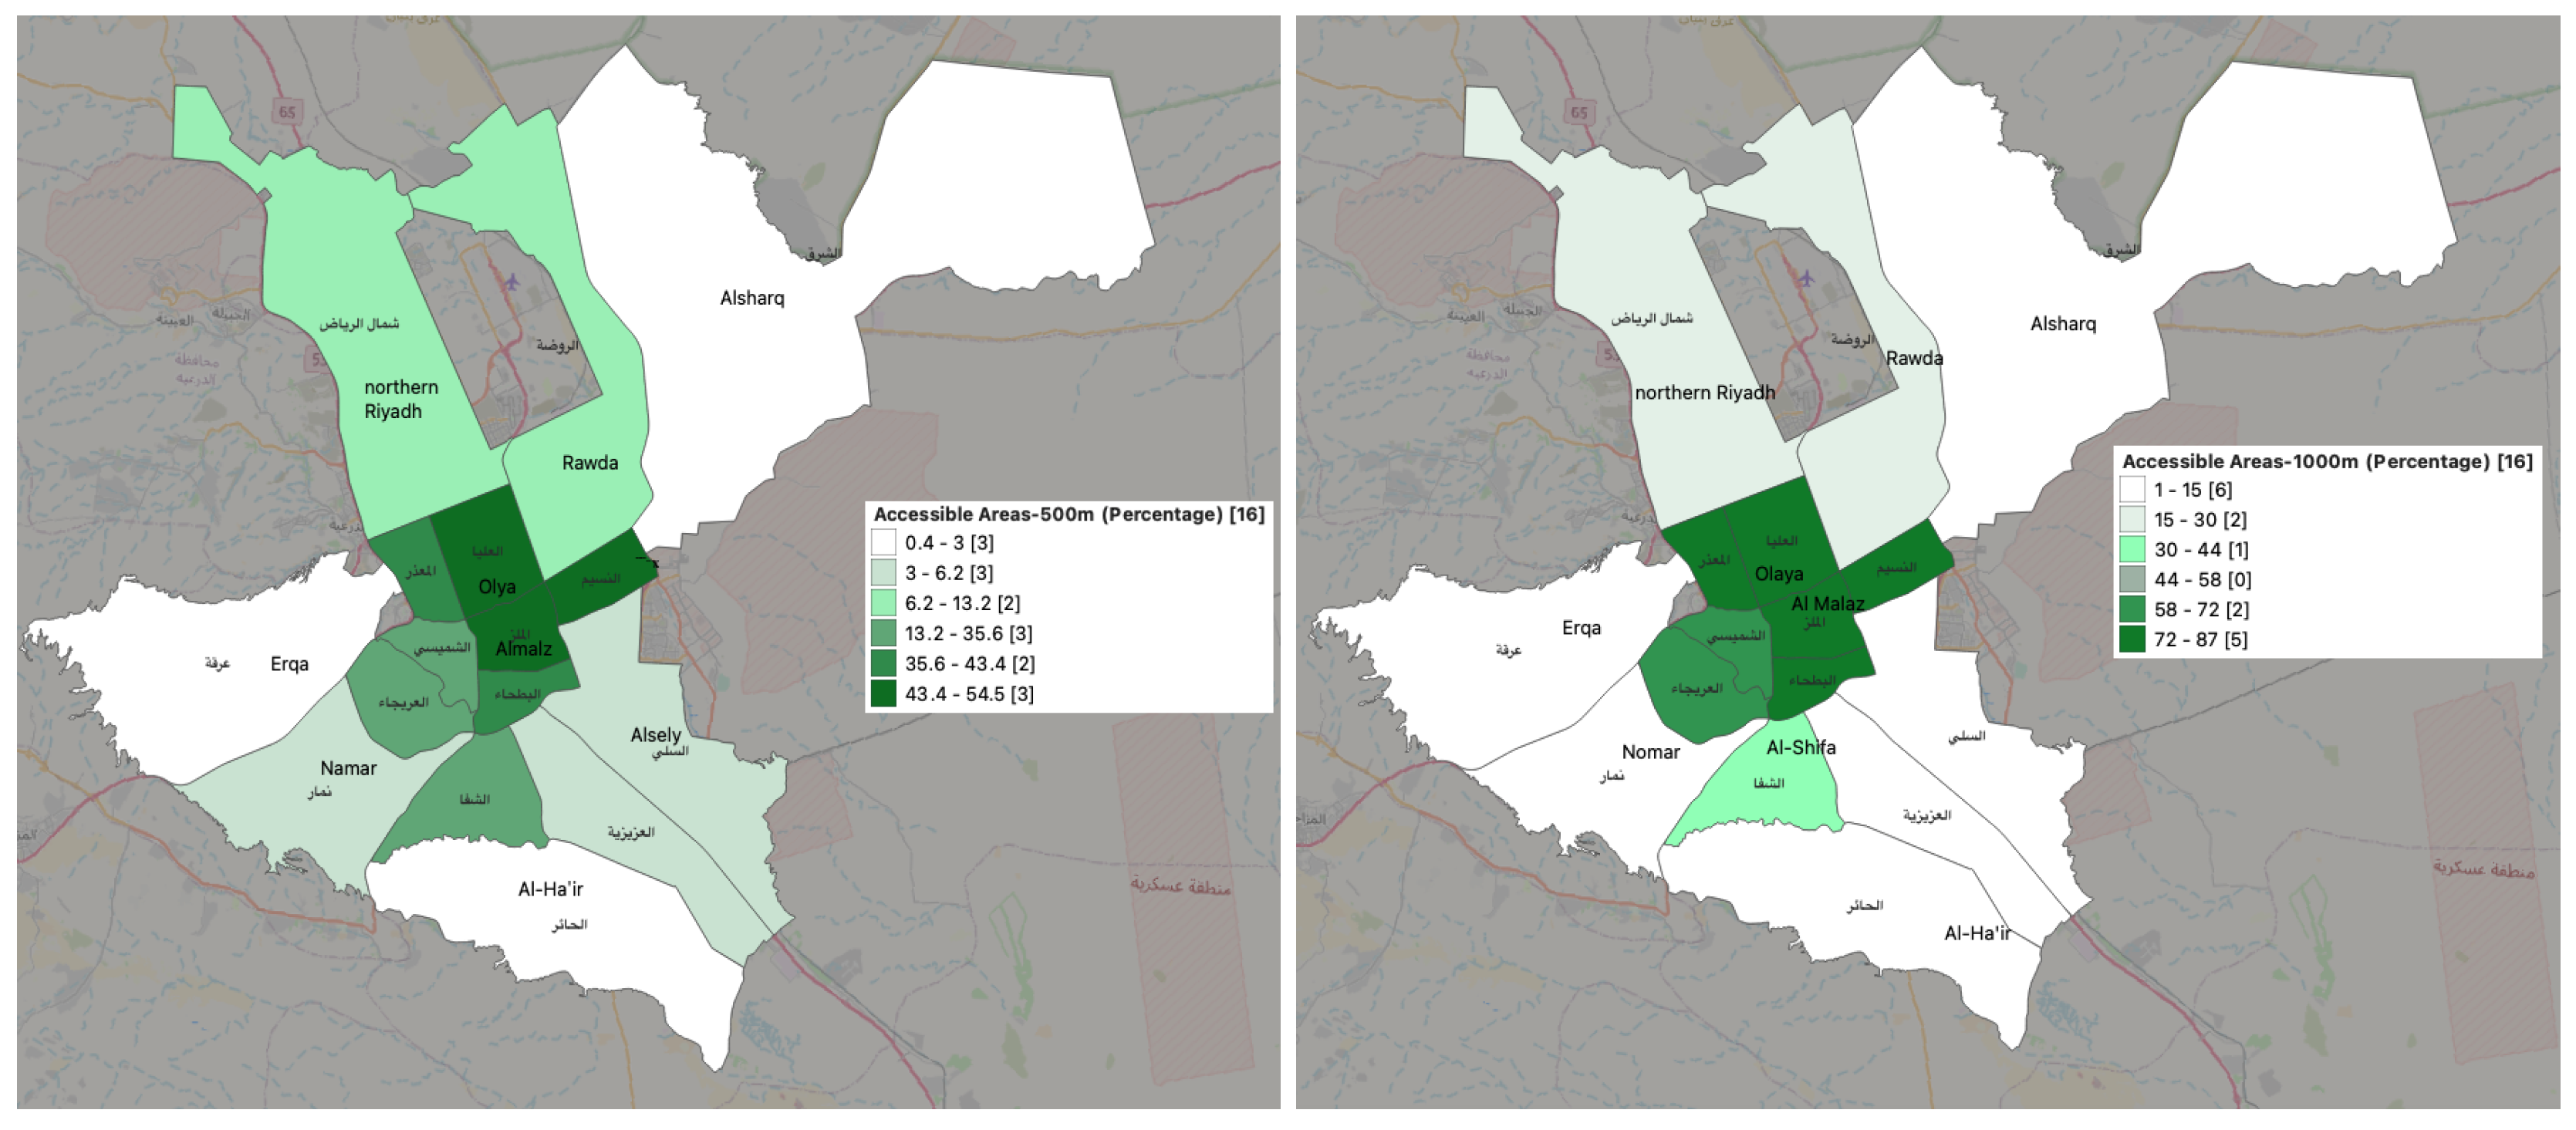
In this section, public park areas in various neighborhoods and administrative municipalities are analyzed, taking into account the previously mentioned walking distance (in terms of accessibility). Note that, here, we have considered the various kinds of public parks described above. The blank areas are those where residents do not have access to any parks within the required walking distance. This research was based on catchments of 500 m; however, as previously stated, we increased the distance to 1000 m solely to determine the extent of inadequate access to parks. Figure 8 indicates the accessibility within Riyadh city areas. As clearly seen, for the 500-m distance, in the administrative municipalities, in some areas such as northern Riyadh (known as Shimal Al-Riyadh), the catchment shows that only 6–13% of residents can access any of the public park types. Even when we increase the distance to 1000 m, residents in the northern Riyadh administrative municipality have only 15–30% accessibility rate. Administrative municipalities such as Olya and Almlaz performed well compared to others as their accessibility rate was up to 54%. On the other hand, areas such as Namar and Erqa have less than 3% accessibility. Figure 9 indicates the number of parks in each administrative municipality. Although the northern Riyadh administrative municipality ranks second in terms of the number of parks (39–50), it performs poorly in regard to accessibility. Figure 10 shows each administrative municipality and the sizes of its parks. As evident, in most of the administrative municipalities, the parks are very small (less than 1% of total municipality area).
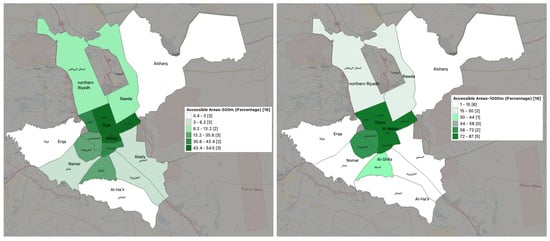
Figure 8.
The accessibility of administrative municipalities.

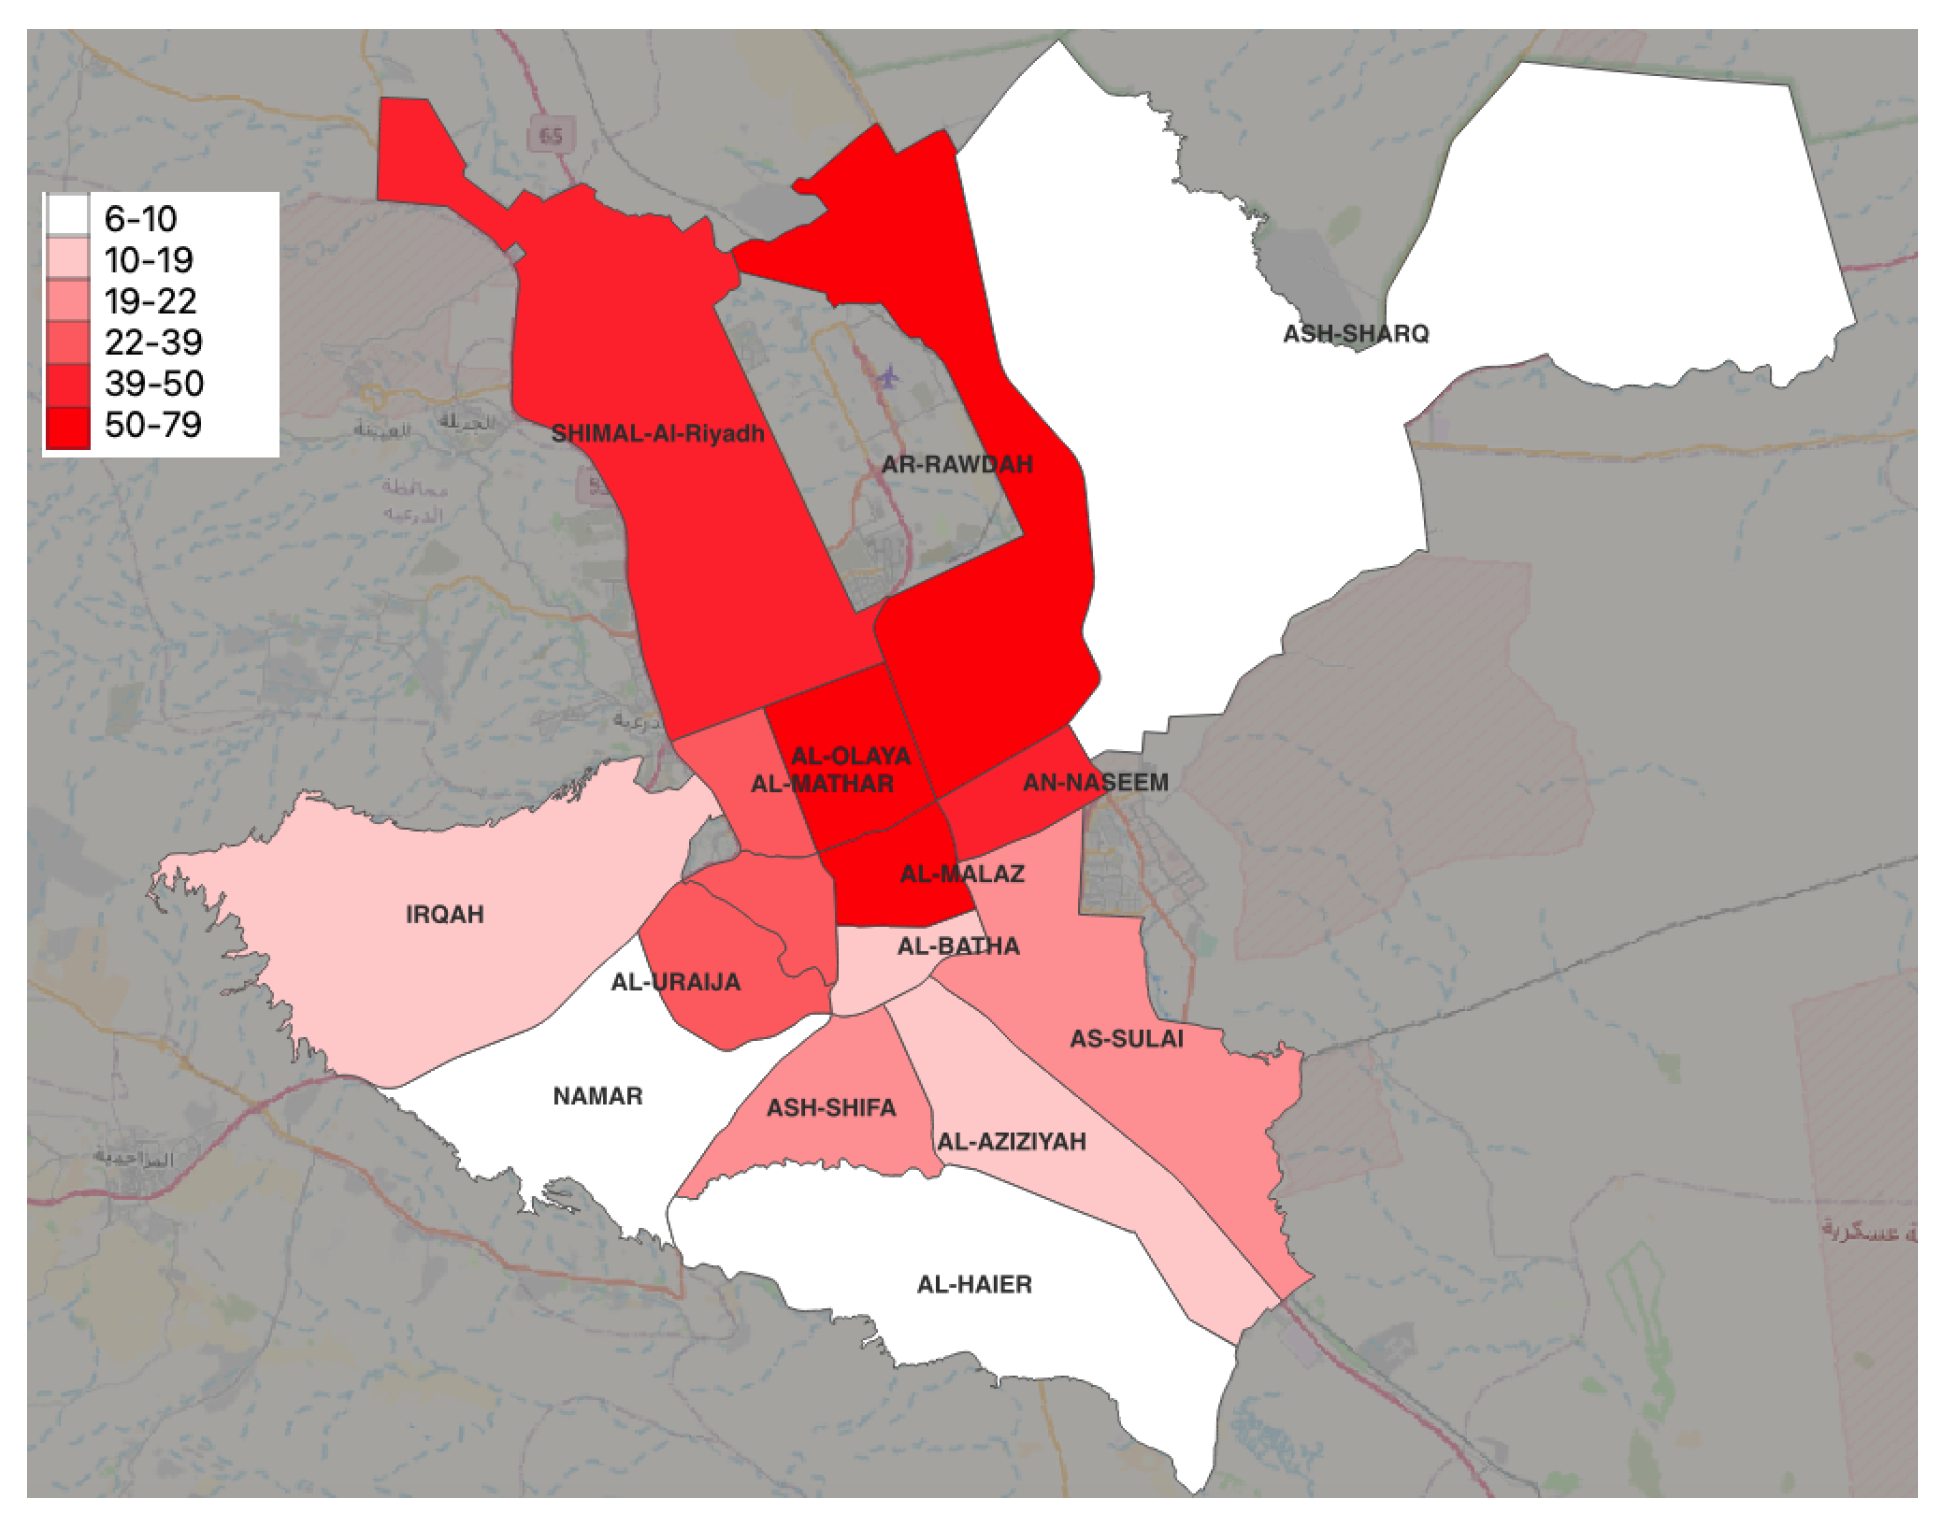
Figure 9.
Parks count in each administrative municipality.

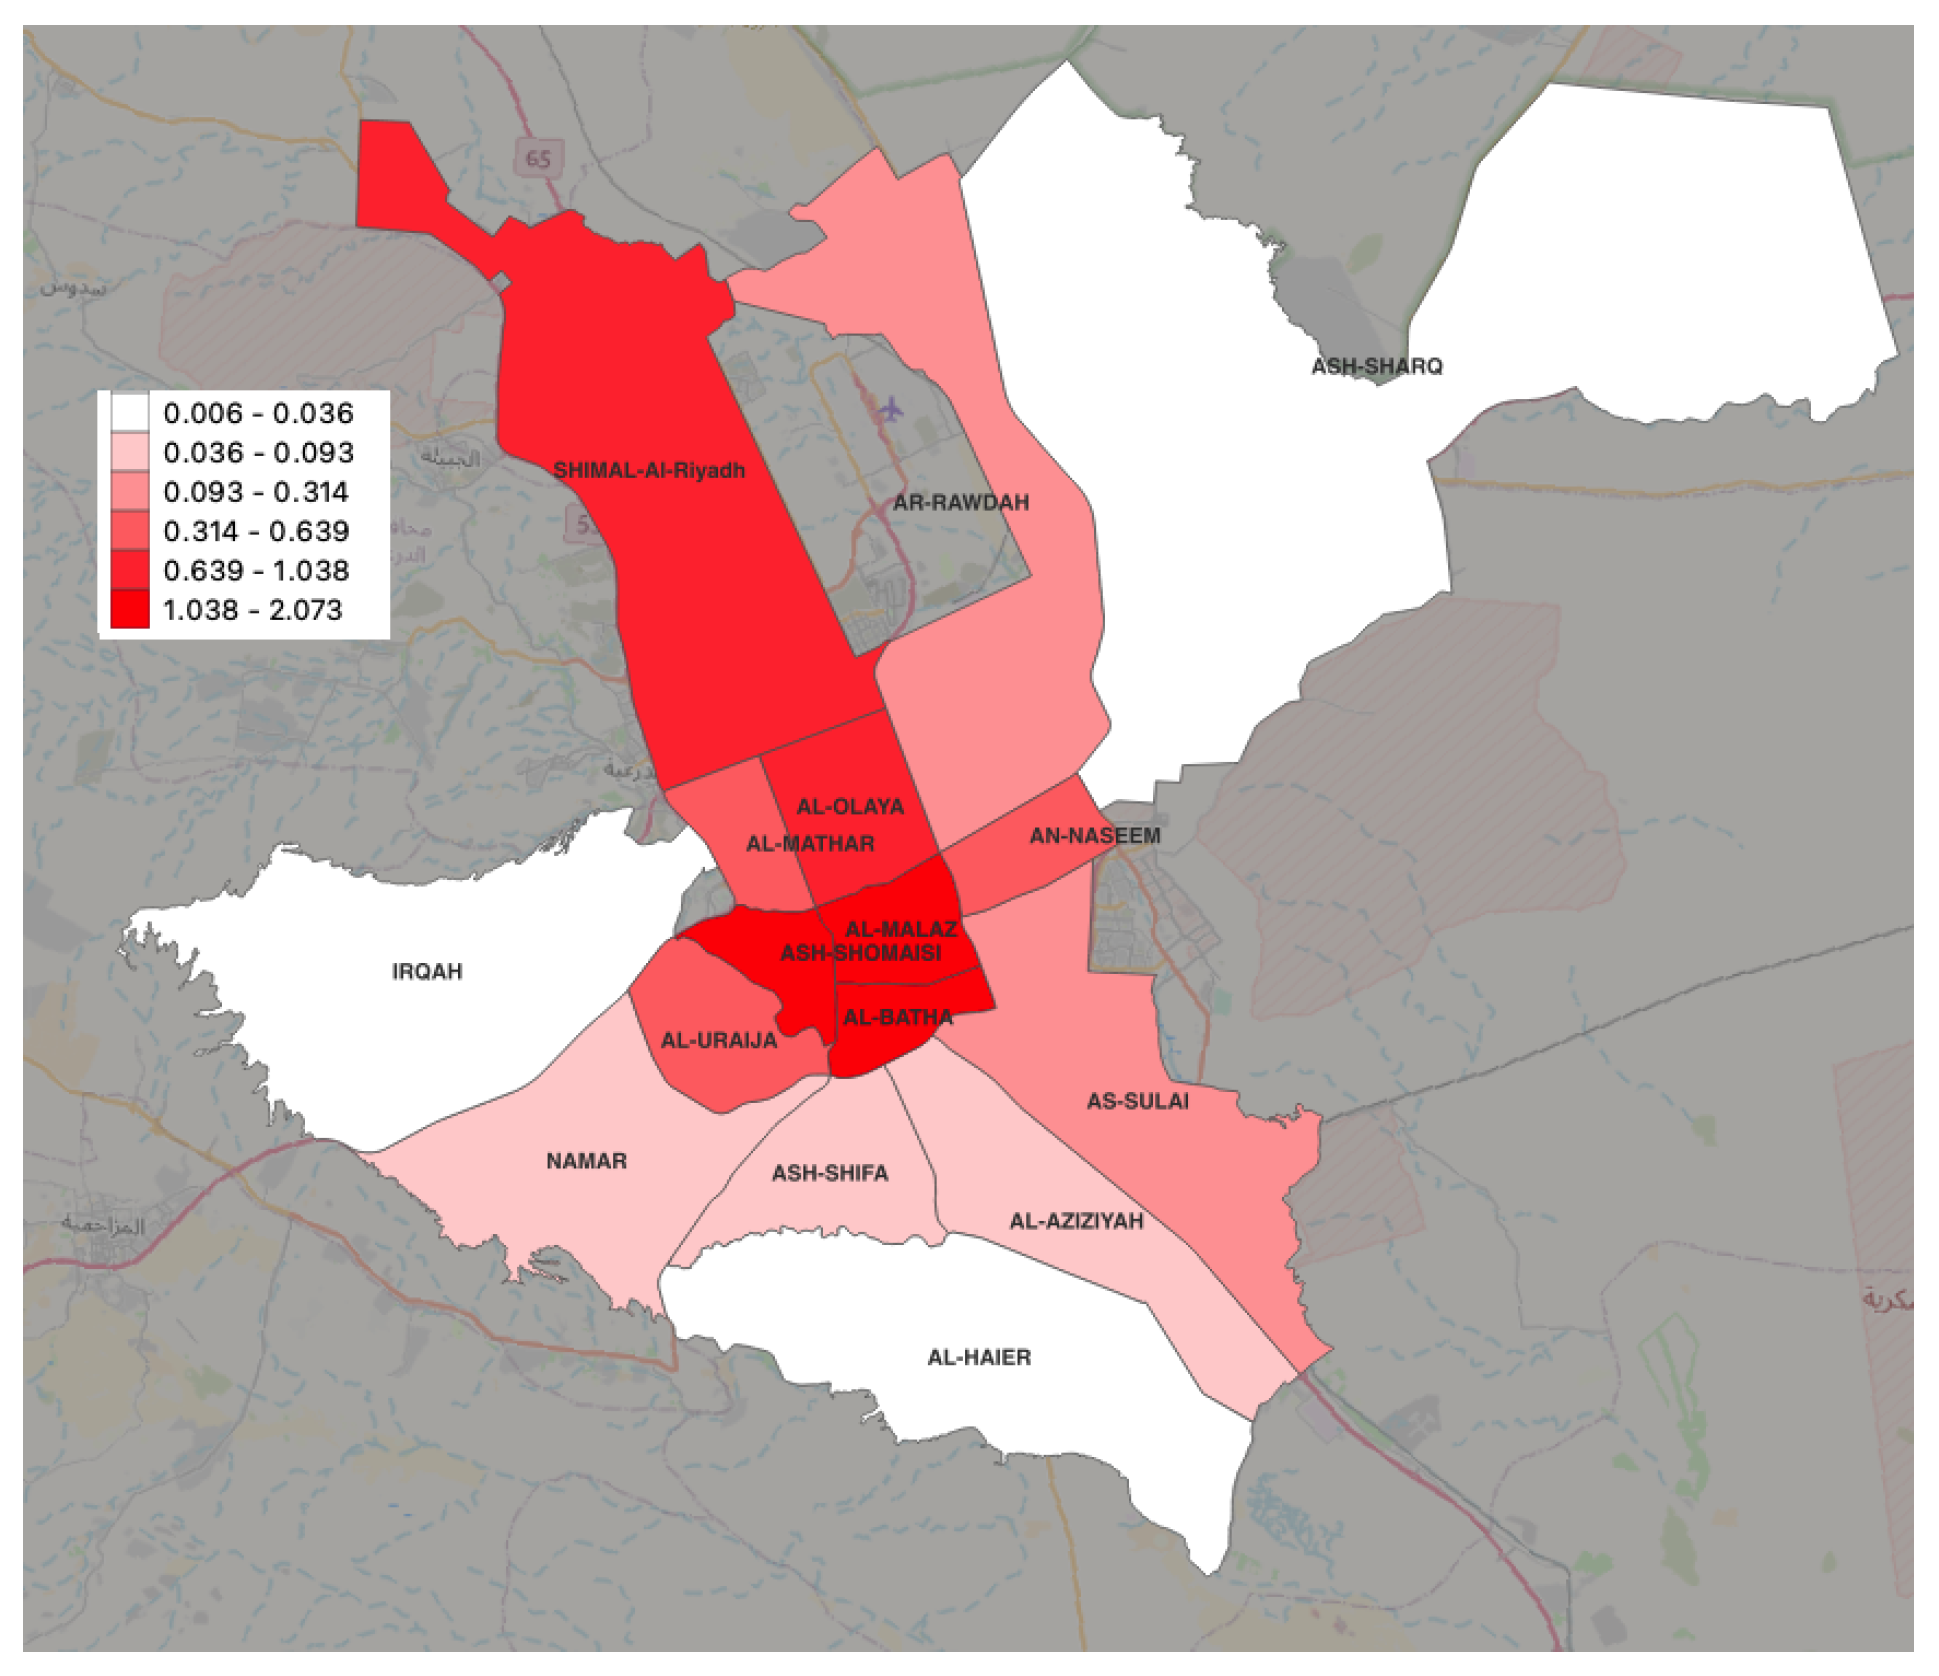
Figure 10.
Percentage of parks size area in each administrative municipality.
Our analysis of the accessibility of neighborhood parks shows (Figure 11) that over 64 neighborhoods have between 0 and 20% accessibility to parks. Suburbs such as Al-najis, Al-arrid, Al-bayan, Al-iskan, and many others have 80% of their residential blocks with no access to any parks within these neighborhoods (blank areas). However, suburbs such as As-sulaimanyah, Al-mursalat, Umm-saleem, As-salam, Ar-rawdah Ash-sharafiyah, Skirinah, Al-qura, Al-futah, Al-wisham, and Al-wizarat have less than 20% blank areas. Figure 12 clearly shows that the highest number of parks in a suburb regardless of size is 17. As is evident, some large areas and neighborhoods have fewer than four parks, indicating issues related to urban planning or the allocation of resources. The lack of accessible green spaces in these areas could reduce the residents’ quality of life, given the well-documented benefits of parks in regard to people’s physical health, mental well-being, and community building. This underscores the significance of equitable distribution of public spaces like parks in urban planning.
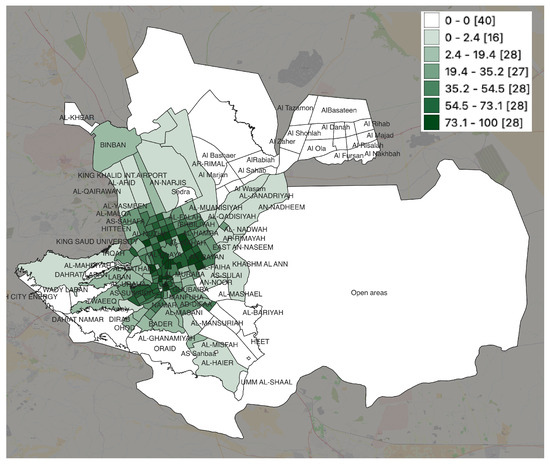
Figure 11.
Park accessibility in each neighborhood.
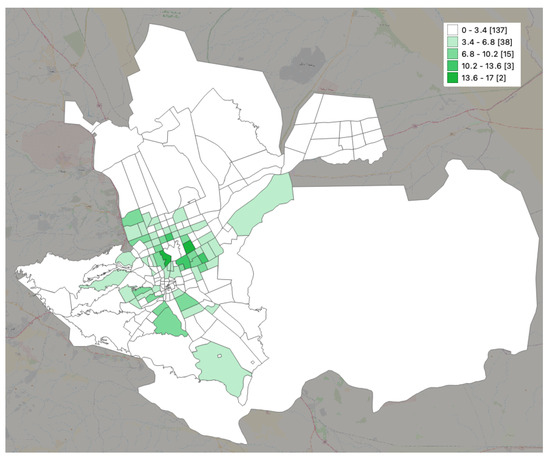
Figure 12.
Number of parks in each neighborhood.
5.2. Discussions
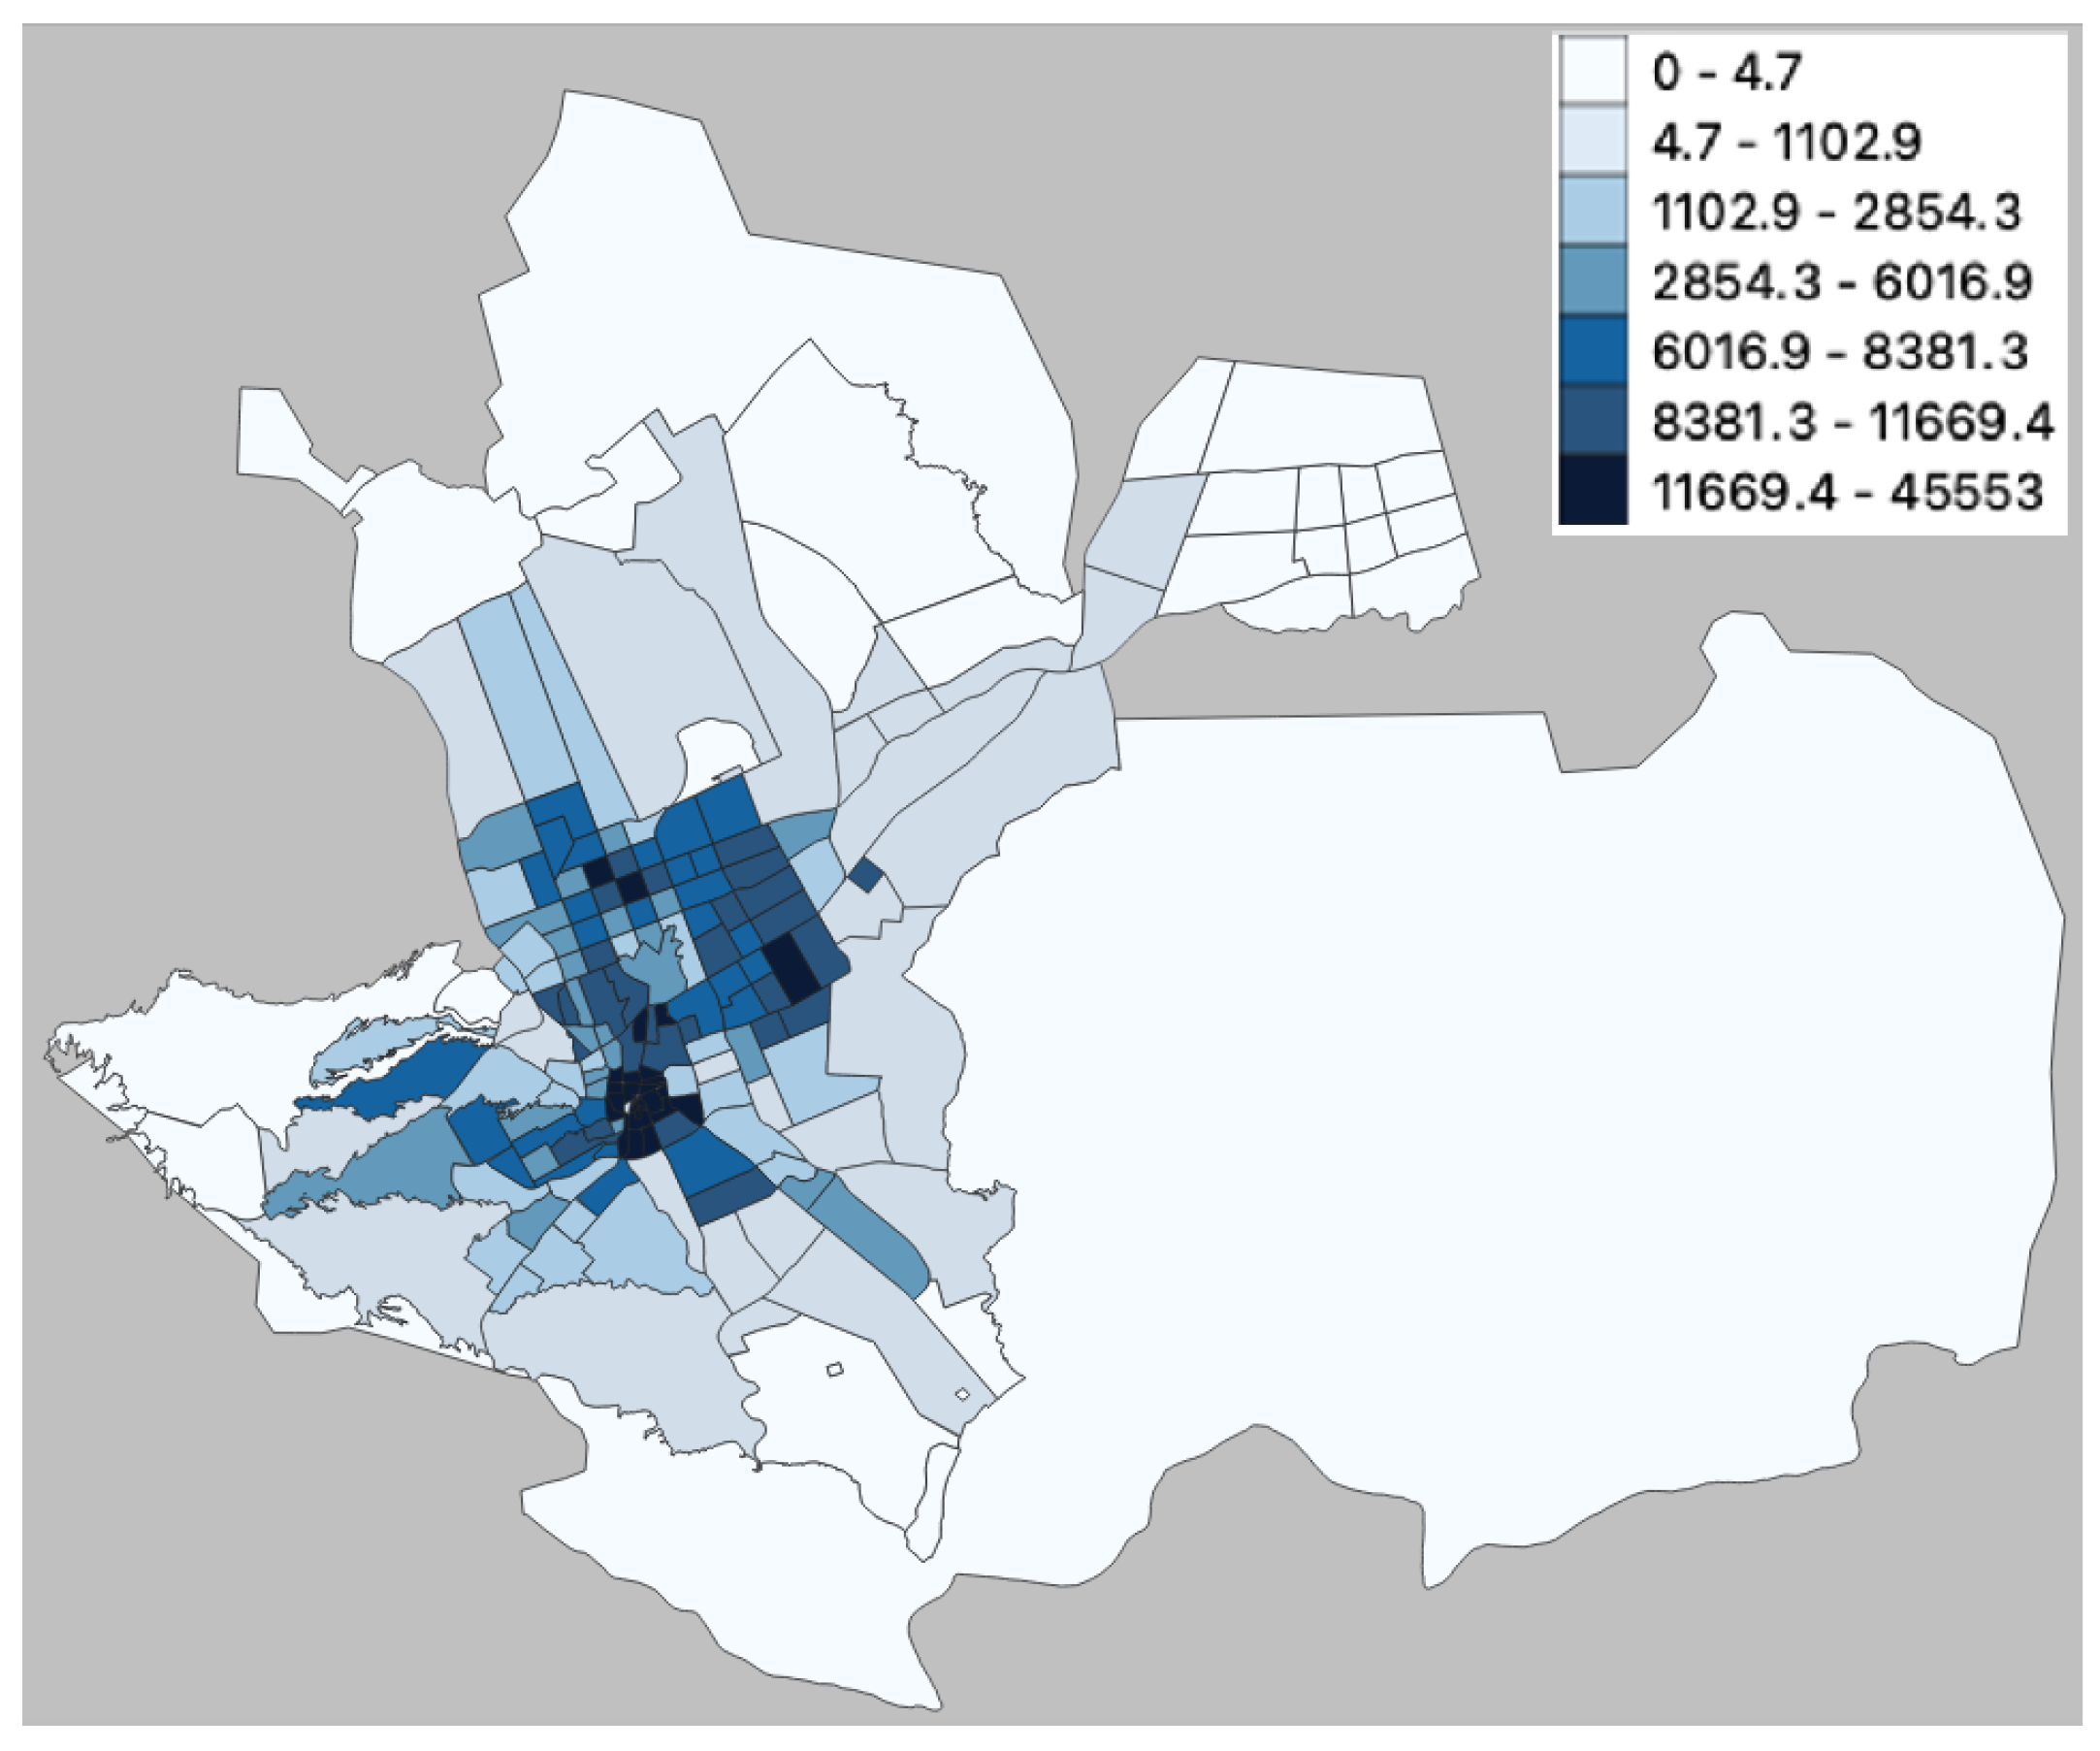
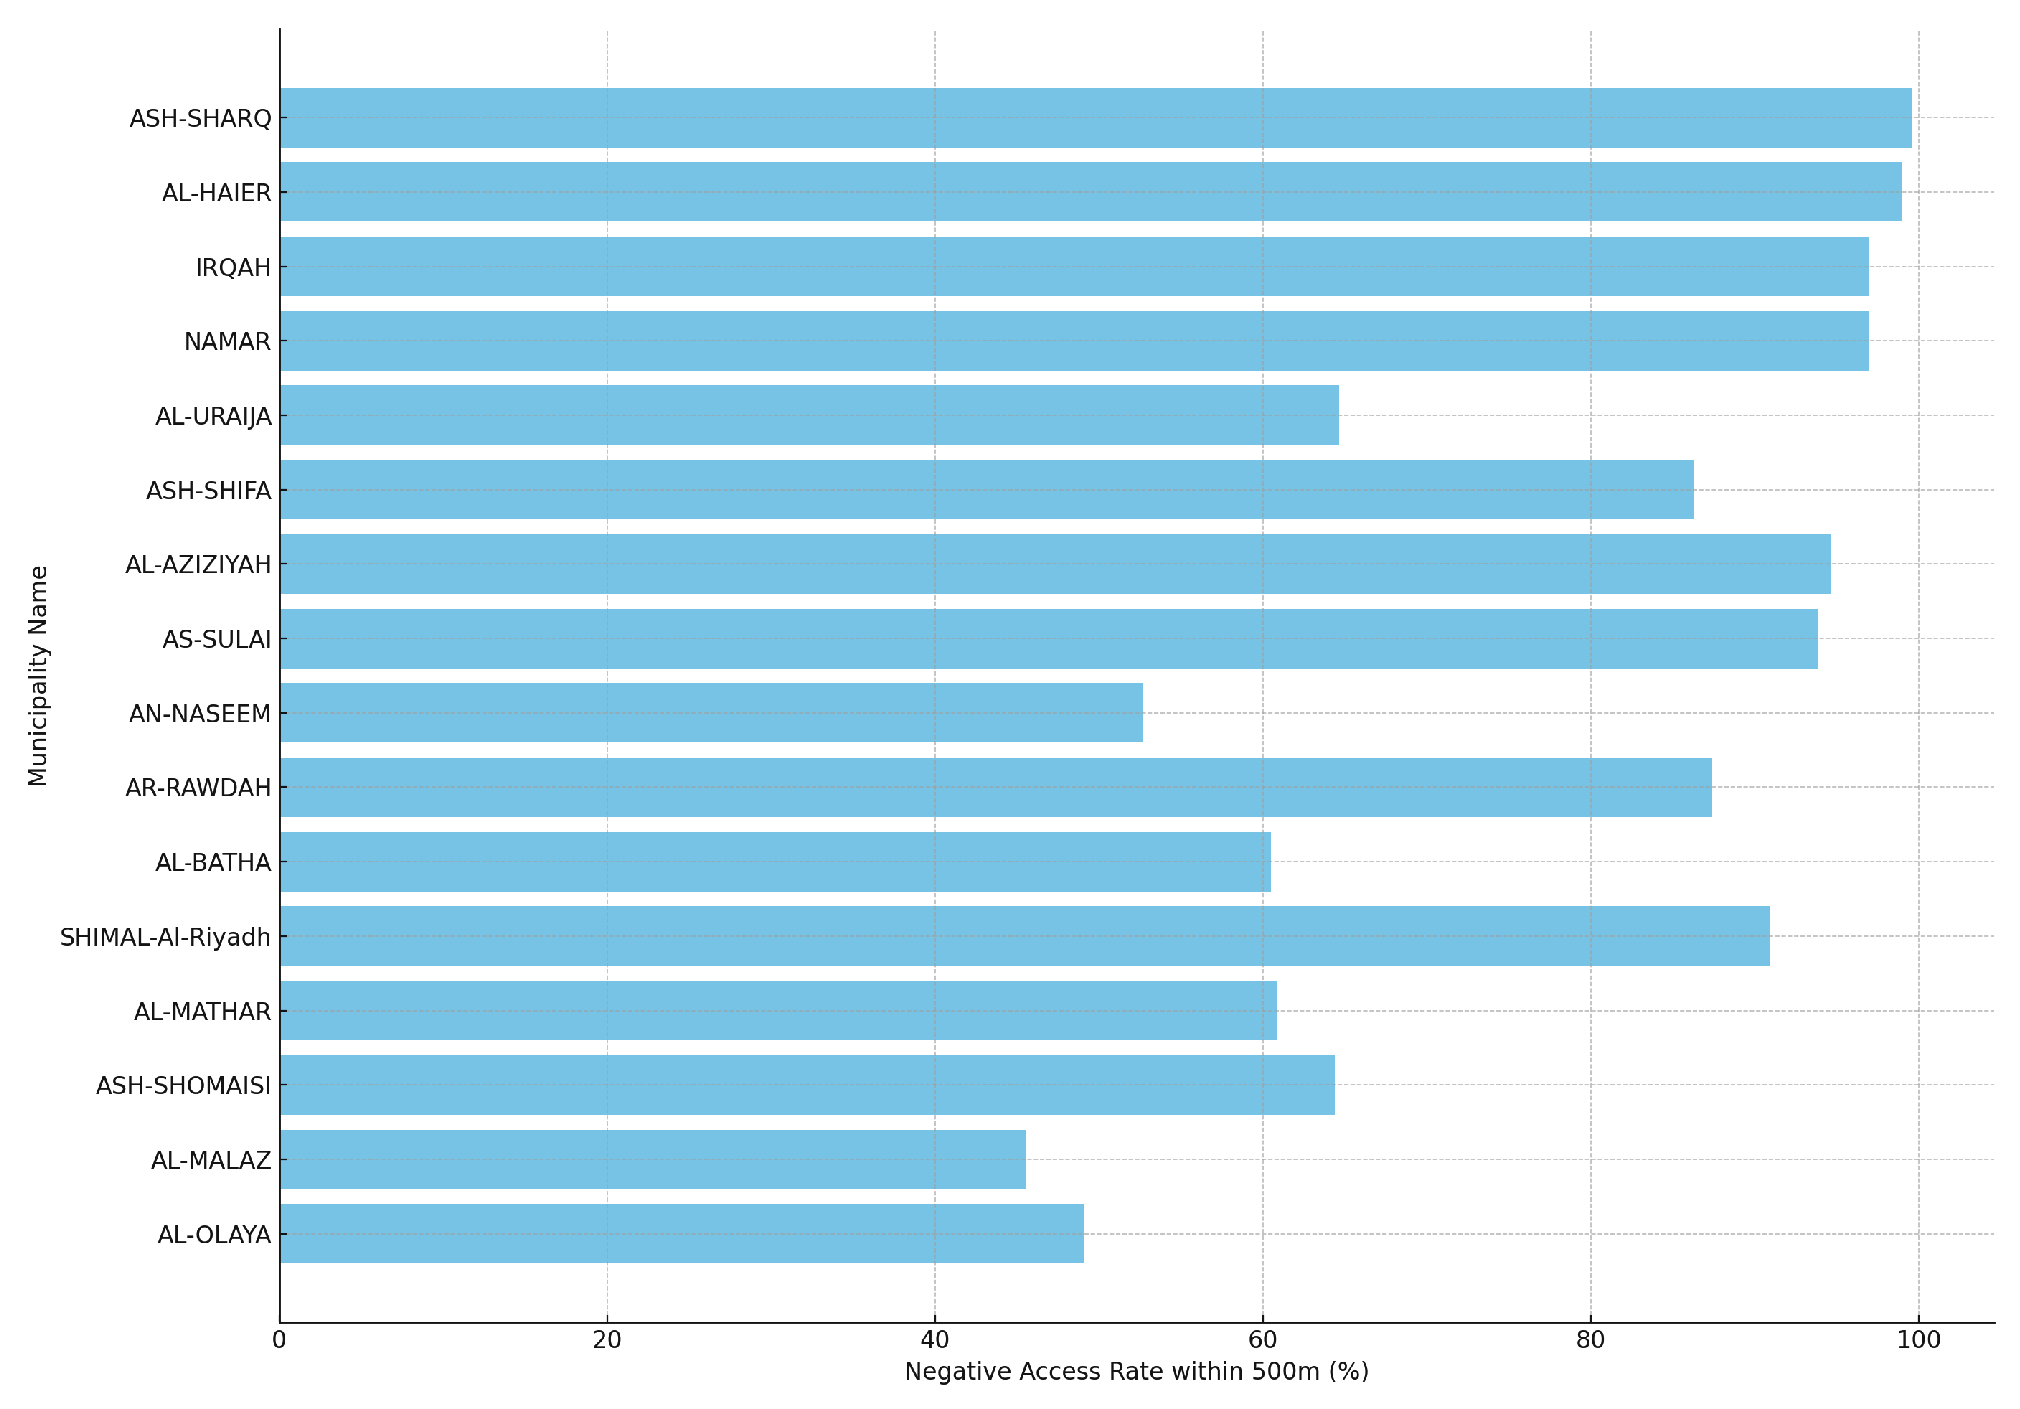
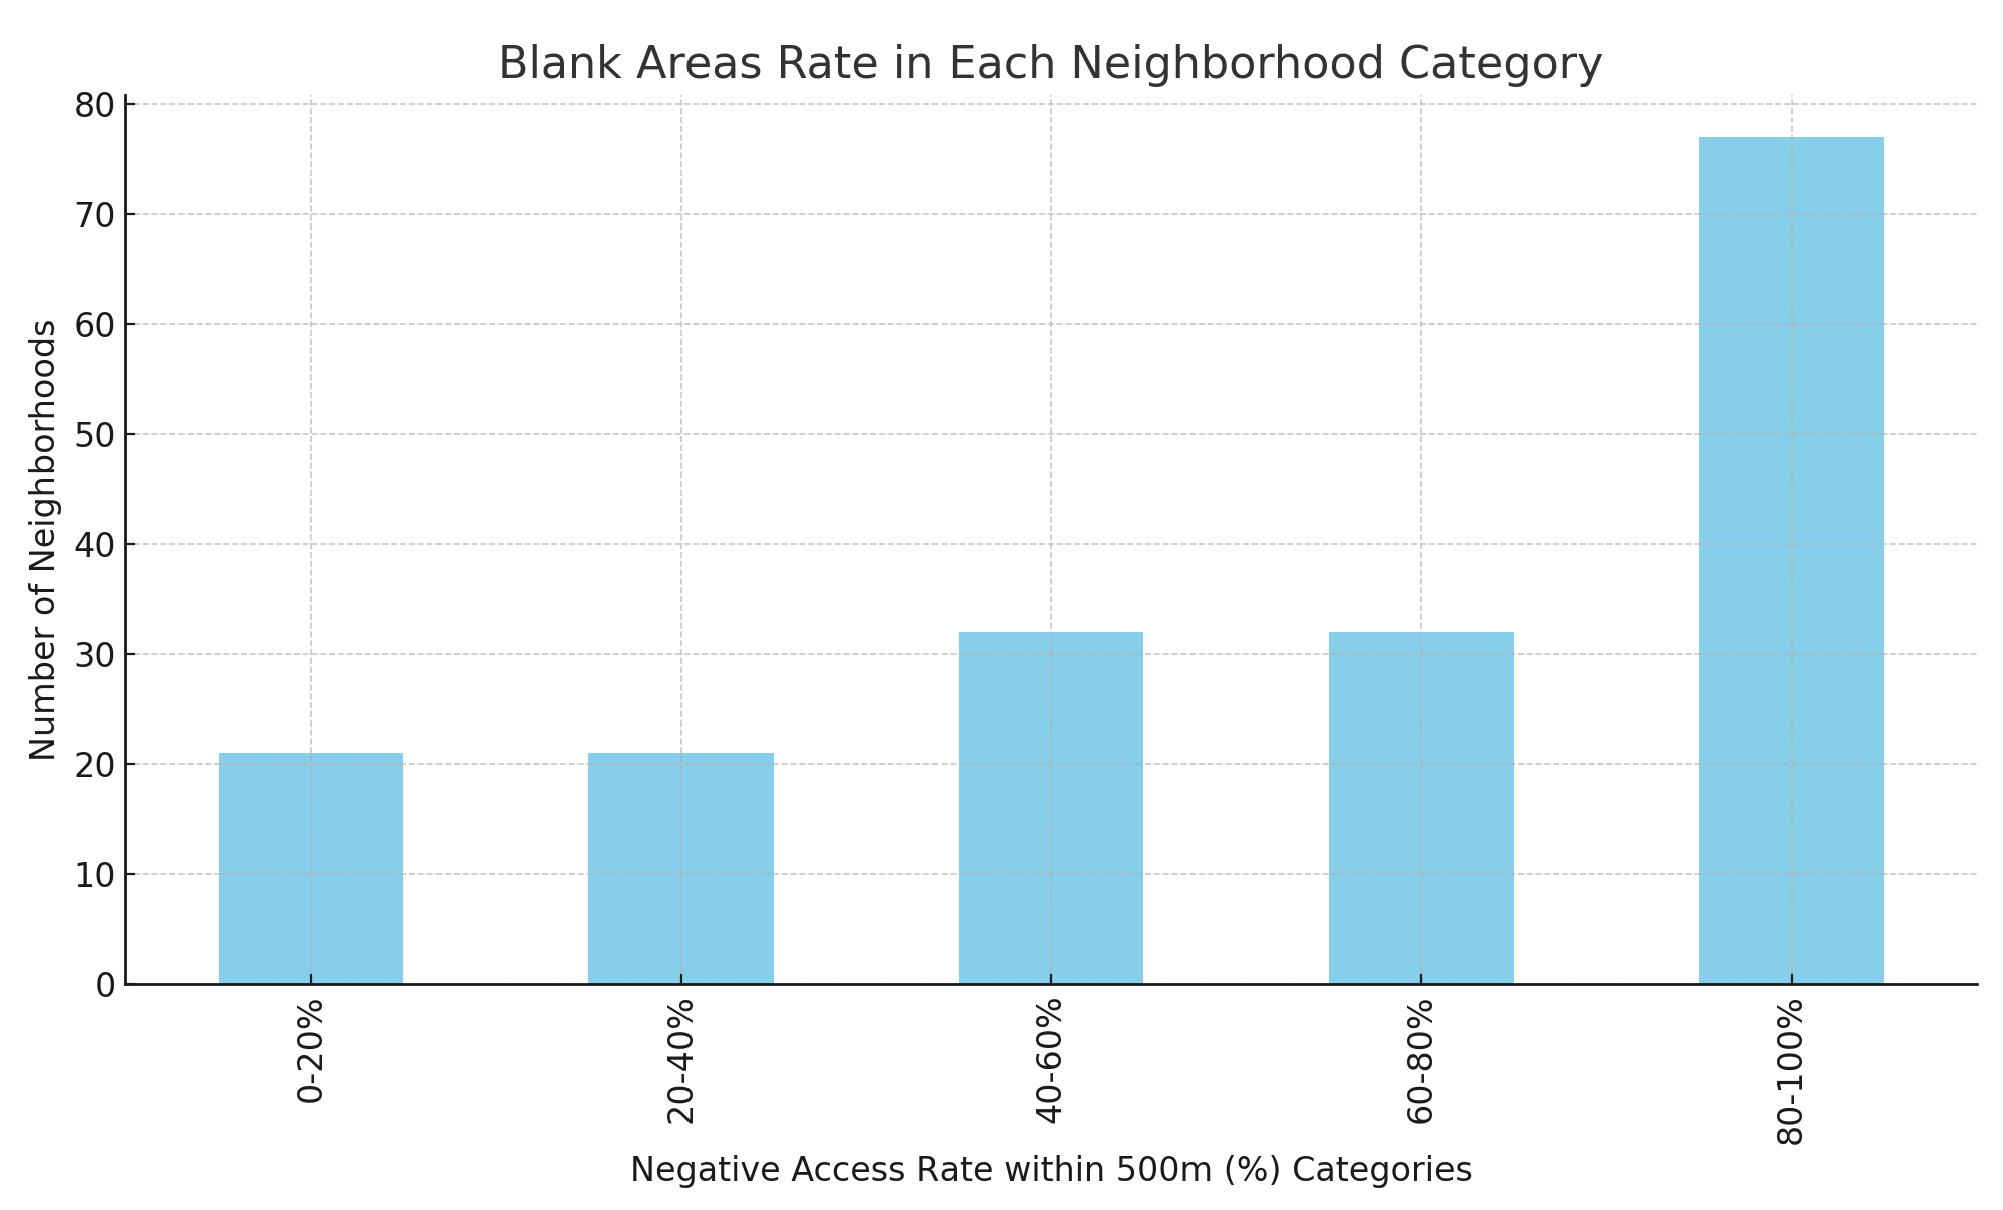
In this section, we discuss the results of the comprehensive analysis of public parks in the city of Riyadh. Moreover, despite its small size, the Riyadh center appears to perform better in terms of the accessibility of parks than the east or west of the city and the northern area that has experienced rapid development and steady population growth for several years. Figure 13 shows the density of the population per square kilometer according to the 2022 statistics. Figure 14 shows the blank areas in each municipality; these are areas that are underserved by essential services such as parks, green spaces, or picnic areas and by walking paths that are accessible. Noticeably, Al-Malaz and Al-Olaya are performing better than others, with 50% having blank areas. The percentage of blank areas is very high in some municipalities (up to 90% blank areas), indicating a lack of public parks and green spaces throughout these suburbs. Figure 15 shows the blank areas in each suburb. As indicated in the figure, 21 suburbs have a low rate of blank areas, with only 0–20% of their area falling into this category, suggesting good accessibility. Of greater concern are the 32 neighborhoods that fall in the 40–60% and 60–80% categories, where a significant portion of the area has limited access to parks. The most pressing issues are observed in the 77 neighborhoods in the 80–100% category, where most of each neighborhood is a blank area, highlighting severe accessibility concerns. Figure 16 shows the percentage of the total areas that do not have any access to any parks in each administrative municipality.
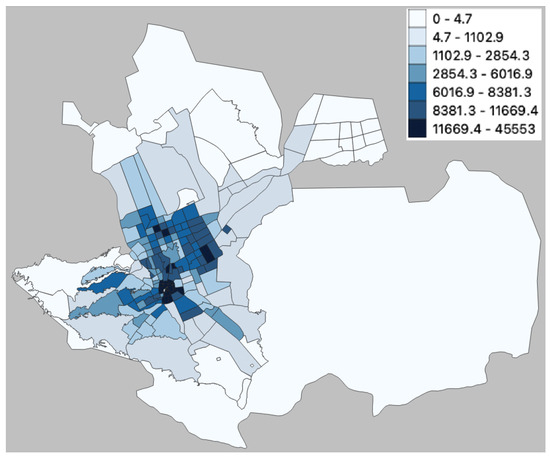
Figure 13.
Population density per square kilometer in each neighborhood.
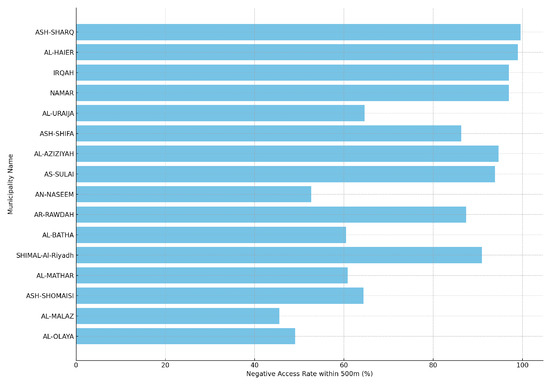
Figure 14.
The blank areas in each municipality.

Figure 15.
The blank areas in each neighborhood.
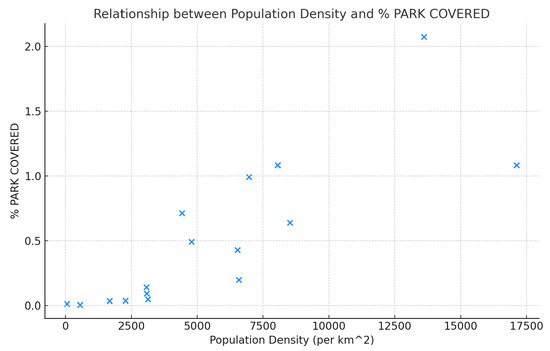
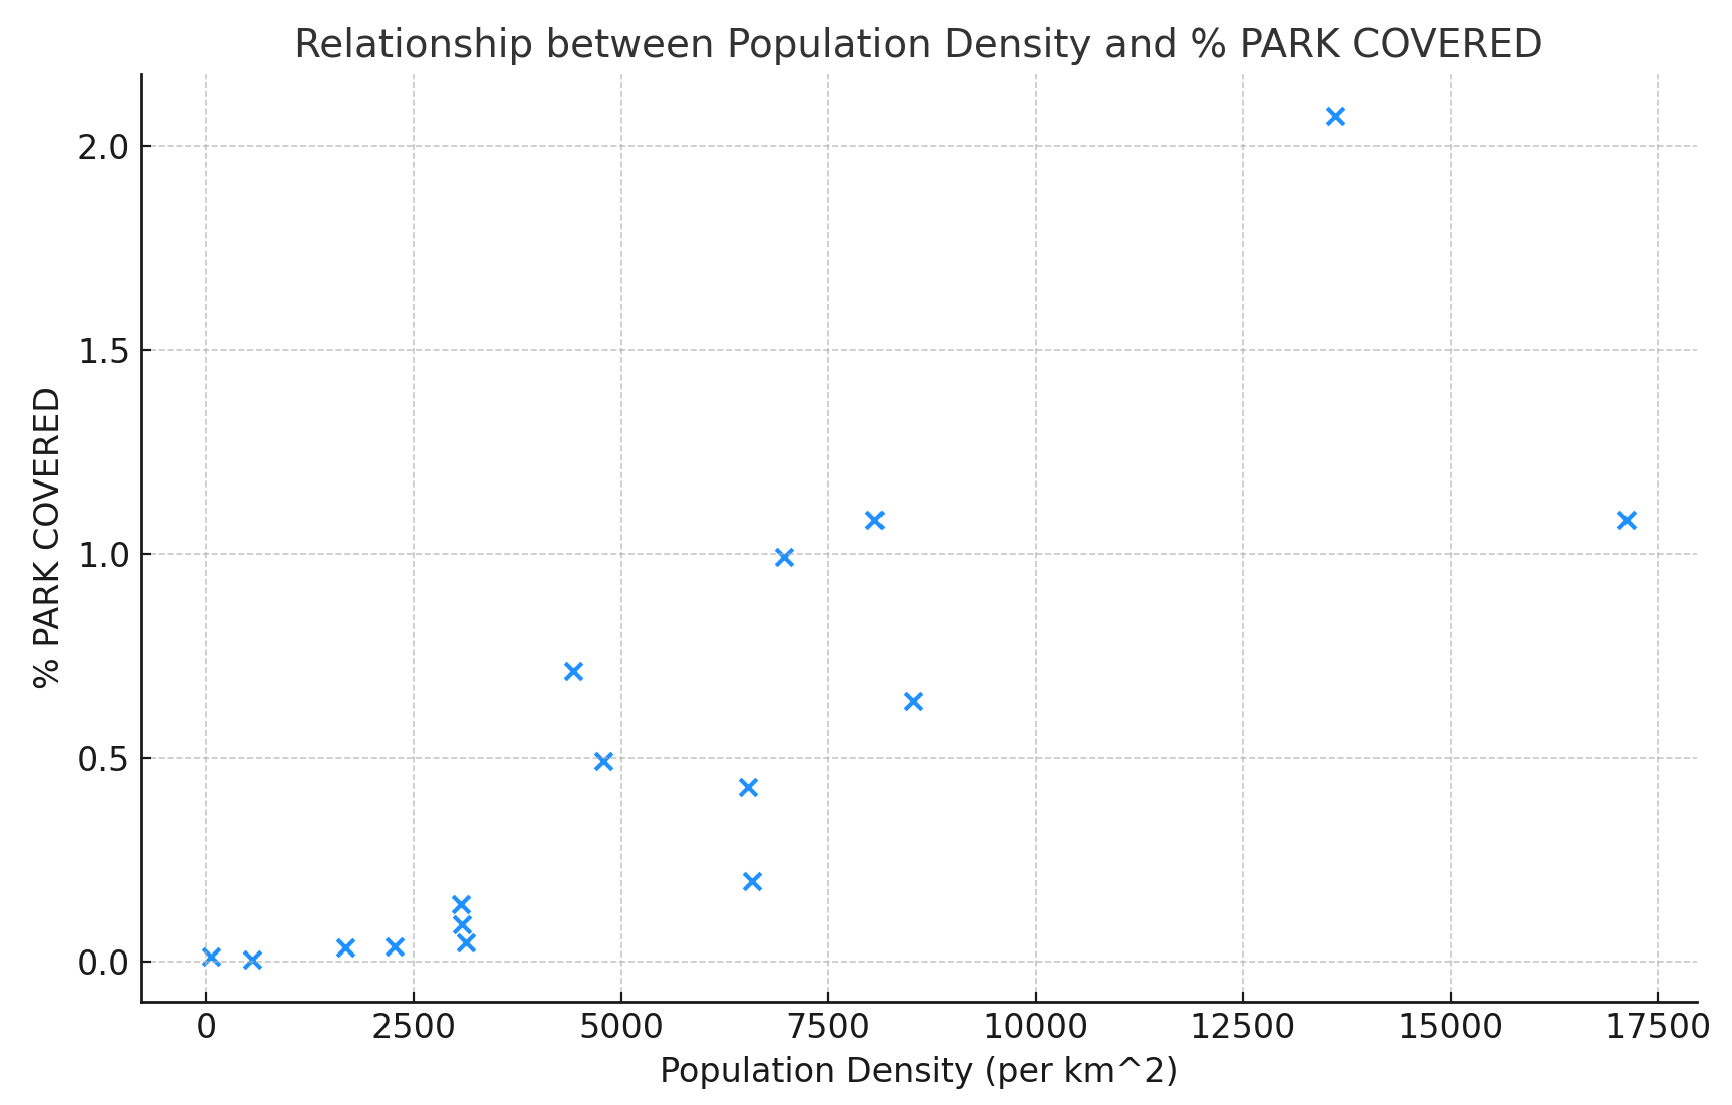
Figure 16.
Relationship between population density and park covered.
Here, we explain the effects of different factors in regard to the blank areas or the level of accessibility to parks. Figure 16 shows the distribution of park spaces across municipalities. In the figure illustrating the relationship between population density and park area, we notice diverse patterns in different municipalities. Some municipalities have a higher population density but have less area covered by parks. This might imply that while the population in these municipalities has grown, there has not been a commensurate rise in the distribution or maintenance of green spaces and parks. This trend is alarming since densely populated places benefit immensely from the availability of parks and green spaces that have been proven to mitigate urban heat islands, improve air quality, and offer leisure spaces for residents. However, a few municipalities do show a balance between population density and park coverage spaces.
As evident in Figure 17, some municipalities, despite having high-density populations, have a substantial percentage of park coverage within a 500 m walking distance. The figures show that in certain municipalities, there is a positive correlation between population density and level of accessibility. Specifically, as population density increases there is an increase in the accessibility of parks within 500 m. This relationship might seem counterintuitive initially as it is expected that with an increase in population density (i.e., more people living in a confined area), there would be less space available for parks. However, this should encourage municipalities to provide more green areas and more parks for their residents. However, we can see the accessibility rate is very low in all municipalities regardless of the density of their populations.
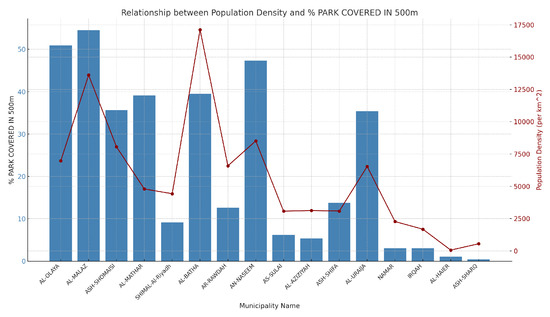
Figure 17.
Parks count in each neighborhood.
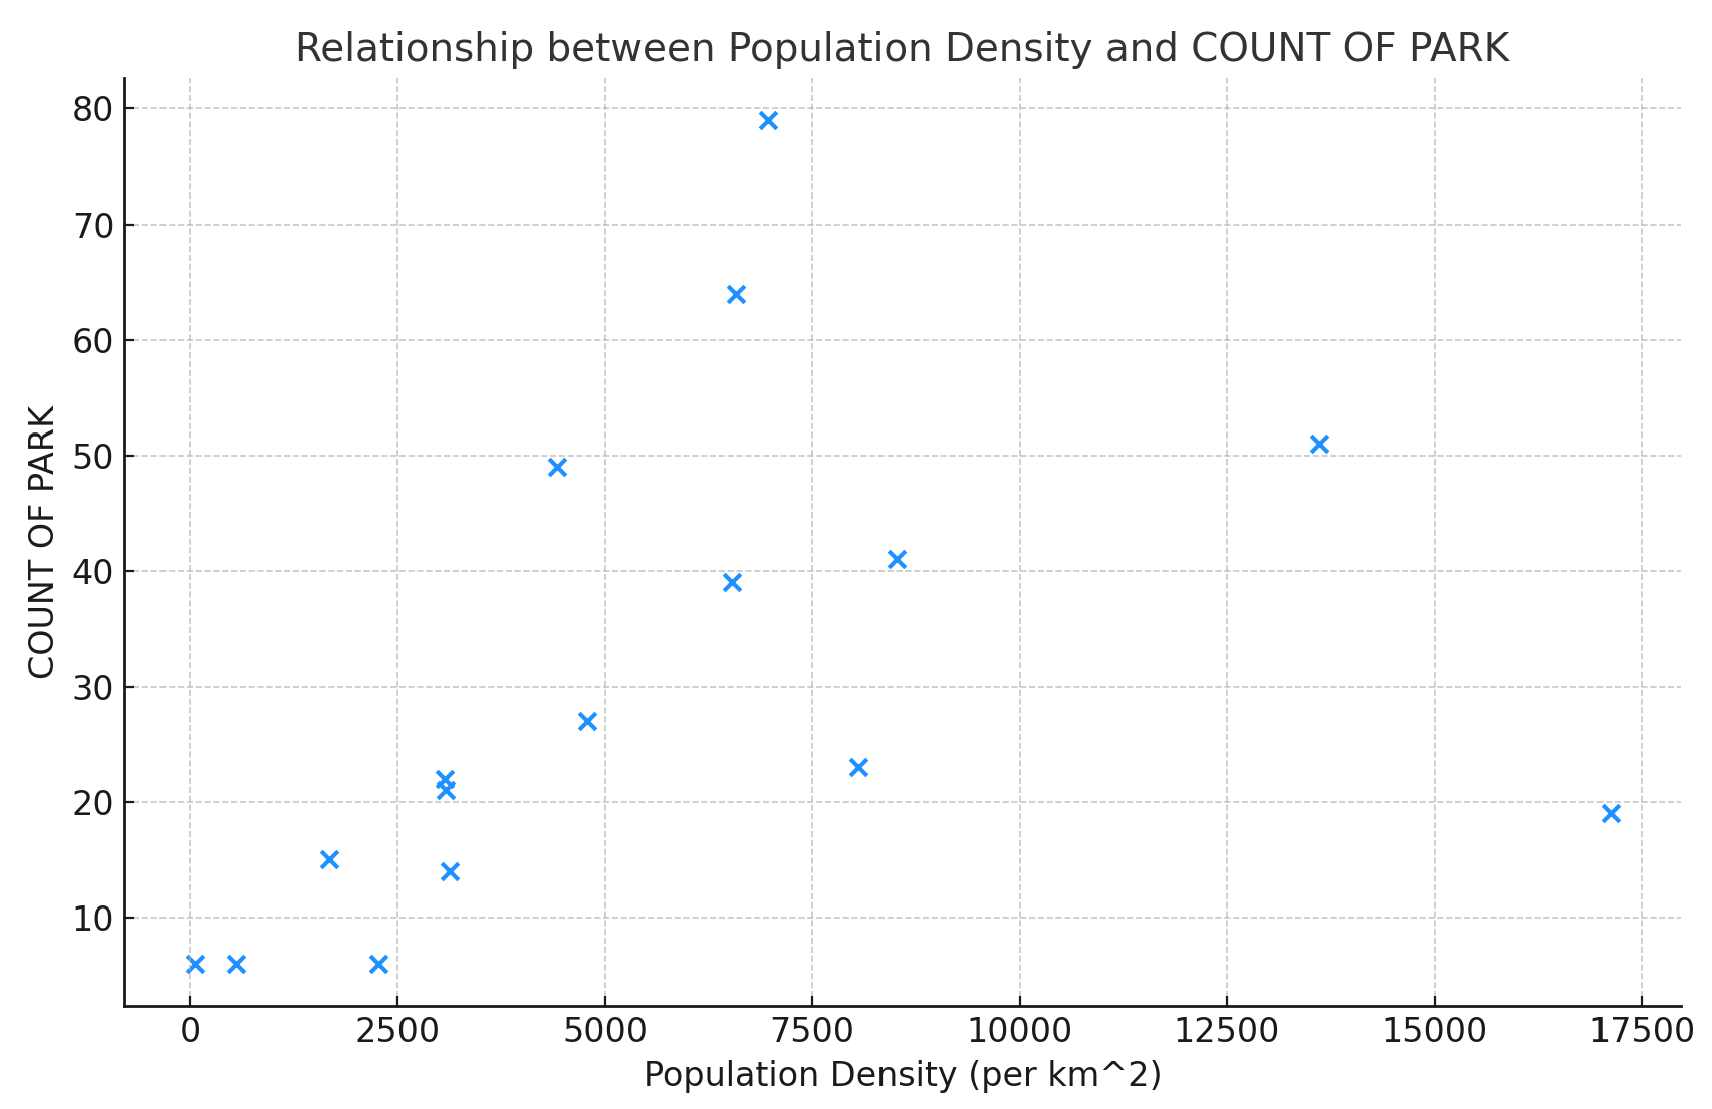
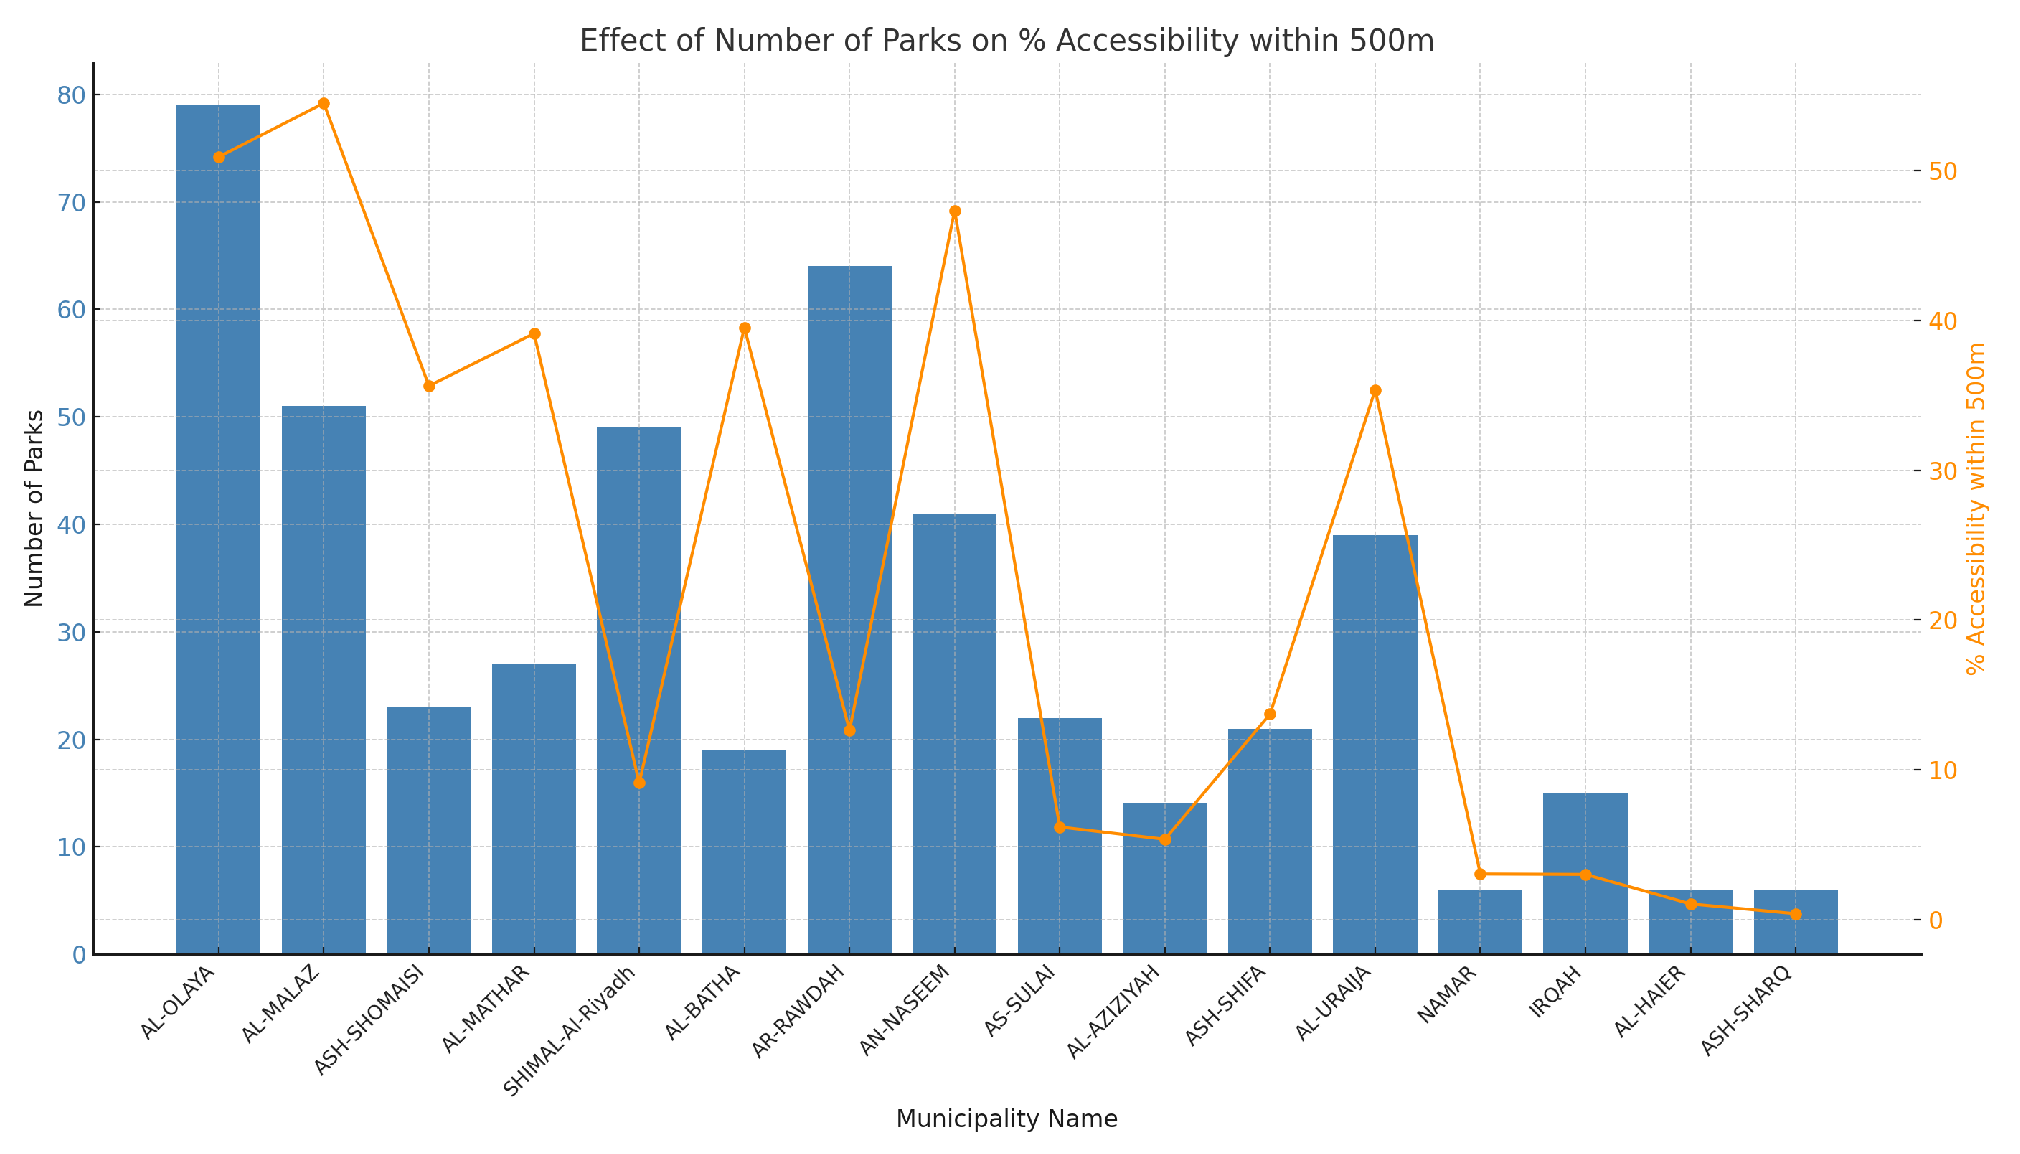
Figure 18 depicts the relationship between population density and the number of parks and provides valuable insights into the spatial distribution of parks in relation to the number of residents in a given municipality. The figure shows that municipalities with lower population densities have a diverse number of parks. On the other hand, some municipalities with high population densities have fewer parks. This scenario could suggest a more centralized approach to green spaces. According to Figure 19, there appears to be a positive trend in several municipalities: as the number of parks increases, the level of accessibility also increases. However, it is important to remember that not all municipalities are exhibiting the same trend. There are areas where the accessibility rate within the 500 m is not as high as anticipated, even with a greater number of parks.
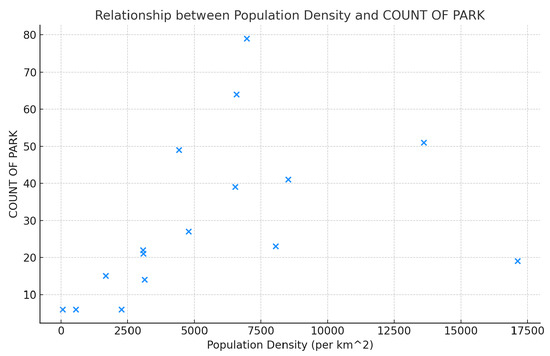
Figure 18.
Relationship between density and park count.
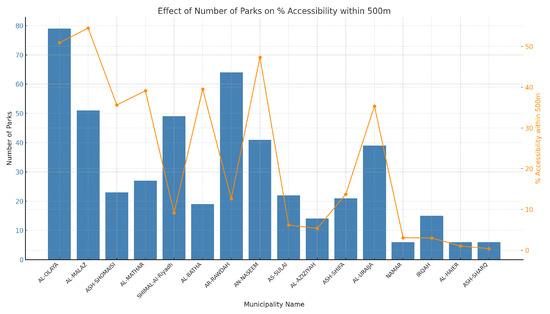
Figure 19.
Density in each municipality and park count.
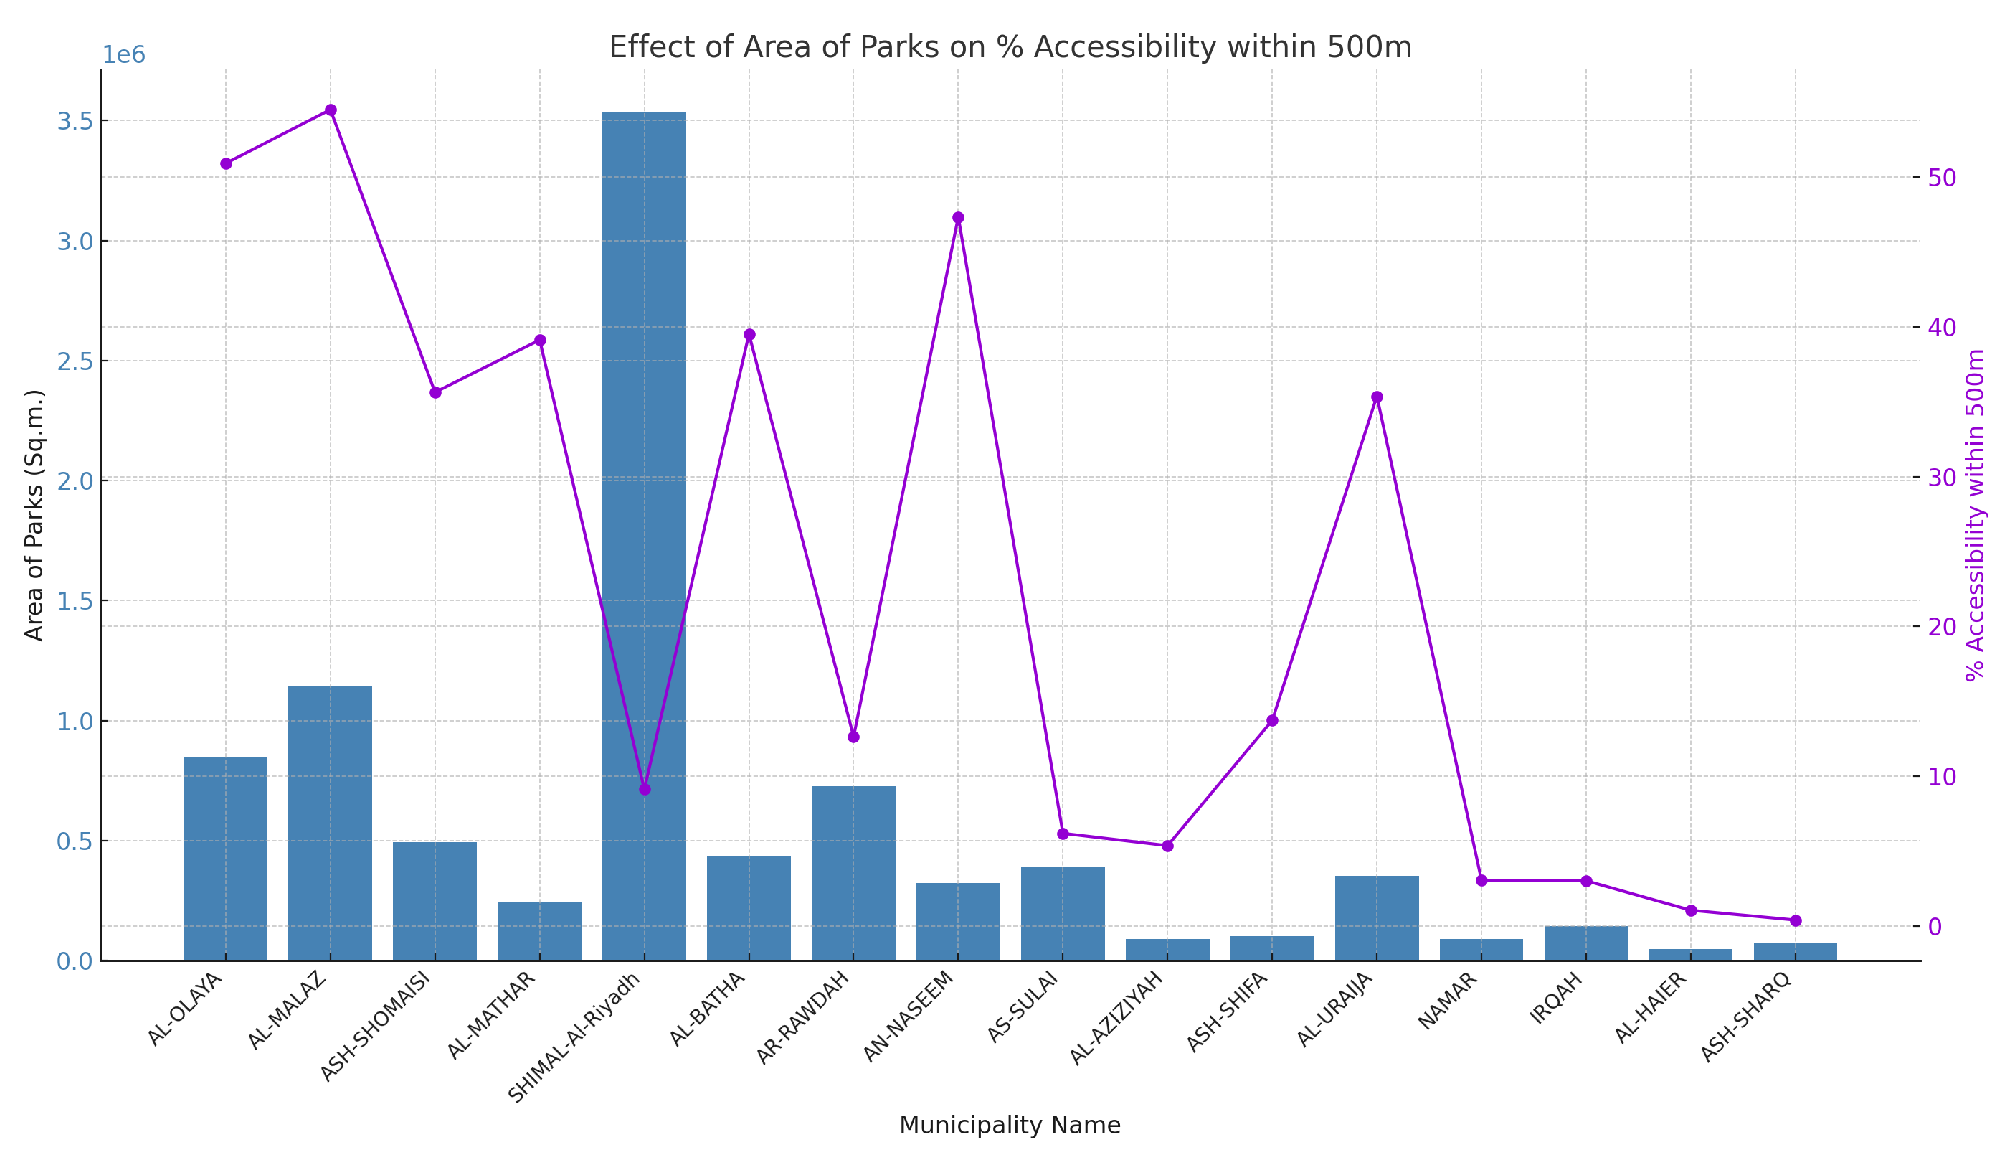
Figure 20 illustrates the relationship between the total area of parks and their accessibility. In some municipalities, a larger total area of parks is correlated with greater accessibility, suggesting that these municipalities have vast green spaces that cater to a significant number of residents. This pattern indicates that these municipalities might have several very large parks that, due to their sheer size, offer more accessibility to residents in their vicinity. On the other hand, there are municipalities where, despite having a substantial total park area, the level of accessibility is relatively lower. This could indicate that there are large, centrally located parks that, despite occupying a considerable amount of land, may not be evenly distributed throughout the municipality, resulting in areas where residents are living outside the accessibility range. Alternatively, these large parks may be situated on the outskirts of the municipality or in less-populated areas, thus affecting the accessibility metric.
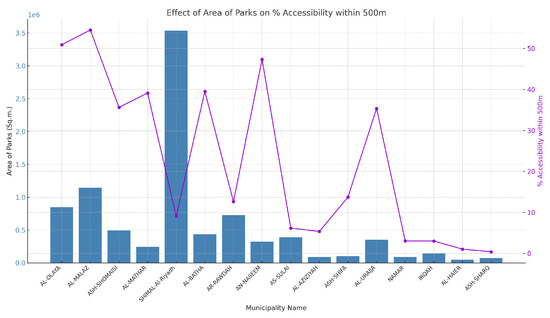
Figure 20.
The relationship between the areas of parks and their accessibility.
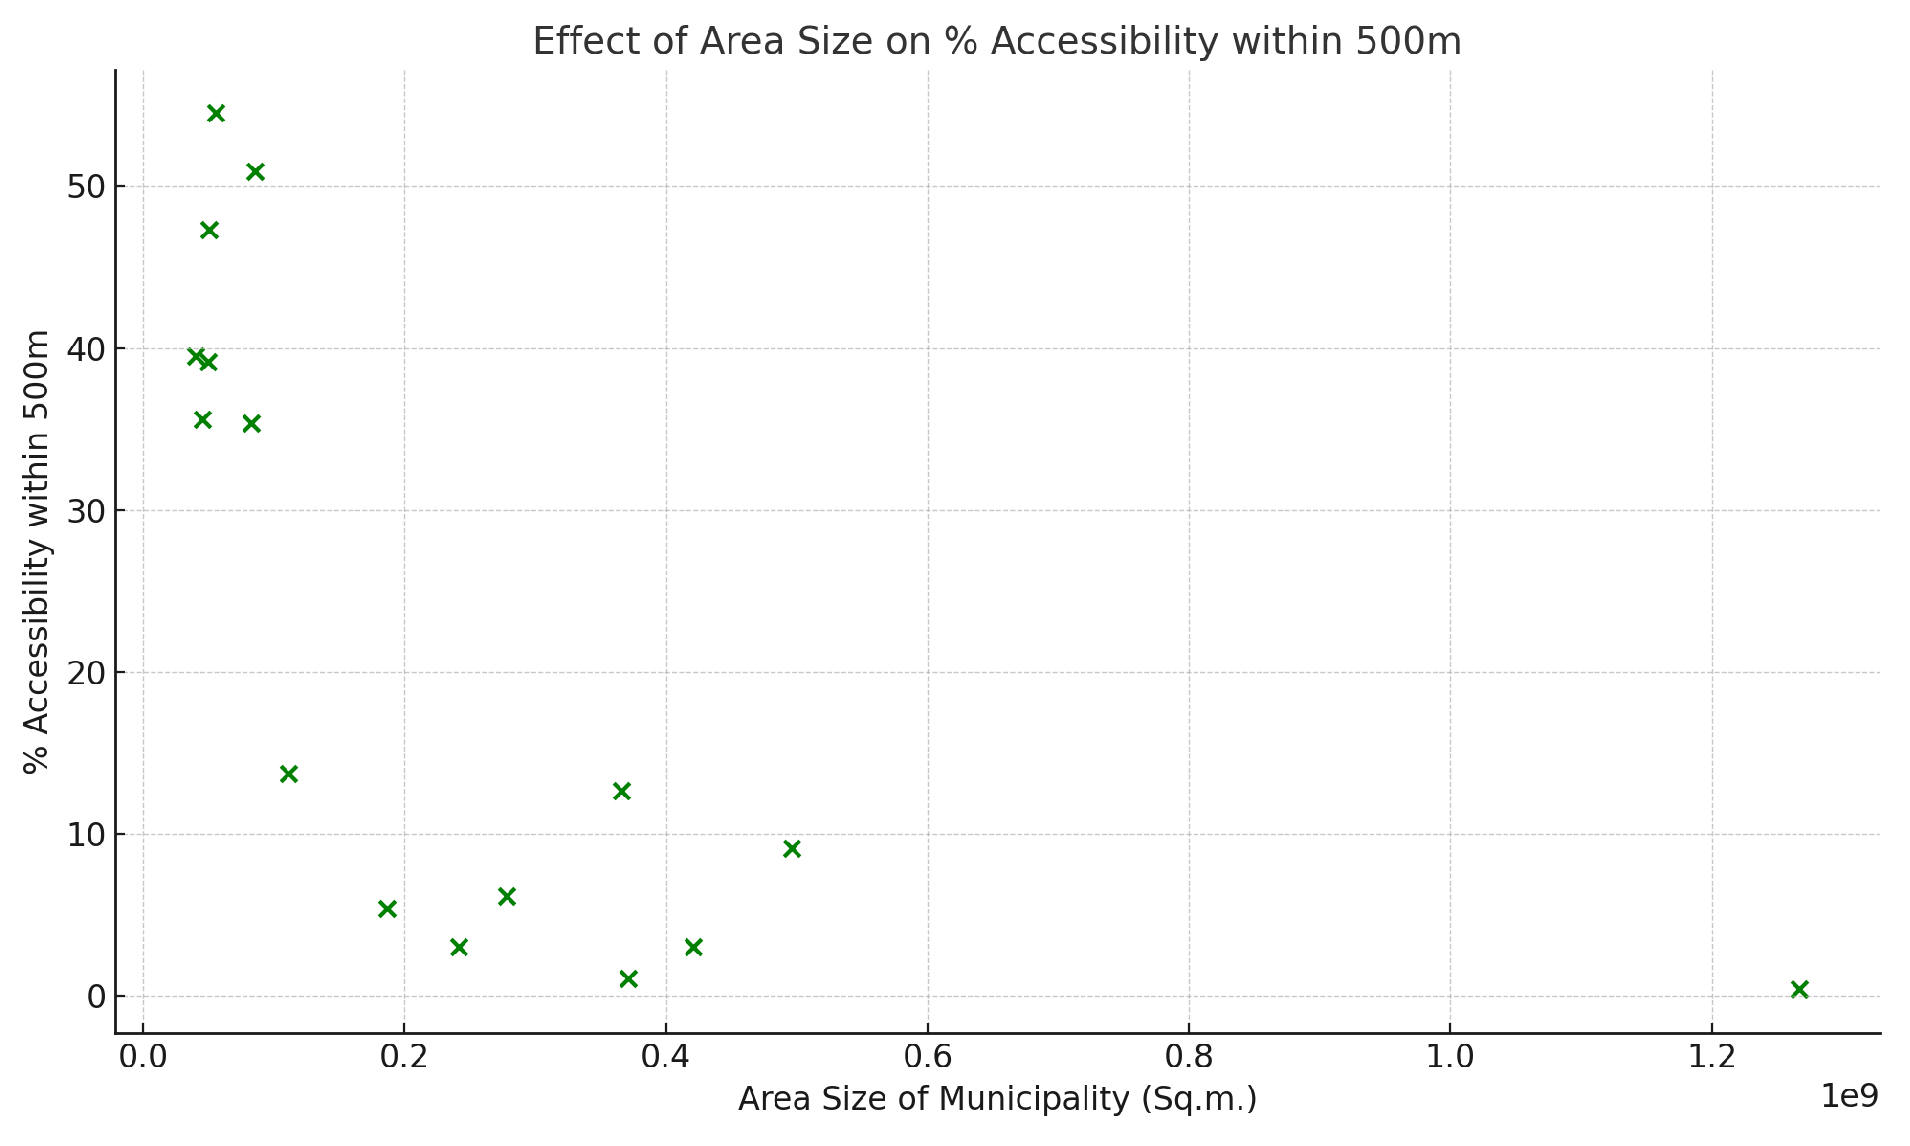
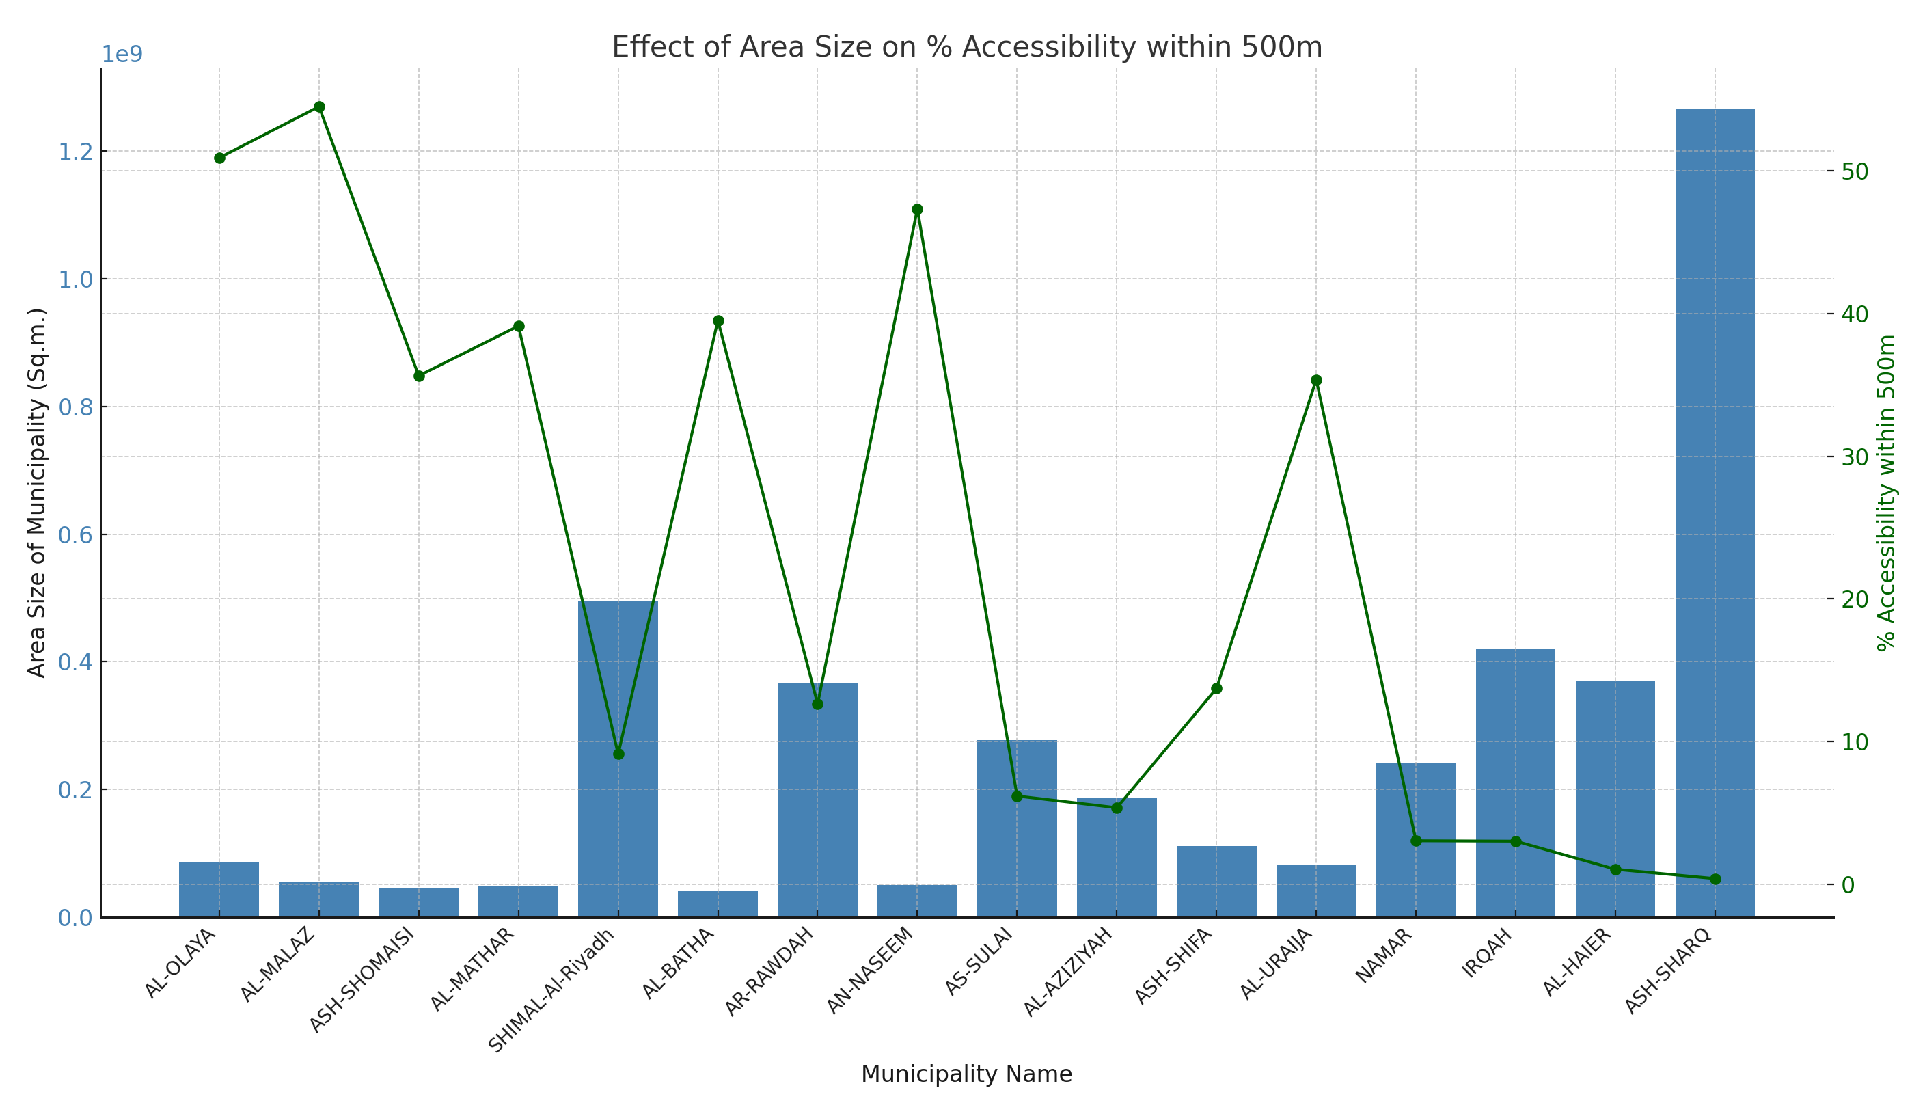
Figure 21 shows the relationship between the areas of municipalities and the level of accessibility in various locales. Regardless of the bigger land region of certain municipalities, the level of accessibility remains comparatively high. This demonstrates the effectiveness of urban planning that balances the challenges of large land areas with the advantages of well-positioned green and park spaces. Then again, a few bigger regions show a lower level of accessibility within 500 m, suggesting that the parks should be relocated in specific regions or be expanded, focusing on those parks that do not provide widespread accessibility (see Figure 22). It is possible that people in some areas of these municipalities may be outside the 500 m range, suggesting potential areas of future development and the distribution of parks.
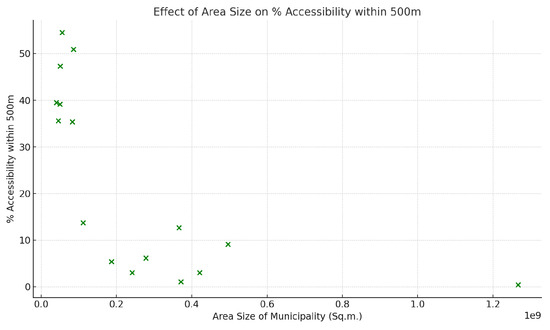
Figure 21.
The relationship between the total area of municipalities and accessibility.
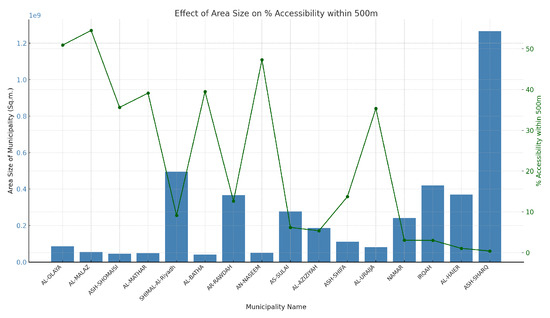
Figure 22.
The accessibility of each municipality and its total area size.
Spatial data analysis provides a valuable lens for understanding and improving accessibility in Riyadh’s distinctive urban context. This approach can provide vital insights by combining data on park locations, population density, and road networks. It can detect locations with limited park access, especially in high-density neighborhoods. This insight can help guide strategic park development, ensuring that inhabitants have access to nearby green areas. Current variations in the distribution of parks could be rooted in historical development patterns that neglected the inclusion of green spaces in certain neighborhoods; socioeconomic factors; or urban density issues where space for parks is limited. To convert vacant or underutilized spaces into smaller green areas, municipalities should design multi-purpose parks and gather extensive community input for park design and function. Also, public transport links to existing parks should be improved. Furthermore, a neighborhood’s size has a significant impact on the number of parks it can accommodate and where they are located. Larger neighborhoods may have space for large parks, but smaller ones require careful planning to ensure that several well-placed parks serve multiple communities. Additionally, spatial analysis might reveal discrepancies in pedestrian infrastructure throughout the city. It can direct targeted infrastructure investments by identifying places without sidewalks or safe walking routes, resulting in a more walkable and egalitarian Riyadh.
6. Conclusions and Future Work
In the rapidly developing city of Riyadh, parks play a crucial role as serene retreats amongst urban sprawl, offering residents both leisure and health-related respite. A core factor of urban development and planning in Riyadh is ensuring that these green spaces and parks are not only abundant but also ideally located to serve the city’s diverse population. This research examined the accessibility of parks in depth, utilizing a data-driven approach to gauge the adequacy of park coverage across various municipalities and districts. Our analysis revealed the intricate relationship between several urban factors such as population, density, park area size, the number of parks, and other factors, offering insights into their collective impact on residents’ accessibility to parks. The major finding of this research is that many of the neighborhoods and municipalities have many blank areas where the majority of their residents do not have any accessibility to parks and green spaces. We found that municipalities with higher population densities afforded slightly better accessibility to parks. However, a greater number of parks in a municipality did not always ensure better accessibility, accentuating the importance of strategic park placement and distribution. One noteworthy observation was the positive correlation between population density and park coverage within a 500 m walking distance in certain municipalities. This suggests that more densely populated areas might have ensured that, as a priority, residents have a park within a short walking distance. However, the overall level of accessibility in some regions, despite their vast area or significant number of parks, did not always provide widespread accessibility, suggesting potential areas of focus for urban planning. Factors like urban development, demographic shifts, and infrastructural developments could reshape patterns of park accessibility. Furthermore, as Riyadh continues to develop and evolve, understanding the influence of new residential or commercial projects on park accessibility will be crucial.
In future work, this analysis model will be applied to other cities for the purpose of comparison. Additionally, this study will be extended to other public services such as health services where the accessibility features will be adapted according to the driving zone and the navigation to determine the accessibility of these services.
Funding
This research received no external funding.
Institutional Review Board Statement
Not applicable.
Informed Consent Statement
Not applicable.
Data Availability Statement
The datasets generated during and/or analyzed during the current study are available from the corresponding author upon reasonable request.
Conflicts of Interest
The authors declare no conflicts of interest.
References
- Vision 2030. 2016. Available online: https://www.vision2030.gov.sa/en/ (accessed on 4 November 2023).
- Rigolon, A. A complex landscape of inequity in access to urban parks: A literature review. Landsc. Urban Plan. 2016, 153, 160–169. [Google Scholar] [CrossRef]
- Bedimo-Rung, A.L.; Mowen, A.J.; Cohen, D.A. The significance of parks to physical activity and public health: A conceptual model. Am. J. Prev. Med. 2005, 28, 159–168. [Google Scholar] [CrossRef] [PubMed]
- Chen, K.; Zhang, T.; Liu, F.; Zhang, Y.; Song, Y. How Does Urban Green Space Impact Residents’ Mental Health: A Literature Review of Mediators. Int. J. Environ. Res. Public Health 2021, 18, 11746. [Google Scholar] [CrossRef] [PubMed]
- Ferraro, A.; Marino, E.; Trancone, G.; Race, M.; Mali, M.; Pontoni, L.; Fabbricino, M.; Spasiano, D.; Fratino, U. Assessment of environmental parameters effect on potentially toxic elements mobility in foreshore sediments to support marine-coastal contamination prediction. Mar. Pollut. Bull. 2023, 194, 115338. [Google Scholar] [CrossRef] [PubMed]
- Mertes, J.D.; Hall, J.R. Park, Recreation, Open Space and Greenway Guidelines; National Recreation and Park Association: Alexandria, VA, USA, 1996. [Google Scholar]
- Gehl, J. Cities for People; Island Press: Washington, DC, USA, 2010. [Google Scholar]
- Wolch, J.R.; Byrne, J.; Newell, J.P. Urban green space, public health, and environmental justice: The challenge of making cities ‘just green enough’. Landsc. Urban Plan. 2014, 125, 234–244. [Google Scholar] [CrossRef]
- Fouad, A.T.Z.; Sinnett, D.; Bray, I.; McClatchey, R.; Reece, R. Measures of Greenspace Exposure and Their Association to Health-Related Outcomes for the Periods before and during the 2020 Lockdown: A Cross-Sectional Study in the West of England. Land 2023, 12, 728. [Google Scholar] [CrossRef]
- Jennings, V.; Bamkole, O. The Relationship between Social Cohesion and Urban Green Space: An Avenue for Health Promotion. Int. J. Environ. Res. Public Health 2019, 16, 452. [Google Scholar] [CrossRef] [PubMed]
- Chini, C.M.; Canning, J.F.; Schreiber, K.L.; Peschel, J.M.; Stillwell, A.S. The Green Experiment: Cities, Green Stormwater Infrastructure, and Sustainability. Sustainability 2017, 9, 105. [Google Scholar] [CrossRef]
- Ignatieva, M.; Mofrad, F. Understanding Urban Green Spaces Typology’s Contribution to Comprehensive Green Infrastructure Planning: A Study of Canberra, the National Capital of Australia. Land 2023, 12, 950. [Google Scholar] [CrossRef]
- American Society of Planning Officials. Standards for Outdoor Recreational Areas; American Society of Planning Officials: Chicago, IL, USA, 1960. [Google Scholar]
- Yasumoto, S.; Nakaya, T.; Jones, A.P. Quantitative Environmental Equity Analysis of Perceived Accessibility to Urban Parks in Osaka Prefecture, Japan. Appl. Spat. Anal. 2021, 14, 337–354. [Google Scholar] [CrossRef]
- McCormack, G.R.; Rock, M.; Toohey, A.M.; Hignell, D. Characteristics of urban parks associated with park use and physical activity: A review of qualitative research. Health Place 2010, 16, 712–726. [Google Scholar] [CrossRef] [PubMed]
- Zhang, J.; Yue, W.; Fan, P.; Gao, J. Measuring the accessibility of public green spaces in urban areas using web map services. Appl. Geogr. 2021, 126, 102381. [Google Scholar] [CrossRef]
- Cohen, D.A.; Han, B.; Derose, K.P.; Williamson, S.; Marsh, T.; Rudick, J.; McKenzie, T.L. Proximity to urban parks and mental health. J. Ment. Health Policy Econ. 2016, 19, 19–24. [Google Scholar]
- Alamri, S.; Adhinugraha, K.; Allheeib, N.; Taniar, D. GIS Analysis of Adequate Accessibility to Public Transportation in Metropolitan Areas. Isprs Int. J. Geo-Inf. 2023, 12, 180. [Google Scholar] [CrossRef]
- Tatit, P.; Adhinugraha, K.; Taniar, D. Navigating the Maps: Euclidean vs. Road Network Distances in Spatial Queries. Algorithms 2024, 17, 29. [Google Scholar] [CrossRef]
- Stephen Gibson, A.L.S.; Mukhija, V. Ensuring park equity: A California case study. J. Urban Des. 2019, 24, 385–405. [Google Scholar] [CrossRef]
- So, S.W. Urban Green Space Accessibility and Environmental Justice: A GIS-Based Analysis in the City of Phoenix, Arizona. Ph.D. Thesis, University of Southern California, Los Angeles, CA, USA, 2016. [Google Scholar]
- Park, J.H.; Lee, D.K.; Park, C.; Kim, H.G.; Jung, T.Y.; Kim, S. Park Accessibility Impacts Housing Prices in Seoul. Sustainability 2017, 9, 185. [Google Scholar] [CrossRef]
- Li, Y.; Lin, Y.; Geertman, S.; Hooimeijer, P.; Xu, W.A. Accessibility-Based Equity of Public Facilities: A Case Study in Xiamen, China. Appl. Spat. Anal. 2021, 14, 947–968. [Google Scholar] [CrossRef]
- Kabisch, N.; Strohbach, M.; Haase, D.; Kronenberg, J. Urban green space availability in European cities. Ecol. Indic. 2016, 70, 586–596. [Google Scholar] [CrossRef]
- Zhang, X.; Lu, H.; Holt, J.B. Modeling spatial accessibility to parks: A national study. Int. J. Health Geogr. 2011, 10, 31. [Google Scholar] [CrossRef]
- Yang, L.; Chau, K.; Szeto, W.; Cui, X.; Wang, X. Accessibility to transit, by transit, and property prices: Spatially varying relationships. Transp. Res. Part Transp. Environ. 2020, 85, 102387. [Google Scholar] [CrossRef]


Disclaimer/Publisher’s Note: The statements, opinions and data contained in all publications are solely those of the individual author(s) and contributor(s) and not of MDPI and/or the editor(s). MDPI and/or the editor(s) disclaim responsibility for any injury to people or property resulting from any ideas, methods, instructions or products referred to in the content. |
© 2024 by the author. Licensee MDPI, Basel, Switzerland. This article is an open access article distributed under the terms and conditions of the Creative Commons Attribution (CC BY) license (https://creativecommons.org/licenses/by/4.0/).