1. Introduction
Access to energy is a need and a right, and as energy demand continues to grow worldwide (due to increasing per capita demand and population growth) [
1], energy supply faces enormous challenges. Traditional non-renewable resources are being depleted, and the geographical distribution of these resources raises important issues in terms of equitable access to energy and potential related conflicts [
2,
3]. Finally, energy production from non-renewable fossil fuels generates amounts of carbon emissions that human life on Earth can no longer bear. Climate change mitigation and the consequent demand for decarbonisation are as urgent as the need to continue meeting energy demands [
4,
5,
6,
7,
8].
To cope with meeting energy demand and the need for decarbonisation, energy transition is the solution identified by European Union (EU) strategies (related to the European Green Deal [
9]). The energy transition is a shift in the energy paradigm from energy produced through non-renewable fossil resources to energy produced through renewable resources, or renewable energy (RE) [
10]. Thus, RE has the potential to be the key tool for a successful energy transition [
11,
12]. Renewable electricity is expected to decarbonize a large share of the EU’s energy consumption by 2050 and play a crucial role in energy strategies being developed at different levels and in different contexts. Not only that, REs have the potential to provide a set of co-benefits, such as the decentralisation of energy production, better access to energy, and integrated energy-environmental actions, as well as measures against energy poverty [
13].
Renewable technologies contribute to over 23% of global power generation, and solar photovoltaics (PVs) are one of the most prominent renewable technologies, with an annual growth rate of over 28% with the net global installed capacity [
14]. Italy, Greece, and Germany are the leading countries in the world in terms of the percentage of their power generation coming from PVs, with respective shares of 7.8%, 6.5%, and 6.4% [
14].
To counterbalance the endorsed role of REs in general and PVs and the positive impacts expected from their massive implementation, it is key to highlight that REs and, hence, PVs are not a sustainable measure per se: their sustainable use for energy production purposes requires that no critical trade-offs with services and benefits derived from natural resources are triggered [
15]—e.g., food production loss due to PV installation, aesthetical damage to valuable landscapes due to gigantic solar parks, and habitats altered by the increase in local temperature due to the presence of PVs [
16,
17,
18,
19]. Therefore, the development of PVs can negatively impact other ecosystems’ delivering functions, and hence, it may hamper the sustainability of the transition [
20]. In addition, the unsustainable expansion of RE production through PVs raises complex social and cultural questions and creates unexpected economic and developmental implications [
21].
Contrary to fossil fuel extraction, the production of RE from PVs requires space [
17], and how land is used is central to addressing sustainability issues; the installation of PVs presents a variety of possible scenarios for development, each one presenting different land use and sustainability implications. For example, small-scale and building-integrated applications have provided a substantial proportion of the global PV capacity. Germany, for example, the world’s leading country in solar PV installed capacity, benefits mainly from small-scale systems. Together with Germany, other countries like Italy, Japan, Spain, the UK, and the USA have seen their PV market rapidly flourish. In the UK, over the five-year period between 2010 and 2015, 87% of renewables were developed through solar PV, 70% of which are under 10 kW [
14]. In Italy, at present, 64% of the total solar PV installed capacity is on roofs without triggering massive land use changes [
22]. As Dijkman and Benders [
17] state, to prevent or minimise the potential competition for land between PV installation and other activities (e.g., food production), it is important that land must be used in such a way that maximal energy gains are achieved through minimal further land consumption.
Energy planning has the chance and the responsibility to identify, design, and implement initiatives, policies, plans, and strategies that can ensure the needed upscale of PV systems while minimising land consumption and, consequently, possible negative effects on the economy, the environment, and society. At present, there is growing consensus on the critical role of land consumption in the development and mainstreaming of PV systems. Despite this, the practice of land use for massive RE production, such as big-scale solar farms, is a critical challenge to the low-carbon energy transition. For instance, green grabbing is a new form of land acquisition in which land and natural resources are dispossessed under sustainable development goals [
13].
According to De Pascali et al. [
23], analysing energy production from PVs from a sustainability lens can reduce environmental negative impacts. We believe that energy plans can and have to set the ground for ensuring a sustainable energy transition [
24].
The scientific literature presents promising insights and sets challenging perspectives addressing the analysis of energy production alternatives through PVs without triggering negative environmental, social, and economic impacts, in addition to purely “energy-focused” considerations [
25]. While Academia has progressed in including environmental and social considerations in the design of energy plans and in energy transition strategies [
24], the application of an integrated approach that goes beyond purely technical considerations for energy production in real practice is still not established [
24].
It is true that the EU has shown paramount efforts over the last decade to accelerate and support the transition with targets, principles, strategies, and measures. At the national level, member states are asked to align in terms of targets, approach, and timing, and they are doing so thanks to the trajectories followed by the relevant EU policies and platforms such as the NECPs [
26]. However, national energy plans have been characterised broadly by the limited participation of decision-making forces and actors outside the energy sector [
26], proving the above-mentioned lack of integration of different disciplines to the design of energy strategies. Further development within the research arena is essential for providing decision-maker-oriented information and tools that can enable them to pursue the proper use of PVs in their territories. Hence, the virtuous improvement of energy plans and transition strategies should align and integrate with principles of the minimisation of land consumption, negative environmental impacts, and social externalities [
23].
Concerning the scale of research and action, landscape changes introduced by the maximisation of PV installation call for local-level thoughts and strategic planning [
15,
20]. It is key to acknowledge the relevance of the local scale—referring to regional, provincial, metropolitan, and municipal levels—to address these issues, as it is the scale where most stakeholders make decisions or exert their power. Consequently, impacts, land use trade-offs, and landscape implications analysis should focus on the local scale. Analysis and tools to support decision making for a sustainable transition should be concrete and close to the work of the local decision-makers [
27]. Hence, an effort to support the local dimension could enable the technical experts and policy designers to overcome the business-as-usual practice that lacks the integration of environmental and social considerations in energy planning. However, concerning the state of the art in the EU context and with a specific focus on Italy, the local dimension of energy plans lacks the integration of sustainability principles in the development of energy strategies [
15]. To conclude the overall picture, there is a distance between the tools available and their complexity for the end-user or difficulty to choose: capacity issues and the availability of user-friendly assessment tools to effectively support decision-makers and planners are major issues in the planning practice [
28].
Based on such science–policy–action interface gaps, the aim of this work is to provide a concrete contribution to this panorama by linking the theory derived from scientific knowledge and practice. The goal of this paper is to propose a stepwise methodology to facilitate the planning of RE production upscale at the regional level in a sustainable manner. More specifically, this work focuses on the development of PV systems for supporting the energy transition at the regional level (to cover the electricity demand) while minimising negative impacts in terms of land competition and overall sustainability. This methodological approach, which brings novelty to the local level energy planning and sustainable transition fields, is applied to an illustrative case study at the regional level, i.e., the Veneto Region.
Through the illustrative case study of the Veneto Region, this study divides national targets into regional targets. Then, based on electricity consumption data, the electricity demand for the present and future is calculated. This methodology follows the calculation of the area needed to meet the future electricity demand through PV production only. In the last step, a set of alternative options for PV installation without triggering further soil consumption is identified and mapped and available areas for PV installation are quantified per category or option (e.g., residential roofs, parking lots, school buildings, …) through GIS analysis. This last step is to verify whether the national and regional target for RE production over total electricity consumption can be met and, if so, which viable options can serve as alternatives for decision-makers to identify their strategies.
This paper follows with
Section 2, which briefly illustrates the case study.
Section 3 presents the methods organised into three main blocks addressing three applied research questions, respectively, as listed below:
- (i)
How much RE production is needed to meet the future electricity demand in the region to reach the energy transition targets?
- (ii)
How many hectares are needed to meet the energy transition targets at the regional level through PV installation?
- (iii)
How many areas do we have available in the region for PV installation without implying further land consumption? And do we have a set of viable options to consider?
Section 4 presents the results mirroring the three applied research questions supported by a set of explicative maps. The discussion (
Section 5) and conclusions (
Section 6) sections build on the empirical insights and delve into the theoretical framing, aiming to fill the research gaps.
2. Case Study
The Veneto Region in Italy spans 18.3 × 10
3 km
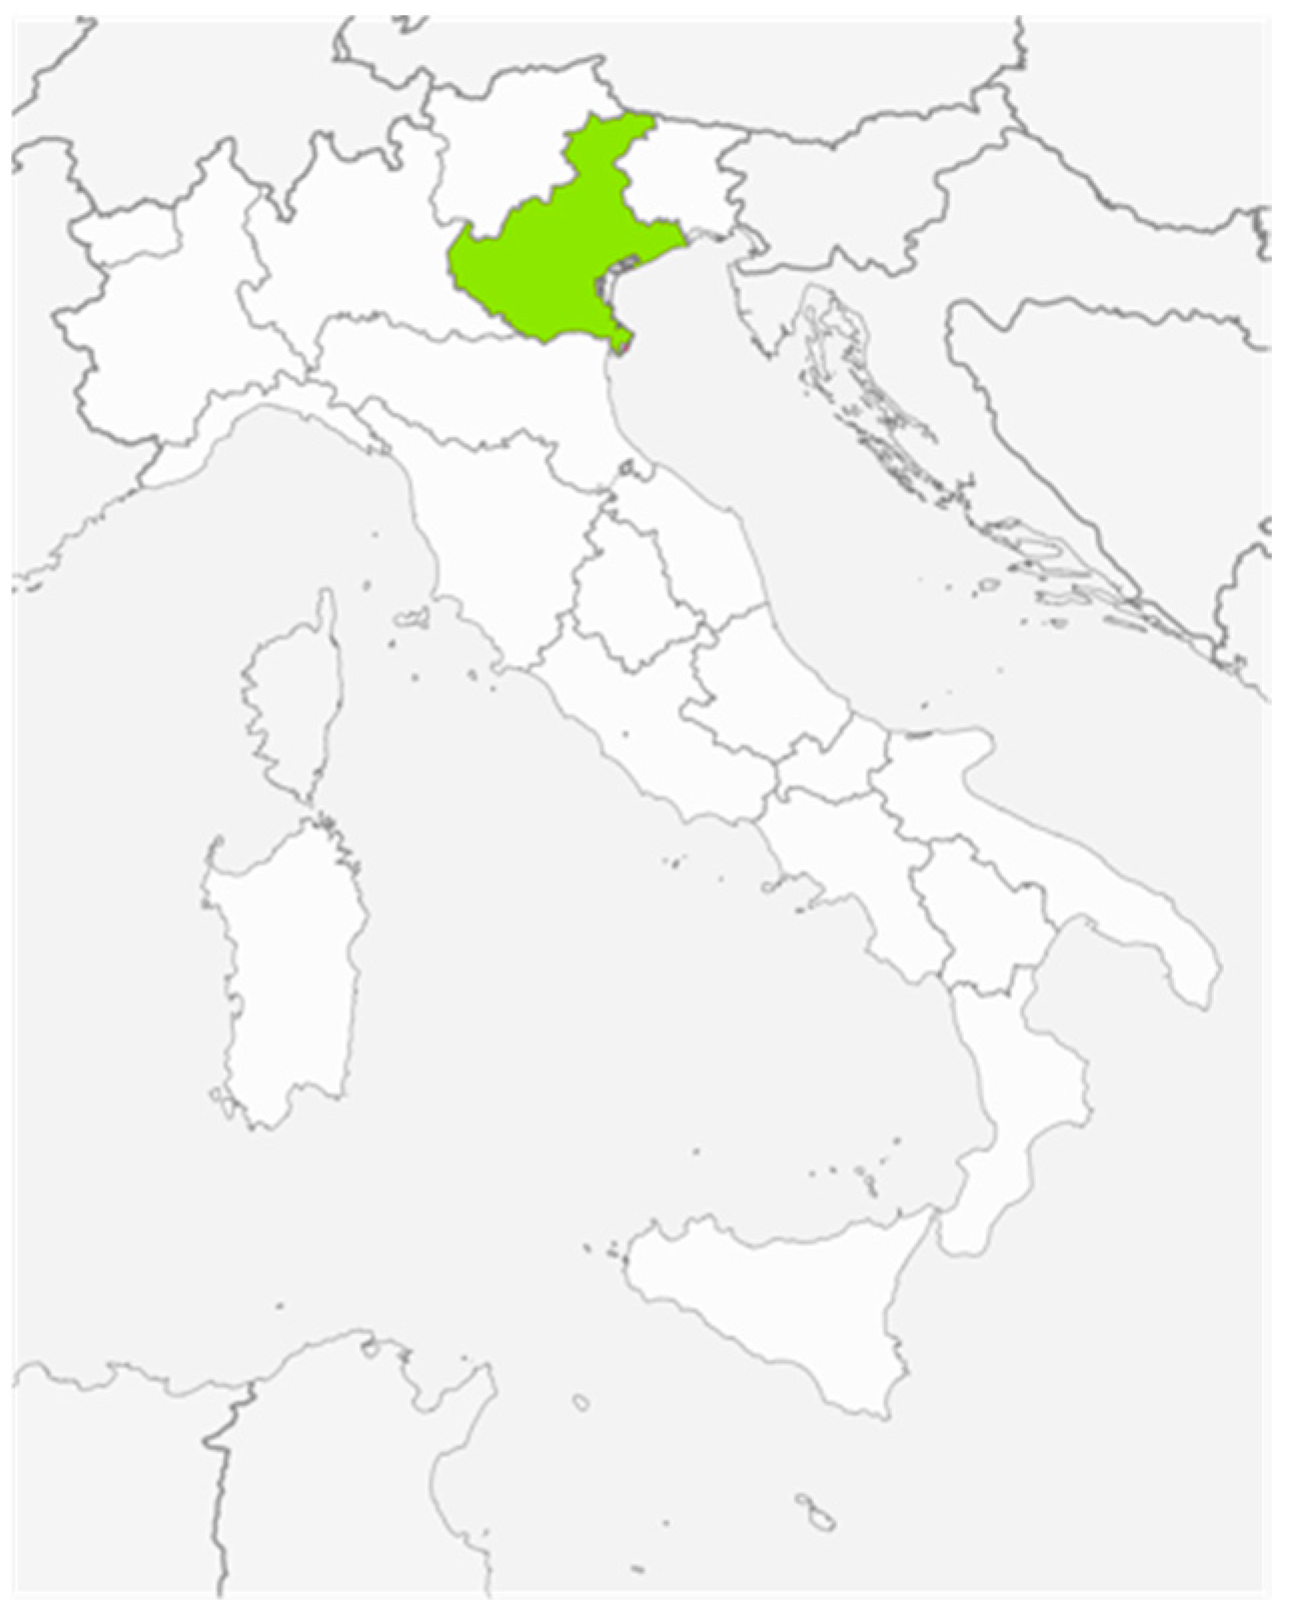
2, ranking as the eighth largest region in the country, with a population of 4.5 million inhabitants. Situated in north-eastern Italy, it is bordered by Austria, four Italian regions (Lombardia, Trentino, Sud Tirol, Emilia-Romagna, and Friuli Venezia-Giulia), and the Adriatic Sea. Notable cities within Veneto include its capital, Venezia, as well as Padova and Verona [
29]. From a geo-morphological standpoint, Veneto shares a diverse landscape with the Friuli Venezia-Giulia region, encompassing Alpine, hilly, plain, and coastal terrains. While plains dominate the region (56.4%), the most valuable natural assets, recognised by UNESCO, are found in the mountains, such as the Dolomites, and along the coast, including Venezia’s lagoon and the Po River delta. (
Figure 1 shows the location of the Veneto Region in Italy).
Over the past 70 years, Veneto has witnessed changes in its plain landscape due to low-density urbanisation, spanning from Verona to Treviso, termed a “Città diffusa” or the Diffused City [
30]. Urban land now covers 2.7 × 10
3 km
2, while rural areas (8.9 × 10
3 km
2) with agricultural significance exist both within and outside the sprawled city. Agricultural activities contribute positively to ecological systems, providing essential ecosystem services. However, intensive vineyard cultivation has adversely impacted soil nutrient cycles and human life. Forest land, wetlands, and water bodies cover 5.6 × 10
3 km
2, 0.3 × 10
3 km
2, and 0.8 × 10
3 km
2, respectively [
31].
Regarding climate, Veneto experiences a statistically significant average annual temperature increase of +0.6 °C per decade. Precipitation patterns have not significantly changed over the past thirty years, showing inter-annual variability with increasing trends in standard deviation [
32]. Regional planning in Veneto faces challenges due to a rigid regulatory framework with limited flexibility, resulting in siloed policies that hinder cross-cutting issues like ecosystem services and climate change.
Economically, Veneto is vital, with renowned small-medium enterprises producing high-end products, predominantly in the energy-demanding plain area. This region is susceptible to energy supply risks, as it heavily relies on external sources and lacks a developed renewable energy system.
Examining the Veneto Region from the standpoint of regional planning and policymaking has been an extensive endeavour, incorporating perspectives on governance, local development, and spatial planning [
30,
33]. The regulatory framework in the Veneto Region is notably rigid, exhibiting low legalistic flexibility. Additionally, the spatial planning approach at both regional and sub-regional levels tends to be confirmative, often resulting in the isolation of plans and policies within specific administrative departments. This poses challenges, particularly when addressing overarching issues such as ecosystem services, climate change mitigation and adaptation, and smart specialisation, among others. Consequently, these plans may encounter hindrances in implementation, leading to prolonged periods of inertia. The Veneto Energy Plan (PER) [
12], approved in 2017, focuses on promoting renewable energy sources (RESs) to achieve national objectives in burden sharing, energy efficiency, and emissions reduction/neutralisation in transportation.
Regarding the picture of electricity production from renewable sources in Veneto, to date, the region is betting heavily on photovoltaics. Historically, the contribution of hydropower has always been fundamental and still is, but due to technical and environmental limitations (due to the impact on ecosystems and minimum flow levels guaranteed for waterways), the region does not plan to increase the amount of energy production through hydropower [
6]. Similarly, but for different reasons, wind power to date is also not a viable alternative for the region. In fact, with current production technologies, analyses show that the region has too little wind to consider serious investment in wind farms [
6]. Finally, regarding the expansion of solar photovoltaics, to date, Veneto produces 9.8 percent of national photovoltaic production (or 2.3 × 10
4 MW) [
22]. Sixty-four percent of this production occurs on rooftops, while the remaining 36 percent is from ground-mounted installations [
22].
3. Materials and Methods
3.1. Quantifying Future RE Demands to Reach the Energy Transition Targets
According to the National Integrated Plan for Energy and Climate (PNIEC), Italy is expected to play a leading role in assisting the other member states in achieving the objective of eliminating harmful emissions by 2050 [
34]. Several intermediate targets have been defined in order to accomplish this goal. According to the “fit for 55” EU Directive [
35], at least 55% of harmful emissions must be reduced by 2030. Reducing reliance on fossil fuels is one approach to achieve this. However, this approach is not sufficient as it is necessary to also link a shift to renewable energy sources as widely as possible.
Veneto Region’s role in this pathway may be of relevance. The residential sector is the largest, with around 75% of the buildings being residential and consequently, the emissions related to this sector are 80%. The transition from a massive use of fossil energy to renewable energy is, therefore, crucial.
This work aimed at providing a contribution to the implementation of decarbonisation to support regional policy making, by defining the energy demand from the residential sector (including road mobility needs), and determining whether such demand can be satisfied by energy production from solar panels installed on the private roofs of residential sectors. These steps were made in the light of promoting informed policies and strategies for the upscale of REC: the target and possible areas of energy production.
To estimate potential energy demands in 2030 for the residential sector of the Veneto Region, we adopted three steps. First, we determined the overall energy consumption of the Veneto Region from a business-as-usual perspective. Then, we identified the ratio of the residential sector demand to the overall demand, and we fine-tuned it considering the potential electrification and improved thermal efficiency of the building sector. To conclude, we estimated the surface needed (in m2) to cover the expected energy demand of the residential sector by 2030.
Firstly, to determine the overall energy consumption of the Veneto Region in 2030, we applied an approach adopted by Jäger-Waldau et al. [
2], which consisted of a combination of a compound annual growth rate (CAGR) formula and a compound interest (CI) formula. CAGR is a measure used to determine the average annual growth rate over a specified period of time and it is often applied to energy demand. When forecasting energy demand, CAGR can provide insights into the rate at which energy consumption is expected to grow or decline over a certain period based on past trends and forecasting. It is important to recognise that CAGR-based forecasts are based on assumptions and historical trends and may not fully account for unexpected events or disruptions [
2].
The application of the CAGR formula makes it possible to identify the annual growth rate of energy consumption, while the application of the CI formula makes it possible to apply this rate to all years from 2020 to 2030 to obtain the total energy consumption of the region in 2030. To apply the CAGR formula, we used data from Terna [
3], the company that manages the Italian electricity transmission grid, which provides the region’s total energy consumption from 1973 to 2020. This approach assumes linear growth. The CAGR formula adopted is presented below:
where
V final = final value (in our case, the overall consumption value in 2020);
V begin = starting value (in our case, the overall consumption value in 1973);
T = time (in our case, the time corresponds to a 47-year time-lapse)
We obtained the CAGR value and adopted it to calculate the CI. The formula is presented below:
where
V final = final value (in our case, the overall consumption value in 2020);
CAGR = see the formula above;
t = time (in our case, time corresponds to the 10-year time-lapse, from 2020 to 2030).
From this first step, a CAGR value of 0.018588 (GWh) was obtained, which corresponds to annual growth. Applying this annual growth through the CI formula, an expected energy demand for the Veneto Region in 2030 of 3.6 × 10
4 GWh was obtained. This figure is comparable to that obtained by Lorenzoni et al. using a different methodology [
6].
3.2. Transforming the Future RE Demand in HA Equivalent of Surface Needed to Produce It
Based on the work by Lorenzoni et al. [
6], within the overall energy demand, the residential sector in the region is responsible for 30% of the overall energy consumption (and 21% of the overall consumption is due to the heating systems). The 30% of the overall regional demand calculated above means 1.1 × 10
4 GWh. The work by Lorenzoni et al. [
6], also states that the energy demand due to the heating systems decreases thanks to the improvements in the thermal energy efficiency of buildings, and there is an increase in the use of RESs (thanks to the present policies and subsidies stimulating the retrofitting of old and energivorous buildings), a mild climate in the winter months, which is a trend that will continue in the years to come due to climate change, and energy poverty, which is driving households in difficulty to adopt economical ways of saving money that push them to a minimum use of heating [
36]. However, this decrease is balanced by the growing electrification of residential systems and the increased energy demand due to technological progress and trends that keep the overall energy demand stable. Hence, we assume that the result obtained of 1.1 × 10
4 GWh coincides with a fine-tuned residential energy demand for 2030 in this region.
To conclude, to quantify the area required (m
2) to cover the solar energy consumption identified, we adapted the methodology of Terés-Zubiaga et al. [
8].
We assume the use of a Sunpower (SunPower Italia Srl, Via Trebazio 3, Milano, Italy) E20 series photovoltaic panel (panel area: 1.6 m
2, maximum peak power: 0.3 kWp, panel efficiency: 22%). The Sunpower E20 series corresponds to a high-performance panel type today but could represent an average-performance panel by 2030. Starting from such with the assumption of using such a panel as an illustrative case, we divided the expected solar energy demand by the efficiency of the system. In this way, we obtained the theoretical peak power [
8]. The efficiency of the system was obtained by multiplying the technical efficiency of the panel (22% in our case, for the Sunpower E20 series panel) by a performance ratio value of 0.84 [
5], and a dust and dirt factor of 0.93. Then, we divided the theoretical peak power by the average number of hours of use of photovoltaic systems for the Veneto Region, which corresponds to 1073 h per year. The number of panels required was calculated by dividing the demand by the maximum peak power of a panel (0.3 kWp). By multiplying such a number by the panel area (1.6 m
2 in our case, for the Sunpower E20 series panel) [
7], the total surface needed (in m
2) to cover the expected residential energy demand in 2030 was determined.
3.3. The Energy Transition without Further Land Consumption
Given the need to produce electricity to support the green transition, this section studies alternative scenarios for producing the solar energy required to cover the residential sector consumption by 2030. In particular, the aim of this methodological section is to identify alternatives for producing energy from solar power plants without this implying the consumption of agricultural land (since energy production from solar power plants and food production usually conflict) and without this implying further land consumption in general.
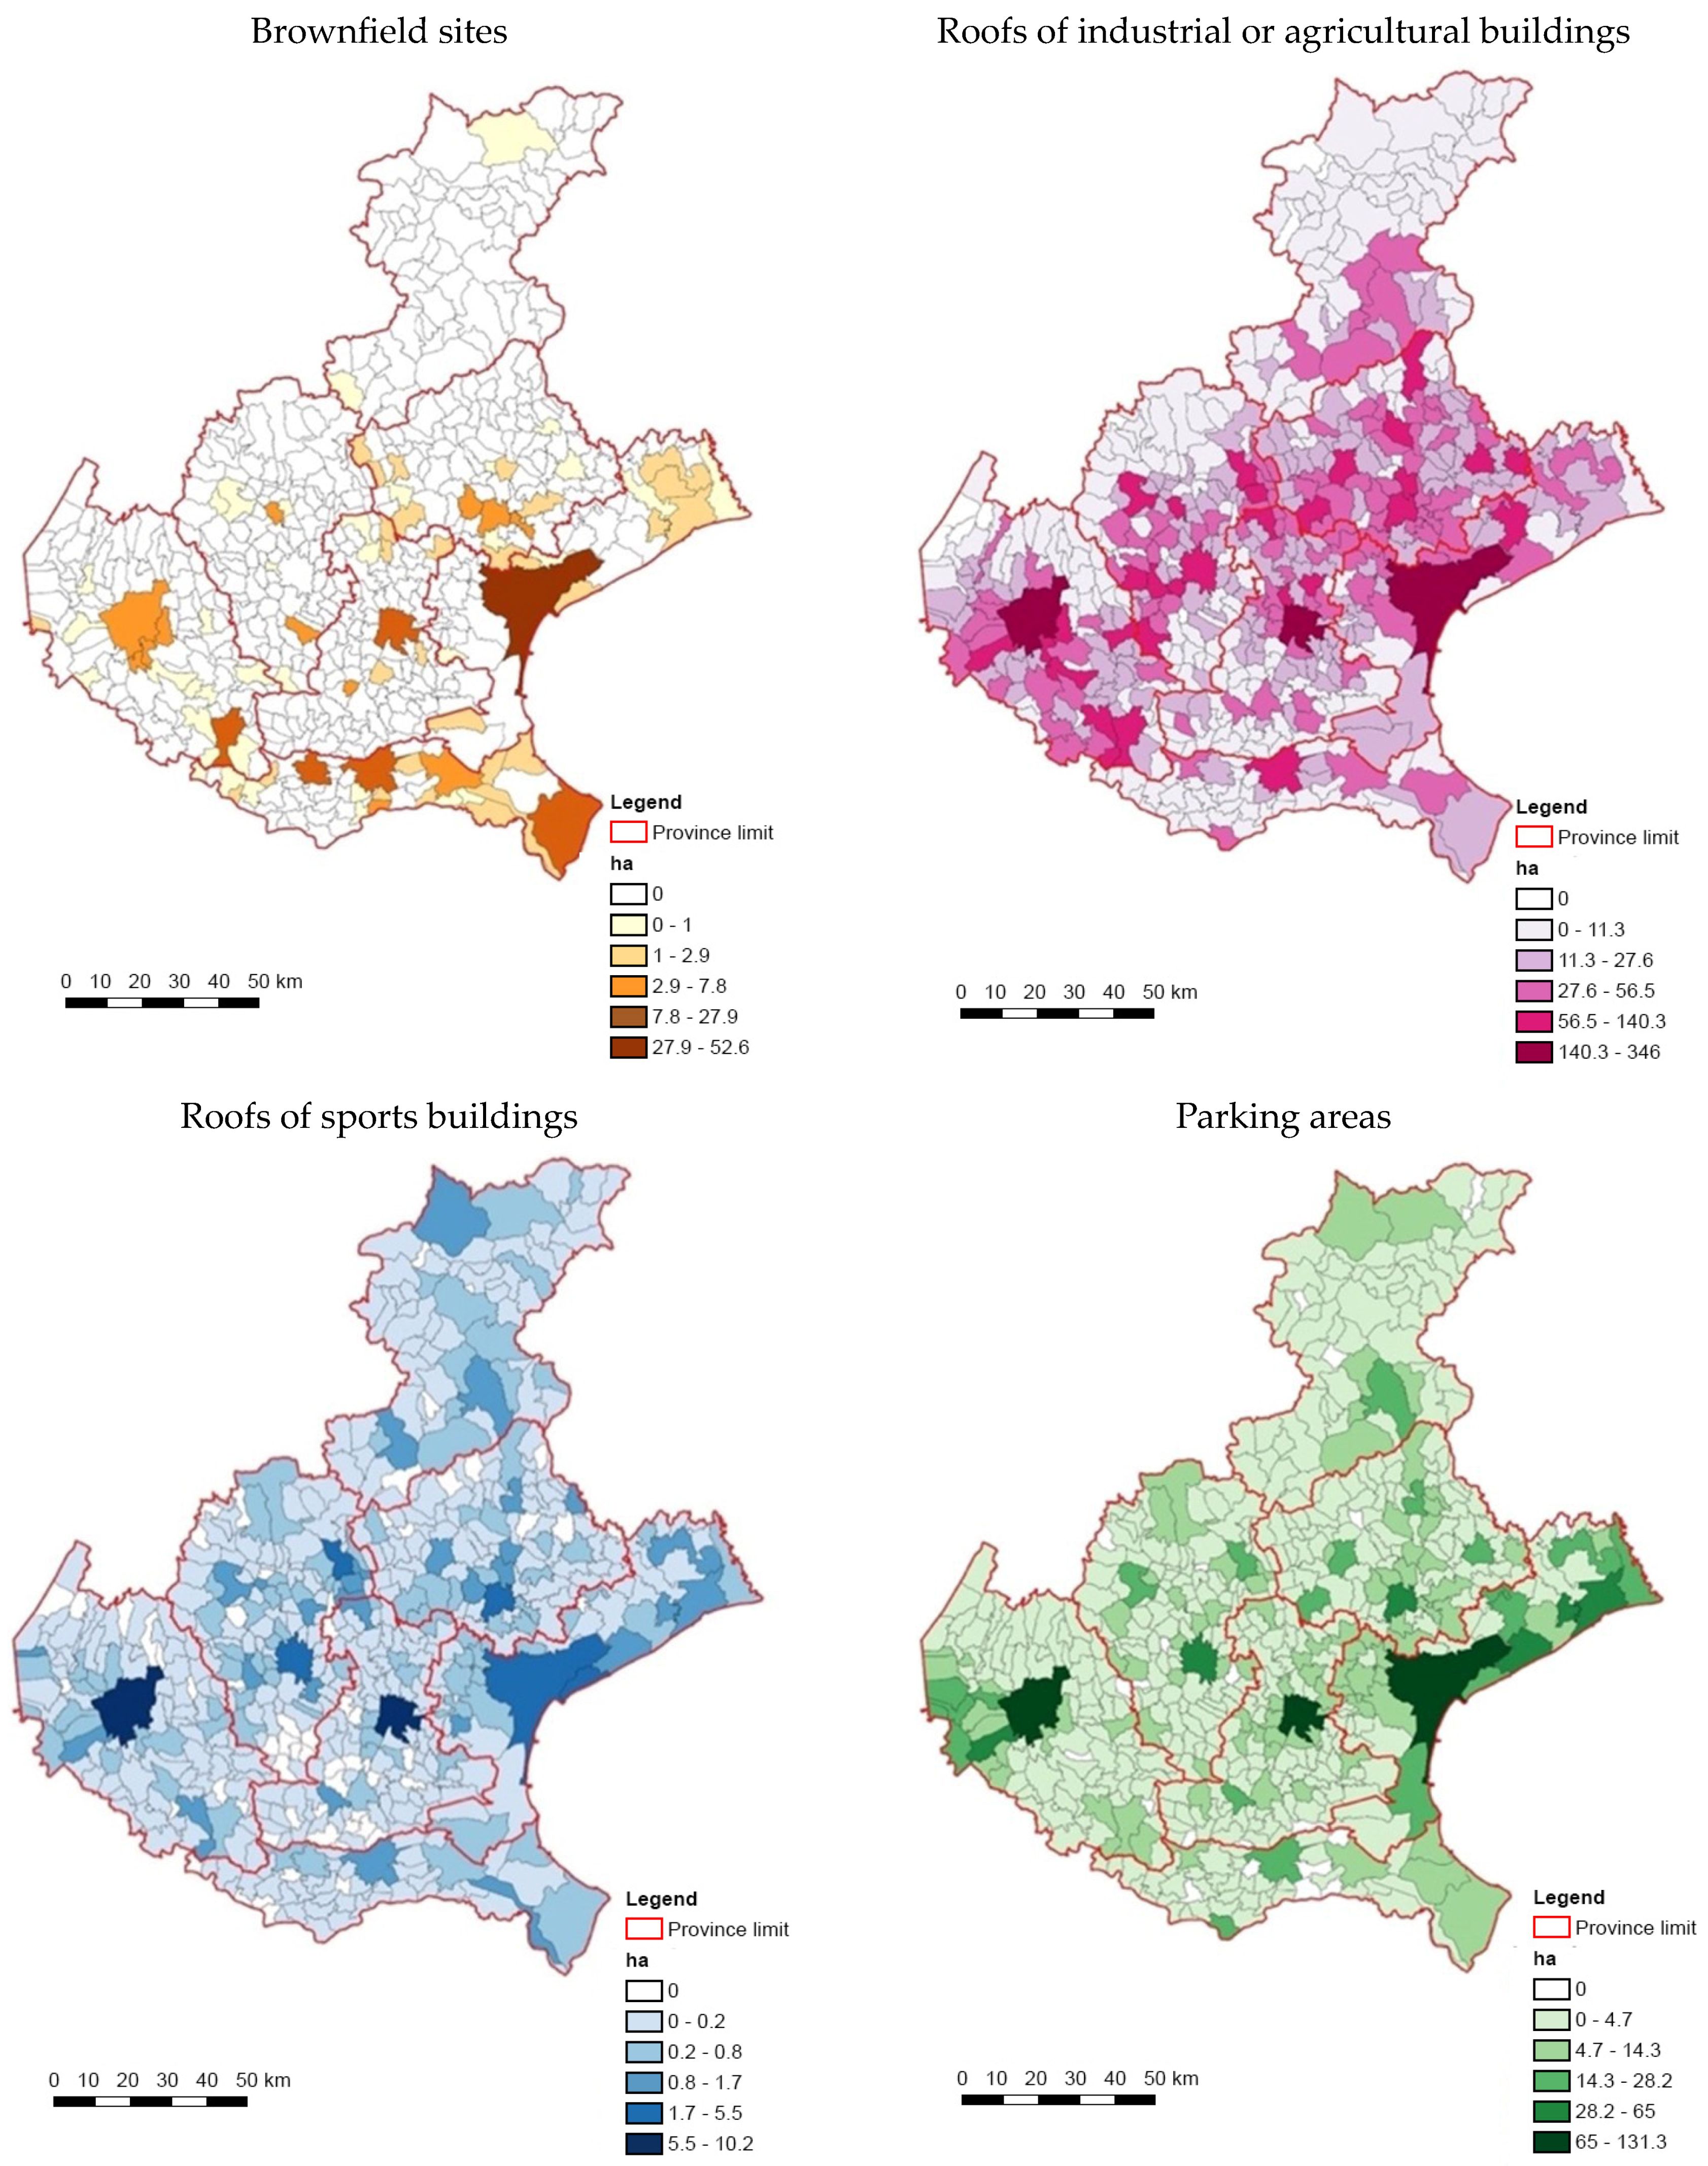
By means of GIS analysis, we mapped and quantified the area of six types of areas where photovoltaic systems could be installed: (i) brownfield sites; (ii) the roofs of industrial or agricultural buildings; (iii) the roofs of sports buildings; (iv) parking areas; (v) the roofs of school buildings; (vi) and the roofs of residential and accommodation buildings (outside historical centres and/or excluding listed buildings). All data are disaggregated by municipality.
To quantify the surface area available from brownfields, a 2018 land cover information layer was used (taken from the Veneto Region geoportal: “Land Cover Map Database update 2018” [
31]). This information base is filtered for the “abandoned areas” layer (brownfields), which is then dissolved and intersected with the region’s municipalities to obtain the total surface area of abandoned areas for each municipality.
For the quantification of the surface area available from the roofs of industrial or agricultural buildings, an information base of all buildings in the Veneto Region was created through the open street map portal. Subsequently, this information base, composed of all the geometries of buildings in the region, was cut for the layer “areas for industrial activities and annexed spaces” and “agro-industrial complexes”, again obtained from the 2018 land use layer (the same data source as in the previous paragraph). The latter result is dissolved and intersected with the geometry of the municipalities to obtain the total area of industrial and agro-industrial buildings per municipality.
For the quantification of the area available from the roofs of sports buildings, the same method as in the previous point is used, where instead of cutting the geometries for the land use levels defined in the previous point, the ‘sports areas’ level is used. Again, the result obtained is dissolved and intersected with the geometries of the municipalities to obtain the total area of sports buildings per municipality.
For the quantification of the surface area available from parking areas, all geometries identified as parking areas for the entire region were downloaded from the open street map portal. This layer was then dissolved and intersected for the municipalities to obtain the total parking area per municipality.
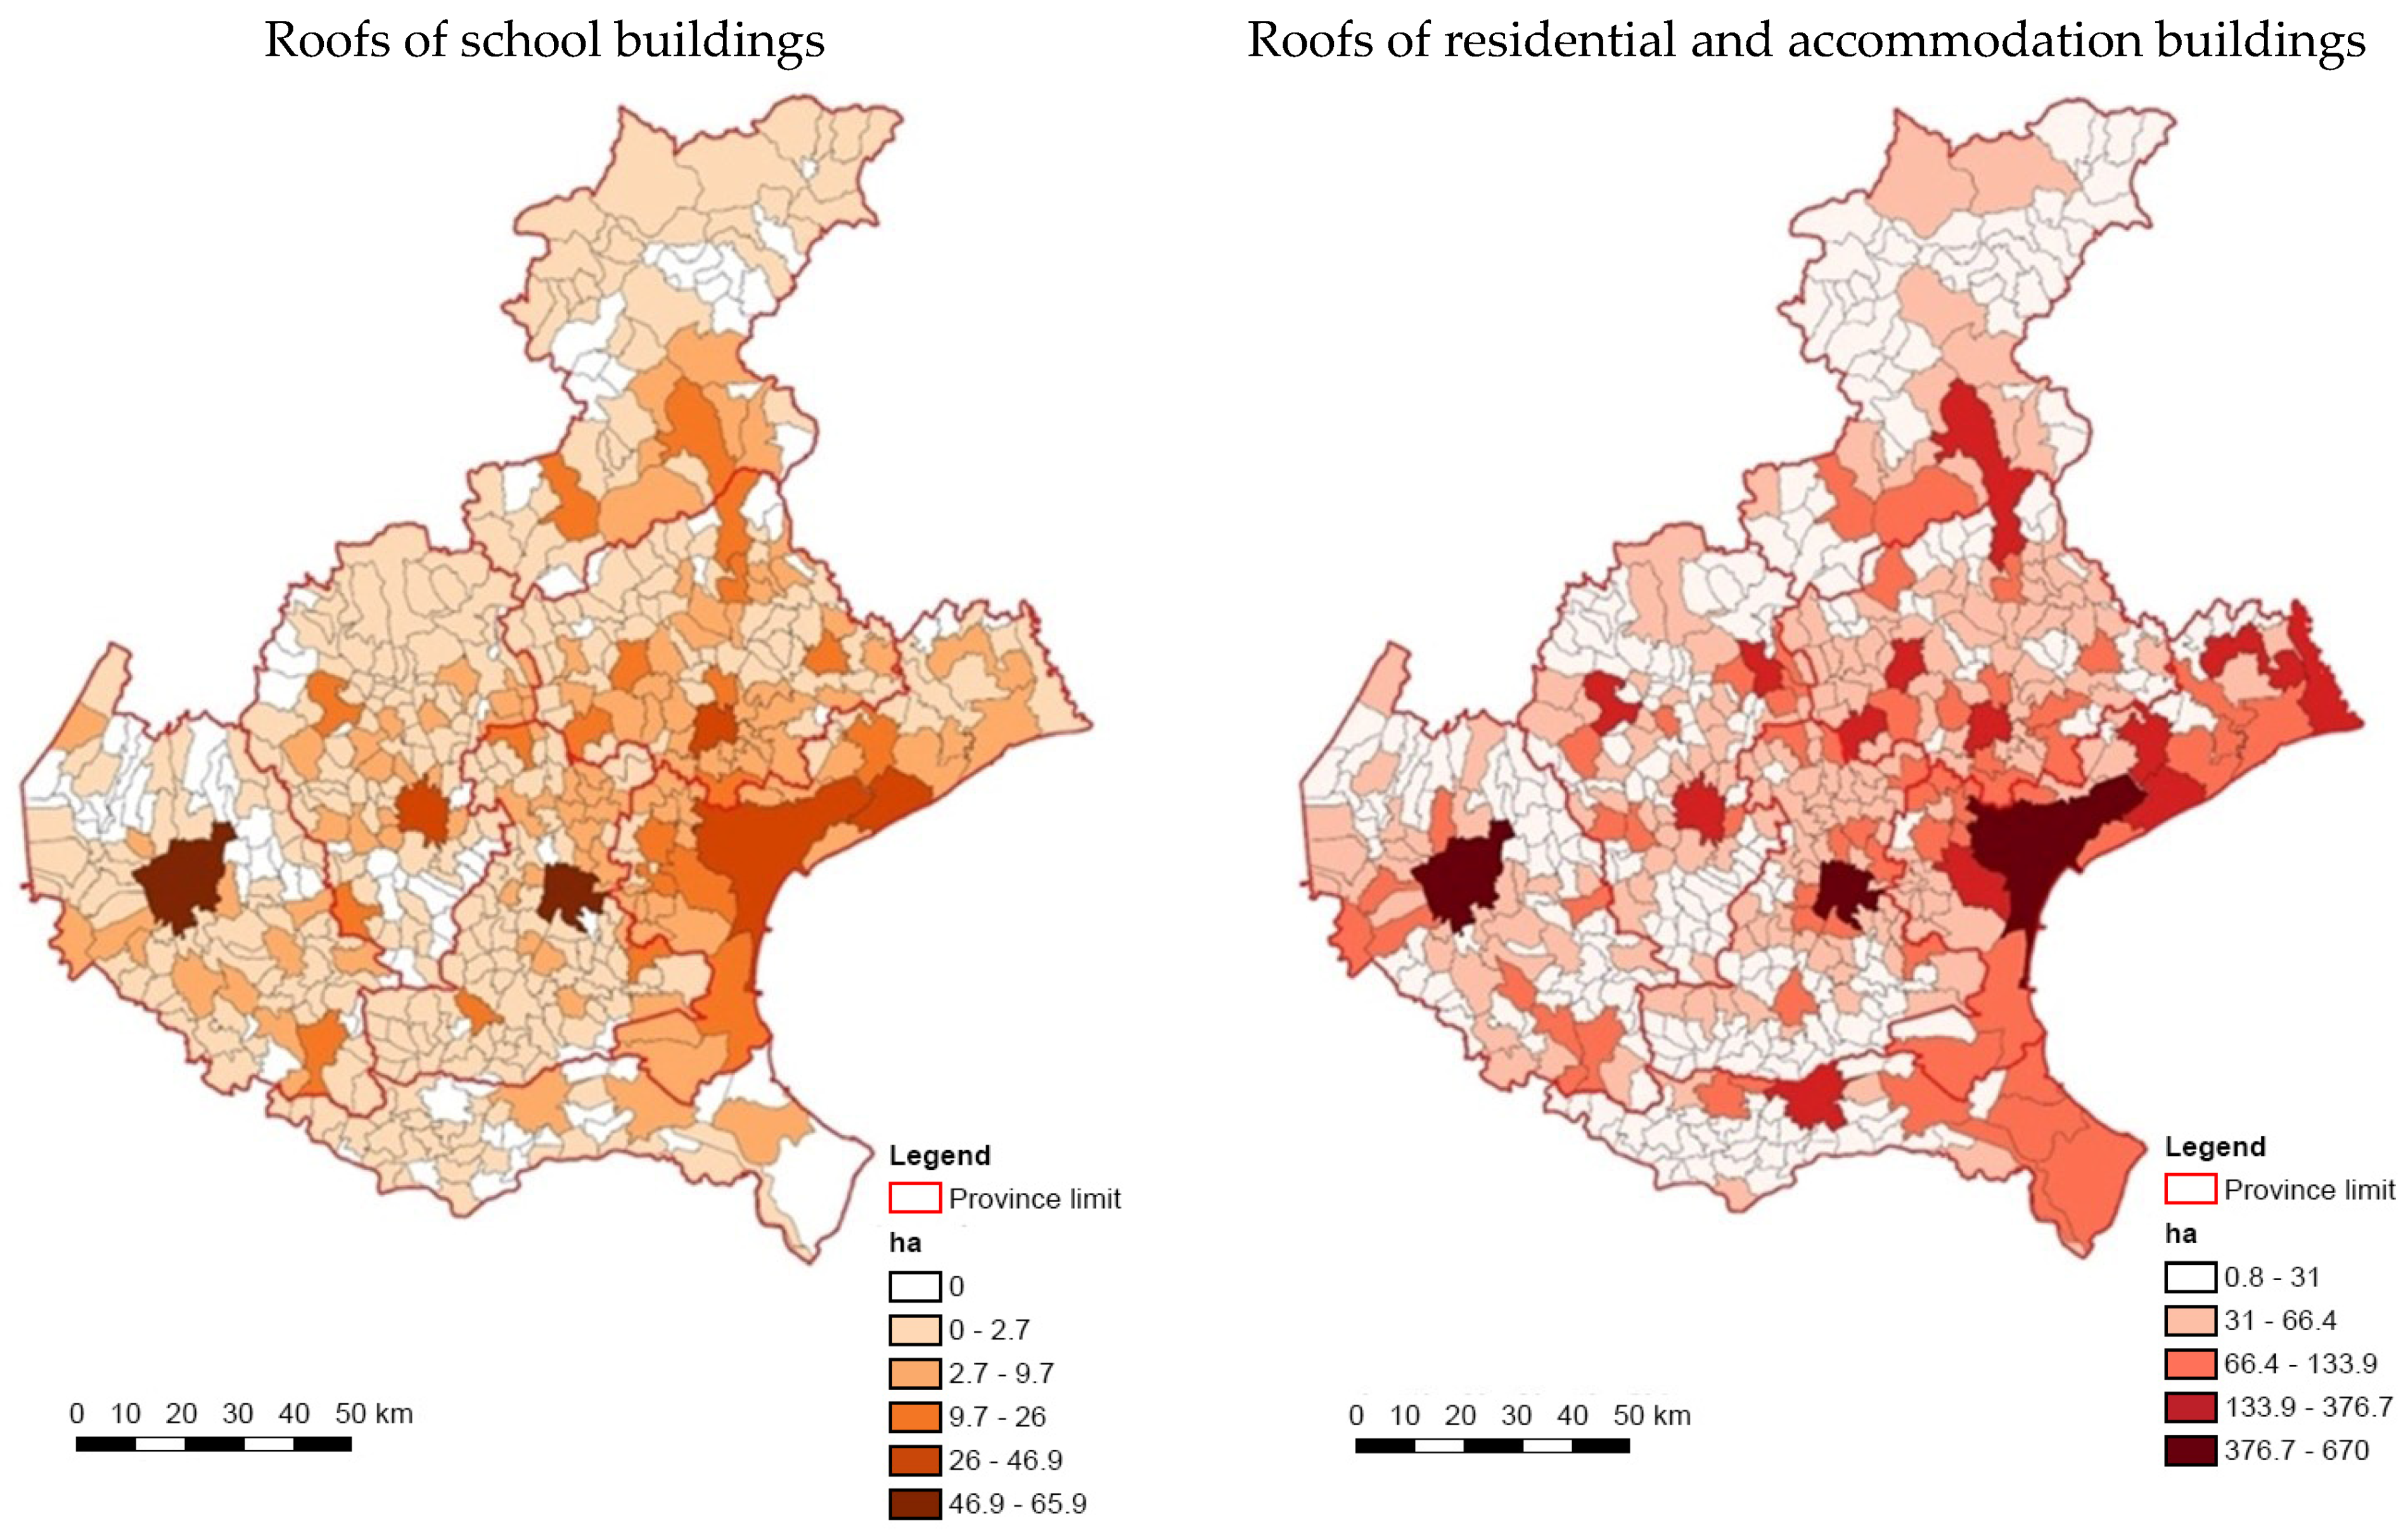
For the quantification of the area available from the roofs of school buildings, all geometries identified as schools for the entire region were downloaded from the open street map portal. This layer was subsequently dissolved and intersected for municipalities to obtain the total area of school buildings per municipality.
For the quantification of the surface area available from the roofs of residential and accommodation buildings (outside historic centres and/or excluding listed buildings), the results were obtained by working by difference, i.e., starting from the general building information layer obtained from Open Street Map, everything that fell within the previous categorisations was removed. This result was further cleaned up by removing all those geometries that were included in the information levels “ville Venete” (villas built in past centuries and protected by legislation) and “centro storico” (historic centres), both of which can be obtained from the geoportal. At the end of this operation, the result was dissolved and intersected for the municipalities of the region to obtain for each municipality the total surface area of residential and accommodation buildings.
The OpenStreetMap software (version 2021), which was used to collect the information for map construction, had a resolution of 5 m per pixel for the Veneto Region.
In order to estimate the roofs’ usability, we adapted the work by Asif [
14] and Aslani and Seipel [
37,
38], who conducted a remote sensing assessment on a set of different contexts (geographically wise) with different architectural types (flat roofs, non-flat roofs, …) and building densities in the urban environment, and estimated the minimum number of roofs usable for PV installation to be around 25% of the total roofs’ surface. For these reasons, only 25% of the total roof surface was considered.
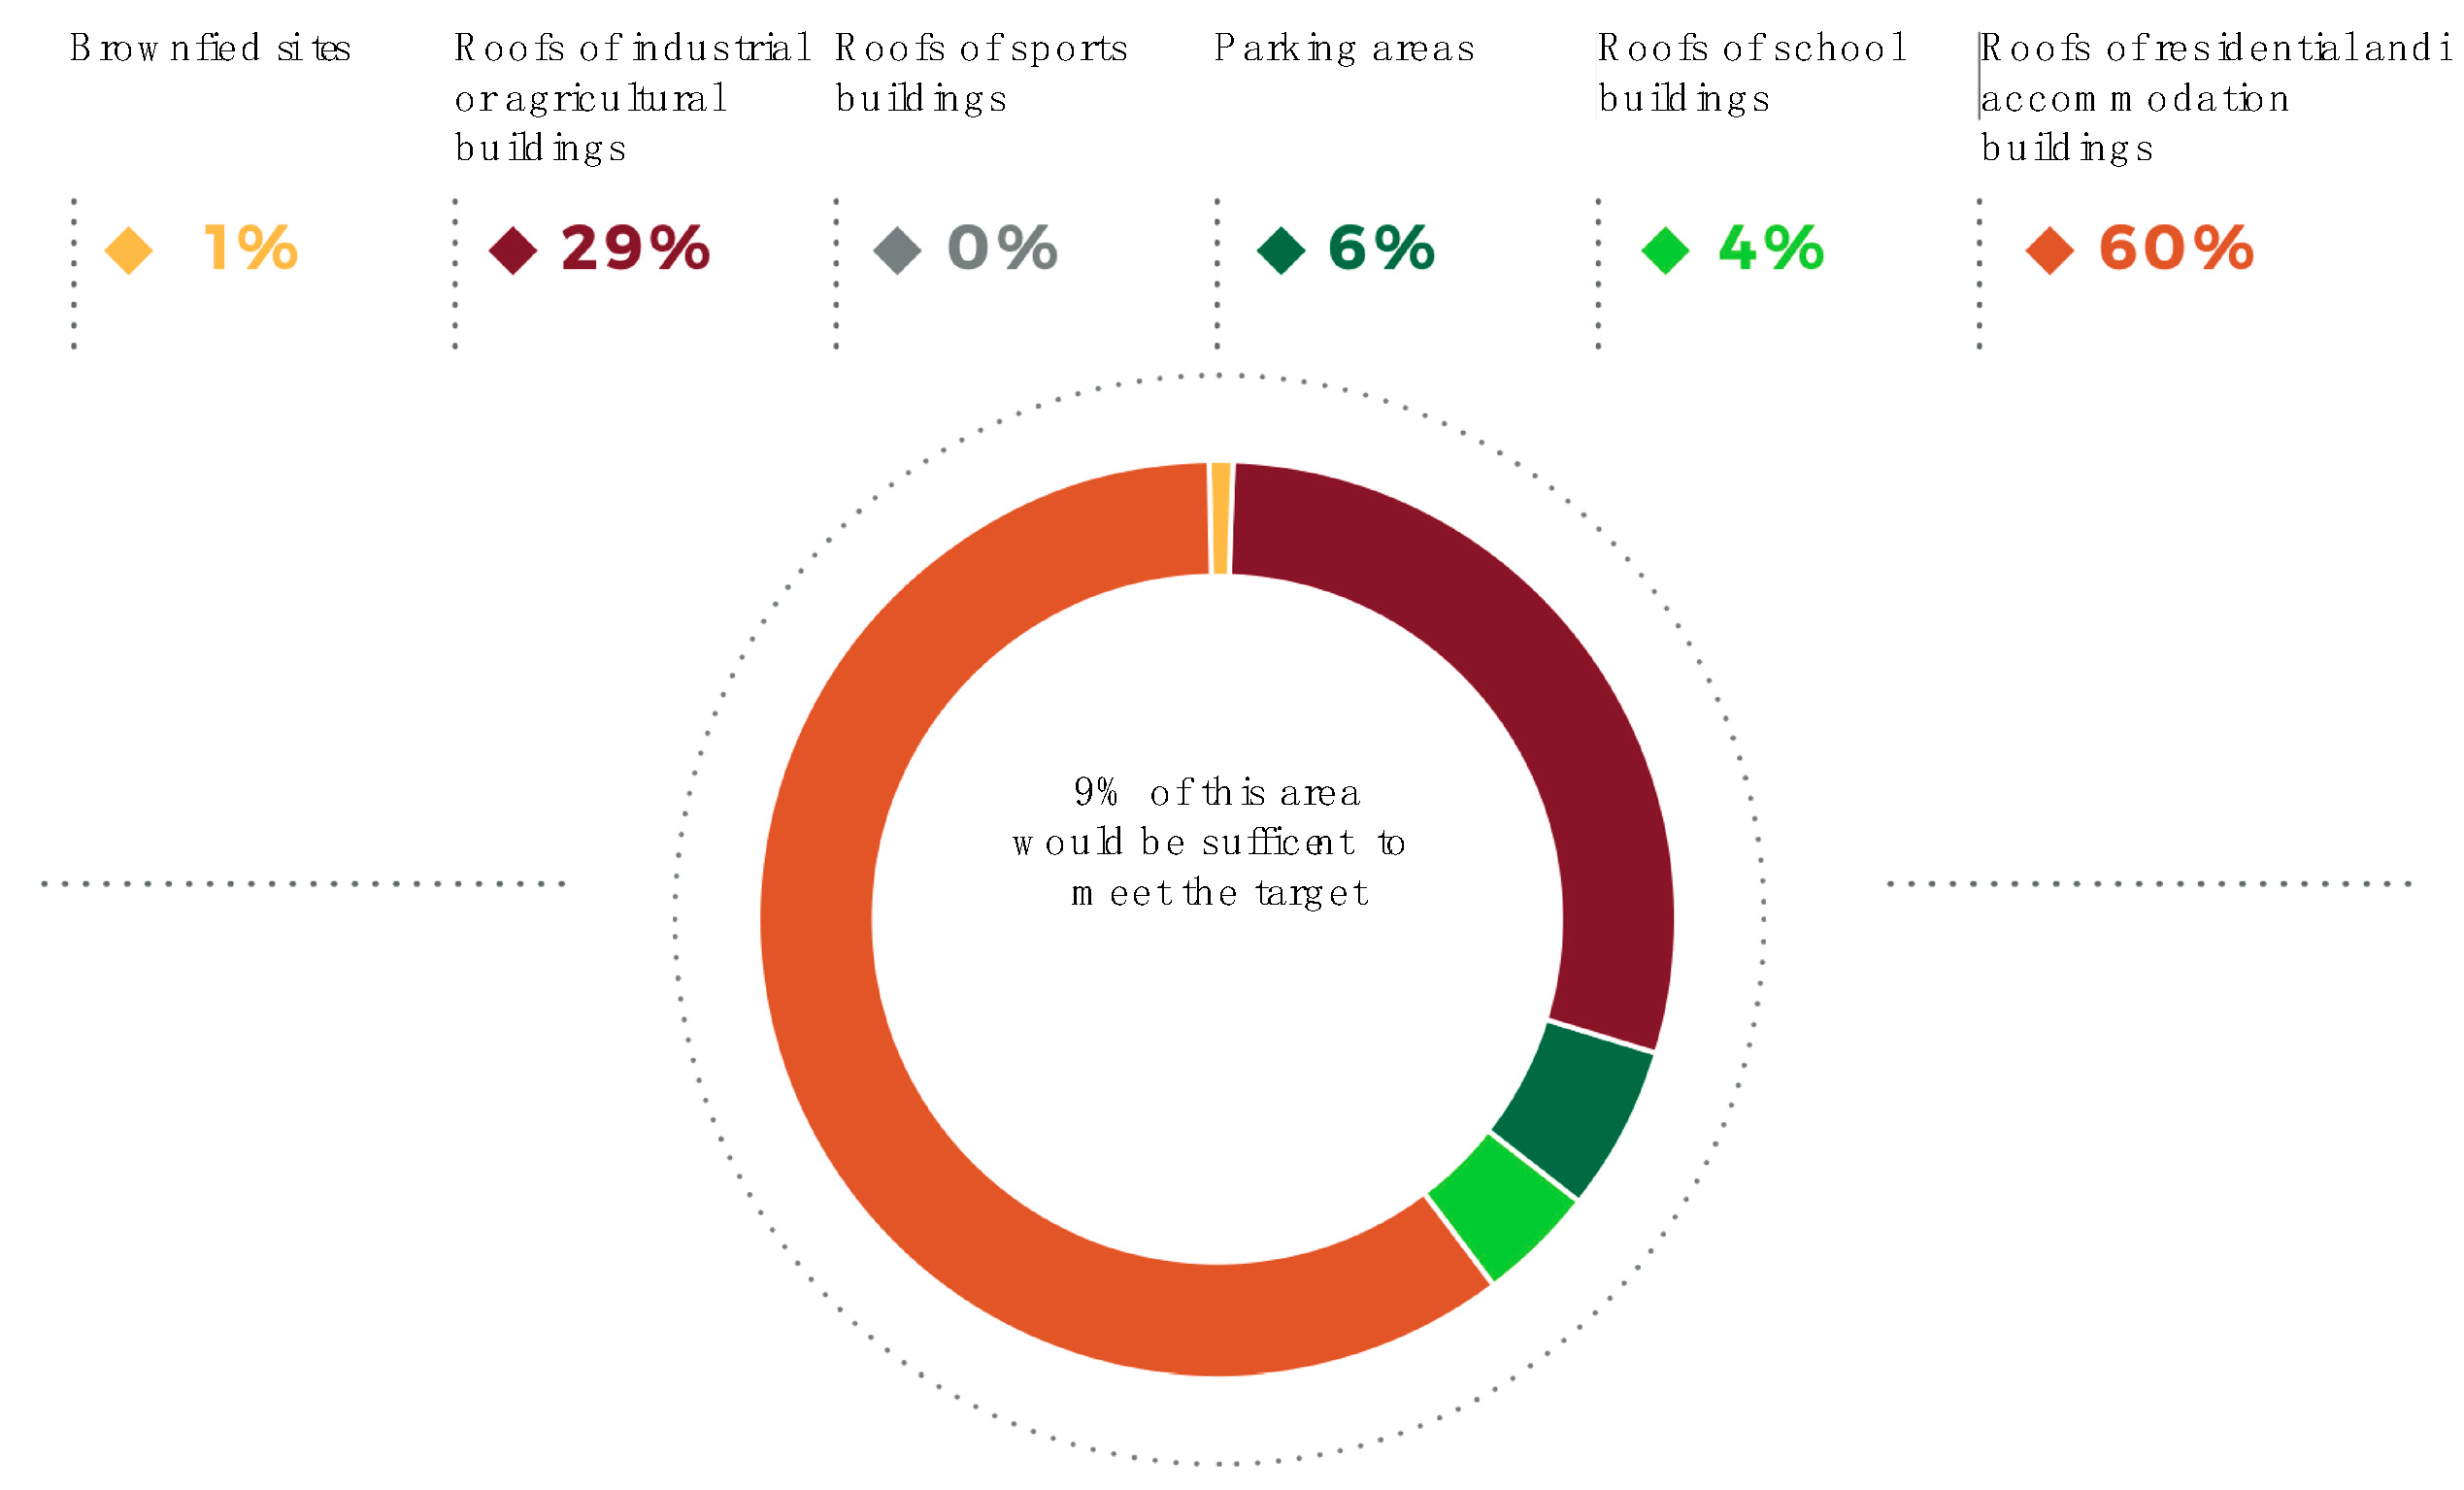
Once we had identified, mapped, and quantified the available surface area in the region for each of the six categories, we divided the available surface area by category in order to understand (i) whether there was enough surface area to potentially produce green energy through solar panels without implying additional land consumption; (ii) if so, we questioned whether one category alone could cover the entire surface area needed, and if so, which categories these were.
5. Discussion
To transform European and national targets into regional strategies and actions, context-based quantification and spatial-explicit tools are urgently needed. This paper provides a first attempt to contextualise the targets and understand their spatial implications for comparing and evaluating possible scenarios. A contextualised quantification of the expected energy consumption covered by green energy production in 2030 is presented. Then, to outline possible scenarios to cover the expected regional (green) energy consumption in 2030, we adopted a geo-spatial approach to identify potentially suitable areas (for the installation of PVs to produce the energy needed to cover the expected electricity consumption). This part of the paper responds to the strong demand that emerged from this research and from the stakeholder’s arena regarding the operationalisation and localisation of possible actions to kick-start the energy transition and is in line with other studies that have proposed a narrative on renewables and the identification of suitable areas to avoid negative impacts from clean energy production [
39,
40]. The method presented is based on readily available data and can be applied to other regions where PV systems could significantly support the local development of regional energy strategies.
The results obtained by applying the method described in
Section 3 have some limitations. Regarding the results presented in
Section 4.1, to obtain the total energy consumption in the region for 2030, we had to project past and present energy consumption and assume linear growth. Most likely, the actual growth does not present a linear trend; however, other works considering the same context [
6] are working with numbers of comparable magnitude, which provide further credibility to the calculated and adopted figures. Furthermore, given the current lack of data, approximate values can help to consider possible scenarios. As soon as new data become available, it will be interesting to integrate them into the reasoning. Another limitation concerns the continuity and efficiency of solar photovoltaic energy production. It is, therefore, necessary to remember that electricity production by photovoltaic solar panels occurs at low voltage and is not continuous over time; the system requires both bringing the voltage up to grid utilisation levels and activating storage systems. Regarding the results presented in
Section 4.2, it is important to emphasise that the mapped and quantified areas do not distinguish where photovoltaic panels are already installed or not due to the lack of available data. Lastly, the results do not include the PV systems already installed. We know from the GSE [
22] that the systems already installed on roofs in Veneto to date correspond to produce 9.8% of the national energy produced by photovoltaics (2214 MW) and that 64% (national average) of the systems are not on the ground but on roofs. With more accurate data, it would be appropriate to subtract from the areas on rooftops with the systems already installed.
More general limitations of the research include the fact that the work focuses on production aspects and does not consider networks, the intermittency of energy supply and storage devices, the consideration of different photovoltaic technologies to evaluate different scenarios for energy production, as well as the economic feasibility and social inclusion of vulnerable groups. In particular, with regard to the intermittent nature of renewable energy, it is recognised that without storage systems or energy carriers such as hydrogen, simple energy production does not guarantee adequate energy supply to our territories. On a different note, the distribution grid also needs to be upgraded to handle any energy peaks due to the intermittent nature of the energy produced through PV systems.
What emerges from a critical reading of the results is that the area required to reach the target is not a problem. The 36 km2 area approximately required is more than available in the region, even without triggering any land consumption or conflict with agricultural production or landscape value. At the regional level, residential roofs offer more than the surface needed to cover the energy demand that could be expected for the future of the region (around 6 times), as well as roofs of agricultural or industrial buildings (around four times).
6. Conclusions
The rise in green energy production from photovoltaics has never attracted as much international interest as it has in recent years. However, to ensure a sustainable transition, PV deployment must be addressed by minimising possible negative impacts on the environment and society, such as further land consumption or competition with food production. To ensure this, planning practice and decision makers need an integrated approach to energy policy design [
24], which is an important current gap. Another gap is the need to address energy policies and plans at the local scale, where there is a lack of capacity in terms of knowledge and tools when it comes to analysing, defining, and quantifying possible alternatives for installing PVs and their impacts on land use, for example [
23,
26]. For this reason, this paper is designed to break the ice or, rather, to build a small bridge between theory and practice and support policymakers in sifting through the first hypotheses that can carry their territories toward an energy transition.
This research work stems from the described science–policy–action gaps and responds to the demand of local decision makers for data, information, and support to think of concrete responses to the transition. More specifically, this work presents an original methodology, which builds on existing scientific knowledge to enable local decision makers to take informed actions for producing PVs toward transition goals while minimising impacts in terms of land consumption and, more broadly, on the environment and society. This is the real novelty of the methodology, which, while original, builds on existing knowledge, bridging scientific knowledge and the needs of energy planning practice at the local level to provide appropriate tools to support informed decision making.
In practical terms, it enables local decision makers to define future electricity demand and the amount of land area needed to meet transition targets through the installation of PV systems. More importantly, through GIS analysis, the methodology allows verification of whether the required electricity can be produced locally without triggering additional land consumption (by mapping and quantifying already available surfaces such as rooftops, parking lots, etc.). In addition, the categorisation of available surfaces (residential roofs, industrial roofs, etc.) provides a potential contribution to energy policy design because it shows viable options and allows decision makers to propose a strategy in an informed way (e.g., knowing that public buildings can meet needs on its own, or by involving specific segments of the private sector, or a combination of the two is needed). This research is designed to take a preliminary step in promoting informed policies and strategies for increasing electricity generated through photovoltaics, including goals and possible areas of solar power generation.
Although the data are context-specific, the methods adopted are replicable in other regional contexts. Moreover, some of the aspects, information, and limitations that emerged are useful for laying the groundwork for fruitful discussion with regional decision makers, planners, and stakeholders, as well as for taking new steps in research.


