Article

The Impact of Environmental Management Capabilities on the Economic Value Added of Industrial Enterprises—Empirical Evidence from China

Department of Environmental Science and Engineering, Fudan University, Shanghai 200438, China
*
Author to whom correspondence should be addressed.
Sustainability 2024, 16(8), 3356; https://doi.org/10.3390/su16083356
Submission received: 5 March 2024 / Revised: 12 April 2024 / Accepted: 14 April 2024 / Published: 17 April 2024

Abstract

:
Under the requirements of carbon peaking and carbon neutrality goals, the value added of Chinese industrial enterprises may face pressure, especially for those with high carbon emissions, where the constraints are more apparent. It is urgent to explore a long-term development path for enterprises to achieve value addition while managing environmental responsibilities effectively. This study conducts an empirical analysis using the unbalanced panel data of 3137 Chinese A-share listed industrial enterprises from 2008 to 2023. It constructs a comprehensive index covering 7 dimensions and 22 indicators to evaluate corporate environmental management capabilities based on three aspects: government policy requirements, corporate management needs, and public social demands. In this study, a dynamic panel differential generalised moment estimation model (dif-GMM) is established to investigate the impact of environmental management capabilities on economic value added. By categorising industrial enterprises into heavily polluting industries and non-heavily polluting industries, the study further investigates the differences in impact. The results show a significant positive correlation between environmental management capabilities and the amount of economic value added, with a stronger correlation for enterprises in heavily polluting industries. The article provides suggestions from government, enterprises, and societal perspectives to promote a virtuous cycle of enhanced environmental management capabilities and value addition, jointly advancing carbon peaking and carbon neutrality goals.

1. Introduction

In the context of carbon peaking and carbon neutrality goals, industrial enterprises, as an important subject of carbon emissions, account for up to 70% of carbon emissions in China, and they are the key to achieving carbon emission reduction. The “double carbon” target requirement may put pressure on their value added, and particularly for the heavily polluting industries, the constraint effect is more obvious. As a rational homo economicus, the fundamental goal of enterprises is to achieve value growth, while the previous environmental management of enterprises focused on the end treatment of pollutants, which would cause an increase in the cost of enterprises and was not conducive to the realisation of their business goals. Under the requirement of the “double carbon” goal, the environmental management of enterprises needs to be upgraded from a single “pollution reduction” to a comprehensive “both pollution reduction and carbon reduction”. Therefore, it is important to explore a long-term development path for enterprises to achieve value growth while improving environmental management capabilities.
This article focuses on Chinese industrial enterprises, conducting empirical research using the unbalanced panel data of 3137 Chinese A-share listed industrial enterprises from 2008 to 2023. Firstly, through literature review methods, we summarise and outline the current standards for assessing a company’s environmental management capabilities and clearly define these capabilities. Secondly, based on the Resource-Based View, we propose several research hypotheses and construct the analytical framework of the article. Lastly, we construct a comprehensive index covering 7 dimensions and 22 indicators to evaluate corporate environmental management capabilities based on three aspects: government policy requirements, corporate management needs, and public social demands. By developing a dynamic panel differential generalised moment estimation model (dif-GMM), this article explores the impact of industrial enterprises’ environmental management capabilities economic value added of industrial enterprises. The conclusions of this article can help enterprises improve their environmental management and provide theoretical support for promoting the achievement of carbon peaking and carbon neutrality goals at the corporate level.

2. Literature Review

2.1. The Meaning and Assessment of Corporate Environmental Management

Environmental management includes the management of the environment itself and the management of development in consideration of the environment [1]. At the enterprise level, environmental management is the management implemented to control the environmental pollution caused by production and operation activities [2], which includes not only the management of pollutant emissions that have a direct impact on the environment, such as waste gas and wastewater disposal, but also the guidance and management of the long-term development of the enterprise with the aim of reducing environmental impact, for instance, the environmental institutional arrangements, and even the construction of the enterprise’s environmental culture.
Chinese scholars mainly evaluate the environmental performance of enterprises from the following perspectives: (1) Pollution emission, such as when Su Danni selected six major pollutants (including chemical oxygen demand, wastewater, exhaust gas, etc.) to construct indicators of the intensity of pollution emissions of enterprises [3]; (2) environmental violations and penalties, for example, Luo Enyi quantified the environmental violations and penalties of enterprises to construct indicators [4]; (3) environmental information disclosure, for example, Deng Li and Cui Cheng used a combination of qualitative and quantitative methods to construct the enterprise environmental information disclosure index [5,6]; (4) environmental taxes and fees, for example, Hu Quying and Zhang Zhaoguo selected the ratio of emission fees to operating revenue as an evaluation indicator [7,8]; (5) environmental certification and verification, for example, Lv Jingye has considered whether the company has passed environmental certification and environmental verification requirements for a comprehensive assessment [9].
The evaluation system constructed by foreign scholars is mainly based on two ideas: one is to directly measure the environmental performance of enterprises, such as the emission of pollutants and wastes, as well as their compliance with laws and regulations. For example, Hamilton, Cohen et al. use data from the US Toxic Release Inventory (TRI) database [10,11], Muhammad uses environmental reports submitted by the companies to the National Pollutant Inventory (NPI) [12], and P.M. Clarkson uses emission data available from the NPI [13]. The second is to refer to the assessment of environmental performance or environmental behaviour by third parties. For example, Filbeck & Gorman use the five main indices to measure environmental performance. These were obtained from the Investor Responsibility Research Center (IRRC)’s 2000 Corporate Environmental Profiles Database (CEPD) [14]. Meanwhile, some studies use ISO 14001 certification of environmental management systems [15,16].
In summary, there are numerous similarities between the measurement indicators used by domestic and foreign scholars in relation to enterprise environmental management. These indicators cover the effectiveness of enterprise environmental management, enterprise environmental management behaviour, third-party certification and verification, and other related aspects. All of the above evaluation perspectives and indicators provide effective references for assessing the environmental management capability of enterprises. Synthesis of existing studies, the indicator system that comprehensively reflects the environmental management capability of enterprises, should include (but should not be limited to) environmental policy implementation, environmental pollution disposal, environmental risk treatment, and environmental information disclosure. It is necessary to consider the purpose of enterprises to conduct environmental management, and to build a comprehensive assessment system that considers different levels, such as the external requirements of the government and the public, and the internal management needs of enterprises [17].

2.2. Economic Value Added

With the advancement of globalisation, the competition has become increasingly fierce. In this escalating competitive environment, those with more capital have more opportunities. However, the biggest characteristic of capital is to pursue profit, which demands continuous value creation from companies. Therefore, to win in the competition, enterprises must continually create value for stakeholders and meet the profit-seeking demands of capital [18].
In 1991, Stern and Stewart introduced the concept of Economic Value Added (EVA). The basic economic principle behind EVA is to calculate the company’s real economic value added, beyond traditional financial profits, by considering the cost of capital (both debt and equity) required to generate those profits [19]. This method measures the value of the enterprise and evaluates the company’s operational performance, marking a shift in financial performance evaluation from a profit-centric to a value-centric approach. This shift could prompt enterprises to gradually move from a profit model to a value model. The concept of EVA was not introduced to precisely measure the indicator of economic value added but to guide enterprises onto a path of continuous value creation for sustainable development through the dynamic observation of the EVA indicator [20]. EVA can more accurately assess operational performance [21,22] and has been widely applied in enterprise management practice. Qiao Hua and Li Hong have confirmed that measuring company performance with EVA is consistent with traditional performance indicators and is scientifically effective [23,24]. Research by Chi Guohua and Liu Fengwei concluded that implementing EVA assessment can enhance corporate value by influencing investment decisions [25] and effectively curbing excessive investment [26].

2.3. The Relationship between Corporate Environmental Performance and Economic Outcomes

There have been a number of studies related to the environmental performance and economic outcomes of firms at home and abroad, with the following three main conclusions.
Firstly, there exists a positive correlation, meaning that good corporate environmental performance can promote better economic outcomes. As Telle and Kjetil have confirmed, enterprise environmental management has a positive impact on economic performance. However, these researchers also indicate that the positive effects may be due to the oversight of unobserved variables such as management or technology [27]. It was found by Glen Dowell and Stuart Hart that a corporation’s adoption of stringent environmental standards is positively correlated with higher market values [28]. Liu Dingli’s empirical research on listed mining companies indicates a significant positive impact of corporate environmental costs on economic outcomes [29]. It was discovered by Sheng Chunguang and Hu Quying that there is a significant positive correlation between the environmental management capabilities of forestry enterprises and their economic outcomes [30], but a diminishing marginal effect exists [7].
Secondly, there exists a negative correlation, as intensified environmental management by enterprises may result in economic losses. For example, Greg Filbeck and Gorman found a negative correlation between the economic outcomes of power companies and more proactive environmental performance [14].
Thirdly, there is a correlation between them. Some studies indicate that the environmental performance of enterprises has a positive effect on economic outcomes in the short term, but the opposite is true in the long term; other scholars have divided environmental management capabilities into two dimensions and discussed their impacts on the economic outcomes of enterprises. For example, Lv Jingye and Han Ke utilise a difference-in-differences (DID) approach to study coal enterprises, concluding that under external strong environmental constraints, short-term environmental management has a positive effect on economic outcomes, whereas it has a negative effect in the long term [9]. Schaltegger and Synnestvedt explore the reasons behind the two perspectives of “positive environmental performance affecting economic outcomes” and “negative environmental performance affecting economic outcomes”, constructing a theoretical framework that integrates both [31]. Zhang Qiang and Ma Yuan divide environmental management into two dimensions: breadth and depth. Their empirical analysis reveals an inverted U-shaped correlation between the former and economic outcomes, while the latter has a positive effect on economic results [32].
In terms of industry classification, many studies have focused on heavily polluting industries. For instance, research by Delmas has shown that proactive environmental strategies can help chemical companies gain a competitive advantage [33]. Tao’s research on enterprises in heavily polluting industries has found a positive correlation between corporate environmental performance and the financial performance of the company in the following year [34]. Fewer studies have examined the service sector [35]. Pereira-Moliner and Gil conducted research on the hotel industry, finding a positive relationship between environmental management and both competitive advantage and operational performance [36,37]. There are also scholars who have investigated the impact of industry characteristics on the correlation between corporate environmental performance and economic outcomes [38].

2.4. The Literature Gap

Existing research primarily has the following deficiencies: First, the assessment indicators for corporate environmental management capabilities are somewhat one-sided, with the concept and definition of corporate environmental management not clearly defined. Most literature evaluates the environmental performance of enterprises from a single perspective, lacking a comprehensive and integrated assessment system for corporate environmental management capabilities. Second, most scholars have studied the relationship between corporate environmental performance and economic outcomes, using measures like the net profit margin of total assets and return on equity to assess economic outcomes, without considering the cost of capital for enterprises, making it difficult to accurately reflect corporate operational performance. Third, the majority of the literature does not categorise the sample firms by industry and does not thoroughly examine industry characteristics.
Based on a review of the existing literature, this paper’s potential marginal contributions and innovations are as follows.
Firstly, we discuss the construction of a comprehensive indicator system for corporate environmental management capabilities. This paper fully considers the stakeholders of enterprises, building a comprehensive environmental management index (EMI) covering 7 dimensions and 22 indicators based on three aspects: government policy requirements, corporate management needs, and public social demands. This can enrich existing literature research to some extent and provides a comprehensive perspective for assessing corporate environmental management capabilities.
Secondly, in a broad sense, this paper belongs to the literature studying the impact of corporate environmental management on financial performance, but in the narrow definition of “performance”, we adopt the EVA that takes into account the cost of capital to evaluate the comprehensive performance of enterprises, which increases the scientific validity and feasibility of the conclusions of this paper.
Thirdly, this paper investigates the industry heterogeneity of environmental management capability on firms’ value-added, and scientifically groups the sample firms into heavily polluting and non-heavily polluting industries based on the Industrial Classification for National Economic Activities (UNSD), and we explore the strength of the relevance of environmental management capability on value added for the two types of firms, respectively.

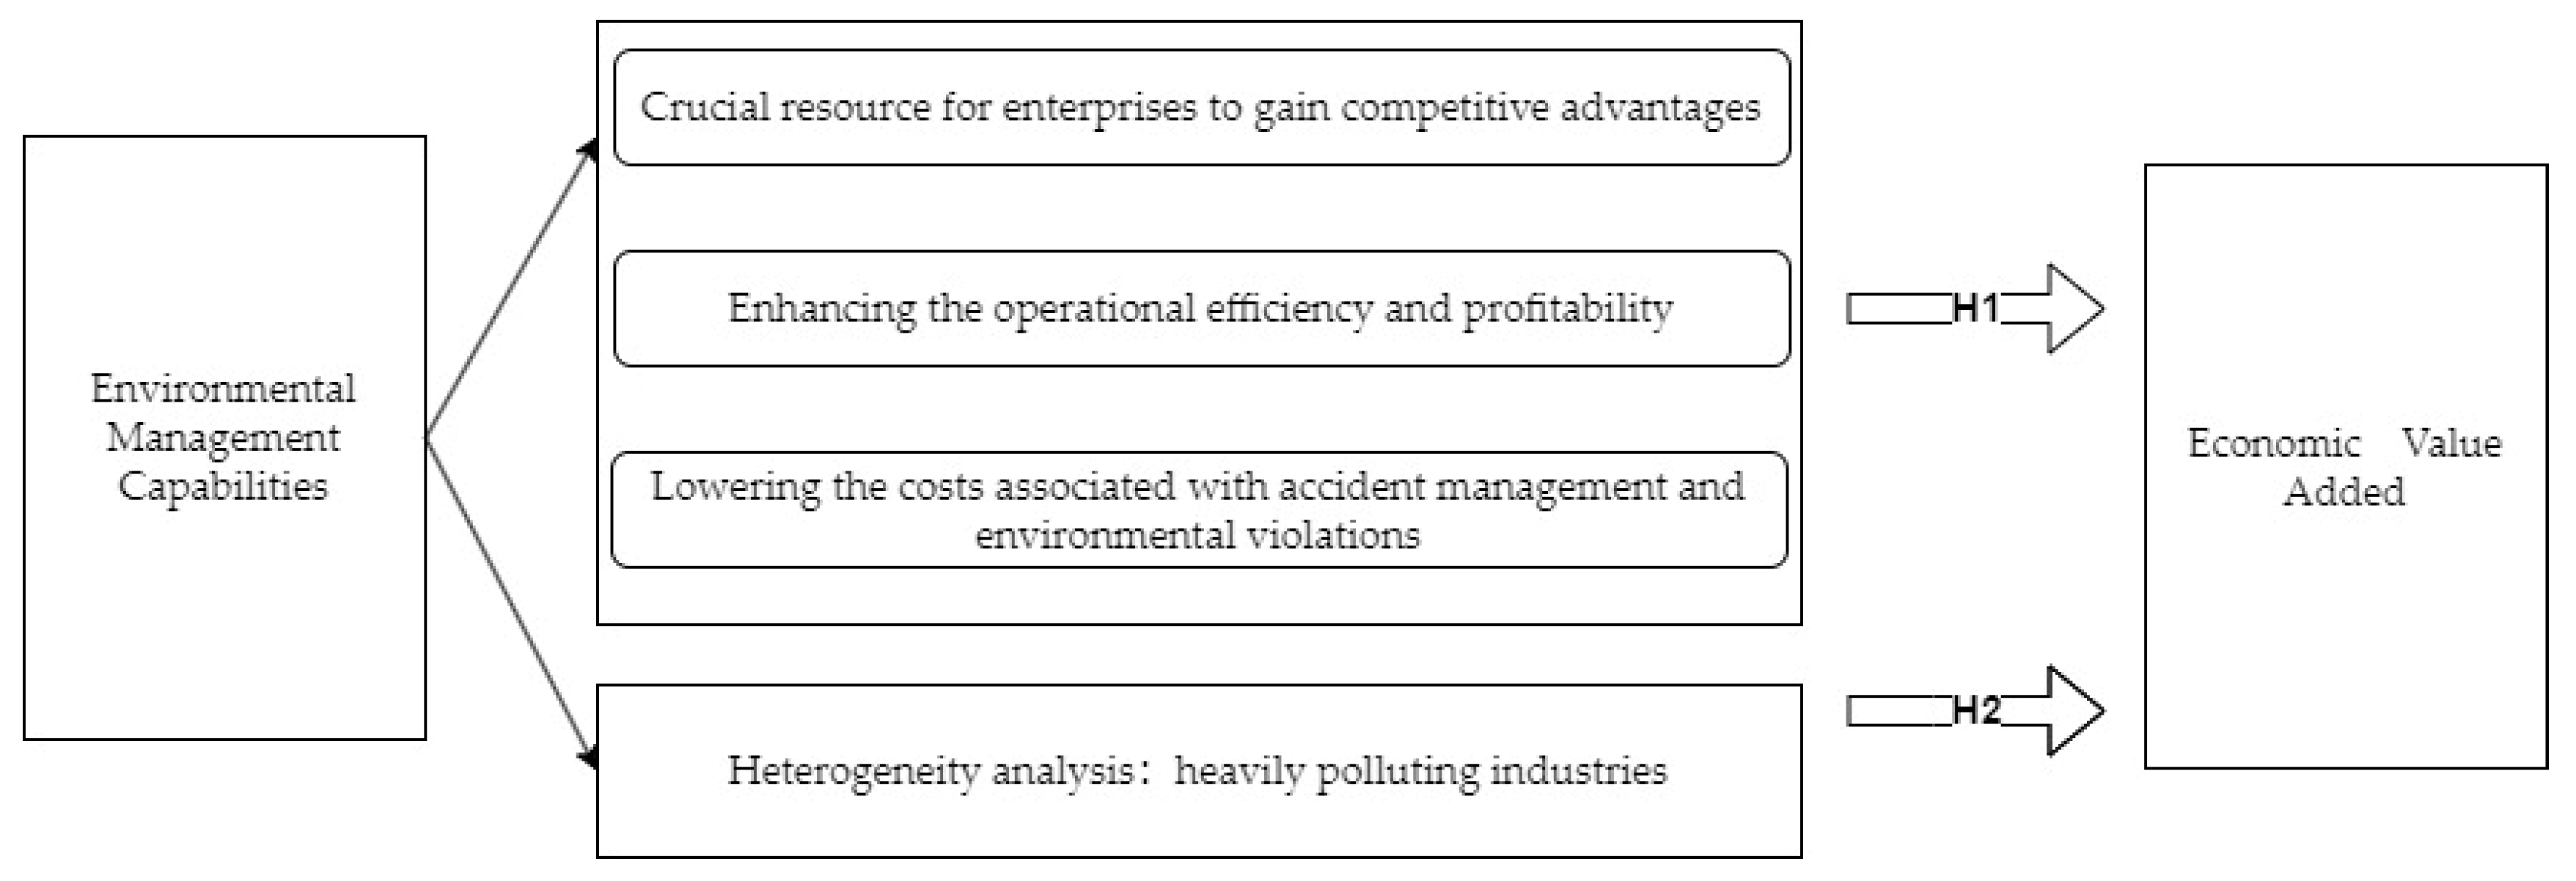
3. Theoretical Framework and Research Hypotheses

In traditional understanding, businesses are viewed as entities aiming to make a profit, with efforts in environmental management often seen as operational costs or even as “wasteful”. Yet, numerous studies have shown that high levels of corporate environmental management frequently correlate with better economic performance. Based on corporate social responsibility theory and social contract theory, corporations should assume responsibilities for environmental protection and sustainable development because ensuring public welfare and reducing environmental pollution are integral components of a firm’s external contracts. In 2002, Account Ability proposed the theory of Responsible Competitiveness, which is expressed as the ability of enterprises to use their professional strengths to solve economic and environmental problems while improving the economic efficiency of enterprises. This theory posits that creating value for society and the environment can improve a firm’s competitiveness [39], enabling it to attain a favourable position in market competition and, consequently, enhance its value. In 2021, Bao Yongjian categorised the dynamic evolution of business models into four types: benefactor, winner, loser, and glutton, proposing that companies can facilitate the dynamic transition of their business models for long-term development by implementing socially beneficial measures within their capabilities and vision.
Firstly, the enhancement of environmental management capabilities is a crucial resource that allows enterprises to gain competitive advantages. Wernerfelt (1984) proposed the Resource-Based View (RBV), stating that enterprises possess various tangible and intangible resources and capabilities, which serve as the sources of sustained competitive advantages. The RBV suggests that enterprises need to cultivate or acquire specific resources that can contribute to their competitive advantages. With the improvement of environmental management capabilities, environmental management technologies, green production methods, and similar practices become vital resources for enterprises to gain competitive advantages [40].
Secondly, the improvement of environmental management capabilities contributes to enhancing the operational efficiency and profitability of enterprises. Research by Xie, J. indicates that the enhancement of environmental management capabilities can improve operational efficiency [41]. Additionally, studies by Ambec suggest that environmental management can stimulate green innovation within enterprises, leading to better resource utilisation and increased profitability [42]. Furthermore, research by Bansal suggests that enterprises with higher environmental management capabilities tend to gain more visibility, media coverage, and public recognition, thereby enhancing their corporate image and facilitating value creation [43].
Thirdly, environmental management practices can effectively reduce the likelihood of environmental accidents, thus lowering the costs associated with accident management and environmental violations [44]. Research by King suggests that strengthening environmental management can significantly reduce the risk of environmental litigation [45].
Industries facing heavy pollution incur higher costs associated with environmental violations and are more prone to environmental incidents. Compared to non-heavily-polluting industries, they are often subjected to stricter environmental regulations and policies. Enterprises in heavily polluting industries are also more likely to attract public attention. Therefore, the impact of enhancing environmental management capabilities on economic value added is more significant for enterprises in heavily polluting industries.
Based on the above theories, this paper proposes the following research hypotheses:
H1: 
Higher environmental management capabilities of enterprises contribute to economic value added. There is a significant positive correlation between environmental management capabilities and economic value added.
H2: 
The correlation between environmental management capabilities and economic value added is stronger for enterprises in heavily polluting industries.
The theoretical framework model is presented in Figure 1.

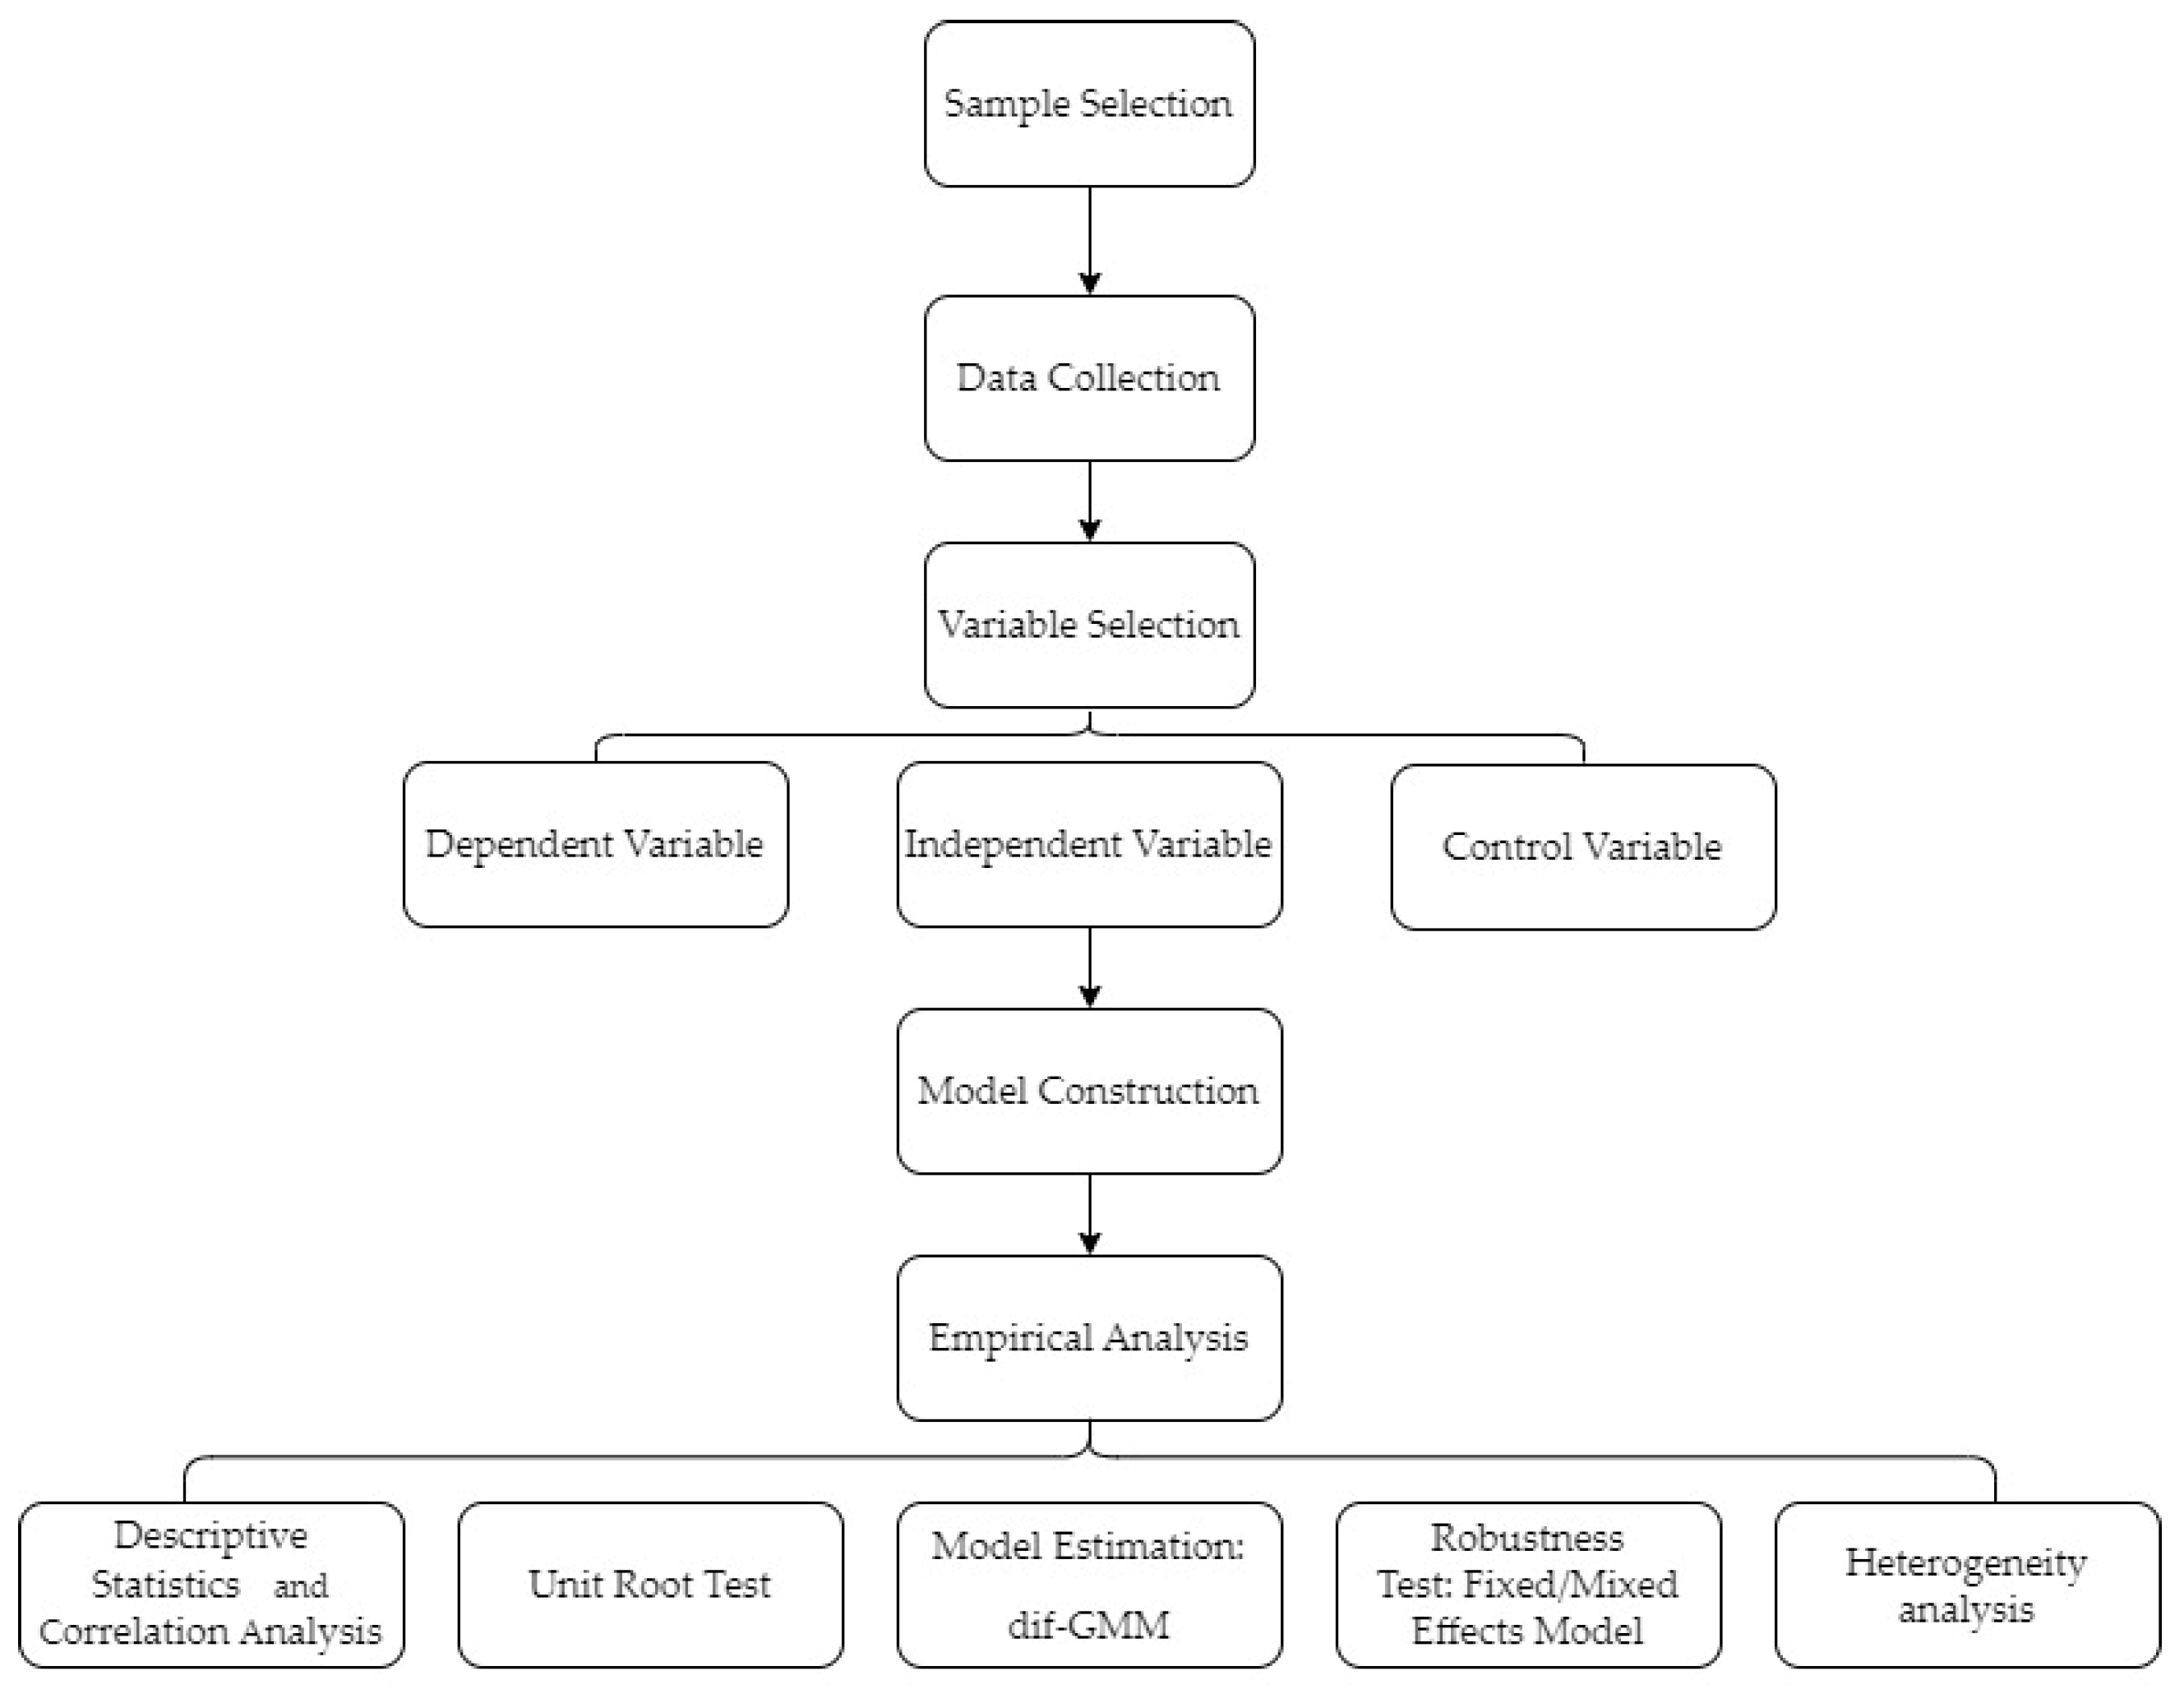
4. Methodology and Research Design

This section is designed according to the order of sample selection and data source, variable selection, model construction, empirical analysis. The detailed process is shown in Figure 2.

4.1. Sample Selection and Data Source

We selected high-carbon industry A-share listed companies from 2008 to 2023 as samples. According to the Industrial Classification for National Economic Activities (UNSD) published by the Ministry of Civil Affairs of the People’s Republic of China, industries include mining; manufacturing; production and supply of electricity, heat, gas, and water, among other industry categories [46]. We screened 39 industries according to their industry codes and obtained 31,843 data of 3137 A-share listed industrial enterprises in the past 16 years.
The data of the article are mainly from the CSMAR database (China Stock Market & Accounting Research Database, CSMAR), annual reports of listed companies, sustainable development reports, as well as ESG governance reports. The data are shown in Table 1.

4.2. Variable Selection

4.2.1. Dependent Variable

We chose Economic Value Added (EVA) as the dependent variable. EVA, by subtracting the cost of capital and converting net profit into a return on net assets, more accurately reflects an enterprise’s ability to create economic value. EVA emphasises long-term value creation and encourages enterprises to engage in long-term strategic planning and continuous innovation. By directly linking the operating performance of the enterprise with shareholder interests, it motivates managers to pursue long-term benefits.
The calculation method of EVA is as follows:
E V A = N O P A T W A C C I C
N O P A T = O P I T + [ I P + A D + D C ] ( 1 25 % ) + I D L I D A
I C = O E + P I A P C D P C + D L D A + S T B + T F L + N C L + L C L + B P + L T P
W A C C = C D C ( 1 25 % ) ( D C / I C ) + C E C ( E C / I C )
The variable symbols and their meanings involved in the above formula are shown in Table 2. In the calculation, the cost of debt capital (CDC) selects the one-year loan interest rate, while the cost of equity capital (CEC) is calculated using the Capital Asset Pricing Model (CAPM). The risk-free rate is based on the one-year deposit interest rate, the risk premium is 4%, and the risk factor is the β value weighted by the market capitalisation for 250 trading days.

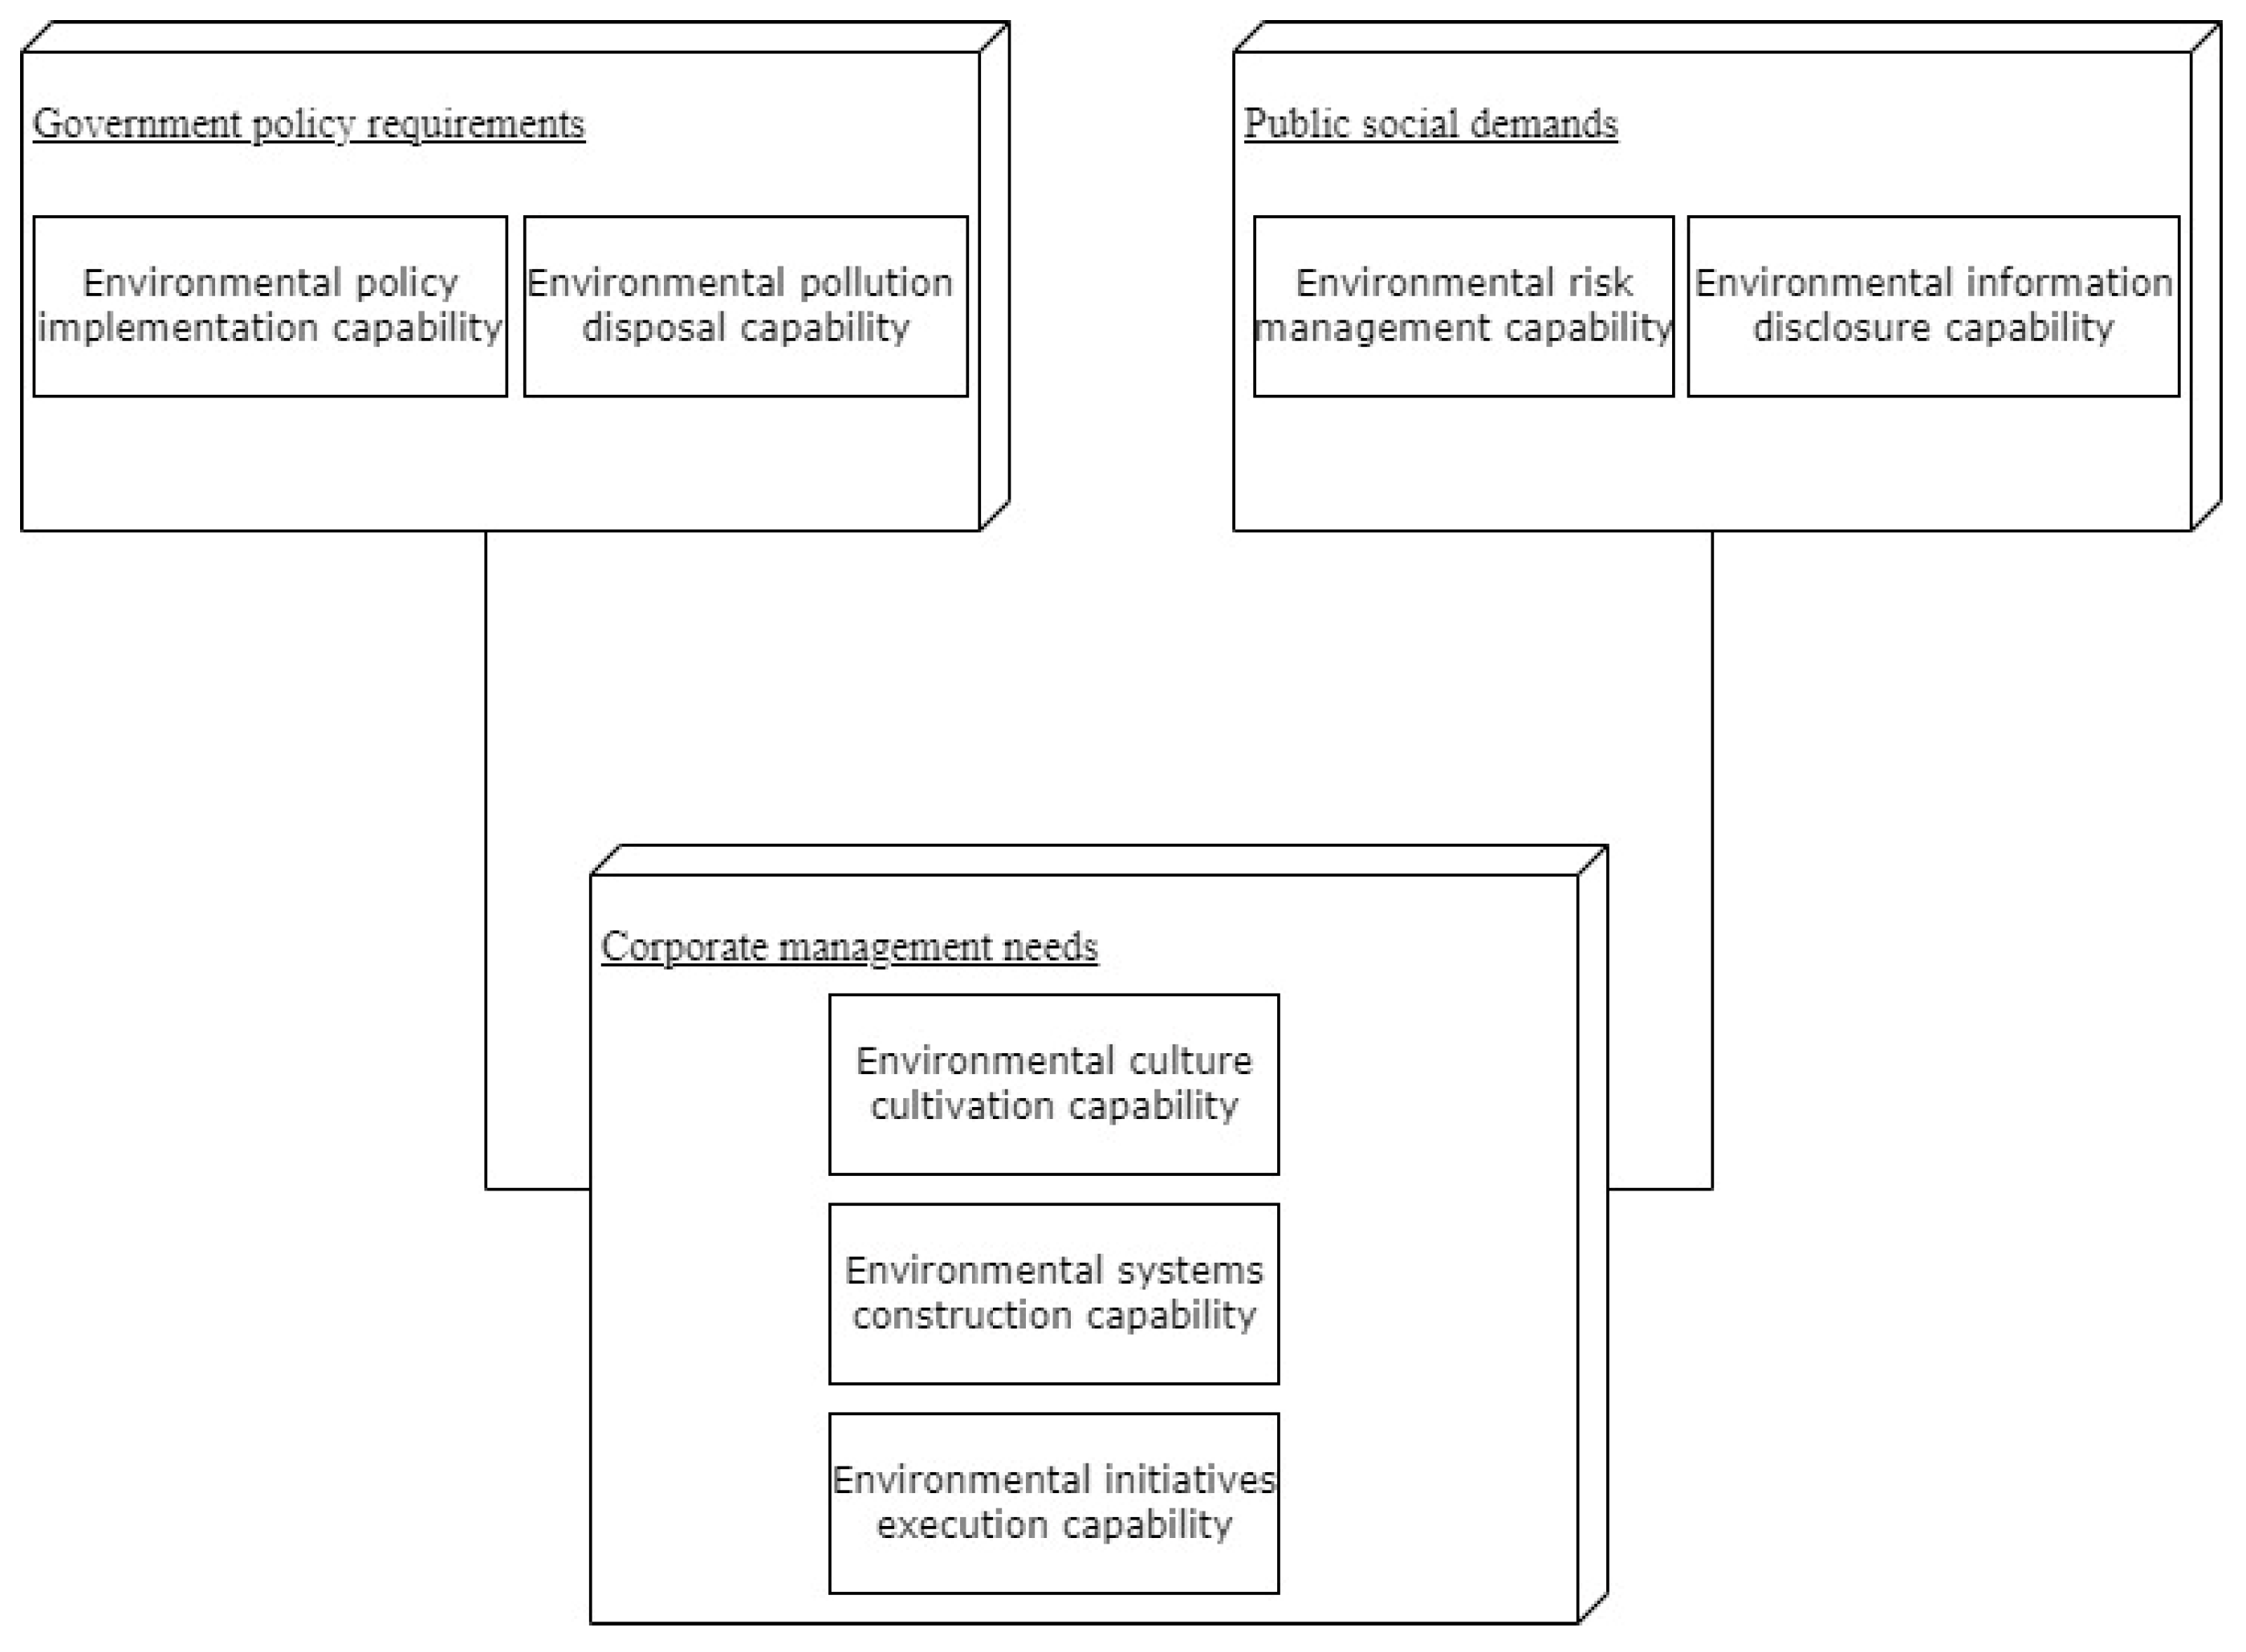
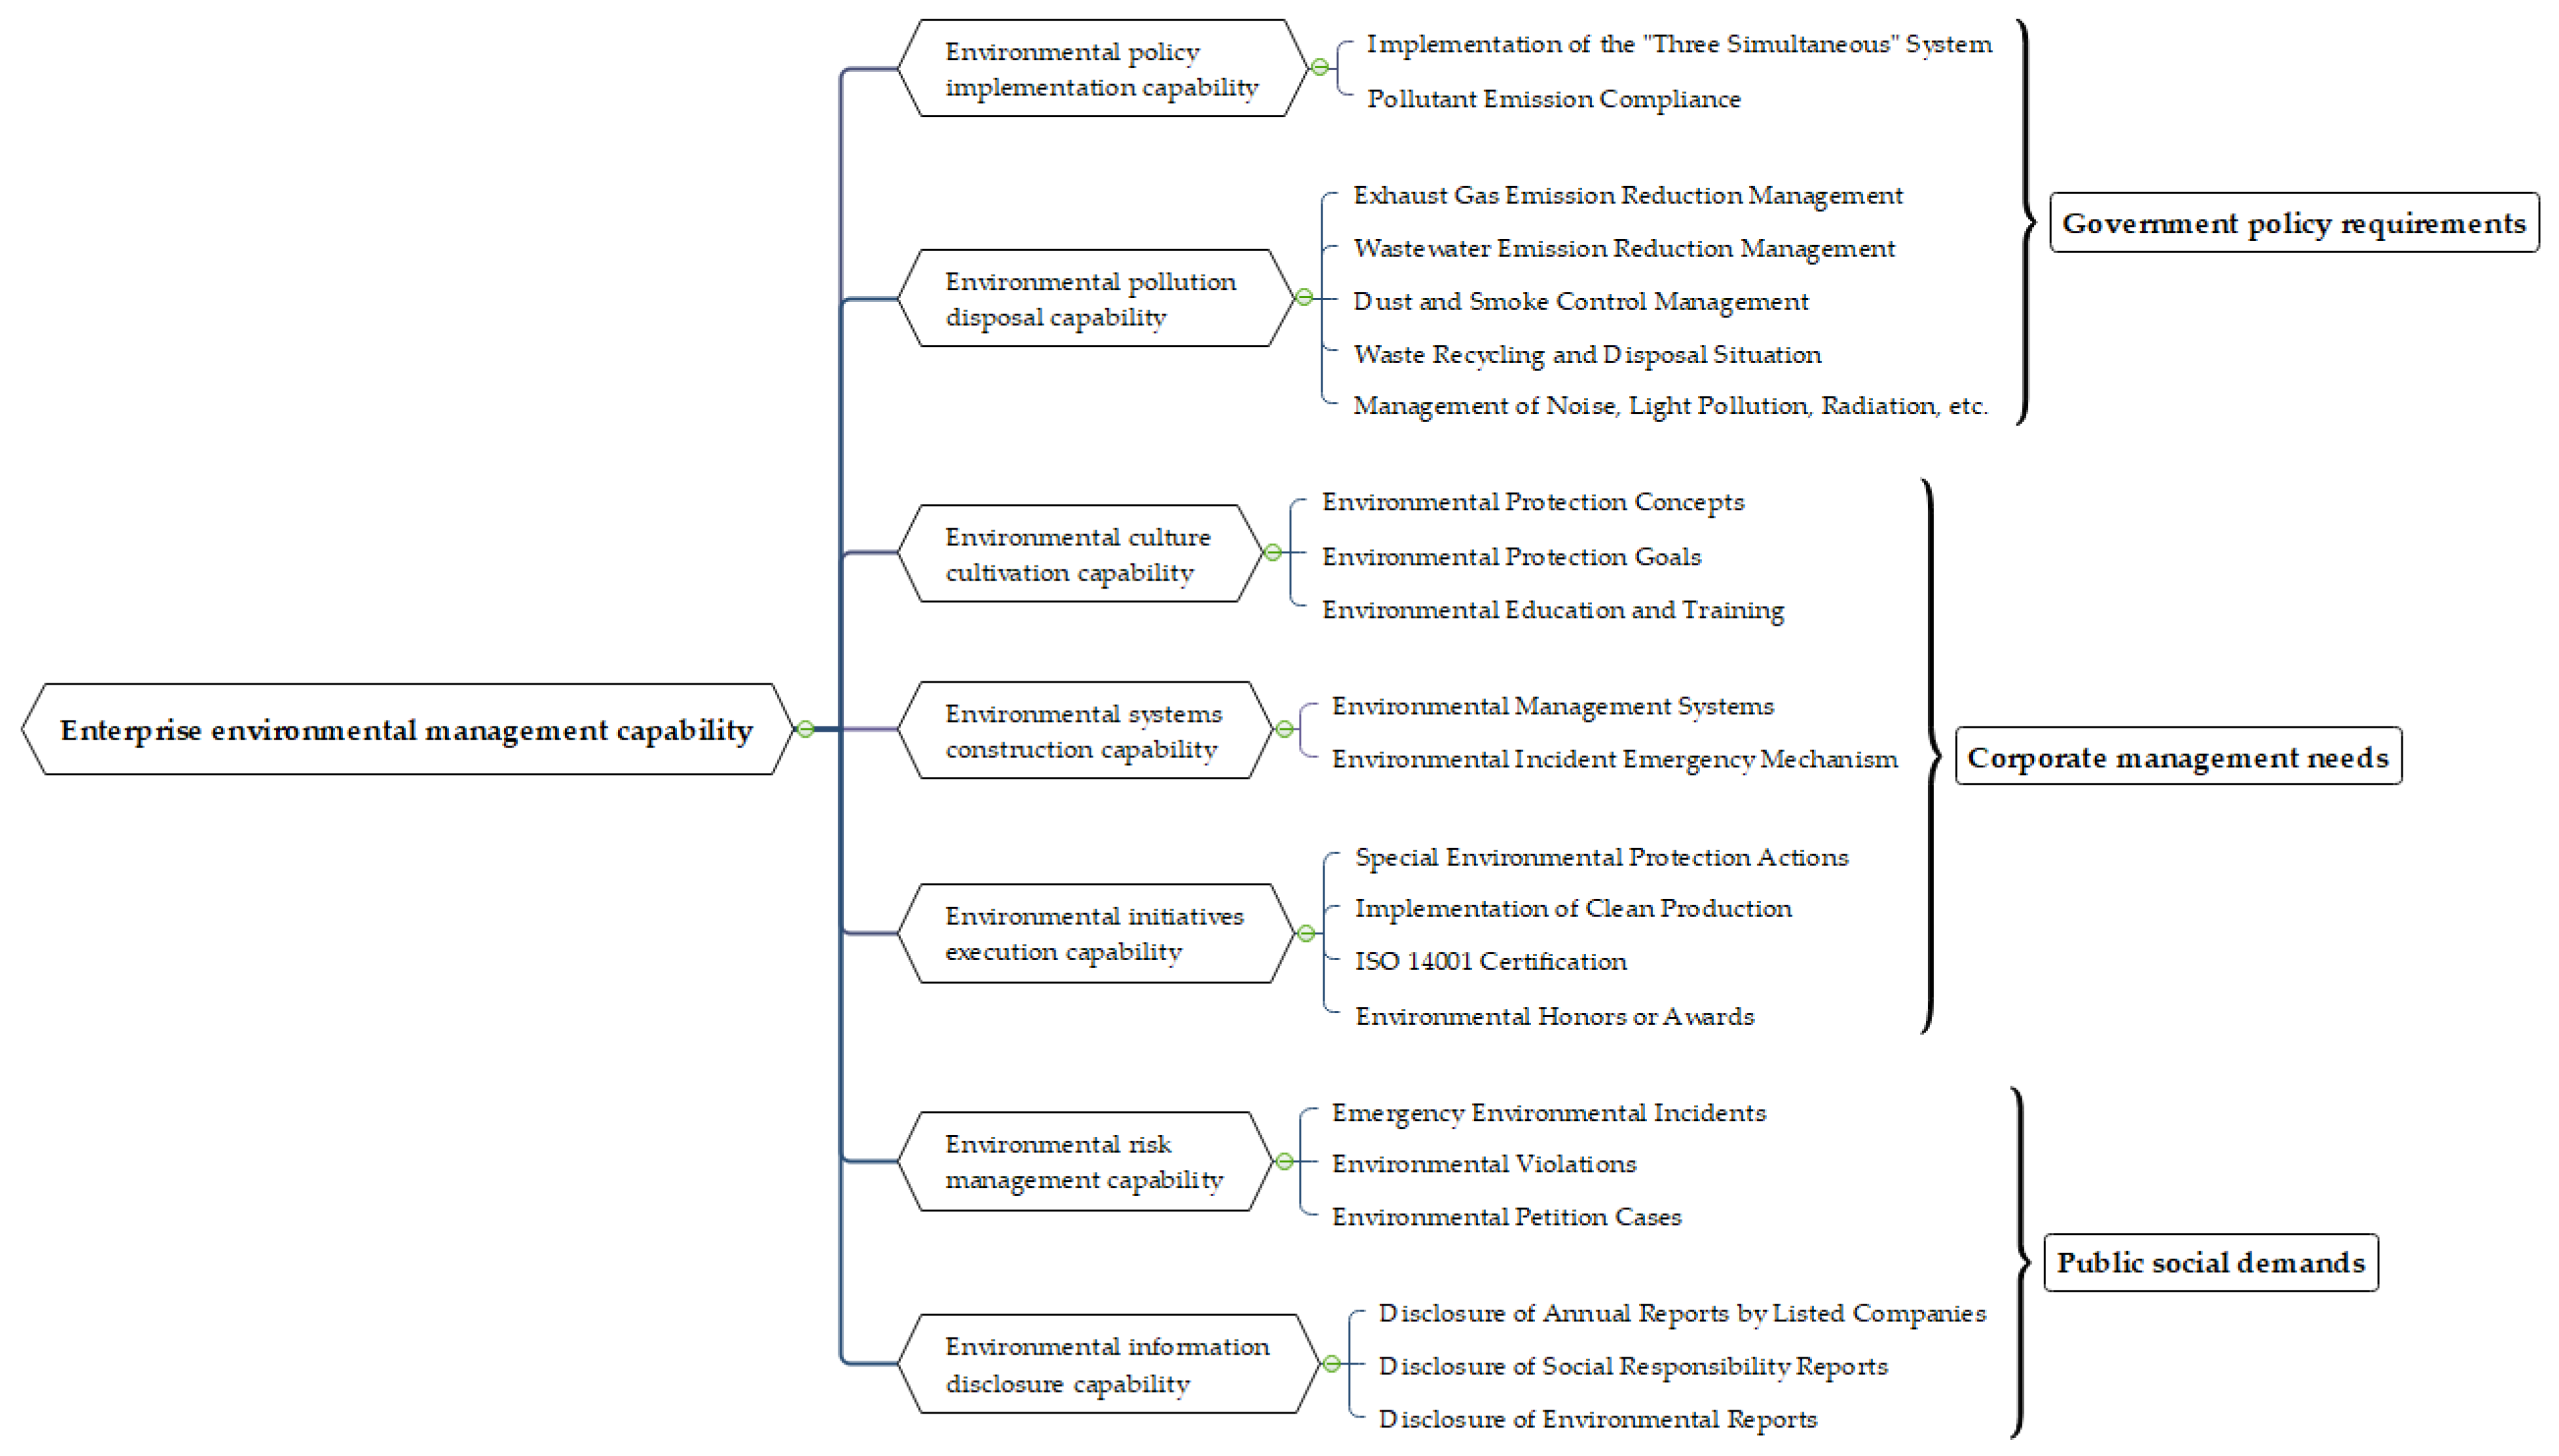
4.2.2. Independent Variable

Traditional corporate environmental management aims at a single “pollution reduction”, focusing only on the final treatment and disposal of pollutants in production to meet emission standards. Under the new context of “double carbon” goals, corporate environmental management needs to be integrated into the entire process and all aspects of production and operations to balance “pollution reduction and carbon reduction” with value added. Therefore, it is necessary to reconstruct the corporate environmental management assessment system: As shown in Figure 3, the objectives of corporate environmental management are to respond to government policy requirements, corporate management needs, and public social demands. Among these, government policy requirements and public social demands provide external motivation for corporate environmental management, while corporate management needs represent the intrinsic motivation. These three objectives are interrelated and, together, contribute to the formation of the seven capabilities of enterprise environmental management.
At the governmental level, the response to government policy requirements is reflected in enterprises’ environmental policy implement capability, including the implementation of systems, standards, and certifications. It is also reflected in the enterprises’ environmental pollution disposal capability as required by the government, which is to assume the responsibility of the polluter of the enterprise, the treatment and disposal of a series of pollutants such as waste gas, wastewater and solid waste in the production process.
At the corporate level, conducting environmental management meets the needs of business management and long-term development, specifically manifesting in three aspects: Firstly, the environmental culture cultivation capability, that is, the enterprise, through the formulation of environmental protection concepts and objectives, carries out the environmental protection education and training of employees to integrate environmental management into the corporate culture. Secondly, the environmental systems construct capability. This means that companies will integrate environmental management into every process and aspect of production and operation through the establishment of an internal environmental system. Thirdly, the environmental initiatives execution capability, that is, companies promoting the effective implementation of environmental management through spontaneous environmental protection special actions, implementation of clean production, completion of ISO 14001 certification, and other initiatives.
At the social level, on one hand, enterprises need to improve their environmental risk management capability to reduce sudden environmental incidents and major environmental risk events, thereby responding to the public’s demands for safe living conditions. On the other hand, enterprises need to enhance their environmental information disclosure capability, systematically and comprehensively revealing environmental information during the production and operation process in annual reports and social responsibility reports, ensuring the public’s right to be informed about environmental information.
Based on the above conceptual definition of enterprise environmental management capability, this article constructs an environmental management index (EMI) from the perspective of corporate stakeholders, based on three aspects: government policy requirements, corporate management needs, and public social demands. As shown in Figure 4, this index includes seven dimensions: environmental policy implementation capability, environmental pollution disposal capability, environmental culture cultivation capability, environmental systems construction capability, environmental initiatives execution capability, environmental risk governance capability, and environmental information disclosure capability, encompassing 22 indicators.
In selecting indicators and determining their weights, we ensured that the number of indicators under each dimension was similar. By collecting and organising disclosure reports from listed companies, we adopted a combined qualitative and quantitative approach to score each indicator, assigning equal weight to each. We fully referenced existing literature on indicator system construction methods [6,9,47], such as in the studies by Li Xiaomei and Li Manman on corporate environmental governance, which constructed an evaluation system of 26 disclosure items from five aspects, including government regulation and pollutant emissions, assigning equal weight to each indicator. By summing all the values, they derived an evaluation value for the company’s environmental governance [48]. Lu constructed a stakeholder-driven three-dimensional social and environmental disclosure index (SEDI), aggregating indicators through a scoring and summing method [49], while Ma Ge and Yang Guangqing adopted a comparable approach of scoring and summing indicators [50,51].
The specific indicators and their value methods are shown in Table 3.

4.2.3. Control Variable

With reference to Hu Quying’s research, we chose operating income growth rate (OIGR) and return on total assets (ROA) as control variables to reflect the development ability and profitability of enterprises, respectively [7]. With reference to Cui Cheng’s research, the natural logarithm (SIZE) of total assets at the end of the year (LEV) and the growth rate of total assets (TAGE) were selected as control variables [6].

4.3. Model Construction

We selected the unbalanced panel data of 3137 Chinese A-share listed industrial enterprises from 2008 to 2023, which belong to short panel data. Considering the time correlation of the dependent variable, they fall into the category of dynamic panel data. Hence, the modelling in this study is conducted using the Difference Generalised Method of Moments (Difference GMM) for dynamic panel data.
Y i t = α 1 Y i , t 1 + β 0 + β 1 E M I i t + β 2 L E V i t + β 3 O I G R i t + β 4 R O A i t + β 5 S I Z E i t + β 6 T A G E i t + ξ i t
Among them, α i and β i represent the coefficients of explanatory variables, ξ i t represents residuals, i indexes different entities, t indexes different years, and t 1 indicates a lag of one period. The variables involved in the GMM model and their meanings are shown in Table 4.

5. Empirical Testing and Result Analysis

5.1. Descriptive Statistics and Correlation Analysis

Table 5 provides descriptive statistics of the data. From the table, it can be observed that the mean of the selected sample enterprises’ EVA is 2.104485, with a maximum value of 1041.038 and a minimum value of −621.3602. The standard deviation is 25.86897, which shows that there is a large gap in the economic value added of the sample firms. The range of EMI is 26 and the standard deviation is 4.818786, indicating that there are large differences in the environmental management capabilities of different enterprises.
The correlation analysis can test the closeness of correlation between two variables. As shown in Table 6, EVA and EMI are significantly correlated and the correlation coefficient between them is positive.

5.2. Unit Root Test

Unit root tests are conducted on the data to verify their stationarity. After normalisation, the Levin–Lin–Chu test (LLC), Im–Pesaran–Shin test (IPS), Fisher-PP test, and Fisher–ADF test are selected to validate the stationarity of the data, ensuring more robust GMM regression results. The null hypothesis of all test methods is a unit root process, with the alternative hypothesis of LLC being sequential stationarity, and the alternative hypothesis of the other three test methods being partial stationarity of the sequence. As shown in Table 7, in the results of the unit root test, except for the IPS test in which SIZE did not reject the null hypothesis, all the other tests rejected the original hypothesis, proving that the overall series of the selected data is smooth, and there is no need to carry out the panel cointegration test, which can be used for GMM regression analysis.

5.3. Model Estimation

We used EVIEWS 10.0 to build a dynamic panel difference generalised moment estimation model (dif-GMM). This model better captures the dynamic adjustment process of the data and is suitable for studying the persistence of economic status. It not only considers the time correlation of the dependent variable by incorporating lagged terms of enterprise value into the equation, but also overcomes issues of variable omission and reverse causality. Moreover, it does not require precise distributional information of the error term and employs instrumental variable methods to address endogeneity problems, allowing for heteroscedasticity and serial correlation in the error term. As a result, it enhances the accuracy of fitting the data.
The estimation results of the model are shown in Table 8.
As can be seen from Table 8, the explanatory variable EMI has a significant effect on the explanatory variables, and its correlation coefficient is about 0.9239, which indicates that there is a significant positive correlation between the environmental management capability and the value of the enterprise, and the higher environmental management capability of the enterprise helps to realise the value added of the enterprise, and there is a significant positive correlation between environmental management capabilities and economic value added, so H1 is validated.

5.4. Robustness Test

To test the robustness of the model by changing the estimation method, we simultaneously model the static panel data and estimate using the fixed-effects model and the mixed-effects model, respectively. The results are presented in Table 9.
As shown in Table 9, the signs of the correlation coefficients of the explanatory variables derived from the dif-GMM, the fixed-effects model, and the mixed-effects model are consistent, and the goodness of fit is good for all of them, indicating that the models are robust.
The presence of serial correlation issues was verified using the Arellano–Bond test. The null hypothesis states that the random disturbance terms of the first-order differenced equation do not exhibit L-order serial correlation. The results are presented in Table 10. The A R ( 1 ) test passed the 5% significance level, indicating the presence of first-order autocorrelation. Thus, the first lagged term of the dependent variable should be included as an explanatory variable. The A R ( 2 ) test did not pass the 5% significance level, indicating the absence of second-order autocorrelation, hence confirming the adequacy of the model specification.
The effectiveness of instrumental variables was verified using the Sargan test to determine if there are overidentifying restrictions in the generalised method of moments (GMM) estimation. The null hypothesis states that the overidentifying restrictions are correct. From Table 8, the p-value of the J-statistic is 0. Rejecting the null hypothesis suggests that the instrumental variables used are valid and the model specification is correct.

5.5. Heterogeneity Analysis

The former Ministry of Environmental Protection issued the “Environmental Protection Inspection Industry Classification Management Directory for Listed Companies” and the “Industry Classification Guide for Listed Companies”, categorising 16 industries, including thermal power, steel, cement, electrolytic aluminium, coal, metallurgy, chemicals, petrochemicals, building materials, papermaking, brewing, pharmaceuticals, fermentation, textiles, leather making, and mining, as heavily polluting industries [46]. Therefore, this paper adopts this standard and classifies the following 18 industries as heavily polluting industries according to the “Industrial Classification for National Economic Activities” (GB/T 4754-2017): industries with codes B06, B07, B08, B09, C15, C17, C19, C22, C25, C26, C27, C28, C29, C30, C31, C32, C33, and D44. The remaining industries are classified as non-heavily polluting [52].
Dynamic panel data models of different generalised methods of moments (GMM) were applied separately to heavily-polluting industries and non-heavily polluting industries, with results shown in Table 11 and Table 12, respectively. It can be concluded that the environmental management capabilities of enterprises in both categories have a significant impact on the value addition of enterprises, with all coefficients being positive. Compared to non-heavily polluting industries, the correlation coefficient for enterprises in heavily polluting industries is higher, indicating a stronger correlation between environmental management capabilities and value addition in heavily polluting industries. Thus, H2 is validated.

6. Conclusions and Recommendations

6.1. Research Conclusions

Using the method of empirical analysis, this paper takes the unbalanced panel data of 3137 Chinese A-share listed industrial enterprises from 2008 to 2023 as samples to study the relationship between enterprise environmental management capabilities on the economic value added of Industrial Enterprises. The research conclusion are as follows:
Firstly, higher environmental management capabilities of enterprises contribute to economic value added. There is a significant positive correlation between environmental management capabilities and economic value added. Hypothesis 1 is validated. Companies can achieve a “win–win” situation between environmental performance and economic performance by improving their environmental management capabilities. This finding is consistent with the findings of Telle and Kjetil [27] and Hu Quying [7] and supports the Resource-Based View.
Analysing the reasons for this result, the improvement of enterprise environmental management capability becomes a resource for enterprises to gain a competitive advantage, which not only helps to improve the efficiency of production and operation of enterprises and enterprise benefits, but also helps to establish a better corporate image, improve the visibility of enterprises, and win the acceptance of the public. At the same time, it can also effectively reduce the likelihood of environmental accidents, and reduce the cost of disposal of accidents and the cost of environmental violation of the law. By contrast, lower environmental management capacity can pose potential risks to the development of the company, resulting in a number of consequences, such as penalties for non-compliance and sudden environmental accidents, as well as damage to the company’s image and efficiency, which will not contribute to the increase in the company’s value and long-term development.
Secondly, the correlation between environmental management capabilities and economic value added is stronger for enterprises in heavily polluting industries. Hypothesis 2 is validated. The article divides the selected industrial firms into two groups: heavily polluting industries and non-heavily polluting industries, and discusses the relationship between environmental management capabilities and value added for each of the two types of firms. We find that the correlation between firms’ environmental management capabilities and value added is stronger in heavily polluting industries. This result is consistent with the findings of M. Delmas [33].
Analysing the reasons for this result, Heavily polluting enterprises will be subject to stricter legal regulations, greater risk of sudden environmental accidents, and higher costs of environmental violations, therefore, heavily polluting enterprises to improve environmental management capabilities can prevent problems before they occur, establish a better corporate image, and contribute to the value of the enterprise value added.

6.2. Recommendations

Based on the research conclusions, the following recommendations are proposed from the perspectives of the government, enterprises, and society.
The government should comprehensively utilise administrative regulation and market approaches to impose environmental constraints and controls on corporate, promoting the green transformation of high-carbon industries through more refined environmental policy design. Firstly, improve the environmental regulatory and certification systems. The government should advance the process of achieving peak carbon and carbon neutrality through the establishment and implementation of systems and standards. Secondly, the implementation of environmental supervision, rewards, and punishment measures should be promoted in corporate settings. The government should encourage and standardise the disclosure of environmental information by enterprises, severely punish those that violate environmental regulations, resolutely eliminate illegal environmental activities, and award honours to corporate that perform well. Thirdly, market-based environmental regulatory tools should be used with greater flexibility. The government should improve the systems for pollution rights trading, carbon emission rights trading, and other green financial systems, and reform and optimise the carbon pricing system and fiscal and tax systems [53], providing external conditions and motivation to carry out environmental management of enterprises.
Enterprises should create a virtuous cycle of carbon emission reduction and value enhancement by cultivating environmental management capabilities, and avoid the short-sighted tendency of pursuing economic goals, especially for heavily polluting enterprises, which should implement environmental management in all aspects and processes of production and operation. Firstly, there is a need to strengthen the understanding and implementation capacity regarding environmental policies, and on this basis, establish the company’s environmental philosophy and objectives, fostering an environmental management culture through education and training and constructing an environmental management system at the corporate level. Secondly, the enterprises should manage and dispose of waste from production to meet standards, voluntarily participate in environmental protection initiatives and other public welfare activities to enhance their corporate image, and at the same time, they should increase investment in research and development of clean production technologies and promote the green transformation of business production methods. Lastly, the enterprises should strengthen environmental risk control, prevent environmental accidents, ensure proper environmental information disclosure, and accept oversight from investors and the general public.
The public should pay attention to the environmental information disclosed by enterprises, maintain sensitivity to environmental risks, and strengthen the role of supervision. Public attention can encourage companies to disclose environmental information in their annual reports and social responsibility reports and can lead them to publish separate environmental reports when conditions are favourable, and to provide good disclosure to the public.

Author Contributions

Conceptualisation, C.B.; methodology: K.F.; writing: K.F. All authors have read and agreed to the published version of the manuscript.

Funding

This research was funded by Shanghai Municipal Bureau of Ecology and Environment (Shanghai Environmental Science and Technology [2023] No. 11).

Institutional Review Board Statement

Not applicable.

Informed Consent Statement

Not applicable.

Data Availability Statement

The datasets used and/or analysed during the current study are available from the corresponding author on reasonable request.

Conflicts of Interest

The authors declare no conflicts of interest.

References

  1. Bao, C.; Wang, J. Environmental Management in China Facing Ecological Civilization: Historical Mission and Academic Discourse. Chin. J. Environ. Manag. 2019, 11, 5–10. [Google Scholar]
  2. Gattiker, T.F.; Carter, C.R. Understanding project champions’ ability to gain intra-organizational commitment for environmental projects. J. Oper. Manag. 2010, 28, 72–85. [Google Scholar] [CrossRef]
  3. Su, D. How Does Global Value Chain Embedding Affect the Environmental Performance of Chinese Firms? Nankai Econ. Stud. 2020, 5, 66–86. [Google Scholar]
  4. Luo, E. Fiscal and tax incentives, green technology innovation and corporate environmental performance. Commun. Financ. Account. 2020, 20, 46–49. [Google Scholar]
  5. Deng, L. Research on Relationship among Environmental Disclosure, Environmental Performance, and Economic Performance. Master’s Thesis, Chongqing University, Chongqing, China, 2007. [Google Scholar]
  6. Cui, C.; Wang, L. An empirical study on the impact of environmental accounting information disclosure quality on enterprise value—A case study of mining listed companies. Res. Financ. Account. 2017, 38, 49–56. [Google Scholar]
  7. Hu, Q. Research on Relationship Between Environmental Performance and Financial Performance of Chinese Listed Companies. China Popul. Resour. Environ. 2012, 22, 23–32. [Google Scholar]
  8. Zhang, Z.; Zhang, C.; Pei, X. Research on Environmental Management System Certification and Corporate Environmental Performance. Chin. J. Manag. 2020, 17, 1043–1051. [Google Scholar]
  9. Lv, J.; Han, K. Impact of environmental performance on financial performance of coal enterprises under strong environmental constraints. Coal Eng. 2020, 52, 188–192. [Google Scholar]
  10. Hamilton, J.T. Pollution as news—Media and stock-market reactions to the toxics release inventory data. J. Environ. Econ. Manag. 1995, 28, 98–113. [Google Scholar] [CrossRef]
  11. Cordeiro, J.J.; Sarkis, J. Environmental proactivism and firm performance: Evidence from security analyst earnings forecasts. Bus. Strategy Environ. 1997, 6, 104–114. [Google Scholar] [CrossRef]
  12. Muhammad, N.; Scrimgeour, F.; Reddy, K.; Abidin, S. The relationship between environmental performance and financial performance in periods of growth and contraction: Evidence from Australian publicly listed companies. J. Clean. Prod. 2015, 102, 324–332. [Google Scholar] [CrossRef]
  13. Clarkson, P.M.; Overell, M.B.; Chapple, L. Environmental Reporting and its Relation to Corporate Environmental Performance. Abacus 2011, 47, 27–60. [Google Scholar] [CrossRef]
  14. Filbeck, G.; Gorman, R.F. The relationship between the environmental and financial performance of public utilities. Environ. Resour. Econ. 2004, 29, 137–157. [Google Scholar] [CrossRef]
  15. Heras-Saizarbitoria, I.; Molina-Azorín, J.F.; Dick, G. ISO 14001 certification and financial performance: Selection-effect versus treatment-effect. J. Clean. Prod. 2011, 19, 1–12. [Google Scholar] [CrossRef]
  16. Cañón-de-Francia, J.; Garcés-Ayerbe, C. ISO 14001 Environmental Certification: A Sign Valued by the Market? Environ. Resour. Econ. 2009, 44, 245–262. [Google Scholar] [CrossRef]
  17. Qiao, Y.; Qiao, P.; Xue, H. Construction of enterprise environmental performance evaluation index system. Financ. Account. Mon. 2006, 11, 19–20. [Google Scholar]
  18. Sun, Z.; Wu, Q. Economic Added Value: Thinking under the high reputation. Account. Res. 2003, 24, 8–14. [Google Scholar]
  19. Tang, H.; Li, X.E. Traditional Accounting Index and Listed Company’s Share Price Performance—A Typical Case Study Based on Kweichow Moutai Company. J. Financ. Dev. Res. 2017, 36, 38–43. [Google Scholar]
  20. Hu, Y. Economic added value: The insight to identify whether an enterprise creates value or destroys value. Financ. Account. 2008, 30, 11–13. [Google Scholar]
  21. Jin, Y. Research on performance evaluation of software industry based on EVA. Bus. Inf. 2021, 39, 7–9. [Google Scholar]
  22. Gao, S.; Wang, J. Research on the effectiveness of EVA in evaluating the performance of pharmaceutical listed companies. Friends Account. 2018, 36, 26–29. [Google Scholar]
  23. Li, H.; Zhang, D.; Cao, X.; Zhang, X. An Empirical Research on the Validity of EVA Performance Evaluation Index-Based on 2004 Data of 454 Listed Companies in SSE. China Soft Sci. 2006, 10, 150–157. [Google Scholar]
  24. Qiao, H.; Zhang, S. The correlation between firm value and economic added value: An empirical study of listed companies in China. J. World Econ. 2001, 24, 42–45. [Google Scholar]
  25. Chi, G.; Wang, Z.; Yang, J. Has EVA Assessment Improved Firm Value?—Empirical Evidence from State-owned Listed Companies of China. Account. Res. 2013, 34, 60–66. [Google Scholar]
  26. Liu, F.; Li, Q. Market Competition, EVA Evaluation and Corporate Over-investment. Account. Res. 2013, 2, 54–62. [Google Scholar]
  27. Telle, K. “It Pays to be Green”—A Premature Conclusion? Environ. Resour. Econ. 2006, 35, 195–220. [Google Scholar] [CrossRef]
  28. Dowell, G.; Hart, S.; Yeung, B. Do Corporate Global Environmental Standards Create or Destroy Market Value? Manag. Sci. 2000, 46, 1059–1074. [Google Scholar] [CrossRef]
  29. Liu, D. Research on the Impact of Environmental Costs on Corporate Performance—Empirical Evidence from the Mining Listed Companies. Master’s Thesis, Anhui University, Hefei, China, 2016. [Google Scholar]
  30. Sheng, C.; Niu, X.; Guan, J. Moderating Effect of Institutional Investors on the Relationship between Environmental Management and Enterprise Performance of Forestry Enterprises. Issues For. Econ. 2021, 41, 1–7. [Google Scholar]
  31. Schaltegger, S.; Synnestvedt, T. The link between ‘green’ and economic success: Environmental management as the crucial trigger between environmental and economic performance. J. Environ. Manag. 2002, 65, 339–346. [Google Scholar]
  32. Zhang, Q.; Ma, Y. The impact of environmental management on firm economic performance: The mediating effect of green innovation and the moderating effect of environmental leadership. J. Clean. Prod. 2021, 292, 126057. [Google Scholar] [CrossRef]
  33. Delmas, M.; Hoffmann, V.H.; Kuss, M. Under the Tip of the Iceberg: Absorptive Capacity, Environmental Strategy, and Competitive Advantage. Bus. Soc. 2011, 50, 116–154. [Google Scholar] [CrossRef]
  34. Tao, P.; Zhang, Q.Y. Study on Relationship between Environmental Performance and Corporate Financial Performance-Based on Listed Companies in Heavy Polluting Industries. In Proceedings of the 2014 International Conference on Management Science & Engineering (ICMSE), Helsinki, Finland, 17–19 August 2014; pp. 1127–1134. [Google Scholar]
  35. Earnhart, D. The Effect of Corporate Environmental Performance on Corporate Financial Performance. Annu. Rev. Resour. Econ. 2018, 10, 425–444. [Google Scholar] [CrossRef]
  36. Pereira-Moliner, J.; Font, X.; Molina-Azorin, J.F.; Tarí, J.J.; Lopez-Gamero, M.D.; Pertusa-Ortega, E.M. The Holy Grail Environmental management, competitive advantage and business performance in the Spanish hotel industry. Int. J. Contemp. Hosp. Manag. 2015, 27, 714–738. [Google Scholar] [CrossRef]
  37. Gil, M.; Jiménez, J.B.; Lorente, J. An analysis of environmental management, organizational context and performance of Spanish hotels. Omega-Int. J. Manag. Sci. 2001, 29, 457–471. [Google Scholar]
  38. Chen, X.L. An empirical study of corporate environmental liability performance, industry characteristics and financial performance. In Proceedings of the 16th International Conference on Service Systems and Service Management (ICSSSM), Shenzhen, China, 13–15 July 2019. [Google Scholar]
  39. Lu, X.; Yin, G. Corporate Responsibility Competitiveness: Disscussing The Theory Deepening And Quantitative Evaluation. China Sustain. Trib. 2017, 16, 56–62. [Google Scholar]
  40. Russo, M.V.; Fouts, P.A. A resource-based perspective on corporate environmental performance and profitability. Acad. Manag. J. 1997, 40, 534–559. [Google Scholar] [CrossRef]
  41. Xie, J.; Nozawa, W.; Yagi, M.; Fujii, H.; Managi, S. Do environmental, social, and governance activities improve corporate financial performance? Bus. Strateg. Environ. 2019, 28, 286–300. [Google Scholar] [CrossRef]
  42. Ambec, S.; Lanoie, P. Does It Pay to Be Green? A Systematic Overview. Acad. Manag. Perspect. 2008, 23, 45–62. [Google Scholar]
  43. Bansal, P. Evolving sustainably: A longitudinal study of corporate sustainable development. Strateg. Manag. J. 2005, 26, 197–218. [Google Scholar] [CrossRef]
  44. Peloza, J. Using corporate social responsibility as insurance for financial performance. Calif. Manag. Rev. 2006, 48, 52. [Google Scholar] [CrossRef]
  45. King, A.A.; Shaver, J.M. Are aliens green? Assessing foreign establishments’ environmental conduct in the United States. Strateg. Manag. J. 2001, 22, 1069–1085. [Google Scholar] [CrossRef]
  46. Wang, L.; Yao, Z.; Li, C. Quasi-natural experimental study on new environmental protection law on the performance of listed industrial enterprise. Ind. Econ. Res. 2021, 20, 115–128. [Google Scholar]
  47. Yao, S.; Pan, X. Research on the Relationship between Environmental Information Disclosure and Corporate Debt Costs—Based on the Data of A-share Listed Companies in China’s Manufacturing Industry. Friends Account. 2018, 36, 68–73. [Google Scholar]
  48. Li, X.; Li, M. Research on Green Investment and Corporate Environmental Governance Under the Target of Carbon Neutrality-Test of Intermediary Effect Based on Technological Innovation. Forum Sci. Technol. China 2022, 38, 118–127. [Google Scholar]
  49. Lu, Y.J.; Abeysekera, I. Stakeholders’ power, corporate characteristics, and social and environmental disclosure: Evidence from China. J. Clean. Prod. 2014, 64, 426–436. [Google Scholar] [CrossRef]
  50. Ma, G.; Zhang, T. Low-carbon policy pilot, green technology innovation and corporate environmental performance. Stat. Decis. 2024, 40, 177–182. [Google Scholar]
  51. Yang, G.; Du, Y.; Liu, Y. Business Performance, Media Attention and Environmental Information Disclosure. Bus. Manag. J. 2020, 42, 55–72. [Google Scholar]
  52. GB/T 4754-2017; Industrial Classification for National Economic Activities. Standardization Administration of China: Beijing, China, 2017.
  53. Deng, H.; Yin, R. Research on the Function and Institutional Construction of China’s Carbon Emissions Trading under the Vision of Carbon Neutrality. North. Leg Sci. 2022, 16, 5–15. [Google Scholar]
Figure 1. Theoretical framework model.
Sustainability 16 03356 g001
Figure 2. Methodology of the study.
Sustainability 16 03356 g002
Figure 3. Enterprise environmental management capability.
Sustainability 16 03356 g003
Figure 4. Environmental management capability index (EMI).
Sustainability 16 03356 g004
Table 1. Industry distribution of sample enterprises.
Industry CodeIndustry NameIndustry CodeIndustry Name
C39Computer, communications and other electronic equipment manufacturing industryC28Chemical fibre manufacturing industry
C26Manufacturing of chemical raw materials and chemical products industryC23Printing and recording media reproduction industry
C38Electrical machinery and equipment manufacturing industryC41Other manufacturing industry
C27Pharmaceutical manufacturing industryC43Metal products, machinery, and equipment repair industry
C35Special equipment manufacturing industryC25Petroleum processing, coking, and nuclear fuel processing industries
C34General equipment manufacturingC21Furniture manufacturing industry
C36Automobile manufacturing industryC42Waste resources comprehensive utilisation industry
C30Non-metallic mineral products industryC24Arts, teaching, art, sports, and entertainment goods manufacturing industry
C22Paper and paper products industryC19Leather, fur, feathers, and their products and footwear industry
C29Rubber and plastic products industryC20Wood processing and wood bamboo rattan palm grass products industry
C32Nonferrous metal smelting and rolling industryB11Mining auxiliary activity industry
C33Metal products industryB09Non-ferrous metal mining industry
C37Railway, Marine, aerospace and other transportation equipment manufacturingB06Coal mining and washing industry
C17Textile industryB07Oil and gas extraction industry
C13Agricultural and sideline food processing industryB08Ferrous metal mining industry
C15Wine, beverage, and refined tea manufacturingB10Non-metallic mining and beneficiation industry
C40Instrumentation manufacturing industryD45Gas production and supply industry
C14Food manufacturing industryD46Water production and supply industry
C31Ferrous metal smelting and rolling industryD44Electricity and heat production and supply industry
C18Textile and garment industry
Table 2. Variable symbols and meanings.
Variable SymbolMeaningSource and Calculation MethodUnit
E V A Economic Value AddedEquation (1)RMB
N O P A T Net Operating Profit After TaxesEquation (2)RMB
W A C C Weighted Average Cost of CapitalEquation (4)1
I C Invested CapitalEquation (3)RMB
O R Operating RevenueCompiled from annual reports disclosed by listed mining companiesRMB
O P Operating ProfitRMB
I T Income Tax ExpenseRMB
I P Interest ExpenseRMB
A D Impairment Loss on AssetsRMB
D C Development ExpenditureRMB
D L Deferred Income Tax LiabilitiesRMB
D A Deferred Income Tax AssetsRMB
I D L Increase in Deferred Income Tax LiabilitiesRMB
I D A Increase in Deferred Income Tax AssetsRMB
P I A Allowance for Asset ImpairmentRMB
S T B Short-term BorrowingsRMB
O E Total Owners’ EquityRMB
P C Construction in ProgressRMB
P C D Impairment Provision for Construction in ProgressRMB
T F L Trading Financial LiabilitiesRMB
N C L Current Maturities of Non-current LiabilitiesRMB
L T L Long-term BorrowingsRMB
B P Bonds PayableRMB
L T P Long-term PayablesRMB
D C Debt CapitalRMB
E C Equity CapitalRMB
C D C Cost of Bond CapitalOne-year loan interest rateRMB
C E C Cost of Equity CapitalBased on the capital asset pricing modelRMB
Table 3. Environmental management index (EMI) indicators and valuation methodology.
IndicatorMethod of Valuation
Implementation of the “Three Simultaneous” SystemDisclose the company’s implementation of the “Three Simultaneities” system. Assign 1 if applicable; otherwise, assign 0.
Pollutant Emission ComplianceAssign 1 if pollutant emissions meet standards; otherwise, assign 0.
Exhaust Gas Emission Reduction Management0 = No description; 1 = qualitative description; 2 = quantitative description.
Wastewater Emission Reduction Management
Dust and Smoke Control Management
Waste Recycling and Disposal Situation
Management of Noise, Light Pollution, Radiation, etc.
Environmental Protection ConceptsDisclose the company’s environmental concepts, environmental policies, environmental management organisational structure, development models for circular economy, and green development initiatives. Assign 1 if applicable; otherwise, assign 0.
Environmental Protection GoalsDisclose the company’s past environmental goal achievements and future environmental goals. Assign 1 if applicable; otherwise, assign 0.
Environmental Education and TrainingDisclose the company’s participation in environmental education and training. Assign 1 if applicable; otherwise, assign 0.
Environmental Management SystemsDisclose the series of management systems established by the company, including relevant environmental management systems, frameworks, regulations, and responsibilities. Assign 1 if applicable; otherwise, assign 0.
Environmental Incident Emergency MechanismDisclose the establishment of emergency mechanisms for significant environmental incidents by the company, including emergency measures taken and the treatment of pollutants. Assign 1 if applicable; otherwise, assign 0.
Special Environmental Protection ActionsDisclose the company’s participation in special environmental activities and other social welfare activities related to environmental protection. Assign 1 if applicable; otherwise, assign 0.
Implementation of Clean Production0 = No Description; 1 = Qualitative Description; 2 = Quantitative Description.
ISO 14001 CertificationAssign 1 if certified; otherwise, assign 0.
Environmental Honors or AwardsDisclose the honours or awards received by the company in environmental protection. Assign 1 if applicable; otherwise, assign 0.
Emergency Environmental IncidentsAssign 0 if such events exist; otherwise, assign 1.
Environmental Violations
Environmental Petition Cases
Disclosure of Annual Reports by Listed CompaniesIndicate whether environment-related information is disclosed. 1 = Yes; 0 = No.
Disclosure of Social Responsibility Reports
Disclosure of Environmental ReportsIndicate whether the listed company separately discloses an environmental report. 1 = Yes; 0 = No.
Table 4. Symbols and meanings of variables in GMM models.
Variable PropertiesVariable SymbolMeaning
Explained Variables Y i t The economic value-added (EVA) of the i listed company in the t year
Explanatory Variables E M I i t The environmental management capability index (EMI) of the i listed company in the t year.
Control Variables L E V i t The debt-to-net-worth ratio of the i listed company in the t year
O I G R i t The operating income growth rate of the i listed company in the t year.
R O A i t The increase rate of main business revenue of the i listed company in the t year
S I Z E i t The natural logarithm of total assets at the end of the year of the i listed company in the t year
T A G E i t The total assets growth rate of the i listed company in the t year
Table 5. Descriptive statistics.
VariableNMaximumMinimumMeanStd. Dev.
Y i t 31,8431041.038−621.36022.10448525.86897
E M I i t 31,84328.000002.0000009.1907484.818786
L E V i t 31,843178.3455−0.1946980.4384911.298748
O I G R i t 31,843944.0996−1.0000000.4194298.881446
R O A i t 31,843108.3657−51.297760.0342970.791679
S I Z E i t 31,84328.6364913.0759721.994641.301169
T A G E i t 31,84345.46043−1.0000000.2230740.723578
Table 6. Correlation analysis.
Covariance
Probability
EVAEMILEVOIGRROASIZETAGE
EVA1
-----
EMI0.1313121
0-----
LEV−0.008508−0.0006741
0.12910.9044-----
OIGR0.002915−0.0144240.0021041
0.60310.01010.7074-----
ROA0.0262630.009094−0.3328640.0024151
00.104800.6666-----
SIZE0.2573310.47155−0.0061640.006650.0114141
000.27160.23550.0418-----
TAGE0.014093−0.063764−0.0360460.069940.028016−0.0213171
0.011900000.0001-----
Table 7. Unit root test results.
Variable L L C I P S Fisher - A D F Fisher - P P
Y i t 0.00000.00000.00000.0000
E M I i t 0.00000.00000.00000.0000
L E V i t 0.00000.00000.00000.0000
O I G R i t 0.00000.00000.00000.0000
R O A i t 0.00000.00000.00000.0000
S I Z E i t 0.00000.6547 ***0.00010.0000
T A G E i t 0.00000.00000.00000.0000
Note: *** represents acceptance of the null hypothesis.
Table 8. GMM model estimation results.
VariableCoefficientStd. Errort-StatisticProb.
Y i , t 1 0.3348290.000724462.66070.0000
E M I i t 0.9239020.05701216.20530.0000
L E V i t 6.8719111.0983776.2564230.0000
O I G R i t 0.3243880.210521.5408840.1234
R O A i t 36.382193.8223269.5183370.0000
S I Z E i t −1.7329570.232215−7.462720.0000
T A G E i t 4.877770.7462966.5359720.0000
Mean dependent var0.174288S.D. dependent var16.52153
S.E. of regression37.09420Sum squared resid33,463,830
J-statistic385.9647Instrument rank210
Prob(J-statistic)0.000000
Table 9. Estimation results of the static panel model.
VariableFixed Effects ModelMixed Effects Model
Coefficientp-ValueCoefficientp-Value
Y i , t 1 −39.396250.0000−108.88110.0000
E M I i t 0.1338880.00010.0755350.0222
L E V i t 0.0603280.47040.0296210.7958
O I G R i t 0.0206290.09370.000030.9985
R O A i t 0.7476210.00000.758640.0001
S I Z E i t 1.8208670.00005.0050690.0000
T A G E i t 0.7013590.00000.7066850.0003
Durbin-Watson stat1.2105670.461062
R 2 0.6455550.067277
Adjusted - R 2 0.5955740.067101
Table 10. Serial correlation test results.
Test Orderm-StatisticrhoSE(rho)Prob.
A R ( 1 ) −2.817628−8,069,000.0162,863,756.3070.0048
A R ( 2 ) −0.562815−574,577.85521,020,899.9560.5736
Table 11. The regression results of heavily polluting industries.
VariableCoefficientStd. Errort-StatisticProb.
Y i , t 1 0.3588550.000532674.09740.0000
E M I i t 1.7089110.04004342.676390.0000
L E V i t 26.052412.2413911.623330.0000
O I G R i t 0.2502340.148371.6865470.0917
95.06144.63762220.49788
R O A i t −3.2828780.366469−8.9581370.0000
S I Z E i t 8.1827311.5687865.2159630.0000
T A G E i t 0.3588550.000532674.09740.0000
Mean dependent var0.364429S.D. dependent var22.42847
S.E. of regression51.76067Sum squared resid29,816,450
J-statistic282.6828Instrument rank210
Prob(J-statistic)0.000183
Table 12. The regression results of non-heavily polluting industries.
VariableCoefficientStd. Errort-StatisticProb.
Y i , t 1 0.1796890.00365049.223580.0000
E M I i t 0.2469870.0351547.0258580.0000
L E V i t 1.7134560.5284633.2423400.0012
O I G R i t 0.8864800.1529725.7950460.0000
7.2474691.6676154.346008
R O A i t −0.7685850.161781−4.7507780.0000
S I Z E i t 1.1041090.3105813.5549830.0000
T A G E i t 0.1796890.00365049.223580.0004
Mean dependent var0.001774S.D. dependent var8.524356
S.E. of regression13.35598Sum squared resid2,294,531
J-statistic275.6335Instrument rank210
Prob(J-statistic)0.000521
Disclaimer/Publisher’s Note: The statements, opinions and data contained in all publications are solely those of the individual author(s) and contributor(s) and not of MDPI and/or the editor(s). MDPI and/or the editor(s) disclaim responsibility for any injury to people or property resulting from any ideas, methods, instructions or products referred to in the content.

