1. Introduction
The integration of urban and rural development is fundamental to China’s economic and social progress, forming the cornerstone of overall stability and representing the “last mile” in social governance. As China enters a new phase of development, the conditions for urban–rural integration have undergone profound transformations. Consequently, China has proposed accelerating the establishment and perfection of systems and policy frameworks for urban–rural integrated development [
1]. To comprehensively advance rural revitalization, solidly promote common prosperity, and expedite modernization, the Chinese government is gradually advancing urban–rural integration, building a new pattern of joint construction, governance, and sharing.
Therefore, accelerating urban–rural integration is of significant importance and necessity. First, rural revitalization, a demand of both history and practice, primarily focuses on urban–rural integration [
2]. For a long time, China has explored solutions to the unbalanced development caused by the urban–rural dual structure, deepening its understanding of the urban–rural relationship. Implementing the strategy of rural revitalization and promoting urban–rural integration are guiding principles in addressing the current issues of inadequate rural public infrastructure, irrational spatial planning, uneven distribution of urban–rural resources, and severe environmental pollution as well as resulting challenges like rural hollowing, aging, land abandonment, and decline. Secondly, China faces obstacles in its urban–rural integration work, making the process challenging. The advancement of reform and opening-up has gradually improved living standards and significantly adjusted the urban–rural industrial structure, laying a solid foundation for integration. However, significant disparities still exist between urban and rural residents in economic, living, and cultural aspects, with a widening trend. In terms of industrial integration, urban and rural industries in China have not formed complementary advantages, with weak structural complementarity and hindered factor mobility between urban and rural areas, impeding the emergence of new rural industrial paradigms and affecting sustainable development. In terms of population integration, migration mainly flows from rural to urban areas, without fully realizing the two-way movement of urbanizing rural populations and urban residents moving to rural areas. Hindered by the household registration system, rural residents cannot access public services on par with urban residents, suppressing their urbanization aspirations. Moreover, due to traditional disdain for rural areas in Chinese culture, urban-to-rural migration is less common. In terms of cultural and lifestyle integration, the widening income gap between urban and rural residents has left rural consumption growth far behind urban levels. Most rural residents still lack access to education, housing, social security, and medical services comparable to urban areas. The low degree of cultural and lifestyle integration between urban and rural areas also presents governance challenges, as the influx of rural populations into cities increases the complexity and heterogeneity of governance subjects, destabilizing social stability. Thus, how to fully integrate rural populations into urban social and cultural life and enhance their sense of belonging is a key aspect of advancing urban–rural integration in China.
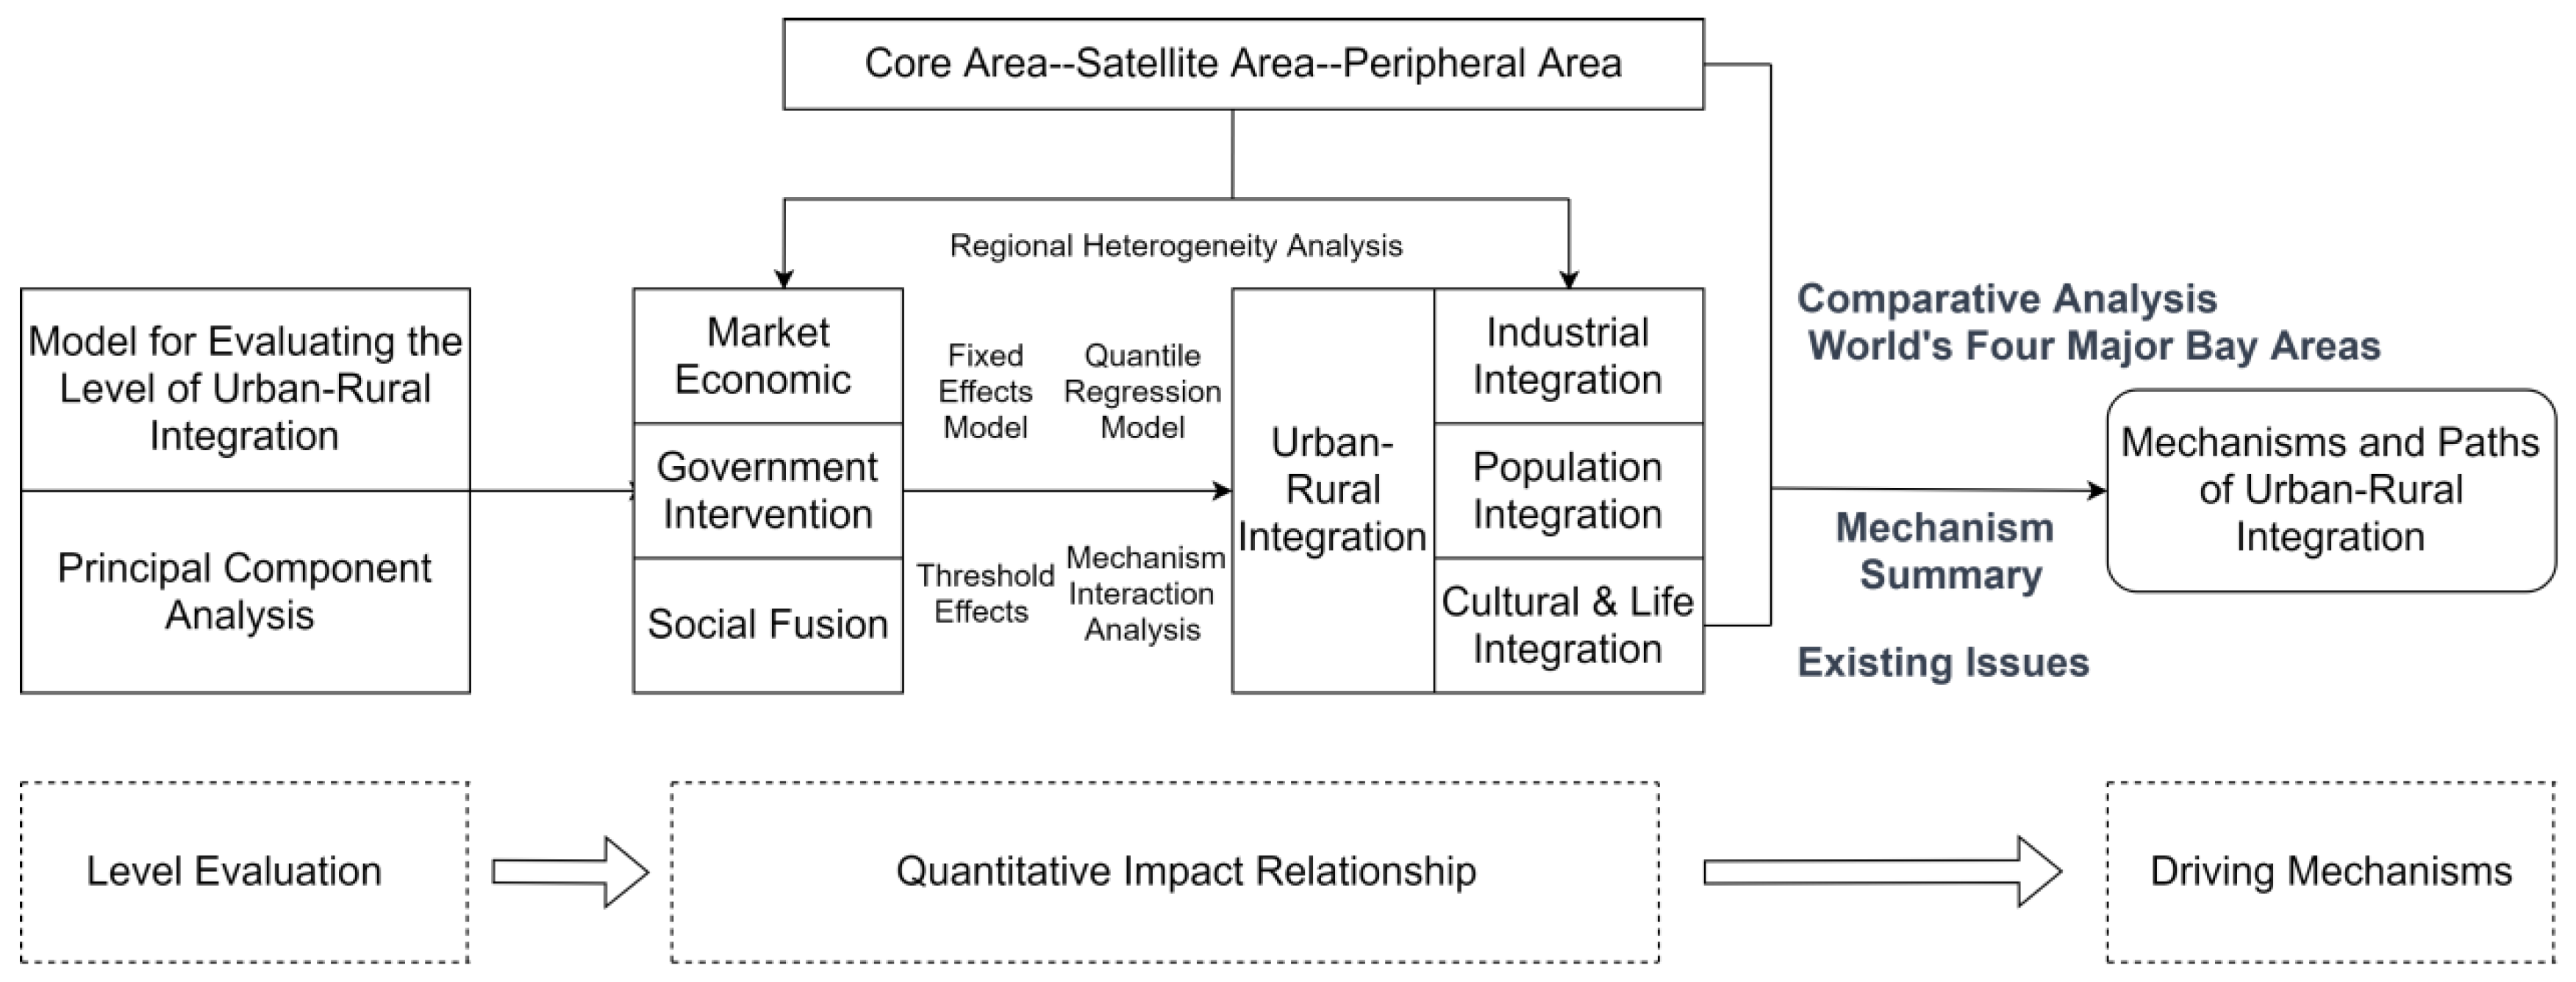
Therefore, it is necessary to select cases with strong experience and generalizability to explore the level, spatial-temporal evolution, and driving mechanisms of urban–rural integration. The Greater Bay Area, one of the world’s most economically vibrant urban agglomerations, is designated as a comprehensive reform and development pilot zone for urban and rural integration in China, making its development worthy of attention. Rural statistics are also not available for Hong Kong, Macao, and Shenzhen because the Chinese government does not have rural household registration in these areas due to their high degree of urbanization. This paper explores the level of urban–rural integration and development, and the removal of non-farming areas will not have an impact on the results of the paper. This study primarily focuses on the other eight major cities (Guangzhou, Foshan, Dongguan, Huizhou, Zhuhai, Jiangmen, Zhongshan, and Zhaoqing) of the Greater Bay Area. This approach aims to reflect the overall situation of urban–rural integration in the area; analyze its influencing factors and spatial-temporal trends; explore the driving mechanisms of urban–rural integration and its subsystems such as industrial, population, and cultural life integration; and examine the threshold and interaction effects of urban–rural integration in the Greater Bay Area. Given the scarcity of micro- and meso-level research in the current academic discourse on urban–rural integration, which primarily focuses on conceptual and theoretical studies without establishing a unified, mature theoretical framework, and a notable lack of quantitative research on spatiotemporal evolution and panel data leading to insufficient explanatory power for the driving mechanisms of urban–rural integration, this paper contributes by selecting the Greater Bay Area, known for its pronounced urban–rural disparities. It aims to analyze the influencing factors and spatiotemporal evolutionary trends of urban–rural integration using three driving mechanisms: market economy, government intervention, and social fusion. Utilizing various quantitative models, including fixed-effect models and threshold testing, and adopting a comparative perspective, this study seeks insights from the urban–rural integration processes of other global bay areas. In conclusion, this research aims to provide new insights for urban–rural integrated development worldwide, effectively responding to the urgent needs of coordinated urban–rural development and rural sustainability.
4. Empirical Results Analysis
4.1. Evaluation of Urban–Rural Integration Development Level
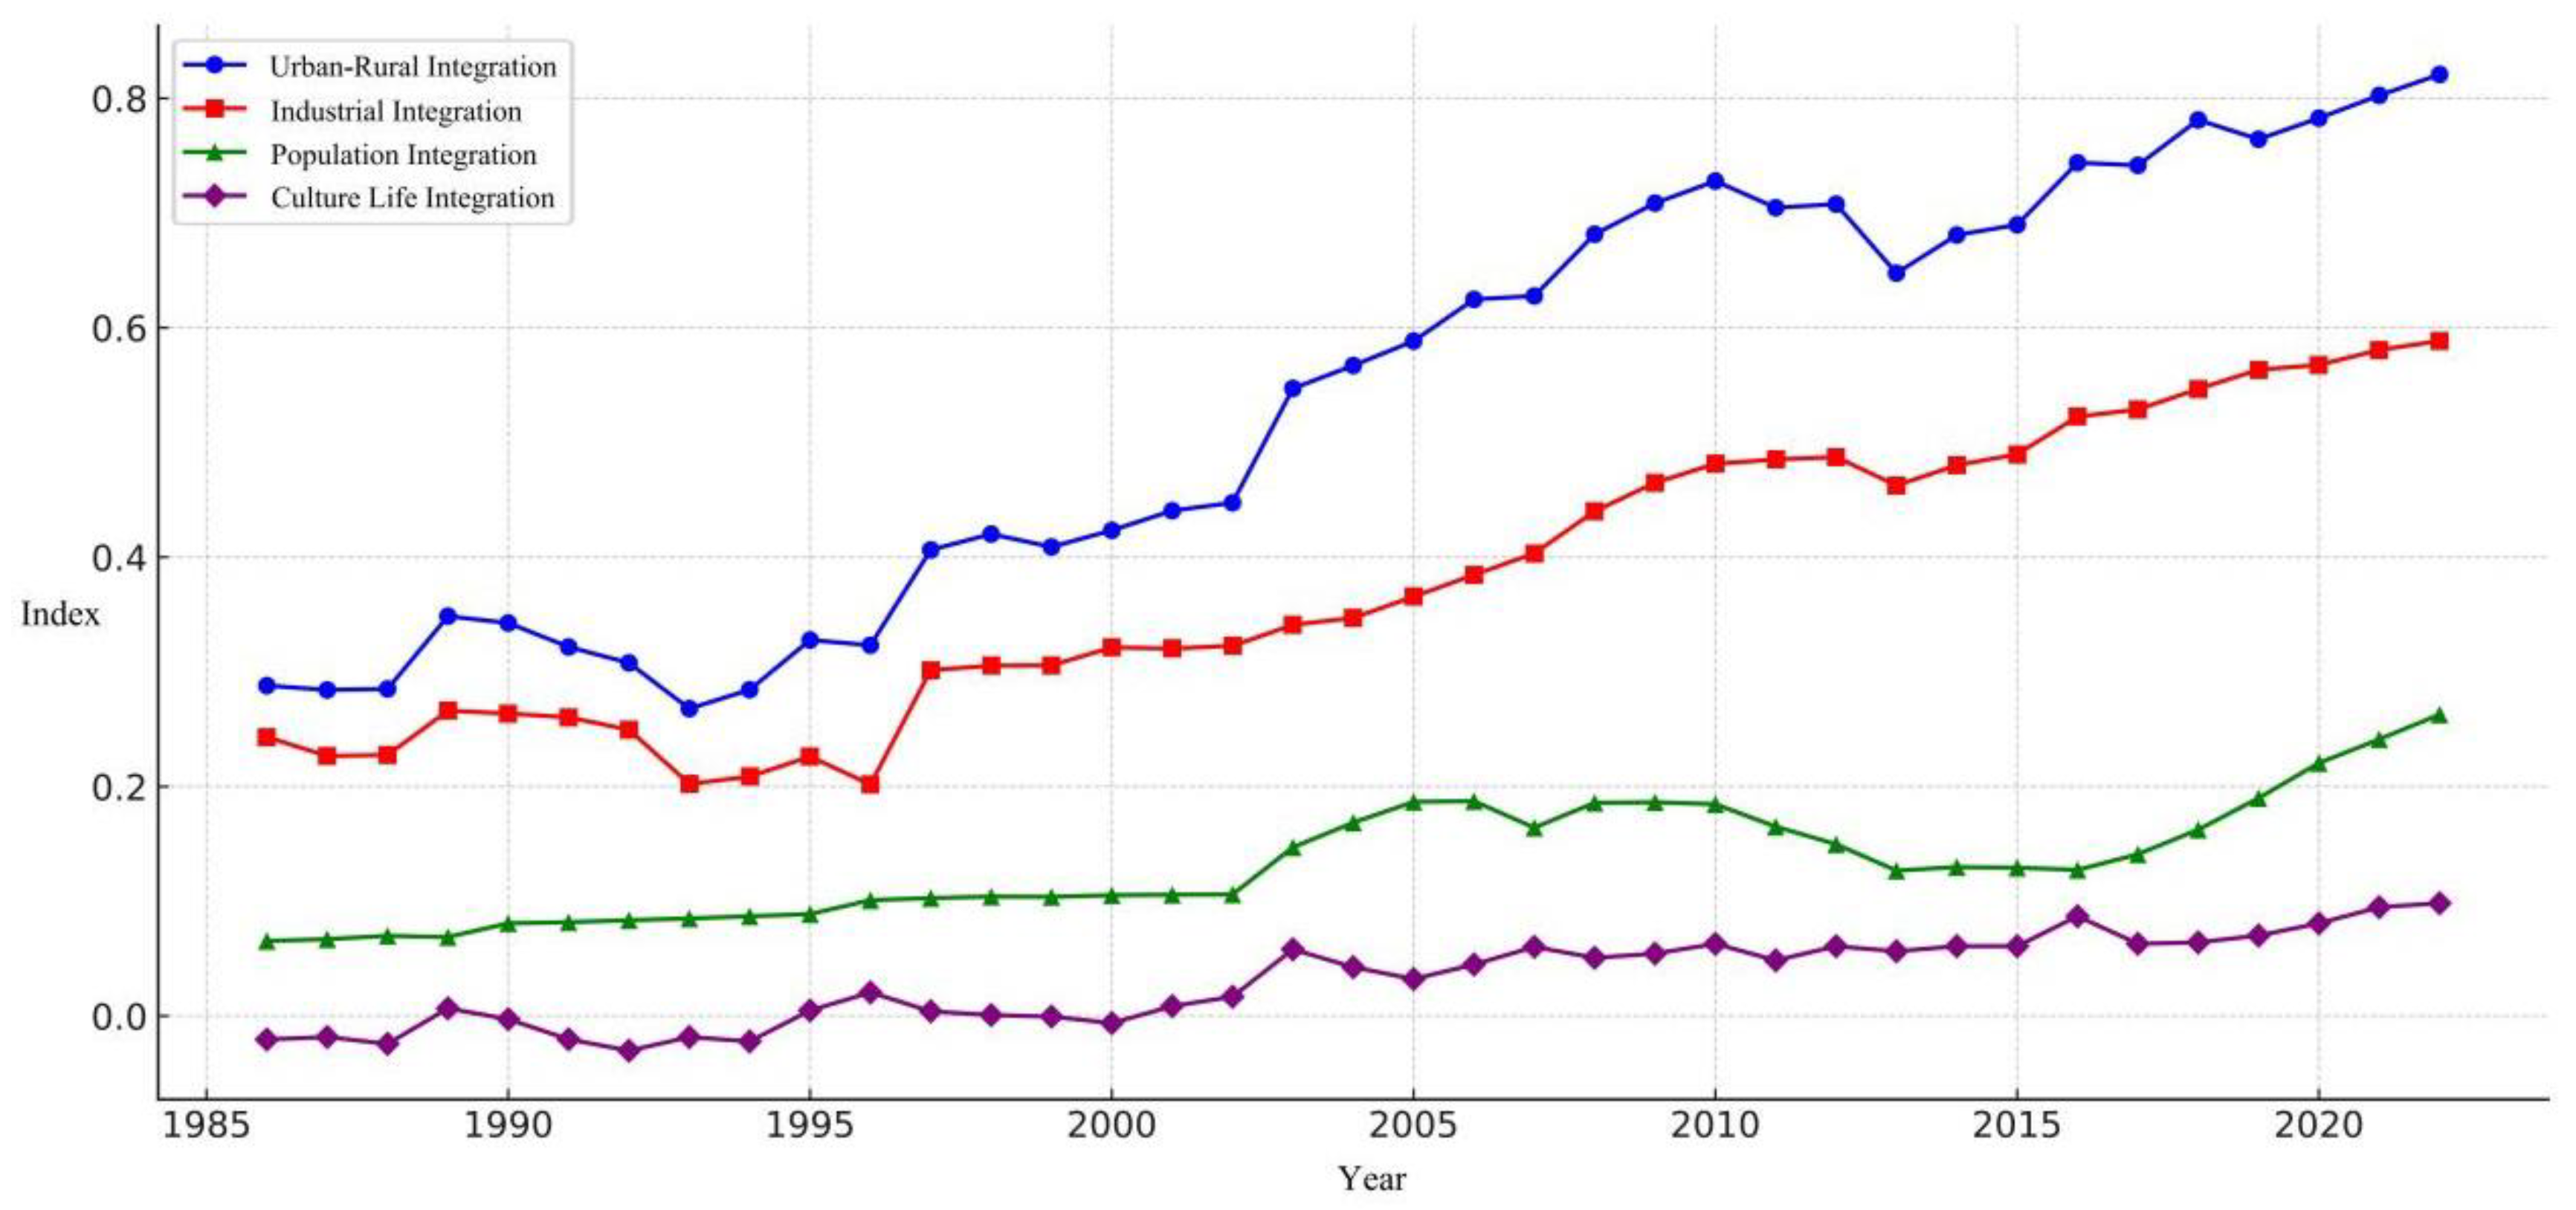
The level of urban–rural integration in the Greater Bay Area has increased from 0.32 in 1986 to 0.82 in 2022, marking an increase of 156.25 percentage points over 36 years (as shown in
Figure 2). Specifically, the level of industrial integration in the Greater Bay Area started high and developed rapidly, with an index growth rate of 146% from 1986 to 2022. Over these 36 years, the area maintained a reasonable proportion in agricultural industry, and urban and rural retail goods could meet the demands of both urban and rural residents. However, the decline in the output of the primary industry did not lead to a decrease in the proportion of agricultural employment, so the current rural labor productivity remains far lower than that of urban areas. Secondly, the level of population integration started low and developed steadily, positioned between industrial integration and cultural life integration. From 1986 to 2022, its index growth rate was 305%. Yet, the current decline in the proportion of agricultural output in the Greater Bay Area has not led to a qualitative change in employment structure or a complete transfer of rural labor, which may indicate the presence of hidden unemployment. Additionally, due to the insufficient capacity of small- and medium-sized towns to absorb and gather population, urbanization growth is slow, increasing the difficulty of urban infrastructure construction and basic public service provision. Finally, the level of cultural life integration started with a negative index, remained low, and grew slowly, with an increase rate of 566% from 1986 to 2022. Field surveys indicate significant differences in urban and rural consumption structures in the Greater Bay Area, with a substantial gap in public security levels and a higher incidence of criminal cases in urban–rural junctions. The current level of basic public service equalization between urban and rural areas lags behind, with significant differences in lifestyle, consumption awareness, and habits between urban and rural residents.
In terms of development trends, the curve of urban–rural integration aligns closely with that of industrial integration, showing similar development and fluctuation trends leading to a preliminary conclusion that industrial integration contributes significantly to urban–rural integration. The curve of population integration showed little change in the early stages and fluctuated in the later period, suggesting it is in a period of institutional reform. The current trend of the population integration curve is synchronized with the changes in urban–rural and industrial integration curves, indicating that the driving role of population integration is gradually emerging postreform. The curve of cultural life integration has consistently maintained a gentle, low-level trend and has not yet unleashed its driving force for the development of urban–rural integration.
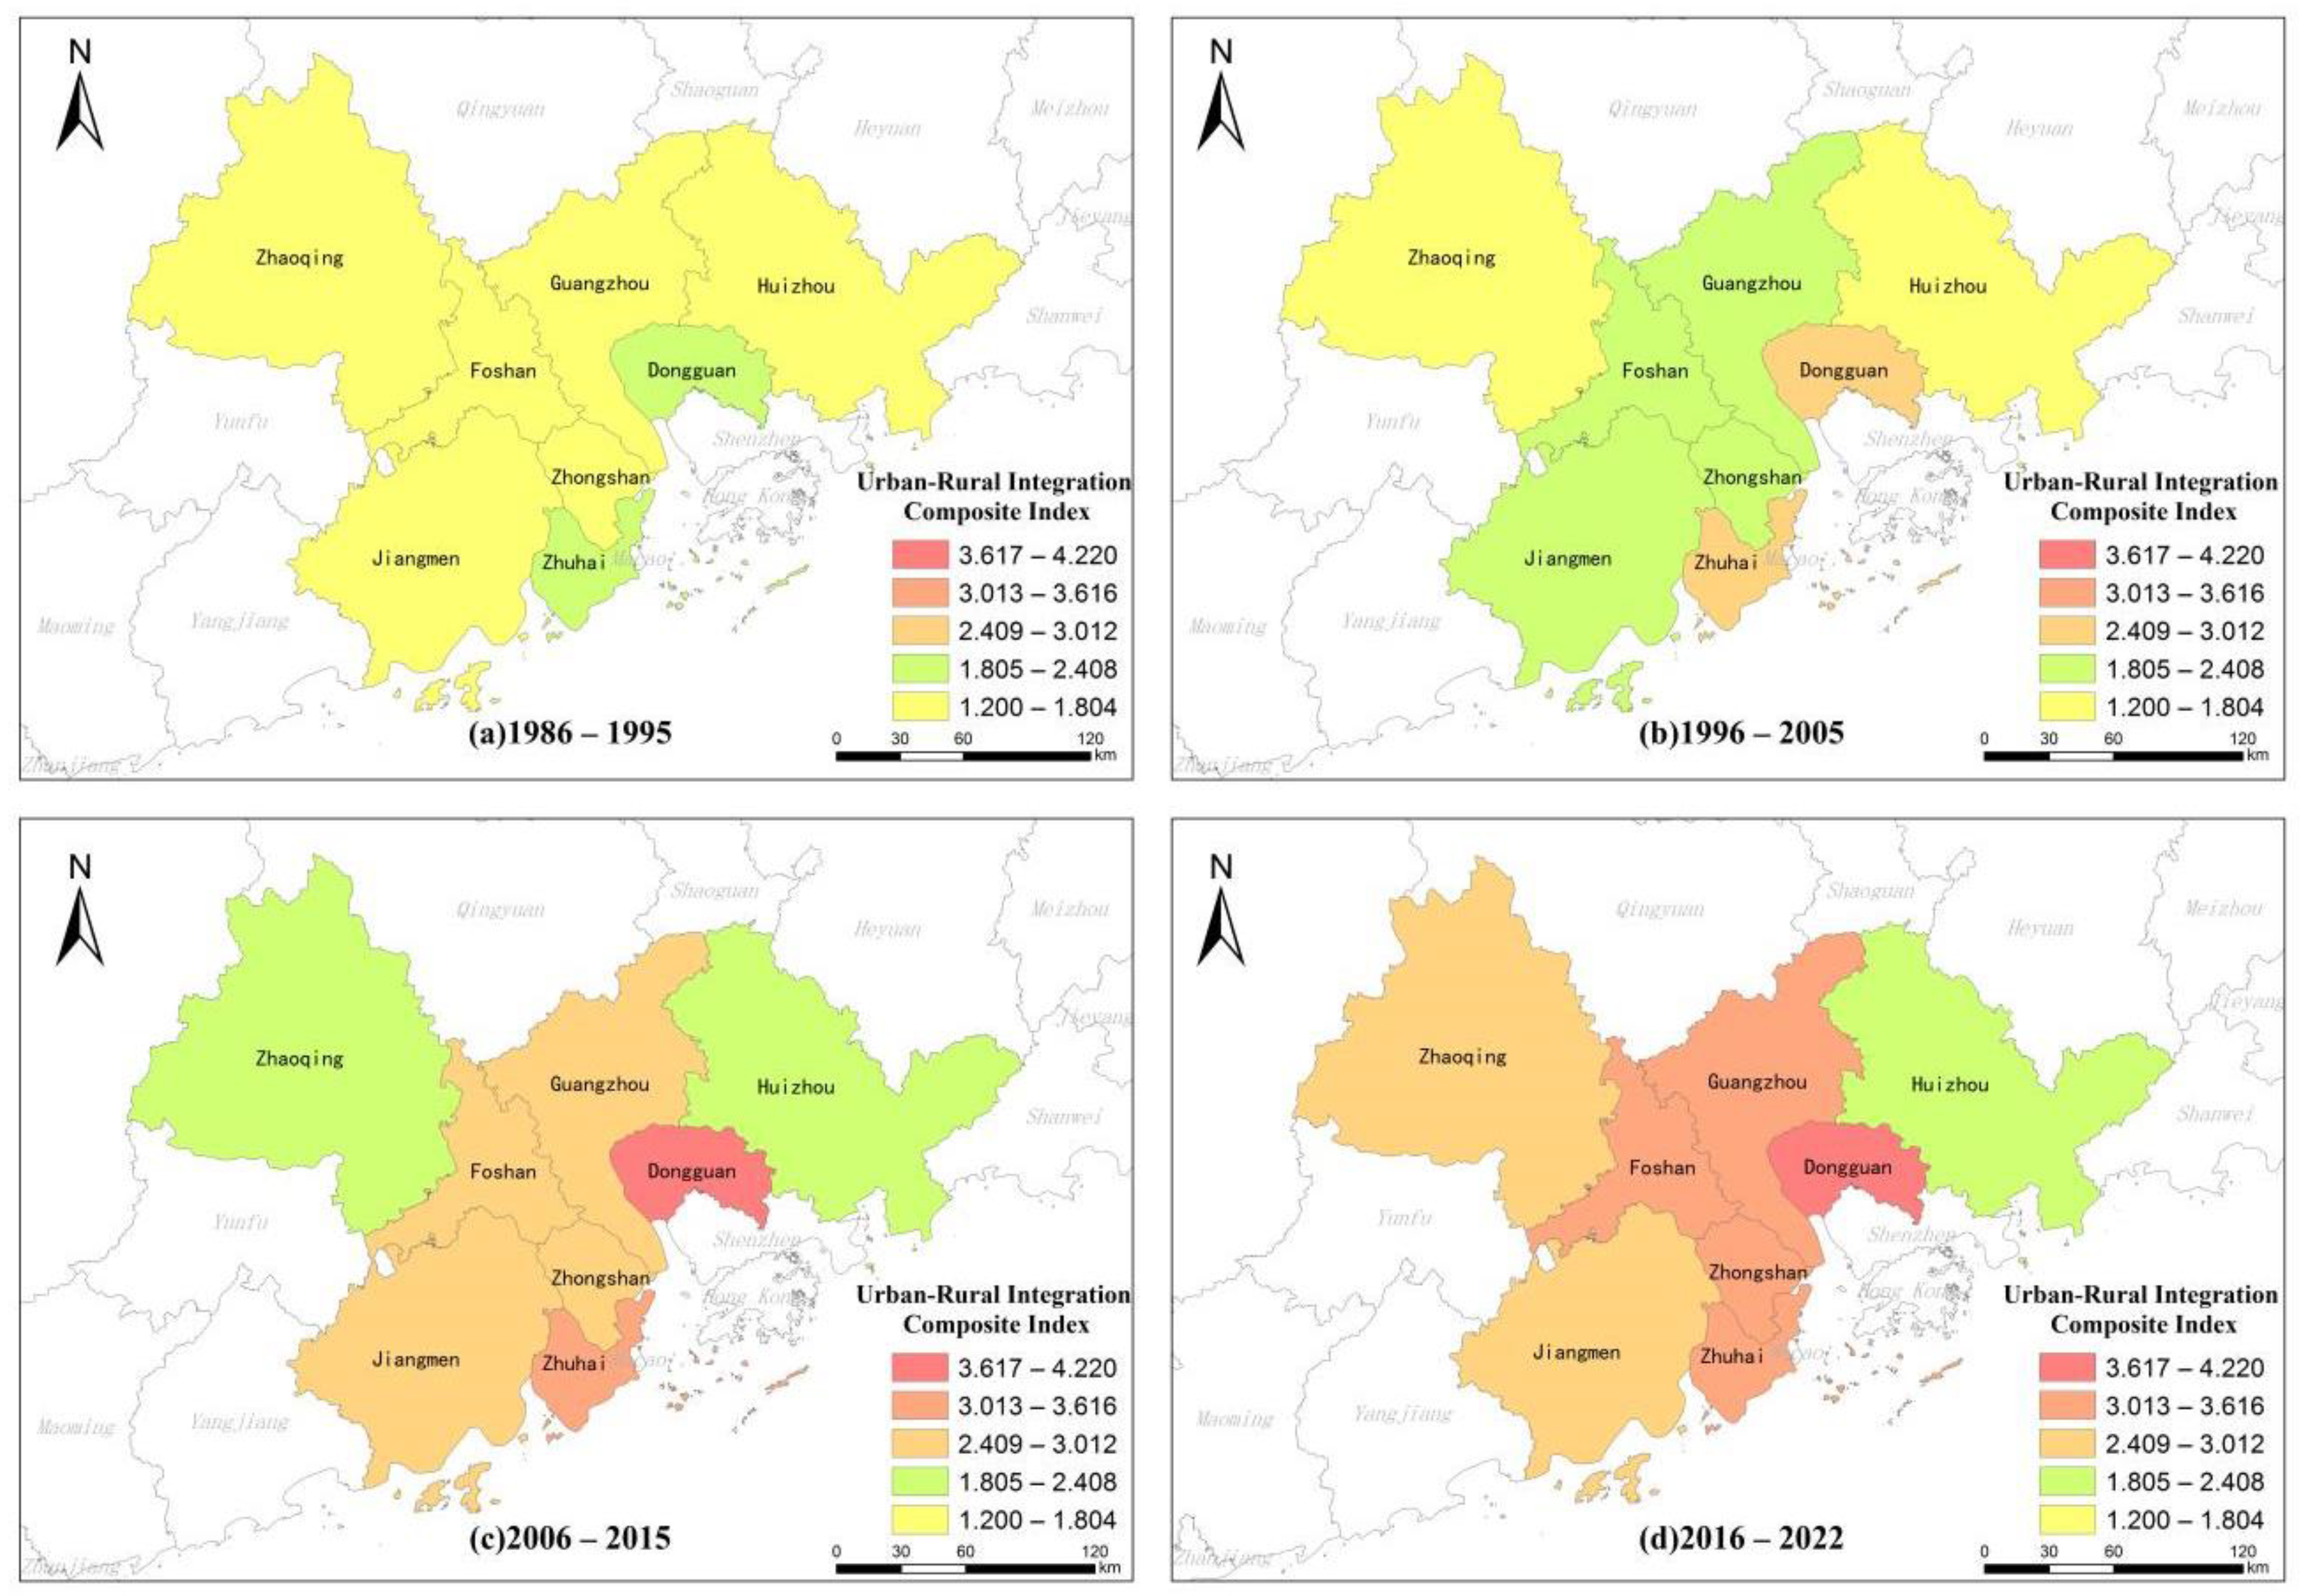
The data from
Figure 3 illustrate the changes in the urban–rural integration composite index within the Greater Bay Area across four distinct time periods (1986–1995, 1996–2005, 2006–2015, and 2016–2022). From 1986 to 2022, there was an overall enhancement in the urban–rural integration composite index across the cities within the Greater Bay Area. Dongguan, in particular, exhibited the highest index and the most rapid development during the 2016–2022 period, likely linked to its dominant position in the manufacturing sector and export-oriented economy. Dongguan’s development strategy, possibly focused on industrial upgrading and innovation-driven growth, significantly propelled the fast-paced urban–rural integration. During the 2016–2022 period, Dongguan, Zhuhai, and Guangzhou reported the highest indices of urban–rural integration, benefiting from a robust economic foundation, well-established infrastructure, strong policy support, and successful urban planning. In contrast, Huizhou and Zhaoqing consistently displayed lower indices throughout all periods, indicating a lag in urban–rural integration processes attributed to a weaker economic base, a monolithic industrial structure, and insufficient attractiveness to talent.
Upon conducting a more detailed regional segmentation of the Greater Bay Area into core areas (Guangzhou, Foshan, and Dongguan), satellite areas (Huizhou, Zhuhai, and Zhongshan), and peripheral areas (Jiangmen and Zhaoqing), analysis of
Figure 3’s data revealed several insights. Firstly, the core area consistently demonstrated a higher baseline and rapid development momentum in urban–rural integration across all stages. Despite fluctuations in integration levels around 2000 and 2008 due to the macroeconomic environmental volatility, the overall trend in the core area was one of stable growth. Secondly, the satellite area’s level of urban–rural integration, initially positioned between the core and peripheral areas, experienced significant volatility from 1988 to 2002. The year 2003 marked a turning point for the satellite area, which thereafter found a development path that suited its characteristics, leading to a steady increase in urban–rural integration levels. However, a considerable gap remains between the satellite and core areas. Thirdly, the peripheral area started with the lowest level of urban–rural integration, encountering frequent fluctuations throughout its development. Until 2005, the integration levels between the peripheral and satellite areas alternated. From 2006 onwards, the gap between the peripheral and satellite areas gradually widened. Yet, after 2014, the peripheral area began to narrow the gap with the satellite area, and the rate of growth stabilized. Despite this, significant differences in the level of urban–rural integration persist between the peripheral and satellite areas.
4.2. Baseline Regression and Quantile Regression
This paper employs Stata 15.0 software to perform mixed-effects, fixed-effects, and random-effects regression on the equation. F-test, Breusch–Pagan (BP) test, and Hausman test statistics were obtained, all passing the tests at the 1% significance level. Therefore, the fixed-effects model was chosen for the final analysis. The descriptive statistics for the main variables are presented in
Table 3.
According to
Table 4, concerning the market economy, there is a significant positive impact on urban–rural integration at the 0.01 level (t = 5.262,
p = 0.000 < 0.01), with a regression coefficient of 0.213 > 0. This indicates that the market economy has a significant positive relationship with urban–rural integration. Regarding government intervention, there is significance at the 0.05 level (t = 2.364,
p = 0.018 < 0.05), with a regression coefficient of 0.176 > 0, suggesting a significant positive impact on urban–rural integration. As for social fusion, it is significant at the 0.01 level (t = 3.059,
p = 0.002 < 0.01), with a regression coefficient of 0.083 > 0, indicating a significant positive impact on urban–rural integration. Therefore, we can conclude that market economy, government intervention, and social fusion have significant impacts on urban–rural integration, with the market economy having the greatest influence, thus validating Hypothesis 1.
From 1986 to 2022, the level of urban–rural integration development in the Greater Bay Area showed steady growth. Hence, the 25%, 50%, and 75% quantile regression models from
Table 4 were used to discuss the differences in the factors influencing urban–rural integration at different development stages, summarizing the temporal evolution trends of the driving mechanisms in the Greater Bay Area.
Firstly, regarding the market economy mechanism, it consistently plays a significant positive role. At the 25% level of urban–rural integration, in the initial stage of market development, industrial structures are just being established and invested in, with elements stably flowing between urban and rural areas. For urban–rural integration to develop, the market economy must take the lead as the primary driving mechanism. Therefore, at this stage, the market economy begins to release and gradually strengthen its significant positive effect on urban–rural integration, with a coefficient of 0.498. However, as it moves into the 50% level of urban–rural integration, its impact coefficient begins to decrease to 0.459 but still plays a positive role. As the basic mechanism of urban–rural integration, the market economy plays a crucial role in the initial stages of development in the Greater Bay Area, providing continuous developmental momentum. However, in the mid-term, under specific technical conditions, the development of non-agricultural industries can only absorb labor according to the principle of minimizing costs and cannot fully absorb the continuously incoming surplus rural labor. When these labor employment issues are not resolved, the negative trend of the market economy may expand, and the employment structure becomes less conducive to urban–rural integration, weakening the impact of the market economy. But as it enters the 75% level of urban–rural integration, with the liberalization and restrictions of the market and adjustments in industrial and employment structures, the positive impact of the market economy strengthens again, with a coefficient of 0.565.
Secondly, regarding the government intervention mechanism, due to the Chinese government’s emphasis and application of regulatory measures, government intervention as a guiding mechanism has a significant positive impact on urban–rural integration throughout the process, though the impact coefficient decreases in the later stages. The government promotes the construction of infrastructure and service systems for urban–rural integration through measures such as household registration system reform, balanced allocation of educational resources, adjustment of land-use policies, equalization of urban and rural public services, tax incentives, and poverty alleviation and development, effectively guiding the direction of resource allocation and social development and ensuring balanced and sustainable development in the process of urban–rural integration. At the same time, the government closely monitors new issues that may arise during urban–rural integration, such as urban–rural disparities and environmental protection, and adjusts and improves relevant policies in a timely way to ensure the healthy and stable development of urban–rural integration. However, entering the 75% level of urban–rural integration, the positive impact coefficient of government intervention decreases by 6.18%. This decrease might be due to a saturation point reached with increased government intervention, leading to diminishing marginal utility of further intervention. As the Chinese government moves towards the construction of a “limited and service-oriented government” in the later stages, government resources and attention are diverted, and with the increasing strength of the market economy, the impact of government intervention on urban–rural integration declines.
Finally, regarding the social fusion mechanism, in the process of urban–rural integration development, social fusion is most closely related to the interests of the people and has a significant driving force for the future development of urban–rural integration. At the 25% level of low urban–rural integration, the social fusion mechanism plays a significant negative role. Combining historical logic, it can be seen that in the early stages of urban–rural integration in the Greater Bay Area, the main focus was on extracting rural resources to develop cities, blocking the flow of elements between urban and rural areas, and concentrating public service and infrastructure supply mainly in cities. This resulted in long-term developmental lags in rural areas in economic, political, and cultural aspects, widening the per capita income gap between urban and rural areas and lowering the sense of gain and identification among rural people. Entering the 50–75% medium-to-high levels of urban–rural integration, the positive impact of the social fusion mechanism gradually unfolds. This is due to the development of information technology, making cultural exchanges between urban and rural areas more frequent and in-depth. Also, the deepening interdependence between urban and rural economies has gradually narrowed the living standards of urban and rural residents as well as equalized public services such as education and healthcare in urban and rural areas, significantly enhancing the sense of gain and identification among rural residents. More importantly, the interactive models between urban and rural areas are constantly innovating. For example, through e-commerce platforms, rural products can be sold directly to cities, and advanced urban technologies and management experiences can be more quickly adopted by rural areas. Through these changes, the social fusion mechanism plays a positive role in the medium-to-high stages of urban–rural integration, effectively promoting balanced development between urban and rural areas. Social fusion will be a key driving mechanism for future urban–rural integration work, laying a solid foundation for achieving higher levels of urban–rural integration.
4.3. Analysis of Regional Heterogeneity
The results of the variance analysis indicate that there are differences in the urban–rural integration index among different areas, and it shows a pattern where the degree of urban–rural integration is in the order of core areas > satellite areas > peripheral areas. This suggests that the core areas have achieved a higher level of urban–rural integration compared to the satellite and peripheral areas. Such disparities highlight the varying success and challenges in urban–rural integration across different regions within the Greater Bay Area (
Table 5).
Looking at the core, satellite, and peripheral areas (as shown in
Table 6), the impact of market economy, government intervention, and social fusion on urban–rural integration varies across different areas. In the core areas, the market economy has the most significant impact on urban–rural integration, with a coefficient of 0.449. This indicates that market forces play a key role in driving urban–rural integration in core areas. Government intervention is also an important factor, with a coefficient of 0.391, suggesting that government policies have a significant positive impact on urban–rural integration in core areas. Although social fusion has a weaker impact, with a coefficient of 0.190, it is still significant, indicating that social and cultural integration is also a fundamental driver for urban–rural integration in the core areas of the Greater Bay Area.
In the satellite areas, the impact coefficient of the market economy is 0.260, which is smaller than that in the core areas but still significant, indicating that the market also plays an important role in promoting urban–rural integration in satellite areas. Government intervention has a significant impact in satellite areas as well, with a coefficient of 0.206, but this impact is smaller than in core areas, suggesting that government policies have a more limited effect in these areas. The influence of social fusion in satellite areas is similar to that in core areas, showing that social and cultural factors have a positive impact on urban–rural integration in satellite areas.
Finally, in the peripheral areas, both market economy and government intervention have significant impacts on urban–rural integration, with coefficients of 0.290 and 0.332, respectively. However, these impacts are weaker compared to core and satellite areas. The influence of social fusion on urban–rural integration in peripheral areas is not significant, possibly due to the slower or uneven process of social and cultural integration in these areas.
In summary, each area exhibits differences in strategies and priorities for promoting urban–rural integration. Core areas mainly rely on market forces supplemented by government roles, satellite areas focus on the dual roles of market and government, and peripheral areas predominantly depend on government intervention. There is a need to balance the roles of the market and government in peripheral areas and potentially strengthen mechanisms for social fusion, thus confirming Hypothesis 4.
Therefore, by combining regional characteristics and data results, we can help elucidate and discuss the urban–rural integration driving mechanisms suitable for each area: Core areas rely on developed market economies and effective government intervention. The market economy attracts population and capital by providing diverse employment opportunities and an innovative environment, while the government ensures the sustainability and fairness of integration through planning, legislation, and financial support. Satellite areas mainly depend on market forces, especially economic connections with core areas, attracting investment and promoting employment by developing industries and services complementary to those in core areas, and they may also rely on resources and services from core areas. Peripheral areas need to rely more on government support and intervention, with the government possibly needing to invest more in infrastructure, education, healthcare, and social welfare to promote economic and social development in these areas. At the same time, promoting social and cultural integration is key, especially in areas with lower levels of diversity.
4.4. Threshold Effect Analysis
Drawing on Hansen’s research method, it is necessary to test for the presence of threshold effects and the number of thresholds in the sample before using the panel threshold model. This determines the form of the panel threshold regression model. The F-test statistic was obtained by estimating the model, and the “bootstrap method” was used to resample 300 times to calculate the probability value
p and the critical value, which are listed in
Table 7.
As shown in
Table 7, using the market economy as the threshold variable, the F-statistic for a single threshold rejects the null hypothesis of “no threshold” at the 10% significance level. However, the F-value for the double threshold cannot reject the hypothesis of “only one threshold” at the 10% significance level, confirming the existence of one threshold in the market economy. Similarly, by using government intervention and social fusion as threshold variables, it was concluded that both government intervention and social fusion have one threshold each. After the threshold effect passes the test, the LR statistic is calculated to determine the threshold value, with the threshold values and the 95% confidence intervals listed in
Table 8. According to
Table 8, the threshold values for market economy, government intervention, and social fusion as threshold variables are −1.2292, 0.6238, and 0.2290, respectively.
After determining the threshold values, parameter estimation was conducted according to the threshold effect model formula. The parameter estimation results of the threshold panel model are shown in
Table 9. Overall, whether the threshold variable is the market economy, government intervention, or social fusion, a significant change occurs in the impact on urban–rural integration development once a certain “threshold” is exceeded, thus validating Hypothesis 2.
- 1.
Threshold Regression Analysis of the Market Economy
Conducting a threshold effect test with the market economy as the threshold variable, the estimated coefficient was consistently significantly positive. This indicates that the development of the market economy and its increasing freedom are conducive to facilitating the flow of factors between urban and rural areas, thereby promoting the sustainable development of urban–rural integration. When the level of the market economy is below the threshold (−1.2292), it has a moderate promotional effect on urban–rural integration. Once the level of the market economy crosses this threshold (−1.2292), the estimated coefficient increases from 0.7483 to 0.9529, further releasing and strengthening its promotional effect. As the market economy matures, capital and resources are more likely to flow to cities and rural areas that offer favorable market environments and ample business opportunities, thus accelerating economic integration in these areas. Additionally, innovation and entrepreneurial activities are encouraged, providing more business opportunities and jobs in urban and rural areas, and changing the consumption patterns and lifestyles of residents. In summary, the impact of the market economy on urban–rural integration development exhibits a significant threshold effect and plays an important positive role throughout the entire process of urban–rural integration, improving economic levels and residents’ incomes between urban and rural areas, laying a solid foundation for further integration, optimizing the industrial structure between urban and rural areas, and promoting efficient resource allocation and balanced development across regions.
- 2.
Threshold Regression Analysis of Government Intervention
Testing the threshold effect with government intervention as the threshold variable, the estimated coefficient was consistently significantly positive but gradually weakened. This suggests that in the process of urban–rural integration development, the government intervention process needs to be controlled at a balance point to effectively promote sustainable urban–rural integration. When the degree of government intervention is below the threshold (0.6238), it significantly positively impacts urban–rural integration. However, once it crosses this threshold (0.6238), the estimated coefficient decreases from 0.3525 to 0.2702, beginning to weaken its promotional effect. This indicates that in the initial stage, government intervention may focus on addressing basic obstacles to urban–rural integration, such as investing in infrastructure, improving rural education and healthcare, etc. These initial interventions can quickly resolve some apparent inequalities and development bottlenecks, significantly promoting urban–rural integration development. Once intervention surpasses the threshold, the previously direct and effective policies might start facing diminishing marginal effects. This is because the initial “low-hanging fruits” have been harvested, and the remaining issues may be more complex and slower to respond to policy interventions. Excessive government intervention might lead to reduced efficiency in resource allocation and suppress the private sector’s enthusiasm, weakening the positive effects of government intervention and reducing the market mechanism’s role in urban–rural integration. Therefore, insufficient intervention might be ineffective in promoting urban–rural integration, but excessive intervention can diminish its effects. The ideal level of government intervention is likely near the threshold value (0.6238).
In summary, government intervention significantly positively impacts urban–rural integration development, but this impact changes at different intervention levels. It is crucial to find the most appropriate level of intervention to maximize the positive effects of government policies. Initially, active government involvement is necessary, but as development progresses, the government should gradually adjust its role, allowing more space for market mechanisms and avoiding the negative effects of excessive intervention.
- 3.
Threshold Regression Analysis of Social Fusion
When the level of social fusion is below the first threshold (0.2290), its impact on urban–rural integration development is significantly negative, with an estimated coefficient of −0.3657. When the level of social fusion is above the first threshold (0.2290), its impact becomes significantly positive, with an estimated coefficient of 0.0883. The change in coefficients from negative to positive indicates that as the level of social fusion increases, its impact on urban–rural integration development changes from “inhibitory” to “promotional”.
When the level of social fusion is below the threshold value (0.2290), its impact on urban–rural integration development is negative. This implies that at lower levels of social fusion, there may be significant differences between urban and rural areas. Differences in culture and lifestyle, along with asymmetrical information transfer, can lead to certain cognitive biases or even urban–rural segregation or conflict, thereby hindering the process of urban–rural integration. Additionally, differences in employment opportunities, economic activities, and lifestyles between rural migrants and urban residents may result in difficulties adapting to urban life.
When the level of social fusion is above the threshold value (0.2290), its impact on urban–rural integration development becomes positive. This indicates that at higher levels of social fusion, the differences in culture and lifestyle between urban and rural areas decrease. Increased exchanges of culture, experience, and information promote mutual understanding and cooperation among residents, thus benefiting urban–rural integration. As social fusion deepens, public resources are more likely to flow and be shared between urban and rural areas, reducing the development imbalance between them. This manifests as better economic participation, smoother transportation, higher quality of life, enhanced interconnectedness of information, and more equitable distribution of educational and medical resources. Furthermore, rural residents’ identification with and adaptation to urban lifestyles improve, leading to a merging and acceptance of urban and rural lifestyles.
In conclusion, the level of social fusion has a complex and phased impact on the development of urban–rural integration. Social fusion can effectively promote urban–rural integration development, possibly involving adjustments and investments in policies related to cultural exchange, social identity, education, and infrastructure construction. Therefore, social fusion is a multifaceted interactive process involving economic, policy, and socio-cultural aspects, requiring the collaborative efforts of the market, government, and society to achieve it.
4.5. Mechanism Interaction Analysis
As can be seen from
Table 10, in the Greater Bay Area, the explanatory power of any two interactive mechanisms for urban–rural integration development is stronger than that of a single mechanism. This indicates that the development of urban–rural integration in the Greater Bay Area is the result of the combined effect of multiple influencing factors, thus validating Hypothesis 3.
Specifically, in terms of urban–rural integration, the regression coefficient of the interaction of market economy, government intervention, and social fusion is 0.999, representing the strongest interactive effect in urban–rural integration. This suggests that the combined effect of these three elements has a significant positive impact on urban–rural integration. The coefficients for the interactions between market economy and government intervention as well as and market economy and social fusion, are 0.440 and 0.543, respectively. These two interactive effects are relatively strong, indicating that the market economy, by improving the efficiency of resource allocation and promoting economic growth, and government intervention, by formulating and implementing policies, ensure that the benefits of economic growth contribute to coordinated and sustainable urban–rural development. The market economy also drives cultural diversity and innovation, while social and cultural fusion facilitates innovation and diverse development in the market economy, promoting the integration of urban and rural cultures.
Similarly, in industrial integration, the combined effect of market economy, government intervention, and social fusion is most significant, with a coefficient of 1.466. Industrial integration requires the innovative and competitive mechanisms provided by the market economy, policy support and guidance from the government, and the adaptation and integration of social culture. The government can guide industries towards more efficient and urban–rural complementary directions, while social and cultural fusion helps form new industrial cultures and consumption habits, which are all crucial factors in driving industrial integration. The coefficient for the interaction between market economy and government intervention is 1.263, indicating a significant role in promoting industrial integration, where the market economy fosters technological innovation and economic growth, and government intervention ensures that these developments align with long-term social and sustainable goals.
Regarding population integration, the levels of impact of the various mechanisms are relatively close, with the interaction between market economy, government intervention, and social fusion having the largest effect, indicated by a coefficient of 1.156. The combined impact of market economy, government intervention, and social fusion on population integration can be understood as a multifaceted interaction and reinforcement effect. The market economy provides economic growth and job opportunities, promoting population mobility, while government intervention, through policy formulation, ensures social equity and reasonable resource distribution, helping alleviate the inequalities brought about by the market economy. Social fusion promotes mutual understanding and acceptance of different cultures and lifestyles, reducing cultural barriers between urban and rural areas.
In cultural life integration, the most influential mechanism is the interaction of market economy, government intervention, and social fusion, with a coefficient of 1.362. In the two-way interaction mechanisms, the coefficients for social fusion interactions are relatively high. Cultural life integration requires not only the lifestyle diversity brought by the market economy and the support of government cultural policies and public service equalization but also mutual respect and exchange in culture from all sectors of society. The fusion of cultures helps form an inclusive and diverse social environment, promoting mutual understanding and integration of cultures between urban and rural areas.
Overall, for urban–rural integration and its subsystems, the regression coefficients for the combined interactive effect of market economy, government intervention, and social fusion are the largest. This demonstrates that although market economy, government intervention, and social fusion each have a certain impact on urban–rural integration and its subsystems, their interactive effects provide a more powerful driving force. From these analyses, it is evident that the impact of different mechanism interactions varies across each integration subsystem. In the practice of sustainable urban–rural integration development, it is essential to choose and match these interactive mechanisms based on specific situations and objectives.
5. Discussion
This study compiled government work reports and urban–rural integration reform policy texts from eight cities in the Greater Bay Area. Based on the quantitative analysis previously conducted, the following section discusses the development and mechanisms of industrial integration, population integration, and culture life integration within the Greater Bay Area. It summarizes existing problems and tries to accurately reflect the current situation of urban–rural integration in the Greater Bay Area, aiming to better generalize the driving mechanisms of urban–rural integration. Moreover, by comparing with the urban–rural integration driving mechanisms of other international bay areas, it achieves insights into the development of urban–rural integration in the Greater Bay Area.
5.1. Relationship Analysis
In the process of urban–rural integration development, industrial integration is the foundation, population integration is the key, and cultural life integration is the ultimate goal. These three aspects complement and promote each other, with the mechanisms of market economy, government intervention, and social fusion working together to drive high-quality development and common prosperity in urban–rural integration and its subsystems.
Firstly, in the early stages of urban–rural integration, industrial integration must take precedence. The premise for industrial integration is to establish a governance pattern where the market decides and the government guides. Industrial integration relies on the mechanism of “market determination of resource and factor allocation” to provide strong momentum. However, blind industrial integration can lead to industry monopolization and market failure. Therefore, the government must play a supplementary role, guiding resource allocation towards urban–rural integration and supporting the construction of a two-way factor flow mechanism between urban and rural areas. Forming an industrial integration structure where the market is primary and the government is auxiliary can effectively stimulate factor mobility and structural, economic, and spatial effects, forming a complementary supply and demand in the industry.
Secondly, the bidirectional flow of human resources is another critical step in urban–rural integration development. Population integration is about allocating human and labor capital according to market demands, achieving labor mobility between cities and rural areas. On one hand, rural labor should integrate into urban industries, while on the other, urban labor should flow into rural areas following market rules. Population integration results from the combined effects of the market and government. Due to the more comprehensive resources and social welfare in cities, rural populations migrate to urban areas for development or settlement, gradually transitioning them to non-agricultural status. While rural populations move to cities, urban residents also start to integrate into rural areas. The driving mechanisms for urban residents to integrate into rural areas include market-driven entrepreneurship or retirement in rural areas, industrial policy guidance, fair and reasonable policy provision, improved rural public systems and infrastructure, breakdown of the mental barrier between urban residents and farmers to form mutual recognition, and implementation of tax and land incentives for rural entrepreneurship.
Lastly, cultural life integration is the ultimate goal, effectively promoting material and spiritual prosperity among the populace, satisfying the growing needs for a better life. Urban–rural cultural life integration is reflected as administrative, economic, and social boundaries between villages and cities dissolve; public services are equalized; and mutual recognition between urban and rural residents increases, facilitating bidirectional population and resource flow between cities and villages. This makes both urban and rural lifestyles natural choices for people. To achieve this, it is necessary to first, establish the market’s decisive role in resource allocation and fully utilize the government’s economic regulation and market supervision functions. Economic boundaries will gradually dissolve as the market and capital integrate labor reproduction and bear the costs of production and reproduction, gradually dissolving the segregation between rural populations and cities. Enterprises and factories will fully respect the rights of rural populations, allowing villagers and migrant workers to freely choose employment in various industries. The government will ensure equal pay for equal work among rural and urban populations by setting corresponding wage standards and improving labor laws. Through these mechanisms, there will be a full flow of human, material, and financial resources between urban and rural areas, and social exclusion and injustice will gradually weaken, accumulating and re-accumulating social fusion between rural populations and cities. Second, by gradually abolishing the household registration system, administrative boundaries will be broken, eliminating household registration as a boundary for urban–rural resident identity. Urban and rural residents will have equal rights in social security, employment, education, and medical care, reducing social exclusion significantly. Social boundaries will blur, and social class mobility will accelerate. Third, based on the dissolution of administrative and economic boundaries, coupled with reforms in urban–rural institutional supply and cultivation of social fusion and inclusiveness mechanisms, rural culture will no longer be a barrier to urban–rural cultural life integration. Rural populations will continuously integrate with urban systems in values, ideologies, lifestyles, language, etc., adjusting their social roles and gradually undergoing resocialization. The government will foster an inclusive integration atmosphere by welcoming rural populations with friendly urban management policies, gradually eliminating rural stigmatization. Influenced by this, urban residents will also increase interaction and psychological identification with rural populations. Rural populations will actively participate in urban and community activities, strengthening their sense of belonging to the city and gradually moving away from being marginalized.
5.2. Comparison of the Four Major International Bay Areas
The Greater Bay Area of China distinguishes itself from the other three major bay areas (San Francisco Bay Area, New York Bay Area, and Tokyo Bay Area) through its unique approaches to market economy, government intervention, and social fusion in the realm of urban–rural integration. These distinctions not only underscore the unique developmental strategies employed by each bay area but also offer insightful lessons for the urban–rural integration development within China’s Greater Bay Area. Herein lies a comparative analysis of these bay areas across the specified mechanisms and the potential lessons for China’s Greater Bay Area.
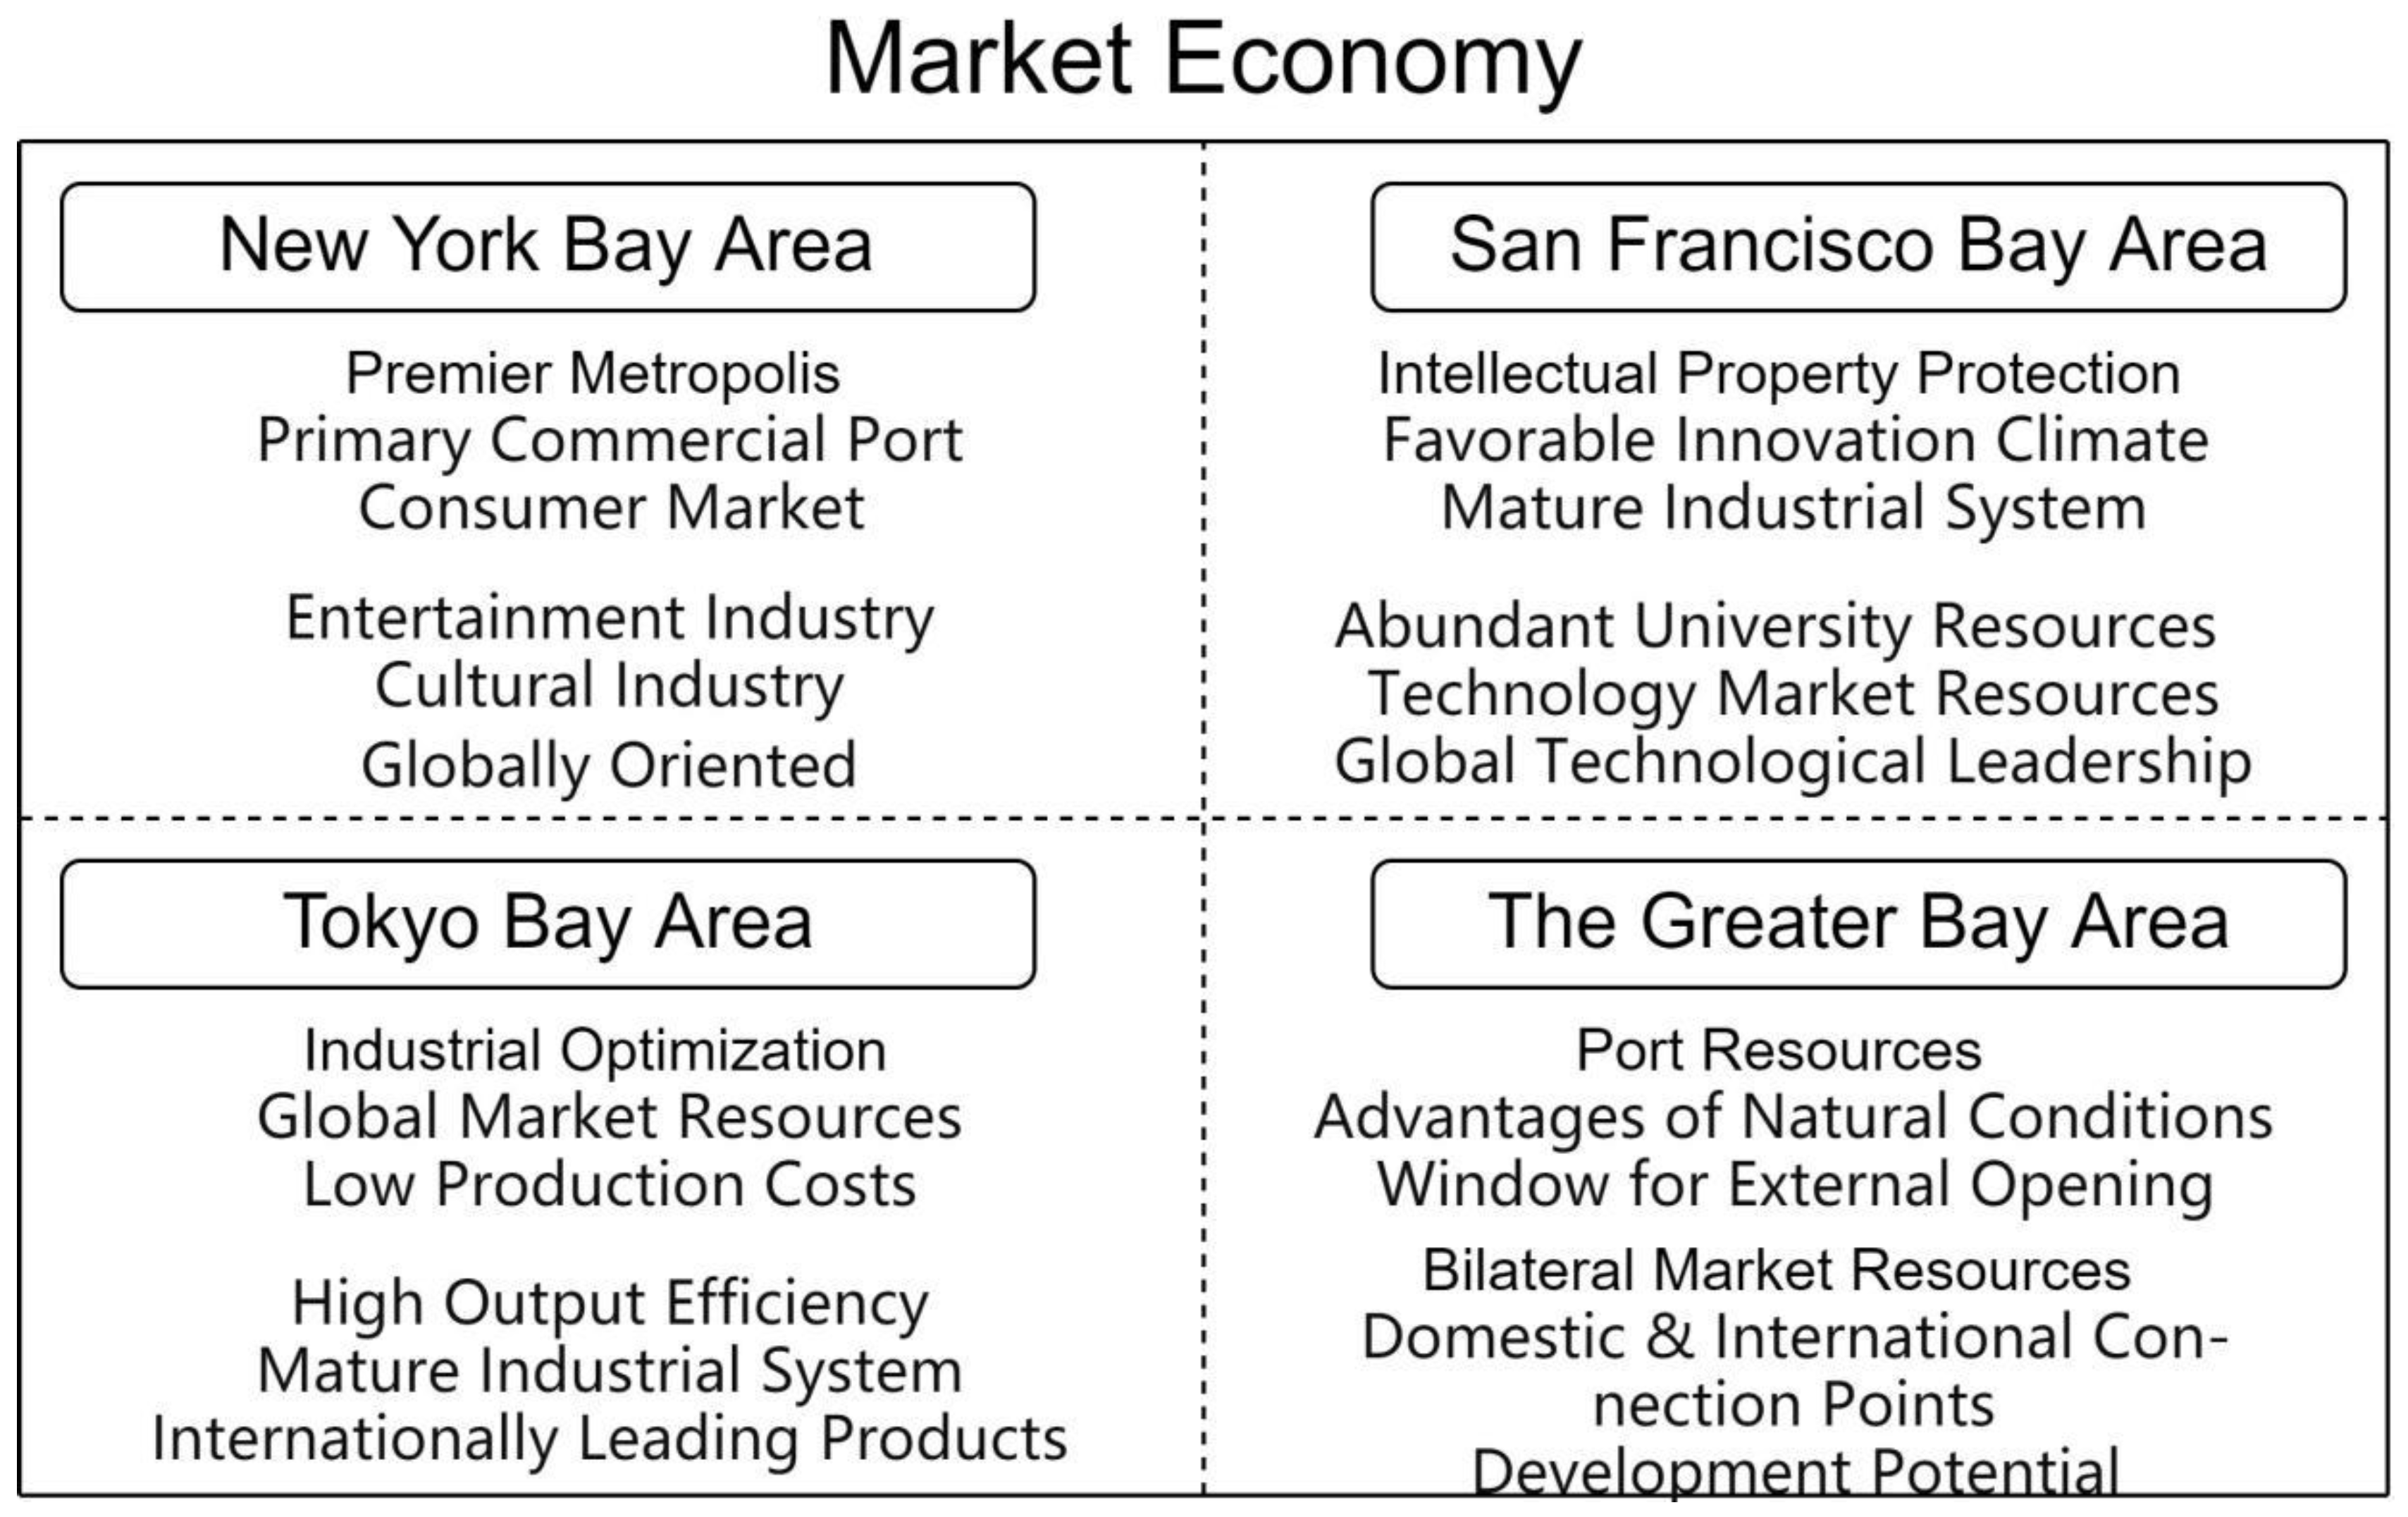
Regarding the market economy mechanisms, the San Francisco Bay Area significantly leans on the dynamism of the market economy and the private sector’s driving force, especially in high-tech and innovative industry sectors, with the emergence of Silicon Valley as the quintessential example. The market economy also plays a pivotal role in the New York Bay Area’s development, albeit with a stronger reliance on its financial services sector. The Tokyo Bay Area’s growth predominantly hinges on the unique symbiotic model between Japanese corporate conglomerates and the government, underscoring a more pronounced role of government intervention in economic endeavors. In contrast, China’s Greater Bay Area melds the features of the Chinese socialist market economy, where government intervention is instrumental in steering regional development. Concurrently, there is an ongoing effort to liberalize market entry, stimulate the private economy, and attract international investments. A comparison of the market economy mechanisms across these bay areas is shown in
Figure 4 [
57].
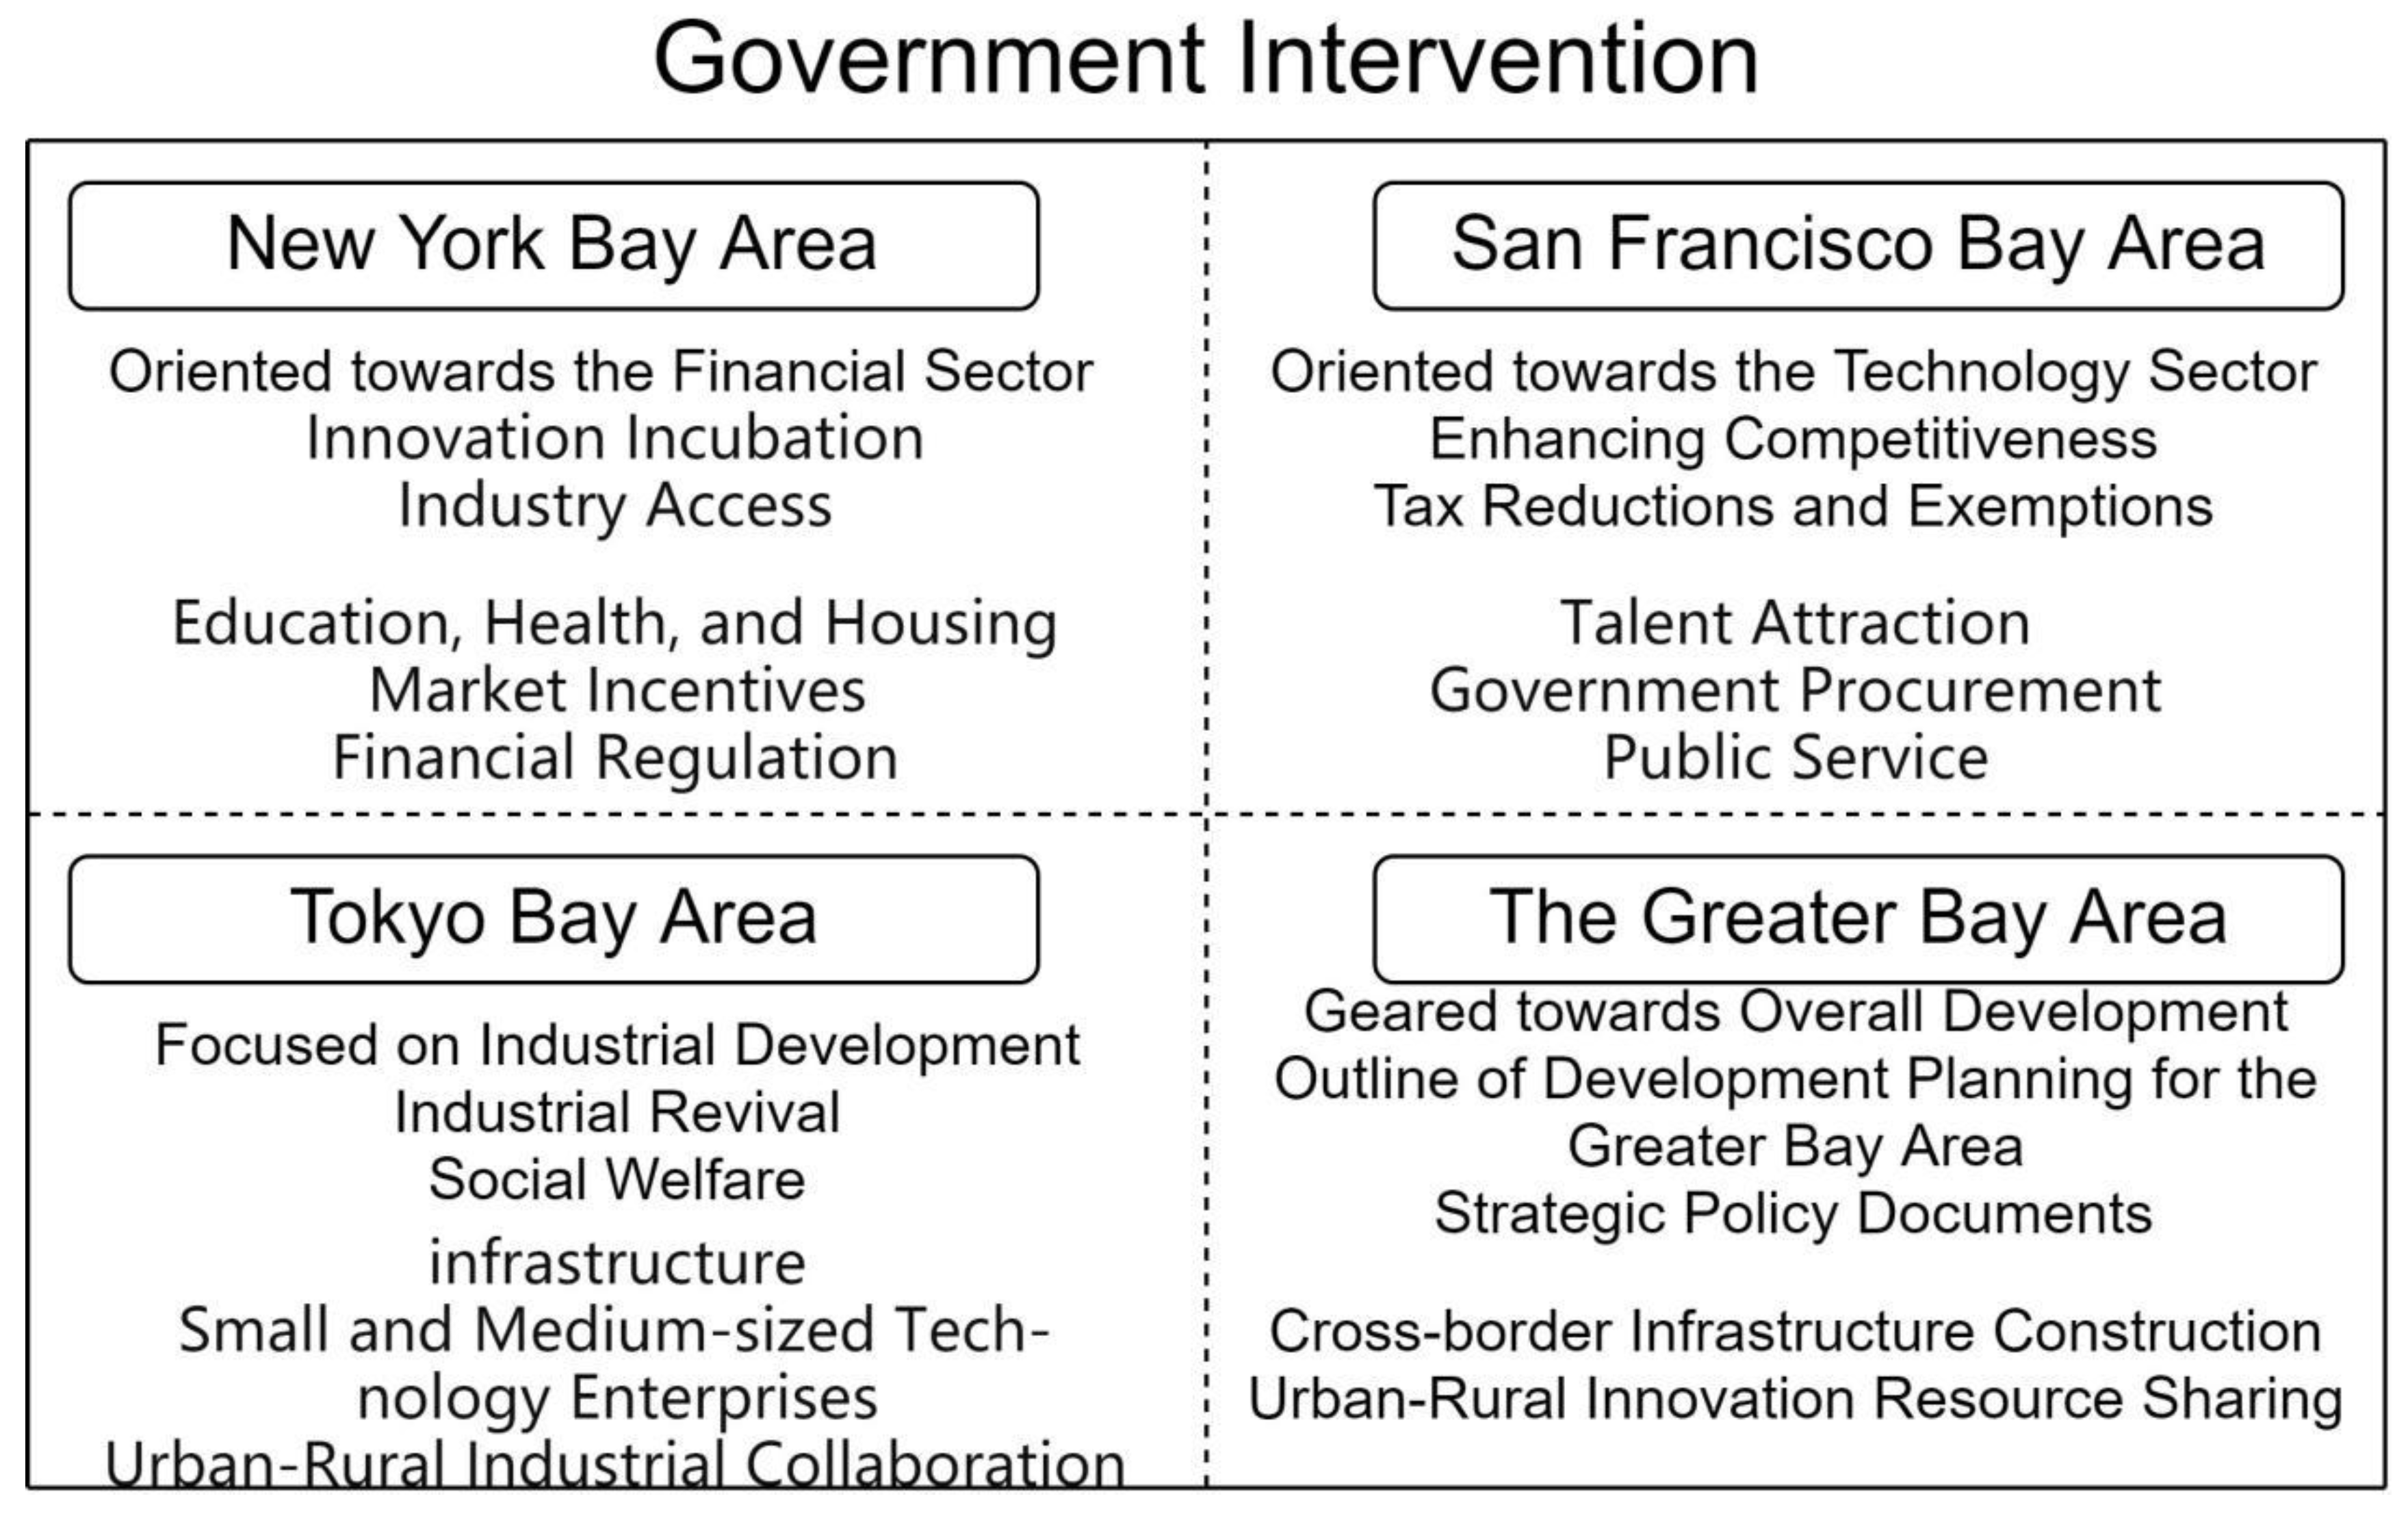
Regarding the differences in government intervention mechanisms, the San Francisco Bay Area and New York Bay Area, while dominated by market forces in economic development, have seen the government implementing a series of policies in public service sectors such as education, health, and housing to ensure equity and enhance the quality of public services. Government intervention in the Tokyo Bay Area is more pronounced not only in infrastructure development but also in guiding and supporting corporate activities as well as investing in innovation and technological development. The government in China’s Greater Bay Area has adopted active industrial and social policy interventions to promote urban–rural regional integration and economic development, including cross-border infrastructure construction and sharing of innovation resources. A comparison of these government intervention mechanisms is presented in
Figure 5 [
58].
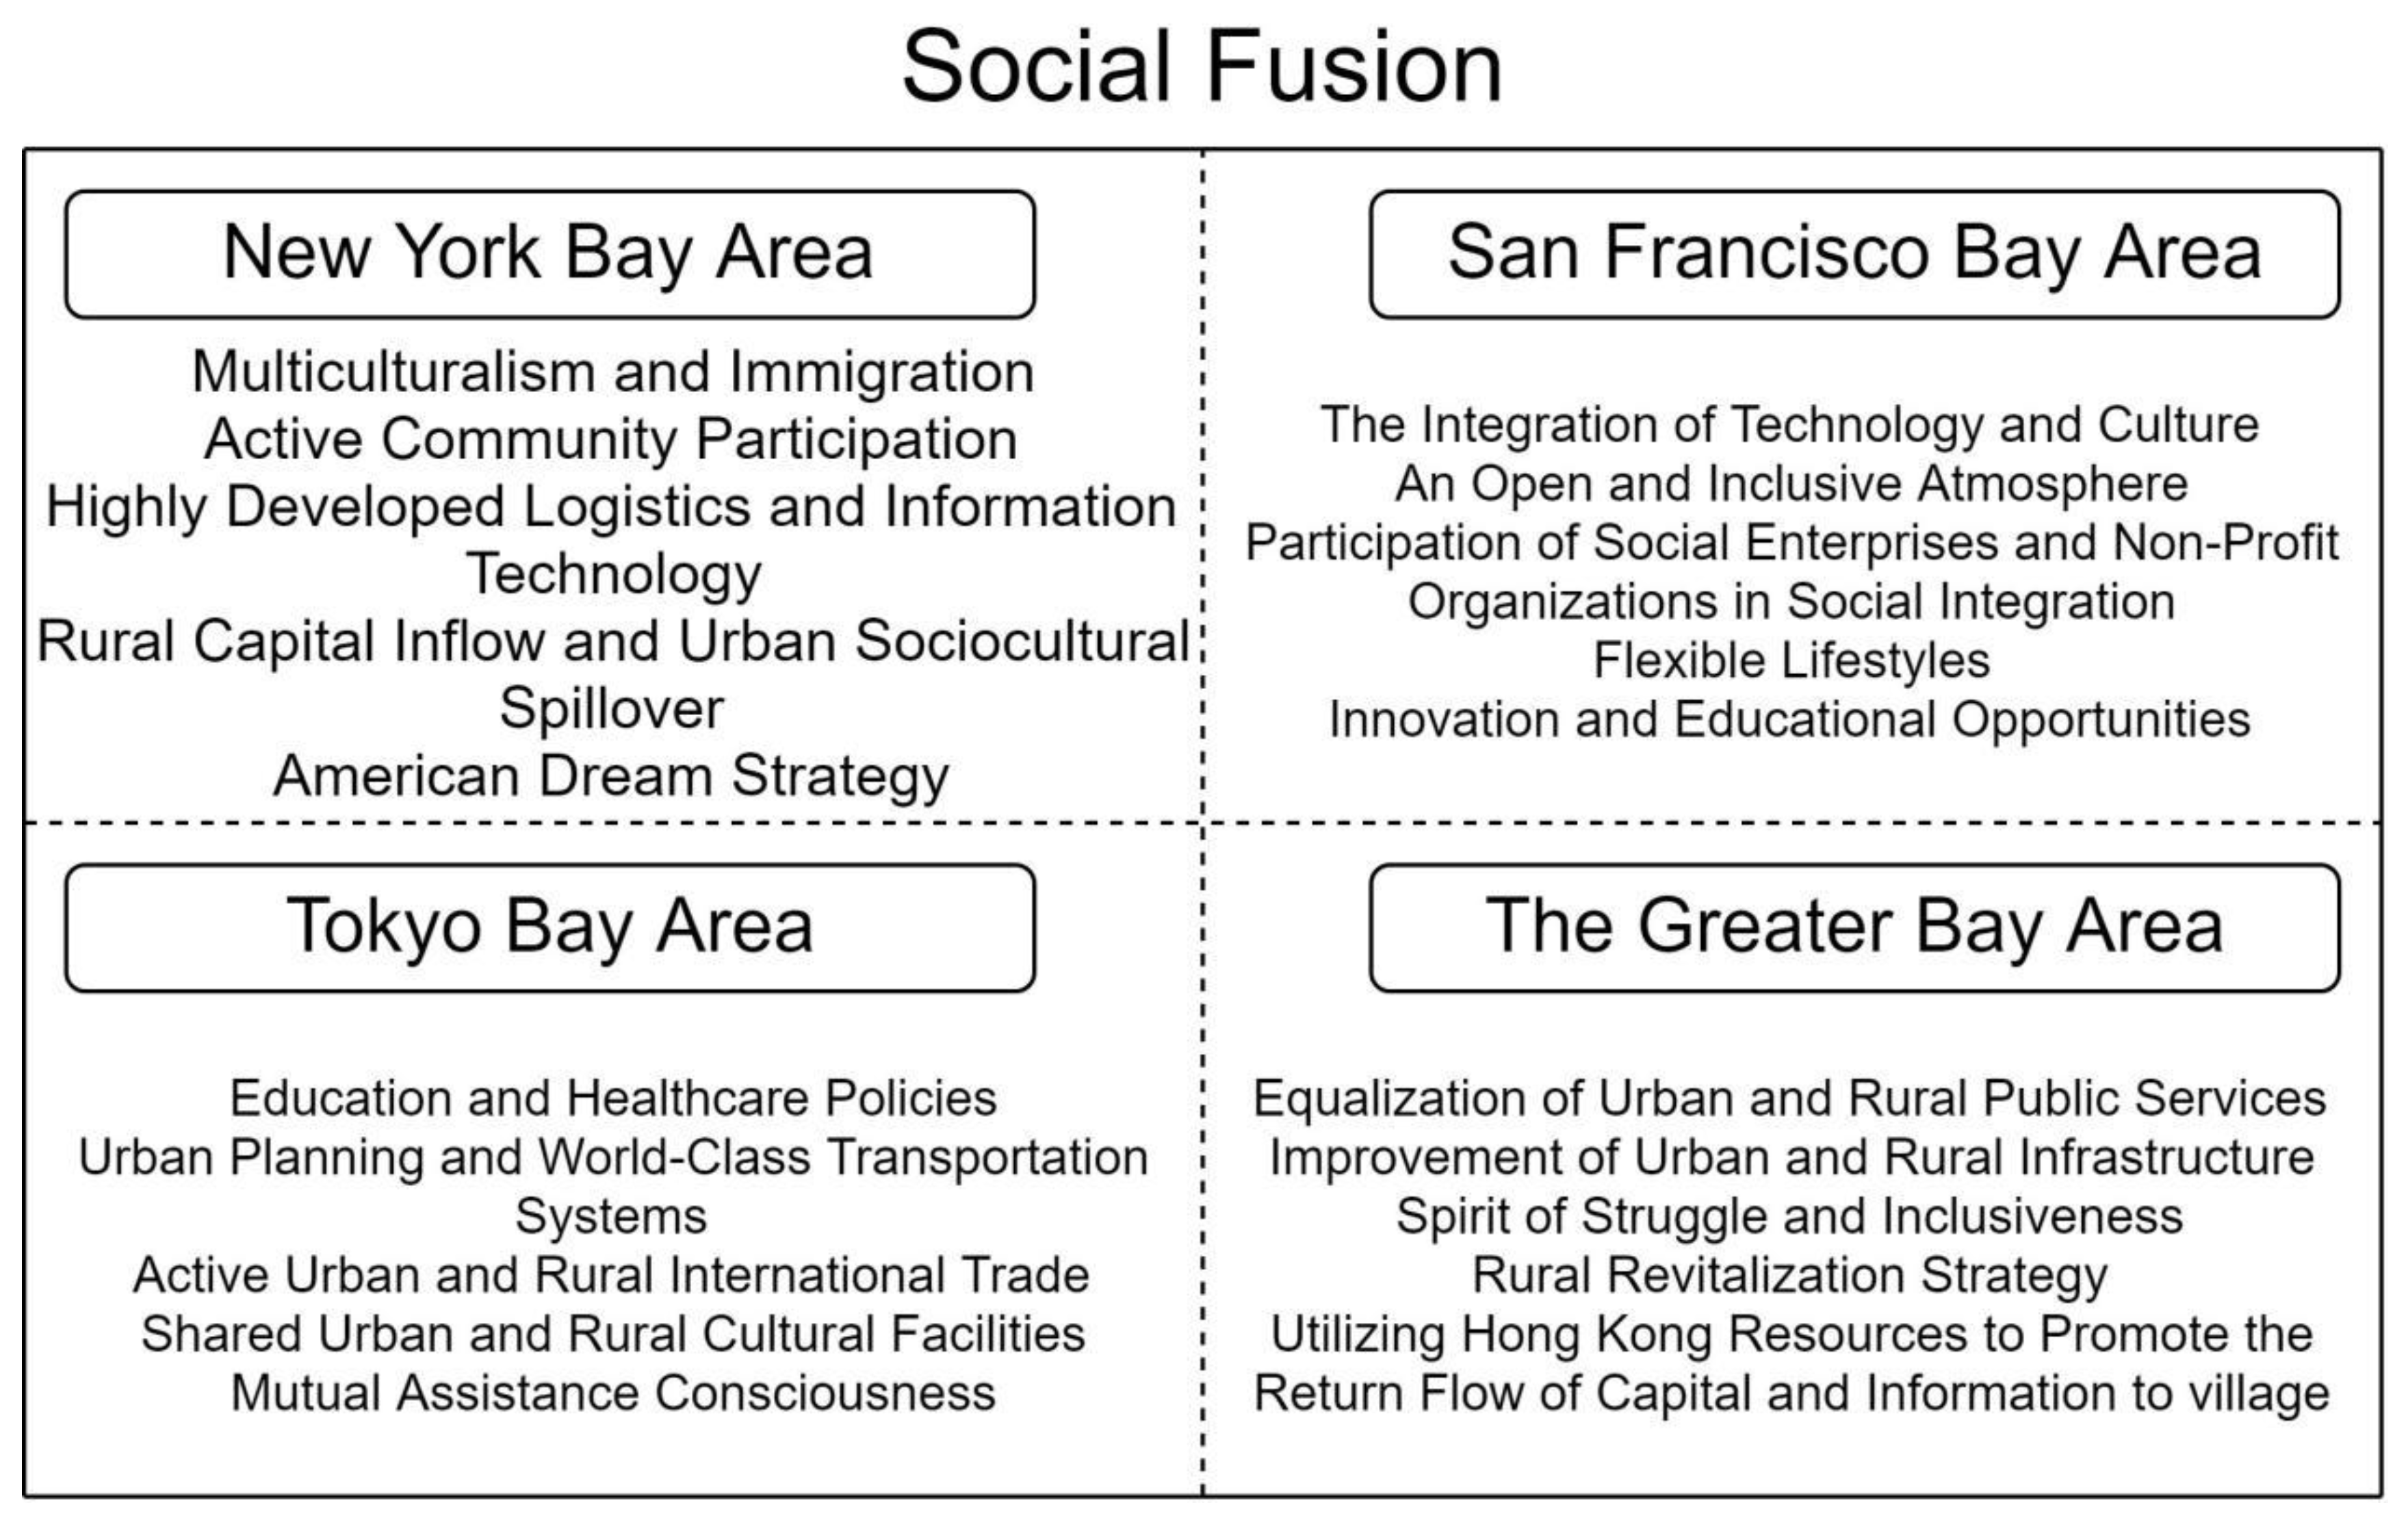
In terms of differences in social fusion mechanisms, the San Francisco Bay Area’s diversity and culture of inclusivity provide fertile ground for innovation and technological development, with social enterprises and non-profit organizations playing roles in societal integration. The New York Bay Area, with its diverse culture and active community participation, enriches social life and promotes global thinking and international cooperation. Unlike the emphasis on cultural diversity and societal openness in the American bay areas, the Tokyo Bay Area showcases a harmonious coexistence of Japanese tradition and modernity, where social policies and planning, social order, and civic consciousness play crucial roles in the urban–rural integration process. The Greater Bay Area of China possesses unique cultural diversity and potential for social integration, combining the international perspective of Hong Kong and Macau with the cultural traditions and innovation capabilities of mainland cities, bringing innovative vitality and diversity to the region’s development. Additionally, China is fully advancing the equalization of urban and rural public services and the Rural Revitalization Strategy, narrowing the gap in cultural life between urban and rural areas. A comparison of social fusion mechanisms is shown in
Figure 6 [
59].
In summary, the New York Bay Area is predominantly market-driven, emphasizing the integration of economic diversification and cultural diversity, with urban–rural integration reflected in the wide coverage of economic opportunities and social welfare. The San Francisco Bay Area, driven by technology and innovation, achieves urban–rural integration primarily through the diffusion of technological innovation and the knowledge economy. The Tokyo Bay Area’s urban–rural integration is mainly manifested in promoting the development of suburbs and surrounding satellite cities to achieve a more balanced population and economic distribution, fostering regional integration by improving transportation networks and providing public services. The Greater Bay Area of China emphasizes promoting urban–rural integration through institutional innovation and open cooperation and driving economic development through technological innovation and industrial upgrading while promoting the integration of cultural life within the region through the equalization of basic urban and rural public services, emphasizing the triple role of market order, government guidance, and social fusion in promoting balanced urban–rural development.
Therefore, the experiences of other bay areas offer the following insights for the urban–rural integration development of China’s Greater Bay Area: The Greater Bay Area should enhance the decisive role of the market in resource allocation while ensuring government guidance and support in key areas and infrastructure construction. By encouraging private enterprises and international investments, especially in high-tech and innovative industries, economic structure optimization and upgrading can be promoted. Strengthening regional policy coordination and integrated development, eliminating administrative barriers, and promoting resource sharing and industrial complementarity are crucial. The government needs to adopt proactive policies to promote urban–rural integration, improve rural infrastructure and public services, and foster an organic combination of economic and social development. Meanwhile, strengthening cultural exchanges and integration, respecting and protecting cultural diversity, and promoting common values and social cohesion are essential. Leveraging the advantages of internationalization to promote open and inclusive cultural policies and international cooperation can enhance the region’s global competitiveness and attractiveness.
6. Conclusions and Implications
6.1. Conclusions
Urban–rural integration is fundamental to China’s socio-economic development and is a pressing demand of the people for a better life. Therefore, it is crucial to grasp the development trends and levels of urban–rural integration, identify its influencing factors, and improve the driving mechanisms of urban–rural integration development. Viewing villages and cities as a community with a shared destiny, we must gradually advance urban–rural integration towards sustainable development. Based on the above analysis, this study concludes the following:
First, from 1986 to 2022, urban–rural integration development in the Greater Bay Area steadily advanced, showing increasing effectiveness. The level of urban–rural integration development in various regions fluctuated upwards. Industrial integration started high and developed rapidly; population integration began low and developed steadily; cultural life integration started with a negative index and developed slowly. The development curve of urban–rural integration is closely aligned with industrial integration, suggesting a significant contribution of industrial integration to urban–rural integration. Currently, the curve of population integration aligns with the urban–rural integration development curve, indicating the emerging role of population integration. However, cultural life integration has not yet unleashed its force in promoting urban–rural integration development.
Second, market economy, government intervention, and social fusion significantly impact urban–rural integration, with the market economy having the greatest effect. Over time, the market economy mechanism has consistently exerted a positive influence, with the effect coefficient showing a trend of “strengthening-weakening-re-strengthening”. Government intervention always shows a significant positive impact, but its effect coefficient has declined in the later stages. The impact of the social fusion mechanism has not been fully unleashed yet, showing a “suppression-promotion” trend with a relatively low effect coefficient.
Third, each region has different strategies and priorities in promoting urban–rural integration. The core areas mainly rely on market forces supplemented by government action, the satellite areas focus on the dual role of the market and government, and the peripheral areas mainly depend on government intervention. Balancing the roles of the market and government is essential, and enhancing the mechanisms of social fusion is needed.
Fourth, all three urban–rural integration driving mechanisms exhibit threshold effects, necessitating the management of the optimal range of mechanism supply. The effect coefficient of the market economy is consistently significant and positive, strengthening as it crosses the threshold, showing a “strengthening-re-strengthening” trend. Government intervention always produces a significant positive impact on urban–rural integration, but its effect weakens after crossing the threshold, indicating a “strengthening-weakening” trend. This suggests that the government needs to control the degree of intervention. When social fusion is below the threshold, it negatively affects urban–rural integration development; after crossing the threshold, it turns positive, showing a “suppression-promotion” trend.
Fifth, the explanatory power of the interaction of any two driving mechanisms of urban–rural integration development is stronger than that of a single mechanism. This indicates that urban–rural integration development results from multiple influencing factors working together. In urban–rural integration and its subsystems, the regression coefficients of the combined interaction of market economy, government intervention, and social fusion are the highest. The impact strength of different mechanisms varies in each integration subsystem, and mechanisms should be chosen and combined according to specific situations.
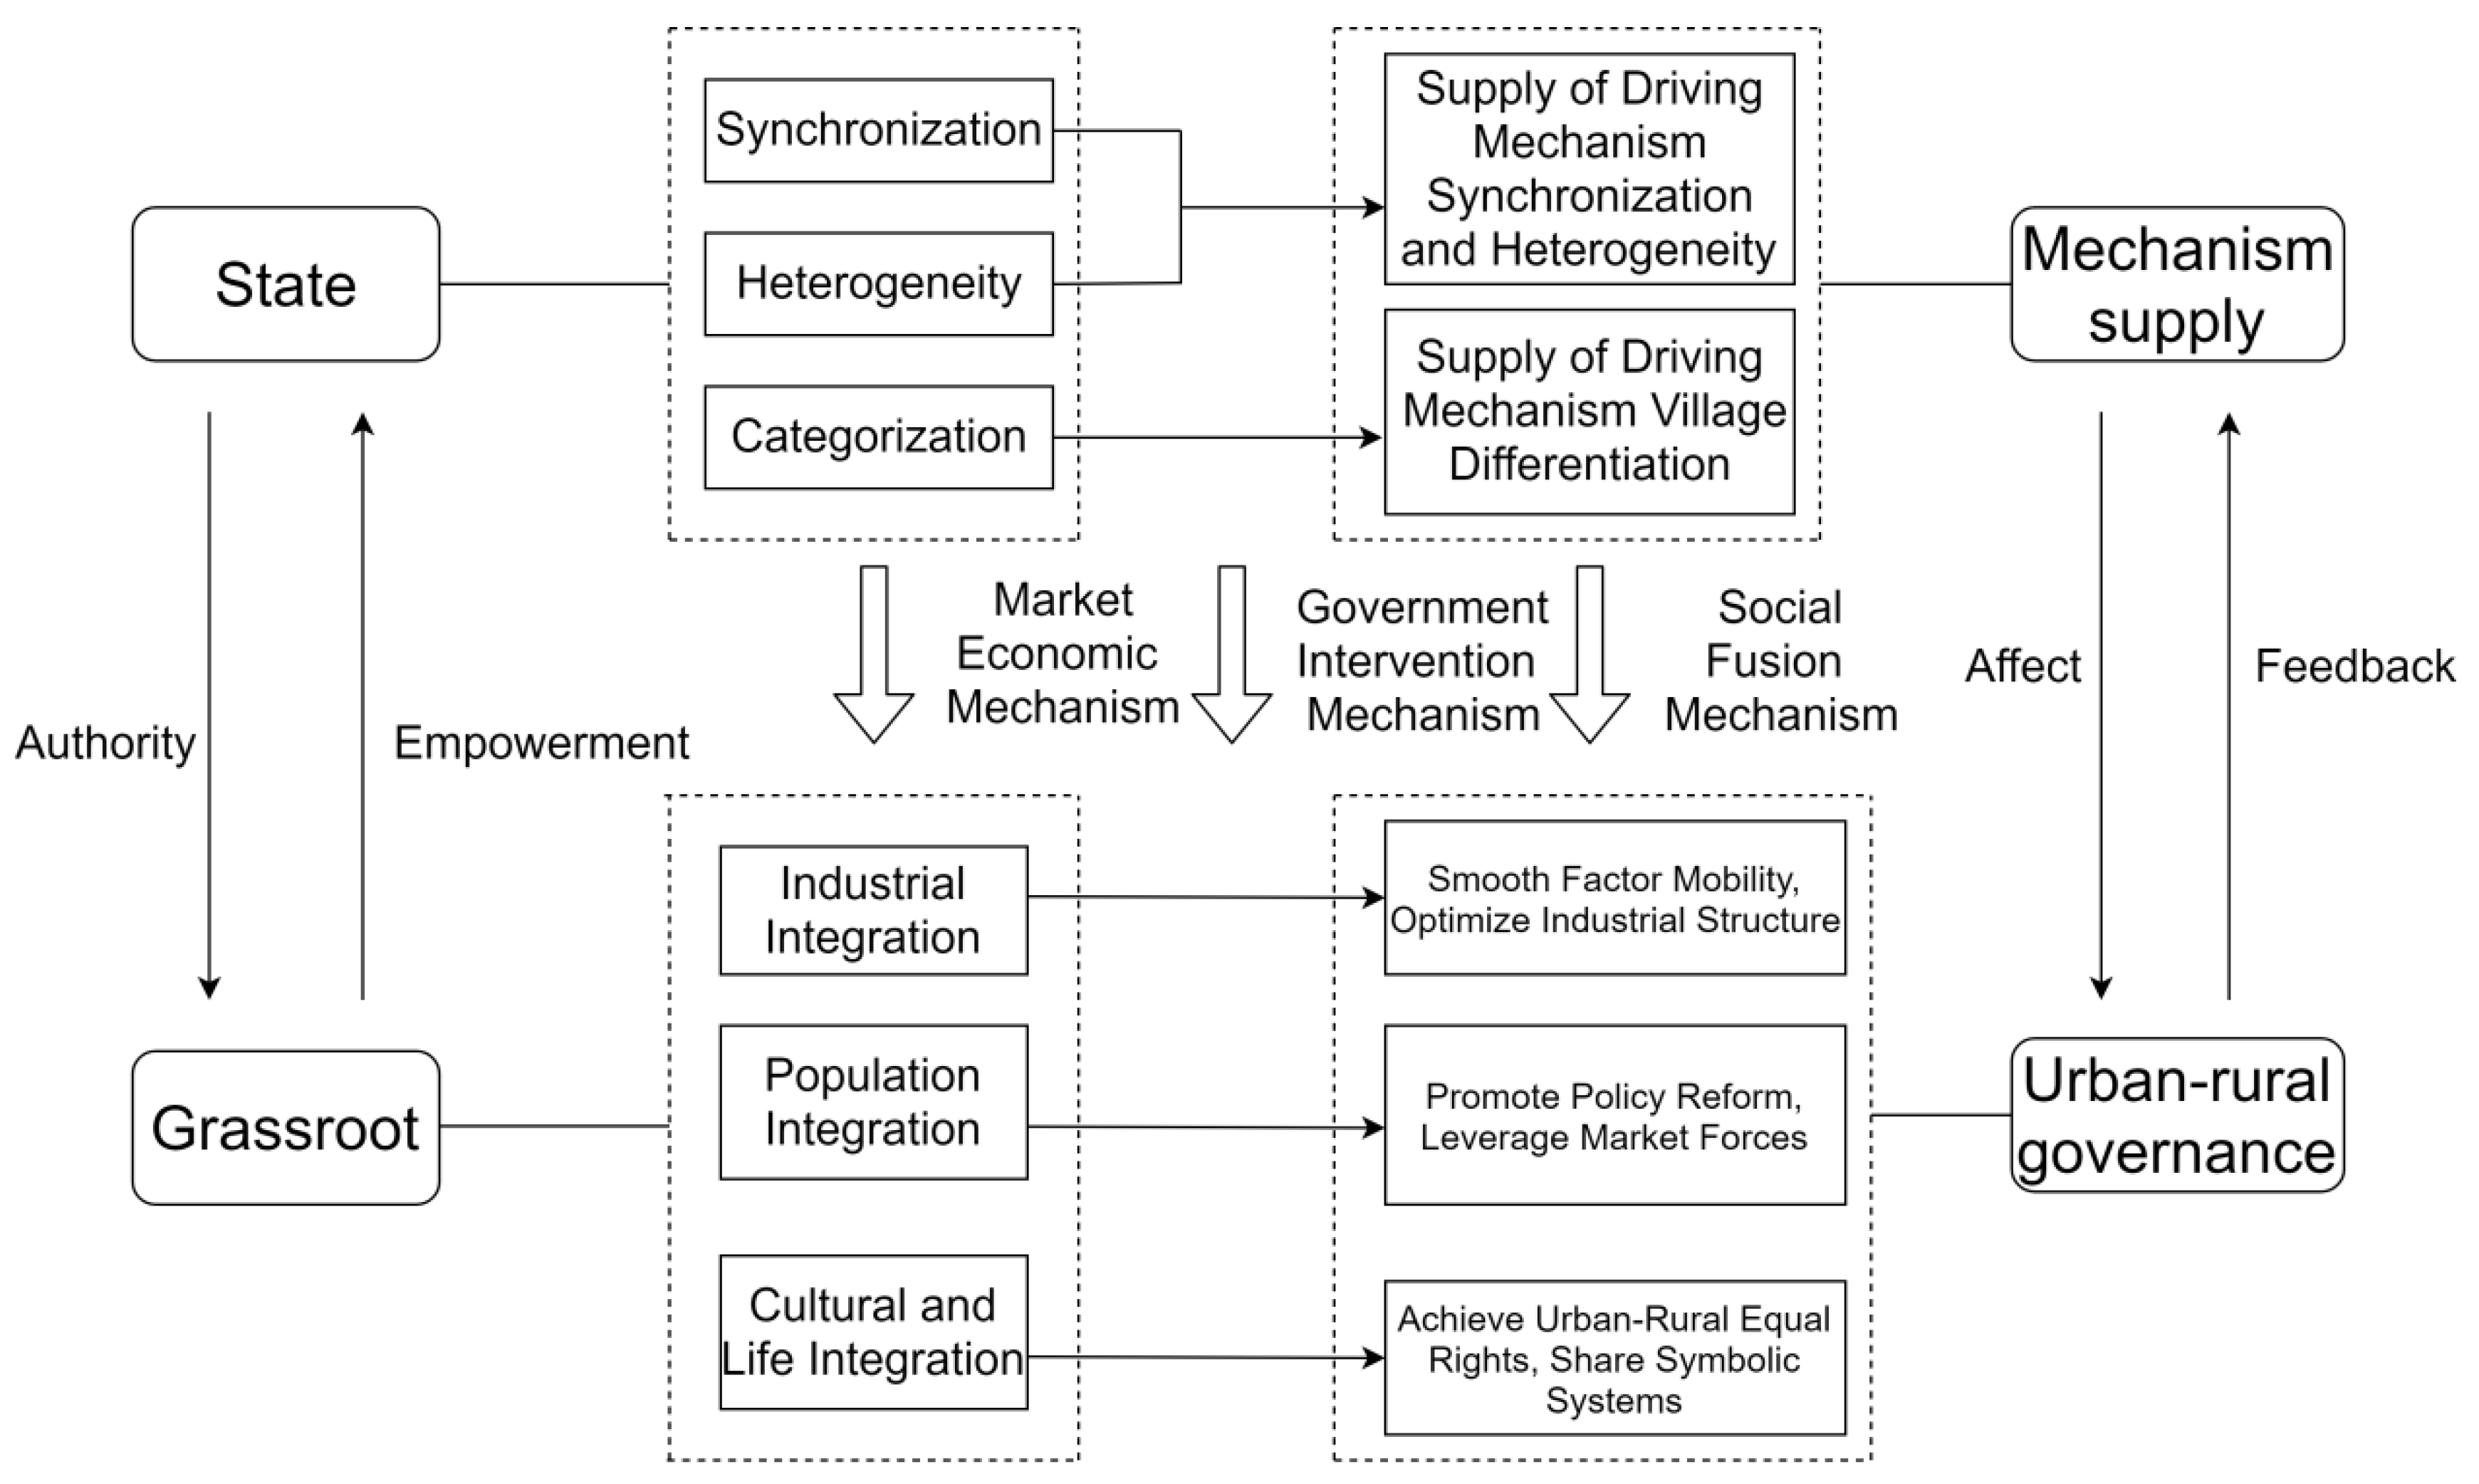
Sixth, the realization of urban–rural integration requires the implementation of urban–rural integration driving mechanisms in accordance with the principles of “synchronization, heterogeneity, and categorization”. The government needs to simultaneously use market economy mechanisms, government intervention mechanisms, and social fusion mechanisms rather than relying on a single driving mechanism. For industrial integration, population integration, and cultural life integration, it is necessary to provide empowerment-based supply according to the characteristics of the three types of integration rather than equal proportion supply. Based on the uniqueness of core areas, satellite areas, and peripheral areas, we should provide regionally differentiated and categorized driving mechanism supplies. We need to strive to achieve the following three principles: facilitate the flow of elements and optimize the industrial structure; promote policy reforms and leverage market forces; and achieve urban–rural equal rights sharing a common symbolic system (
Figure 7).
6.2. Implications and Limitations
Urban–rural integration development essentially breaks down the traditional urban–rural dual system, placing cities and rural areas on an equal footing. It maximizes the advantages and functions of both, enabling bidirectional flow of production factors, rational distribution of productivity, and equitable allocation of public resources, forging a path of mutual benefit and win–win cooperation between urban and rural areas. Urban–rural integrated development does not imply identical development of urban and rural areas but stresses a unified market, integrated systems, and shared culture between them. It is not a zero-sum game of one side’s loss being another’s gain but is instead a symbiotic process of shared outcomes between urban and rural areas.
The development of urban–rural integration is not only crucial for the welfare of the global population but also pivotal for the future of world development. The future trend of urban and rural development is inevitably towards complete integration, where the talents of all members of society are fully developed through urban–rural integration. The opposition between urban and rural areas began with the transition from barbarism to civilization, from tribal systems to nation states, and from regional limitations to national transitions, and it has pervaded all of civilization’s history until now. In other words, transitioning from urban–rural opposition to urban–rural integration is a long historical process. We must deeply understand the changes in urban–rural relationships and their practice, scientifically grasp the trends of urban–rural development, promote coordinated and integrated urban–rural development, and strive to form a new type of urban–rural relationship where industry promotes agriculture, cities lead rural areas, and urban–rural integration is achieved. Efforts should be made to realize the concept of “beauty in each, shared beauty for all” between cities and rural areas; bridge the “last mile” of social governance; and build a new model of urban–rural integrated development where industries are co-constructed, people live together, and culture is shared.
This study investigated the level of urban–rural integrated development, its influencing factors, spatiotemporal evolution, and driving mechanisms and initially proposes an explanatory framework for industrial integration, population integration, and cultural life integration. The veracity of these findings awaits further validation and may contain omissions, such as overlooking the integration of urban–rural environments and spatial integration, which can be further explored in future research. Moreover, this paper uses only eight cities from the Guangdong–Hong Kong–Macao Greater Bay Area as a case study to explore the factors and mechanisms driving urban–rural integration, and the universality of the conclusions requires further verification and in-depth research. Future studies could try to incorporate new influencing factors and control variables to refine the conclusions of this paper.


 ,
, 


