Article

How Do We Move towards a Greener and Socially Equitable Future? Identifying the Trade-Offs of Accepted CO2 Pricing Revenues in Germany

Human-Computer Interaction Center, RWTH Aachen University, Campus-Boulevard 57, 52074 Aachen, Germany
*
Authors to whom correspondence should be addressed.
Sustainability 2024, 16(8), 3378; https://doi.org/10.3390/su16083378
Submission received: 18 March 2024 / Revised: 12 April 2024 / Accepted: 15 April 2024 / Published: 17 April 2024
(This article belongs to the Section Economic and Business Aspects of Sustainability)

Abstract

:
The world faces urgent sustainability challenges and international agreements call for policy change. CO2 pricing is an effective way to reduce greenhouse gas emissions and allows us to find innovative ways to cover these emission sources, addressing environmental, economic, and social sustainability through the targeted use of revenues. In order to design a publicly acceptable pricing concept, this study empirically examines the public perceptions of CO2 pricing in Germany, preferred revenue recycling schemes, and socio-psychological differences following its national implementation. In a choice-based conjoint measurement, we simulated the interplay of influencing factors (revenue reinvestment, climate effects, and scale of action) in a comprehensible choice task (n = 1209). The results show that revenue reinvestment has the highest importance for the acceptance of CO2 pricing, followed by the climate effect, and confirm that the individual financial burden is a significant obstacle to achieving government climate goals. The findings help policymakers to understand the public’s motives and demands for accepted carbon pricing options, and support management recommendations for policy and governance to work towards a sustainable transformation. However, to achieve global sustainability outcomes, it is imperative that such studies are conducted worldwide, as comparisons with previous studies reveal local differences in needs and preferences.

1. Introduction

The world is facing sustainability challenges of urgent importance, and international agreements call for political change. To address the global consequences of global climate change, the United Nations committed itself in the Paris Agreement to limiting global warming to a maximum of two degrees Celsius [1]. Achieving this requires sustainable action strategies that meet the needs of present and future generations while allowing the biosphere to absorb the impacts of human activity [2]. The signatories to the Paris Agreement agree on the need to reduce greenhouse gases, including CO2. However, the specific design and financing of these strategies are left to the discretion of the signatory nations [1].
Putting a price tag on CO2 to uncover its harmful effects has been identified to be an essential policy measure to tackle climate change [3]. As recommended by economists, CO2 pricing does not simply reduce CO2 emissions without setting technological constraints, thereby creating unnecessary bureaucratic hurdles [4,5,6], but also generates revenues that can be used for a sustainable societal transformation in the form of environmental projects, technological innovation, tax reduction in other sectors, or compensation of social inequities [3]. At the beginning of 2021, Germany took a step forward in expanding the effective pricing of greenhouse gases from the energy and industrial sectors to the building and traffic sectors to make climate-friendly technologies and conversion work more attractive [7]. The government employed CO2 pricing as part of a CO2-oriented Reform of the Energy levies, taxes, and apportionments (CORE) system for the buildings and transport sectors. The incentives are to significantly reduce CO2 emissions and trigger a steering effect towards more environmentally friendly forms of energy and products. The price was initially set at EUR 25 per ton of CO2 and is to be gradually increased to EUR 55 per ton of CO2 by 2025 [8,9].
A lack of public support has been shown to be a major barrier to national climate policy [10]. As we know from prior CO2 pricing implementations in other countries, public acceptance tends to be low in the beginning but might improve over time as people experience the actual costs and benefits of CO2 pricing [11,12]. In addition, Bristow et al. [13] argue that the degree of preference for CO2 pricing depends on the specifics of its implementation, highlighting the importance of careful design. From a social science perspective, the question remains as to how to overcome the initial lack of acceptance and understand the assessment of the different options to design suitable CO2 pricing that takes acceptance patterns as a basis for diligent information and communication concepts. Any changes in the way societies implement the energy transition severely affect social habits, the way of thinking, and the consequences for the public. Identifying acceptance patterns and potentially controversial perspectives is therefore essential for effective policy and public communication [14,15,16]. In this context, the participation of citizens in the implementation of climate change measures is a critical issue of acceptance and success in scientific debate [17,18].
This study empirically examines public perception and the level of acceptance of CO2 pricing in Germany. The aim was directed to the questions “Under what circumstances is CORE considered more or less acceptable?” and “What compensatory measures (CM) are likely to increase and/or decrease acceptance?”.
In the following, we first provide a theoretical overview of existing research on CO2 pricing; we address its implications for consumers, considering public perceptions and acceptance levels, barriers, and boosters. Subsequently, we describe the method used and report the results regarding CO2 pricing model acceptance in Germany. Finally, we discuss the implications of the results in a socially relevant context.

2. CO2 Pricing and Its Implications for a Sustainable Transformation

Sustainable development is defined as a “development that meets the needs of the present without compromising the ability of future generations to meet their own needs” ([2], p. 37). It is often discussed conceptually as economic, environmental, and social sustainability, although this conceptualization lacks a theoretical foundation. Nevertheless, these three pillars of sustainability have emerged as relevant from a common academic perspective [19]. CO2 pricing addresses all aspects of sustainability, as will be elaborated upon in this section.
CO2 pricing, like environmental taxes in general, is a Pigovian tax [20]. As such, it functions as a counterbalance to correct market failures by implementing a shift towards more environmentally friendly CO2 usage without imposing constraints on industry [21]. Firstly, CO2 pricing has a direct impact on CO2 emissions. To keep costs down, carbon pricing incentivizes the implementation of all available means to reduce CO2 emissions in the provision of services and goods, considering all aspects of the production and service provision, including the resources chosen and their efficient use, as well as the overall structure of industrial sectors [3]. Secondly, pricing indirectly reduces CO2 emissions by increasing the motivation of households and industries to promote new, innovative, and environmentally friendly technologies and business models [22]. Thirdly, revenues from CO2 pricing may be used to additionally foster green technological progression [21]. Fourthly, it can reduce socioeconomic inequalities. Taken alone, CO2 pricing is often regressive and may disproportionately affect low-income households without countermeasures [23,24,25]. However, the reinvestment of CO2 pricing revenues in social equity measures can counteract the regressive tendencies or even turn them into progressive ones [6]. In addition, commuters or residents of energy-inefficient, older, or unmodernized buildings, who are financially overburdened by their living conditions, may benefit from the revenue sharing.
Finally, Seghezzo [26] presents an additional definition of sustainability and argues that sustainability should not be seen in the triad of Planet, People, and Profit that underlies the notion of environmental, social, and economic sustainability, but rather in the triangle of Place, Permanence, and Person. According to this conceptualization of sustainability, any assessment of sustainability must take into account the subjective perspectives of societies and individuals, their perceptions of their environment, and the needs and developments of future generations, all of which are highly intertwined [26]. Acceptance and preference analysis, as can be provided by the social sciences, can provide the individual and societal perspectives that should be an integral part of the design of sustainable CO2 pricing.

3. Public Perception and the Acceptance of Alternative Arrangements for CO2 Pricing

So far, little is known about public acceptance levels of the actual implementation of CO2 pricing in Germany. In 2019, shortly before the German CO2 pricing reform, Jagers and colleagues [27] conducted a comparative survey study on public acceptance of CO2 pricing with participants from the USA (n = 3072), Canada (n = 3005), and Germany (n = 3011). Their findings revealed that Germany had lower public acceptance of CO2 pricing than Canada and the USA. Similar findings were revealed by Beiser-McGrath and Bernauer [28], who conducted a choice-based online experiment among German and American citizens. They determined a significantly lower acceptance of higher tax rates among German citizens compared to Americans. In the same year, another study on climate change awareness and the acceptance of environmental policy measures was conducted in Germany (n = 970) and Poland (n = 999) [29]. Results indicate that climate change mitigation received widespread support in both countries: 93% of the respondents accepted additional fees to cover decarbonization costs, both in Germany and Poland. Yet, the introduction of CO2 pricing had the lowest support among environmental protection measures. This may be traced back to the negative attitude towards taxes in general, which can be grounded on the public perception of their function [29].
Acceptance studies in the food sector have shown that taxes are strongly perceived as governmental patronization and as the illegal profits of the state, often disregarding the protective function that governmental prohibitions bring about [30]. In this context, political trust has been identified to be a strong predictor of CO2 pricing acceptance [31,32,33]. Compared to prohibitions, the perception of taxes contradicts the idea of fairness as they appear to disproportionately burden low-income households, whereas prohibitions apply equally to all [30]. This general assumption has been proven to also apply to CO2 pricing, with the perceived fairness being a significant moderator in the dependency of tax design and public acceptance [10,27,32,33,34]. Thus, the objective fairness of CO2 pricing heavily depends on the applied design. Mattauch et al. [35], only months before the introduction of CO2 pricing in Germany had been decided, conducted an online choice experiment among a representative German sample to examine the influence of revenue use on the acceptance of CO2 pricing. They identified investments into green projects as sustainable transportation to be the most preferred revenue use for low tax rates (EUR 10/t CO2). The higher the tax rate, the more popular direct revenue redistribution became. When restricted to direct revenue redistribution, participants preferred lump-sum over directed support of burdened or poor households.
A qualitative study conducted in Germany in 2006 revealed that the environmental tax reform was not fully understood, because people still tended to have strong attitudes towards it, whether positive or negative [36]. This result allows the conclusion that—although it can be moderated by knowledge if present [6,10,28,31]—acceptance is largely determined by affective parameters in terms of attitude towards the climate and environment, political attitudes, costs, social norms, and perceived fairness (e.g., [10,27,29,34,35,37,38,39,40,41,42]). Their influence on acceptance has been shown to be even stronger than that of action-related parameters such as perceived current CO2 production and the potential to reduce one’s own CO2 footprint [42]. Affective parameters are conveyed by quality, resilience, and honesty of public communication [18], going as far as terminology, and have a significant impact on acceptance levels [6,32]. Regarding political attitudes, research has revealed that left-oriented people show higher acceptance levels than right-oriented [10,27], and that political orientation moderates political trust [31]. Regarding attitudes towards climate and the environment, people who declare higher relevance or even emotional bonds towards the environment and climate are more willing to accept political climate measures (e.g., [37,39]). Support for the relevance of feelings can also be found in the previously mentioned comparative study on acceptance levels in Germany and Poland, in which valid predictors of support of renewable energy, energy efficiency, and CO2 pricing were exclusively based on feelings, such as awareness, emotional responses to the climate crisis, sense of control, and belief in the effectiveness of solutions [29].

Research Questions and Aims

In this study, we provide an overview of the prevailing public perception and the level of acceptance of CO2 pricing in Germany shortly after its implementation. We empirically approached this topic based on the following research questions:
-
RQ1: Which design factors of a CORE most strongly shape the citizens’ perception of it?
-
RQ2: What trade-offs or weightings between acceptance criteria are carried out in the evaluation of CORE design alternatives and do the assessments vary in different societal groups?
-
RQ3: How is the measure of CO2 pricing publicly perceived and assessed?
As derived from the literature, public assessment of acceptance is primarily influenced by affect heuristics [43]. To save mental or time resources, in complex decision-making situations, individuals make an affective assessment (like vs. dislike) that shapes the acceptance decision and is not necessarily conscious. Therefore, in this study, we used the approach of conjoint analysis to uncover these subconscious decision patterns of the social acceptance of CO2 pricing by simulating the complex interplay of several factors in a comprehensible and realistic choice task [44,45]. In this way, we obtained results with comparably higher validity compared to conservative methods that focus only on isolated factors [46].
In the next step, we delineate in detail the approach that we used to operationalize the research questions and describe participants who took part in the study, sharing their opinions on social acceptance of CO2 pricing.

4. Methodology

In this section, we first describe the characteristics of conjoint analysis and present our selection of attributes considered relevant for measuring the acceptance of CO2 pricing. In the next step, we refer to the online survey design and detail the characteristics of our participants. Descriptions of data analysis close the method section.

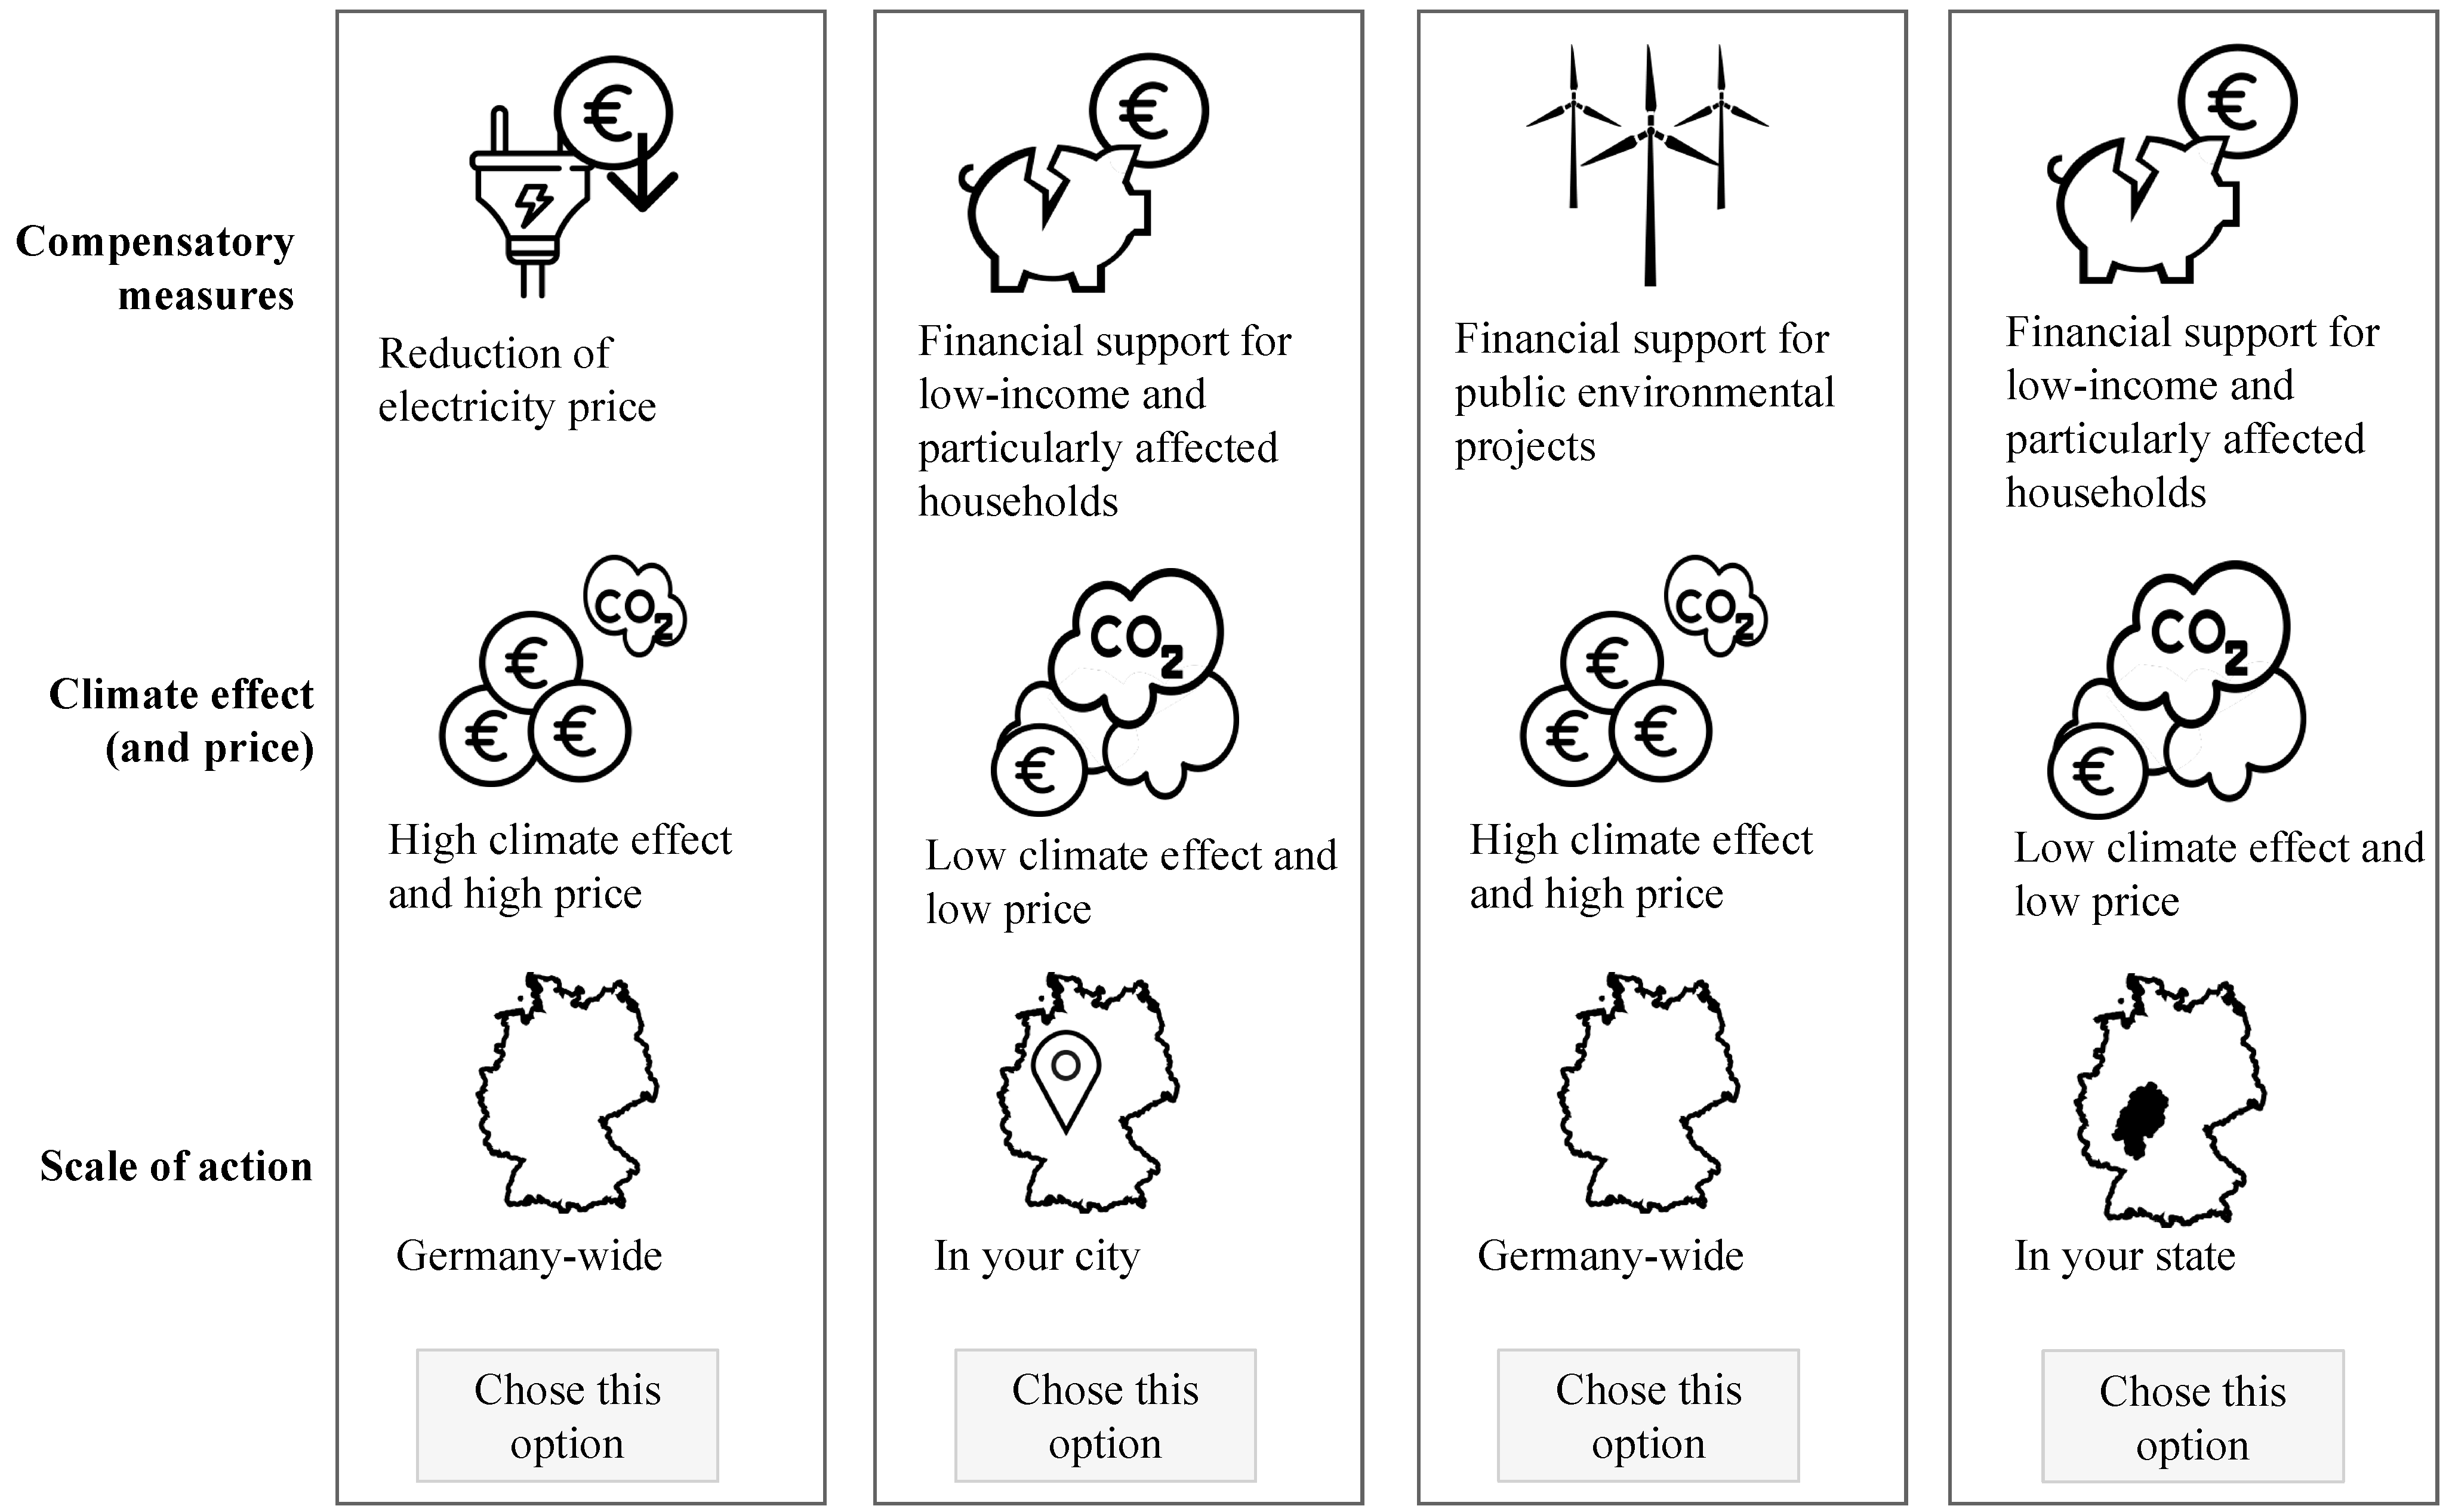
4.1. Conjoint Measurement and the Selection of the Used Attributes

The quantitative method of conjoint measurement originated from Luce and Tukey [47] and was initially applied mainly in the economic field, especially in marketing research [48]. The main goal is to explain and predict preferences that result in an assessment of achievement [49]. Using defined attributes and their levels, real as well as hypothetical configurations are generated, and these are evaluated by study participants. Based on the overall preference judgments, as expressed by the test persons, it is estimated which contributions the various attributes make to the overall preference [44].
In recent years, conjoint measurement has been increasingly used in various research fields, such as healthcare, transportation, and energy research, finding ever broader applications in the assessment of acceptance. For the present study, we have chosen the approach of a choice-based conjoint (CBC) analysis, which enables us to imitate complex decision processes, in which several attributes influence the final decision, appearing together in different scenario configurations [46].
According to Rao [50], the identification and selection of relevant attributes is one of the most important steps in the planning, preparation, and implementation of a conjoint study. As it impacts the generalizability and significance of our findings, we aimed for attributes with limited complexity that are relevant from the social, political, and communication science perspectives. For the conjoint analysis in this study, we have chosen three attributes with different numbers of attribute levels, which we describe in more detail below.
(1)
Compensatory measures (revenue reinvestments): Bristow et al. point to the particular importance of revenue usage for public acceptance when designing CO2 pricing [13], making compensatory measures a key attribute in our study. Recent research has shown that three revenue reinvestment strategies are particularly important for public acceptance of CO2 pricing [21,27,35]: (1) the earmarking of revenues to support emission reduction projects, (2) the redistribution of revenues to achieve a fair and non-regressive outcome, and (3) the reduction of other taxes to achieve revenue neutrality. Following this research in combination with the results of our previous focus group study [51,52], we have chosen five compensatory measures (reinvestment strategies) for our conjoint analysis, hypothesizing that German citizens, consistent with the results of prior studies [11,35,53,54], will favor earmarking strategies, followed by social equality measures and revenue neutrality:
  • Financial support for low-income and particularly affected households (social equality)
  • Financial support for private environmental projects (earmarking)
  • Financial support for public environmental projects (earmarking)
  • Reduction of electricity price (revenue neutrality)
  • Climate dividend (revenue neutrality)
(2)
Climate effect and its costs: As research has shown that the perceived effectiveness of a climate policy measure significantly affects public acceptance of that measure [6,11], the second attribute in our CBC was the role of climate effect on the acceptance of CO2 pricing. We hypothesized that higher effectiveness results in higher acceptability. However, perceiving the climate effect without the associated costs is far from reality. Citizens who tend to reject CO2 pricing [55] frequently overestimate their personal financial burden and underestimate its benefits [11]; therefore, their acceptance decision appears to be heavily influenced by direct personal costs which are compared to environmental benefits [28,31,34,55]. For this reason, we applied two variants of the survey in our study. While variant A considered the effect of climate without any further descriptions of the consequences it brings along, in variant B, we explicitly mentioned the costs linked to the climate effect (cf. Table 1). The attribute is roughly subdivided into a low climate effect (and low price), representing non-compliance with Germany’s climate targets (and not increasing the current CO2 price), a medium climate effect (and medium price), and a high climate effect (and high price), meeting and thereby even exceeding Germany’s climate targets for 2025.
(3)
Scale of action: Since revenue reinvestments in the context of CO2 pricing are a national policy measure, although their effects may also be visible or perceptible on an individual or state level, it remains unclear on which level the Germans prefer the spending to take place. While regional spending holds the potential of specifically addressing local issues, a national recycling scheme can provide a homogeneous and therefore fair policy, and as a coordinated approach, it can contribute to creating synergies between different regions and utilizing resources more efficiently.
The scale of action attribute represents the personally visible beneficial actions for the individual citizen on different regional levels. We examine how the perception of these actions influences acceptance. To our knowledge, examining the field of action is a so-far ignored attribute, but as has been discussed before, political trust is an important factor in CO2 pricing acceptance [31,32,33], and in Germany, political trust is higher in local municipalities than in national government [56]. Furthermore, German citizens, being more individualistic than collectivistic [57], support revenue recycling schemes that benefit themselves individually [58,59]. Therefore, we hypothesize that the more locally the reinvestment effects are seen and the more the individual personally benefits from it, the higher the acceptance. To operationalize this attribute in the survey, we differentiated between visible benefits throughout Germany in the state of the participant or in the city he/she is living in.
A detailed overview of the selected attributes and attribute levels used for the acceptance of CO2 pricing is presented in Table 1.

4.2. Design of the Online Survey

Data collection was achieved using an online survey, in which conjoint measurement was integrated. The census-representative online survey (quotation on age, gender, and German federal state) was conducted nationwide in the summer of 2021, using the service of a market research institute for data collection. Before implementation, the survey was pretested for comprehensibility, wording, and length of interview. Completing the survey took an average of 20 min. Participants were part of an online panel, and they were paid for their participation in the survey by the market research institute.
In the introduction, we informed participants about the main purpose of the survey, its average length, and our focus of interest to provide them with a proper background for the designed study. In addition, we assured the participants of a high standard of data protection and informed them that none of their answers could be linked to them personally. Regarding content, we reported on the effects of the greenhouse gas CO2 and the goal of the German government to reduce greenhouse gas emissions shortly. The focus thereby was laid on CO2 pricing, which was introduced by the government in 2021 as a measure meant to support the achievement of German climate targets.
The online survey was divided into three parts. In the first part, participants indicated their demographic data such as age, gender, educational level, monthly household income, and their residential area. They also provided information on their housing conditions and mobility behavior, as well as their political affiliation. Following this, the questionnaire captured attitudes toward perceived self-efficacy in political (2 items; α = 0.86) and environmental issues (7 items; α = 0.74), and also surveyed behavioral patterns related to environmental awareness (7 items; α = 0.74). Moreover, participants assessed their political system satisfaction (4 items; α = 0.81) and their prior knowledge about the CO2 pricing, energy transition, and climate goals of the government; the knowledge evaluations were assessable on a six-point Likert-scale ranging from 1 (=little knowledge) to 6 (=comprehensive knowledge). Table 2 summarizes these constructs with some item examples and the used scales.
In the second part of the questionnaire, we applied the choice tasks (choice-based conjoint approach). In this step, we collected participants’ opinions and preferences on the implementation of CO2 pricing and the measures financed by it. The different design options consisted of a combination of three attributional characteristics: (1) the compensatory measures financed by the revenues from the CO2 price, (2) the amount of the CO2 price and the related climate effect, and (3) the perceivable scale of action of all these measures to the citizens. In the first step, we introduced all attributes and attribute levels of the conjoint analysis to the participants. Regarding the choice tasks that were generated in a randomized way (an example is given in Figure 1), we asked them to choose from four alternatives the one scenario that they prefer most or feel most comfortable with. A fully crossed study design would require combinations of all possible attribute levels (in our study: 4 × 5 × 3 × 3 = 180), which would have overly burdened participants’ attention spans. However, the tool enables a reduction in the number of decision situations by having each participant go through a predetermined number of randomized decision situations. We tested the number of necessary decision situations using an efficiency test [46]: An efficiency value of 99% and a standard error of <0.05 confirmed that the randomized reduced design of eight decision situations provided comparable results to a fully crossed study design.
To partly validate the results of the conjoint measurement, in the third part of the online survey, participants additionally assessed the compensatory measures using the method of a semantic differential, in which they placed their opinions regarding these measures between pairs of adjectives (e.g., “fair” vs. “unfair”) or between contradictory statements (e.g., “I would profit from it” vs. “I would suffer from it”). These opposing statements formed the respective poles of a six-point scale on which respondents were asked to rank their opinions. In the same manner, respondents performed a general evaluation of CO2 pricing. In a final statement of the survey, we asked participants to rate directly whether or not they are in favor of CO2 pricing on a 6-point Likert scale (from 1 = “I do not agree at all” to 6 = “I fully agree”).

4.3. Participants

As we have argued in Section 2, CO2 pricing may affect different groups within the German population in different ways. In order to investigate any impact this may have on acceptance patterns, we set quotas for our sampling procedure that divide the total sample into three groups: (1) persons with increased mobility behavior, i.e., individuals with an above-average commuting distance to work (>21 km one way) (n = 401; “commuters”), (2) persons from low-income households who receive state subsidies such as unemployment benefit, basic income support, or housing benefit (n = 401; “social welfare recipients”), and (3) citizens to whom the previously named criteria do not apply, i.e., not commuting and without social welfare support (n = 407; “control group”). Data acquisition was continued until the quotas were met in the final sample.
To provide a representative cross-section of the German population, we aimed for a sample that is equal to the German population regarding age, gender, and the region of residence in Germany (federal state). Due to practical reasons, it was not possible to set strict quotas for each of the commuters, social welfare recipients, and control groups. However, we provide the statistical data for age, gender, level of education, and federal state for the German population side by side with our collected data in Appendix A.
After data cleaning, N = 1209 participants were considered for the statistical analyses in this study. Overall, the age of the participants ranged from 18 to 80 years and the average age was M = 48.3 years (SD = 13.6). With approximately 55%, more males (n = 663) than females (n = 544) participated in the survey; two individuals reported a diverse gender. Most respondents (38.5%, n = 466) had completed vocational training, and the second largest group reported holding a secondary school degree as their highest educational qualification (20.4%; n = 247). Equal proportions of the sample (each 14.6%) reported holding a university degree (n = 177) and school leaving certificate (“Hauptschulabschluss”; n = 176). Of the respondents, 10.4% (n = 126) accounted for a vocational baccalaureate diploma or general university entrance qualification, and 0.7% (n = 8) reported holding a PhD. The demographic characteristics of the three study groups are detailed in Table 3.
The study sample included representatives of all German political parties. As for the whole sample, most individuals reported living on the outskirts (29.7%) or centrally in the city (27.5%). Comparable numbers reported living in the countryside (28%) and 14.8% reported living in the suburbs. Most study participants reported a rather low monthly household net income (in 2020, the median monthly net household income in Germany equaled EUR 3,681 [65]): 25.5% reported earning less than EUR 1000 and 26.5% between EUR 1000–2000/month. Almost 21% had available income of about 2000–3000 €/month, and 22% of the sample had EUR 3000–5000/month; 5% indicated net salaries of more than 5000 €/month. The results in Table 3 enable a detailed view of the residential area and the distribution of earnings in the three study groups.
In addition to demographical information, we collected data regarding attitudes towards perceived self-efficacy about politics and the environment, as well as opinions referring to relevant topics for our study. Figure 2 depicts the resulting means for the whole sample and for the three study groups. Overall, participants reached, on average, neutral values in their evaluations of environmental self-efficacy (M = 3.5, SD = 0.9), and the study groups differed only marginally in this context (F(2,1206) = 3.6, p = 0.028, η2 = 0.006). The differences between the commuters, social welfare recipients, and the control group were slightly more distinct (F(2,1206) = 14.5, p ≤ 0.001, η2 = 0.02) in the estimations of the active pro-environmental behavior in everyday life; however, the resulting means in the sample suggest a rather low awareness of environment- and climate-friendly behavior. According to the participants’ self-assessments, satisfaction with the political system reached a restrained level; however, the study groups significantly varied in their evaluations (F(2,1206) = 8.8, p ≤ 0.001, η2 = 0.01). Nevertheless, participants assessed, on average, their political self-efficacy positively, with commuters reaching the highest mean (M = 4.2, SD = 1.2), followed by the control group (M = 4, SD = 1.2) and social welfare recipients (M = 3.7, SD = 1.2); these differences were statistically significant (F(2,1206) = 17.5, p ≤ 0.001, η2 = 0.03).
When asked about their self-assessed prior knowledge regarding CO2 pricing, energy transition, and the climate goals of the government, participants indicated their knowledge to be in the middle range. However, the three study groups differed significantly in their means (F(2,1206) = 18.1, p ≤ 0.001, η2 = 0.03), with the group of commuters reaching higher values than social welfare recipients and the control group. Figure 3 shows the resulting means for the three categories of prior knowledge, both group-specifically and for the whole sample.

4.4. Data Analyses

We performed descriptive statistics for the (self-)assessments of the attitudes and prior knowledge of relevant factors using means (M) and standard deviations (SD) and standard error bars in the graphs. To ensure a satisfying quality of the constructs, the internal consistency of the scales was inspected by means of Cronbach’s Alpha (α > 0.7). For the evaluation of acceptance, we calculated firstly the relative importance of the attributes as well as the part-worth utilities of attribute levels using Hierarchical Bayes analysis that allows the simulation of the decision processes (choice-based conjoint (CBC) analysis (Sawtooth Software Version 14 [66]). Thereby, the relative importance of attributes delivers information about which attribute influences the participants’ decision the most, while the part-worth utilities indicate which attribute level is estimated as the highest and lowest and to what extent an attribute level contributes to the overall decision. For the validation of the CBC results, we used semantic differentials [67]. To analyze differences between the study groups, we performed (multivariate) analyses of variance ([M]ANOVA) and stepwise regressions to explain variance in the general perception of CO2 pricing. We examined correlative relationships between the study variables (Pearson coefficients). The level of statistical significance (p) was set at 5%.

5. Results

The online survey was conducted in two draws in which, among the relevant attributes for CO2 pricing, the factor “climate effect” was explicitly manipulated (on the one hand, the climate effect was traded generically, and, on the other hand, the associated costs were considered). The remaining factors and possible influencing variables were kept constant. In the second step, the relative influence of the individual attribute levels within an attribute, the so-called part worth, was analyzed. This approach enables the determination of both the optimal and worst compositions of attributes and their levels for the CORE design. The results of both drawings of the acceptance study (variants A and B) are shown side by side.

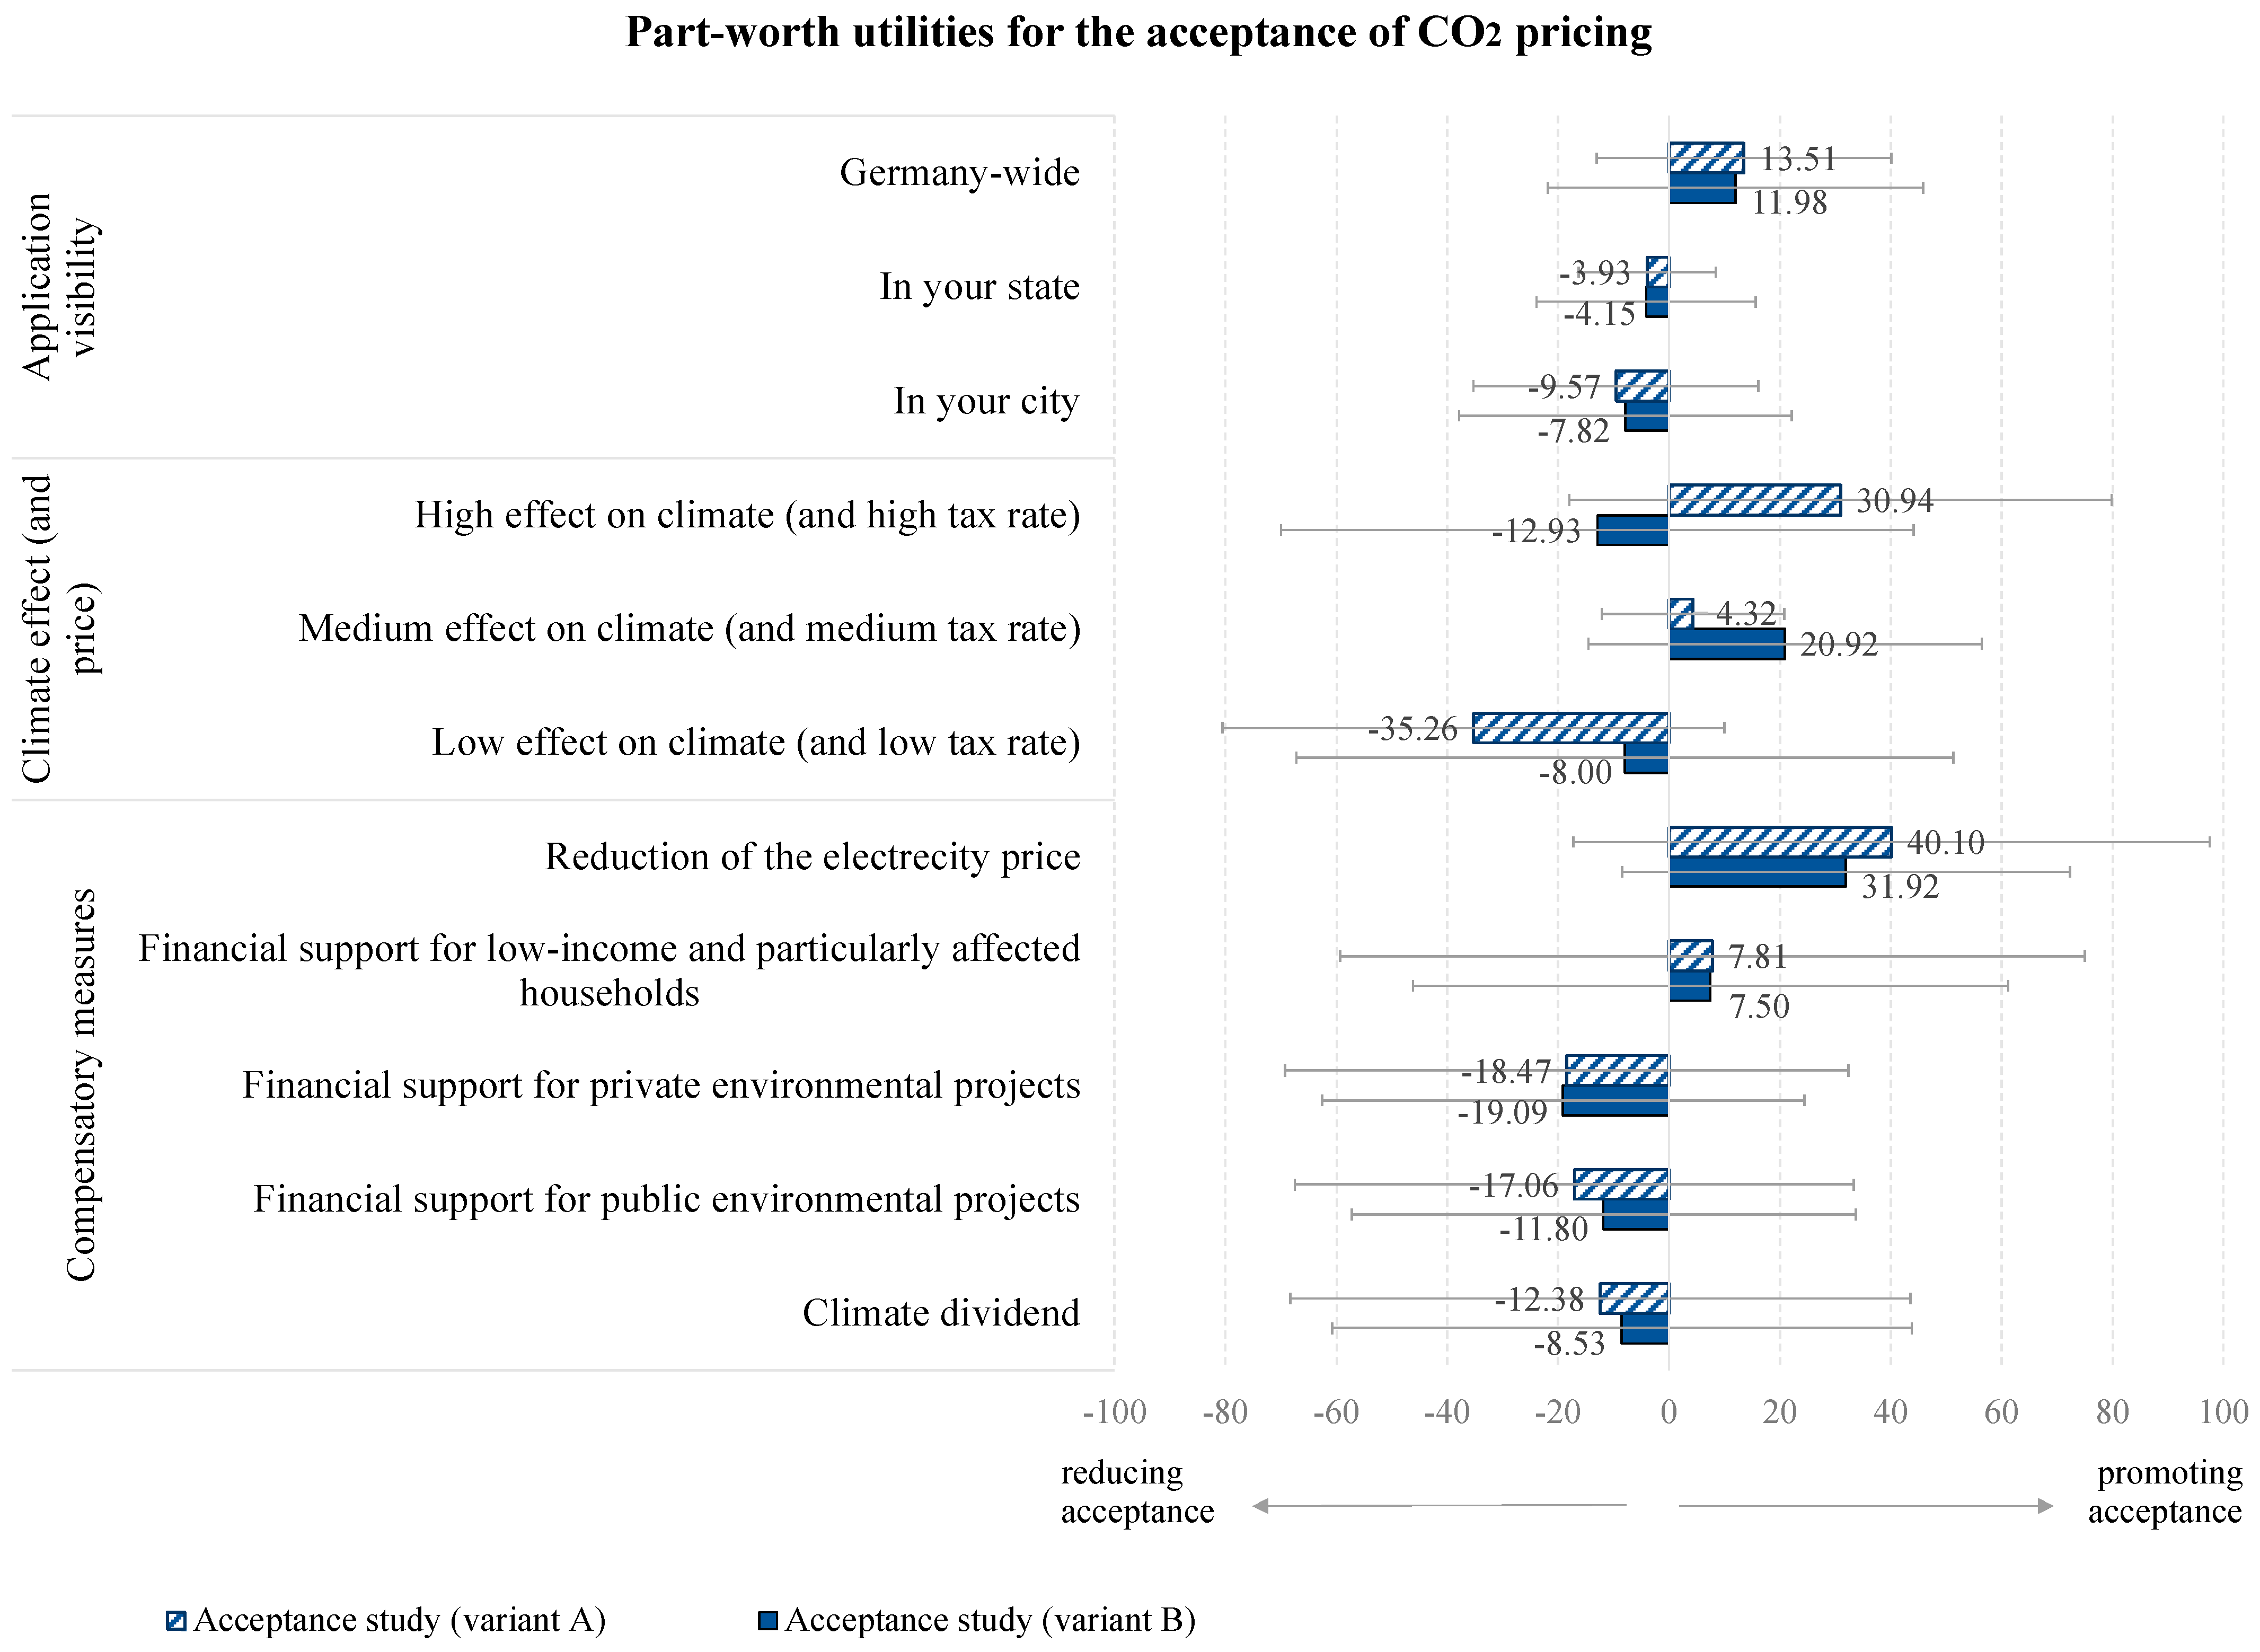
5.1. Study Results of the Conjoint Analyses on Acceptance of CO2 Pricing

First, a Hierarchical Bayes analysis determined the relative influence of the different attributes on the selection decision (Figure 4). Considering the climate effect in a generic way (variant A of the acceptance studies), compensatory measures (CM), with 50.3% (SD = 19.5), make the strongest relative contribution to the social acceptance of CO2 pricing, followed by the climate effect (33.7%; SD = 18.8) which has a medium influence, and the smallest contribution comes from the application’s perceivable scale of action (15.9%; SD = 11.1). This pattern basically persists when costs related to the climate effect are explicitly indicated (variant B), but the contributions of the attributes change substantially (CM: 41.9%; SD = 17; climate and price: 38.3%, SD = 18; the scale of action: 19.7%; SD = 12.2): While the strength of the compensatory measures is overall reduced, the relative importance of the climate effect coupled with its price grows overall, and the scale of action also gains additional weight in its acceptance contribution. Since the importance is relative, it is possible to compare the values directly. We can thus conclude that for the acceptance of CORE, the climate effect had about twice the influence of the scale of action.
In the next step, to examine how the different levels contributed to the attractiveness of the attributes, part-worth values were also determined using the Hierarchical Bayesian analysis. From the part-worth values, the CORE compositions with the highest and lowest potential could be identified. Figure 5 depicts the mean part-worth values (zero-centered) for all attribute levels in the total samples of variants A and B of the acceptance studies. The values are to be interpreted relative to each other and not in absolute terms. This means that a negative part-worth value is not synonymous with a negative influence on the selection decision but rather shows the extent to which a given attribute level inhibits the acceptance of CO2 pricing.
The configuration with the highest choice decision in variant A of the acceptance studies (=best case) contains the following characteristics: the reduction of the electricity price (+40.1; SD = 57.4), high climate effect (+30.9; SD = 48.9), and a Germany-wide scale of action of the effects of CO2 pricing (+13.5; SD = 26.5). The configuration with the lowest choice decision (=worst case) includes, in this variant, the following characteristics: financial support of private investments for climate protection (−18.5; SD = 50.8), low climate effect (−35.3; SD = 45.3), and perceptibility within the participant’s own city (−9.6; SD = 25.7).
The configuration with the highest choice decision in variant B of the acceptance studies is somewhat different. Here, the climate effect considering the associated price shows different choice preferences in the sample (=best case): the reduction of electricity price (+31.9; SD = 41), medium climate effect and medium price (+20.9; SD = 35.2), and a Germany-wide scale of action of the effects of CO2 pricing (+12; SD = 33.8). The configuration with the lowest choice decision (=worst case) includes the following characteristics: financial support of private investments for climate protection (−19.1; SD = 43.8), high climate effect and high price (−12.9; SD = 57.2), and scale of action within one’s own city (−7.8; SD = 30.1).

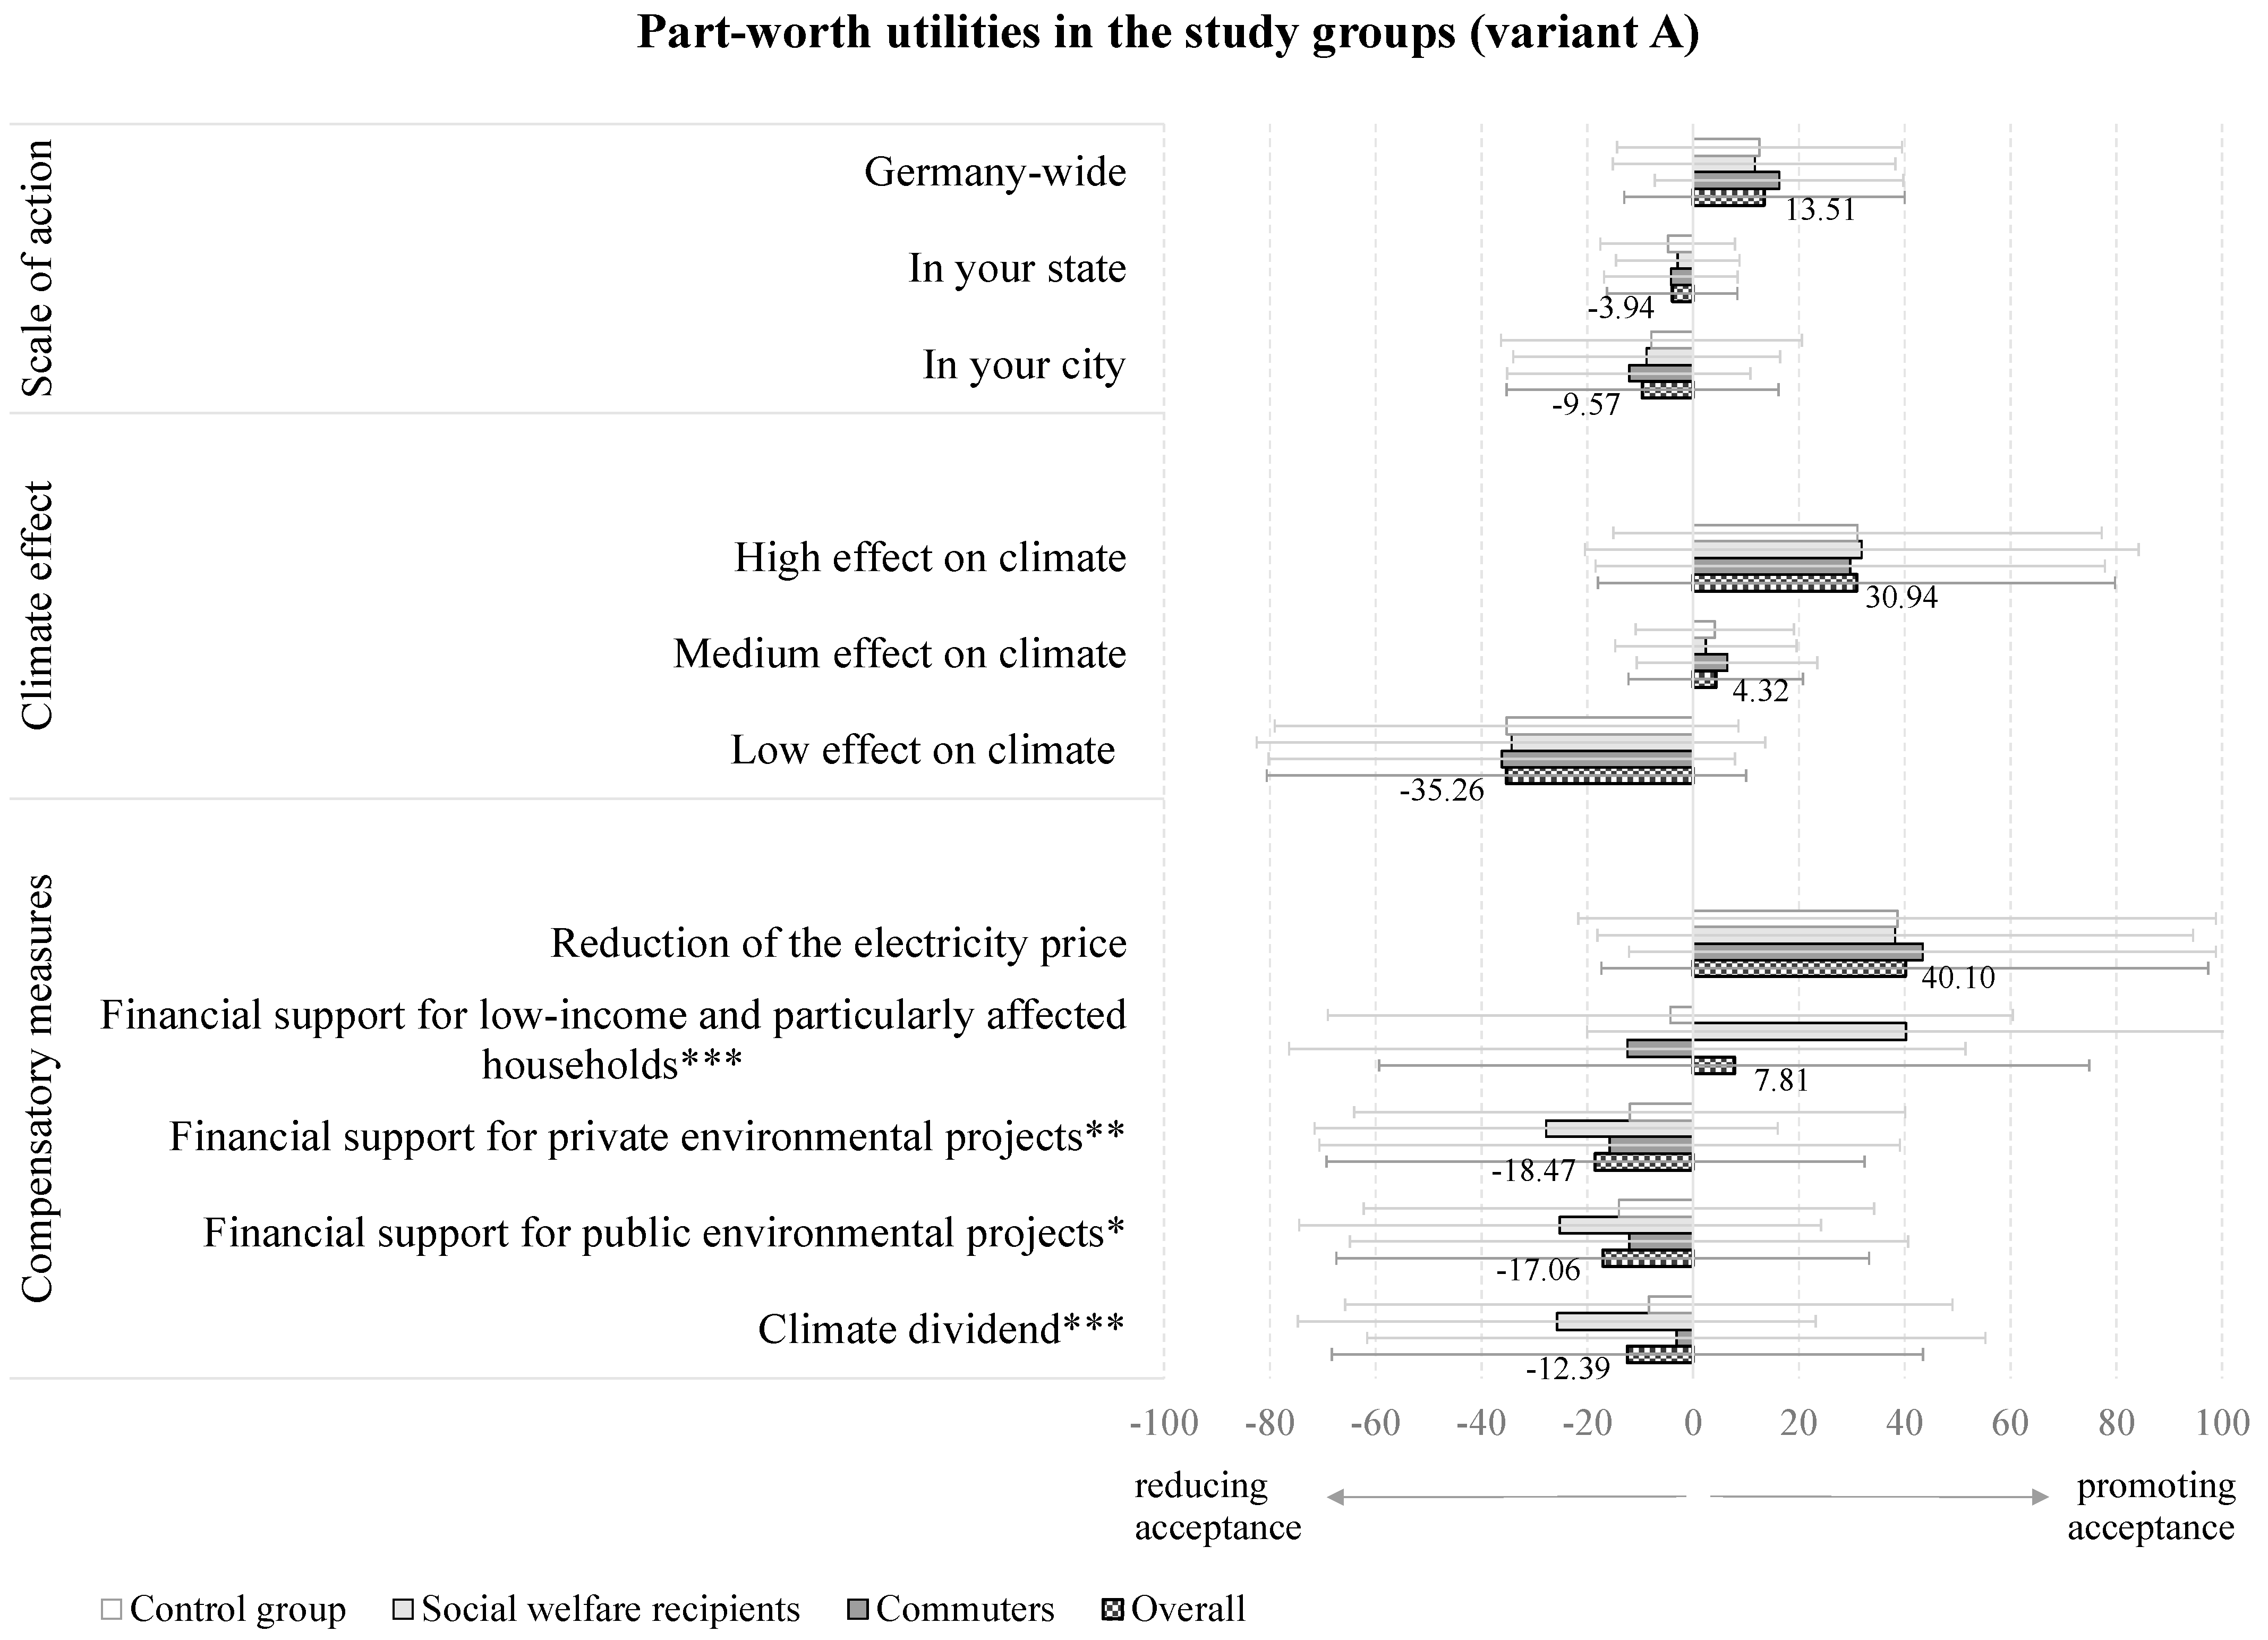
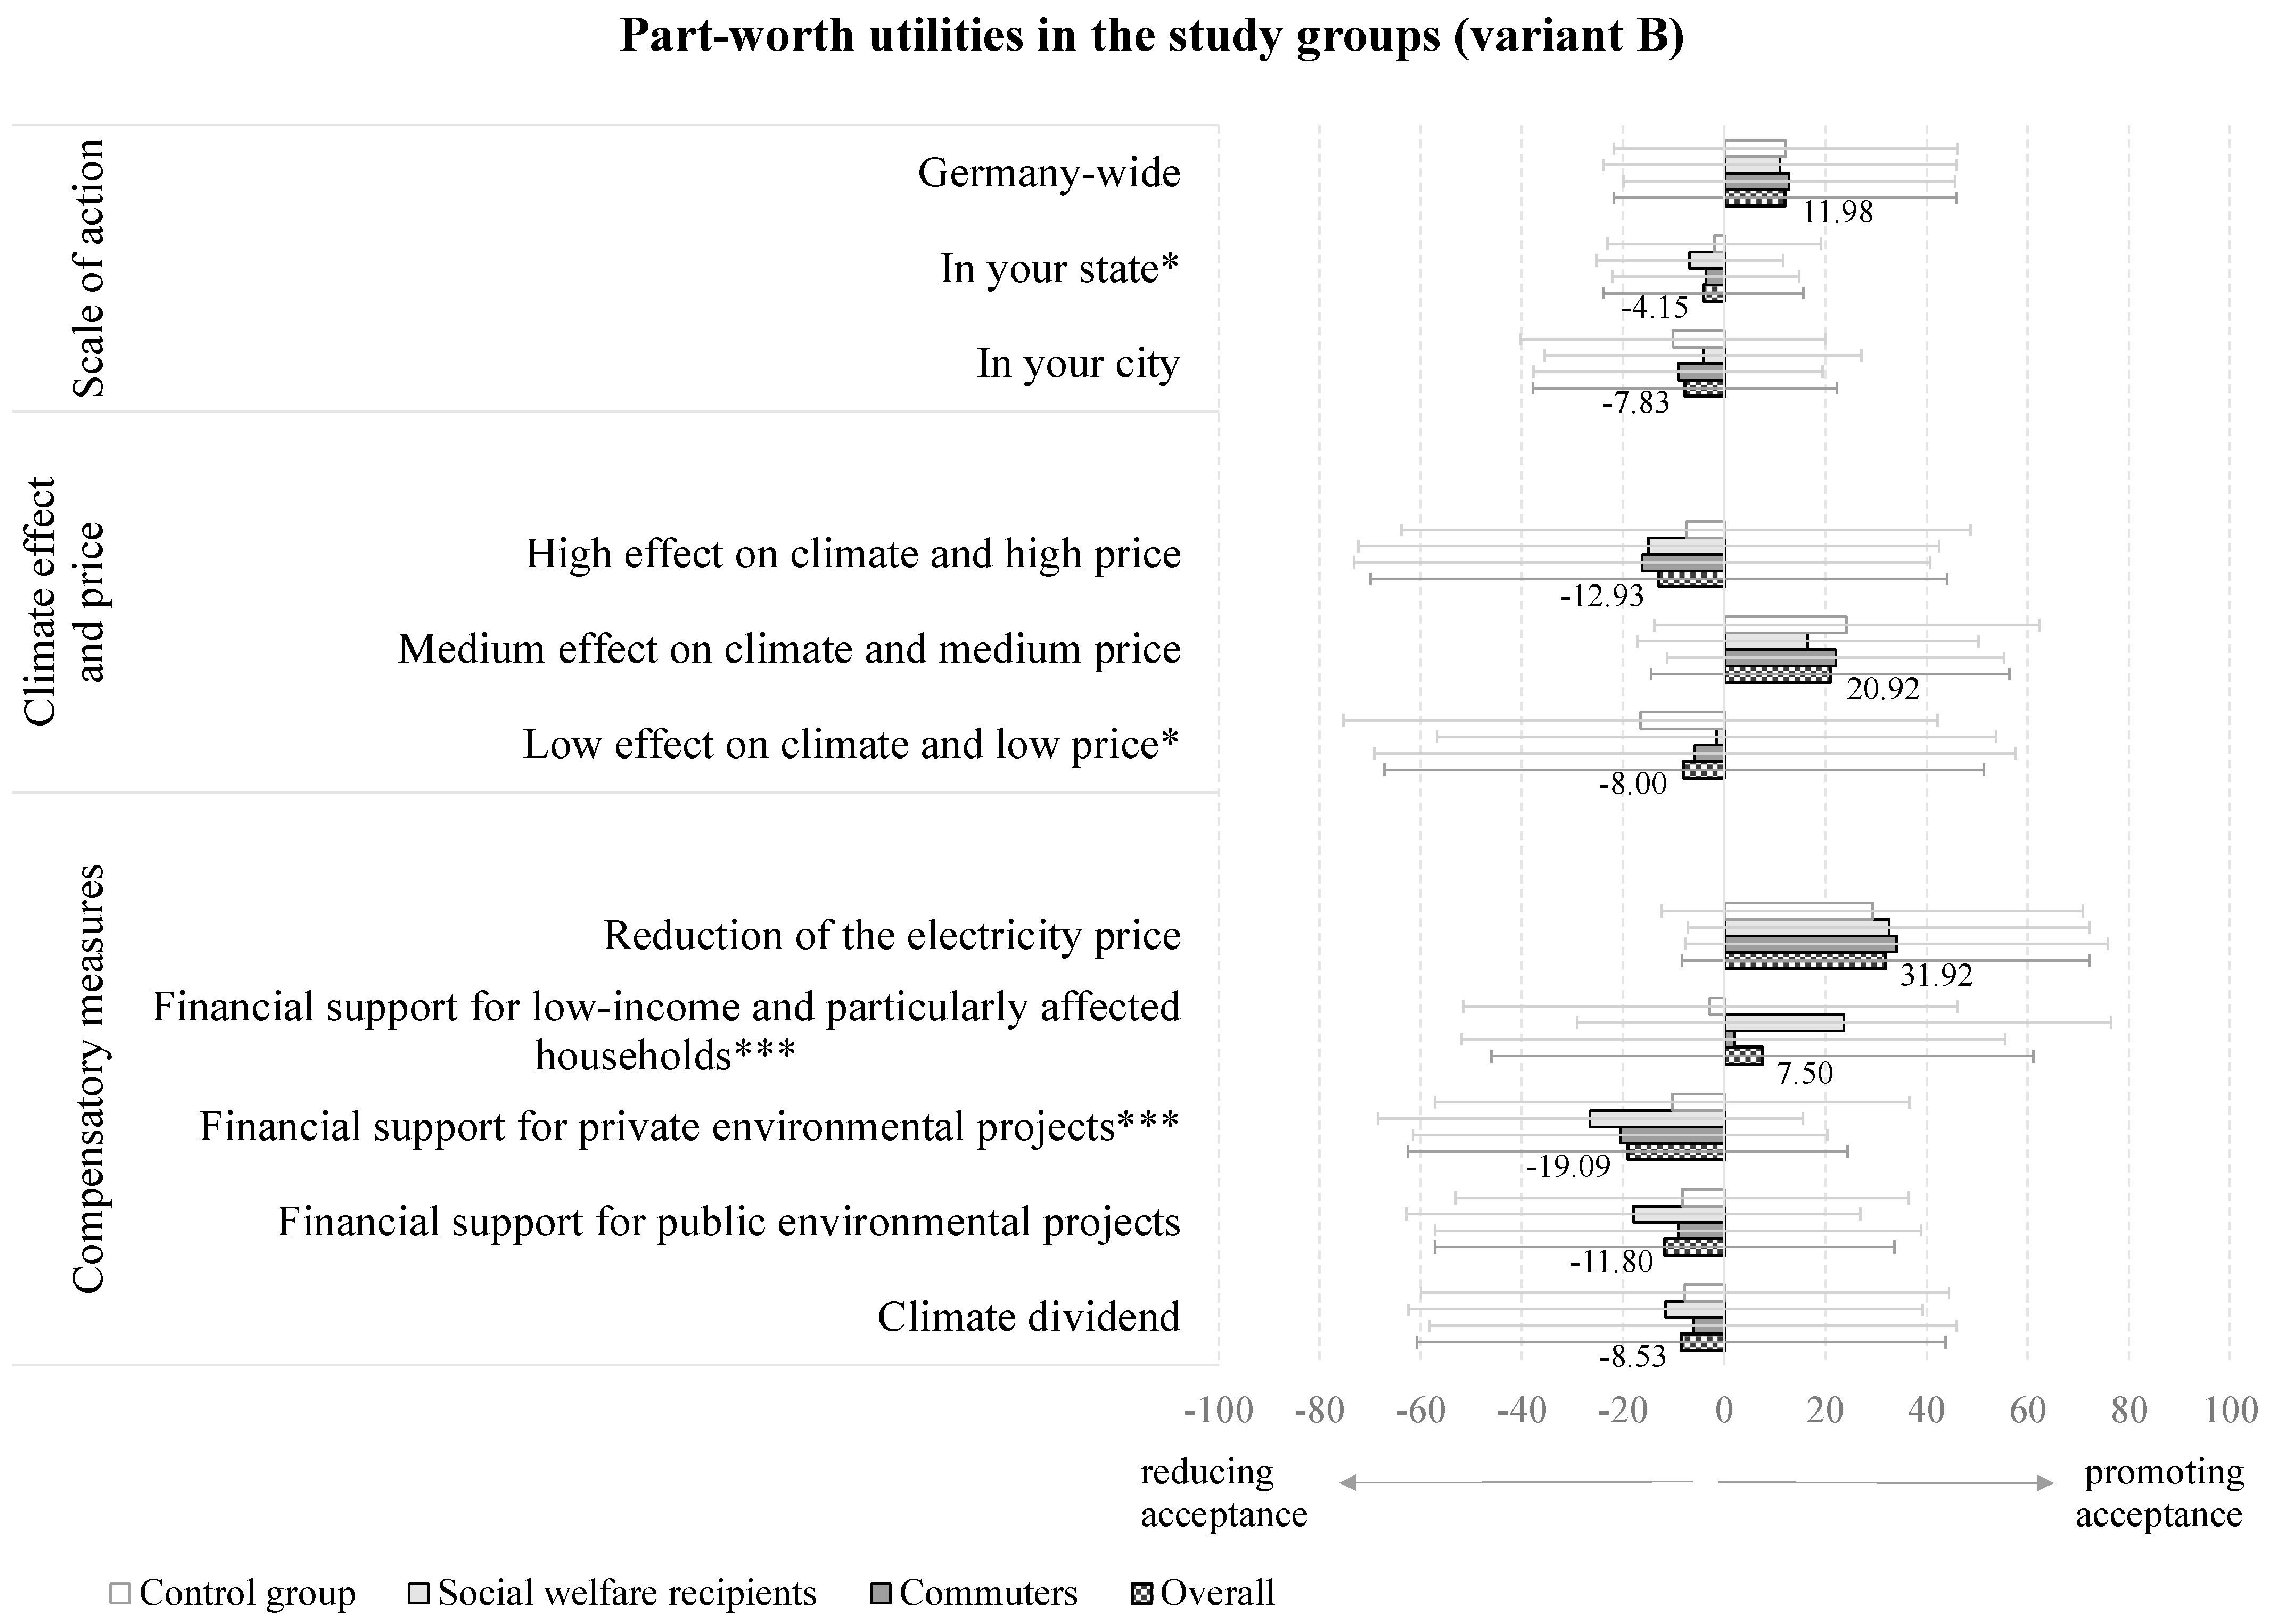
5.2. Differences between the Study Groups in the Assessments of Attribute Levels

Considering the varying trade-offs, especially regarding the climate effect between both subsamples (variants A and B), we additionally performed inferential statistics, examining whether the participants of our three study groups considerably differ in their assessments of the attribute levels. The key parameters for both study variants are summarized in Table 4.
Within the first study (variant A), where no specific remark was made on the financial consequences of the climate effect, significant differences between the assessments of the three study groups resulted solely within the attribute compensatory measures on the following levels:
-
Financial support for low-income and particularly affected households: commuters (−12.42; SD = 64), social welfare recipients (+40.31; SD = 60.4), control group (−4.29; SD = 64.7),
-
Financial support for private environmental projects: commuters (−15.77; SD = 54.8), social welfare recipients (−27.74; SD = 43.8), control group (−11.99; SD = 52.1),
-
Financial support for public environmental projects: commuters (−12.07; SD = 52.7), social welfare recipients (−25.13; SD = 49.3), control group (−14.01; SD = 48.3), and
-
Climate dividend: commuters (−3.14; SD = 58.4), social welfare recipients (−25.73; SD = 48.9), control group (−8.34; SD = 57.4).
The group receiving social welfare significantly differed in their opinions from the other groups, contributing most positively to financial support for low-income households and most negatively to climate dividends, as well as supporting private or public environmental projects. On the other hand, survey participants from all groups agreed on the importance of electricity price reduction. For the remaining attribute levels in the study, no further significant differences resulted. The effects are depicted in Figure 6.
In variant B of the studies, assessments of the three groups differed significantly on the individual levels of all three attributes (Figure 7). As to the compensatory measures, social welfare recipients voted significantly more strongly for financial support of low-income households (+23.62; SD = 52.8) and against private environmental projects (−26.50; SD = 42) in comparison to the commuters (household: +1.86, SD = 53.7; private projects: −20.56, SD = 40.9) and the control group (household: −2.81, SD = 48.9; private projects: −10.33, SD = 46.9). Regarding the climate effect with price considerations in the acceptance decision, we found small differences in voting for low climate effect accompanied by low prices. Here, the control group (−16.59; SD = 58.7) voted significantly more negatively to such a solution than the other study groups (commuters: −5.79, SD = 63.4 and social welfare recipients: −1.48; SD = 55.3). Considering the scale of action as the attribute for the acceptance of CO2 pricing, small significant differences emerged for the perceptibility of the measures in the state, where social welfare recipients (−6.84; SD = 18.4) voted slightly more negatively against it than commuters (−3.70; SD = 18.5) and respondents in the control group (−1.96; SD = 21.2).

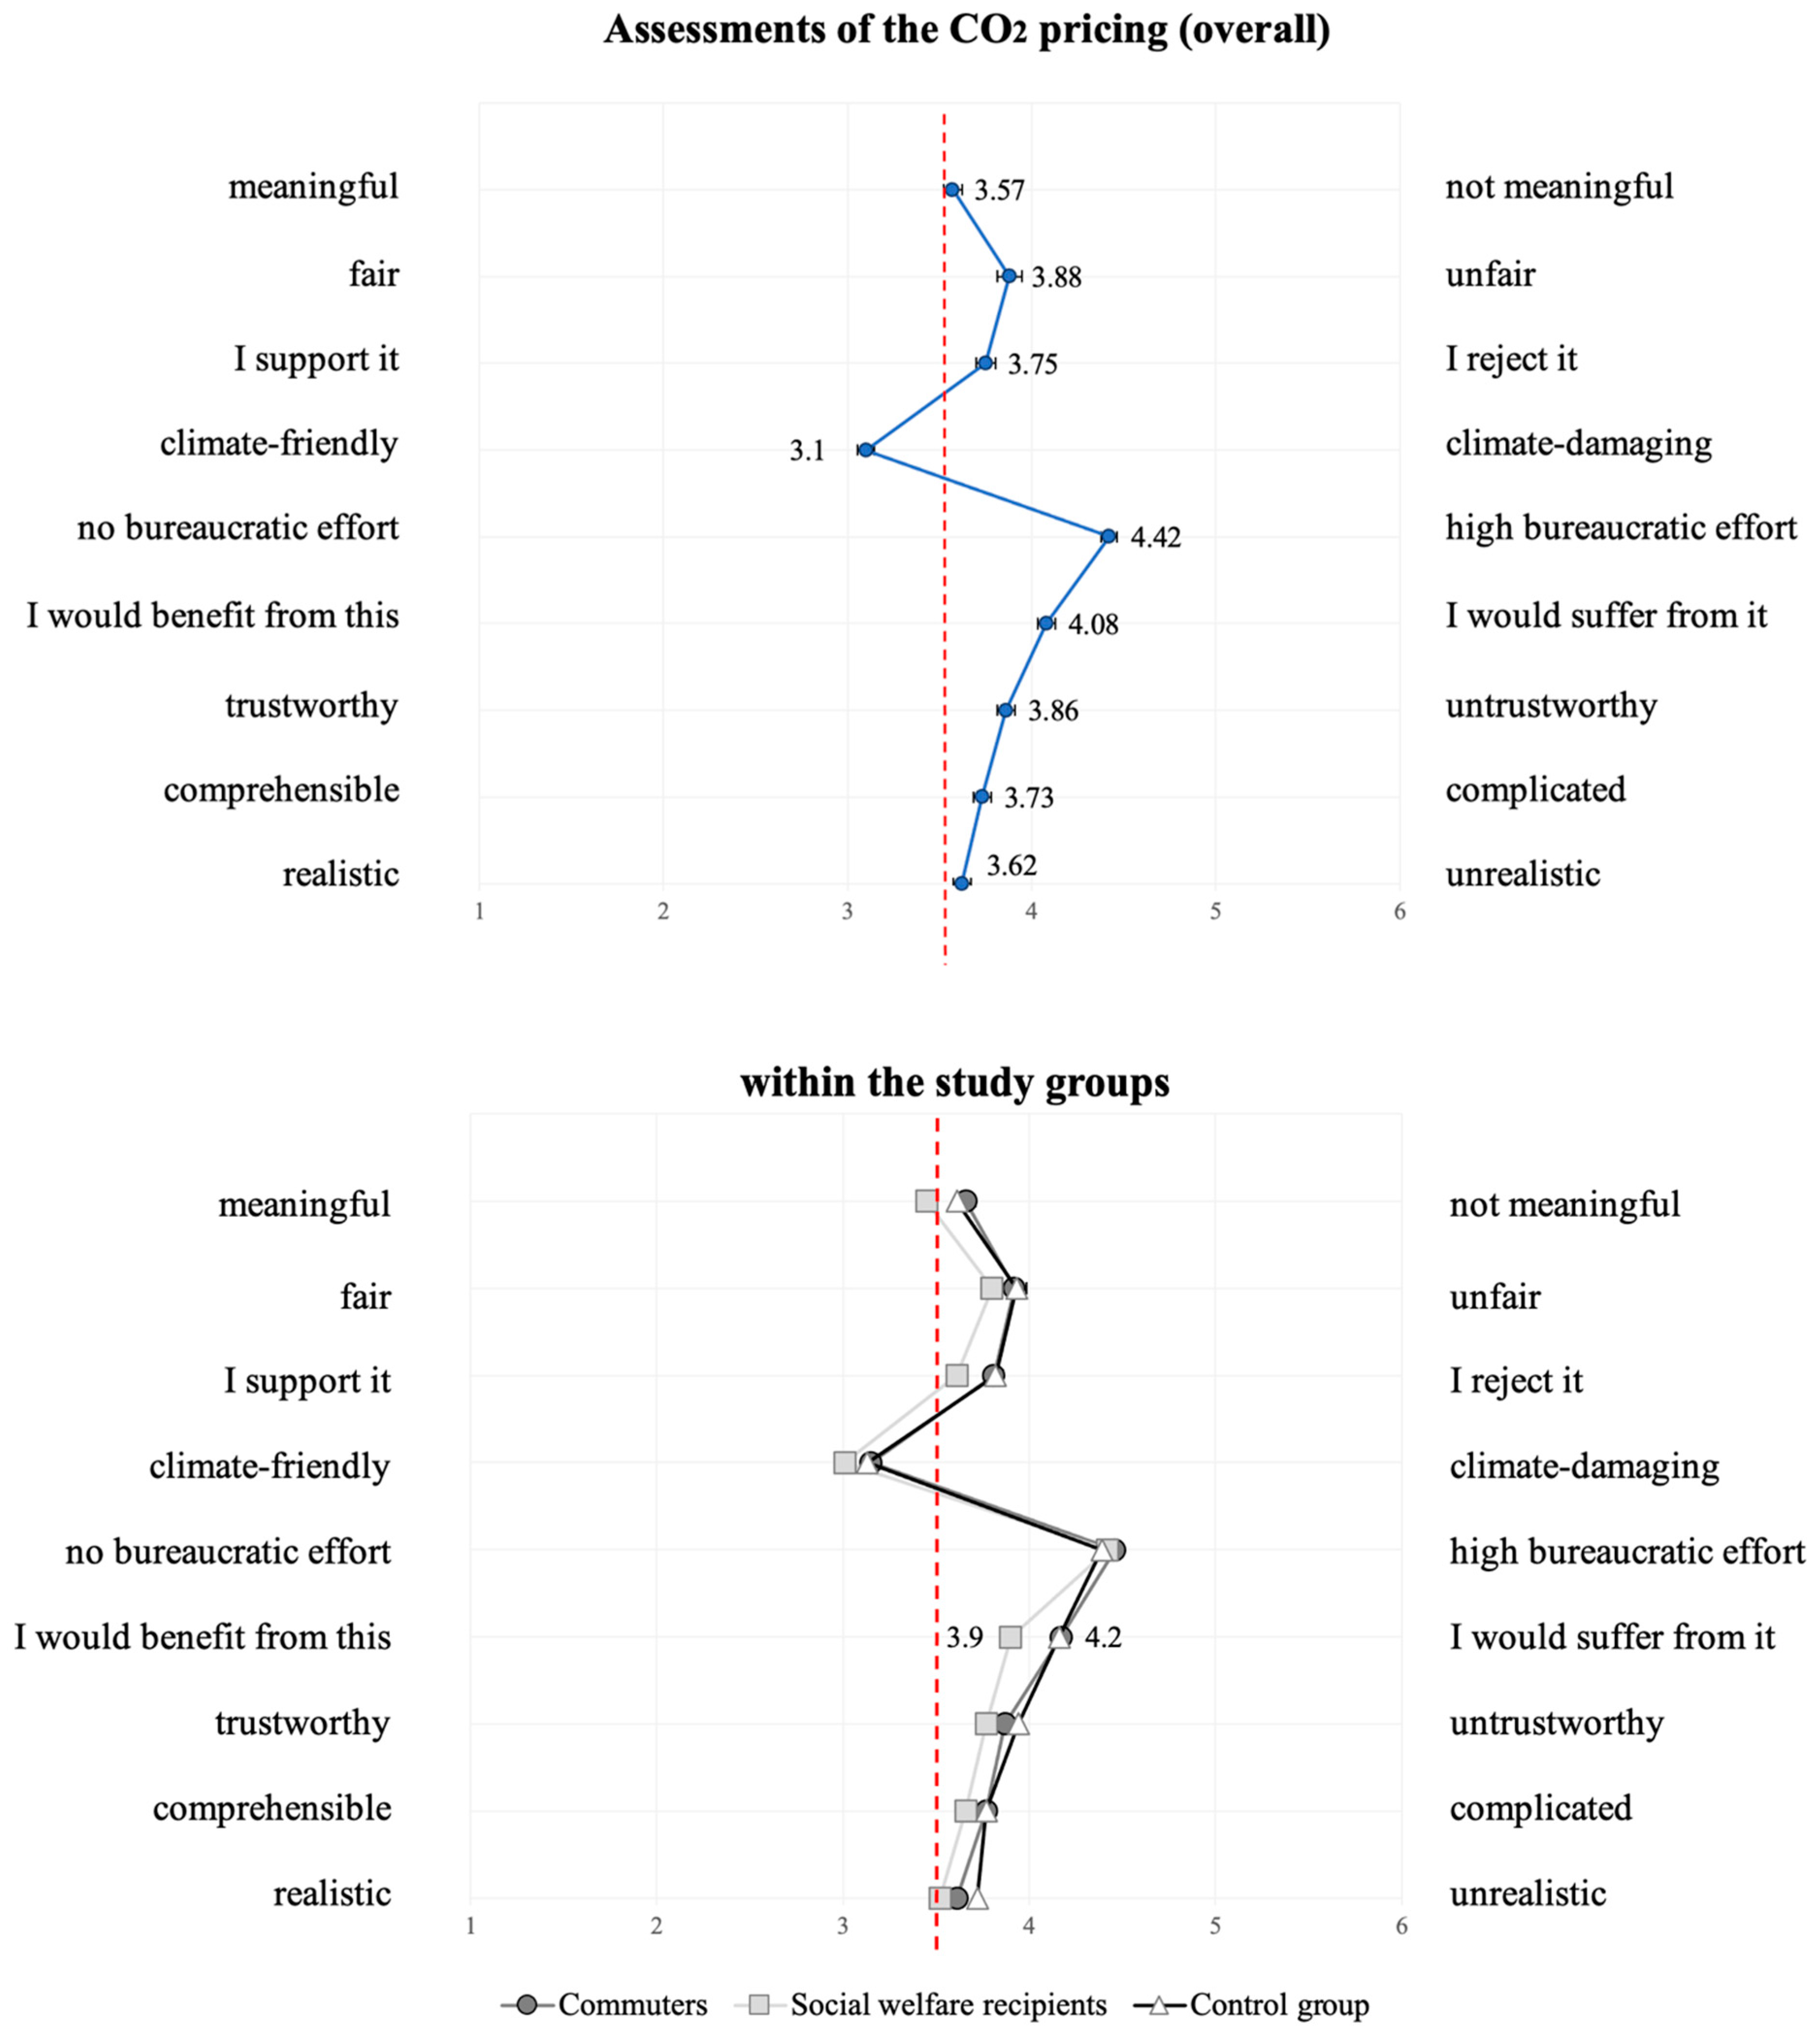
5.3. General Perception of CO2 Pricing in Germany

In addition to the trade-off analyses on the acceptance of CO2 pricing, we examined how citizens generally perceive CO2 pricing. We used the semantic differential method, which allows spontaneous evaluations between two poles of one dimension (i.e., between two opposing adjectives/statements). The polarity profile for the resulting mean values is depicted in Figure 8.
The results show that, on average, the assessments regarding CO2 pricing are predominantly neutral with a tendency towards negative expressions of the respective dimensions. The participants suspect a high bureaucratic effort and fear suffering from the measure rather than profiting from it. They also fear unfair solutions or complicated processing of pricing for different social groups. The only positive rating in this format was for the climate, implying that participants assume a climate-friendly effect in the pricing of CO2. Even though opinions regarding the meaningfulness and feasibility of CO2 pricing remain neutral (the mean value oscillates around the scale’s midpoint), the respondents tend to have little trust in this measure. Among the three study groups, significant differences emerged only for the opinion that one would profit from CO2 pricing vs. suffer from it (F(2,1206) = 3.44, p = 0.032, η2 = 0.01), with social welfare recipients (M = 3.9, SD = 1.6) being, on average, less convinced of suffering from CO2 pricing than the other two study groups (commuters: M = 4.2, SD = 1.6, control group: M = 4.2, SD = 1.7).
This result is further confirmed by a final statement of the survey in which participants assessed the following item: “In general, I am in favor of CO2 pricing”. The resulting mean of M = 3 (SD = 1.5) out of six possible points for the whole sample displays little enthusiasm for the measure among the respondents and the differences between the study groups are not significant [F(2,1206) = 2.06, p = 0.128 (n.s.)]. Most of the participants did not agree to be in favor of CO2 pricing (38.2%) and the majority varied in their answers between “I rather agree” (24%) and “I rather disagree” (20.8%). Only a small percentage of respondents (fully) agreed with CO2 pricing (17%).
To show which factors of the provided assessments have more or less influence on the general perception of CO2 pricing, we performed a stepwise multivariate regression analysis of the general acceptance assessment. The regression analysis revealed that CO2 pricing is significantly related to the assessments used in the semantic differential. Five pairs of adjectives were included in the model as presented in Table 5 (top), where all relevant statistical parameters are also provided. The model was statistically significant, F(5,1203) = 442.1, p < 0.001, and accounted for approximately 65% of the variance (R2 = 0.648, adjusted R2 = 0.646). Support vs. rejection had the largest beta coefficient of −0.34, making the strongest unique contribution to explaining variance in the general perception of CO2 pricing, followed by the lower contribution from how meaningful, or not, participants perceived this measure to be (−0.18). The three other adjective pairs contributed only slightly to the variance explanation in the assessment of CO2 pricing.
To complement this analysis, we additionally conducted a regression analysis that included individual attitudes and self-assessed prior knowledge (Table 5, bottom). The significant regression model (F(3,1205) = 49.1, p < 0.001) contained three predictors and explained approximately 11% of the variance (R2 = 0.109, adjusted R2 = 0.107). Conscious environmental behavior (β = 0.32) and satisfaction with the political system (β = 0.32) make the strongest contribution, and environmental self-efficacy (β = 0.12) the lowest, to explaining the variance in the acceptance of the CO2 pricing. For both regression models, all VIF values lie well below 10 and tolerance statistics well above 0.2, which allow us to safely conclude that there is no collinearity within the present data. For a better overview of the interrelations of the study variables, we have summarized the correlative coefficients resulting between the personality measures, policy factors, and the general acceptance of CO2 pricing in Table 6.

6. Discussion

The aim of this study was to empirically predict the design and evaluation of concrete loading and unloading scenarios of a CORE measure. Acceptance of CO2 pricing in Germany was modelled in terms of compensatory measures, climate effect and associated costs, and the extent to which these applications affect citizens. Using conjoint measurement in the online survey, participants selected their preferred CO2 pricing design that combined different characteristics (=levels) of these decision-relevant factors (=attributes). In this way, preferences for individual factors were related to each other, from which we derived factors that are particularly relevant for the (non-)acceptance and optimization of the CO2 pricing strategy for the samples studied.
The participants represent a broad spectrum of the German population. The results provide a picture of the prevailing opinions on CO2 pricing in Germany and the factors that determine them. The results of both draws of the survey (variant A and B) indicate high and consistent data quality and a high replicability of the results.

6.1. Key Results and Responses to the Research Questions

Focusing on RQ1, the analysis shows that among the attributes assumed to influence the acceptance of CO2 pricing, compensatory measures achieve the highest relative importance, followed by the climate effect they address. Taking the associated costs into account modifies this result, generally strengthening the relative importance of the climate effect and weakening the relative importance of the compensatory measures. The scale of the measure is the least relevant attribute for the acceptance decision. These findings are consistent with previous research showing that when people perceive a relatively high climate benefit [6,11], individual costs associated with policy decarbonization measures are accepted [29]. Trust [30] and perceived fairness [31,32,33] have been shown to be important predictors of acceptance of CO2 pricing, but taxes are often perceived as illegal government gains [29]. Making the use of revenues public and transparent has the potential to reduce this skepticism, making climate impact and revenue use the most relevant design factors in our study.
Addressing the question of trade-offs between acceptance criteria in evaluating CORE design alternatives (RQ2), we delve into the details of the conjoint analysis: Examining the most acceptance-shaping attribute, the compensatory measures, our study’s preference ranking contrasts with what the existing literature suggests. While previous research [11] reported a higher preference for earmarking environmental projects, followed by progressive redistribution mechanisms and revenue-neutral measures, our findings indicate that the reduction of electricity prices is the most preferred measure among German citizens and contributes most strongly to CO2 pricing acceptance. This preference for electricity price reduction aligns with the concerns about rising energy prices, which have become more pertinent in the wake of recent events in Ukraine. While a reduction of other taxes has been rejected in the past, as individuals perceived linkage issues [68], subsidies and tax rebates have been found to be accepted in previous studies [11,69,70]. A reduction in energy prices might be considered a subsidy for alternative low-carbon behavior [36], which would be a plausible explanation for it being the most accepted revenue use. However, subsidies for renewable energy can be highly regressive [71], and the general preference for progressive, or at least non-regressive, uses of revenues found in previous studies (e.g., [34]) may be an indicator of low awareness of the regressive nature of reducing energy costs, or a focus on personal benefit rather than egalitarian principles. Two arguments contradict the second assumption. Firstly, participants selected financial support for lower-income households as the second-strongest compensatory measure that positively contributes to the acceptance of CORE. Secondly, this preference behavior aligns with previous research that demonstrated the significant negative impact of CO2 pricing on low-income households, which has been found to be crucial for public acceptance [31,72]. Finally, climate dividends and the support for governmental and private climate protection measures were the least relevant for CO2 pricing acceptance in Germany. According to previous research, the preference for environmental earmarking is grounded in a lack of understanding of, and trust in, the climate-effectiveness of the tax itself. Individuals do not perceive CO2 pricing itself as an effective way to discourage high-carbon behavior and prefer subsidies for low-carbon behavior instead, believing them to yield climate effects more effectively [11,68]. We found significant correlations between CO2 pricing acceptance and meaningfulness, trust, and comprehension. However, comprehension was more neutral than negative, and a recent study by Matthies et al. [72] has shown that the steering effect of the pricing itself, not the compensation measure, is understood by the German public. Other studies [31,54] found information about the climate-effectiveness to reduce the preference for environmental earmarking. Since the climate effect was made visible in our conjoint design and participants yielded a high climate effect, trust and information gaps regarding climate efficiency were overcome and preference for power tax reduction increased. On the other hand, the climate dividend, despite its progressive potential [72] and enforcement of the steering effect, has been rejected in our and previous studies. Matthies et al. [72] pointed out that the term ‘redistribution’ might give the impression that the increased price is being withdrawn, which would counteract the idea of the steering effect of CO2 pricing. They highlighted Germans’ preference for equity over equality, therefore assuming a lack of understanding of the social effects of lump sums. Therefore, they recommend informing the public about these effects, which was proven to be effective in another study [31].
In addition, special attention should be paid to the climate effect considered in the acceptance decision of CORE. Although this attribute was found to be less important than revenue reinvestment, the influence of the climate effect changes significantly when costs are explicitly considered in the decision. Overall, the relative importance of the climate effect increases in this case. When participants were presented with a high climate effect without explicit mention of the associated costs, they considered it a relevant factor in their acceptance. However, when the costs of the high climate effect were made explicit, participants preferred a medium climate effect and price, indicating that they negatively integrated the additional personal cost burden of a high climate effect. This finding is consistent with previous work in this context [28,31,34,55]. However, personal costs are often overestimated and outcomes underestimated [11]. This misperception flattens after CO2 pricing has been implemented [11]. Therefore, over time and with experiencing the actual effects of CO2 pricing, it is likely that the negative effect of mentioning the costs might decrease. Additionally, the German public is aware that an efficient steering effect can only be achieved when the associated costs are realistically considered [72], which might explain why the participants opted for the medium environmental effect and personal costs. Furthermore, explicitly mentioning the costs of non-action caused by climate change, as has been proposed by [28], may relativize the personal costs of CO2 pricing.
As opposed to the climate effect, statistical analyses revealed that the scale of action of the measure acquires a comparatively low relative importance in terms of the acceptance of CO2 pricing, and, when considered, only a Germany-wide scale of action is meaningful for the acceptance of the measure. Although this result puts the scale of action in the background, given the other factors influencing acceptance considered here, at this point it should still be noted that governments considering CO2 pricing need to carefully communicate, and thus make their proposal visible, to the public [31]. In doing so, they should transparently address citizens’ concerns and ensure that the debate is based on the best available evidence.
When we looked at whether the evaluation of the acceptance criteria differed between the different social groups—commuters, social welfare receivers, and the control group—we found only small differences in the design of the CO2 price between them, showing a fairly homogeneous public opinion on the revenue measures. The main difference arose with regard to compensation measures, where social welfare recipients showed a preference for the financial support of low-income households and those particularly affected by CO2 pricing. It is understandable that this social group would be more sensitive to the potential regressive impacts of CO2 pricing [11] and all compensatory measures except for social cushioning and lump-sum payments [31,53], and would seek to counteract them through progressive compensatory measures. Indeed, welfare recipients perceived a lesser personal burden due to the CO2 pricing than participants who did not receive financial welfare support. It is therefore likely that social welfare recipients are well aware of the progressive potential of CO2 pricing if social cushioning is applied. Interestingly, commuters as a group particularly affected by CO2 pricing [73] did not explicitly prefer support measures specifically targeted at them, contradicting earlier findings from a German focus group study [72]. One explanation is that they already feel adequately compensated by the existing commuter allowance in Germany, as well as the increasing opportunities and support for remote working [74]. Another explanation could be that, with higher incomes than those on social assistance and the control group, they did not feel that the social cushioning measures were addressing their needs. However, this needs to be investigated further in subsequent studies. It is less surprising that there was no significant difference between the groups in their willingness to pay for the climate effect, as previous studies have shown that acceptance of CO2 pricing is not dependent on income [75].
Finally, we examined how our survey respondents generally assess CO2 pricing (RQ3). The results suggest that German citizens do not show a clear tendency in favor of this measure. More than one-third of all participants did not agree with CO2 pricing and the majority expressed neutral or slightly negative-leaning opinions. In concrete terms, the evaluation using semantic differentials indicated that an environmental benefit is positively perceived by the public, while all other assessed evaluation criteria are rated as neutral or negative. Again, this finding challenges the common argument that the public does not perceive the tax itself as environmentally friendly and finds it difficult to understand [11,68]. However, as observed, personal consequences as well as unfairness towards the disadvantaged members of society are feared, regardless of the examined subgroup. The importance of both personal costs [76] and fairness perceptions [10,27,32,34,35] have been highlighted in previous research. The importance of political distrust as a significant barrier to ecological tax reforms in Germany (e.g., [36,72]) was also found here, as participants perceived the pricing system as untrustworthy and associated it with a high bureaucratic burden. For public communication, the choice of terminology needs special care [76]. Despite significant differences in the perceived individual cost burden, the groups did not differ significantly in their general attitude toward CO2 pricing, thereby supporting the idea of Gevrek et al. [34] that the public supports progressive political measures.

6.2. Limitations and Future Research

In the introductory section, we have explained that sustainable policy design should be considered within the framework of the individual, time, and place [26]. The focus of this study has been on individual and societal perceptions of CO2 pricing. The limitations of time and place are discussed below.
It is important to recognize that acceptance studies such as the one presented here are always timely and reflect the current socioeconomic and political situation in a country. Our data collection took place in the summer of 2021 in Germany, where the public debate about how to deal with major societal impacts of climate change was high on the political agenda. However, the climate-related discussions and the question of appropriate political responses have gained enormous momentum since the start of the war in Ukraine, Europe’s (and especially Germany’s) dependence on fossil fuels, and the shortage of gas and electricity. Ongoing inflation prompted the government to attenuate the stepwise initiation plan from 2019 as part of the Federal Government’s third relief package. The coalition committee decided in early September 2022 to postpone the price increases by one year from 2023 [7,9]. The focused discussion about the need to move away from fossil fuels on the one hand and the reduced purchasing power of households on the other may have changed the public’s perception and assessment of such CORE measures, and thus shifted the public’s preference for the use of revenues. There is a need to re-examine public attitudes and acceptance in the light of current political events.
In addition, two lines of future research should be pursued—one with regard to the differentiation of the internal perspective (German population) and the other with regard to the differentiation of the external perspective (other European countries and worldwide). For the internal perspective, the issue is society’s willingness to forego, or at least significantly reduce, prosperity in favor of individual and societal behaviors that are both appropriate to the seriousness of climate change and responsible in preserving the world for future generations. From an external perspective, the German-centric view of this study needs to be cross-validated with other European and global countries. It is clear that Germany has a special role to play when it comes to the constraints imposed by climate change and the resulting additional costs of climate action. The country is rich and secure, and its citizens enjoy a good standard of living and are relatively well off, although there are considerable differences in individual socioeconomic status. However, limiting decarbonization efforts to a national or even European strategy is unlikely to have a sufficient impact on climate change. Introducing decarbonization measures such as CO2 pricing can be the start of a holistic and global socioeconomic transformation that can only be achieved through global cooperation and participation. Therefore, a further study focusing on the European and global perspective (with selected countries) would highlight the possibly different societal perceptions, influenced by culture, different socio-cultural values, or the socioeconomic status of the respective countries, taking into account both global significance and local differences.
Finally, a possible shortcoming of the present study may be due to the methodological design. Each methodology changes the phenomenon under investigation in the multifactorial decision space. Our aim was to examine the main CORE measures in Germany on the revenue from CO2 pricing. We chose the conjoint method because it allows us to identify the preferences and the weighting of the importance of each measure, and this method provides the tipping points between acceptance and non-acceptance of the measures. Thus, the methodology is appropriate overall when considering the research goal. However, there also may be some drawbacks. One is that there are a number of other strong climate policies beyond the studies CORE policies that we have not yet considered [77,78]. In addition, the conjoint analysis may show greater relevance of dimensions that have more levels, as the variability encompassed by these levels is then greater. In our study, the factor ‘compensatory measures’ has five attribute levels, and the factors ‘climate effect’ and ‘scale of action’ each have three attribute levels. The results show that compensatory measures have the most significant effect on acceptance, which may be partly due to the design of the tool. It is also important to note that the list of factors and attribute levels used in this study, although based on previous exploratory research, should not be considered exhaustive. A different set of attribute levels could lead to different results and possibly provide further insights.

6.3. Conclusions and Implications

Binding international political agreements and climate change are driving the need for effective instruments for a more responsible and sustainable management of carbon emissions [1,2]. CO2 pricing is one such effective tool for reducing CO2 emissions [3,21,22] and also addresses the environmental and social dimensions of sustainability through the targeted use of revenues [6,21]. Public acceptance of national climate policies is crucial for their success [10], and CO2 pricing is the least preferred measure among them. However, it has been shown that acceptance strongly depends on the specific design of the pricing [13], which provides policymakers with effective levers. By comparing the effects on public acceptance of three different aspects of the CO2 pricing design in Germany, we are able to advise policymakers on how best to use the available levers to move towards a greener and socially equitable future.
We provide empirical evidence that compensatory measures in the form of revenue reinvestment play a crucial role in the German public’s acceptance of CO2 pricing. The only notable difference between the different social groups surveyed was in their views on compensation measures, and the results confirm that the individual financial burden is a significant barrier to achieving government sustainability goals. However, in order to achieve global sustainability outcomes, it is essential that such studies are conducted worldwide, as comparisons with previous studies reveal local differences in acceptance rates and preferences [27,28].
The climate effect is relevant for the acceptance of the measure, but the awareness of the financial challenge and the technical feasibility is a relevant obstacle. Significant differences in the relative importance of this attribute between the two survey variants (A: only climate effect without costs, and B: including costs associated with climate measures) indicate that costs are another relevant predictor of acceptance of CO2 pricing and warrant further investigation. We observed not only an interaction effect of costs and effectiveness on the acceptance of CO2 pricing but also a stronger steering effect and a higher reinvestment budget with higher pricing. The results suggest that transparent earmarking of revenues that lead to emission reductions is necessary to strengthen public perception and acceptance and to gain the citizens’ confidence that the purpose of CO2 pricing is a meaningful and socially equitable implementation rather than a mere increase in the national budget.
While the scale of action had less influence on acceptance, effective communication strategies are essential for the introduction of CORE. Political actors need to carefully communicate their proposal for CORE to the public, considering the concerns and demands of their constituents. Governments must ensure that the debate is based on the best available evidence, and—once carbon pricing is in place—report transparently on its effects, providing ongoing information on how revenues are spent, their outcomes, and whether the intended beneficiaries have been successfully reached. Such clear communication would facilitate public understanding of the processes, promote acceptance, and positively influence behavioral change to mitigate climate change and support a sustainable transformation.

Author Contributions

W.W.: Conceptualization, Formal Analysis, Data Curation, Writing, Visualization, Supervision. M.F.: Conceptualization: Methodology, Formal analysis, Investigation, Data Curation, Writing. J.K.: Conceptualization: Methodology, Investigation, Supervision, Funding Acquisition. M.Z.: Conceptualization: Supervision, Project Administration, Funding Acquisition. All authors have read and agreed to the published version of the manuscript.

Funding

This work was a part of the COreFAKTEN project and was funded by the German Federal Ministry of Economic Affairs and Climate Action (03EI5202C).

Institutional Review Board Statement

Ethical review and approval were waived for this study, as our research falls into a category that does not require such approval in Germany. This category includes all non-invasive, non-clinical research on human subjects, where subjects are transparently informed about the purpose, aim, and risks of the studies, and where these risks are reasonably low. Prior to data collection, respondents were informed that it was important to understand citizens’ unbiased opinions and attitudes toward sustainable energy and that it would be of great value if they shared their views. Nevertheless, we stressed that they were free to participate or not and that their participation was completely voluntary. We also ensured a high standard of privacy protection and let participants know that none of their responses could be attributed to them personally.

Informed Consent Statement

Informed consent was obtained from all subjects involved in the study.

Data Availability Statement

The raw data supporting the conclusions of this article will be made available by the authors on reasonable request and with the permission of the funding organization.

Acknowledgments

The authors would like to thank all the reviewers for their valuable and constructive feedback on the manuscript of this paper. We would also like to acknowledge the collaboration with adelphi and Fraunhofer ISI institutions and thank Julia Offermann and Valerie Michaux for their scientific support. We would also thank all participants for sharing their views on the subject of the study.

Conflicts of Interest

The authors declare no conflict of interest.

Appendix A

Table A1. Comparison of statistical data for Germany, the total sample, the commuters, social welfare recipients, and the control group on age, gender, educational attainment, and state of residence. Derivation in the sample from the German population is given in brackets.
Demographic CharacteristicsGermany
(as available in 2021)
Overall
(N = 1209)
Commuters
(n = 401)
Social Welfare Recipients
(n = 401)
Control Group
(n = 407)
Age 1
[79]
18 < 20 years2.3%1.5% (−0.8%)1.7% (−0.6%)0.0% (−2.3%)2.7% (+0.4%)
20 < 40 years29.5%26.1% (−3.4%)31.7% (+2.2%)17.5% (−12.0%)29.2% (−0.3%)
40 < 60 years33.8%47.0% (+14.8%)48.8% (+15.0%)55.6% (+11.8%)36.9% (+3.1%)
60 < 80 years26.2%25.2% (−1.0%)17.8% (−18.4%)26.7% (+0.5%)31.0% (+4.8%)
≥80 years8.5%0.2% (−8.3%)0.0% (−8.5%)0.2% (−8.3%)0.2% (−8.3%)
Gender
[80]
Female50.7%45.0% (−5.7%)42.9% (−7.8%)42.4% (−8.3%)49.6% (−1.1%)
Male49.3%54.8% (+5.5%)57.1% (+7.8%)57.1% (+7.8%)50.4% (+1.1%)
DiverseN/V0.2% (N/V)0.0% (N/V)0.5% (N/V)0.0% (N/V)
Education
[81]
No certificate (so far)N/V0.7% (N/V)0.0% (N/V)1.2% (N/V)1.0% (N/V)
Basic school qualificationN/V14.6% (N/V)8.0% (N/V)24.2% (N/V)11.5% (N/V)
Secondary school certificateN/V20.4% (N/V)19.7% (N/V)19.7% (N/V)21.9% (N/V)
Qualification for university entranceN/V10.4% (N/V)13.5% (N/V)6.2% (N/V)11.3% (N/V)
Completed apprenticeship55.9%38.5% (−17.4%)34.2% (−21.7%)40.6% (−15.3%)40.8% (−15.1%)
University degree14.7%14.6% (−0.1%)23.7% (+9.0%)7.2% (−7.5%)13.0% (−1.7%)
Doctor’s degree1.2%0.7% (−0.5%)1.0% (−0.2%)0.5% (−0.7%)0.5% (−0.7%)
Federal state
[82]
Baden-Württemberg13.3%11.3% (−2.0%)16.0% (2.7%)8.0% (−5.3%)10.1% (−3.2%)
Bavaria15.8%14.7% (−1.1%)18.2% (+2.4%)8.7% (−7.1%)17.2% (+1.4%)
Berlin4.4%3.8% (−0.6%)1.7% (−2.7%)5.0% (+0.6%)4.7% (+0.3%)
Brandenburg3.0%4.5% (+1.5%)5.5% (+2.5%)5.0% (−2.0%)2.9% (−0.1%)
Bremen0.8%0.9% (+0.1%)0.2% (−0.6%)1.5% (+0.7%)1.0% (+0.2%)
Hamburg2.2%2.2% (+0.0%)1.0% (−1.2%)2.7% (+0.5%)2.7% (+0.5%)
Hessia7.5%7.4% (−0.1%)8.2% (+0.7%)7.0% (−0.5%)6.9% (−0.6%)
Lower Saxony9.6%9.4% (−0.2%)10.2% (0.6%)8.0% (−1.6%)10.1% (+0.5%)
Mecklenburg-Vorpommern1.9%2.5% (+0.6%)2.7% (+0.6%)2.5% (+0.6%)2.2% (+0.3%)
North Rhine-Westphalia21.6%20.2% (−1.4%)16.2% (−5.4%)24.9% (+3.3%)19.4% (−2.2%)
Rhineland-Palatinate4.9%6.6% (+1.7%)7.7% (+2.8%)5.2% (+0.3%)6.9% (+2.0%)
Saarland1.2%1.6% (+0.4%)1.2% (+0.0%)2.5% (+1.3%)1.0% (−0.2%)
Saxony4.9%3.8% (−0.9%)3.5% (−1.4%)4.5% (−0.4%)3.4% (−1.5%)
Saxony-Anhalt2.7%3.2% (+0.5%)1.7% (−1.0%)5.7% (+3.0%)2.2% (−0.5%)
Schleswig-Holstein3.5%3.9% (+0.4%)2.5% (−1.0%)4.5% (+1.0%)4.7% (+1.2%)
Thuringia2.6<%4.1% (+1.5%)3.2% (+0.6%)4.2% (+1.6%)4.7% (+2.1%)
1 Number in relation to population above legal age, as only those were allowed to participate in the survey.

References

  1. United Nations. PARIS AGREEMENT. 2015. Available online: https://unfccc.int/files/essential_background/convention/application/pdf/english_paris_agreement.pdf (accessed on 6 March 2024).
  2. Brundtland, G.H. Our Common Future: Report of the World Commission on Environment and Development; UN-Document A/42/427; WCED: Geneva, Switzerland, 1987. [Google Scholar]
  3. Stiglitz, J.E.; Stern, N.; Duan, M.; Edenhofer, O.; Giraud, G.; Heal, G.; La Rovere, E.; Morris, A.; Moyer, E.; Pangestu, M. Report of the High-Level Commission on Carbon Prices; International Bank for Reconstruction and Development and International Development Association: Washington, DC, USA, 2017. [Google Scholar] [CrossRef]
  4. Aldy, J.E.; Stavins, R.N. The promise and problems of pricing carbon: Theory and experience. J. Environ. Dev. 2012, 21, 152–180. [Google Scholar] [CrossRef]
  5. Weitzman, M.L. Voting on prices vs. voting on quantities in a world climate assembly. Res. Econ. 2017, 71, 199–211. [Google Scholar] [CrossRef]
  6. Baranzini, A.; Carattini, S. Effectiveness; earmarking, and labeling: Testing the acceptability of carbon taxes with survey data, Environ. Environ. Econ. Policy Stud. 2017, 19, 197–227. [Google Scholar] [CrossRef]
  7. Umweltbundesamt [Federal Environmental Ministry]. CO2-Bepreisung im Verkehrs- und Gebäudebereich Sozialverträglich Gestalten. Herausforderungen, Strategien, Instrumente. 2022. Available online: https://www.umweltbundesamt.de/sites/default/files/medien/1410/publikationen/2022-12-07_climate-change_47-2022_co2-bepreisung_verkehrs-gebaeudebereich_sozialvertraeglich.pdf (accessed on 5 January 2024).
  8. Bundesministerium für Umwelt, Naturschutz und nukleare Sicherheit (BMU). Klimaschutz in Zahlen: Fakten, Trends und Impulse deutscher Klimapolitik. [Climate Protection in Figures: Facts, Trends and Impulses of German Climate Policy]; Bundesministerium für Umwelt, Naturschutz und Nukleare Sicherheit (BMU): Berlin, Germany, 2020. [Google Scholar]
  9. Bundesministerium der Justiz [Federal Ministry of Justice]. Brennstoffemissionshandelsgesetz [German Fuel Emissions Trading Act] §10 as by 12th of December 2019 (BGBl. I S. 2728). Available online: https://www.gesetze-im-internet.de/behg/BJNR272800019.html (accessed on 12 January 2024).
  10. Drews, S.; Van den Bergh, J.C. What explains public support for climate policies? A review of empirical and experimental studies. Clim. Policy 2016, 16, 855–876. [Google Scholar] [CrossRef]
  11. Carattini, S.; Carvalho, M.; Frankhauser, S. How to Make Carbon Taxes more Acceptable; Grantham Research Institute on Climate Change and the Environment, and Centre for Climate Change Economics and Policy, London School of Economics and Political Science: London, UK, 2017; 57p. [Google Scholar]
  12. Carattini, S.; Baranzini, A.; Lalive, R. Is taxing waste a waste of time? Evidence from a supreme court decision. Ecol. Econ. 2018, 148, 131–151. [Google Scholar] [CrossRef]
  13. Bristow, A.L.; Wardman, M.; Zanni, A.M.; Chintakayala, P.K. Public acceptability of personal carbon trading and carbon tax. Ecol. Econ. 2010, 69, 1824–1837. [Google Scholar] [CrossRef]
  14. Simons, L.; Engelmann, L.; Arning, K.; Ziefle, M. Two sides of the same coin—Explaining the acceptance of CO2-based fuels for aviation using PLS-SEM by considering the production and product evaluation. Front. Energy Res. 2021, 9, 742109. [Google Scholar] [CrossRef]
  15. Heek, J.O.-V.; Arning, K.; Linzenich, A.; Ziefle, M. Trust and Distrust in Carbon Capture and Utilization Industry as Relevant Factors for the Acceptance of Carbon-Based Products. Front. Energy Res. 2018, 6. [Google Scholar] [CrossRef]
  16. Kluge, J.; Heek, J.O.-V.; Ziefle, M. How Will I Know about Local Energy Projects? A Conjoint-Analysis of Communication Preferences in Germany. Energy Res. Soc. Sci. 2021, 75, 102016. [Google Scholar] [CrossRef]
  17. Friedl, C.; Reichl, J. Realizing energy infrastructure projects—A qualitative empirical analysis of local practices to address social acceptance. Energy Policy 2016, 89, 184–193. [Google Scholar] [CrossRef]
  18. Zaunbrecher, B.S.; Ziefle, M. Integrating acceptance-relevant factors into wind power planning: A discussion. Sustain. Cities Soc. 2016, 27, 307–314. [Google Scholar] [CrossRef]
  19. Purvis, B.; Mao, Y.; Robinson, D. Three pillars of sustainability: In search of conceptual origins. Sustain. Sci. 2019, 14, 681–695. [Google Scholar] [CrossRef]
  20. Pigou, A.C. The Economics of Welfare; Routledge: London, UK, 2017. [Google Scholar] [CrossRef]
  21. Carattini, S.; Carvalho, M.; Frankhauser, S. Overcoming public resistance to carbon taxes. WIREs Clim. Chang. 2018, 9, e531. [Google Scholar] [CrossRef] [PubMed]
  22. Aghion, P.; Hemous, D.; Veugelers, R. No Green Growth without Innovation, Bruegel Policy Brief-2009/07. 2009. Available online: https://www.bruegel.org/policy-brief/no-green-growth-without-innovation (accessed on 15 February 2024).
  23. Gough, I.; Abdallah, S.; Johnson, V.; Ryan-Collins, J.; Smith, C. The Distribution of total Greenhouse Gas Emissions by Householfs in the UK, and Some Implications for Social Policy. LSE STICERD Research Paper 152. 2011. Available online: https://papers.ssrn.com/sol3/papers.cfm?abstract_id=1935761 (accessed on 19 February 2024).
  24. Metcalf, G.E. Designing a carbon tax to reduce U.S. greenhouse gas emissions. Rev. Environ. Econ. Policy 2009, 3, 63–83. [Google Scholar] [CrossRef]
  25. Sterner, T. Fuel Taxes and the Poor: The Distributional Effects of Gasoline Taxation and Their Implications for Climate Policy; Routledge: London, UK, 2012; ISBN 9781138184237. [Google Scholar]
  26. Seghezzo, L. The five dimensions of sustainability. Environ. Politics 2009, 18, 539–556. [Google Scholar] [CrossRef]
  27. Jagers, S.C.; Lachapelle, E.; Martinsson, J.; Matti, S. Bridging the ideological gap? How fairness perceptions mediate the effect of revenue recycling on public support for carbon taxes in the United States, Canada and Germany. Rev. Policy Res. 2021, 38, 529–554. [Google Scholar] [CrossRef]
  28. Beiser-McGrath, L.F.; Bernauer, T. Could revenue recycling make effective carbon taxation politically feasible? Sci. Adv. 2019, 5, eaax3323. [Google Scholar] [CrossRef] [PubMed]
  29. Bohdanowicz, Z. Different countries, common support for climate change mitigation: The case of Germany and Poland. Climate 2021, 9, 27. [Google Scholar] [CrossRef]
  30. Lemken, D.; Kraus, K.; Nitzko, S.; Spiller, A. Staatliche Eingriffe in die Lebensmittelwahl: Welche klimapolitischen Instrumente unterstützt die Bevölkerung [Government intervention in food choices: Which climate policy instruments does the public support?]? GAIA Ecol. Perspect. Sci. Soc. 2018, 27, 363–372. [Google Scholar] [CrossRef]
  31. Carattini, S.; Baranzini, A.; Thalmann, P.; Varone, F.; Vöhringer, F. Green taxes in a post-Paris world: Are millions of nays inevitable? Environ. Resour. Econ. 2017, 68, 97–128. [Google Scholar] [CrossRef]
  32. Clinch, J.P.; Dunne, L. Environmental tax reform: An assessment of social responses in Ireland. Energy Policy 2006, 34, 950–959. [Google Scholar] [CrossRef]
  33. Hammar, H.; Jagers, S.C. Can trust in politicians explain individuals’ support for climate policy? The case of CO2 tax. Clim. Policy 2006, 5, 613–625. [Google Scholar] [CrossRef]
  34. Gevrek, Z.E.; Uyduranoglu, A. Public preferences for carbon tax attributes. Ecol. Econ. 2015, 118, 186–197. [Google Scholar] [CrossRef]
  35. Mattauch, L.; Sommer, S.; Pahle, M. Supporting Carbon Taxes: The Role of Fairness; INET Oxford Working Papers 2020-23; Institute for New Economic Thinking at the Oxford Martin School, University of Oxford: Oxford, UK, 2020. [Google Scholar]
  36. Beuermann, C.; Santarius, T. Ecological tax reform in Germany: Handling two hot potatoes at the same time. Energy Policy 2006, 34, 917–929. [Google Scholar] [CrossRef]
  37. Ziegler, A. The relevance of attitudinal factors for the acceptance of energy policy measures: A micro-econometric analysis. Ecol. Econ. 2019, 157, 129–140. [Google Scholar] [CrossRef]
  38. Nielsson, A.; Biel, A. Acceptance of climate change policy measures: Role framing and value guidance. Eur. Environ. 2008, 18, 203–215. [Google Scholar] [CrossRef]
  39. Harring, N.; Jagers, S.C.; Matti, S. Public support for pro-environmental policy measures: Examining the impact of personal values and ideology. Sustainability 2017, 9, 679. [Google Scholar] [CrossRef]
  40. De Groot, J.I.; Schuitema, G. How to make the unpopular popular? Policy characteristics, social norms and the acceptability of environmental policies. Environ. Sci. Policy 2012, 19, 100–107. [Google Scholar] [CrossRef]
  41. Poortinga, W.; Whitmarsh, L.; Steg, L.; Böhm, G.; Fisher, S. Climate change perceptions and their individual-level determinants: A cross-European analysis. Glob. Environ. Chang. 2019, 55, 25–35. [Google Scholar] [CrossRef]
  42. Merten, M.J.; Becker, A.C.; Matthies, E. What explains German consumers’ acceptance of carbon pricing? Examining the roles of pro-environmental orientation and consumer coping style. Energy Res. Soc. Sci. 2022, 85, 102367. [Google Scholar] [CrossRef]
  43. Finuncane, M.L.; Alhakami, A.; Slovic, P.; Johnson, S.M. The affect heuristic in judgments of risks and benefits. J. Behav. Decis. Mak. 2000, 13, 1–17. [Google Scholar] [CrossRef]
  44. Backhaus, K.; Erichson, B.; Weiber, R. Fortgeschrittene Multivariate Analysemethoden: Eine Anwendungsorientierte Einführung [Advanced Multivariate Analysis Methods: An Application-Oriented Introduction]; Springer: Berlin/Heidelberg, Germany, 2015. [Google Scholar] [CrossRef]
  45. Baier, D.; Brusch, M. Conjointanalyse: Methoden-Anwendungen-Praxisbeispiele [Conjoint Analysis: Methods-Applications-Practical Examples]; Springer: Berlin/Heidelberg, Germany, 2009. [Google Scholar] [CrossRef]
  46. Sawtooth Software. The CBC/HB System for Hierarchical Bayes Estimation. Sawtooth Software Research Paper Series, Version 5.0. 2009. Available online: https://www.sawtoothsoftware.com/support/technical-papers/hierarchical-bayes-estimation/cbc-hb-technical-paper-2009 (accessed on 30 June 2023).
  47. Luce, R.D.; Tukey, J.W. Simultaneous conjoint measurement: A new type of fundamental measurement. J. Math. Psychol. 1964, 1, 1–27. [Google Scholar] [CrossRef]
  48. Green, P.E.; Rao, V.R. Conjoint measurement for quantifying judgmental data. J. Mark. Res. 1971, 8, 355–363. [Google Scholar] [CrossRef]
  49. Gustafsson, A.; Herrmann, A.; Huber, F. Conjoint Analysis as an Instrument of Market Research Practice. In Conjoint Measurement; Gustafsson, A., Herrmann, A., Huber, F., Eds.; Springer: Berlin/Heidelberg, Germany, 2003; pp. 5–46. [Google Scholar] [CrossRef]
  50. Rao, V.R. Applied Conjoint Analysis; Springer: Berlin/Heidelberg, Germany, 2014. [Google Scholar] [CrossRef]
  51. Dütschke, E.; Preuß, S.; Brunzema, I.; Piria, R. Using the Revenues from Carbon Pricing—Insights into the Acceptance and Perceptions of Affected Groups. Energy Policy 2023, 175, 13468. [Google Scholar] [CrossRef]
  52. Barckhausen, A.; Becker, J.; Dütschke, E.; Piria, R.; Preuß, S.; Wilkowska, W.; Ziefle, M. Akzeptanz und Kommunikation eines CO2-Bepreisungssystems [Acceptance and Communication of a CO2 Pricing System]; Adelphi Research gGmbH: Berlin, Germany, 2022. [Google Scholar]
  53. Maestre-Andrés, S.; Drews, S.; van den Bergh, J. Perceived fairness and public acceptability of carbon pricing: A review of the literature. Clim. Policy 2019, 19, 1186–1204. [Google Scholar] [CrossRef]
  54. Maestre-Andrés, S.; Drews, S.; Savin, I.; den Bergh, J.V. Carbon tax acceptability with information provision and mixed revenue uses. Nat. Commun. 2021, 12, 7017. [Google Scholar] [CrossRef] [PubMed]
  55. Wolf, I. Soziales Nachhaltigkeitsbarometer der Energiewende 2019: Kernaussagen und Zusammenfassung der wesentlichen Ergebnisse [Social Sustainability Barometer of the Energiewende 2019: Key Statements and Summary of the Key Results]; IASS: Potsdam, Germany, 2020. [Google Scholar] [CrossRef]
  56. Fitzgerald, J.; Wolak, J. The roots of trust in local government in western Europe. Int. Political Sci. Rev. 2016, 37, 130–146. [Google Scholar] [CrossRef]
  57. Miroshnik, V. Culture and international management: A review. J. Manag. Dev. 2002, 21, 521–544. [Google Scholar] [CrossRef]
  58. Hofstede, G. Culture’s Consequences: Comparing Values, Behaviors, Institutions and Organizations across Nations; Sage Publications: Thousand Oaks, CA, USA, 2001. [Google Scholar]
  59. Sommer, S.; Mattauch, L.; Pahle, M. Supporting carbon taxes: The role of fairness. Ecol. Econ. 2022, 195, 107359. [Google Scholar] [CrossRef]
  60. Dentler, K.; Bluemke, M.; Gabriel, O.W. German Satisfaction with the Political System Short Scale (SPS). In Zusammenstellung sozialwissenschaftlicher Items und Skalen (ZIS); ZIS—GESIS Leibniz Institute for the Social Sciences: Mannheim, Germany, 2020. [Google Scholar] [CrossRef]
  61. Beierlein, C.; Kemper, C.J.; Kovaleva, A.; Rammstedt, B. PEKS—Political Efficacy Kurzskala [Manual]. In Leibniz-Zentrum für Psychologische Information und Dokumentation (ZPID); Elektronisches Testarchiv; ZPID: Trier, Germany, 2012. [Google Scholar] [CrossRef]
  62. Kannapin, O. Prädiktormuster Selbstberichteten Umweltverhaltens [Predictor Patterns of Self-Reported Environmental Behaviour]; Staats- und Universitätsbibliothek Hamburg Carl von Ossietzky: Hamburg, Germany, 2000. [Google Scholar]
  63. Krampen, G.; Ronco, C.; Martini, M. Analysen Umweltbewußten Handelns in Italien und Deutschland Anhand des Handlungstheoretischen Partialmodells der Persönlichkeit; Univ., Fachbereich I.: Trier, Germany, 1993. Available online: http://www.jstor.org/stable/43645430 (accessed on 7 February 2024).
  64. Ajzen, I. Constructing a Theory of Planned Behavior Questionnaire; University of Massachusetts Amherst: Amherst, MA, USA, 2006; Available online: https://people.umass.edu/aizen/pdf/tpb.measurement.pdf (accessed on 14 April 2024).
  65. Statistisches Bundesamt. Einkommen, Einnahmen und Ausgaben privater Haushalte in Deutschland. 2 December 2022. Available online: https://www.destatis.de/DE/Themen/Gesellschaft-Umwelt/Einkommen-Konsum-Lebensbedingungen/Einkommen-Einnahmen-Ausgaben/Tabellen/deutschland-lwr.html (accessed on 8 April 2024).
  66. Orme, B. Interpreting the Results of Conjoint Analysis, Getting Started with Conjoint Analysis: Strategies for Product Design and Pricing Research; Research Publishers: Madison, WI, USA, 2010; pp. 77–88. [Google Scholar]
  67. Osgood, C.E.; Suci, G.J.; Tannenbaum, P.H. The Measurement of Meaning; University of Illinois Press: Urbana, IL, USA, 1957. [Google Scholar]
  68. Kallbekken, S.; Sælen, H. Public acceptance for environmental taxes: Self-interest, environmental and distributional concerns. Energy Policy 2011, 39, 2966–2973. [Google Scholar] [CrossRef]
  69. Hammar, H.; Jagers, S.C. Is there a trade-off between cost-effective climate policies and political legitimacy? In From Kyoto to the Town Hall; Routledge: London, UK, 2013; pp. 57–72. [Google Scholar]
  70. Kallbekken, S.; Aasen, M. The demand for earmarking: Results from a focus group study. Ecol. Econ. 2010, 69, 2183–2190. [Google Scholar] [CrossRef]
  71. Marcantonini, C.; Ellerman, A.D. The Implicit Carbon Price of Renewable Energy Incentives in Germany; RSCAS Working Paper 2014/28; European University Institute: Fiesole, Italy, 2014. [Google Scholar] [CrossRef]
  72. Matthies, E.; Becker, A.; Bobeth, S. CO2-Bepreisung zwischen wirkungsvollem Instrument und Überforderung? Eine Pilotstudie zu Bedingungen der Akzeptabilität [CO2 pricing between effective instrument and excessive demand? A pilot study on conditions of acceptability]. GAIA Ecol. Perspect. Sci. Soc. 2020, 29, 249–257. [Google Scholar] [CrossRef]
  73. Hammar, H.; Jagers, S.C. What is a fair CO2 tax increase? On fair emission reductions in the transport sector. Ecol. Econ. 2007, 61, 377–387. [Google Scholar] [CrossRef]
  74. Bundesministerium für Familie, Senioren, Frauen und Jugend [Federal Ministry for Family Affairs, Senior Citizens, Women and Youth]. Weitere Entlastungen Unterstützen Familien ab Januar 2023 spürbar. [Further Relief Will Significantly Support Families from January 2023]. 2022. Available online: https://www.bmfsfj.de/bmfsfj/aktuelles/alle-meldungen/weitere-entlastungen-unterstuetzen-familien-ab-januar-2023-spuerbar-208100#:~:text=Januar%202023%20um%20561%20Euro,Kilometer%20gestiegen (accessed on 30 June 2023).
  75. Thalmann, P. The public acceptance of green taxes: 2 million voters express their opinion. Public Choice 2004, 119, 179–217. [Google Scholar] [CrossRef]
  76. Kallbekken, S.; Kroll, S.; Cherry, T.L. Do you not like Pigou, or do you not understand him? Tax aversion and revenue recycling in the lab. J. Environ. Econ. Manag. 2011, 62, 53–64. [Google Scholar] [CrossRef]
  77. Watari, T.; Nansai, K.; Nakajima, K.; Giurco, D. Sustainable Energy Transitions Require Enhanced Resource Governance. J. Clean. Prod. 2021, 312, 127698. [Google Scholar] [CrossRef]
  78. Feldhaus, P.; Fuerstenwerth, D.; Gohl, M.; Schroeter, B.; Vahlenkamp, T. Transformation of Europe’s Power System until 2050 Including Specific Considerations for Germany Electric Power and Natural Gas Practice; McKinsey: Chicago, IL, USA, 2010. [Google Scholar]
  79. Statistisches Bundesamt. Bevölkerung Nach Altersgruppen (ab 2011). 20 June 2023. Available online: https://www.destatis.de/DE/Themen/Gesellschaft-Umwelt/Bevoelkerung/Bevoelkerungsstand/Tabellen/liste-altersgruppen.html#249808 (accessed on 5 April 2024).
  80. Statistisches Bundesamt. Bevölkerung Nach Nationalität und Geschlecht. Available online: https://www.destatis.de/DE/Themen/Gesellschaft-Umwelt/Bevoelkerung/Bevoelkerungsstand/Tabellen/deutsche-nichtdeutsche-bevoelkerung-nach-geschlecht-deutschland.html (accessed on 5 April 2024).
  81. Statistisches Bundesamt. Bildungsstand der Bevölkerung. 25 November 2020. Available online: https://www.destatis.de/DE/Themen/Gesellschaft-Umwelt/Bildung-Forschung-Kultur/Bildungsstand/Publikationen/_publikationen-bildungsstand.html?nn=209288#_t0ke8baci (accessed on 5 April 2024).
  82. bpb.de. Bevölkerung Nach Bundesländern. 14 January 2022. Available online: https://www.bpb.de/kurz-knapp/zahlen-und-fakten/soziale-situation-in-deutschland/61535/bevoelkerung-nach-bundeslaendern/ (accessed on 5 April 2024).
Figure 1. Example of a choice task (acceptance study, variant B): The participant chooses one of four presented alternatives.
Sustainability 16 03378 g001
Figure 2. Means resulting from the (self-)assessments of environmental and political aspects in the whole sample (N = 1209) and in the three study groups (error bars indicate standard errors).
Sustainability 16 03378 g002
Figure 3. Means resulting from the (self-)assessed prior knowledge regarding climate goals, energy transition, and CO2 pricing in the whole sample (N = 1209) and in the three study groups (error bars indicate standard errors).
Sustainability 16 03378 g003
Figure 4. Relative importance of CO2 pricing acceptance attributes (N = 1209; * refers to variant B of the questionnaire, i.e., climate effect with consideration of price; error bars refer to standard errors).
Sustainability 16 03378 g004
Figure 5. Part-worth utilities for the aspects shaping acceptance assessments of CO2 pricing (N = 1209; error bars indicate standard deviations).
Sustainability 16 03378 g005
Figure 6. Differences between, and stabilities within, the three study groups on the attribute level (variant A: n = 603; *** p ≤ 0.001; ** p ≤ 0.01; * p ≤ 0.05; error bars indicate standard deviations).
Sustainability 16 03378 g006
Figure 7. Differences between, and stabilities within, the three study groups on the attribute level (variant B: n = 606; *** p ≤ 0.001, * p ≤ 0.05; error bars indicate standard deviations).
Sustainability 16 03378 g007
Figure 8. Polarity profile of assessments of CO2 pricing in both acceptance studies; top: overall (N = 1209), bottom: for the three study groups (commuters n = 401, social welfare recipients n = 401, control group n = 407).
Sustainability 16 03378 g008
Table 1. Overview of the examined acceptance attributes and their gradations (=levels) in the study.
Compensatory measures (revenue reinvestments)Sustainability 16 03378 i001
Reduction of electricity price
The revenue from CO2 pricing is used to reduce the price of electricity for consumers. This can be achieved, for example, by reducing or abolishing the levy for the promotion of energy production from renewable energies in accordance with the Renewable Energy Sources Act (EEG levy). In this way, climate-friendly types of heating and mobility (e.g., heat pumps, electric cars) become more affordable.
Sustainability 16 03378 i002
Financial support for public environmental projects
The revenue from CO2 pricing is used to promote governmental investment in climate protection. These are measures that facilitate the switch to climate-friendly alternatives, especially investments in infrastructure. Examples include the expansion of public transport, the development of charging infrastructure for electric vehicles, the expansion of cycling infrastructure, and the expansion of heating networks.
Sustainability 16 03378 i003
Financial support for private environmental projects
This measure provides financial support for households to make their means of transport and buildings more climate-friendly. As a result, they are less affected by CO2 pricing. Examples of such private investments are the energy-efficient refurbishment of buildings, financial support for the purchase of climate-friendly household appliances, or the purchase of an electric car.
Sustainability 16 03378 i004
Financial support for low-income and particularly affected households
In this measure, households that have a low income and/or are particularly affected by CO2 pricing receive support through, e.g., an increased commuting allowance, a mobility premium, or an increase in housing allowance.
Sustainability 16 03378 i005
Climate dividend
With the climate dividend, a lump sum is paid back to each person in a household. This amount is then freely available to the households.
Climate effect (and price)Sustainability 16 03378 i006
High effect on climate (and high price)
Variant A: The climate effect achieved is high. The climate targets can be achieved and exceeded.
Variant B: The climate effect achieved is high at a high CO2 price of EUR 180 per ton of CO2. This roughly corresponds to a cost of EUR 0.42–0.60 per liter of heating oil, gasoline, or diesel. The climate targets can thus probably be achieved and exceeded.
Sustainability 16 03378 i007
Medium effect on climate (and medium price)
Variant A: The climate effect achieved is medium. The climate targets can be achieved in time or later than planned.
Variant B: The climate effect achieved and the CO2 price are medium–high (EUR 120 per ton of CO2). This means that the climate targets can probably be achieved only just in time or later than planned. A medium CO2 price roughly corresponds to costs of EUR 0.28–0.40 per liter of heating oil, gasoline, or diesel.
Sustainability 16 03378 i008
Low effect on climate (and low price)
Variant A: The climate effect achieved is low. The climate targets may be achieved significantly later or not at all.
Variant B: The climate effect achieved is low with a low CO2 price of EUR 60 per ton of CO2. This roughly corresponds to costs of EUR 0.14–0.20 per liter of heating oil, gasoline, or diesel. The climate targets can thus probably be achieved significantly later or not at all.
Scale of actionSustainability 16 03378 i009
In your city
Revenues from CO2 pricing are used to support projects in the respondent’s city. They are thus visible in places of their everyday life (e.g., by planting green spaces, extending cycle paths, etc.).
Sustainability 16 03378 i010
In your state
The revenue from CO2 pricing is used to implement measures in the respondent’s state. This could be, for example, a nationwide improvement of public transport.
Sustainability 16 03378 i011
Germany-wide
Revenue from the CO2 price is used to implement measures throughout Germany. These could include, for example, a nationwide expansion of the charging infrastructure for electric cars or improvements to climate-friendly travel options.
Table 2. Constructs used in the survey to map the political and environmental attitudes of the study participants.
ConstructItem ExamplesUsed Scales
Political system satisfaction [60];
α = 0.81
“The political system of the Federal Republic of Germany is upright
and fair.”
“The political system of the Federal Republic of Germany protects the fundamental freedom of its citizens.”
“In the political system of the Federal Republic of Germany, only the welfare of a few interest groups is taken into account and not the welfare of all population groups.” (recoded)
Six-point Likert- scales ranging from 1 (=”I do not agree at all”) to 6 (=“I fully agree”)
Political self-efficacy [61]; α = 0.86“I can understand and assess important political issues well.”
“I have the confidence to actively participate in a conversation about political issues.”
Conscious environmental behavior [62], extended by own items; α = 0.74“I actively participate in a group that works for the environment and climate.”
“I am careful not to take unnecessarily long hot showers in order to keep my hot water consumption low for the benefit of the environment.”
“I make others aware of their misconduct toward the environment.”
Environmental self-efficacy [63], extended by own items according to [64]; α= 0.74“I have no possibility of changing my mobility behavior in such a way that my CO2 emissions are significantly reduced.” (recoded)
“I can contribute to environmental and climate protection through my everyday behavior.”
“People are powerless in the face of environmental and climate problems.”
Table 3. Demographic characteristics of the sample (N = 1209) and in the three study groups.
Demographic CharacteristicsOverall
(N = 1209)
Commuters
(n = 401)
Social Welfare
Recipients (n = 401)
Control Group
(n = 407)
Age M = 48.3
(SD = 13.6)
M = 46.0
(SD = 13.1)
M = 51.1
(SD = 11.0)
M = 47.8
(SD = 15.9)
GenderFemale45.00%42.90%42.40%49.60%
Male54.80%57.10%57.10%50.40%
Diverse0.20%-0.50%-
EducationNo certificate (so far)0.70%-1.20%1.00%
Basic school qualification14.60%8.00%24.20%11.50%
Secondary school certificate20.40%19.70%19.70%21.90%
Qualification for university entrance10.40%13.50%6.20%11.30%
Completed apprenticeship38.50%34.20%40.60%40.80%
University degree14.60%23.70%7.20%13.00%
Doctor’s degree0.70%1.00%0.50%0.50%
Household net income<1000 €25.50%3.50%62.80%10.30%
1001 €–2000 €26.50%20.00%28.90%30.50%
2001 €–3000 €20.90%27.40%6.90%28.50%
3001 €–4000 €14.00%21.70%1.20%18.90%
4001 €–5000 €8.10%16.20%0.20%8.10%
>5000 €5.00%11.20%-3.70%
Residential areacentrally located in a city27.50%15.00%37.70%29.70%
on the outskirts29.70%23.40%33.60%31.90%
in a suburb14.80%18.00%13.20%13.30%
in the countryside28.00%43.60%15.50%25.10%
Table 4. Inferential statistics on the assessments of the attribute levels (Variant A and B) in the study groups.
Attributes and Their LevelsVariant A (n = 603)
95% CI [Lower, Upper]
Variant B (n = 606)
95% CI [Lower, Upper]
Compensatory measuresReduction of the electricity priceF(2,600) = 0.5, p = 0.608 (n.s.)
[34.74, 69.86]
F(2,603) = 0.75, p = 0.470 (n.s.)
[28.66, 35.18]
Financial support for low-income and particularly affected householdsF(2,600) = 40.58, p ≤ 0.001, η2 = 0.12
[2.45, 67.29]
F(2,603) = 14.96, p ≤ 0.001, η2 = 0.05
[3.29, 11.71]
Financial support for private environmental projectsF(2,600) = 5.32, p = 0.005, η2 = 0.02
[−23.82, 65.19]
F(2,603) = 7.21, p ≤ 0.001, η2 = 0.02
[−22.57, −15.61]
Financial support for public environmental projectsF(2,600) = 3.96, p = 0.020, η2 = 0.01
[−22.41, 65.30]
F(2,603) = 2.76, p = 0.064, (n.s.)
[−15.46, −8.14]
Climate dividendF(2,600) = 9.22, p ≤ 0.001, η2 = 0.03
[−17.74, 65.67]
F(2,603) = 0.59, p = 0.554 (n.s.)
[−12.64, −4.42]
Climate effect (and price)High effect on climate (and high price)F(2,600) = 0.11, p = 0.899 (n.s.)
[25.59, 69.13]
F(2,603) = 1.54, p = 0.215 (n.s.)
[−17.48, −8.38]
Medium effect on climate (and medium price)F(2,600) = 2.99, p = 0.051 (n.s.)
[−1.03, 67.01]
F(2,603) = 2.58, p = 0.076 (n.s.)
[18.12, 23.73]
Low effect on climate (and low price)F(2,600) = 0.8, p = 0.926 (n.s.)
[−40.62, 63.85]
F(2,603) = 3.58, p = 0.028, η2 = 0.01
[−12.73, −3.26]
Scale of actionGermany-wideF(2,600) = 1.72, p = 0.180 (n.s.)
[8.16, 67.74]
F(2,603) = 0.15, p = 0.856 (n.s.)
[9.29, 14.67]
In your stateF(2,600) = 1.25, p = 0.287 (n.s.)
[−9.29, 66.35]
F(2,603) = 3.27, p = 0.039, η2 = 0.01
[−5.70, −2.60]
In your cityF(2,600) = 1.52, p = 0.219 (n.s.)
[−14.93, 67.74]
F(2,603) = 2.26, p = 0.105 (n.s.)
[−10.22, −5.43]
Table 5. Results of regression analyses for the general perception of CO2 pricing (N = 1209; *** p ≤ 0.001, ** p ≤ 0.01; * p ≤ 0.05; VIF = variance inflation factor < 10).
PredictorsAdj. R2βtANOVA
General perception of CO2 pricingSupport vs. rejection64.60%−0.34−13.51 ***F(5,1203) = 442.1, p < 0.001
Meaningful vs. not meaningful −0.18−5.88 ***
Realistic vs. unrealistic −0.07−3.21 ***
Trustworthy vs. untrustworthy −0.08−3.05 **
Climate-friendly vs. climate-damaging −0.07−2.91 **
Conscious environmental behavior10.70%0.326.61 ***F(3,1205) = 49.1, p < 0.001
Satisfaction with political system 0.266.38 ***
Environmental self-efficacy 0.122.28 *
Table 6. Correlation coefficients between personality and policy factors and the general perception of CO2 pricing (N = 1209; ** p ≤ 0.001, * p < 0.05).
CEBESESPSPSESupportMeaningfulRealisticTrustworthyClimateFairnessBureaucraticBenefitComprehens
Acceptance of CO2 pricing0.25 **0.21 **0.24 **0.03−0.78 **−0.74 **−0.60 **−0.67 **−0.60 **−0.68 **−0.37 **−0.58 **−0.53 **
Conscious environmental behavior (CEB)-0.37 **0.17 **0.10 **−0.20 **−0.17 **−0.14 **−0.16 **−0.13 **−0.16 **−0.10 **−0.19 **−0.13 **
Environmental self-efficacy (ESE) -0.36 **0.06 *−0.16 **−0.16 **−0.15 **−0.16 **−0.15 **−0.16 **−0.06 *−0.15 **−0.12 **
Satisfaction with political system (SPS) -0.09 **−0.18 **−0.19 **−0.18 **−0.19 **−0.17 **−0.15 **−0.08 **−0.12 **−0.15 **
Political self-efficacy (PSE) -0.020.02−0.040.01−0.010.030.020.04−0.01
Support vs. rejection (Support) -0.82 **0.64 **0.76 **0.67 **0.77 **0.42 **0.71 **0.59 **
Meaningful vs. not meaningful (Meaningful) -0.65 **0.74 **0.70 **0.77 **0.40 **0.66 **0.59 **
Realistic vs. unrealistic (Realistic) -0.68 **0.56 **0.65 **0.43 **0.52 **−0.58 **
Trustworthy vs. untrustworthy (Trustworthy) -0.61 **0.76 **0.44 **0.68 **0.64 **
Climate-friendly vs. climate-damaging (Climate) -0.62 **0.43 **0.48 **0.53 **
Fair vs. unfair (Fairness) -0.46 **0.71 **0.60 **
No vs. high bureaucratic effort (Bureaucratic) -0.40 **0.47 **
Benefit vs. suffer (Benefit) -0.52 **
Comprehensible vs. complicated (Comprehens.) -
Disclaimer/Publisher’s Note: The statements, opinions and data contained in all publications are solely those of the individual author(s) and contributor(s) and not of MDPI and/or the editor(s). MDPI and/or the editor(s) disclaim responsibility for any injury to people or property resulting from any ideas, methods, instructions or products referred to in the content.

