
Analysis of Microclimatic Comfort Conditions in University Classrooms

Institute of Civil Engineering, Peter the Great St. Petersburg Polytechnic University, St. Petersburg 195251, Russia
*
Authors to whom correspondence should be addressed.
Sustainability 2024, 16(8), 3388; https://doi.org/10.3390/su16083388
Submission received: 6 March 2024
/
Revised: 6 April 2024
/
Accepted: 13 April 2024
/
Published: 18 April 2024
(This article belongs to the Topic Accessing and Analyzing Air Quality and Atmospheric Environment)
Abstract
:This paper considers microclimate to be one of the main contributors to thermal comfort in educational buildings. The influence of microclimate on well-being and productivity is considered. The role of microclimatic parameters is assessed from the perspective of building design, focusing on approaches to regulating these parameters. We also describe the formation of microclimate and the factors directly affecting it. The state of the microclimate of classrooms of an educational institution was analyzed, providing estimates of people’s real thermal sensations. The microclimate was assessed by the Fanger method. The PMV and PPD comfort indices were calculated for this purpose. The calculations were carried out thrice, i.e., based on the data obtained by using measuring equipment, based on the data from the survey and based on a SolidWorks model. Calculations in the program were carried out to validate the measured values and visualize the process of the distribution and localization of comfort indices. The results confirm that the indoor microclimate was generally favorable, and the PMV values obtained from the survey of people’s real sensations of thermal comfort were higher than the calculated PMV values. It was established that the PMV and PPD values corresponding to the largest deviations from the norm were as follows: −0.74/17% (PMV/PPD) for the calculation based on the real values of microclimatic parameters and 0.70/15.3% (PMV/PPD) for the calculation based on people’s thermal sensations. For applying the Fanger method for thermal comfort analysis in an educational institution in St. Petersburg, we upgraded the procedure, introducing a questionnaire survey. The mean PMV values calculated by the Fanger method were 0.16 lower than the PMV values obtained by the survey.
1. Introduction
1.1. Effect of Microclimate on Humans
Providing comfortable conditions in classrooms is one of the dominant factors in students’ academic performance. It is the indoor microclimate that largely determines the well-being and productivity of people. The thermal comfort experienced by people given a favorable combination of microclimatic parameters is crucial for high productivity and disease prevention. If the microclimatic parameters deviate from the optimal values, processes aimed at regulating heat production and heat loss are initiated in the human body to maintain a constant temperature [1,2].
Studies dedicated to the influence of microclimate on training efficiency indicate that microclimate can affect both the emotional and physical state of a person and, ultimately, their health. If the indoor microclimatic conditions are poor, the so-called sick building syndrome can occur among building occupants, consequently increasing the number of students suffering from respiratory diseases, leading to decreased productivity and frequent absences from class due to poor health [3,4].
1.2. Fanger’s Model of Thermal Comfort
Thermal comfort is a state of satisfaction with the thermal environment. An approach to evaluating thermal comfort aimed at reducing the influence of subjective thermal perception by building occupants on the evaluation procedure, offering a predictive model for obtaining the estimates, was formulated by P. Ole Fanger [5,6].
However, the first comfort equation does not take into account the individual characteristics of a person and other environmental parameters. Moreover, the first condition does not account for the requirements relative to the gas composition of the air (for example, the CO2 concentration) [7,8]. The microclimatic conditions that satisfy only the Fanger equation can hardly be regarded as comfortable. The geographical location is also important for setting the range of permissible temperatures, as the optimal temperatures can vary dramatically depending on the region [9].
1.3. Prediction Methods
The existing approaches and methods for calculating heat and mass transfer in rooms are largely generalized, often producing significant deviations of indoor microclimatic parameters from the normalized ones [10,11,12]. This discrepancy is due not only to the deviations from design solutions during construction but also to variations in the thermal characteristics of buildings over time. Furthermore, international standards (including those based on ASHRAE 55) used to design microclimate systems are too general in nature, failing to fully take into account the peculiarities of climatic or other conditions of the region where construction works are planned.
Predicted Mean Vote (PMV) is the comfort index introduced by Fanger. This is a person’s sense of satisfaction with the environment, expressed as a mean estimate of thermal sensation. PMV is measured on a seven-point scale (where +3 corresponds to hot, +2 to warm, +1 to slightly warm, 0 to neutral, −1 to slightly cool, −2 to cool and −3 to cold). The target PMV value is zero, corresponding to the ideal conditions for a person [13,14,15].
PMV depends on four microclimatic parameters (air temperature, humidity, air movement and mean radiant temperature) and two individual parameters (metabolic rate and thermal insulation characteristics of clothing) [16,17].
There are three approaches to calculating PMV, listed as follows:
- Using the table of PMV values from GOST ISO 7730-2009, (if the relative air humidity is 50%).
- Direct measurements performed by using an integrated sensor for operative and equivalent temperatures.
PPD is a comfort index for the predicted percentage of dissatisfied subjects [20]. This index is calculated based on the PMV indicator, allowing one to account for the thermal discomfort of some of the people. The thermal environment is considered acceptable if 80% of the people in the same room are satisfied with it (the PMV index in this case is in the range from −0.5 to +0.5), but even in the case where PMV is zero, PPD is equal to 5%. Thus, there is always a percentage of people dissatisfied with the indoor microclimate; PPD is never less than 5% but always tends to a minimum.
The goal of this study is to evaluate the effectiveness of assessing people’s thermal comfort by various methods. The main objectives are to analyze the state of the microclimate of classrooms in an academic building, measure the real-life values of the microclimatic parameters, calculate the comfort indices based on the measurement data and compare them with the indices obtained based on people’s real sensations of thermal comfort, create a mathematical model based on the selected software to confirm the reliability of the calculated PMV and PPD values and visualize the results, and suggest solutions for eliminating obstacles.
2. Materials and Methods
2.1. Measurement Procedure
Real indoor microclimate parameters were measured in compliance with the regulations set out in the GOST 30494-2011 standard [21].
Classrooms of the Hydro-2 Building at Peter the Great St. Petersburg Polytechnic University were selected for this study. The first reason why this building was chosen is that its shape is a parallelepiped, which is typical for educational institutions in St. Petersburg; thus, the results obtained can be extrapolated to the buildings of other college or university campuses. Secondly, the building has rectangular rooms, which are very convenient for taking measurements. Thirdly, the sizes of the rooms in the building are suitable for accommodating a focus group (20–60 students, which corresponds to 1–4 classes). During the measurements, the number of people was fixed, and they were not allowed to enter or leave the auditorium. The distribution of people within the audience was also monitored in order to avoid situations where most of the focus group was located in a certain part of the audience.
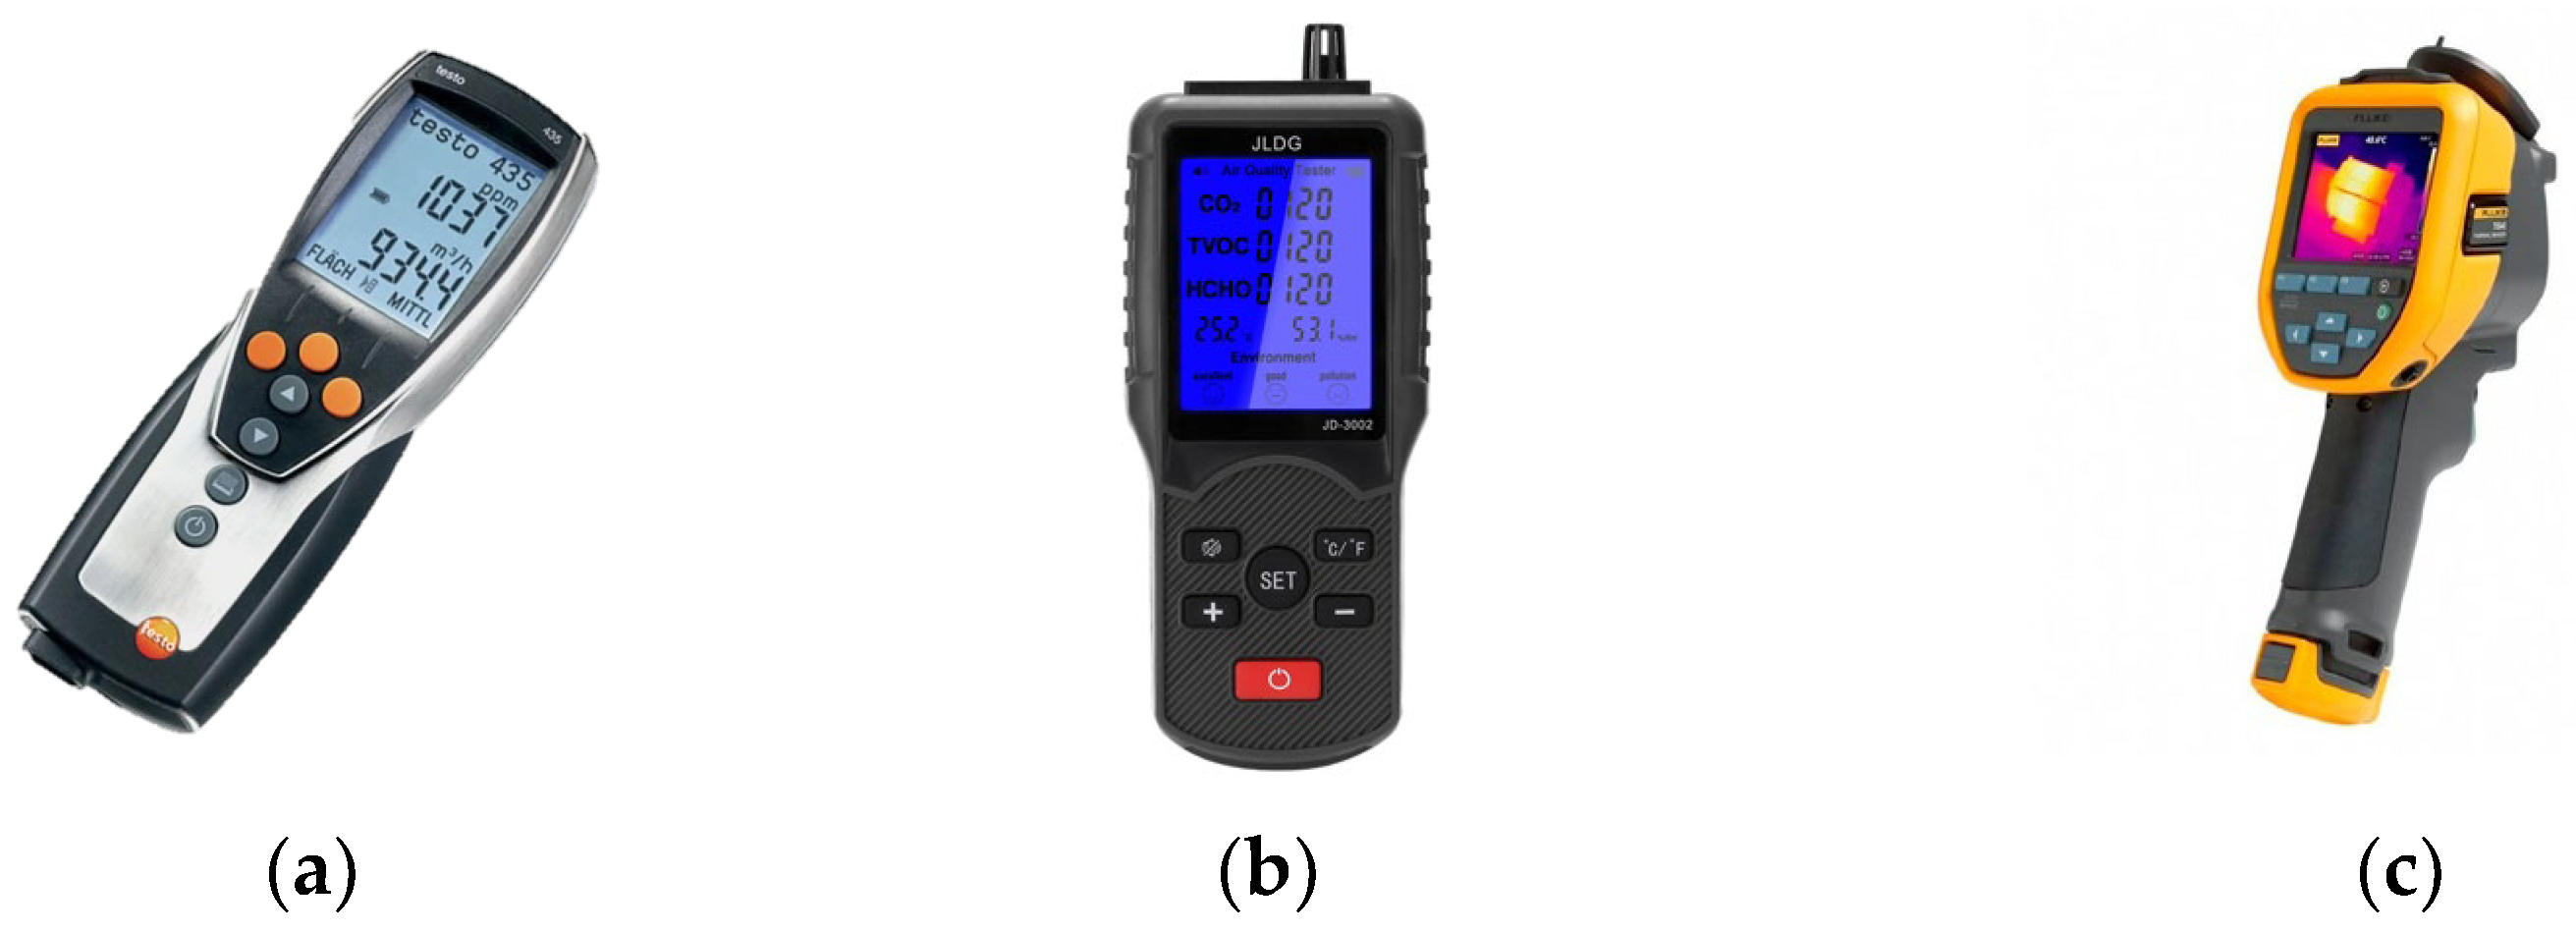
In total, three devices were used in this study (Figure 1), i.e., a JD-3002 air quality tester (for measuring CO2 concentrations in the air, with measuring range of 350–2000 ppm; relative humidity measuring range: 0–99%), a Testo 435 multifunction measuring instrument (for measuring air temperature, with measuring range from −50 °C to +150 °C; air speed measuring range: 0–60 m/s) and a Fluke thermal camera (for measuring radiant temperature, with measuring range from −10 °C to +1200 °C).
The error and resolution of the measuring equipment were determined before the procedure. JD-3002: resolution for CO2 measurements of ±1 ppm; measurement resolution for relative humidity of 0.1% RH. Testo 435: measurement error for air temperature of ±0.3 °C; measurement error for air speed of ±0.01 m/s. Fluke: ±5% of readings in °C.
The thermal camera was calibrated, and the indoor temperature and the type of reflective surface were set. The Testo meter was set to self-calibrate at startup. The windows in the classroom were closed. The measurements were started 30 min after the subjects were seated. In parallel with the measurements, the survey began. It took 15 min to complete the questionnaire, after which the results were collected.
The number of measurements varied depending on the specific requirements or problems. The total number of points per classroom and their locations were individually adjusted according to the seating arrangement of the students in the classroom.
Three measurements were taken at each point (the measuring instruments were fixed to keep them stable) with an interval of at least 5 min. Measurements for people seated in the room were carried out at the following heights: 0.1 m from the floor, 0.6 m from the floor and 1.7 m from the floor (GOST 30494-2011). The measuring instruments were installed at least 0.5 m away from walls and other objects to exclude the influence of the sources of heat and moisture. The instruments were placed in the center of the walls between the windows to take the readings from points near the walls.
Thermal comfort was estimated in 9 classrooms. This study was conducted in several stages: (1) Full-scale measurement of the main microclimatic parameters, with the values being recorded manually. (2) Assessment of real thermal sensations of people in the selected rooms by means of a questionnaire survey and analysis of the data obtained. (3) Calculation of thermal comfort by the Fanger method by using PMV and PPD indices. (4) Comparison of the calculation results based on experimental values of microclimatic parameters and normative values.
The measurements were carried out on different days within the same range of outdoor temperatures (3 days in April, 4 days in May and 2 days in September 2023). The days for the measurements were selected in accordance with GOST 30494-2011; the weather was cloudy, while the outdoor temperature was in the range of 15–20 °C. The outdoor air temperature was initially recorded before commencing the measurements (Table 1) and subsequently monitored multiple times throughout the measurements to ensure that it remained at or above 15 °C. The time of measurements, the period from 10:00 to 14:00, was also recorded. Detailed information on the classrooms selected is given in Table 1.
All classrooms were closed rooms with single-sided natural ventilation. Additional equipment (such as air conditioning or fans) was not used. Before taking measurements, windows and doors were checked—they had to be closed to create a more stable and permanent microclimatic environment.
We also decided to determine the CO2 concentration (ppm) in the air. The CO2 values are not necessary for calculating thermal comfort by the Fanger method. However, if the carbon dioxide level is high, this means that there are problems with ventilation inside the room, thus problems with the microclimate. According to ASHRAE, 600–800 ppm is the optimal value, 1000 ppm is the level at which discomfort is felt by 50% of people, 1400 ppm is the maximum permissible value, and the quality of air with higher CO2 levels is considered poor.
The radiant air temperatures (trad) and the resulting temperatures (tres) were calculated based on the measurements taken. The radiant air temperatures were used to calculate the Fanger comfort indices (EN-16798) [22]. The resulting temperatures were necessary for comparison with the normative values set out in GOST 30494-2011.
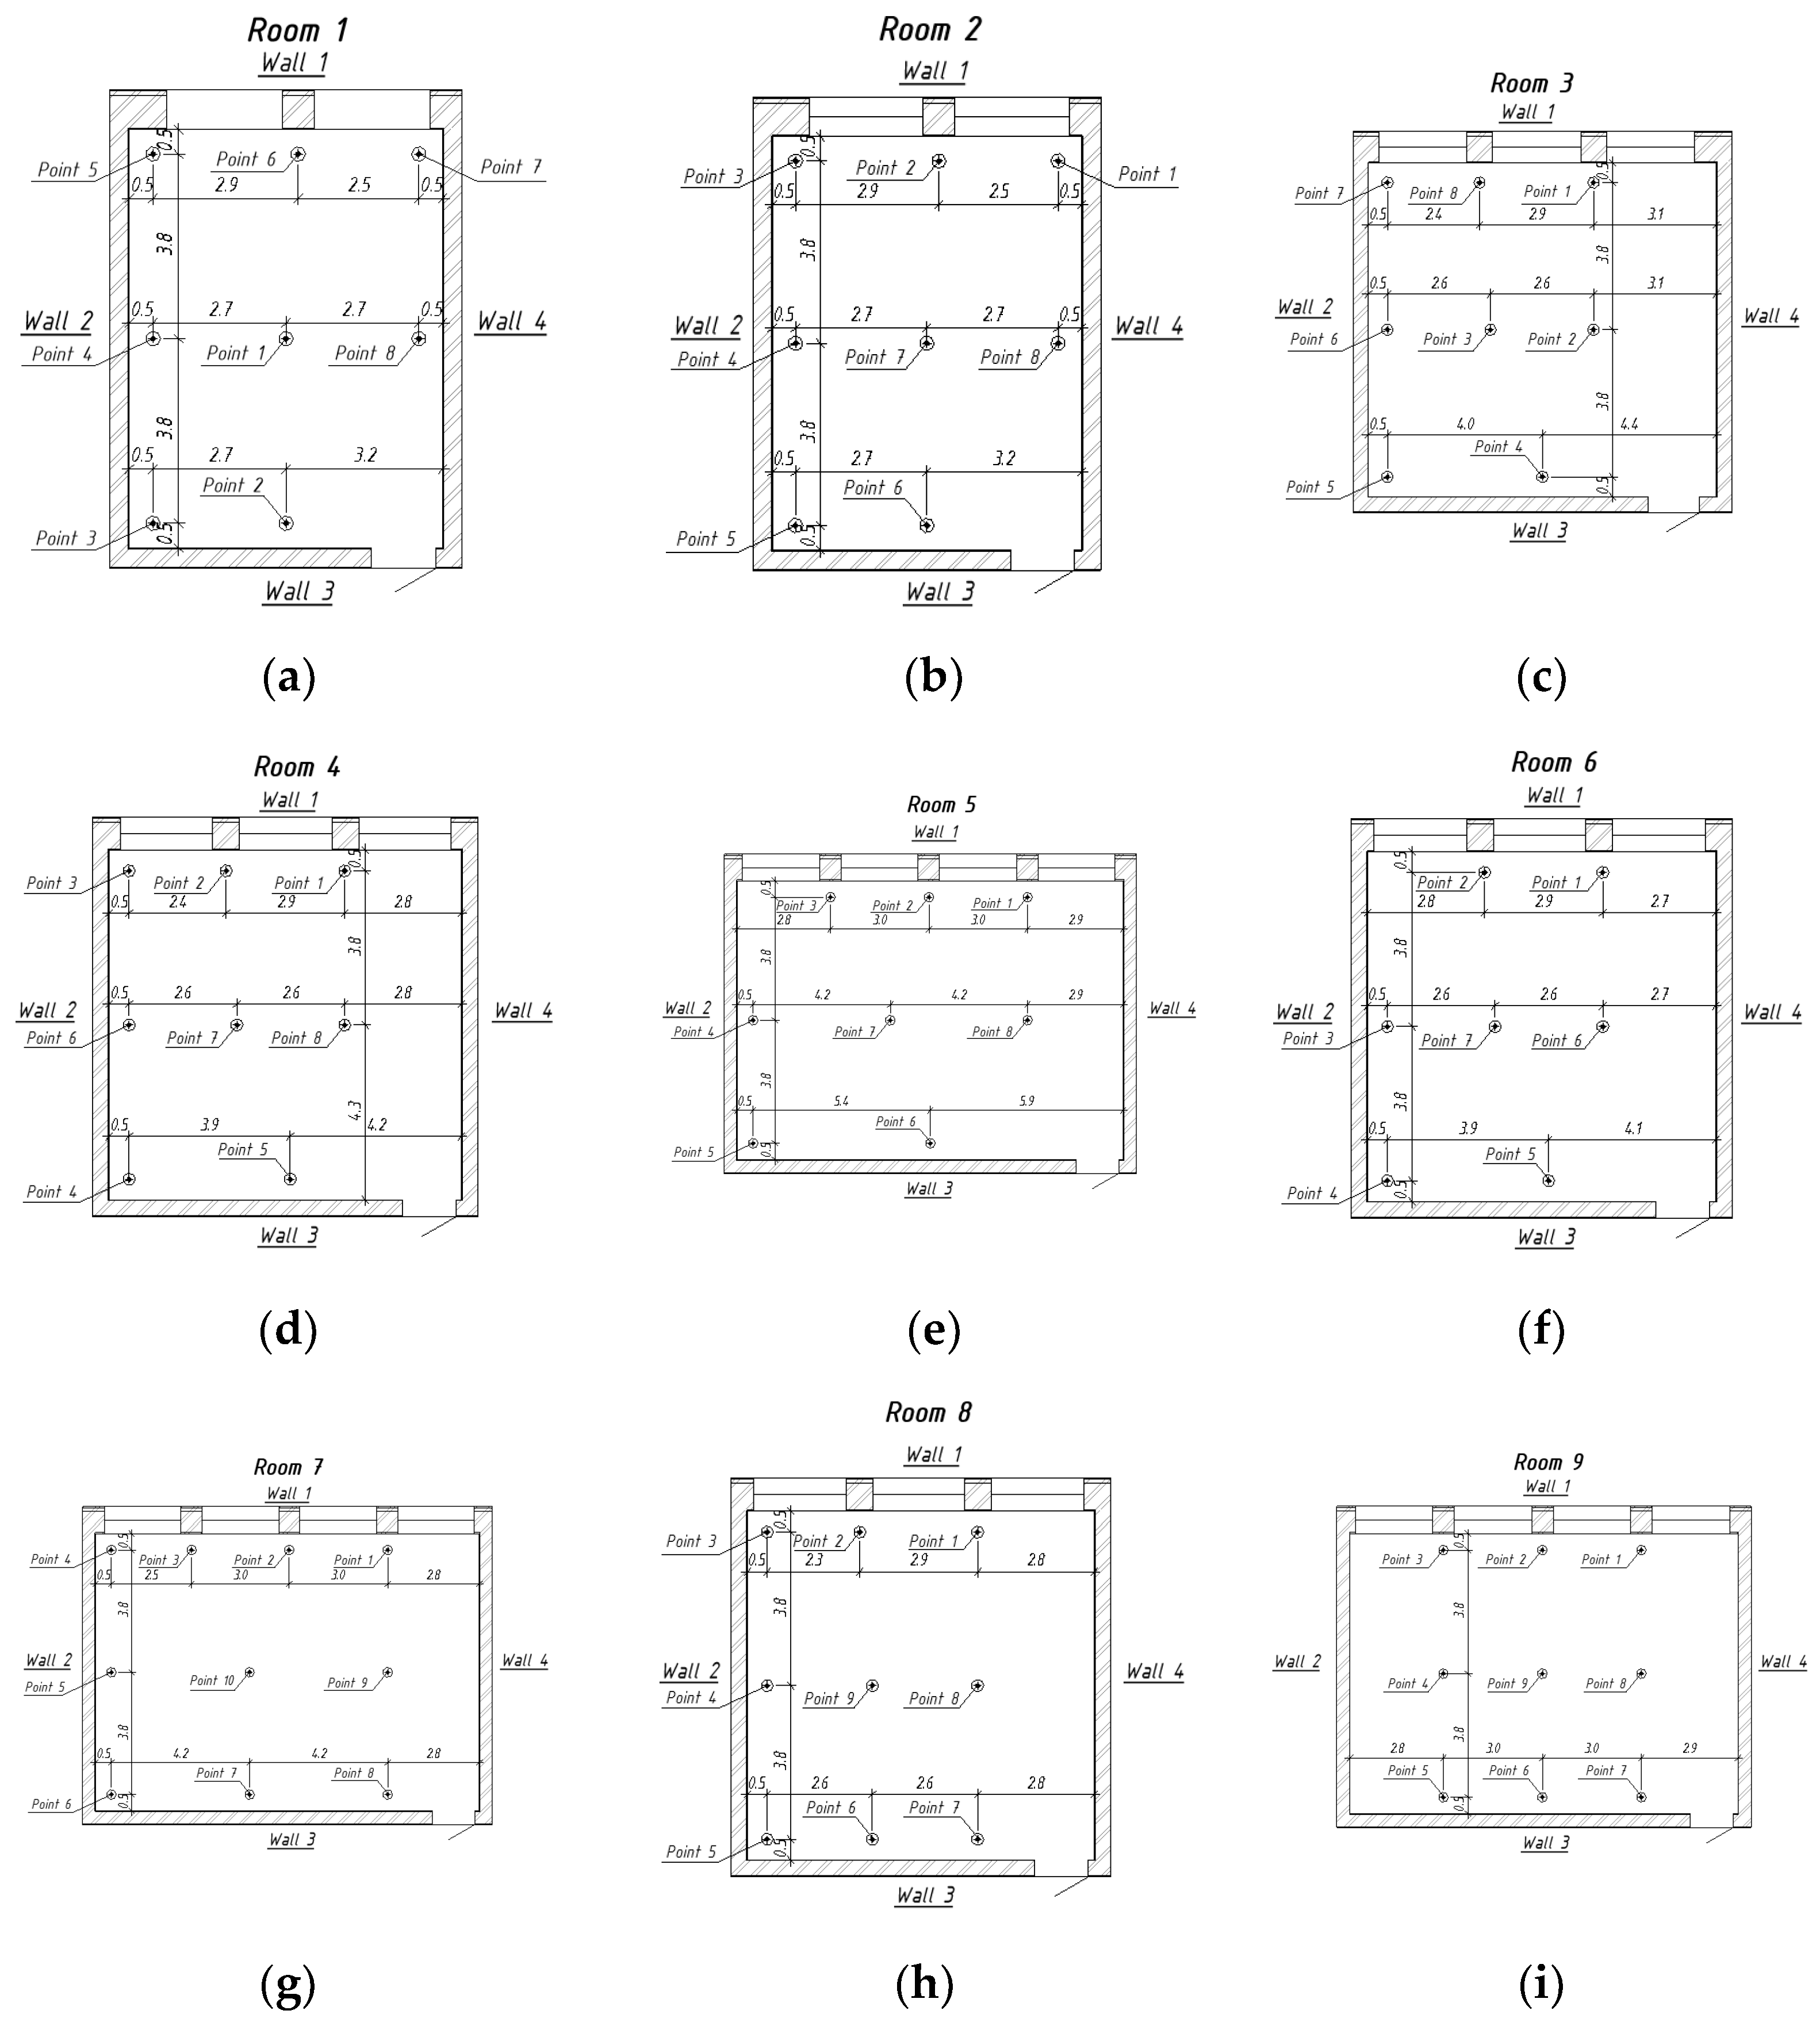
Figure 2 shows the plans of Rooms 1–9, marking the points in which the measurements were taken. Distances are given in meters.
The results obtained at various points for air temperature, air speed, relative humidity, CO2 concentration in the rooms are summarized in Tables 4–6.
Additional information for the classrooms required for this study is given in Table 1.
2.2. Survey of Real Thermal Sensations of People in Rooms
The goal of the questionnaire survey was to determine the real thermal sensations of people occupying the room. In total, 316 people in the nine classrooms participated in the survey. The questionnaire consisted of the following questions:
- “Which classroom are you in?” This question was asked to record the specific location of the subject, because the survey was carried out in nine different classrooms.
- The subjects were asked how old they were, because metabolism declines with age.
- “Where are you sitting right now?” This question was asked to determine the approximate distance between the subject and the window as a source of cold air, because warm air can be distributed unevenly in a classroom.
- “What are you wearing?” This question was asked because the type of clothing can affect thermal sensations.
- “Rate on the following scale how you feel”. The subjects were presented with a scale from −3 to +3, where −3 corresponds to cold, −2 to cool, −1 to slightly cool, 0 to neutral, +1 to slightly warm, +2 to warm and +3 to hot.
- “What do you think is the outdoor temperature right now?” This question was asked because the subjective perception of the temperature outside the window can affect the thermal comfort of people in the room.
- “Do you feel any local discomfort?” This question was asked to gain for a more accurate understanding of the state of the indoor microclimate.
The state of the microclimate was assessed by means of a survey because the concept of thermal comfort is rather subjective [23]. In turn, the results obtained in the survey could help systematize and correlate the data produced in the calculation based on the readings taken with the instruments and provided by the digital model.
2.3. Calculation by Fanger Method
The Fanger model allows one to predict people’s thermal sensitivity and degree of discomfort. It includes indicators such as PMV, an indicator predicting the mean thermal sensitivity for a large group of people based on the balance of the human body temperature on a 7-point scale, and PPD, an indicator predicting the percentage of people dissatisfied with the thermal environment.
The PMV value can be calculated according to the information from ASHRAE-55, EN-16798 and GOST ISO 7730-2009.
2.4. Simulation of Thermal Comfort in SolidWorks
A model of thermal comfort was constructed for two of the classrooms to additionally verify the results and the reliability of the data obtained by the survey. The classrooms selected were Room 5 and Room 7. These classrooms had the same layout but contained a different number of people. The focus of the simulation was on the main variables affecting the state of the indoor microclimate, with people as the main heat sources. However, people’s subjective thermal sensations were not taken into account. The models were developed in the SolidWorks software package.
The models of the lecture halls in the Hydro-2 Building at Peter the Great St. Petersburg Polytechnic University were used as a basis for simulation in Revit 2021 software. The models were constructed from the latest plans of the building to reproduce the geometry more accurately.
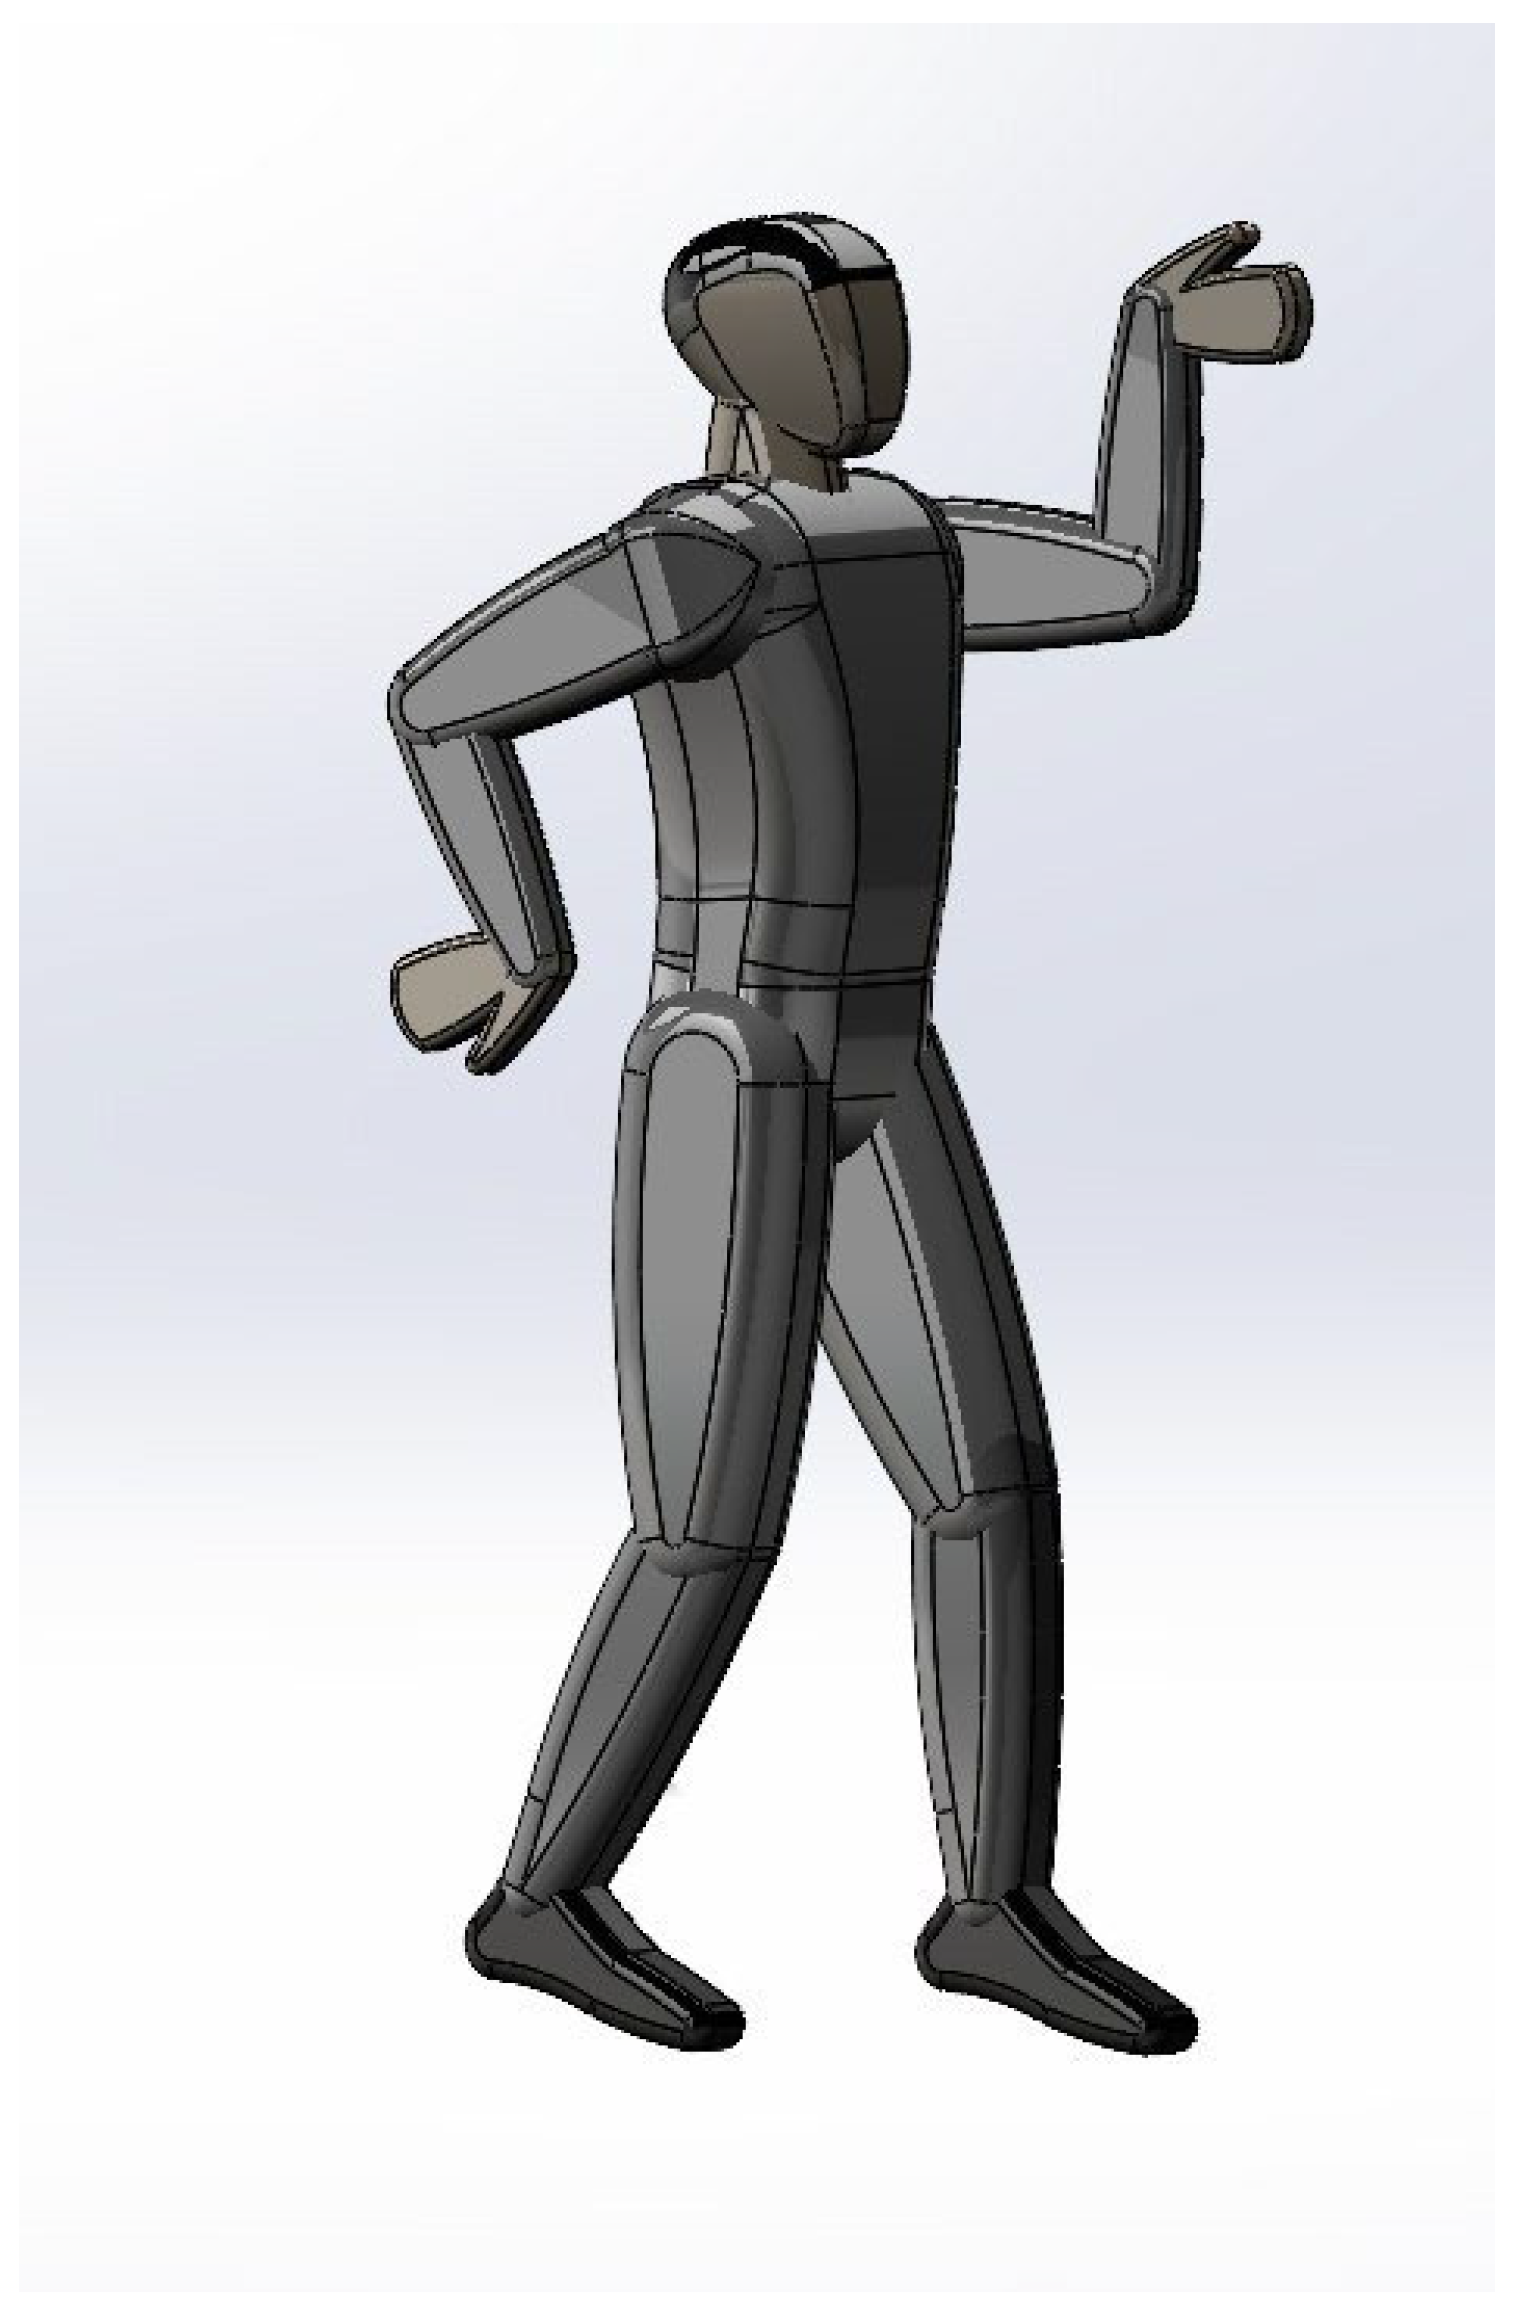
A conceptual model of a person inside the classroom was constructed at the preparatory stage. Since humans release heat and moisture, they must be included into the resulting model. The level of detail of the human body in the geometrical description only slightly affects the local distribution of the heat transfer coefficient on the human body surface and the local distributions of speed and temperature in the immediate vicinity of a person but has virtually no effect on the indoor microclimatic parameters obtained as a result of a numerical simulation of air distribution. We decided to simplify the conceptual model of the human body to make the computational processes easier. However, the general sizes and proportions of the human body were preserved for more accurate distribution of the results and visualization [24]. The model used in this study is shown in Figure 3.
The subsequent simulation in SolidWorks was divided into the following stages:
- Formation of the model base taking into account the main dimensional characteristics and design features.
- Material selection as follows:
- -
- “Human” material (simulating the thermo-physical properties of the human body for the model shown in Figure 3).
- -
- “Air” material (selected for the space bounded by the enclosures to simulate heat losses and heat production).
- -
- Materials of enclosures (for walls, ceilings and windows, brick, concrete and glass were selected as materials, respectively).
- -
- Materials of additional elements (for desks, benches and doors, wood was selected as a material).
- Imposition of the following boundary conditions:
- -
- Indoor temperature (a temperature of 22 °C was set for the selected classrooms, which corresponds to the normal air temperature in the classrooms (before people enter and stay there)).
- -
- The pressure in the classroom was set to 101.325 kPa.
- -
- Outdoor temperature (given by the incoming airflow and corresponding to the air temperature on the corresponding measurement days, equal to 19 and 17 °C, respectively, for Rooms 5 and 7).
- -
- Heat generated by people (the mean thermal dissipation rate of a person at rest, taken equal to 90 W).
- -
- Simulation of natural ventilation (we simulated the supply and return airflow; since ventilation was mostly natural, we selected the windows and the door as working surfaces, respectively (imitation of ventilation); an incoming gas flow was set at the inlet (windows) (the inlet velocity was measured by an air quality tester and was equal to 1 m/s); the ambient pressure at the outlet (ventilation, door) was set to 101.25 kPa for the gas phase (flow in both directions was possible)).
- -
- A no-slip condition was imposed at the phase boundary (air speed = 0 m/s).
- Generation of computational mesh.
- Selection of solution parameters as follows:
- -
- Selection of calculated values for thermal comfort.
- -
- Selection of physics.
- -
- Selection of number of computational iterations.
- The creation and running of the computational scenario.
- Analysis of results and assessment of thermal comfort.
The finite element model consisted of 218,593 finite elements, of which 95,409 were solid and 123,184 were gaseous (liquid/fluid) for Room 5. The model of Room 7 consisted of 231,021 finite elements, of which 142,189 were solid and 88,832 were gaseous. The finite elements at the phase boundary were reduced (thickened) to calibrate the finite element model.
The simulation results are presented in Section 3.4.
3. Results
3.1. Results Based on Manual Measurements
The values of the microclimatic parameters recorded by using the instruments are shown in Table 2. Examples are also provided for a range of calculated values.
The results are presented for one room (Room 1) as an example.
Air temperature tpi at the measurement points is calculated with the formula
where t0.1, t0.6 and t1.7 are the air temperatures at the 0.1 m, 0.6 m and 1.7 m heights from the floor and i is the point number.
Below is an example for point 1 from Table 2.
Air temperature tx in the audience during measurement x is calculated with the formula
where tpi is the air temperature at point I and n is the total number of points.
Below is an example for Room 1, measurement 1.
Relative humidity φpi, air speed vpi and CO2pi concentration are calculated in the same way as the air temperature.
Additional characteristics of the enclosing structures for Room 1 are indicated in Table 3.
For the rest of the classrooms, the measurements were made in the same way as for Room 1.
Further, Table 4 provides a summary of the total values of the microclimatic parameters in each of the classrooms. They were calculated based on finding the means calculated in each measurement cycle.
The PMV and PPD indices are determined by calculating the radiant air temperatures in accordance with the following formula:
where Ai is the area of the inner surface of enclosures and heaters, m2, and ts is the temperature of the inner surface of enclosures and heaters, °C.
Obtaining the areas of the enclosures and the temperatures of their internal surfaces allows one to calculate the radiant air temperature of the rooms.
Below is an example for Room 1.
Table 5 gives the radiant air temperatures for the classrooms considered.
Now, let us calculate the resulting temperatures (tres) for the given classrooms. We calculate them with the formula
where tov is the measured temperature in the classroom, given in Table 3, and trad is the radiant air temperature.
Below is an example for Room 1.
Table 6 shows the resulting temperatures for each classroom.
3.2. Results Based on EN-16798 Calculator
The PMV and PPD values were determined with a calculator based on Formulas (5) and (9). The values of the parameters in the formulas (see below) were obtained from real measurements. The calculator is based on the formulas below for calculating PMV and PPD.
For PMV,
where tcl (°C) is the surface temperature of clothing, calculated by the formula
hc (W/(m2·K)) is the coefficient of convective heat transfer, calculated by the formula
fcl is the surface area coefficient of clothing, calculated by the formula
and M (W/m2) is the metabolic rate.
The PPD index is found as a function of PMV by the formula
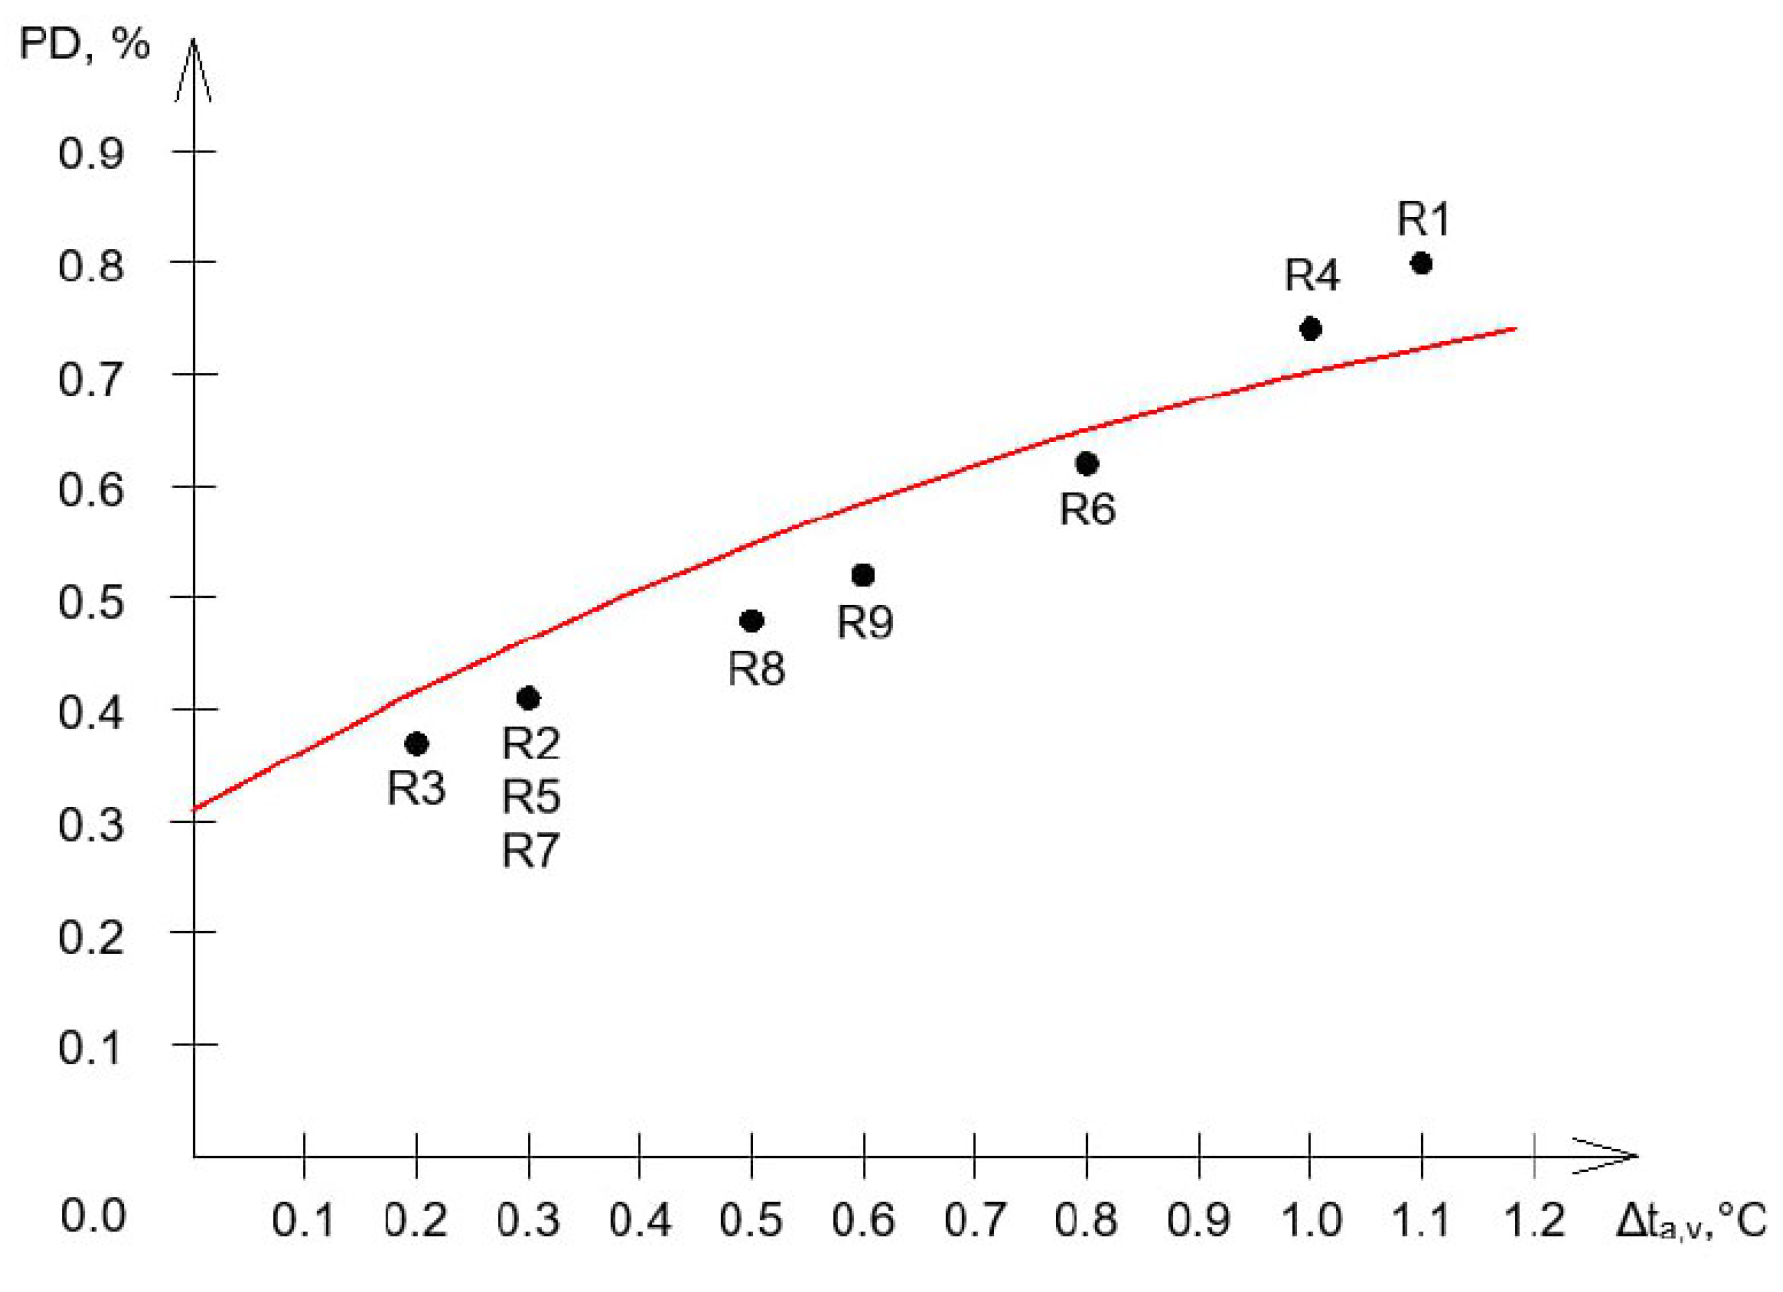
Also, based on the data from Table 2, the PD index was additionally calculated. While PMV and PPD show discomfort due to the cold or heat for a person’s body as a whole, PD shows the percentage of people who are dissatisfied with the temperature difference between the upper and lower parts of the body. The PD index is a measure of “local discomfort”. If this value is low (lower than 3%), then this indicates the reliability and feasibility of a study (according to GOST R ISO 7730-2009). This means that the distribution of heat in the study room is uniform, which makes it possible to more accurately assess the state of the microclimate in the room as a whole.
Before calculating the PD index, a visual assessment of the temperature readings taken at the heights of 0.1 m and 1.7 m was carried out. The difference between these values was, on average, no more than 1–1.5 °C. To carry out a statistical assessment, in each room, we selected the point with the largest vertical temperature difference.
PD is calculated by using the following formula:
Below is an example for Room 1, measurement 2, point 1.
The calculation results are presented in Table 7 below.
As evident from the results obtained, the most comfortable environments were created in Rooms 1, 3 and 7. The percentage of those dissatisfied with the state of the microclimate was the highest in Rooms 6 and 8. Some of the likely factors that had a negative impact on the microclimatic parameters in these classrooms were the insufficient thermal insulation characteristics of enclosures and issues with HVAC operation.
According to the calculated PD values, the local discomfort caused by the vertical temperature difference was small enough, so we assumed that it did not influence the respondents’ answers. Figure 4 shows the percentage of dissatisfied people (PD) as a function of the difference in air temperature between the head and feet.
3.3. Survey Results
The results of the survey are summarized in Table 8. The number of people in the focus group ranged from 22 to 53 people.
Below is an example of PMV and PPD calculation for Room 1.
The PMV value can be found from the survey results as the mean value of responses for thermal sensations from −3 (cold) to +3 (hot):
The PPD index is found as a function of PMV by the formula
For the rest of the classrooms, the calculations were made in the same way as for Room 1. The results of PMV and PPD are presented in Table 9.
We can conclude from the data obtained that the people in Rooms 4, 7 and 8 felt the least comfortable. A significant part of the respondents noted that they were experiencing discomfort, namely, that they were too warm or hot. A possible explanation for this is that the largest number of people in these classrooms (with approximately equal areas) were dressed in warm clothes and many were seated far from the windows. It may also indicate that insufficient measures are taken for natural or mechanical ventilation in the classrooms.
People in the other classrooms felt comfortable. They were evenly distributed throughout the rooms, with no preference for any particular type of clothing. (Figure 5).
3.4. Results Based on SolidWorks Model
The resulting finite element model for Room 5 consisted of 218,593 finite elements, of which 95,409 were solid and 123,184 were gaseous (liquid/fluid). The model of Room 7 consisted of 231,021 finite elements, of which 142,189 were solid and 88,832 were gaseous. The finite elements at the phase boundary were reduced (thickened) to calibrate the finite element model.
Figure 6 shows the results obtained with SolidWorks 2022 software.
Table 10 summarizes the comfort indices for Rooms 5 and 7, calculated by three different approaches, i.e., based on the real thermal sensations of the respondents (method 1), based on the measurements obtained with a calculator (method 2) and based on the digital model (method 3).
It is clear that the results obtained by method 2 and method 3 are very close in values. In view of this, we can assume that the number of people and the air temperature were the crucial factors that influenced the state of the microclimate in the classrooms. The results obtained by method 1 were higher than those obtained by other calculation methods in two cases. This may indicate that people tend to perceive the temperature as higher than it actually is.
Additionally, it is important to maintain the balance of space per person. Drastically different results were obtained for two rooms that had the same dimensions but a different number of people, with one being occupied by half of the people occupying the other. Negative values of the calculated parameters were obtained in the first case, and positive in the second one.
Temperature slices were generated during the modeling process to analyze temperature propagation gradients, as illustrated in Figure 7. According to human physiology, individuals are the most sensitive to temperatures from the waist to the head. This is because the significant difference in body temperature and indoor air results in the highest heat transfer in this region.
At the same time, the local discomfort that a person might experience was checked by recording disturbances in the propagation of air masses. If disruptions were identified, comparisons of the questionnaire responses with the individual’s location in the model were made. When local discomfort significantly influenced the objectivity of responses in the questionnaire, the answer was disregarded.
Such modeling perfectly shows local discomfort in the room (where the legs are colder than the upper body). The spread of local discomfort and the learning of its influence on the perception of the thermal sensations of a person are planned to be considered in more detail in further studies.
3.5. Overall Results
The PMV and PPD values obtained by using a calculator based on the measured parameter values deviated from the calculated PMV and PPD values obtained by interviewing the people in the room. The reason for the discrepancy in the results may be the “universality” of the Fanger method, which takes into account the main microclimatic parameters but does not take into account things such as individual characteristics of the body, mentality, geographical location and a number of other local factors.
Table 11 summarizes the results for microclimatic parameter measurements, the PMV and PPD parameter values based on the survey, and the PMV and PPD parameter values obtained by using a calculator based on measurements and normalized values.
Also, for the obtained PMV and PPD values, the average values are calculated by taking into account the standard deviation (SD). The standard deviation is calculated as follows:
where σ is standard deviation, xi represents each observed value of a feature, M is the arithmetic mean and n is the number of observations (sample size).
Table 12 shows the average values for PMV and PPD, taking into account the standard deviation based on the measurements made and based on the questionnaire.
The results suggest that values derived from measurements and regulatory documents closely align with those obtained from survey data processing, reflecting people’s real perceptions of warmth. The use of the Fanger method as a calculation base was found to be acceptable for performing a general assessment and obtaining information about the microclimate within the selected educational institution in St. Petersburg.
The results from Table 11 also indicate a fairly good state of the indoor microclimate, in terms of people occupying the selected rooms. Most of them felt neutral, i.e., they did not experience elevated or low temperatures, which is optimal (Figure 8).
The following pattern emerged: the PMV values calculated with the survey data were higher than those obtained with the measurements. This suggests that people felt the temperature to be higher than its actual value (without the influence of additional factors and stimuli). This trend must be taken into account in order to obtain more accurate estimates of the state of a microclimate.
However, while the obtained results can provide a general idea of a microclimate’s state, refining the Fanger method and tailoring it to the specific location and focus group is imperative when considering the microclimate as one of the key factors influencing people’s well-being and productivity. This way, it will be possible to reduce the degree of discrepancy between the calculated values and the real perception of people, perform a better assessment and reduce the number of situations, as in Rooms 4, 7 and 8, for which the difference in PPD values, compared with other rooms under consideration, was much higher. In rooms where the state of the microclimate is different from “neutrality”, it is important to perform a correct assessment in order to understand the degree of discomfort of people and take measures to normalize the values of the microclimatic parameters to the necessary extent.
4. Discussion
Two calculation scenarios were run for PMV and PPD in the given rooms based on the main microclimatic parameters. The calculations were carried out based on the existing regulatory framework, the survey conducted and the measured values of microclimatic parameters. Verification was also carried out in SolidWorks for two of the classrooms considered.
We can conclude from the results that the calculated values based on the measurements and the values obtained by the survey had certain differences but were generally in good agreement [25].
The PMV values calculated based on people’s real thermal sensations were higher than the PMV values obtained by using a calculator. Moreover, the concentration of carbon dioxide in the rooms did not exceed the permissible levels, which indicates fairly good air quality [26].
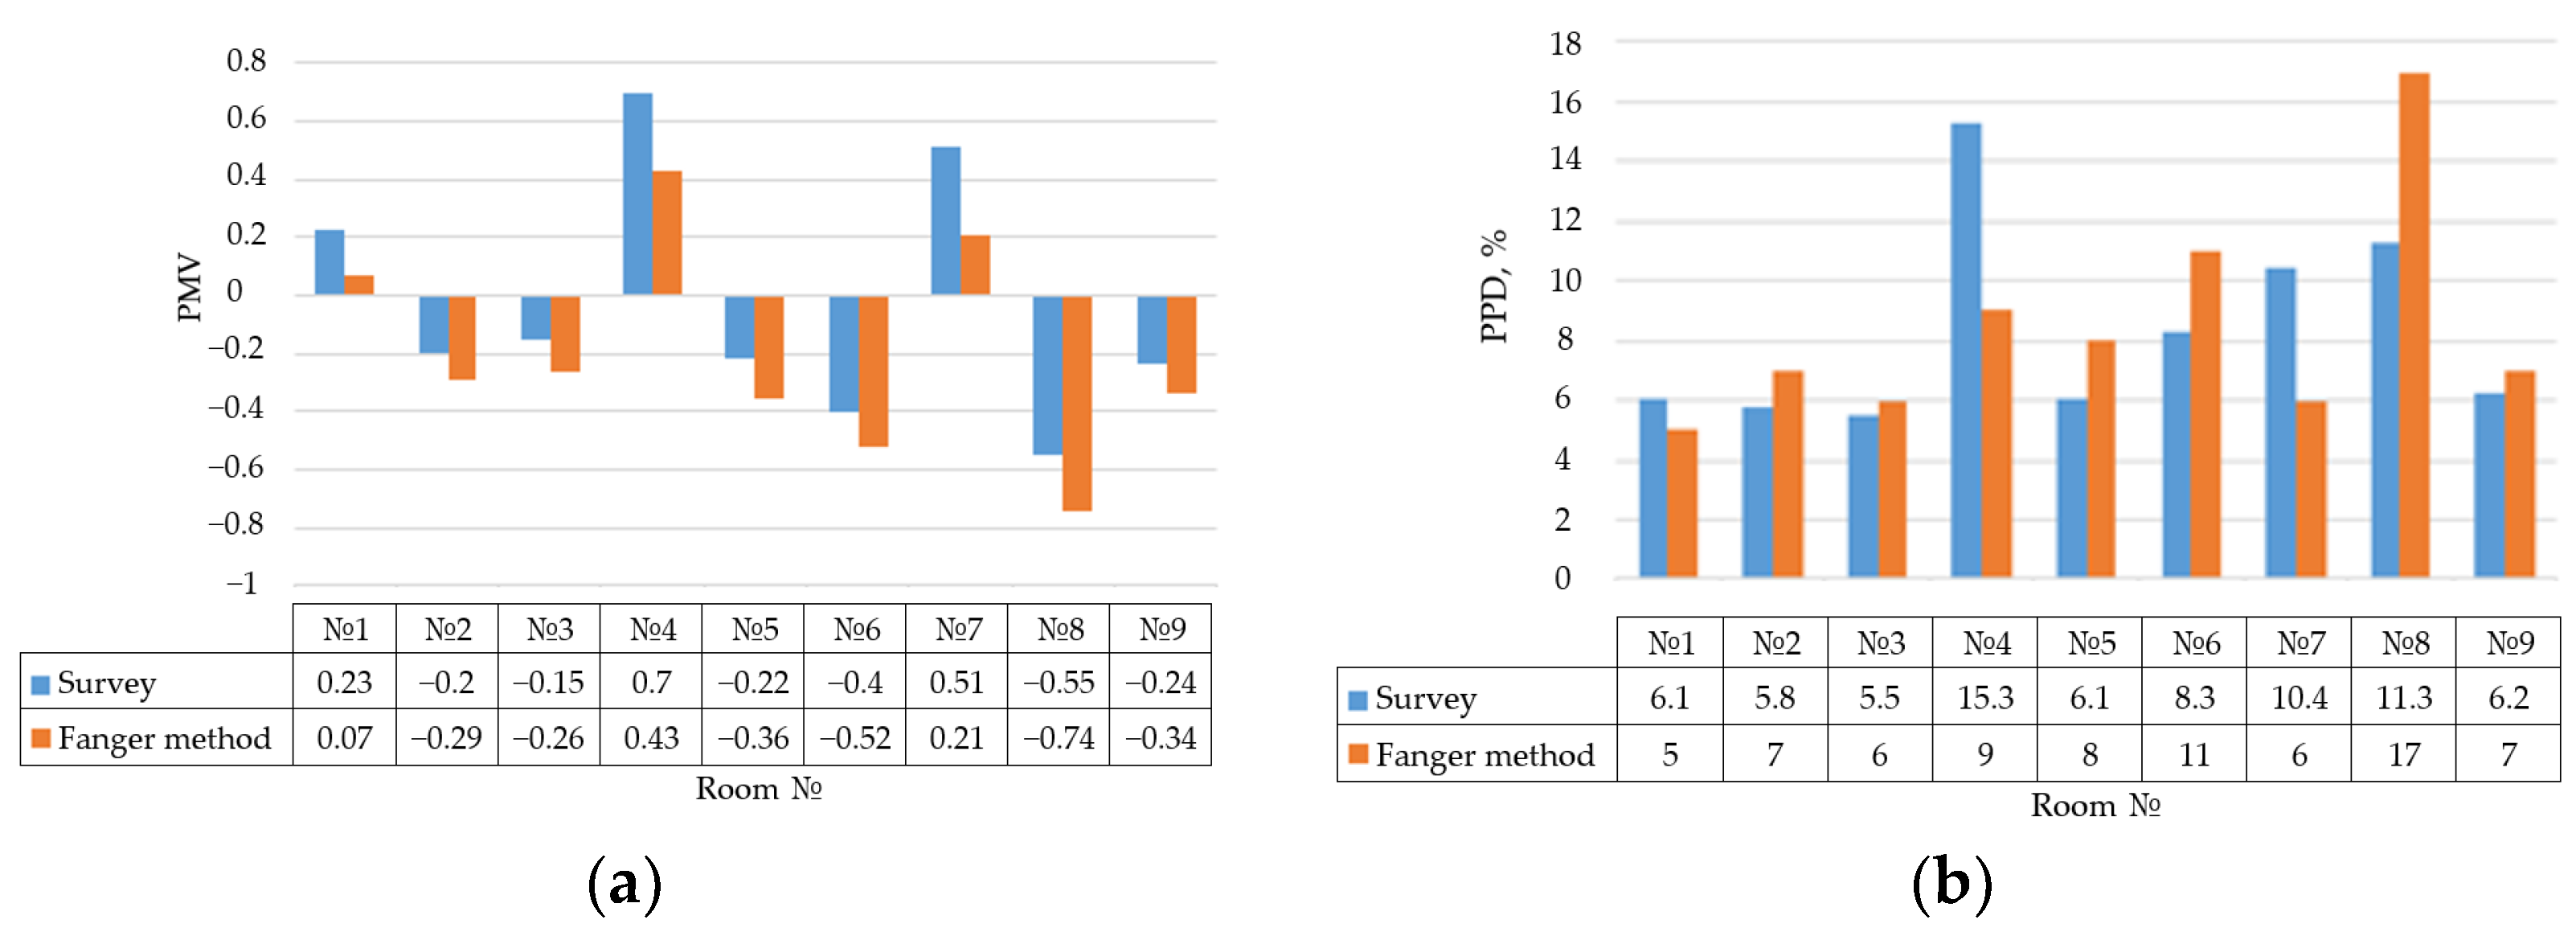
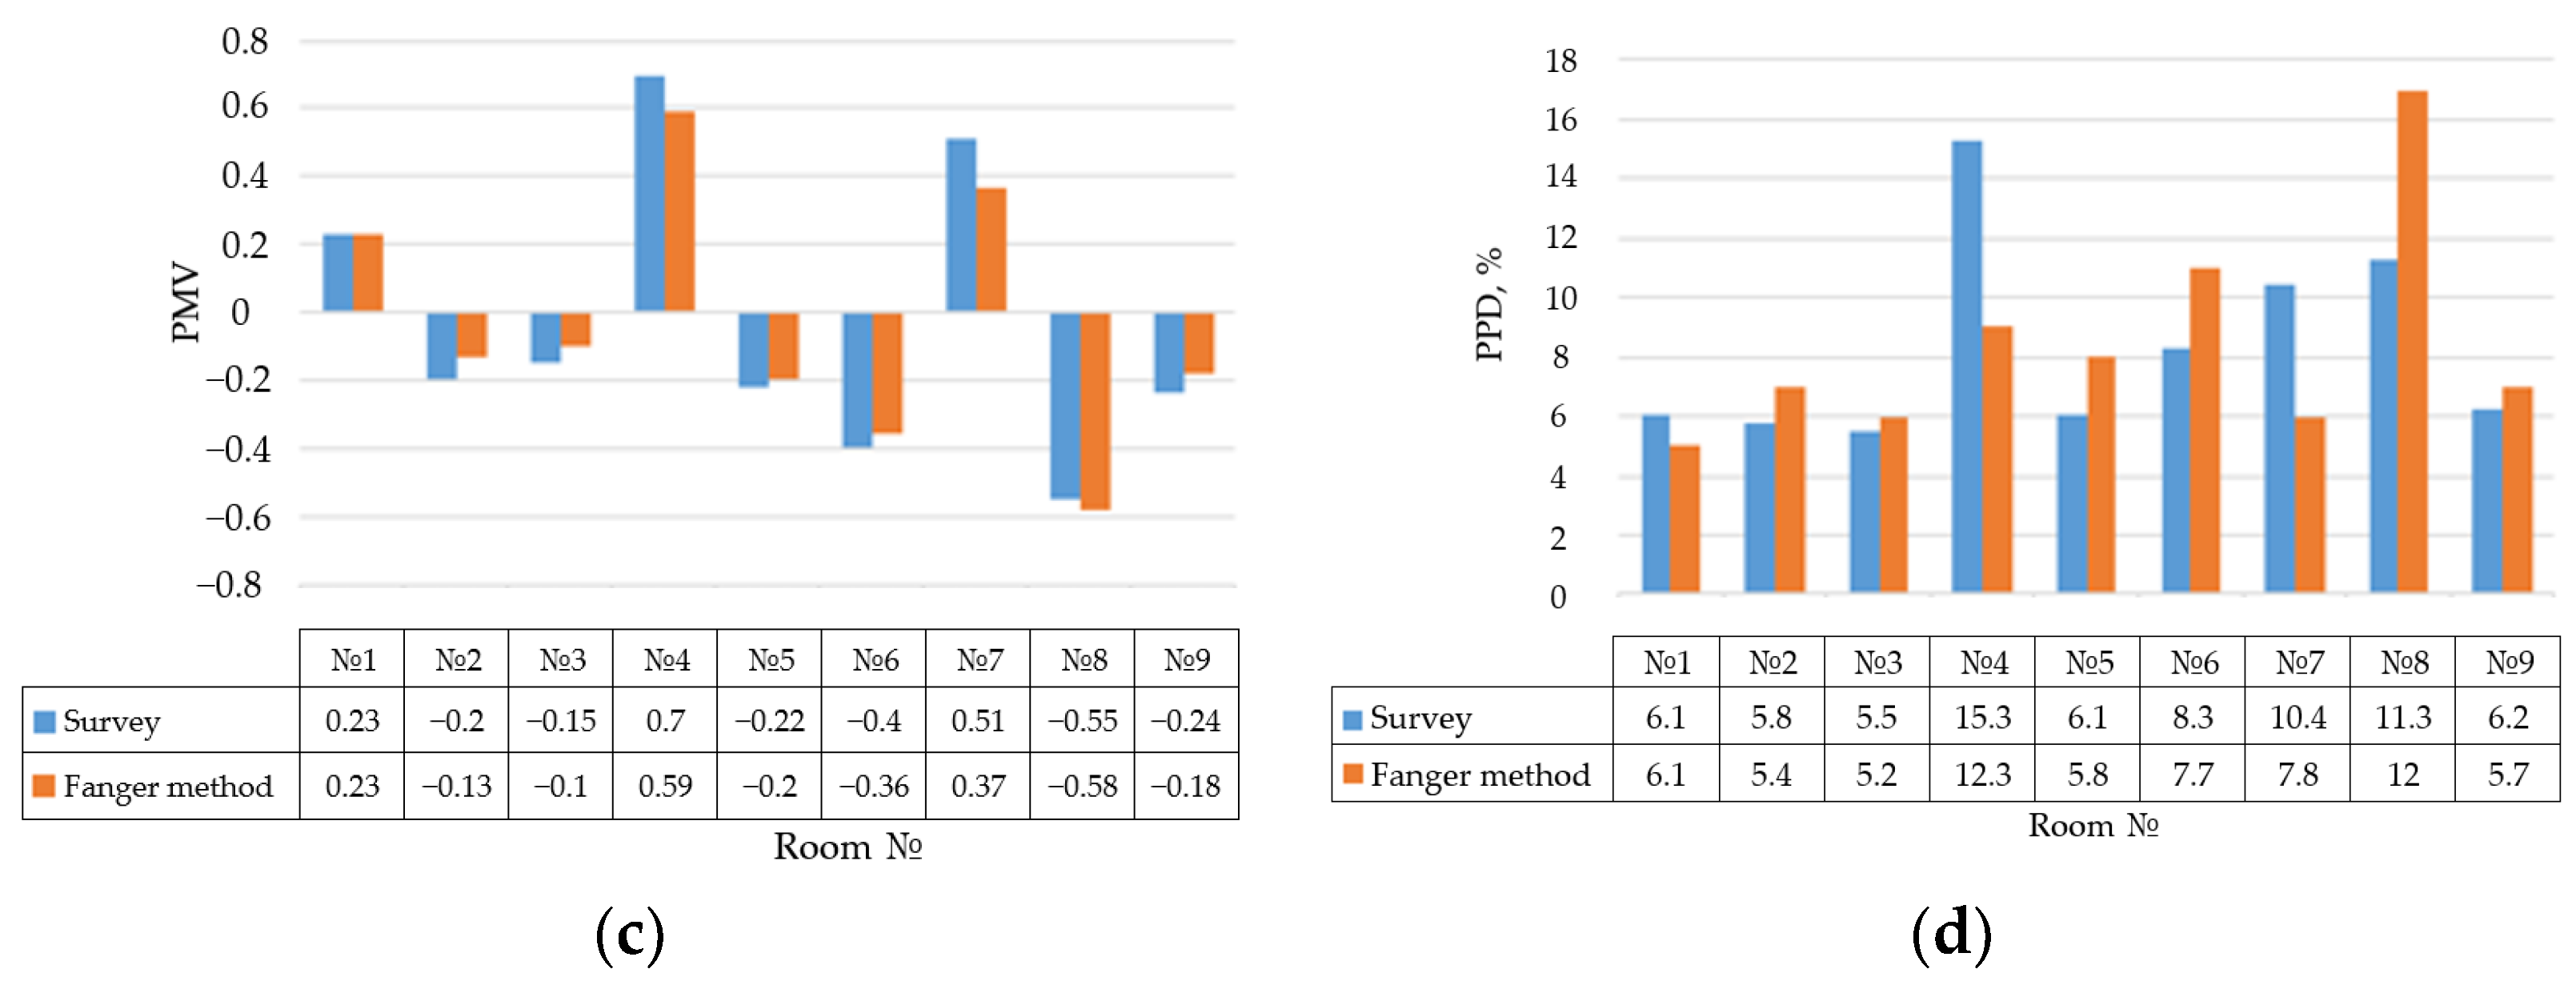
We found that the mean deviation of the PMV index calculated by the Fanger method from the value obtained by the survey was 0.16. By taking this value as an additional coefficient for calculating the comfort index within the educational institution considered, we can more accurately assess the real situation from the percentage of people satisfied with the state of the microclimate (PPD). Figure 9 shows convergence graphs for the comfort indices obtained by the survey and the microclimatic parameter values measured by the Fanger method [27].
By providing estimates of people’s real thermal sensations, the survey established that the state of the microclimate was optimal for 29% of the subjects (−0.5 < PMV < 0.5 (tends to 0%) and PPD = 5–10%), 34% of people experienced slight deviations from their most favored thermal sensations (−1.0 < PMV < −0.5 and −0.5 < PMV < −1.0; PPD = 10–25%), 30% noted that the state of the microclimate was satisfactory but not fully comfortable for them and 7% experienced discomfort.
The extrema of the PMV and PPD indices were detected in Room 4 (with the method based on the survey of the focus group) and Room 8 (with the method based on EN-16798), amounting to −0.74/17% (PMV/PPD) and 0.70/15.3% (PMV/PPD), respectively. Notably, different classrooms were deemed the “least comfortable” depending on the method used. The difference may have been due to the human factor or the qualitative composition of the air, namely, an increased concentration of carbon dioxide. The maximum air temperature and carbon dioxide concentration levels in this study were recorded in Room 4: 27 °C and 912 ppm. A similar situation was observed in Room 7: 25 °C and 803 ppm. Both of these rooms were specifically voted the least comfortable in the survey assessing the real thermal sensations of the participants. Together, a relatively high air temperature and an increased concentration of CO2 could distort people’s thermal sensations [28].
In this paper, we analyzed the state of the microclimate in the classrooms of the Hydro-2 Building at Peter the Great St. Petersburg Polytechnic University, focusing on the analysis of thermal comfort and the real thermal sensations of people occupying the classrooms. We confirmed that the deviation of the microclimatic parameter values from the optimal ones does indeed affect people’s sense of satisfaction.
Temperature is one of the key parameters of microclimate, considerably affecting people. Low temperature induces chills and increases the risk of diseases. On the other hand, high temperatures can lead to the overheating of the body, fatigue and a decrease in concentration. Since classrooms are visited by a large number of people, who are constant sources of heat, maintaining an optimal temperature is an important challenge [29].
Humidity also plays a significant role. Mold can germinate in environments with high humidity, potentially causing respiratory problems. Low humidity causes dry skin and irritation of the mucous membranes. Increased humidity enhances the perceptions of cold and heat. As a result, people may feel thermal discomfort even if optimal temperatures are maintained [30,31].
Airflow speed also has an effect on humans. If the circulation is too intense or constant, this causes discomfort and increased heat loss through the skin. Insufficient air circulation leads to accumulation of dust in the room. Constructing efficient HVAC systems and adopting proper ventilation practices can provide a means for regulating thermal sensations [32]. It is also important to monitor air quality. Polluted air is the cause of allergic reactions and serious diseases. For example, increased CO2 concentration can impair cognitive function and makes it difficult to assess the real state of thermal comfort [33]. The feeling of “stuffiness” can be perceived by people as an elevated temperature. Although these sensations often go together, they may have different causes.
The importance of maintaining a balance of microclimatic parameters cannot be underestimated. Deviations from optimal values of temperature, humidity, air speed and air quality can negatively affect people’s health and comfort. Monitoring and maintaining these parameters at the required levels helps create a healthy and comfortable environment for people.
This study confirms that it is crucial to account for the parameters of the microclimate and maintain their balance to ensure the comfort and health of people. Further research aimed at formulating the appropriate recommendations can help improve the quality of life indoors, creating a healthier environment for people.
5. Conclusions
Even though the actual air temperature in all rooms exceeded the permissible values, while the air speed was below the required range, only 7% of subjects felt uncomfortable due to excessive heat or cold. The majority (about 63%) felt neutral and did not experience noticeable problems that could have affected their sensations of warmth. Such results once again confirm that thermal comfort is a subjective factor, depending on a person’s individual parameters (metabolic rate and clothing insulation) and also on the local discomfort due to the characteristics of the room itself (draft, warm/cold floor, etc.).
Our findings indicate that the microclimate maintained in the selected classrooms of the academic building was fairly comfortable, so students likely do not experience much discomfort and remain productive. However, the estimates obtained for satisfaction with the thermal environment suggest that thermal comfort can be improved, for example, by providing more frequent and regular ventilation (in Rooms 4 and 7), or, vice versa, by reducing the frequency of ventilation (in Room 8).
The results obtained by using the Fanger method coincide with the estimates of thermal comfort obtained by the survey with a mean deviation of 5% in most rooms. The deviation increased with the increase in CO2 concentration because increased CO2 levels led respondents to estimate the temperature to be higher. Therefore, CO2 concentrations should be monitored for compliance with regulatory requirements to correctly apply the Fanger method, and so should the main parameters, such as air temperature, relative humidity, air speed, resulting indoor temperature and radiant temperature of reflective surfaces.
The focus of this study on the state of microclimate and in particular thermal comfort lies in the consideration and development of an adaptive approach within the assessment of internal microclimate. It is aimed at understanding how people perceive thermal comfort under natural conditions (specifically on the premises of an educational institution) through the simultaneous implementation of real measurements of microclimatic parameters and surveys. The results obtained in this research can be applied to enhance our understanding of microclimatic conditions within educational institutions. Additionally, they can contribute to refining the Fanger method to improve its accuracy without compromising its flexibility.
The results of this study can be used to formulate recommendations for retrofitting, e.g., installing additional thermal insulation and installing ventilation systems or trickle vents for windows.
The recommendations can be additionally used for integrating an automated system for monitoring the microclimate in university classrooms.
Author Contributions
Conceptualization, D.Z., K.S. and M.P.; methodology, D.Z., K.S. and I.S.; software, I.S.; validation, I.S., E.Z. and K.S.; formal analysis, D.Z., K.S. and I.S.; investigation, D.Z., K.S. and I.S.; resources, M.P., E.Z. and K.S.; data curation, I.S., D.Z. and E.Z.; writing—original draft preparation, I.S., D.Z. and K.S.; writing—review and editing, M.P., D.Z. and K.S.; visualization, I.S.; supervision, K.S. and M.P.; project administration, M.P., E.Z. and K.S.; funding acquisition, I.S. and K.S. All authors have read and agreed to the published version of the manuscript.
Funding
The research was funded by the Ministry of Science and Higher Education of the Russian Federation under the strategic academic leadership program “Priority 2030” (Agreement 075-15-2023-380 dated 20 February 2023).
Data Availability Statement
The data presented in this study are available on request from the corresponding author.
Conflicts of Interest
The authors declare no conflicts of interest.
References
- Rusanescu, C.O.; Rusanescu, M.; Jinescu, C.; Paraschiv, G. Influence of thermal comfort on health. Rev. Chim. 2019, 70, 1187–1191. [Google Scholar] [CrossRef]
- Ormandy, D.; Ezratty, V. Health and thermal comfort: From WHO guidance to housing strategies. Energy Policy 2012, 49, 116–121. [Google Scholar] [CrossRef]
- Barbic, F.; Minonzio, M.; Cairo, B.; Shiffer, D.; Dipasquale, A.; Cerina, L.; Vatteroni, A.; Urechie, V.; Verzeletti, P.; Badilini, F.; et al. Effects of different classroom temperatures on cardiac autonomic control and cognitive performances in undergraduate students. Physiol. Meas. 2019, 40, 054005. [Google Scholar] [CrossRef] [PubMed]
- Seppänen, O.A.; Fisk, W. Some quantitative relations between indoor environmental quality and work performance or health. HVA&R Res. 2006, 12, 957–973. [Google Scholar]
- Wang, L.; Wang, Y.; Fei, F.; Yao, W.; Sun, L. Study on winter thermal environment characteristics and thermal comfort of university classrooms in cold regions of China. Energy Build. 2023, 291, 113126. [Google Scholar] [CrossRef]
- van Hoof, J. Forty years of Fangers model of thermal comfort: Comfort for all? Indoor Air 2008, 18, 182–201. [Google Scholar] [CrossRef] [PubMed]
- Ovando-Chacon, G.E.; Rodríguez-León, A.; Ovando-Chacon, S.L.; Hernández-Ordoñez, M.; Díaz-González, M.; de J. Pozos-Texon, F. Computational Study of Thermal Comfort and Reduction of CO2 Levels inside a Classroom. Int. J. Environ. Res. Public Health 2022, 19, 2956. [Google Scholar] [CrossRef] [PubMed]
- Ongwuttiwat, K.; Sudprasert, S.; Leephakpreeda, T. Determination of human thermal comfort due to moisture permeability of clothes. Int. J. Cloth. Sci. Technol. 2018, 30, 462–476. [Google Scholar] [CrossRef]
- Rupp, R.F.; Parkinson, T.; Kim, J.; Toftum, J.; de Dear, R. The impact of occupant’s thermal sensitivity on adaptive thermal comfort model. Build. Environ. 2021, 207, 108517. [Google Scholar] [CrossRef]
- Filingeri, D.; Zhang, H.; Arens, E.A. Thermosensory micromapping of warm and cold sensitivity across glabrous and hairy skin of male and female hands and feet. J. Appl. Physiol. 2018, 125, 723–736. [Google Scholar] [CrossRef]
- Stokowiec, K.; Kotrys-Działak, D.; Jastrzȩbska, P. Verification of the Fanger model with field experimental data. J. Phys. Conf. Ser. 2022, 2339, 012027. [Google Scholar] [CrossRef]
- Xue, F.; Zhao, J. Building Thermal Comfort Research Based on Energy-Saving Concept. Adv. Mater. Sci. Eng. 2021, 2021, 7132437. [Google Scholar] [CrossRef]
- Karyono, K.; Abdullah, B.M.; Cotgrave, A.J.; Bras, A. The adaptive thermal comfort review from the 1920s, the present, and the future. Dev. Built Environ. 2020, 4, 100032. [Google Scholar] [CrossRef]
- d’Ambrosio Alfano, F.R.; Pepe, D.; Riccio, G.; Vio, M.; Palella, B.I. On the effects of the mean radiant temperature evaluation in the assessment of thermal comfort by dynamic energy simulation tools. Build. Environ. 2023, 236, 110254. [Google Scholar] [CrossRef]
- Yun, G.Y. Influences of perceived control on thermal comfort and energy use in buildings. Energy Build. 2018, 158, 822–830. [Google Scholar] [CrossRef]
- Sadeghian, P.; Rahnama, S.; Afshari, A.; Sadrizadeh, S. The role of design parameters on the performance of diffuse ceiling ventilation systems–thermal comfort analyses for indoor environment. Adv. Build. Energy Res. 2022, 16, 806–824. [Google Scholar] [CrossRef]
- Cheung, T.; Schiavon, S.; Parkinson, T.; Li, P.; Brager, G. Analysis of the accuracy on PMV—PPD model using the ASHRAE Global Thermal Comfort Database II. Build. Environ. 2019, 153, 205–217. [Google Scholar] [CrossRef]
- ISO 7730-2009; Ergonomics of the Thermal Environment. ISO: Geneva, Switzerland, 2009.
- ASHRAE Standard 55; Thermal Environmental Conditions for Human Occupancy. ASHRAE: Washington, DC, USA, 1966.
- Kim, J.H.; Min, Y.K.; Kim, B. Is the PMV index an indicator of human thermal comfort sensation? Int. J. Smart Home 2013, 7, 27–34. [Google Scholar]
- GOST 30494-2011; Residential and Public Buildings. Microclimate Parameters For Indoor Enclosures. GOST: St. Petersburg, Russia, 2011.
- BS EN-16798; Energy Performance of Buildings—Ventilation for Buildings. British Standards Institution: London, UK, 2019.
- Buratti, C.; Ricciardi, P. Adaptive analysis of thermal comfort in university classrooms: Correlation between experimental data and mathematical models. Build. Environ. 2009, 44, 674–687. [Google Scholar] [CrossRef]
- Zemitis, J.; Borodinecs, A.; Sidenko, N.; Zajacs, A. Simulation of IAQ and thermal comfort of a classroom at various ventilation strategies. E3S Web Conf. 2023, 396, 03005. [Google Scholar] [CrossRef]
- Ansaldi, R.; Corgnati, S.P.; Filippi, M. Comparison between Thermal Comfort Predictive Models and Subjective Responses in Italian University Classrooms. 2007. Available online: https://www.researchgate.net/publication/228503818_Comparison_between_thermal_comfort_predictive_models_and_subjective_responses_in_Italian_university_classroom (accessed on 5 March 2024).
- Corgnati, S.P.; Filippi, M.; Viazzo, S. Perception of the thermal environment in high school and university classrooms: Subjective preferences and thermal comfort. Build. Environ. 2007, 42, 951–959. [Google Scholar] [CrossRef]
- Dębska, L.; Zender, M. Analysis of the accuracy of the Fanger model in the intelligent building—A case study. E3S Web Conf. 2022, 347, 04012. [Google Scholar] [CrossRef]
- Cui, W.; Cao, G.; Park, J.H.; Ouyang, Q.; Zhu, Y. Influence of indoor air temperature on human thermal comfort, motivation and performance. Build. Environ. 2013, 68, 114–122. [Google Scholar] [CrossRef]
- Crosby, S.; Rysanek, A. Extending the Fanger PMV model to include the effect of non-thermal conditions on thermal comfort Build Run-Time Environment. In Proceedings of the eSIM Conference, Vancouver, BC, Canada, 14–16 June 2021. [Google Scholar]
- Arundel, A.V.; Sterling, E.M.; Biggin, J.H.; Sterling, T.D. Indirect health effects of relative humidity in indoor environments. Environ. Health Perspect. 1986, 65, 351–361. [Google Scholar] [PubMed]
- Ness, M.-C. Indoor relative humidity: Relevance for health, comfort, and choice of ventilation system. In Proceedings of the 3rd Valencia International Biennial of Research in Architecture, Valencia, Spain, 9–11 November 2022. [Google Scholar]
- Cattarin, G.; Simone, A.; Olesen, B.W. Human preference and acceptance of increased air velocity to offset warm sensation at increased room temperatures. In Proceedings of the 33rd AIVC conference–2nd TightVent Conference, Copenhagen, Denmark, 10–11 October 2012. [Google Scholar]
- O’Donovan, A.; Delaney, F.; O’Sullivan, P. Indoor environmental quality evaluation of lecture room environments: Changes due to infectious disease risk management. In Proceedings of the Comfort at the Extremes, Edinburgh, Scotland, UK, 5–6 September 2022. [Google Scholar]
Figure 1.
Equipment: (a) Testo 435. (b) JD-3002 air quality tester. (c) Fluke thermal camera.

Figure 2.
Plans: (a) Room 1. (b) Room 2. (c) Room 3. (d) Room 4. (e) Room 5. (f) Room 6. (g) Room 7. (h) Room 8. (i) Room 9.
Figure 2.
Plans: (a) Room 1. (b) Room 2. (c) Room 3. (d) Room 4. (e) Room 5. (f) Room 6. (g) Room 7. (h) Room 8. (i) Room 9.

Figure 3.
Models of human body: Model used in this study.

Figure 4.
Local discomfort caused by vertical temperature differences for Room 1 (R1), Room 2 (R2), Room 3 (R3), Room 4 (R4), Room 5 (R5), Room 6 (R6), Room 7 (R7), Room 8 (R8) and Room 9 (R9).
Figure 4.
Local discomfort caused by vertical temperature differences for Room 1 (R1), Room 2 (R2), Room 3 (R3), Room 4 (R4), Room 5 (R5), Room 6 (R6), Room 7 (R7), Room 8 (R8) and Room 9 (R9).

Figure 5.
Overall thermal sensations.
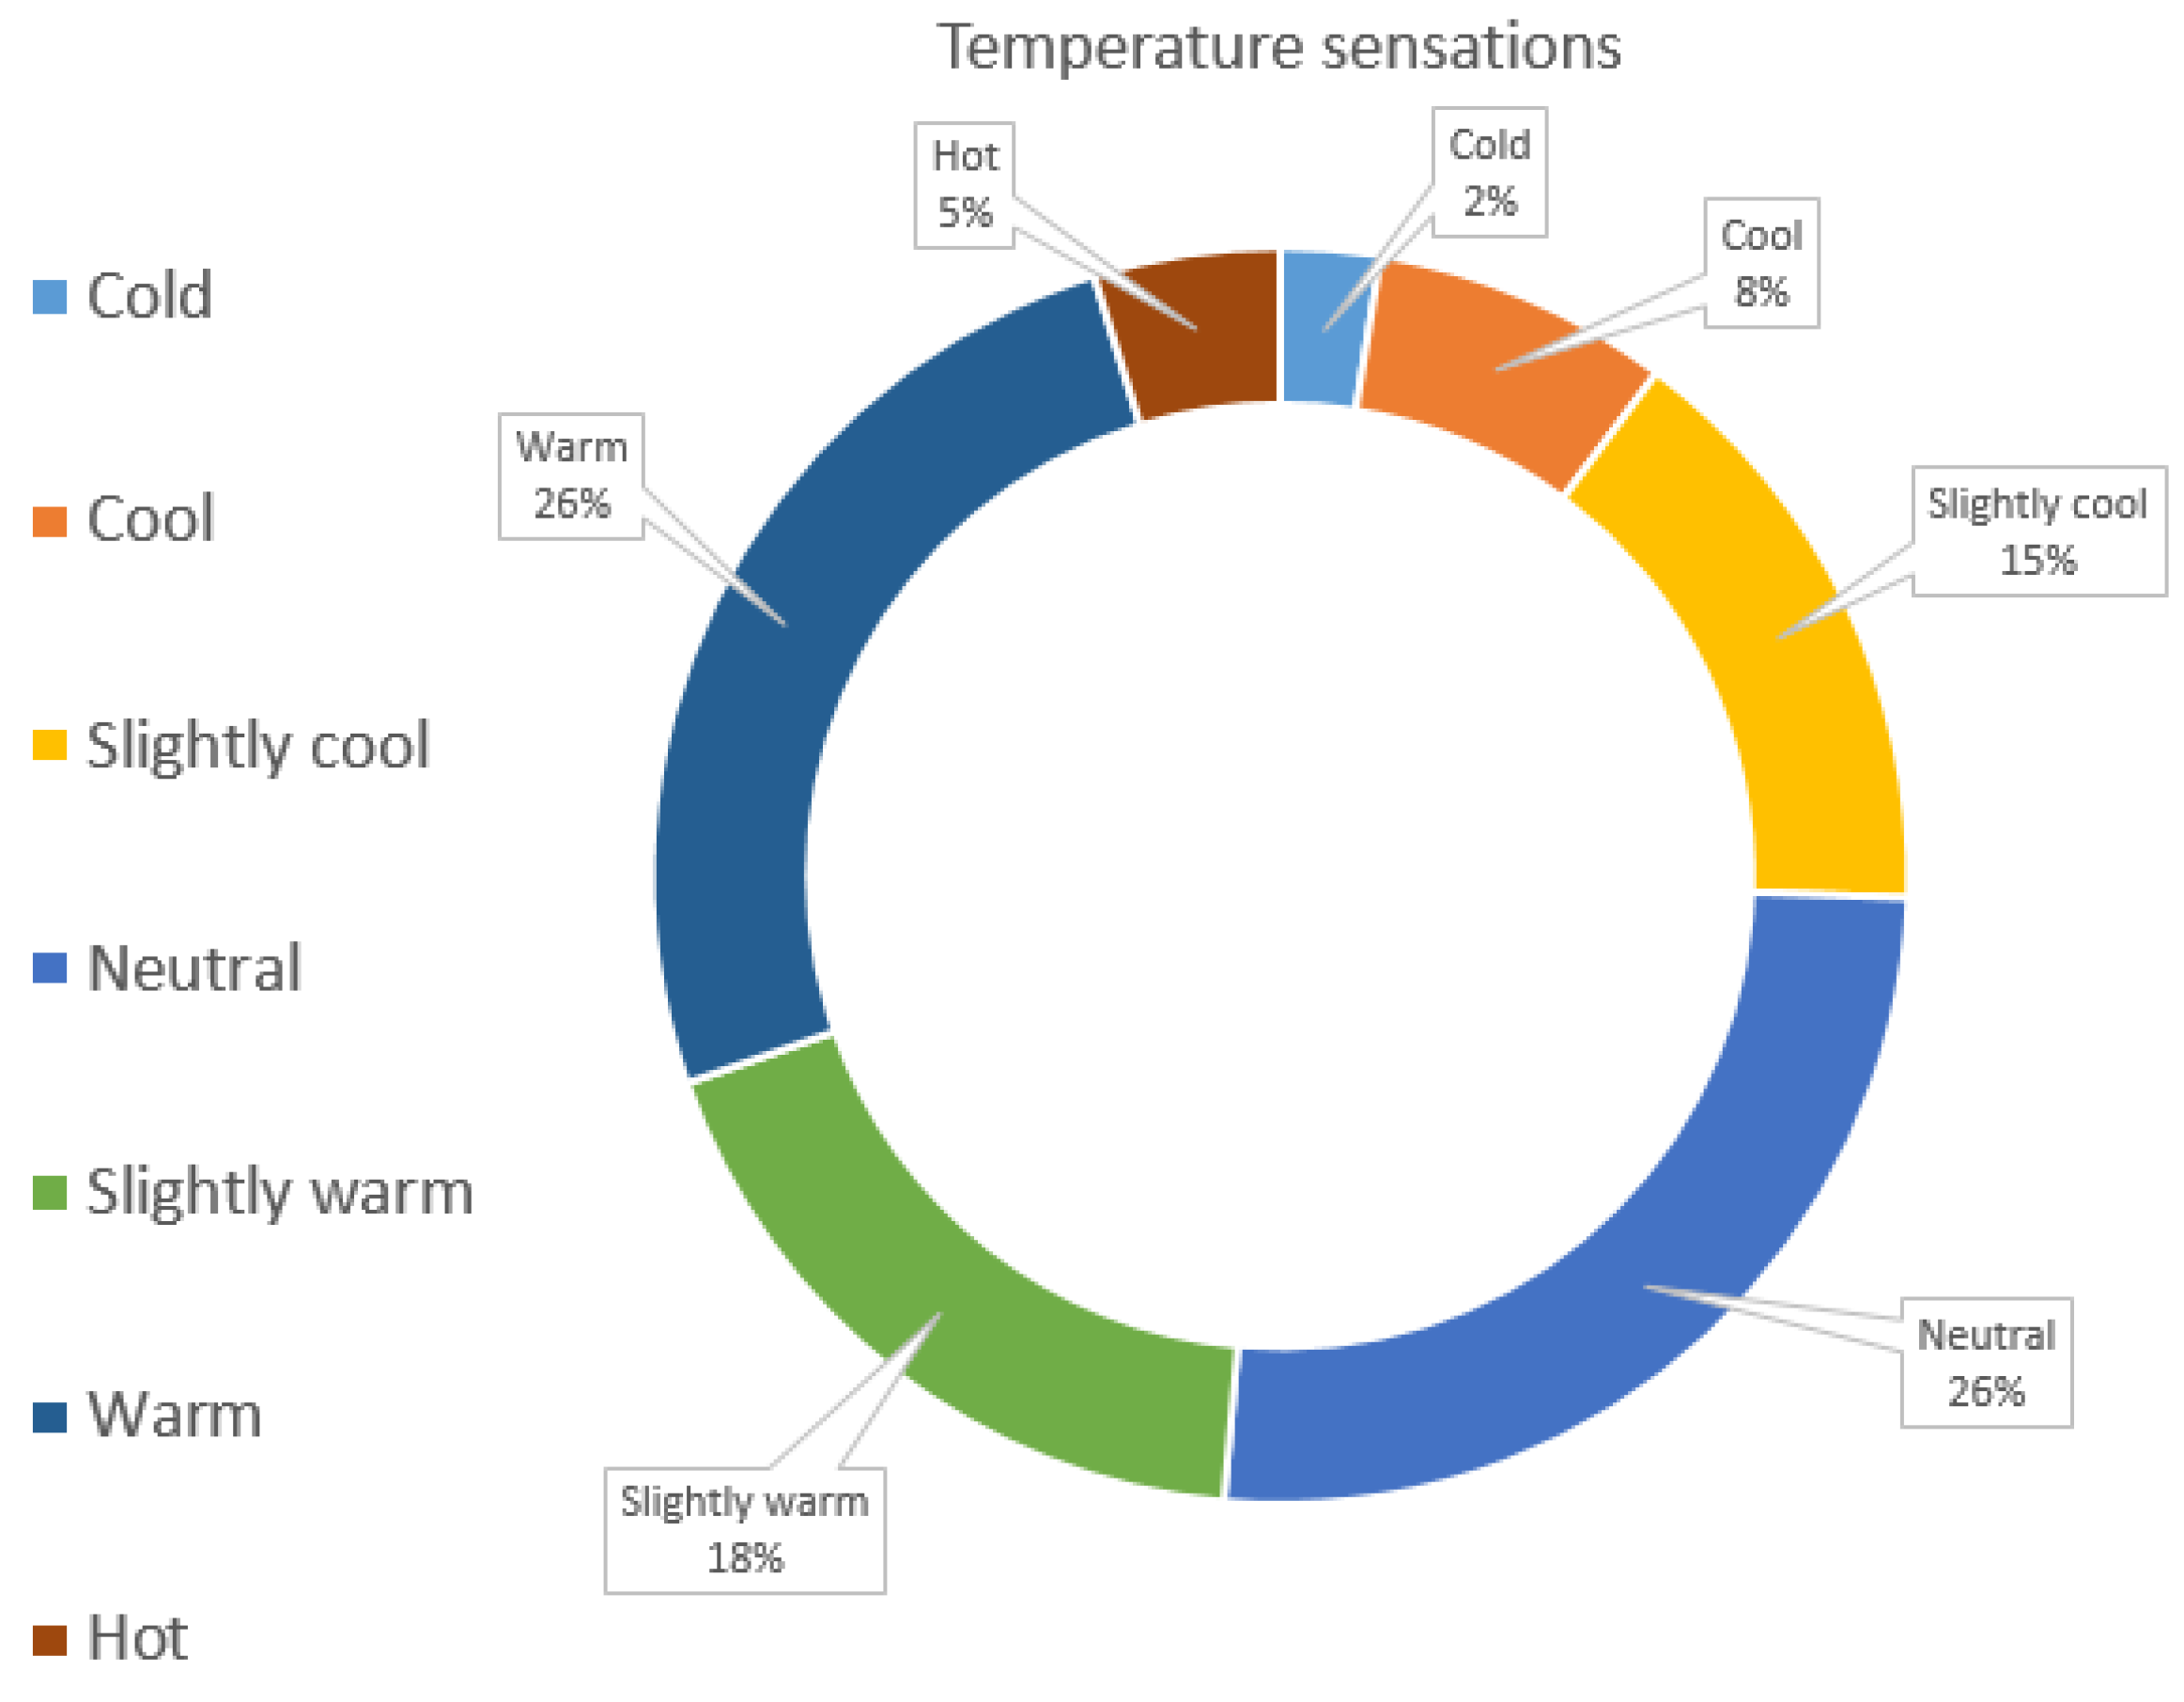
Figure 6.
(a) Simulation results for Room 5, PMV index. (b) Simulation results for Room 5, PMV index on human body. (c) Simulation results for Room 7, PMV index.
Figure 6.
(a) Simulation results for Room 5, PMV index. (b) Simulation results for Room 5, PMV index on human body. (c) Simulation results for Room 7, PMV index.
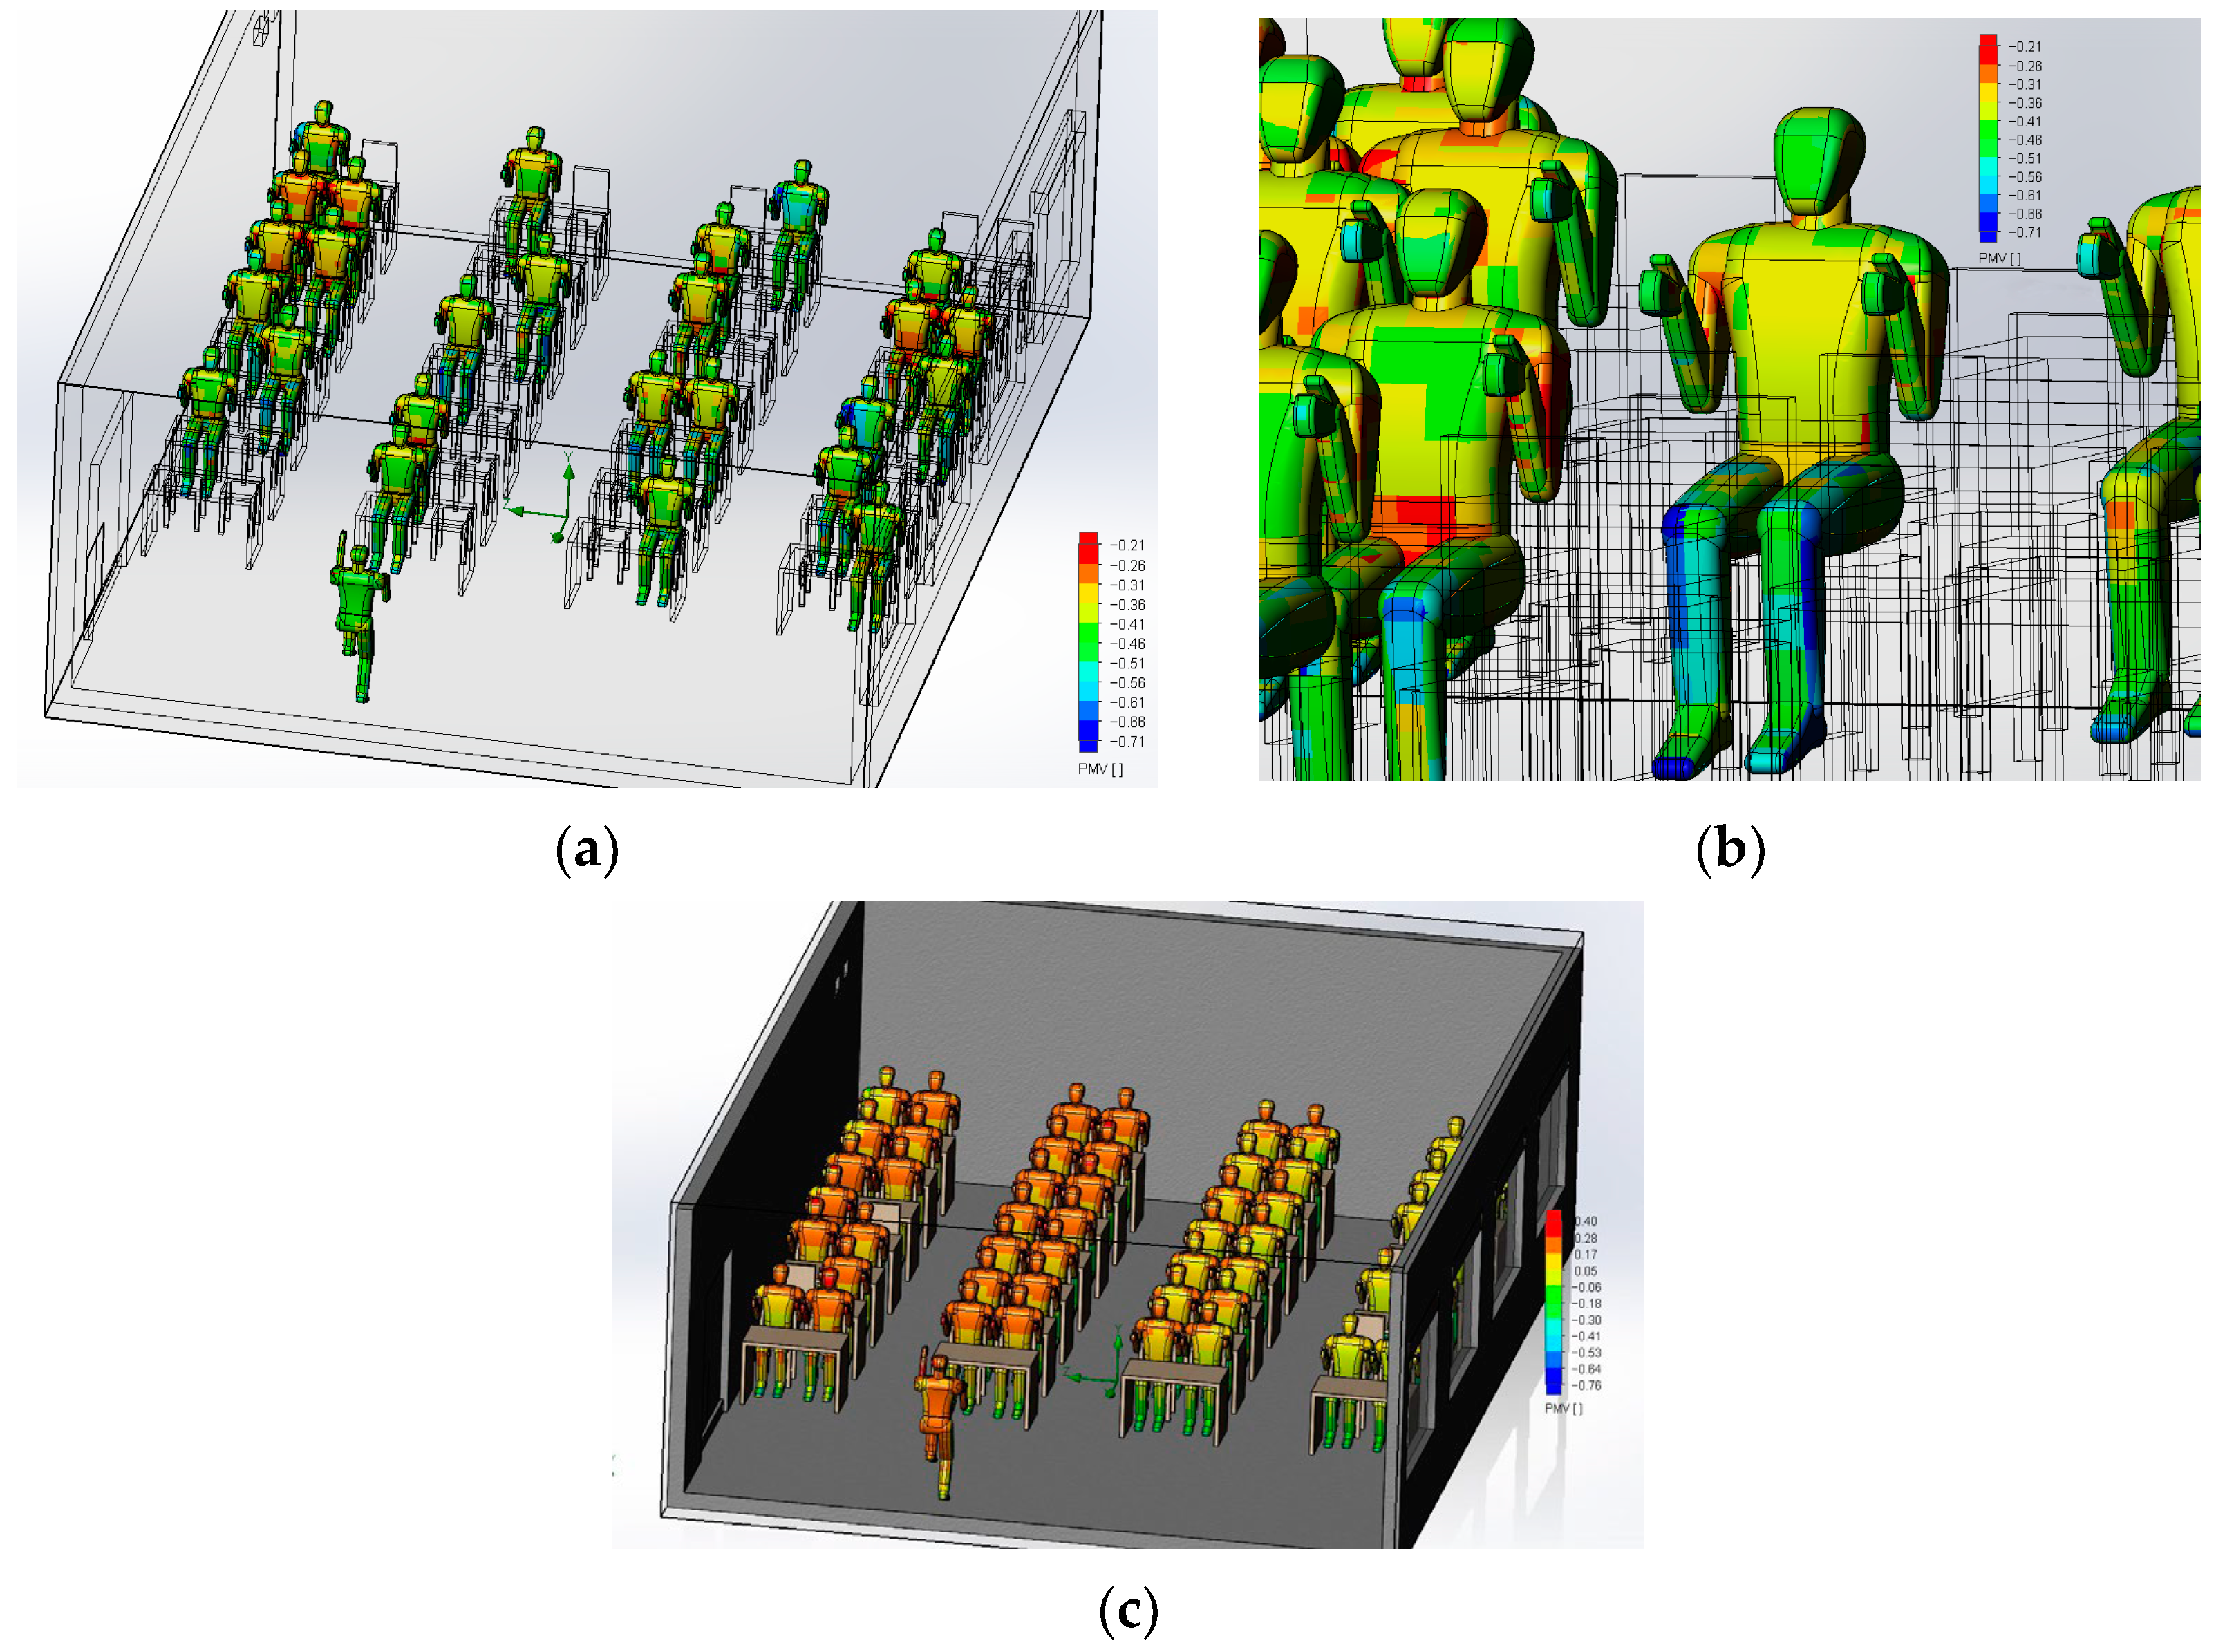
Figure 7.
Temperature gradient in Room 5.
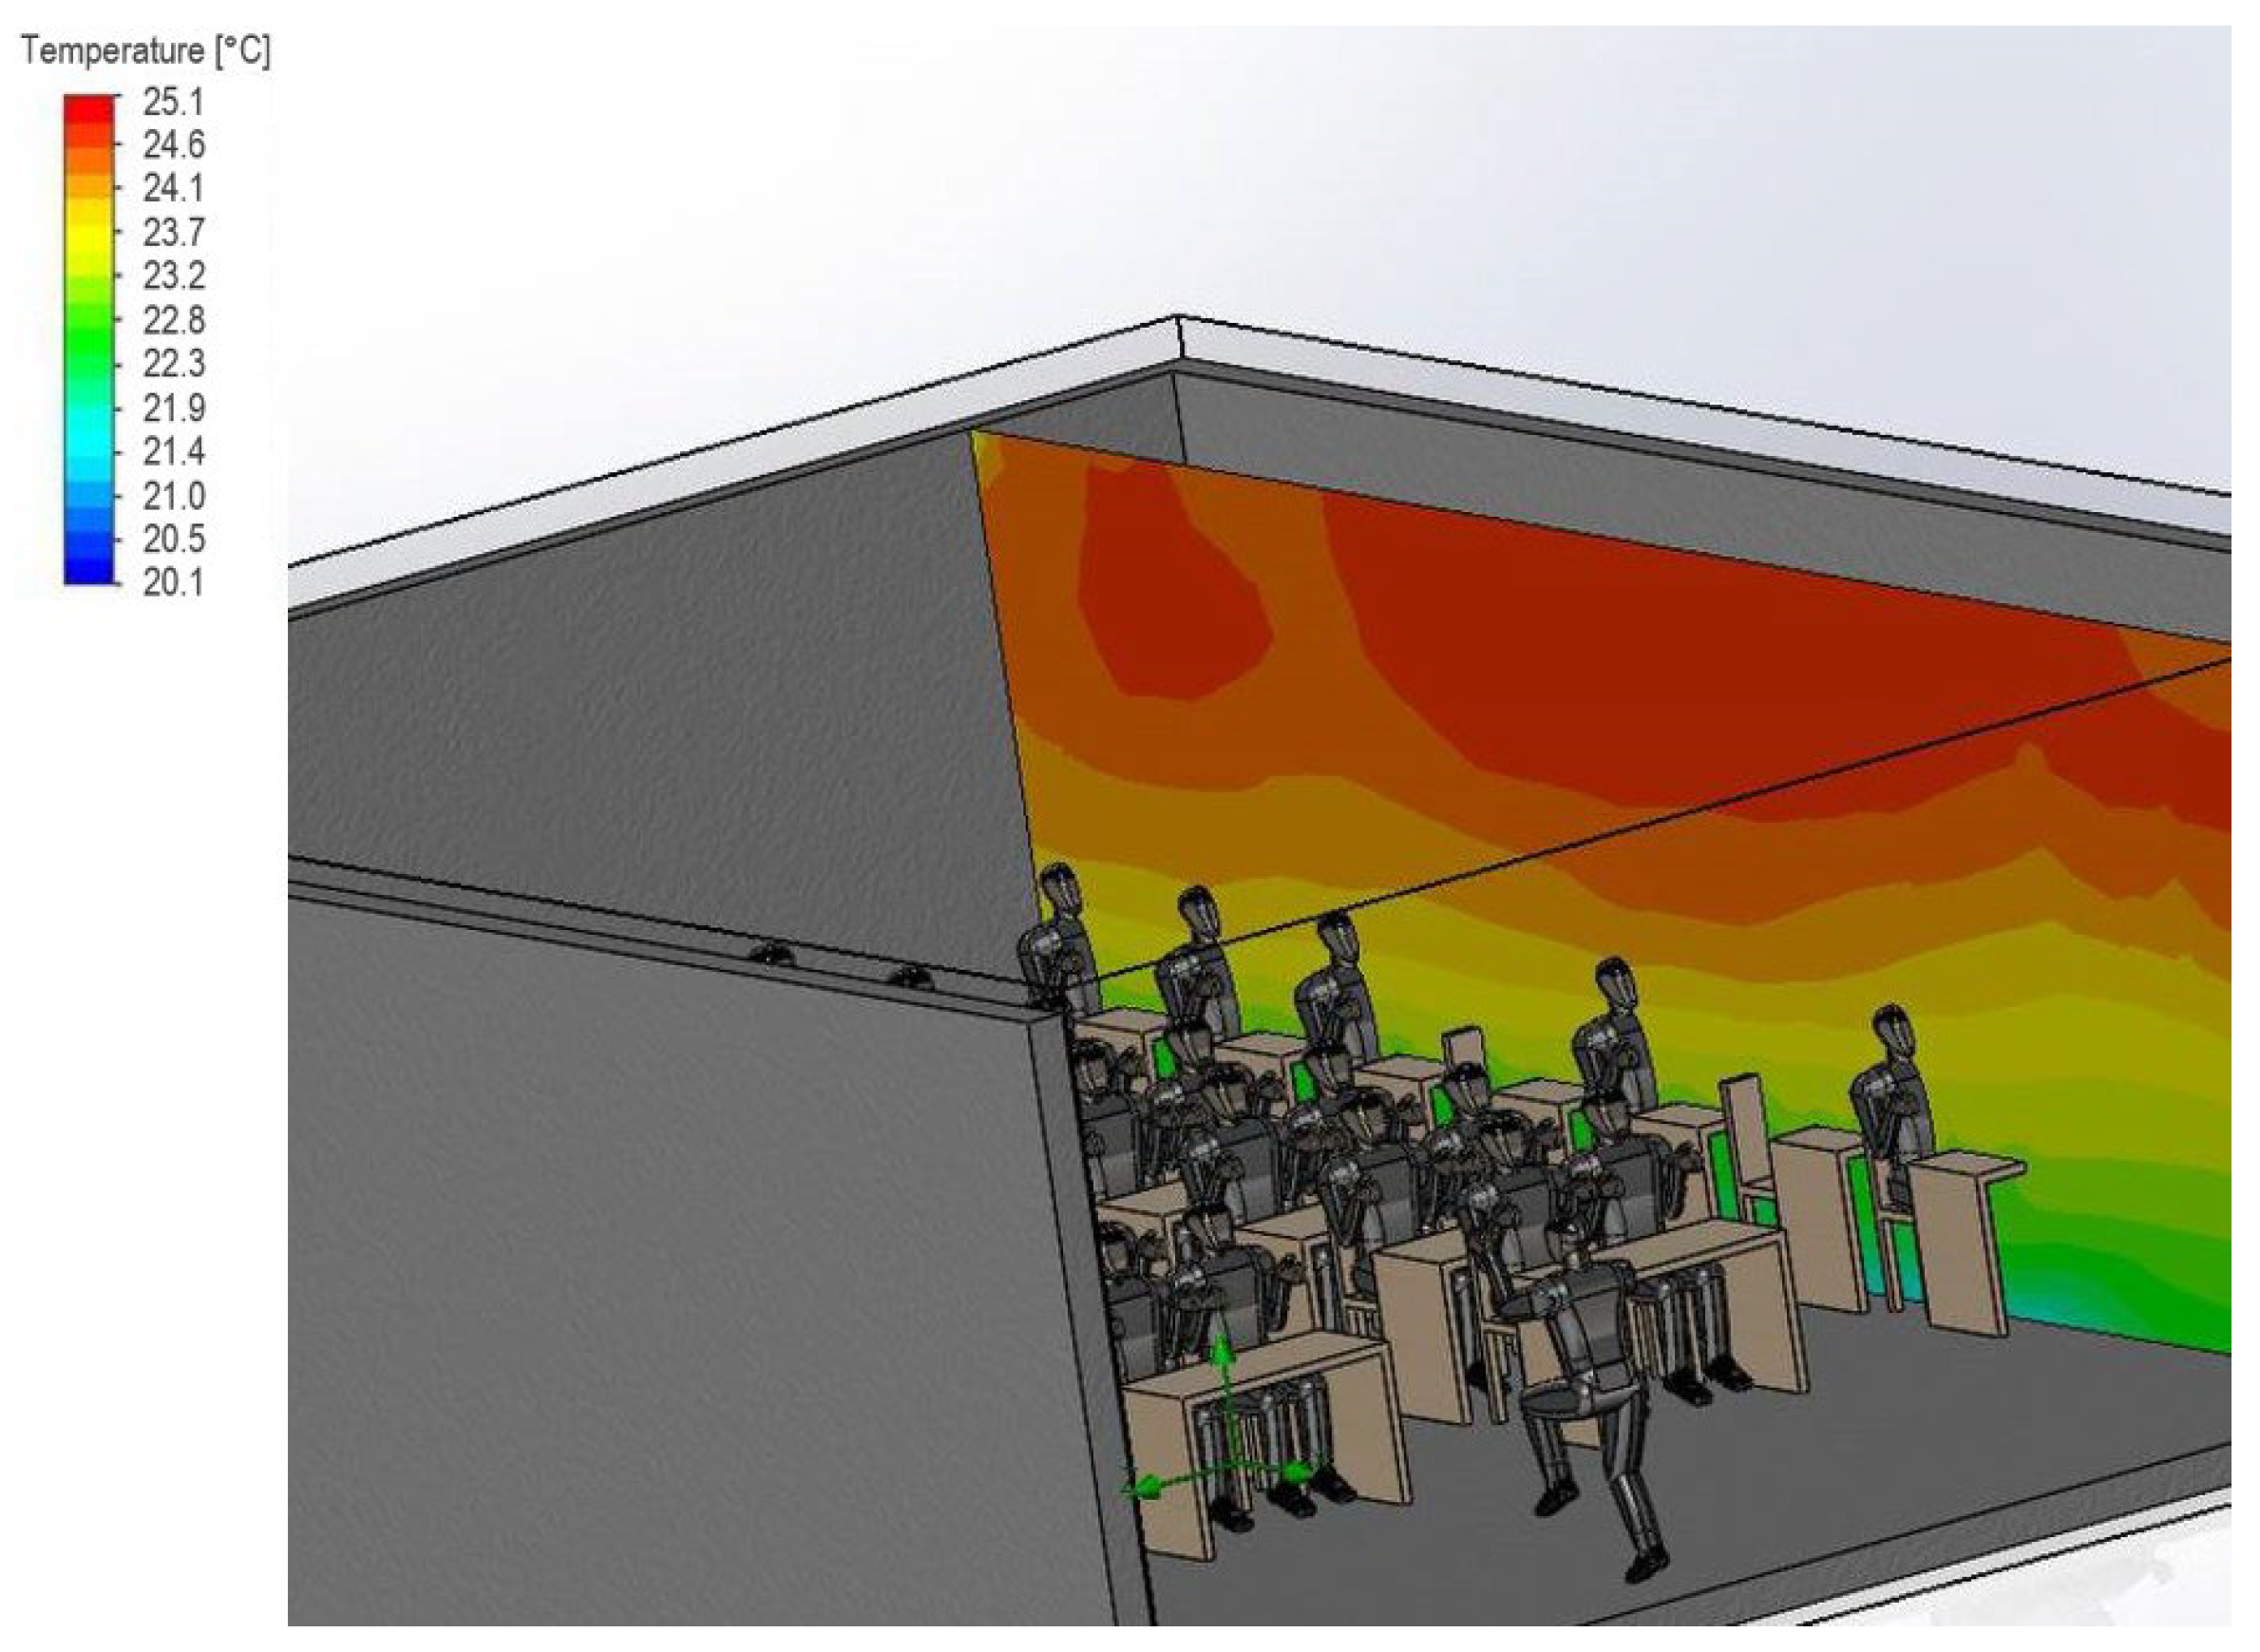
Figure 8.
Generalized diagrams for calculation results: (a) Results obtained by using calculator based on ASHRAE 55 and measured microclimatic parameter values. (b) Results obtained based on survey.
Figure 8.
Generalized diagrams for calculation results: (a) Results obtained by using calculator based on ASHRAE 55 and measured microclimatic parameter values. (b) Results obtained based on survey.
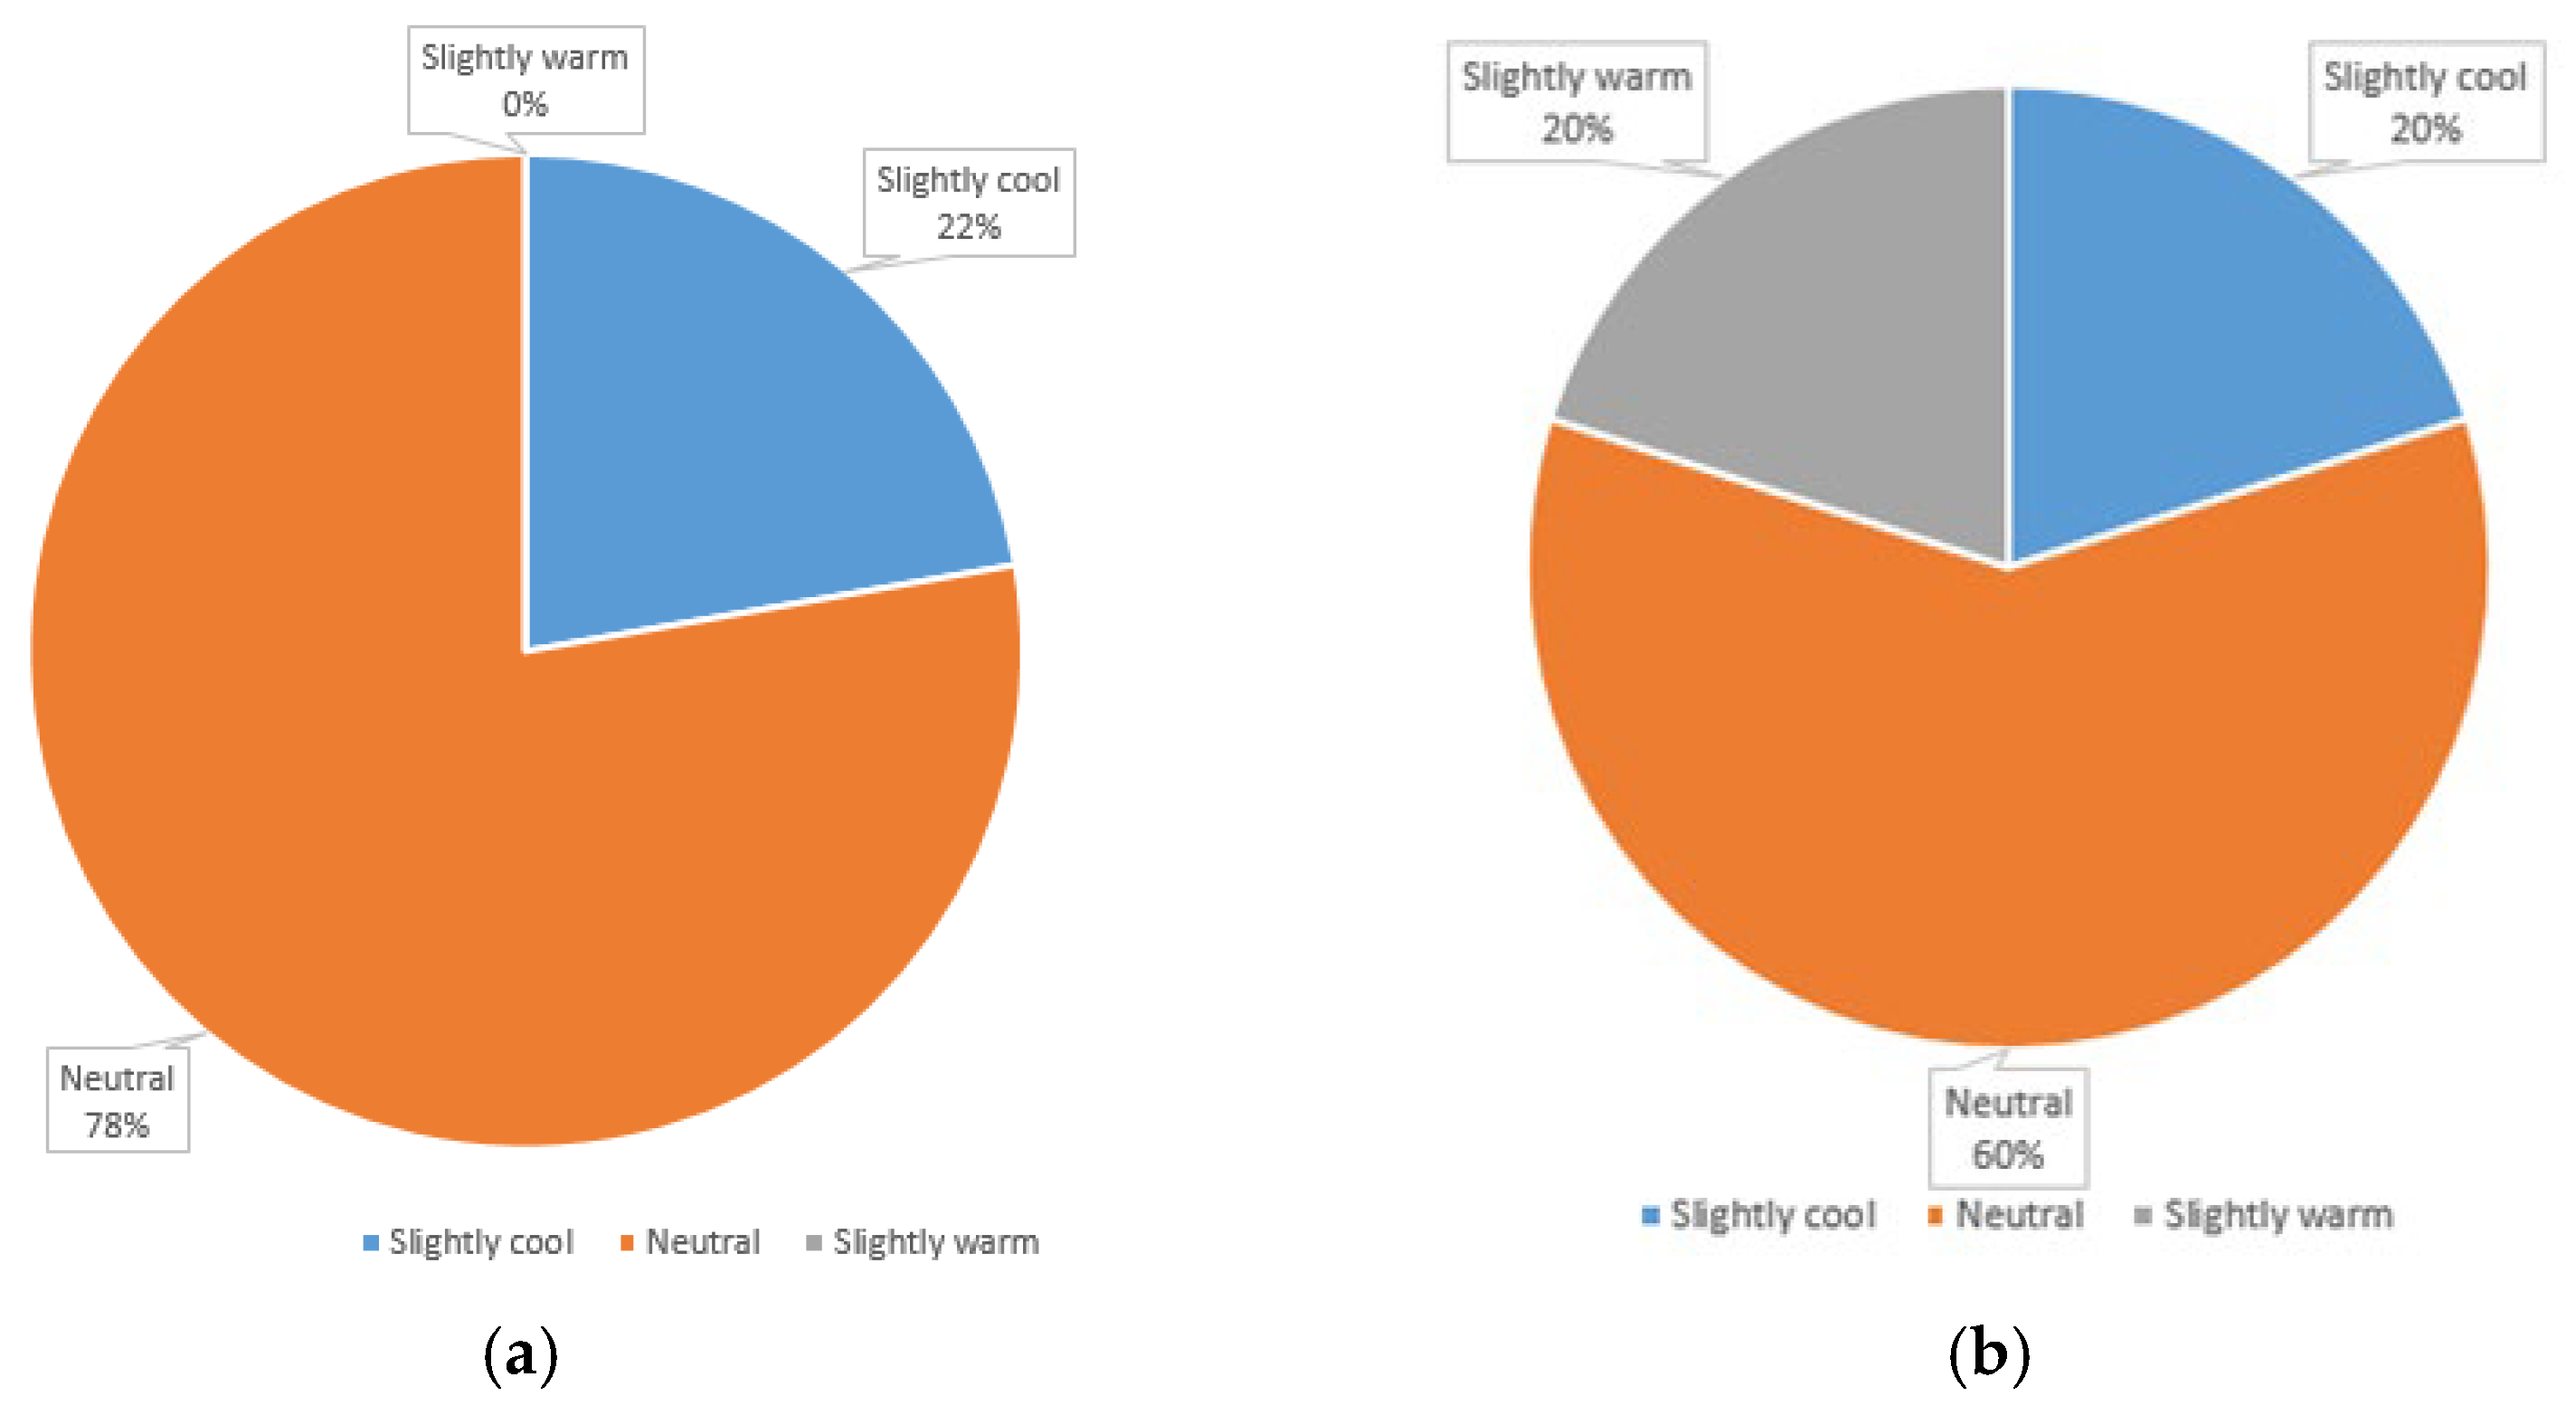
Figure 9.
Convergence of comfort indices: (a) PMV for survey and Fanger method. (b) PPD for survey and Fanger method. (c) PMV for survey and Fanger method accounting for additional coefficient. (d) PPD for survey and Fanger method accounting for additional coefficient.
Figure 9.
Convergence of comfort indices: (a) PMV for survey and Fanger method. (b) PPD for survey and Fanger method. (c) PMV for survey and Fanger method accounting for additional coefficient. (d) PPD for survey and Fanger method accounting for additional coefficient.


Table 1.
Additional information.
| Room | 1 | 2 | 3 | 4 | 5 | 6 | 7 | 8 | 9 |
|---|---|---|---|---|---|---|---|---|---|
| Survey period | Apr | Apr | May | Sep | May | May | May | Sep | Apr |
| Outdoor temperature, °C | 15.6 | 16.1 | 19.2 | 17.3 | 18.5 | 18.1 | 19.7 | 17.4 | 15.6 |
| Number of points | 8 | 8 | 8 | 8 | 8 | 7 | 9 | 9 | 9 |
| Stand | No | No | No | No | No | No | No | No | No |
| Windows | Yes | Yes | Yes | Yes | Yes | Yes | Yes | Yes | Yes |
| Questionnaire number | 22 | 30 | 34 | 23 | 27 | 35 | 53 | 42 | 50 |
Table 2.
Measurement results for Room 1.
| Measurement No. | Measurement Point | Height from Floor, m | Temperature, °C | Air Speed, m/s | Relative Humidity, % | CO2 Concentration, ppm |
|---|---|---|---|---|---|---|
| 1 | 1 | 0.1 | 28.0 | 0.09 | 32.5 | 390 |
| 0.6 | 28.5 | 0.09 | 32.6 | 398 | ||
| 1.7 | 29.0 | 0.09 | 32.5 | 400 | ||
| 2 | 0.1 | 26.0 | 0.09 | 29.9 | 385 | |
| 0.6 | 26.3 | 0.09 | 29.9 | 385 | ||
| 1.7 | 26.9 | 0.09 | 29.9 | 385 | ||
| 3 | 0.1 | 26.0 | 0.10 | 28.7 | 385 | |
| 0.6 | 26.1 | 0.09 | 28.5 | 385 | ||
| 1.7 | 26.5 | 0.10 | 28.7 | 385 | ||
| 4 | 0.1 | 24.8 | 0.09 | 28.1 | 385 | |
| 0.6 | 25.0 | 0.10 | 28.1 | 385 | ||
| 1.7 | 25.2 | 0.09 | 28.1 | 385 | ||
| 5 | 0.1 | 23.5 | 0.11 | 29.9 | 392 | |
| 0.6 | 23.5 | 0.10 | 29.9 | 390 | ||
| 1.7 | 23.7 | 0.09 | 29.9 | 392 | ||
| 6 | 0.1 | 23.7 | 0.09 | 35.4 | 420 | |
| 0.6 | 23.7 | 0.09 | 35.6 | 425 | ||
| 1.7 | 23.8 | 0.09 | 35.8 | 427 | ||
| 7 | 0.1 | 23.1 | 0.09 | 30.4 | 404 | |
| 0.6 | 23.5 | 0.10 | 30.6 | 400 | ||
| 1.7 | 23.9 | 0.09 | 30.7 | 412 | ||
| 8 | 0.1 | 22.6 | 0.09 | 30.0 | 463 | |
| 0.6 | 22.8 | 0.09 | 30.6 | 460 | ||
| 1.7 | 22.8 | 0.09 | 30.3 | 475 | ||
| 2 | 1 | 0.1 | 28.2 | 0.10 | 32.8 | 398 |
| 0.6 | 28.2 | 0.09 | 33.0 | 400 | ||
| 1.7 | 29.3 | 0.09 | 32.9 | 420 | ||
| 2 | 0.1 | 26.2 | 0.09 | 30.0 | 400 | |
| 0.6 | 26.8 | 0.10 | 29.9 | 405 | ||
| 1.7 | 27.3 | 0.09 | 29.2 | 403 | ||
| 3 | 0.1 | 26.2 | 0.09 | 29.1 | 390 | |
| 0.6 | 26.0 | 0.09 | 28.8 | 392 | ||
| 1.7 | 26.3 | 0.09 | 28.8 | 402 | ||
| 4 | 0.1 | 24.9 | 0.10 | 28.7 | 387 | |
| 0.6 | 24.9 | 0.09 | 28.5 | 392 | ||
| 1.7 | 25.2 | 0.09 | 28.5 | 393 | ||
| 5 | 0.1 | 24.0 | 0.09 | 29.5 | 412 | |
| 0.6 | 24.3 | 0.10 | 29.0 | 420 | ||
| 1.7 | 24.2 | 0.11 | 28.8 | 418 | ||
| 6 | 0.1 | 24.2 | 0.09 | 35.4 | 458 | |
| 0.6 | 24.0 | 0.09 | 35.4 | 450 | ||
| 1.7 | 24.3 | 0.09 | 35.2 | 451 | ||
| 7 | 0.1 | 23.5 | 0.10 | 30.2 | 417 | |
| 0.6 | 23.7 | 0.09 | 30.7 | 413 | ||
| 1.7 | 23.9 | 0.09 | 30.0 | 429 | ||
| 8 | 0.1 | 22.8 | 0.10 | 30.2 | 475 | |
| 0.6 | 23.0 | 0.10 | 29.8 | 490 | ||
| 1.7 | 22.9 | 0.09 | 29.7 | 492 | ||
| 3 | 1 | 0.1 | 29.0 | 0.09 | 32.5 | 405 |
| 0.6 | 29.0 | 0.09 | 32.3 | 413 | ||
| 1.7 | 28.6 | 0.09 | 32.3 | 422 | ||
| 2 | 0.1 | 26.7 | 0.09 | 29.8 | 401 | |
| 0.6 | 26.8 | 0.09 | 29.8 | 407 | ||
| 1.7 | 26.9 | 0.09 | 28.3 | 408 | ||
| 3 | 0.1 | 26.9 | 0.09 | 28.6 | 405 | |
| 0.6 | 27.1 | 0.09 | 28.9 | 418 | ||
| 1.7 | 27.2 | 0.09 | 28.7 | 425 | ||
| 4 | 0.1 | 24.8 | 0.09 | 28.1 | 385 | |
| 0.6 | 25.3 | 0.09 | 27.7 | 395 | ||
| 1.7 | 25.3 | 0.09 | 27.6 | 396 | ||
| 5 | 0.1 | 24.3 | 0.09 | 29.5 | 423 | |
| 0.6 | 24.3 | 0.09 | 29.0 | 421 | ||
| 1.7 | 24.4 | 0.10 | 28.6 | 420 | ||
| 6 | 0.1 | 24.2 | 0.09 | 35.6 | 465 | |
| 0.6 | 24.1 | 0.10 | 35.7 | 463 | ||
| 1.7 | 24.1 | 0.10 | 35.0 | 470 | ||
| 7 | 0.1 | 23.6 | 0.09 | 29.7 | 424 | |
| 0.6 | 23.6 | 0.09 | 29.5 | 427 | ||
| 1.7 | 23.8 | 0.09 | 29.7 | 439 | ||
| 8 | 0.1 | 23.0 | 0.09 | 30.0 | 502 | |
| 0.6 | 23.0 | 0.09 | 29.7 | 506 | ||
| 1.7 | 23.1 | 0.10 | 29.7 | 499 |
Table 3.
Areas of enclosing structures. Room 1.
| Wall 1 | Wall 2 | Wall 3 | Wall 4 | Floor | Ceiling | |
|---|---|---|---|---|---|---|
| Width, m | 6.4 | 8.5 | 6.4 | 8.5 | 6.4 | |
| Height, m | 3.6 | 8.5 | ||||
| Square, m | 23.0 | 30.6 | 23.0 | 30.6 | 54.4 | |
| Surface temperature, °C | 26.4 | 26.9 | 27.2 | 26.1 | 24.7 | 27.9 |
Table 4.
Resulting values.
| Room | Measurement | Temperature, °C | Overall Temperature, °C | Relative Humidity, % | Overall Relative Humidity, % | Air Speed, m/s | Overall Air Speed, m/s | CO2 Concentration, ppm | Overall CO2 Concentration, ppm |
|---|---|---|---|---|---|---|---|---|---|
| 1 | 1 | 25.0 | 25.2 | 30.7 | 30.5 | 0.09 | 0.09 | 405 | 419 |
| 2 | 25.2 | 30.6 | 0.09 | 421 | |||||
| 3 | 25.4 | 30.3 | 0.09 | 431 | |||||
| 2 | 1 | 24.7 | 24.9 | 27.3 | 27.9 | 0.09 | 0.09 | 392 | 402 |
| 2 | 24.9 | 28.0 | 0.09 | 403 | |||||
| 3 | 25.1 | 28.5 | 0.09 | 410 | |||||
| 3 | 1 | 24.9 | 25.0 | 32.8 | 32.9 | 0.09 | 0.09 | 416 | 421 |
| 2 | 25.0 | 32.9 | 0.09 | 422 | |||||
| 3 | 25.1 | 33.0 | 0.09 | 425 | |||||
| 4 | 1 | 26.9 | 27.0 | 34.6 | 34.9 | 0.09 | 0.09 | 904 | 912 |
| 2 | 27.0 | 34.9 | 0.09 | 913 | |||||
| 3 | 27.1 | 35.3 | 0.09 | 920 | |||||
| 5 | 1 | 24.7 | 24.9 | 30.9 | 30.7 | 0.09 | 0.09 | 544 | 527 |
| 2 | 24.9 | 30.5 | 0.09 | 513 | |||||
| 3 | 25.0 | 30.7 | 0.09 | 526 | |||||
| 6 | 1 | 24.3 | 24.4 | 65.7 | 63.0 | 0.09 | 0.09 | 513 | 509 |
| 2 | 24.9 | 62.3 | 0.09 | 517 | |||||
| 3 | 24.6 | 61.0 | 0.10 | 498 | |||||
| 7 | 1 | 24.6 | 25.0 | 37.4 | 38.8 | 0.09 | 0.09 | 787 | 803 |
| 2 | 24.9 | 36.4 | 0.09 | 792 | |||||
| 3 | 25.4 | 42.5 | 0.09 | 831 | |||||
| 8 | 1 | 23.4 | 23.7 | 55.0 | 52.6 | 0.10 | 0.10 | 431 | 435 |
| 2 | 23.7 | 50.9 | 0.09 | 418 | |||||
| 3 | 23.9 | 52.0 | 0.10 | 457 | |||||
| 9 | 1 | 24.5 | 24.9 | 39.5 | 40.1 | 0.10 | 0.10 | 463 | 509 |
| 2 | 25.0 | 40.5 | 0.10 | 526 | |||||
| 3 | 25.0 | 40.2 | 0.10 | 538 |
Table 5.
Radiant temperatures in classrooms.
| Room 1 | Room 2 | Room 3 | Room 4 | Room 5 | Room 6 | |
| Radiant temperature, °C | 26.5 | 24.6 | 24.4 | 26.2 | 24.0 | 22.7 |
| Room 7 | Room 8 | Room 9 | ||||
| Radiant temperature, °C | 26.7 | 22.7 | 23.7 |
Table 6.
Resulting temperatures in classrooms.
| Room 1 | Room 2 | Room 3 | Room 4 | Room 5 | Room 6 | |
| Resulting temperature, °C | 25.9 | 24.8 | 24.7 | 26.6 | 24.5 | 23.6 |
| Room 7 | Room 8 | Room 9 | ||||
| Resulting temperature, °C | 25.9 | 23.2 | 24.3 |
Table 7.
Calculation results.
| Room | PMV Value | PPD Value, % | PD Value, % |
|---|---|---|---|
| 1 | 0.07 | 5 | <0.80 |
| 2 | −0.29 | 7 | <0.41 |
| 3 | −0.26 | 6 | <0.37 |
| 4 | 0.43 | 9 | <0.74 |
| 5 | −0.36 | 8 | <0.41 |
| 6 | −0.52 | 11 | <0.62 |
| 7 | 0.21 | 6 | <0.41 |
| 8 | −0.74 | 17 | <0.48 |
| 9 | −0.34 | 7 | <0.52 |
Table 8.
Survey results.
| Room No. | Location | Type of Clothing | Thermal Sensations | ||||||||||
|---|---|---|---|---|---|---|---|---|---|---|---|---|---|
| By the Window | In the Center | Away From the Window | T-Shirt | Long-Sleeved Shirt | Sweatshirt | Cold | Cool | Slightly Cool | Neutral | Slightly Warm | Warm | Hot | |
| 1 | 5 | 10 | 7 | 5 | 9 | 8 | 0 | 2 | 3 | 8 | 6 | 3 | 0 |
| 2 | 10 | 13 | 7 | 7 | 10 | 13 | 2 | 5 | 5 | 9 | 4 | 4 | 1 |
| 3 | 11 | 13 | 10 | 8 | 11 | 15 | 2 | 4 | 8 | 10 | 5 | 3 | 2 |
| 4 | 7 | 5 | 11 | 0 | 7 | 16 | 0 | 1 | 4 | 5 | 4 | 9 | 0 |
| 5 | 7 | 12 | 8 | 6 | 9 | 12 | 0 | 4 | 9 | 6 | 5 | 3 | 0 |
| 6 | 9 | 13 | 13 | 20 | 11 | 4 | 0 | 8 | 6 | 15 | 4 | 2 | 0 |
| 7 | 17 | 16 | 20 | 4 | 15 | 34 | 1 | 3 | 2 | 25 | 9 | 10 | 3 |
| 8 | 19 | 13 | 10 | 15 | 21 | 6 | 1 | 9 | 9 | 17 | 5 | 1 | 0 |
| 9 | 14 | 26 | 10 | 11 | 14 | 25 | 2 | 7 | 13 | 15 | 6 | 6 | 1 |
| Total | |||||||||||||
| 76 | 107 | 133 | 8 | 43 | 59 | 110 | 48 | 41 | 7 | ||||
Table 9.
PMV and PPD calculation results from survey data.
| Room | PMV Value | PPD Value, % |
|---|---|---|
| 1 | 0.23 | 6.1 |
| 2 | −0.20 | 5.8 |
| 3 | −0.15 | 5.5 |
| 4 | 0.70 | 15.3 |
| 5 | −0.22 | 6.1 |
| 6 | −0.40 | 8.3 |
| 7 | 0.51 | 10.4 |
| 8 | −0.55 | 11.3 |
| 9 | −0.24 | 6.2 |
Table 10.
General results of PMV calculation for Rooms 5 and 7.
| Calculation Method | Room 5 | Room 7 |
|---|---|---|
| Method 1 | −0.22 | 0.51 |
| Method 2 | −0.36 | 0.21 |
| Method 3 | −0.3/−0.4 | 0.2/0.28 |
Table 11.
General results of this study.
| Room | Microclimatic Parameters | Thermal Sensations Obtained by Calculator Based on Measurements (ASHRAE 55) | Real Thermal Sensations Obtained by Survey | ||
|---|---|---|---|---|---|
| Name, Unit of Measurement | ASHRAE 55 (Ideal Conditions) | Real | |||
| 1 | Temperature, °C | 19–21 | 25.2 | Neutral (PMV1 = 0.07 PPD1 = 5%) | Neutral (PMV2 = 0.23 PPD2 = 6.1%) |
| Air speed, m/s | 0.2–0.3 | 0.09 | |||
| Relative humidity, % | 30–45 | 30.5 | |||
| CO2 concentration, ppm | 500–600 | 419 | |||
| 2 | Temperature, °C | 19–21 | 24.9 | Neutral (PMV1 = −0.29 PPD1 = 7%) | Neutral (PMV2 = −0.20 PPD2 = 5.8%) |
| Air speed, m/s | 0.2–0. | 0.09 | |||
| Relative humidity, % | 30–45% | 27.9 | |||
| CO2 concentration, ppm | 500–600 | 402 | |||
| 3 | Temperature, °C | 19–21 | 25.0 | Neutral (PMV1 = −0.26 PPD1 = 6%) | Neutral (PMV2 = −0.15 PPD2 = 5.5%) |
| Air speed, m/s | 0.2–0.3 | 0.09 | |||
| Relative humidity, % | 30–45 | 32.9 | |||
| CO2 concentration, ppm | 500–600 | 421 | |||
| 4 | Temperature, °C | 19–21 | 27.0 | Neutral (PMV1 = 0.43 PPD1 = 9%) | Slightly warm (PMV2 = 0.70 PPD2 = 15.3%) |
| Air speed, m/s | 0.2–0.3 | 0.09 | |||
| Relative humidity, % | 30–45 | 34.9 | |||
| CO2 concentration, ppm | 500–600 | 912 | |||
| 5 | Temperature, °C | 19–21 | 24.9 | Neutral (PMV1 = −0.36 PPD1 = 8%) | Neutral (PMV2 = −0.22 PPD2 = 6.1%) |
| Air speed, m/s | 0.2–0.3 | 0.09 | |||
| Relative humidity, % | 30–45 | 30.7 | |||
| CO2 concentration, ppm | 500–600 | 527 | |||
| 6 | Temperature, °C | 19–21 | 24.4 | Slightly cool (PMV1 = −0.52 PPD1 = 11%) | Neutral (PMV2 = −0.40 PPD2 = 8.3%) |
| Air speed, m/s | 0.2–0.3 | 0.09 | |||
| Relative humidity, % | 30–45 | 63.0 | |||
| CO2 concentration, ppm | 500–600 | 509 | |||
| 7 | Temperature, °C | 19–21 | 25.0 | Neutral (PMV1 = 0.21 PPD1 = 6%) | Slightly warm (PMV2 = 0.51 PPD2 = 10.4%) |
| Air speed, m/s | 0.2–0.3 | 0.09 | |||
| Relative humidity, % | 30–45 | 38.8 | |||
| CO2 concentration, ppm | 500–600 | 580 | |||
| 8 | Temperature, °C | 19–21 | 23.7 | Slightly cool (PMV1 = −0.74 PPD1 = 17%) | Slightly cool (PMV2 = −0.55 PPD2 = 11.3%) |
| Air speed, m/s | 0.2–0.3 | 0.10 | |||
| Relative humidity, % | 30–45 | 52.6 | |||
| CO2 concentration, ppm | 500–600 | 435 | |||
| 9 | Temperature, °C | 19–21 | 24.9 | Neutral (PMV1 = −0.34 PPD1 = 7%) | Neutral (PMV2 = −0.24 PPD2 = 6.2%) |
| Air speed, m/s | 0.2–0.3 | 0.10 | |||
| Relative humidity, % | 30–45 | 40.1 | |||
| CO2 concentration, ppm | 500–600 | 509 | |||
Table 12.
Mean values of PMV and PPD.
| Calculation Method | PMVmean ± SD | PPDmean ± SD |
|---|---|---|
| Based on measurements | −0.20 ± 0.37 | 8.44 ± 3.68 |
| Based on survey | −0.04 ± 0.42 | 8.33 ± 3.36 |
Disclaimer/Publisher’s Note: The statements, opinions and data contained in all publications are solely those of the individual author(s) and contributor(s) and not of MDPI and/or the editor(s). MDPI and/or the editor(s) disclaim responsibility for any injury to people or property resulting from any ideas, methods, instructions or products referred to in the content. |
© 2024 by the authors. Licensee MDPI, Basel, Switzerland. This article is an open access article distributed under the terms and conditions of the Creative Commons Attribution (CC BY) license (https://creativecommons.org/licenses/by/4.0/).
Share and Cite
MDPI and ACS Style
Strelets, K.; Zaborova, D.; Serbin, I.; Petrochenko, M.; Zavodnova, E. Analysis of Microclimatic Comfort Conditions in University Classrooms. Sustainability 2024, 16, 3388. https://doi.org/10.3390/su16083388
AMA Style
Strelets K, Zaborova D, Serbin I, Petrochenko M, Zavodnova E. Analysis of Microclimatic Comfort Conditions in University Classrooms. Sustainability. 2024; 16(8):3388. https://doi.org/10.3390/su16083388
Chicago/Turabian StyleStrelets, Ksenia, Daria Zaborova, Ilya Serbin, Marina Petrochenko, and Evgeniia Zavodnova. 2024. "Analysis of Microclimatic Comfort Conditions in University Classrooms" Sustainability 16, no. 8: 3388. https://doi.org/10.3390/su16083388
Note that from the first issue of 2016, this journal uses article numbers instead of page numbers. See further details here.