Abstract
Earth Overshoot Day is used as an exemplary case to suggest actions to obtain better compliance between the ecological footprints and biocapacities of the world’s regions. This study was based on the Global Footprint Network’s free public data on Earth Overshoot Day. The analyses of the data applied a partial ordering methodology in combination with the so-called Philosophy Model, leading to a joint ranking of the regions based on the simultaneous inclusion of ecological footprint data and data on biocapacities. The ranking was topped by South America, whereas North America and the Middle East/Central Asia were at the bottom of the list. Biocapacity was found to be the most important ranking indicator. Thus, doubling the biocapacity for each region would, on a global scale, lead to a population reserve of approx. 1.5 billion, whereas a halving of the individual ecological footprint would still lead to a population deficit of approximately 1 billion. The footprints and the biocapacities are composed of six and five sub-indicators, respectively, and the carbon footprint together with the built-up land footprint is the most important sub-indicator. To comply with the corresponding available biocapacity, significant reductions in the carbon footprint are needed, close to 50% for high-income countries. The ethical issues, as well as their interconnection with the Sustainable Development Goals, were discussed, with a focus on carbon footprints and well-being, as well as educating women, as illustrative cases.
1. Introduction
“The Earth Hungers for the Fulness of Justice”
Hildegard of Bingen (1098–1179)
In September 2015, the United Nations’ General Assembly unanimously adopted the seventeen Sustainable Development Goals (SDGs) [1]—global goals that they optimistically aspired to achieve by 2030. However, it is worth stressing that even the complete fulfillment of the SDGs by all 193 countries by no means indicates that we would have achieved a sustainable world. In the very best case, we would have achieved sustainable development, whereas the road to sustainability is still exceedingly long and troublesome.
It is difficult to talk about sustainability without talking about ethics, and with that in mind, it is some kind of achievement to get 193 countries to adopt the seventeen SDGs [2] unanimously: is it ethically acceptable that in certain parts of the world, girls are not able to have a proper education (SDG 4), that women in many respects are discriminated (SDG 5), that certain groups, e.g., LGPB+ persons, are discriminated against or even prosecuted as criminals, possibly facing the death penalty (SDG 10), and that we are still over-exploiting our planet (SDG 12, 13, 14, 15)? In some parts of the world, this is argued, or at least assumed, to be ethically correct, whereas in other parts, it is not.
In the present study, the focus will be on environmental issues, more specifically, on the over-exploitation of our planet. This over-exploitation is unambiguously demonstrated by Earth Overshoot Day [3], which in simple words is an indication of when a given country or region has used the ‘allowable’ amount of resources for a given year. The Overshoot Day for a given country or region is calculated “by dividing the biocapacity (the amount of ecological resources the region/country is able to generate that year), by humanity’s Ecological Footprint (humanity’s demand for that year), and multiplying by 365, the number of days in a year” [3]. This shows that for the last few years, on a global scale, human activities have used the ‘allowed’ resources, i.e., the resources that may be regenerated, around August 1st. With reference to the so-called Micawber Principle [4], this situation is not everlasting, although it constitutes a crucial step. Ecological footprints, as well as biocapacities, are constructed by a simple arithmetic aggregation of a series of sub-indicators (cf. Appendix A.1 and Appendix A.2). It should be noted that such an aggregation may be subject to compensation effects [5]. Thus, the present study will elucidate the relative importance of the sub-indicators.
The analyses of the Overshoot Day data will be based on the partial order methodology [6,7] for nine regions (Total All Countries, Africa, Asia-Pacific, Central America/Caribbean, EU-27, Middle East/Central Asia, North America, Other Europe, AND South America) and the subsequent discussion will, using the Overshoot Day results as an exemplary case, be discussed adopting a model, which was originally developed as a management model by the military psychologist Bent Rieneck in 1984 [8], where ethical considerations are an essential issue.
Based on the analyses, a ranking of the regions will be developed, as well as an elucidation of the relative importance of the single footprint- and biocapacity sub-indicators. The possible interactions between single SDGs, like SDG 13 (Climate action), SDG 4 (Quality education), well-being (exemplified through SDG 1 (No poverty)), SDG 2 (Zero hunger), and SDG3 (Good health and well-being), will be elucidated through exemplary cases.
2. Methods
2.1. Data
The data for the study were retrieved from the Global Footprint Network, which has published data on the ecological footprints of production and consumption and biocapacity, all given as global hectares per person (gha). Apart from the total footprint, the production and consumption footprints were subdivided into the indicators of cropland, grazing, forest products, carbon and fish footprints, and built-up land. The biocapacity was similarly subdivided into the indicators of cropland, grazing, forest products, fish capacities, and built-up land [9]. The specific definitions of the subdivisions are given in Appendix A, which is taken directly from reference [8]. The data for the ecological footprints and the biocapacities for the single regions are given in Appendix A.1 and Appendix A.2.
It is important to note that the applied data originating from various sources unequivocally may be subject to varying quality that to some extent may influence the analyses and the results. The data quality for the single countries is found in the original data material [9]. The quality of the data are ranked in 12 classes according to a series of criteria and limitations [10,11,12]. For the present study, the available data are applied as such, accepting that the eventual results may be subject to some uncertainty.
2.2. Partial Order Analyses
The partial order methodology is a technique for analyzing the relations, e.g., rankings, between a group of elements, here, countries or regions, which are characterized by a series of indicators without any pretreatment of the data, like aggregation of the single indicators into one single indicator, which allows us to determine the specific roles of the single indicators and at the same time avoid compensation effects [5].
The basics of the partial order methodology have been described in several papers see e.g., [6,7] and is from a mathematical point of view only related to the ≥ function. Thus, if one element, x, is higher for at least one indicator and higher or equal to for all other indicators, x > y [6,7]. The graphical illustration are given by the so-called Hasse diagrams [6,7]
Applying multi-indicator ranking methods, like partial ordering, it is crucial that the single indicators are arranged in the same direction, i.e. the higher the indicator values is the better [6,7]. Thus, in the present study the footprint indicators values were multiplied by −1 to obtain the same direction as for the biocapacity indicator, i.e., the higher the better.
A series of specialized applications of the partial order methodology have been applied, like sensitivity analyses [6,13], which will deliver the relative importance of the included indicators; and the average ranking [14,15], which will lead to a weak order, i.e., an order where several elements may have the same order; and peculiar elements [16], which will point to elements that have one or more indicators values that are surprisingly high or low.
2.3. Software
Partial order analyses were conducted using the PyHasse software [17]. The PyHasse software package is programmed in Python (version 2.6) and contains around 140 more or less specialized modules. Selected modules may be obtained from the author.
2.4. The Philosophy Model
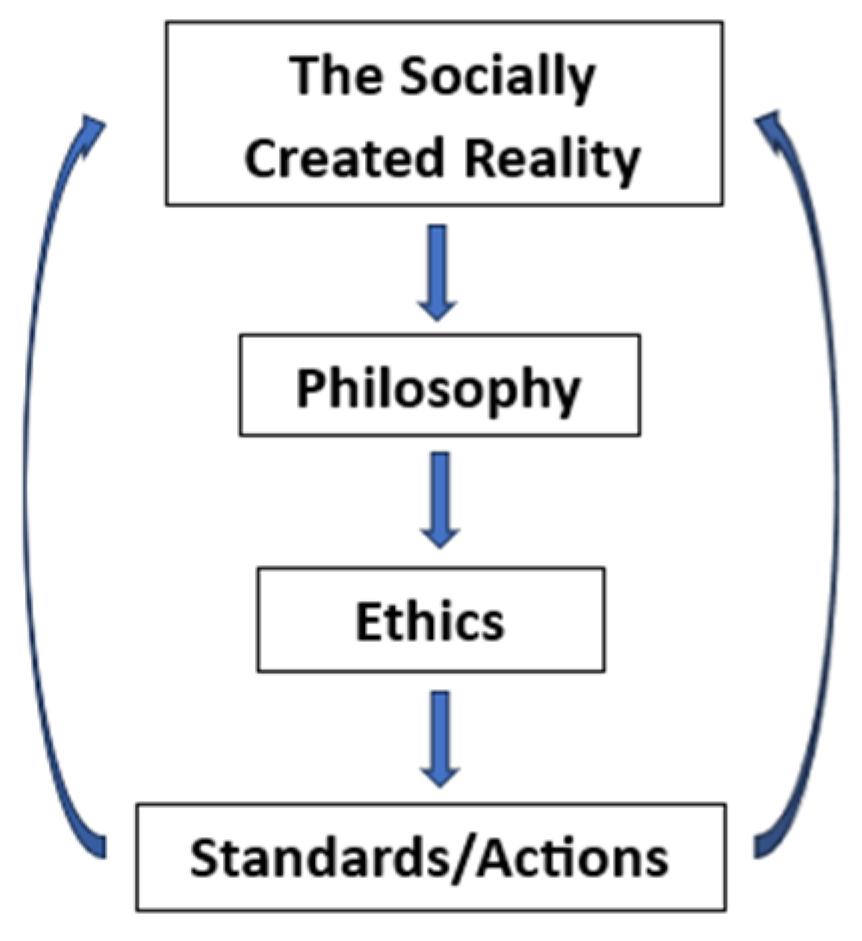
The model “Management Philosophy and Corporate Culture, a Mindset, and a Tool”, often called “The Philosophy Model”, was developed by the Danish military psychologist Bent Rieneck [8]. However, the principles on which the model is based have universal validity. The model starts from the Socially Created Reality, which is defined as “the understanding we, alone or together with others, have about things, mode of life, etc. that we consider as a true picture of the existing reality, which means that we can live and act in it being convinced that it is the reality” [8].
We may have a philosophy based on the socially created reality (which here is the basis of the model’s name), i.e., assumptions or hypotheses about possibilities, actions, and modes—or tendencies of action [8].
Following the philosophy, we arrive at ethics. Ethics is the point where it is necessary to make up one’s mind about philosophical assumptions and hypotheses. In other words, it is the process where it is necessary to judge what is good and what is bad, i.e., what actions do we want to promote and what actions do we want to restrain. It is, in cases like the ones discussed here, important to note that ethical issues may differ significantly from region (or country) to region or between religious beliefs. Subsequently, the possible standards/actions that will sustain the ethics should be disclosed and verified to agree with our mode of living. It is in this context worth mentioning that ethical values may vary geographically between different countries and cultures. However, it is assumed that such variations in the present case, i.e., saving the planet, are not decisive players. A decisive point is the testing and implementing of the actions to verify that it works acceptably. The model can be schematically visualized as in Figure 1 [8]. Note that the arrows leading back from the Standards/Actions to the Socially Created Reality signalize a necessary feedback to verify that the chosen Standards/Actions eventually are in agreement med the Socially Created Reality and thud, the Philosophy and the Ethics.
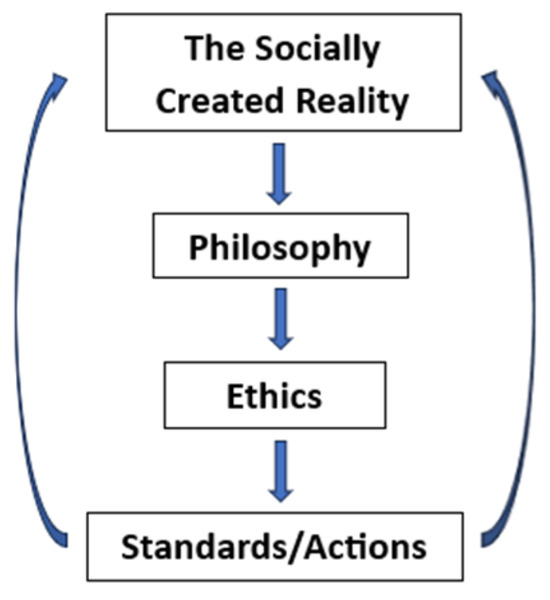
Figure 1.
The Philosophy Model [8].
3. Results
Based on the total ecological footprints for production and consumption, respectively, and the total biocapacity of the single regions, i.e., the composite indicators that are generated by simple summation of the single sub-indicators (cf. Appendix A.1 and Appendix A.2 [9]) (Table 1), together with the average rank [14,15], which is calculated using the footprints and the biocapacity as indicators, all three indicators are measured in global hectares per person (gha). The resulting partial ordering is visualized in Figure 2.

Table 1.
Total ecological footprints of production and consumption and total biocapacity for the single regions (extracted from Appendix A.1, Appendix A.2 and Appendix A.3) and their average rank.
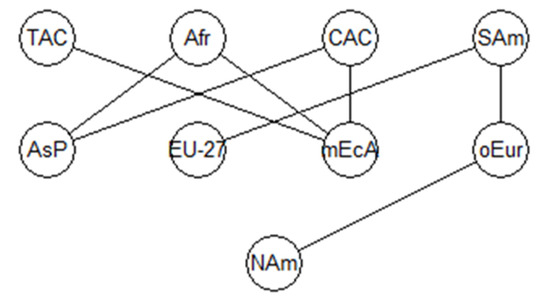
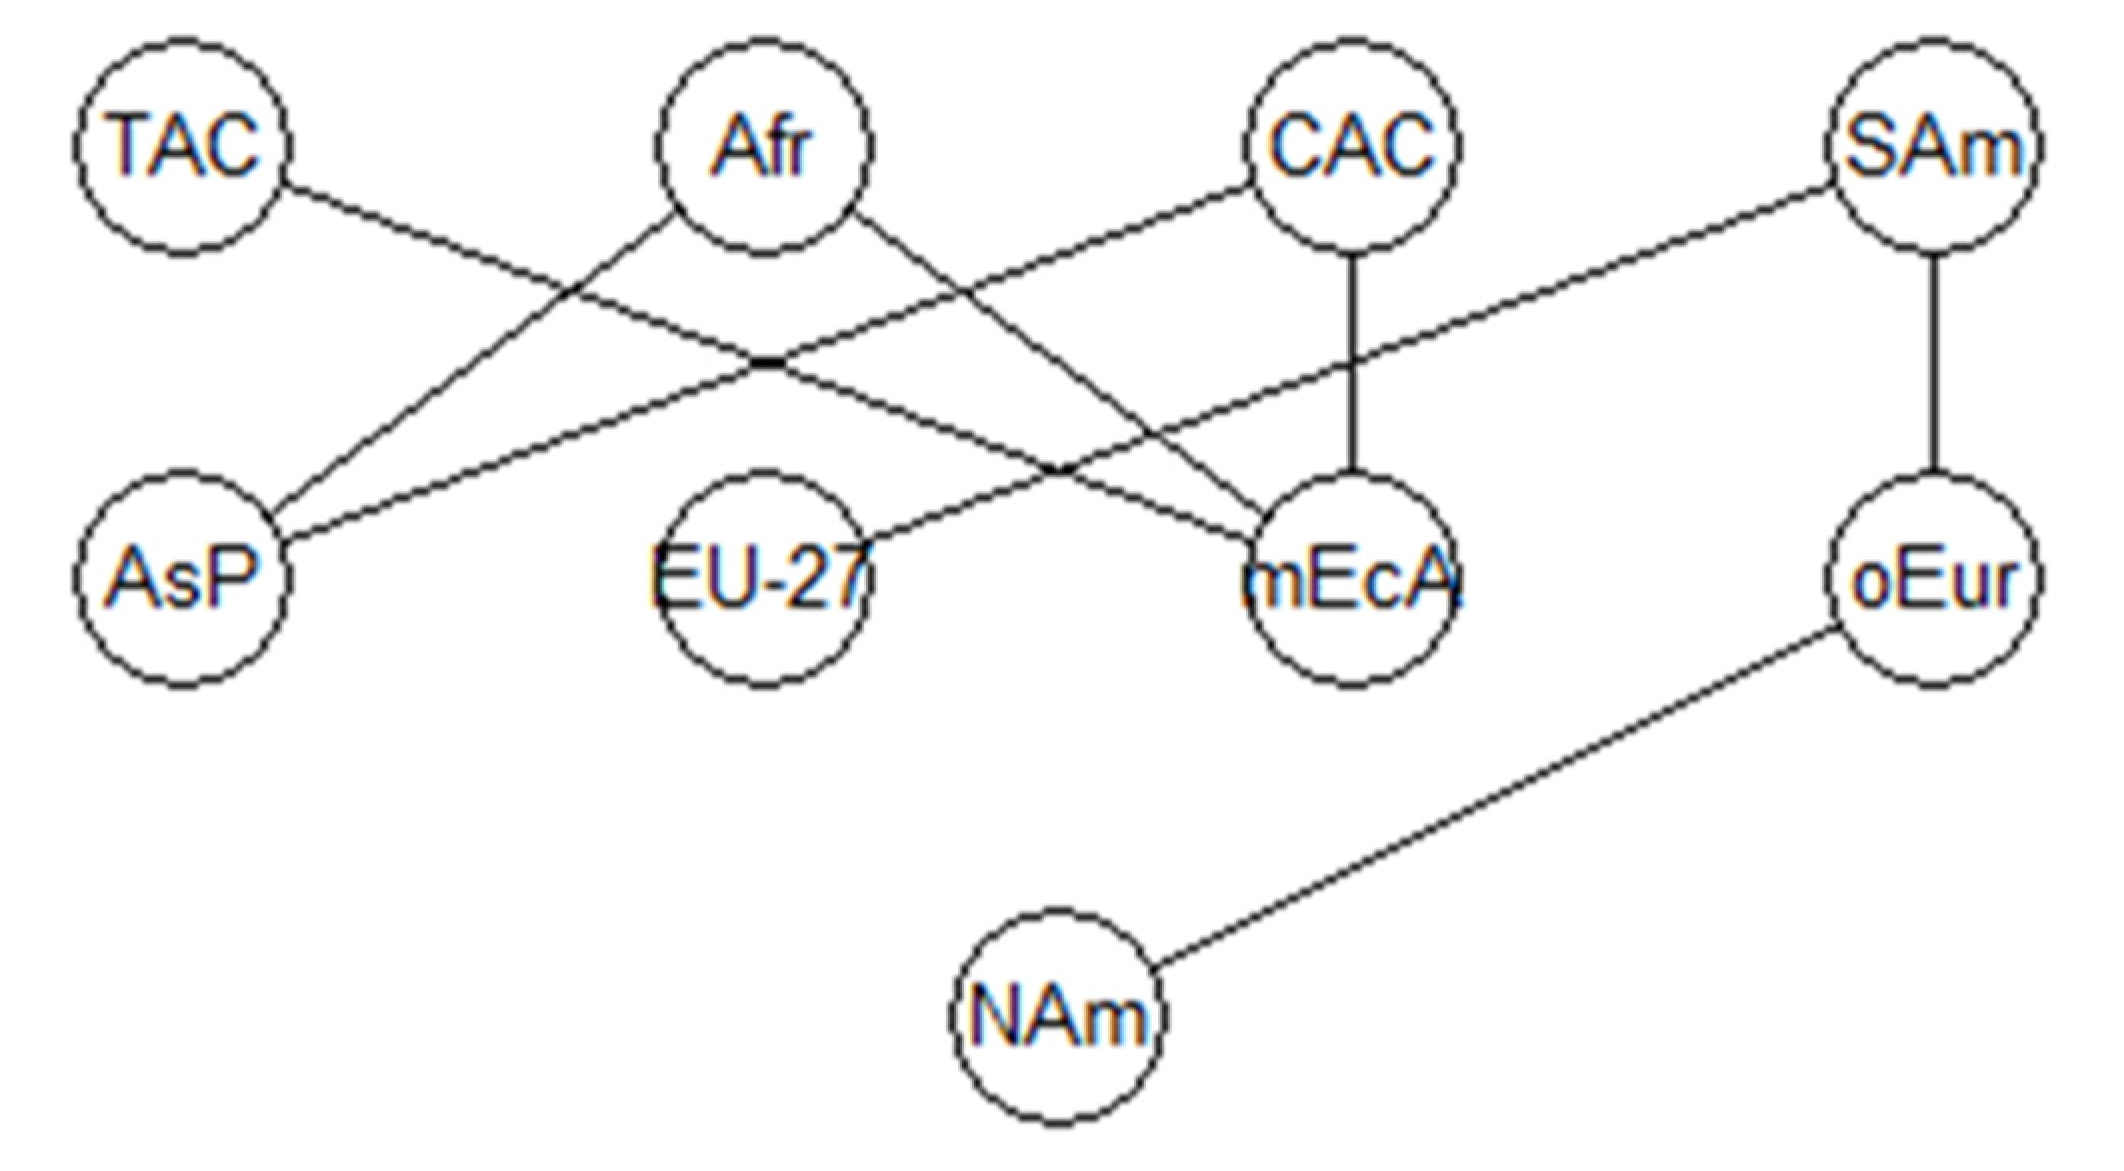
Figure 2.
Hasse diagram visualizing the nine regions’ partial ordering based on the three indicators. For the IDs, Table 1 should be consulted.
Looking deeper into the ranking, it is possible to reveal which of the three indicators dominates the overall ranking. The sensitivity analysis unequivocally demonstrated that the most important indicator is biocapacity, accounting for 88.9%, followed by the ecological footprint of production with 11.1%, whereas the consumption footprint did not influence the ranking. This may a priori seem somewhat surprising. However, production and consumption are strongly linked (cf. Table 2); thus, without consumption, no production. Thus, the footprint of consumption and biocapacity are used to calculate the number of planets and countries that are necessary to sustain the current number of people in the single regions [9] (Table 2).
Number of planets = Total Ecofootprint (consumption)/Total Biocapacity (world)
Number of countries = Total Ecofootprint (consumption)/Total Biocapacity
Table 2.
The ecological deficit/reserve for the single regions and the calculated planets/countries needed to comply with the available biocapacity and the needed population reduction to comply with the available biocapacity.
A similar set of calculations including all 181 countries [9] revealed that biocapacity is the most important indicator (83.9%), followed by the production- and consumption footprints with 12.7 and 3.4%, respectively. As a couple of examples where the consumption footprint is significantly higher than the biocapacity, Denmark and the United States of America may serve, with their consumption footprint being 7.286 and 7.461 global hectares per capita (gha), respectively, whereas their corresponding biocapacities are 4.217 and 3.721 gha per capita, respectively. An extreme example is Bahrain, where the consumption footprint and the biocapacity are 8.176 and 0.556 gha per capita, respectively. On the other end of the scale, e.g., New Zealand is found, with a consumption footprint of 5.436 and a biocapacity of 8.447 gha, respectively.
As a further supplement to the above-described studies on the relative importance of the composite indicators (Table 1) and the single sub-indicators (Table 3), i.e., the production- and consumption ecological footprints, as well as the biocapacity, it is also of interest to elucidate the relative importance of the single components of these three indicators, with the data being retrieved from Appendix A.1 and Appendix A.2, respectively [9]. In Table 4, the relative importance values of the single sub-indicators in the three main indicators are summarized.
Table 3.
Average ranking of the nine regions based on the ecological footprint and biocapacity sub-indicators. The values in parentheses are the strict ordering based on the data for the three main (composite) indicators given in Table 1.
Table 4.
Relative importance of the single sub-indicators for ecological footprints and biocapacity.
4. Discussion
4.1. The Socially Created Reality
In the following, the above-reported results will be discussed by applying The Philosophy Model [8] described in Section 2.4, which means starting from the socially created reality. The quote by Hildegard von Bingen (1098–1179) heading this paper appears, even though it is close to one thousand years old, to be an excellent short and concise description of the current state of the planet, i.e., the socially created reality: “The Earth Hungers for the Fulness of Justice” [18].
4.2. The Philosophy
The next step is to formulate the philosophy that constitutes assumptions or hypotheses about possible actions and modes [8]. Again, it appears appropriate to turn to Hildegard von Bingen who formulated that “The whole nature should be at man’s disposal, that he may work with it, for without it man can neither live nor exist” [19,20]. It is worth noting that this quote is in full alignment with the anthropogenic conviction held by Hildegard von Bingen [21], i.e., “It is a worldview that places humans above all other animals. The human is the crown of creation. In anthropocentrism, the most important goal is to improve human well-being and the reason we care for nature is because it satisfies human needs” [22], or in other words, it represents “the view that nature primarily exists for humans” [23]. This approach is in clear agreement with the over-exploitation of the planet that was presented in the above results section. However, it should be noted, again with reference to Hildegard von Bingen, that “man can only find salvation in harmony with nature” [20]. It is in this connection interesting to note that we are spending less and less time outdoors, i.e., in nature [24,25], indicating a generally decreasing interest in nature and, thus, the planet.
The over-exploitation of the planet has been ‘justified’ with reference to the creation account, Genesis 1:28, stating that “God blessed them and said to them, “Be fruitful and increase in number; fill the earth and subdue it. Rule over the fish in the sea and the birds in the sky and over every living creature that moves on the ground”.” [26]. Obviously, this is in accordance with the anthropogenic view of the planet and has even been accused of being the root of today’s ecological crisis [27]. It is outside the scope of this paper to discuss possible mistranslations from Hebrew to, e.g., English. It has been argued that a more correct translation of Genesis 1:28 would be to tell us to take responsibility for taking care of the planet [28]. However, there has been no mistranslation concerning the other part of Genesis 1:28, i.e., “Be fruitful and increase in number; fill the earth” [26]. We have, indeed, succeeded in living up to this part by being close to 8.1 billion people by 26 January 2024 [29]. This brings us to the ethics part of the model, i.e., to judge what is good and what is bad, i.e., what actions do we want to promote and what actions do we want to restrain if we focus on the outcome, i.e., to eventually arrive at a sustainable planet. However, before getting to that, we need a small diversion to discuss the basic data presented above.
As mentioned, the planet today is the home of approx. 8.1 billion people [29], which, on an overall scale, causes an ecological deficit of approx. 1.1 gha or, in other words, would require another 0.7 planets to ‘break even’. An alternative view is that the planet’s population is roughly three billion people too high to achieve sustainability. In Table 2, the data for the single regions are given.
4.3. The Ethics
As mentioned above, ethical considerations may vary strongly from region to region or differ significantly due to different religious beliefs. Ethical considerations about the Sustainable Development Goals have been addressed by Sachs et al. in their anthology “Ethics in action for Sustainable Development” [30], and ethical considerations in relation to the environment are the overwhelming topic in Pope Francis’ “Laudate Si” from 2015 [31], which calls for “attention to the ethical and spiritual roots of environmental problems, which require that we look for solutions not only in technology but in a change of humanity” and states that “human and ethical degradation are closely linked” [31].
It is crucial to state that the ethical discussion is based on an anthropocentric approach. The alternative, an ecocentric approach, would have immeasurable, unrealistic, and unacceptable ethical consequences, like, e.g., a reduction in the global population by 50% (cf. Table 2) if adopting a duty ethical approach—in Kantian terminology, a categorical imperative [32]. Consequently, from an ethical point of view, it is appropriate to turn to the Kantian practical imperative [32], which states that “people have rights”, and this means we must “act to treat humanity, whether yourself or another, as an end-in-itself and never as a means”. Thus, “people are not to be used unjustifiably to obtain your goals or seek an edge or unfair advantage” [32]. A simple, and provocative answer to this is to continue to do what we are already doing but do it differently. In a broad sense, this means that we should refrain from subduing the earth [26] but promote responsible actions and thus take care of the planet [28]. In the following section, focus areas based on the above-presented results will be discussed.
4.4. Possible Standards/Actions
It is clear, as stated in the introduction, that the current situation is in no way everlasting and requires action.
From the data summarized in Table 1, it is immediately noted that the top rank, i.e., the region with the best agreement between the exploitation of the earth and a high biocapacity and relatively low ecological footprints is South America (rank 1) (Table 1). At the other end of the scale, North America (rank 8) and the Middle East/Central Asia (rank 9) are found, which is immediately understandable looking at the figures in Table 1, which display a significant discrepancy between their biocapacities and rather high ecological footprints. A calculation further showed that Africa, Asia–Pacific, and Central America/Caribbean all have rather low biocapacities, which for Africa and Central America/Caribbean are accompanied by low ecological footprints, resulting in equal ranks of 2.5 for both regions. In contrast, in the case of Asia–Pacific, the low biocapacity is contrasted by relatively high footprints. Thus, Asia–Pacific is number seven in the ranking.
The ranking based on the sub-indicators (Table 3) demonstrates that an overall correspondence between the rankings, based on the sub-indicators, and the strict ordering, based on the composite indicators, can be noted. However, the correspondence is not complete, as the composite indicators are a priori subject to compensation effects [5].
Biocapacity appears to be by far the most important indicator with 88.9%, followed by the ecological footprint of production (11.1%). The consumption footprint does not influence the ranking. This may a priori seem somewhat surprising, as the latter is used to calculate the number of planets and countries, respectively, that are necessary to sustain the current population (Equations (1) and (2)). A rationale for this may be that without consumption, there is no production, and vice versa. It is in this connection noteworthy that the two ecological footprints, apart from in South America and Other Europe, are remarkably close. A more elaborate discussion on the interplay between the ecological footprint and biocapacity was presented in detail by Schaefer et al. [33].
Based on these overall results concerning the ranking of the regions, as well as the relative importance of the composite, and especially the sub-indicators, it is possible to pinpoint areas that should receive major attention.
With reference to Equations (1) and (2), it is clear that a priori, we have two handles to work with, i.e., the ecological footprints and the biocapacity. Taking the above-discussed data into account, the most efficient appears to be biocapacity. A simple thought experiment where the biocapacity for all regions is doubled leads to a global population reserve of approx. 1.5 billion, i.e., the planet could accommodate another 1.5 billion people without changing the population’s behavior. This would, in addition, require some relocation, as some regions would still be overpopulated, e.g., from (especially) Asia–Pacific and the Middle East/Central Asia. This solution is not immediately feasible. The alternative would require substantial changes in, e.g., living conditions, which is illustrated by the rather low values of biocapacity in some regions (Table 1). Alternatively, a substantial reduction in the ecological footprints is necessary to move Earth Overshoot Days to later dates. This leads to more detailed analyses of the footprints and the biocapacity (see Table 4 and Appendix A.1 and Appendix A.2 for data).
The breakdown of the three main (composite) indicators in the six and five sub-indicators (cf. Table 2) demonstrated the relative importance of the single sub-indicators (Table 4). Not surprisingly, the carbon footprint and the grazing footprints appear to be significant components of the two ecological footprints when analyzed together with the built-up land footprint, with the latter being most pronounced in the case of the consumption footprint (Table 4). The built-up land footprints hold significant importance concerning the biocapacity, despite the absolute value of this sub-indicator being relatively small (cf. Table 2). In contrast, the high importance of the grazing footprint concerning biocapacity is directly understandable, as it is the basis for food production. In Table 5, the effect of halving the carbon footprints is shown. The efficiency of such a reduction is apparent. Thus, overall, this would still mean that the population on a global scale would be too high by approximately one billion. Thus, especially Asia–Pacific still shows a remarkably high overpopulation, whereas other regions like Africa, Other Europe, and South America have populations below the critical point. North America is close to breaking even.
Table 5.
The current population and the reduced population following the halving of the carbon footprints combined with the necessary reduction.
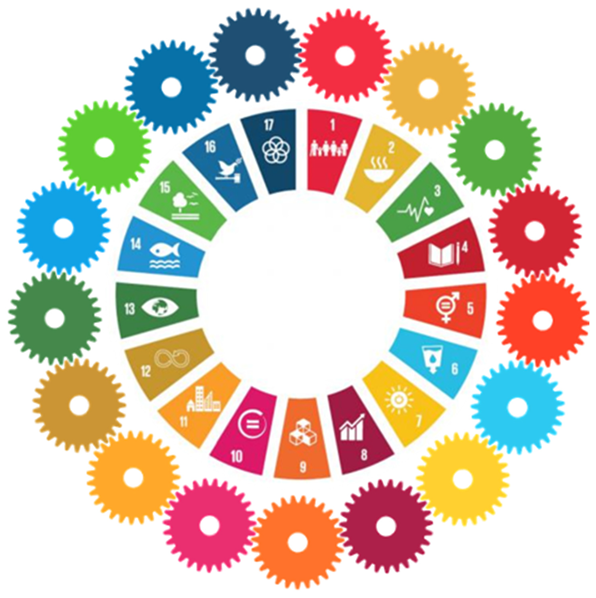
It is clear (Table 5) that a reduction in the carbon footprint, expectedly, appears as one of the key actions to balance footprints and biocapacities. Thus, in the above example, halving the carbon footprints, i.e., Earth Overshoot Day would be postponed by approx. 0.27 years, i.e., close to one hundred days. However, a reduction in the carbon footprint may not come without a price. The following two cases are exemplary illustrations of the fact that making changes under one of the SDGs may well be accompanied by changes in other SDGs that may be negative or positive. The interconnection between the seventeen SDGs may be illustrated by a circle of toothed wheels encircling the well-known rosette of the 17 SDGs (Appendix A.3).
4.4.1. Case A: Education of Girls
Education (SDG 4) [2] is undisputably beneficial. Especially the right to education for girls has received significant attention after Malala addressed youth delegates at the UN with the famous quote “One child, one teacher, one book and one pen can change the world.” [34]. She received the Nobel Peace Prize in 2014.
Education of girls has shown a remarkable influence on climate change through a reduction in the carbon footprint. Hence, it appears that educated women with twelve years of education on average give birth to four to five children less than women without education [35]. Not surprisingly, the effect is larger in low-income countries, as discussed in detail by Kim [36].
The reduced birth rate has a significant influence on the carbon footprint, and at the same time, it eases the pressure on food production, i.e., it decreases poverty (SDG 1) and hunger (SDG 2) and increases the general well-being of the mothers (SDG 3).
4.4.2. Case B: Eliminating Tourist Flying
One approach to reduce the carbon footprint is to limit our flying activities, or simply refrain from flying, which undisputably will reduce CO2 emissions. Further, it will reduce the so-called ‘chem-trails’, which are basically water that is formed simultaneously with CO2 when burning fuel, which does not make the problem less potent, as water is an efficient greenhouse gas [37]. Is that not a good idea? Yes and No. Yes—it will reduce CO2 emissions—and No—it may have a significant influence on, e.g., poverty (SDG 1) [2] and hunger (SDG 2) [2] and thus on well-being (SDG 3) [2]. The explanation is simple: Imagine that all tourist flights to, e.g., Thailand were canceled. Close to 40 million tourists visited Thailand in 2019 [38], with the revenue from tourists being approx. USD 62 bill in 2019 [39], i.e., approx. 12% of the country’s GDP [40]. Close to 46% of the employment in Thailand is in the service sector [41]. It is a scary scenario that develops if tourists, a major part of whom arrive by planes, refrain from flying and thus do not visit Thailand. It requires only a little fantasy to imagine what that would do to the Thai economy and thus employment, with an increase in poverty and starvation and thus a decrease in well-being as a result.
The above examples are illustrations of the derived effects of reducing the carbon footprint and at the same time visualizing the interrelationship between the 17 SDGs. Hence, it is in general necessary to take both pros and cons into account when looking for possibilities for reducing the carbon footprint, as discussed in the fourth IPCC Assessment Report Climate Change from 2007 [42], as well as complying with the policies on linking climate change, biodiversity, and health [43].
In Appendix A.1 and Appendix A.2, all data are provided to enable further attempts to propose specific actions.
The final exercise would be to find out how much the total ecological footprint needs to be reduced to comply with the available biocapacity, i.e., to break even. Based on the data in Appendix A.1 and Appendix A.2, the ecological deficit/reserve (cf. Table 2) is calculated as the total biocapacity-the total ecological footprint of consumption (gha). In Table 6, the necessary percentage reduction in the footprint is depicted for the individual regions, as are the corresponding data for the low-, lower-middle-, upper-middle-, and high-income countries.
Table 6.
Necessary reduction in the ecological footprint to match the available biocapacity.
It is immediately seen that apart from Other Europe and, especially, South America, who both have a reserve due to rather high biocapacities (Table 1), all regions need serious reductions in their ecological footprints to comply with their available biocapacity. Similarly, it is shown that lower-middle-, upper-middle-, and high-income countries need significant reductions in their ecological footprints, whereas low-income countries are closer to breaking even. Overall, taking all countries into account, the ecological footprint needs to be reduced by 40% (Table 6). It is also clear that high-income countries have a significantly higher deficit than low-income countries—a problem that can only be solved through elaborate international collaboration and, not least, a willingness to act, as discussed by Fanning et al. [44].
Further, these exercises can easily be extended to single countries, as all necessary data are available [9]; the above is simply an exemplary illustration of how specific action areas may be defined.
5. Conclusions and Outlook
This study presents an analysis of the data behind Earth Overshoot Day as an exemplary case of how a partial ordering methodology in combination with the so-called Philosophy Model can be used to pinpoint actions that are aimed at improving sustainability. It should be acknowledged that some of the data may be subject to some degree of uncertainty due to the varying data quality. However, even taking such uncertainty into account, the overall conclusions are clear. Thus, partial ordering, which is a rather robust type of analysis that does not require any pretreatment of data, has been used for ranking the world’s regions based on their ecological footprints and available biocapacities, thereby disclosing the mutual ranking of the regions concerning their compliance with the overshoot. North America and the Middle East/Central Asia occupy the two lowest positions, whereas South America appears in the top position, i.e., showing the best compliance. It was unambiguously demonstrated that biocapacity is the most important indicator for the ranking of the regions. A thought experiment where the biocapacity for each region was doubled would, on a global scale, lead to a population reserve of approx. 1.5 billion. On the other hand, a halving of the individual ecological footprint would still lead to a population deficit of approx. one billion.
The ecological footprints and biocapacities were subdivided into six and five sub-indicators, respectively, and not surprisingly, the carbon footprint turned out to be the most important sub-indicator for the ecological consumption footprints, along with built-up land. Hence, a final set of calculations showed the necessary reduction in the carbon footprint for the single regions to comply with their corresponding available biocapacity. These calculations also demonstrated that high-income countries need to reduce their carbon footprint by close to 50%, whereas low-income countries can manage with a 5% reduction.
Turning to the Sustainable Development Goals, several of the goals appear to be crucial for remedying the problems described above. Especially Goal 12 should be mentioned here, i.e., responsible consumption and production come into play. However, also Goal 4, quality education and not least Goal 17 on partnership and collaboration seem of the utmost importance: “We are only as strong as we are united, as weak as we are divided” [45]. And let the final words, as the entry words, come from Hildegard von Bingen (1098–1179): “The earth which sustains humanity must not be injured. It must not be destroyed!” [46]; and in Pope Francis’ words: “we cannot presume to heal our relationship with nature and the environment without healing all fundamental human relationships” [31].
Funding
This research received no external funding.
Institutional Review Board Statement
Not applicable.
Informed Consent Statement
Not applicable.
Data Availability Statement
Data are contained within the article.
Acknowledgments
The author thanks the Global Footprint Network for providing the Overshoot Day data through an Attribution-ShareAlike 4.0 license and Lucas for many inspiring hours together.
Conflicts of Interest
The author declares no conflict of interest.
Appendix A
The components of the ecological footprint and biocapacity include the following [8]:
Cropland: Cropland is the most bioproductive of all the land use types and consists of areas that are used to produce food and fiber for human consumption, feed for livestock, oil crops, and rubber. Due to a lack of globally consistent data sets, current cropland footprint calculations do not consider the extent to which farming techniques or unsustainable agricultural practices may cause long-term degradation of soil. The cropland footprint includes crop products that are allocated to livestock and aquaculture feed mixes, and those that are used for fibers and materials.
Land for forest products: Forests provide for two services. The forest product Footprint, which is calculated based on the amount of lumber, pulp, timber products, and fuel wood consumed by a country on a yearly basis. It also accommodates the Carbon Footprint.
Carbon footprint: This component of the ecological footprint represents the carbon dioxide emissions from burning fossil fuels and cement production. The carbon footprint represents the area that is necessary to sequester these carbon emissions. The carbon footprint component of the ecological footprint is calculated as the amount of forest land that is needed to absorb these carbon dioxide emissions for good. Currently, the carbon footprint is the largest portion of humanity’s footprint. The carbon footprint of consumption also includes the embodied carbon in imported goods.
Fishing grounds: The footprint of fishing grounds is calculated based on estimates of the maximum sustainable catch for a variety of fish species. These sustainable catch estimates are converted into an equivalent mass of primary production based on the various species’ trophic levels. This estimate of the maximum harvestable primary production is then divided amongst the continental shelf areas of the world. Fish that are caught and used in aquaculture feed mixes are included.
Grazing land: Grazing land is used to raise livestock for meat, dairy, hide, and wool products. The grazing land footprint is calculated by comparing the number of available livestock feed in a country with the amount of feed that is required for all livestock in that year, with the remainder of the feed demand assumed to come from grazing land.
Built-up land: The built-up land footprint is calculated based on the area of land that is covered by human infrastructure—transportation, housing, industrial structures, and reservoirs for hydropower. In the absence of better evidence, we typically assume that built-up land occupies what would previously have been cropland.
Appendix A.1. Ecological Footprints of Production and Consumption [9]
| Ecological Footprint of Production (Global Hectares per Person) | |||||||
| Region | Cropland Footprint | Grazing Footprint | Forest Product Footprint | Carbon Footprint | Fish Footprint | Built-Up Land | Total Ecological Footprint (Production) |
| All Countries Total | 0.461 | 0.124 | 0.257 | 1.445 | 0.075 | 0.078 | 2.501 |
| Africa | 0.276 | 0.150 | 0.222 | 0.248 | 0.038 | 0.043 | 1.063 |
| Asia–Pacific | 0.298 | 0.043 | 0.137 | 1.477 | 0.067 | 0.082 | 2.125 |
| Central America/ Caribbean | 0.278 | 0.130 | 0.204 | 0.491 | 0.099 | 0.107 | 1.476 |
| EU-27 | 0.797 | 0.116 | 0.682 | 1.893 | 0.098 | 0.129 | 3.854 |
| Middle East/ Central Asia | 0.450 | 0.098 | 0.049 | 2.051 | 0.060 | 0.058 | 2.766 |
| North America | 1.406 | 0.244 | 0.767 | 3.687 | 0.094 | 0.059 | 6.258 |
| Other Europe | 1.132 | 0.059 | 0.621 | 2.447 | 0.253 | 0.050 | 5.088 |
| South America | 0.791 | 0.756 | 0.508 | 0.745 | 0.105 | 0.153 | 3.150 |
| Ecological Footprint of Consumption (Global Hectares per Person) | |||||||
| Region | Cropland Footprint | Grazing Footprint | Forest Product Footprint | Carbon Footprint | Fish Footprint | Built-Up Land | Total Ecological Footprint (Consumption) |
| All Countries Total | 0.476 | 0.139 | 0.258 | 1.467 | 0.079 | 0.078 | 2.556 |
| Africa | 0.303 | 0.149 | 0.226 | 0.273 | 0.042 | 0.043 | 1.155 |
| Asia–Pacific | 0.363 | 0.066 | 0.176 | 1.458 | 0.072 | 0.082 | 2.230 |
| Central America/ Caribbean | 0.405 | 0.123 | 0.260 | 0.595 | 0.110 | 0.107 | 1.787 |
| EU-27 | 0.930 | 0.212 | 0.560 | 2.212 | 0.168 | 0.129 | 4.458 |
| Middle East/ Central Asia | 0.600 | 0.153 | 0.121 | 1.987 | 0.072 | 0.058 | 2.990 |
| North America | 1.109 | 0.270 | 0.706 | 3.854 | 0.110 | 0.059 | 6.108 |
| Other Europe | 0.879 | 0.120 | 0.499 | 2.445 | 0.153 | 0.050 | 4.450 |
| South America | 0.537 | 0.593 | 0.311 | 0.784 | 0.082 | 0.153 | 2.536 |
Appendix A.2. Biocapacities [9]
| Biocapacity (Global Hectares per Person) | ||||||
| Region | Cropland | Grazing Land | Forest Land | Fishing Ground | Built-Up Land | Total Biocapacity |
| All Countries Total | 0.461 | 0.179 | 0.623 | 0.156 | 0.078 | 1.547 |
| Africa | 0.276 | 0.270 | 0.289 | 0.067 | 0.043 | 0.971 |
| Asia–Pacific | 0.298 | 0.075 | 0.159 | 0.094 | 0.082 | 0.722 |
| Central America/ Caribbean | 0.278 | 0.133 | 0.280 | 0.130 | 0.107 | 1.120 |
| EU-27 | 0.797 | 0.124 | 0.924 | 0.208 | 0.129 | 2.228 |
| Middle East/ Central Asia | 0.450 | 0.174 | 0.139 | 0.095 | 0.058 | 0.916 |
| North America | 1.406 | 0.244 | 1.673 | 0.482 | 0.059 | 3.864 |
| Other Europe | 1.132 | 0.214 | 2.220 | 0.687 | 0.050 | 4.751 |
| South America | 0.791 | 0.870 | 4.175 | 0.321 | 0.153 | 6.577 |
Appendix A.3. The Interconnectivity of the Seventeen Sustainable Development Goals and the Picture Visualizing That Action under one of the SDGs May Have Negative or Positive Derived Actions in other SDGs
References
- Resolution Adopted by the General Assembly on 25 September 2015. Transforming Our World: The 2030 Agenda for Sustainable Development. General Assembly. Seventieth Session Agenda Items 15 and 116. 21 October. Available online: https://www.un.org/ga/search/view_doc.asp?symbol=A/RES/70/1&Lang=E (accessed on 1 February 2024).
- The 17 SDGs, United Nations, Department of Economic and Social Affairs Sustainable Development. Available online: https://sdgs.un.org/goals (accessed on 1 February 2024).
- Earth Overshoot. Available online: https://overshoot.footprintnetwork.org/ (accessed on 1 February 2024).
- Esplin, B. The Micawber Principle: Living the Fundamental Law of Personal Finance. 2013. Available online: https://micawberprinciple.com/the-micawber-principle-living-the-fundamental-law-of-personal-finance-45/ (accessed on 1 February 2024).
- Munda, G. Social Multi-Criteria Evaluation for a Sustainable Economy; Springer: Berlin/Heidelberg, Germany, 2008; Available online: https://www.springer.com/la/book/9783540737025 (accessed on 1 October 2020).
- Bruggemann, R.; Patil, G.P. Ranking and Prioritization for Multi-Indicator Systems—Introduction to Partial Order Applications; Springer: New York, NY, USA, 2011; Available online: https://www.springer.com/gp/book/9781441984760 (accessed on 1 February 2024).
- Bruggemann, R.; Carlsen, L. Introduction to partial order theory exemplified by the evaluation of sampling sites. In Partial Order in Environmental Sciences and Chemistry; Bruggemann, R., Carlsen, L., Eds.; Springer: Berlin/Heidelberg, Germany, 2006; pp. 61–110. Available online: https://www.springer.com/gp/book/9783540339687 (accessed on 1 February 2024).
- Rieneck, B. Ledelsesfilosofi og Virksomhedskultur, en Tankegang og et Værktøj; Forsvarets Center for Lederskab: Copenhagen, Denmark, 1984; Available online: https://www.google.dk/books/edition/Ledelsesfilosofi_og_virksomhedskultur_en/-02rGQAACAAJ?hl=da (accessed on 1 February 2024). (In Danish)
- Earth Overshoot Day, Free Public Data Set, Global Footprint Network. 2023. Available online: https://www.footprintnetwork.org/licenses/public-data-package-free/ (accessed on 1 February 2024).
- Data Quality Scores, Global Fotprint Network. 2024. Available online: https://www.footprintnetwork.org/data-quality-scores/ (accessed on 1 February 2024).
- Limitations and Criticism, Global Footprint Network. 2024. Available online: https://www.footprintnetwork.org/our-work/ecological-footprint/limitations-and-criticisms/ (accessed on 1 February 2024).
- Ecological Footprint Accounting: Limitations and Criticism, ver. 1.2, Global Footprint Network. 2020. Available online: https://www.footprintnetwork.org/content/uploads/2020/12/Footprint-Limitations-and-Criticism.pdf (accessed on 1 February 2024).
- Bruggemann, R.; Halfon, E.; Welzl, G.; Voigt, K.; Steinberg, C.E.W. Applying the Concept of Partially Ordered Sets on the Ranking of Near-Shore Sediments by a Battery of Tests. J. Chem. Inf. Comput. Sci. 2001, 41, 918–925. [Google Scholar] [CrossRef] [PubMed]
- Bruggemann, R.; Annoni, P. Average Heights in Partially Ordered Sets. MATCH Commun. Math. Comput. Chem. 2014, 71, 117–142. Available online: http://match.pmf.kg.ac.rs/electronic_versions/Match71/n1/match71n1_117-142.pdf (accessed on 1 February 2024).
- De Loof, K.; De Meyer, H.; De Baets, B. Exploiting the lattice of ideals representation of a poset. Fundam. Inform. 2006, 71, 309–321. [Google Scholar]
- Bruggemann, R.; Carlsen, L. Incomparable—What now? MATCH Commun. Math. Comput. Chem. 2014, 71, 694–716. Available online: https://match.pmf.kg.ac.rs/electronic_versions/Match71/n3/match71n3_699-716.pdf (accessed on 1 February 2024).
- Bruggemann, R.; Carlsen, L.; Voigt, K.; Wieland, R. PyHasse Software for Partial Order Analysis: Scientific Background and Description of Selected Modules. In Multi-Indicator Systems and Modelling in Partial Order; Bruggemann, R., Carlsen, L., Wittmann, J., Eds.; Springer: New York, NY, USA, 2014; pp. 389–423. [Google Scholar] [CrossRef]
- Craine, R. Hildegard of Bingen: “The Earth Hungers for the Fulness of Justice”. Cistercian Stud. Q. 1991, 26, 120–126. [Google Scholar]
- Von Bingen, H. Welt und Mensch, das Buch “De Operatione Dei”. Available online: https://www.gottliebtuns.com/doc/Hildegard%20Von%20Bingen%20-%20Welt%20und%20Mensch.pdf (accessed on 1 February 2024).
- Hildegard’s View of Creation, Orientation in Times of Climate Change. Available online: https://www.bingen.de/en/hildegard/hildegards-view-of-creation (accessed on 1 February 2024).
- Enders, M. Das Naturverständnis Hildegards von Bingen, Eberhard Karls Universität Tübingen. Available online: https://publikationen.uni-tuebingen.de/xmlui/bitstream/handle/10900/136800/Enders_118.pdf?sequence=1 (accessed on 1 February 2024).
- Fredengren, C. Anthropocentrism and Ecocentrism, Future Learn. Available online: https://www.futurelearn.com/info/courses/taking-on-the-climate-crisis/0/steps/259971 (accessed on 1 February 2024).
- Vashiht, T. Anthropocentric v. Ecocentric Approach to the Environment, Ipleaders. 2020. Available online: https://blog.ipleaders.in/anthropocentric-v-ecocentric-approach-to-the-environment/ (accessed on 1 February 2020).
- Diffey, B.L. An overview analysis of the time people spend outdoors. Br. Assoc. Dermatol. 2011, 164, 848–854. [Google Scholar] [CrossRef]
- The Inside Epidemic? How Has Time Outdoors Changed in 40 Years. Available online: https://www.icewear.is/us/blog/2021/06/07/time-outdoors-the-inside-epidemic/ (accessed on 1 February 2024).
- Genesis 1:28, Bible Gateway. Available online: https://www.biblegateway.com/passage/?search=Genesis+1%3A26-28&version=NIV (accessed on 1 February 2024).
- White, L. The Historical Roots of Our Ecologic Crisis. Science 1967, 155, 1203–1207. [Google Scholar] [CrossRef]
- Jakimow, L. Genesis 1:26–28 and Environmental Rights, Right Now. 2013. Available online: https://rightnow.org.au/opinion/genesis-126-28-and-environmental-rights/ (accessed on 1 February 2024).
- Wordometer. Current World Population. Available online: https://www.worldometers.info/world-population/ (accessed on 1 February 2024).
- Sachs, J.D.; Flanagan, O.; Sorondo, M.S.; Vendley, W.; Annett, A.; Thorson, J. (Eds.) Ethics in Action for Sustainable Development; Columbia University Press: New York, NY, USA, 2022; 456p. [Google Scholar]
- Encyclical Letter Laudato Si’ of the Hole Father Francis on Care for Our Common Home. Available online: https://www.vatican.va/content/francesco/en/encyclicals/documents/papa-francesco_20150524_enciclica-laudato-si.html (accessed on 1 February 2024).
- Kantian Ethics, philosophy.lander.edu. 2020. Available online: https://philosophy.lander.edu/ethics/kant.html (accessed on 1 February 2024).
- Schaefer, F.; Luksch, U.; Steinbach, N.; Cabeça, J.; Hanauer, J. Ecological Footprint and Biocapacity. In The World’s Ability to Regenerate Resources and Absorb Waste in a Limited Time Period; KS-AU-06-001-EN-N; Office for Official Publications of the European Communities, European Communities: Luxembourg, 2006; ISBN 92-79-02943-6. Available online: https://ec.europa.eu/eurostat/documents/3888793/5835641/KS-AU-06-001-EN.PDF/d17ffc94-bf5a-404f-ac90-cc64891a2b67?version=1.0 (accessed on 1 March 2024).
- Malala Addresses Youth Delegates in UN. Available online: https://www.unicef.ie/stories/one-child-one-teacher-one-book-and-one-pen-can-change-the-world/ (accessed on 1 March 2024).
- Hawken, P. DRAWDOWN, the Most Comprehensive Plan Ever Proposed to Reverse Global Warming; Penguin Books: New York, NY, USA, 2017; pp. 80–82. Available online: https://drawdown.org/ (accessed on 1 March 2024).
- Kim, J. Female Education and Its Impact on Fertility; IZA World of Labor: Bonn, Germany, 2023; p. 228v2. [Google Scholar] [CrossRef]
- What about Water Vapour? Climate Change Connection. Available online: https://climatechangeconnection.org/science/what-about-water-vapour/ (accessed on 1 February 2024).
- Tourism Statistics Thailand 2000–2023. Available online: http://www.thaiwebsites.com/tourism.asp (accessed on 1 February 2024).
- Revenue from Foreign Tourists Visiting Thailand. Available online: https://www.thaiwebsites.com/tourism-income-Thailand.asp (accessed on 1 February 2024).
- GDP (Current US$)—Thailand. Available online: https://data.worldbank.org/indicator/NY.GDP.MKTP.CD?locations=TH (accessed on 1 February 2024).
- Thailand: Distribution of Employment by Economic Sector from 2011 to 2021. Available online: https://www.statista.com/statistics/332341/employment-by-economic-sector-in-thailand/ (accessed on 1 February 2024).
- IPCC Fourth Assessment Report, Climate Change 2007: Working Group II: Impacts, Adaptation and Vulnerability, ch. 18.1.1. Available online: https://archive.ipcc.ch/publications_and_data/ar4/wg2/en/ch18s18-1-1.html (accessed on 1 February 2024).
- Cook, P.A.; Howarth, M.; Wheater, C.P. Global Developments: Policy Support for Linking Biodiversity, Health and Climate Change. In Biodiversity and Health in the Face of Climate Change; Marselle, M., Stadler, J., Korn, H., Irvine, K., Bonn, A., Eds.; Springer: Berlin/Heidelberg, Germany, 2019; Chapter 18. [Google Scholar] [CrossRef]
- Fanning, A.L.; O’Neill, D.W.; Hickel, J.; Roux, N. The social shortfall and ecological overshoot of nations. Nat. Sustain. 2022, 5, 26–36. [Google Scholar] [CrossRef]
- Dumbledore, A. Harry Potter and the Goblet of Fire. Available online: https://www.amazon.com/Harry-Potter-Goblet-Fire-Rowling/dp/0439139600 (accessed on 1 February 2024).
- Von Bingen, H. Available online: https://www.healthyhildegard.com/hildegard-bingen-quotes/ (accessed on 1 February 2024).
Disclaimer/Publisher’s Note: The statements, opinions and data contained in all publications are solely those of the individual author(s) and contributor(s) and not of MDPI and/or the editor(s). MDPI and/or the editor(s) disclaim responsibility for any injury to people or property resulting from any ideas, methods, instructions or products referred to in the content. |
© 2024 by the author. Licensee MDPI, Basel, Switzerland. This article is an open access article distributed under the terms and conditions of the Creative Commons Attribution (CC BY) license (https://creativecommons.org/licenses/by/4.0/).