Abstract
The Tibet Autonomous Region presents immense potential for concentrated solar power (CSP) development, driven by its exceptional solar irradiance levels (e.g., a peak DNI exceeding 2100 kWh/m2/day). This positions it as a strategic contributor to China’s 2060 carbon neutrality target and aligns with global energy transition imperatives. However, CSP deployment in this region faces challenges stemming from unique high-altitude geographic characteristics, a complex terrain, and extreme climatic conditions—including pronounced diurnal temperature fluctuations, high wind speeds, and heavy winter snowfall. Additionally, traditional site-selection models inadequately address these region-specific environmental constraints. To address these limitations, an integrated framework combining geographic information systems (GIS) and multi-criteria decision-making (MCDM) is proposed in this study. A localized evaluation system is developed, incorporating four novel high-altitude-specific indicators: the average and maximum wind speed and the average and maximum snow depth. Criteria weights are determined through a hybrid approach integrating the analytic hierarchy process (AHP) and the entropy weight method (EWM), while candidate sites are prioritized using the VIKOR (VlseKriterijumska Optimizacija I Kompromisno Resenje) ranking method. The case study results demonstrate that region-specific environmental factors exert a significantly stronger influence on site suitability than traditional solar resource indicators (e.g., direct normal irradiance) under Tibet’s extreme climatic conditions, emphasizing the necessity of localized evaluation frameworks. The proposed methodology not only provides a robust scientific foundation for CSP site selection in high-altitude regions with environmental complexities but also establishes a replicable framework for optimizing multiple trade-offs in renewable energy systems under geographically complex conditions.
1. Introduction
Concentrated solar power (CSP) has emerged as a key sustainable energy solution in the global energy transition toward carbon neutrality [1]. China launched its first 20 CSP demonstration projects in 2016, reaching a total installed capacity of 1.349 GW [2], validating core technologies and advancing equipment manufacturing. By 2023, China’s CSP capacity reached 588 MW, representing 7.8% of the global total, highlighting its scalability.
1.1. Research on Index Selection of CSP Power Stations
However, CSP deployment faces site-specific challenges in extreme environments. Traditional site-selection models, while effective in temperate regions, struggle to address the unique environmental complexities of high-altitude areas such as the Qinghai–Tibet Plateau. The core contradiction in the current research manifests in the dual requirement for CSP site selection to optimize energy production efficiency while balancing social and environmental benefits [3]. For instance, water resource availability for cooling systems directly influences facility sustainability [4], whereas power station construction [5] and land-use conflicts exacerbate ecological and societal disruptions [6].
Existing research on CSP site selection predominantly emphasizes general criteria such as solar resource availability (e.g., DNI [7,8,9,10]) and infrastructure accessibility (e.g., proximity to grids or roads). While exclusion criteria (e.g., protected areas [11,12,13], military zones [14,15,16], and slope constraints [16,17,18,19,20]) and evaluation metrics (distance from the power grid [21], distance from water sources [22], distance from roads [23], etc.) provide foundational insights, they neglect high-altitude environmental characteristics, such as wind speed and snow depth, which critically influence technical feasibility under extreme climates. For example, Bashar et al. [24] demonstrated that high wind speeds at the 50 MW CSP plant in Shagaya, Kuwait, often correlate with a reduced DNI. This phenomenon may stem from sand dust obscuration or cloud cover, leading to localized resource variability, even in regions with abundant overall radiation. Failure to integrate such dynamic meteorological factors into models risks compromising equipment selection and operational strategies.
1.2. Research on the Location Selection of CSP Using GIS-MCDM
To holistically assess multiple influential factors in concentrated solar power (CSP) plant siting, multi-criteria decision-making (MCDM) methodologies are implemented in this study to establish a systematic decision support framework, ensuring scientific rigor and methodological transparency in site evaluation processes. In the process of MCDM, method selection is emphasized as a critical determinant influencing the reliability of ranking outcomes. Studies have demonstrated that the tripartite integration of MCDM methods, data normalization strategies (the range method/linear scaling method), and weight determination methods (AHP [25]/entropy weight method [26,27,28]) has a significant impact on the results [29]. Current CSP plant site-selection methods predominantly rely on MCDM, with AHP being the most widely applied. For instance, Ouafae et al. [25] constructed a weight allocation model using AHP to evaluate regional suitability by systematically analyzing DNI, topographical characteristics, and water resource availability. Similarly, Merrouni et al. [30] implemented AHP to assess the suitability of large-scale CSP plant deployment in eastern Morocco, where the feasibility of two cooling systems, namely, wet and dry cooling, was analyzed in detail. Subjective approaches such as AHP often prioritize expert judgment at the expense of data-driven objectivity, whereas objective methods such as EWM risk undervaluing domain-specific priorities (e.g., solar resource dominance) by over-relying on data heterogeneity. This “subjective–objective methodological divide” compromises the adaptability and robustness of site-selection models in geographically complex environments such as Tibet.
To address these gaps, an integrated GIS-MCDM framework tailored for Tibet is proposed in this study, focusing on three pivotal objectives:
Quantifying Environmental Specificity: A localized evaluation system is developed, integrating three exclusion criteria (protected areas, land use, and DNI) and thirteen evaluation indicators. Crucially, four novel high-altitude parameters—the average/maximum wind speed and snow depth—are incorporated to systematically address extreme climatic impacts overlooked in conventional models.
Bridging Methodological Divides: A hybrid AHP-EWM weighting strategy balances subjective expertise with data-driven objectivity, while the VIKOR method enables robust multi-criteria prioritization, overcoming the limitations of single-method approaches.
Evaluating Technical Adaptability: A sensitivity analysis of dry versus wet cooling systems is conducted, contextualized by Tibet’s water resource distribution, to inform practical CSP design in cold, high-altitude environments.
2. Methodology
To address the limitations of conventional approaches in complex plateau environments, in this study, an integrated GIS-MCDM framework is developed for comprehensive site evaluation. The methodology synergistically combines the AHP, entropy weight method, and VIKOR techniques. AHP determines subjective criterion weights based on expert judgment, while EWM quantifies objective weights through data dispersion analysis. This combined weighting strategy effectively balances domain expertise with inherent data characteristics. Subsequently, the VIKOR algorithm prioritizes candidate locations through multi-criteria compromise optimization, enabling scientifically robust site selection.
2.1. Site-Selection Framework
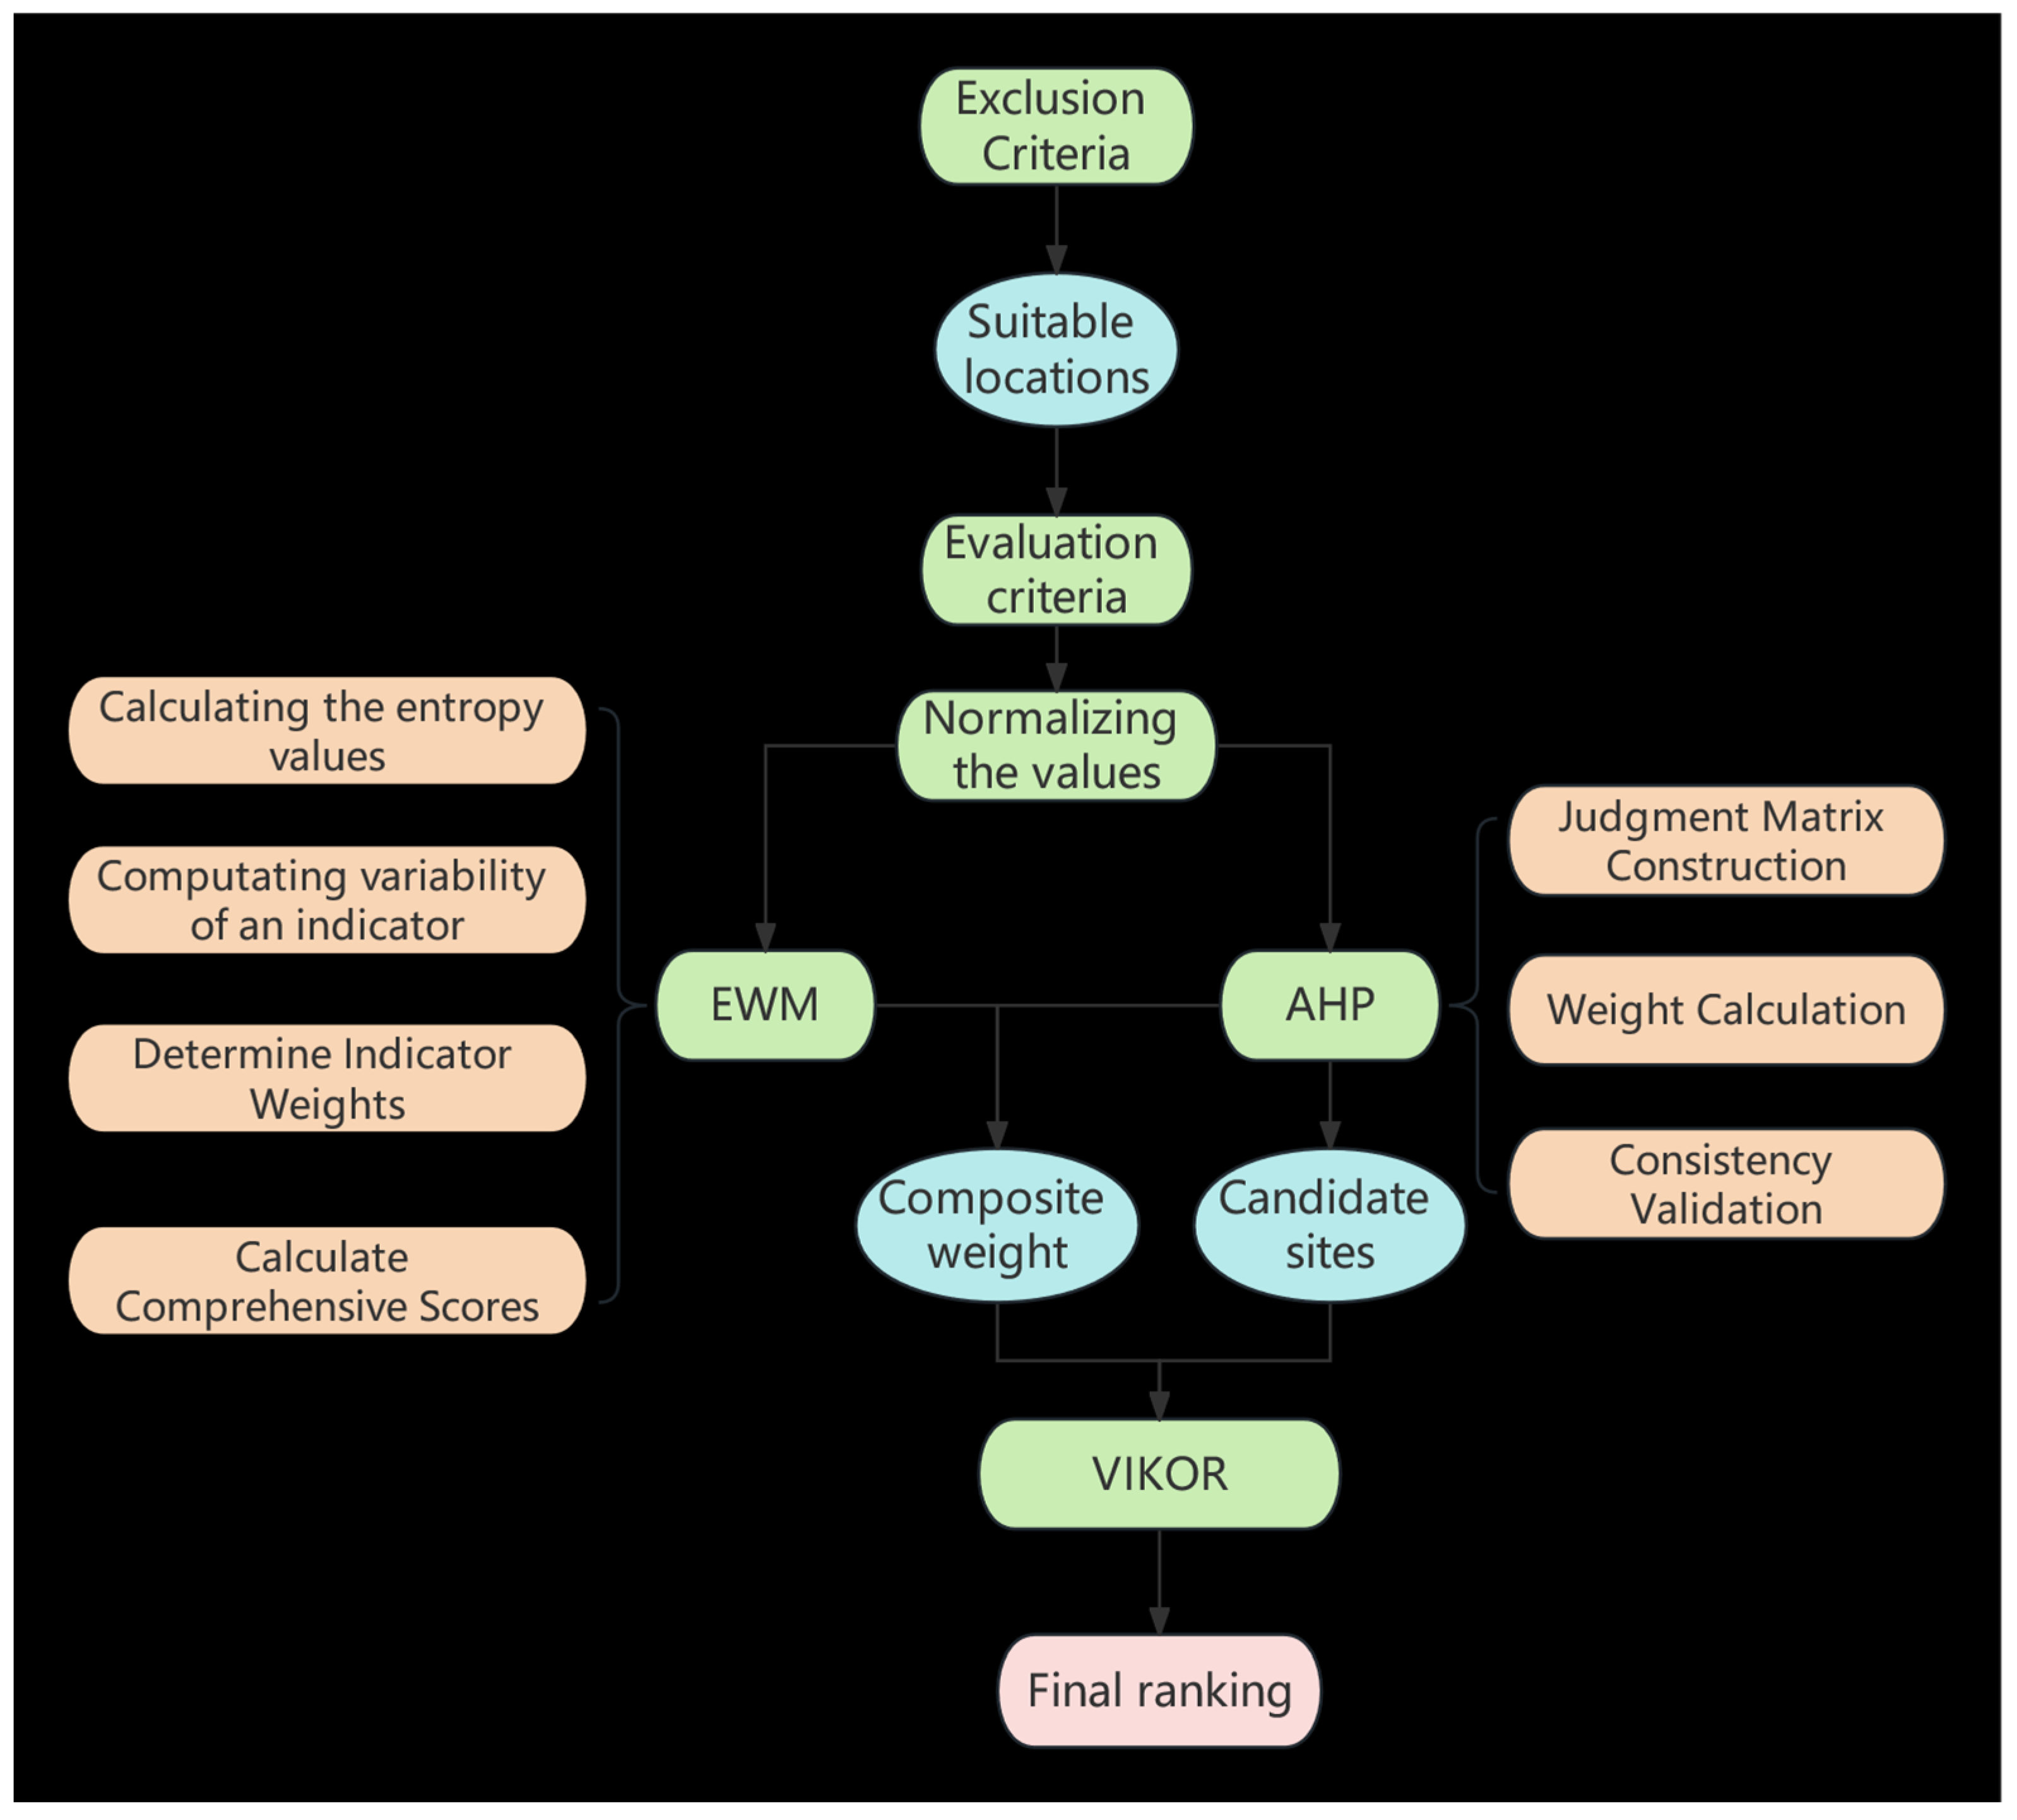
Traditional site-selection models rely on either subjective (e.g., the analytic hierarchy process, AHP) or objective (e.g., the entropy weight method, EWM) weighting approaches, both of which face critical limitations in complex environments such as Tibet. AHP, while effective in integrating expert knowledge to prioritize criteria, risks oversimplification and bias—for instance, overemphasizing solar resource metrics (e.g., DNI) while neglecting region-specific risks such as extreme winds or snowfall. EWM, though adept at quantifying environmental heterogeneity through data-driven analysis, may undervalue domain priorities (e.g., solar energy potential) due to overreliance on data distribution patterns (e.g., low entropy values in DNI datasets caused by uniformly high solar irradiance). To reconcile these limitations, a hybrid framework integrating AHP and EWM (Figure 1) is proposed in this study. The workflow comprises the following four phases.

Figure 1.
Flowchart.
Exclusion Screening: Geospatial constraints (e.g., protected areas and DNI thresholds) are applied to eliminate unsuitable regions.
Criteria Weighting: Subjective weights (AHP) and objective weights (EWM) are calculated and combined to balance expert judgment with data variability.
Candidate Identification: A weighted overlay analysis based on the AHP-derived weights generates preliminary site-suitability maps.
Optimal Site Selection: The VIKOR method ranks candidate sites using combined weights, ensuring a compromise between solar resource potential and environmental risk mitigation.
2.2. Analytic Hierarchy Process (AHP)
AHP assigns subjective weights through pairwise comparisons of criteria, structured as follows [31].
Judgment Matrix Construction: Experts rate the relative importance of n criteria using a scale of 1–9 (Table 1), generating an n × n matrix A (Equation (1)).

Table 1.
Scale and definition of judgment matrix.
Weight Calculation (wi): The eigenvector method (Equation (2)) derives priority weights from A, ensuring hierarchical consistency. aij represents the importance of indicator i relative to that of indicator j.
Consistency Validation: The consistency ratio (CR) is computed using Equation (3). If CR < 0.1, then the matrix is accepted; otherwise, expert revisions are required.
where CI is calculated using Equation (4):
where is the maximum eigenvalue of the judgment matrix, calculated using Equation (5):
The value of RI is contingent upon the matrix order, n; precise numerical values for n = 12 are outlined in Table 2.
Table 2.
Random consistency index values.
2.3. Entropy Weight Method (EWM)
The entropy weight method (EWM) quantifies objective weights based on the dispersion degree of indicator data, where lower entropy values signify higher data variability and a greater influence on evaluations. The procedure is implemented as follows [28]:
- (1)
- Data normalization
When constructing multiple indicator matrices, xij represents the data corresponding to the j-th evaluation indicator under the i-th evaluation object (i = 1, 2, ⋯, n; j = 1, 2, ⋯, m). Due to the significant impact of indicators with different natures on the results, it is imperative to mitigate dimensional influence during calculation and standardize the data as follows:
- (2)
- Normalizing the values (Pij)
The ratio of the n-th indicator is calculated for each evaluation object as follows:
- (3)
- Calculating the entropy values (ej)
- (4)
- Calculating the variability of an indicator
The variability of the j-th indicator is calculated as shown below (gi):
- (5)
- Determining the indicator weights
The weight of the j-th indicator is calculated as follows (wj):
- (6)
- Calculating the comprehensive scores (zij)
2.4. Hybrid AHP-EWM Weighting
To balance the complementary strengths of AHP (subjective expertise) and EWM (objective data variability), a linear weighted aggregation is applied:
where α = 0.5 ensures equal contributions from both methods, balancing domain priorities (e.g., solar resource potential) with environmental heterogeneity (e.g., wind/snow risks).
Subsequently, this hybrid weighting strategy is implemented in a case study of CSP site selection in Tibet. The data sources, preprocessing protocols, and validation procedures are detailed in Section 3.
3. Case Study
3.1. Study Area
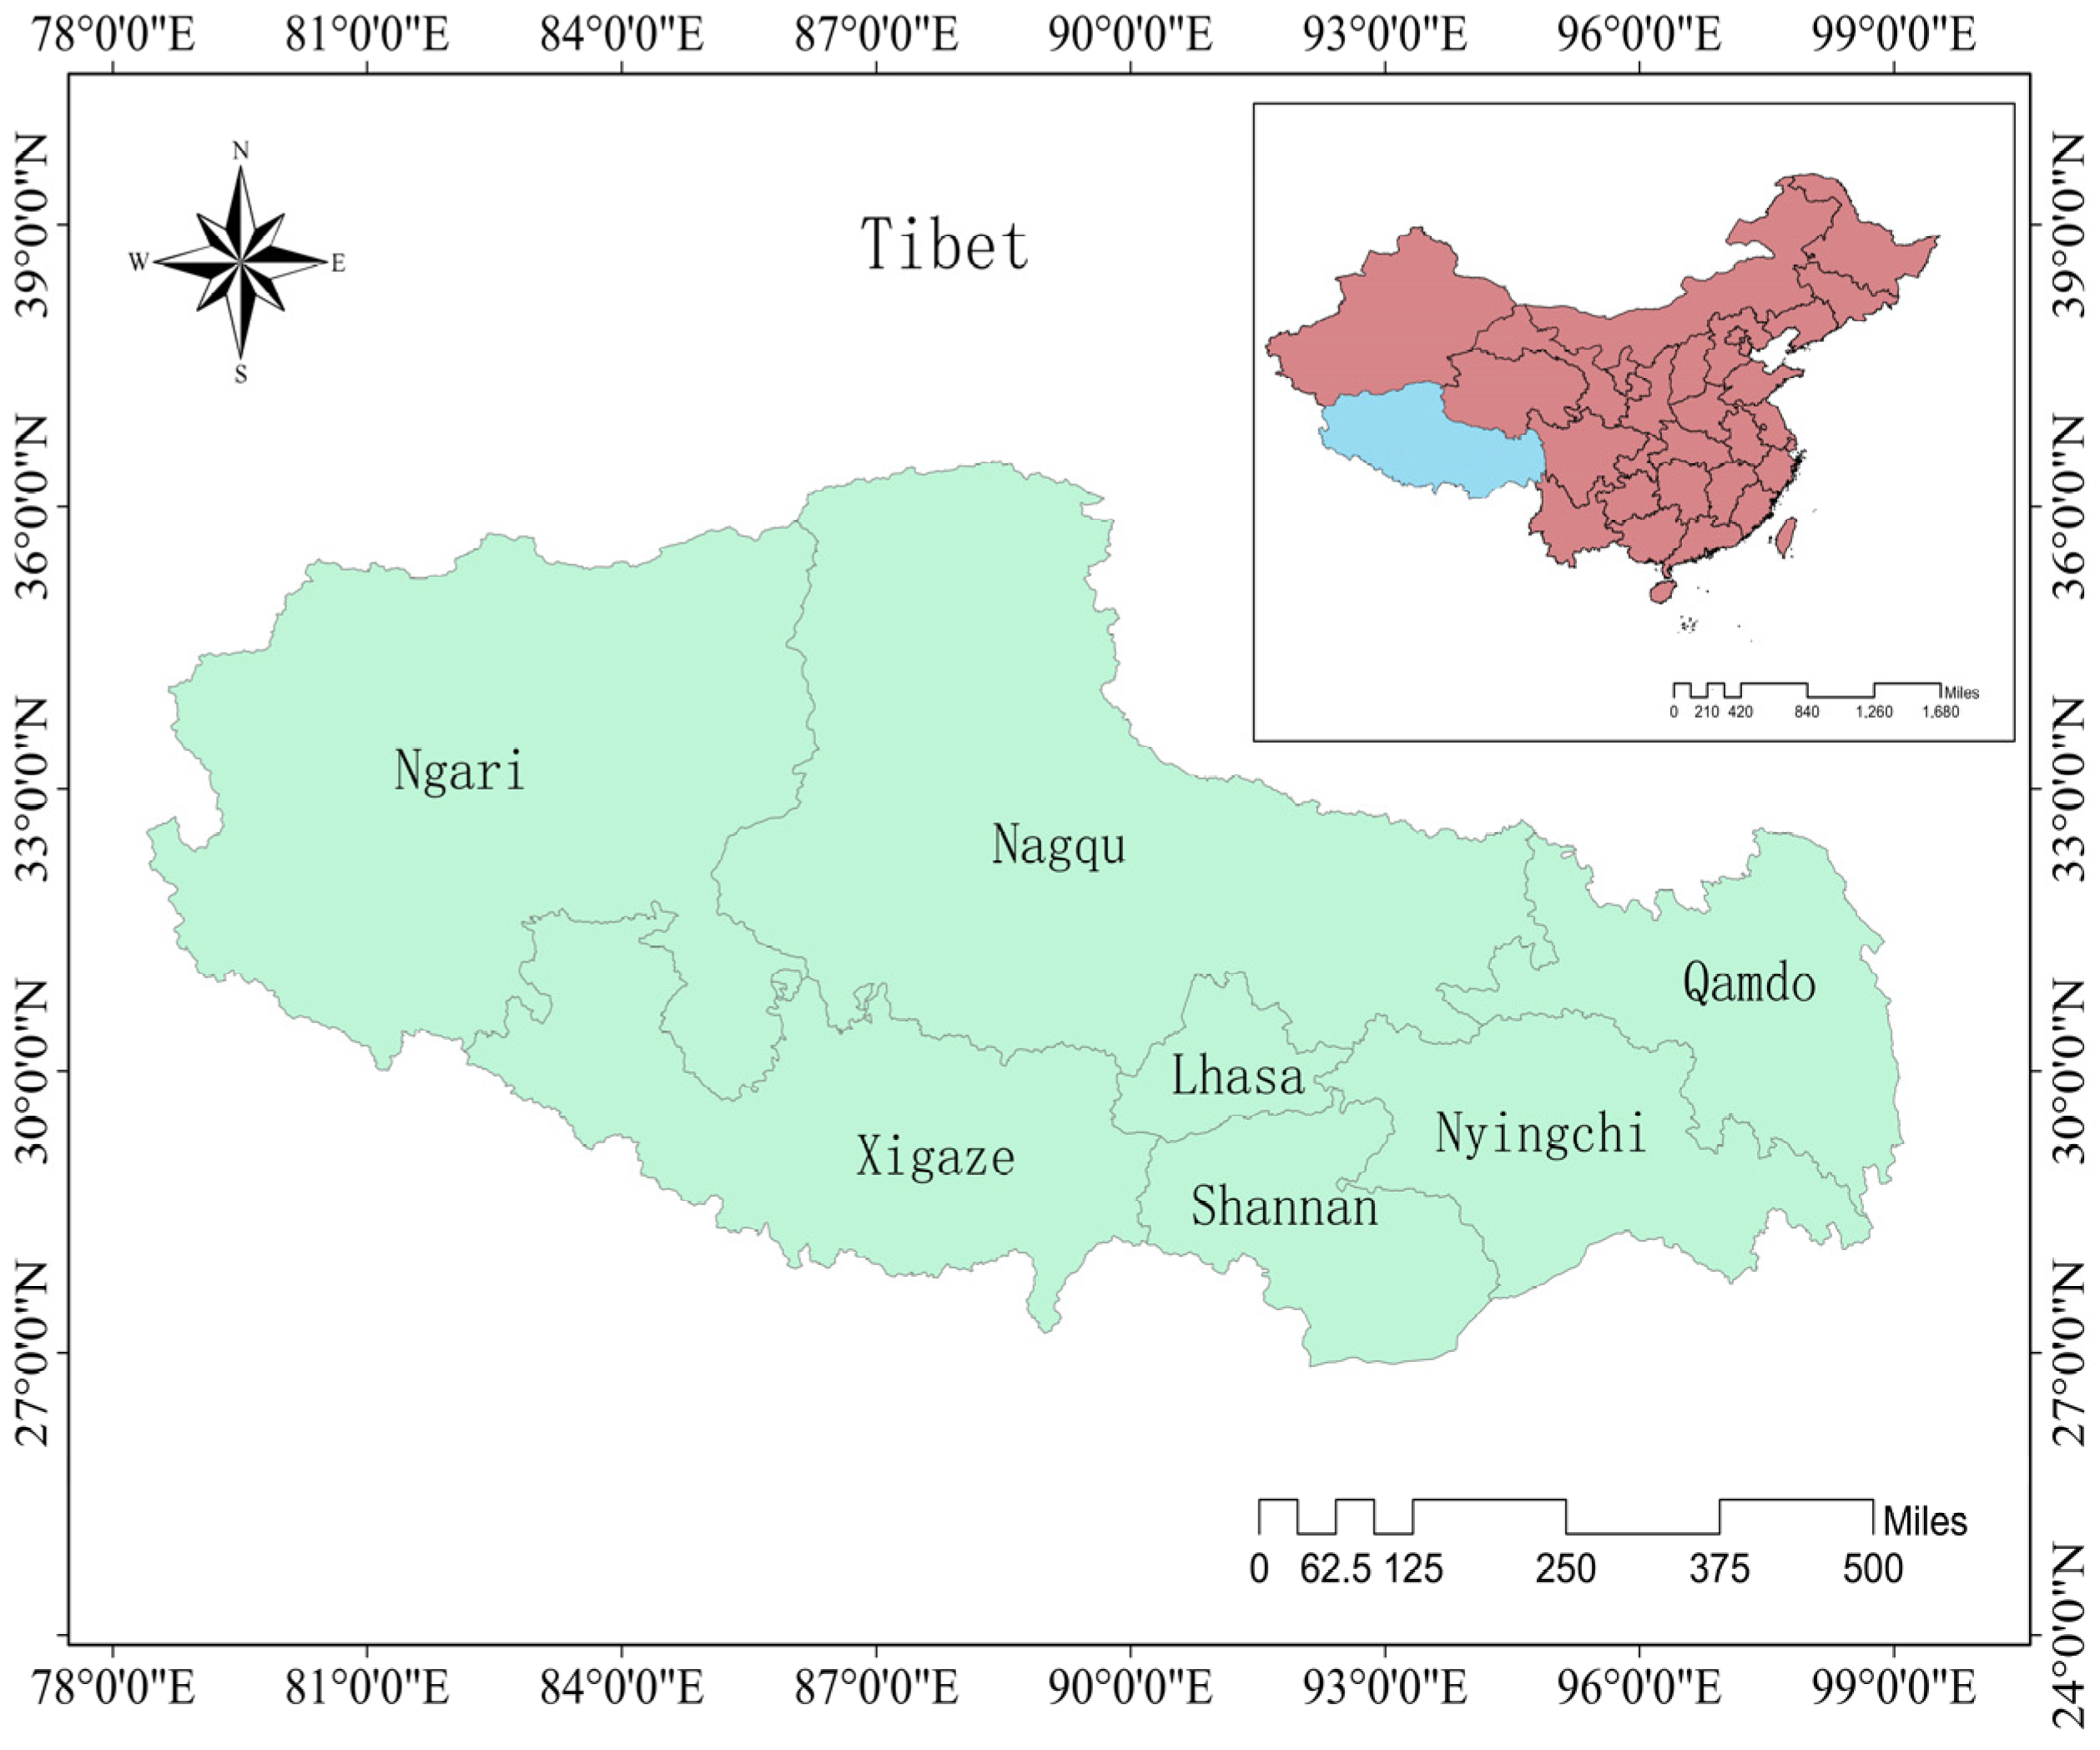
The Tibet Autonomous Region (26.85–36.53° N, 78.40–99.02° E), situated in southwestern China (Figure 2), spans approximately 1.2 million km2 of high-altitude plateau terrain. Its diverse topography encompasses the Himalayan, Gangdise, and Hengduan mountain ranges, creating a complex geomorphological profile.
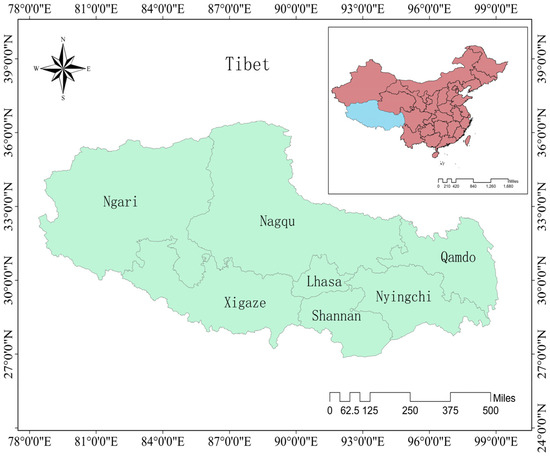
Figure 2.
Study area.
The region boasts exceptional solar energy potential, with the annual global horizontal irradiance (GHI) averaging 1800 kWh/m2 (peaking at 2900 kWh/m2) and the direct normal irradiance (DNI) exceeding 2100 kWh/m2 under minimal cloud cover. The above solar irradiance data were sourced from the Geospatial Data Cloud. The annual average sunshine duration amounts to more than 3000 h [32]. These conditions nominally position Tibet as an ideal candidate for CSP deployment. However, its extreme environmental and socio-geographic constraints necessitate careful site selection.
Climatic Challenges: Pronounced diurnal temperature fluctuations (ΔT > 20 °C), persistent high-velocity winds (annual average > 5 m/s), and heavy winter snowfall (snow depth > 1 m in high-altitude zones).
Infrastructural Limitations: A sparse population density (particularly in the colder northwestern plateau) and underdeveloped transportation networks.
Operational Risks: Health hazards for construction crews due to hypobaric hypoxia at elevations >4500 m.
These factors collectively underscore the imperative for a spatially explicit, multi-criteria decision-making framework tailored to Tibet’s unique environment.
3.2. CSP Site-Selection Framework Based on MCDM and GIS
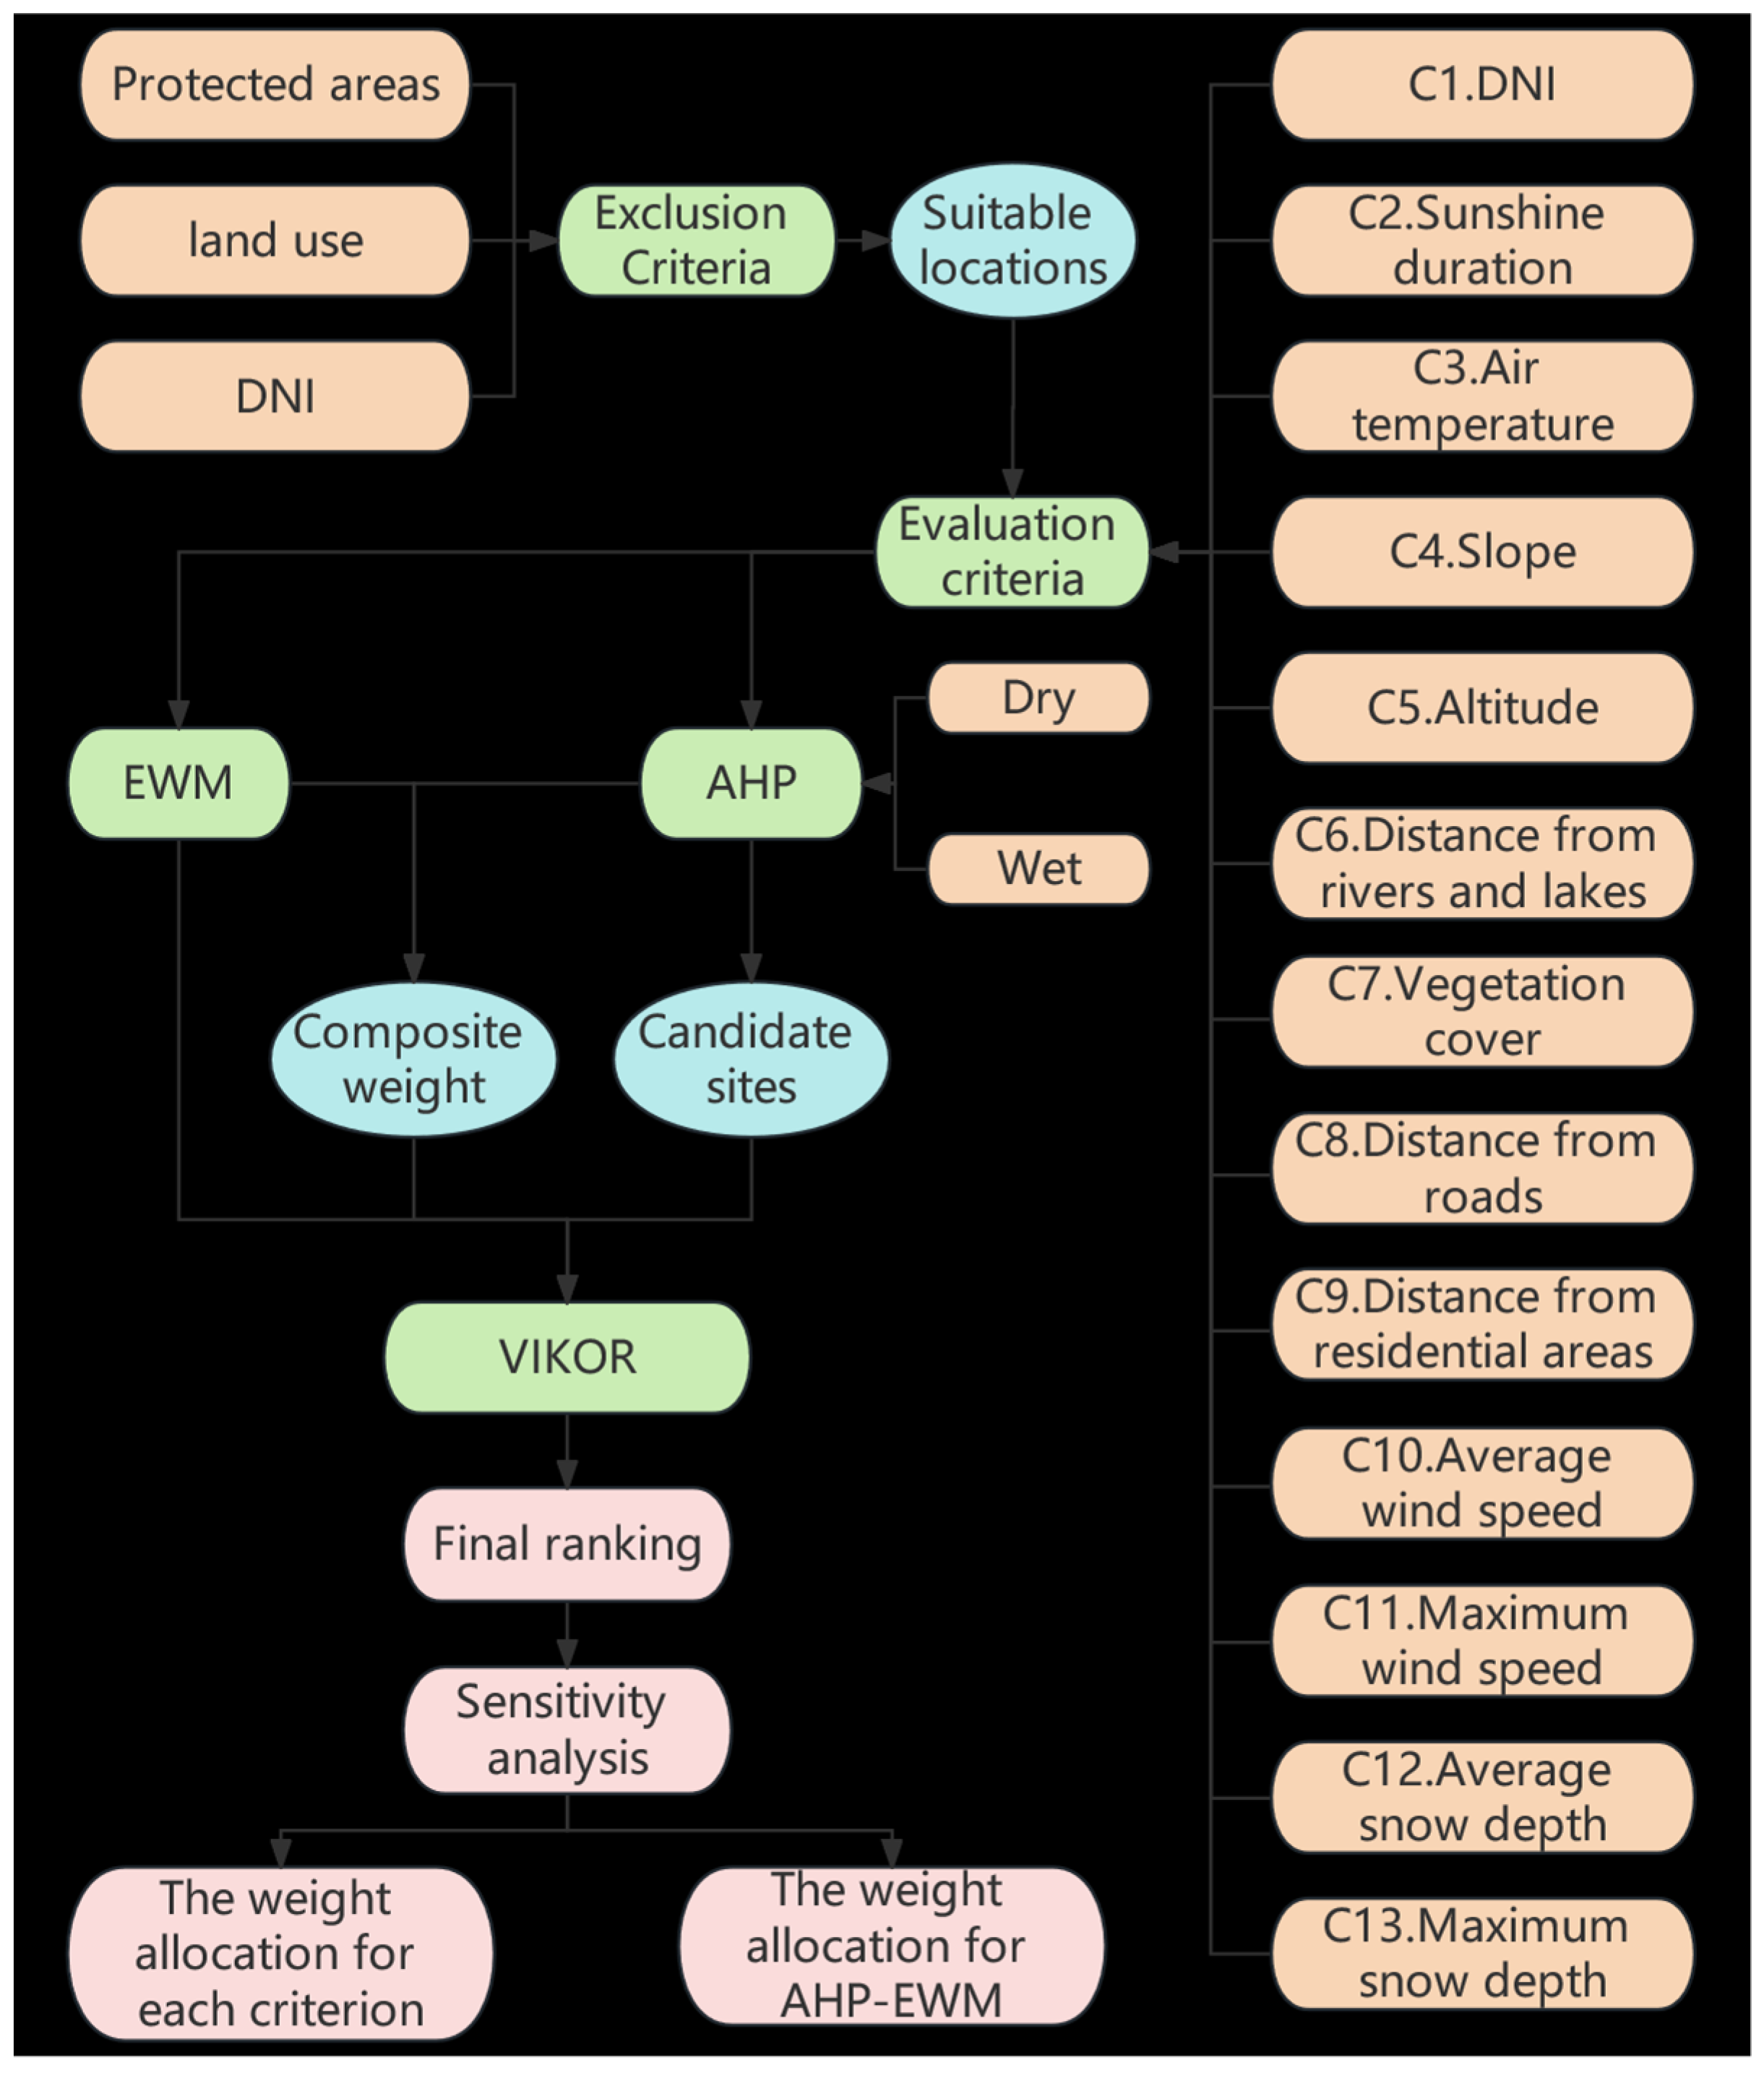
The site selection of CSP plants in Tibet necessitates a systematic integration of geographical constraints and environmental risks. To address this challenge, a hybrid GIS-MCDM framework was proposed (Figure 3), which synergizes geospatial analysis with multi-criteria decision-making to balance solar resource potential and region-specific climatic challenges. The framework implementation steps include the following.
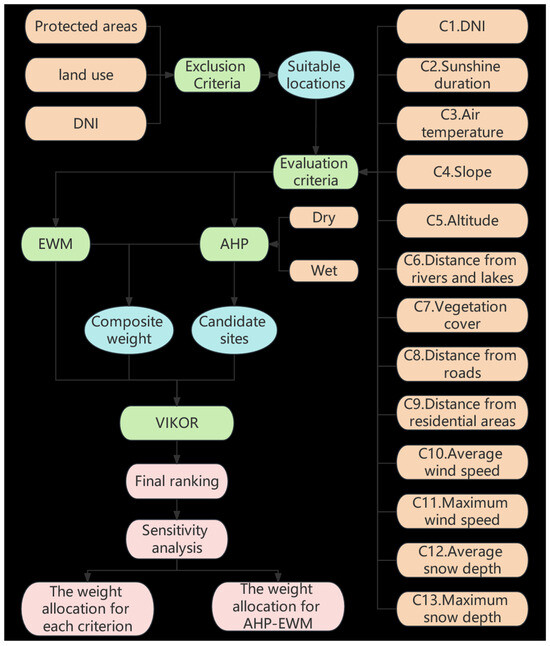
Figure 3.
Workflow.
- (1)
- Criteria Definition
Three non-negotiable constraints were applied as exclusion criteria, including protected areas (e.g., ecological reserves and cultural heritage zones), land-use restrictions (only grasslands and wastelands considered for development), and DNI thresholds (excluding sites with an annual DNI < 1400 kWh/m2).
Thirteen indicators spanning five dimensions were selected as evaluation criteria, comprising climatic (DNI, sunshine duration, and air temperature), geographic (slope and elevation), resource (distance to rivers/lakes and vegetation cover), infrastructural (proximity to roads and residential areas), and local environmental (the average/maximum wind speed and snow depth) factors.
- (2)
- Data Processing
Spatial datasets (e.g., DNI and wind speed) were sourced from platforms such as Meteonorm and normalized using min–max scaling to a [0, 1] range. Positive indicators (e.g., DNI) and negative indicators (e.g., slope) were processed separately to ensure comparability.
- (3)
- Weight Assignment
Twelve domain experts rated criteria importance via pairwise comparisons (1–9 scale), generating AHP weights. Consistency ratios (CR < 0.1) validated judgment matrices. Entropy values quantified data variability, with higher weights assigned to indicators with greater dispersion (e.g., wind speed). Subjective and objective weights were linearly combined (α = 0.5) to balance expert insights and environmental heterogeneity.
- (4)
- Site Screening and Ranking
Preliminary Screening: GIS overlay analysis excluded non-compliant areas, yielding 15 candidate sites (A1–A15).
Cooling System Adaptation: Separate AHP analyses were performed for dry cooling systems and wet cooling systems.
VIKOR Prioritization: Candidate sites were ranked based on their proximity to ideal solutions, with compromise coefficients (v = 0.5) balancing group utility and individual regret.
- (5)
- Validation
For standard weight adjustments, the criteria were categorized into three groups (climatic conditions (C1, C2, and C3) and natural resources (C6 and C7), geographical conditions (C4 and C5) and infrastructure and social factors (C8 and C9), and special local environment (C10, C11, C12, and C13)) to test the stability of the rankings. For the AHP-EWM weight allocation analysis, the subjective–objective ratio (α = 0–100%) was varied to evaluate different AHP-EWM weight allocations, with the VIKOR rankings explicitly addressing conflicts between solar potential and environmental risks.
3.3. Evaluation Index of Site-Selection Planning
3.3.1. Exclusion Criteria
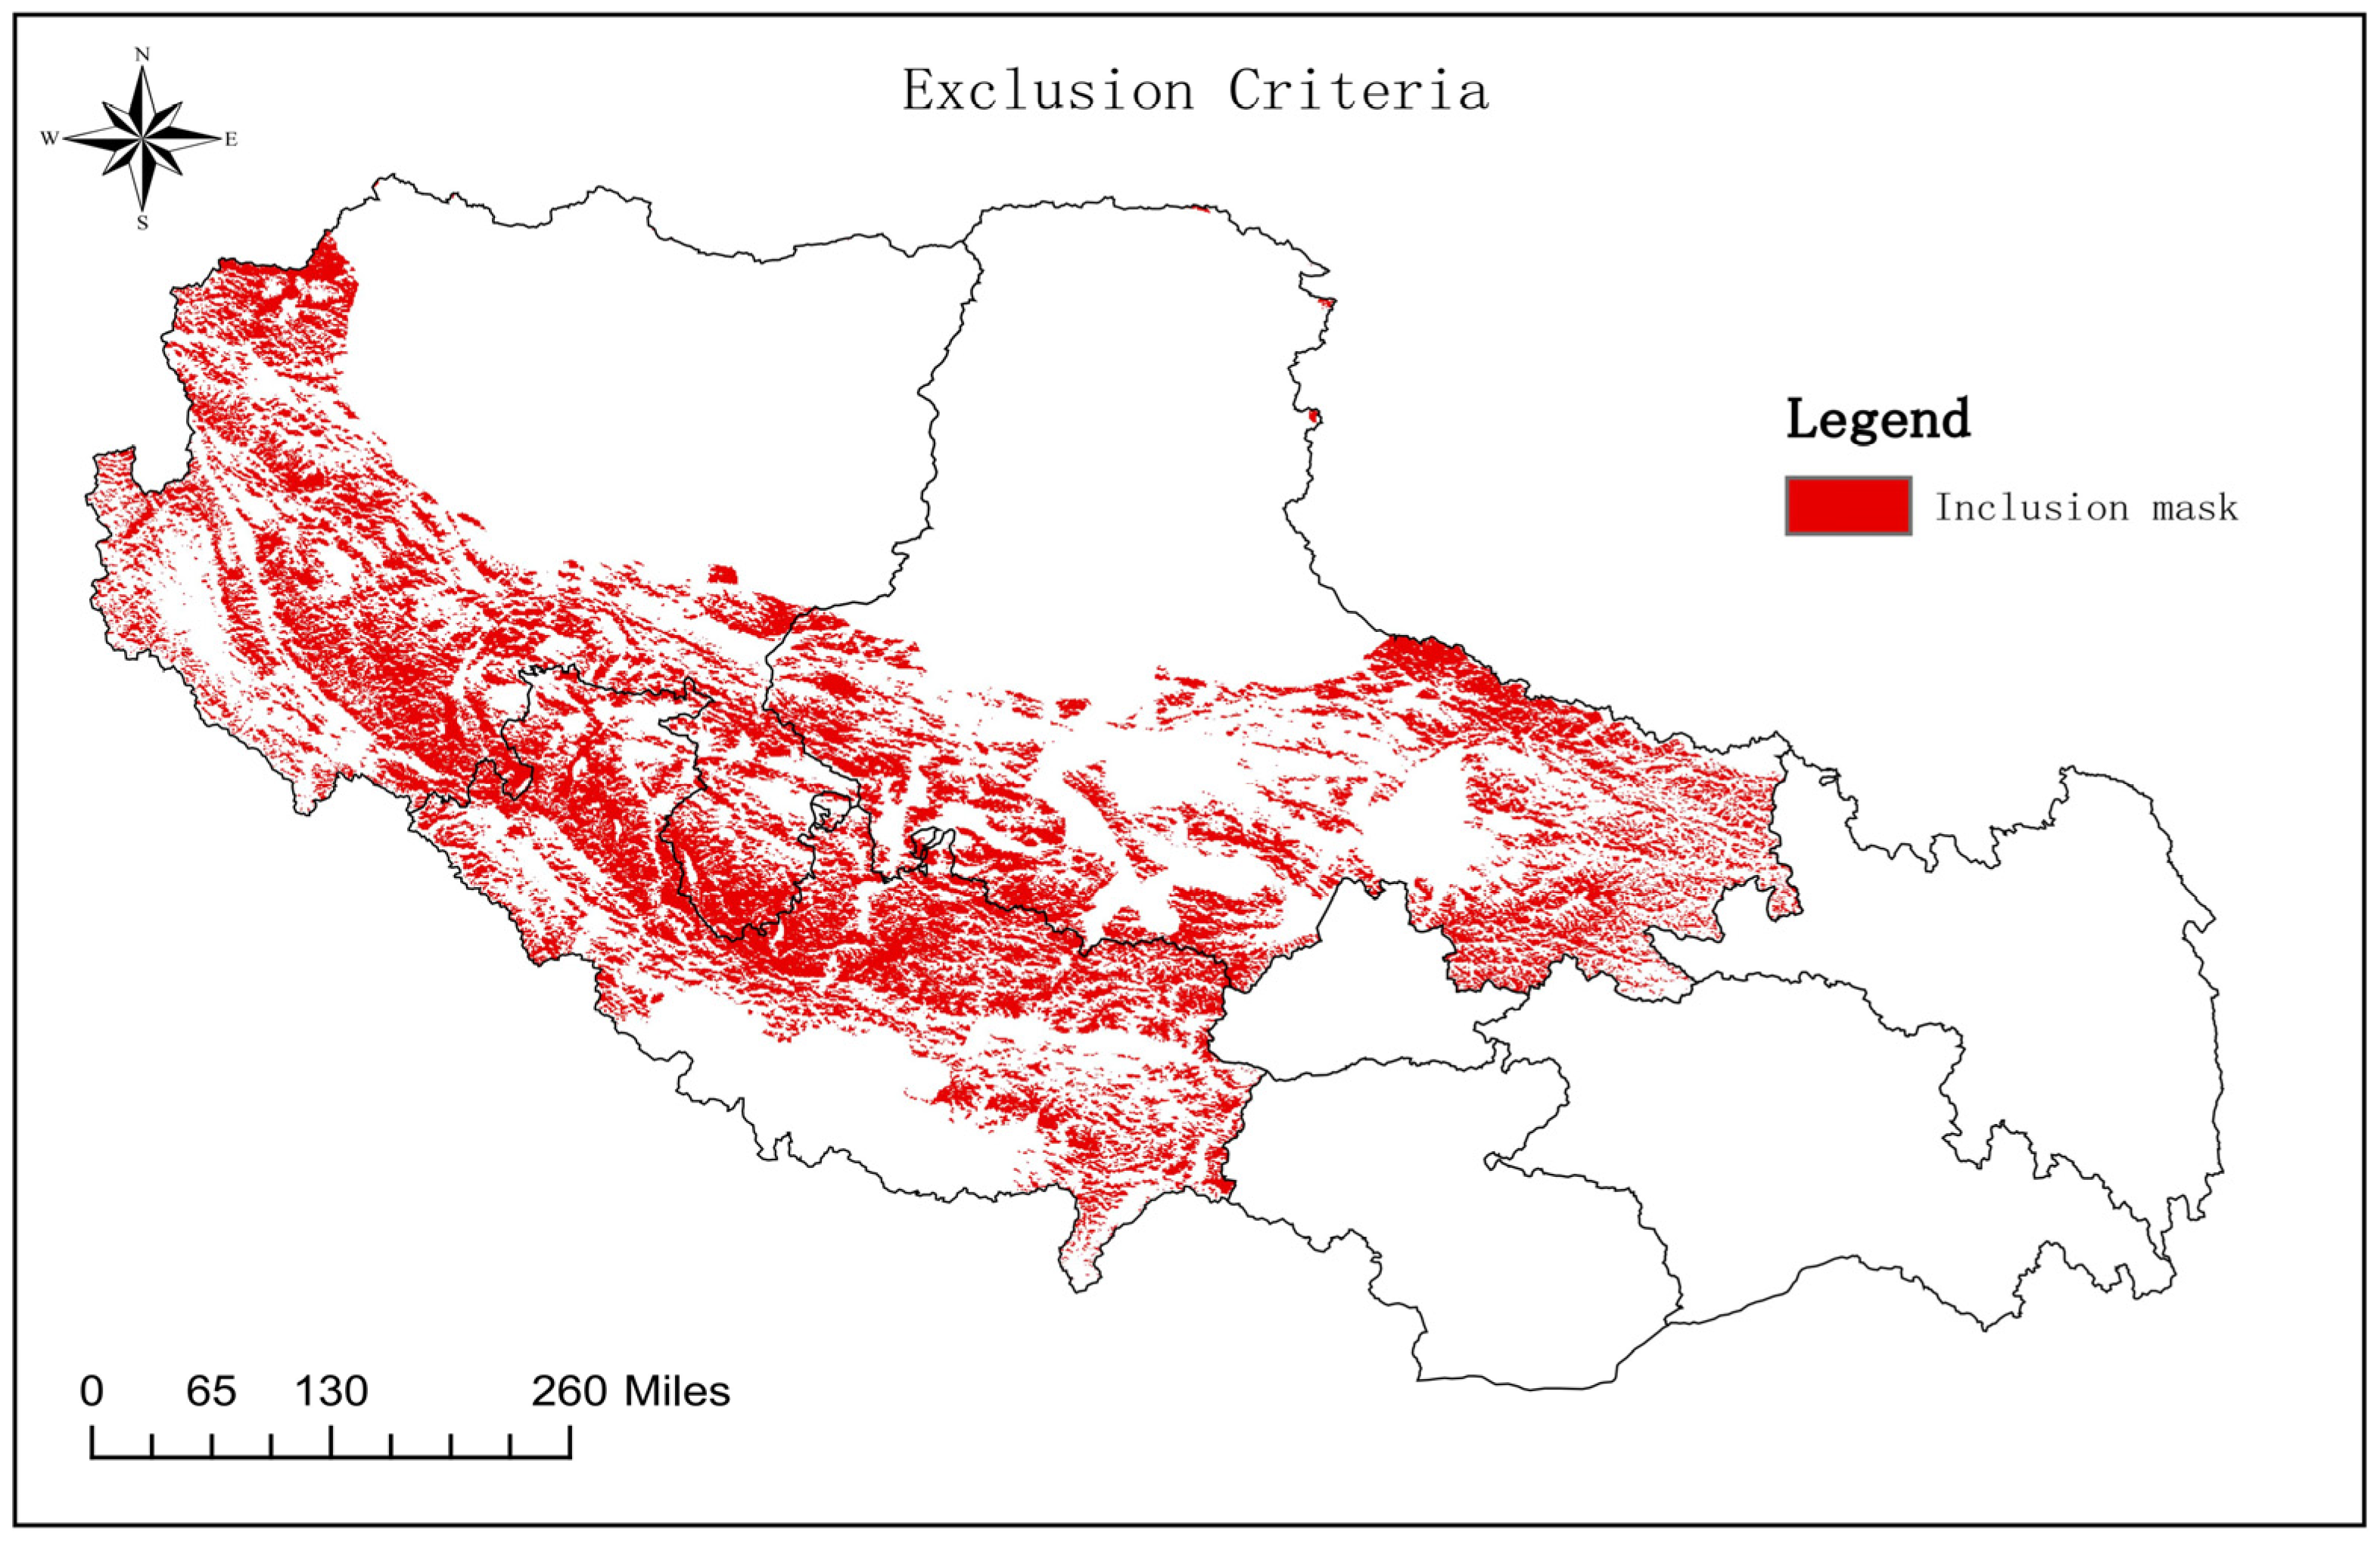
Building on the framework outlined in Section 3.2, three spatially explicit exclusion criteria were rigorously enforced to align with Tibet’s ecological preservation and technical feasibility goals. Ecologically sensitive zones (e.g., national parks and wetlands) and cultural heritage sites were excluded to comply with the Tibet Autonomous Region Ecological Protection Regulations (2021). Only non-arable lands (grasslands: 58.7%; wastelands: 32.1%) were permitted for CSP development, minimizing agricultural disruption. Sites with an annual DNI < 1400 kWh/m2 or a GHI < 1600 kWh/m2 [17,33] were excluded, ensuring the baseline energy yield.
The protected area data consisted of vector boundaries obtained from the Resource and Environmental Science Data Platform (RESDC, v2023). The land-use data consisted of 30 m resolution raster data retrieved from Global Land Cover (GlobCover 2022). The DNI/GHI were derived from DEM-based solar radiation models in ArcGIS Pro 3.1, with raw DEM tiles sourced from the Geospatial Data Cloud. These datasets were integrated through a multi-step GIS workflow as follows: Exclusion layers were combined using Boolean logic (“AND” operation). Mask generation and spatial overlay were achieved by intersecting candidate areas with the composite mask (Figure 4). A 500 m buffer was applied for the edge refinement of excluded zones to mitigate boundary uncertainties.
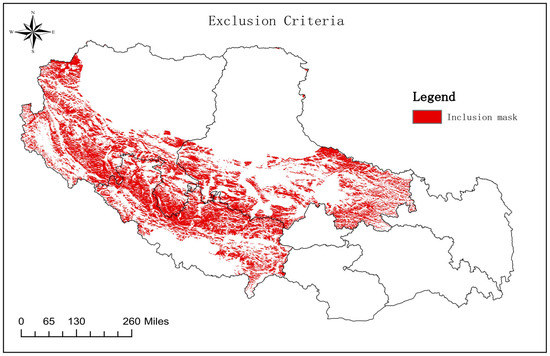
Figure 4.
Exclusion criteria.
3.3.2. Evaluation Criteria
The 13 evaluation criteria, categorized into five dimensions (Table 3), were spatially analyzed using ArcGIS 10.8. Each criterion’s relevance to CSP site suitability in Tibet is detailed below.
Table 3.
Evaluation criteria.
- (1)
- Climatic conditions
C1. DNI: There is a high direct solar irradiance (2100–2280 kWh/m2/year) due to low atmospheric attenuation and minimal cloud cover on the plateau.
C2. Sunshine duration: Many areas in Tibet exhibit a high annual sunshine duration of over 3000 h.
C3. Air temperature: Tibet experiences significant temperature fluctuations. Furthermore, the southeastern region of Tibet is characterized by a tropical mountain monsoon humid climate, while the northern plateau of Tibet exhibits a plateau cold monsoon arid climate.
- (2)
- Geographical conditions
C4. Slope: The topography of Tibet is characterized by a complex landscape consisting of numerous mountains and plateaus. Selecting sites with moderate slopes facilitates the installation and maintenance of CSP equipment, while an excessively steep terrain increases construction challenges and costs.
C5. Altitude: The advantage of such a high altitude lies in its heightened solar radiation intensity; however, it necessitates careful consideration of its impact on the equipment and personnel involved in construction activities.
- (3)
- Natural Resources
C6. Distance from rivers and lakes: Tibet has abundant water resources, primarily derived from glacier melt and plateau rivers. Thus, it is advantageous to situate CSP projects in close proximity to these water sources, as it will ensure an adequate supply for mirror cleaning and steam condensation purposes. Consequently, transportation costs for water can be minimized, and project economics can be enhanced.
C7. Vegetation cover: Areas with lower vegetation cover require less frequent mirror cleaning and occupy a smaller land area. The national Normalized Difference Vegetation Index (NDVI2019), a remote-sensing index, was utilized to assess the health and growth conditions of the vegetation. An NDVI value close to 0 indicates a minimal presence of vegetation.
- (4)
- Infrastructural and social factors
C8. Distance from roads: Given the limited transportation infrastructure and underdeveloped road network in Tibet, selecting sites in close proximity to existing roads can effectively reduce transportation costs and enhance project accessibility. The accessibility of roads directly impacts construction and maintenance efficiency, thus highlighting the importance of considering road proximity in site selection.
C9. Distance from residential areas: The proximity to residential areas has a significant impact on the project’s influence on nearby inhabitants. Greater distances can help to alleviate noise and visual disturbances, thus reducing potential social implications.
- (5)
- Special local weather conditions
C10. Average wind speed: In Tibet, winter is characterized by frequent occurrences of elevated wind speeds. Moderate wind speeds contribute to efficient equipment cooling, while excessively high wind speeds may lead to equipment damage. According to statistical data, the average wind speed in Tibet ranges from approximately 3 to 4 m/s; however, certain regions, particularly the northern Tibetan Plateau, experience an average wind speed of 5–6 m/s.
C11. Maximum wind speed: Tibet occasionally experiences strong wind conditions, with maximum wind speeds reaching 20–30 m/s or even higher. This presents a potential risk to CSP systems, as the mirrors and support structures are particularly susceptible to damage under such high wind velocities.
C12. Average snow depth: Certain regions in Tibet receive substantial winter snowfall, with an average snow depth ranging from approximately 10 to 20 cm. However, in high-altitude areas, the snow depth can reach as much as 30 to 50 cm. The presence of snow significantly impacts the maintenance of mirrors and presents challenges for efficient solar energy collection.
C13. Maximum snow depth: In the high-altitude regions of Tibet, snow depths exceeding 1 m can pose potential risks to the structural integrity of solar thermal power generation equipment due to substantial snow accumulation.
3.4. Weight Calculation and Selection of Candidate Points
3.4.1. Weights Determined Using AHP
- (1)
- Expert questionnaires distribution and collection:
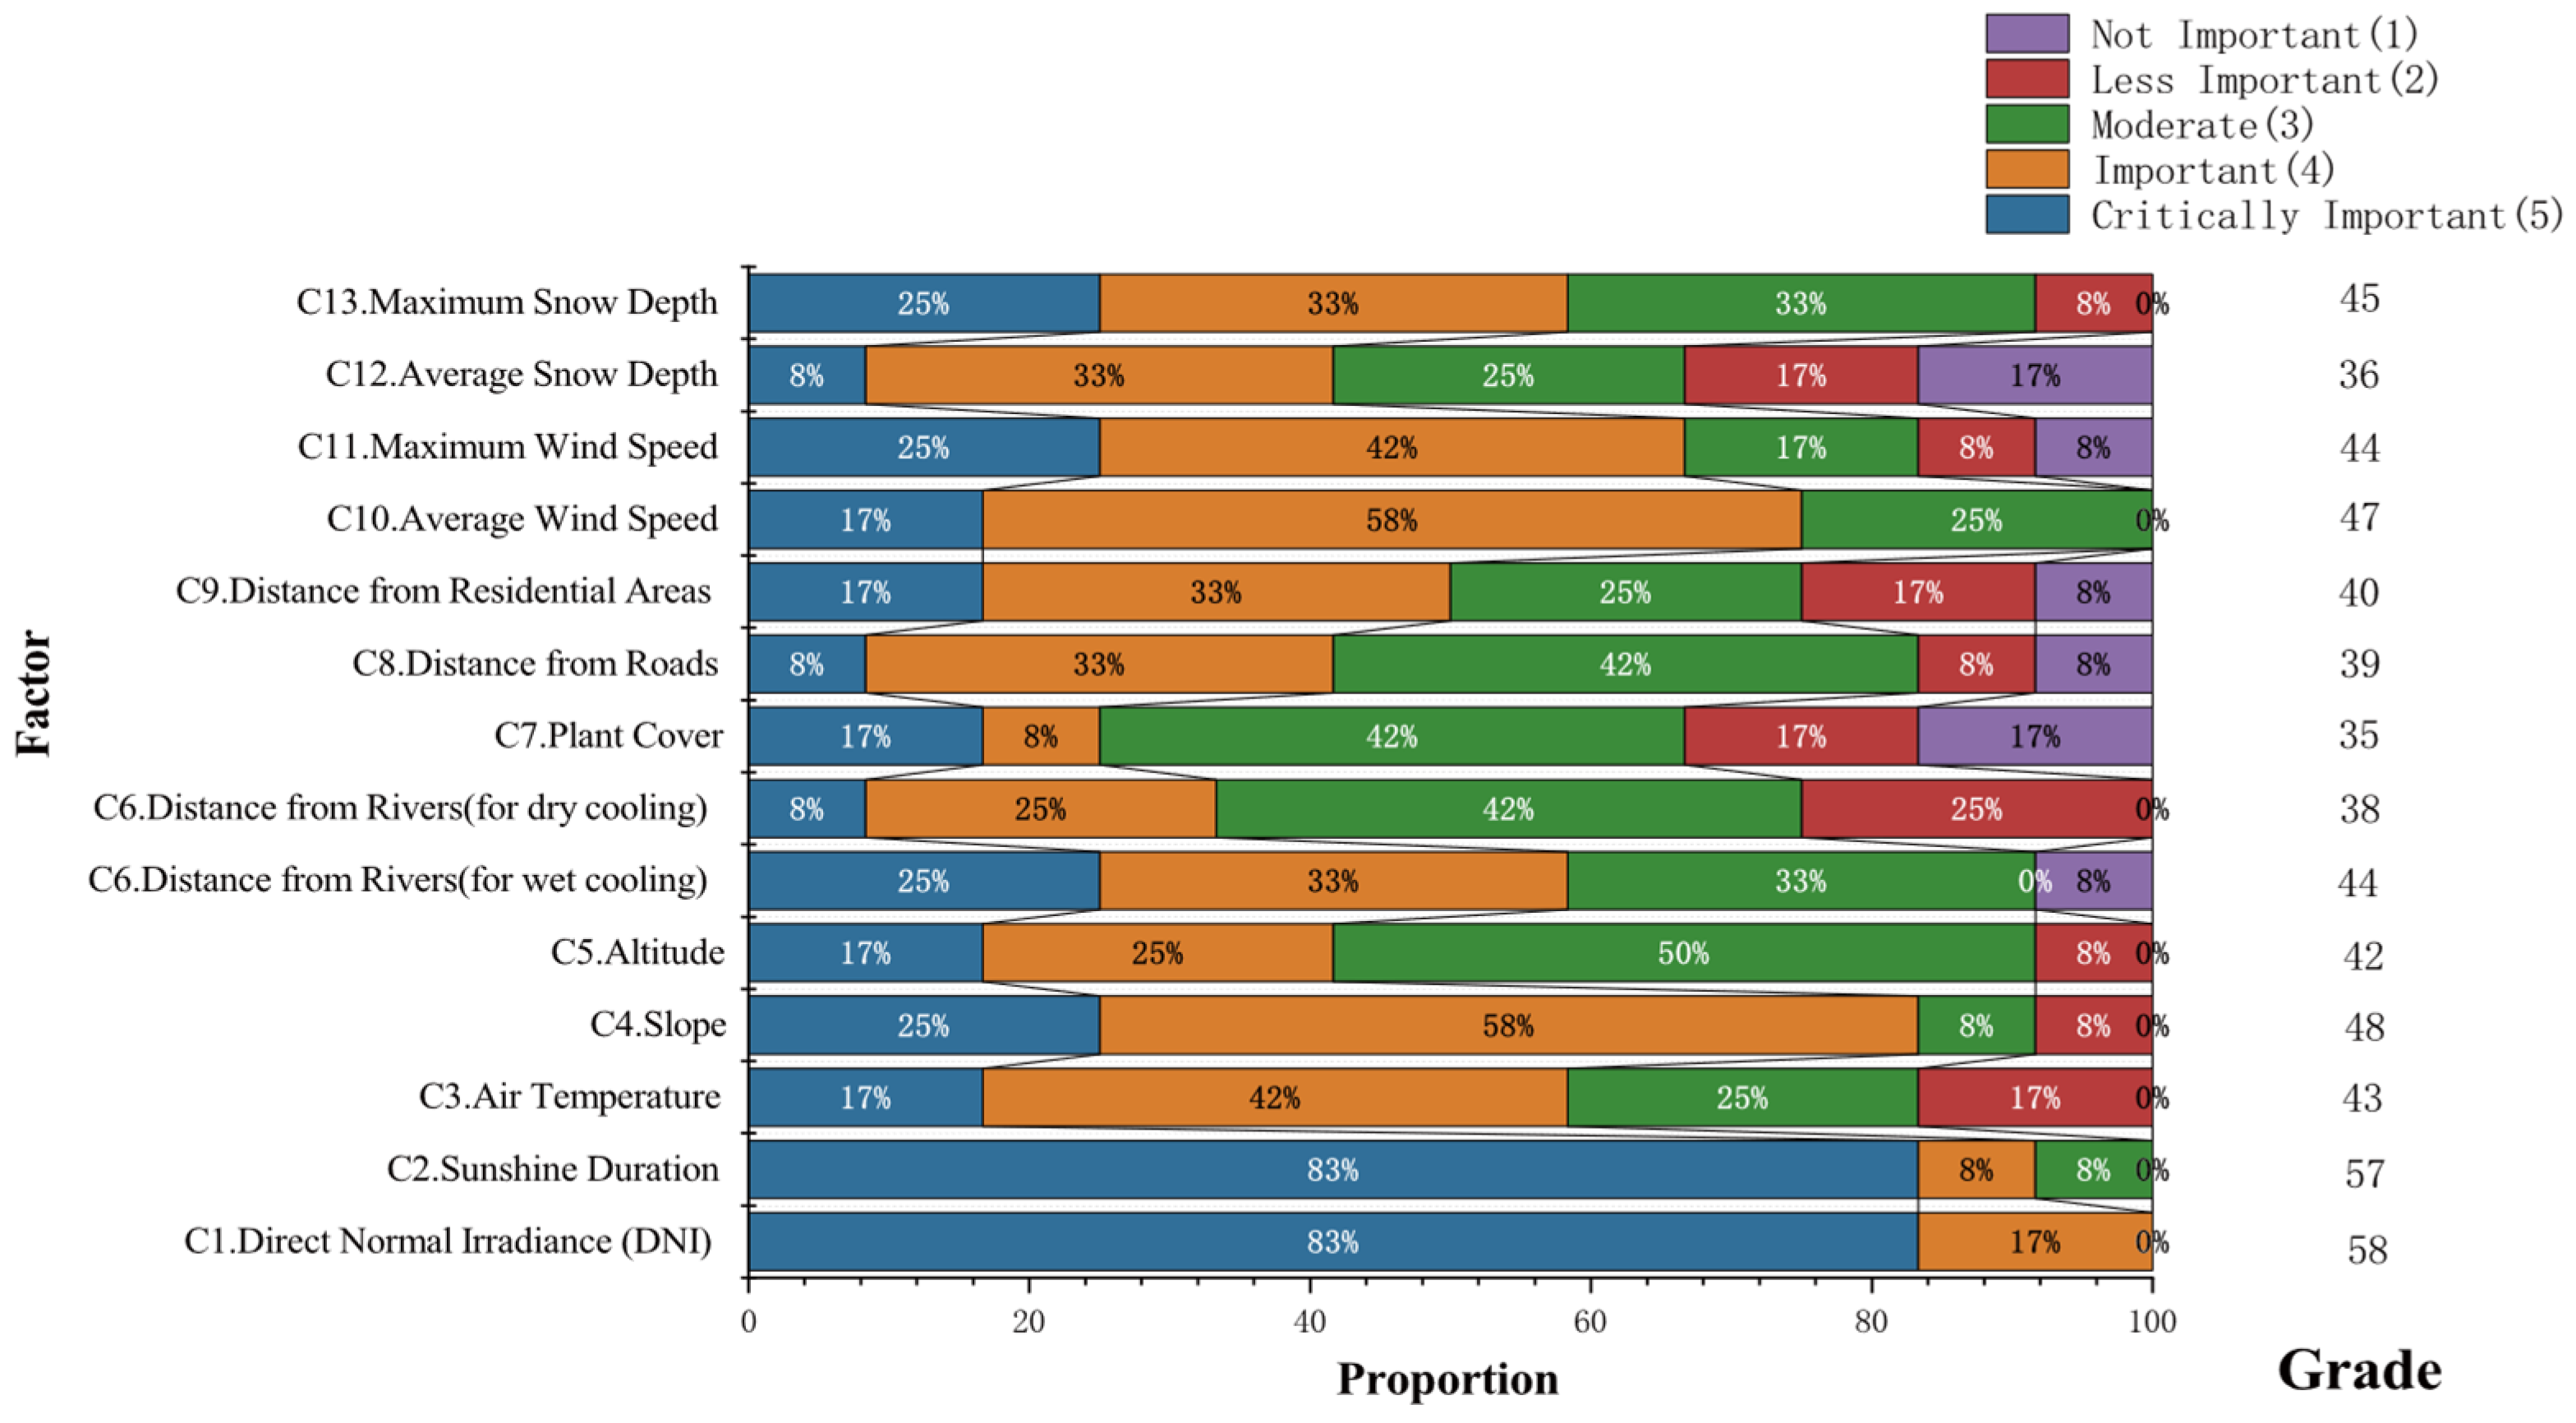
For this study, evaluations were gathered from 12 esteemed professionals in the field of CSP using Questionnaire Star software (a validated online survey platform), with responses rated on a scale of 1 (not important) to 5 (very important). The expert panel for the AHP evaluation comprised internationally recognized CSP researchers with demonstrated expertise evidenced by peer-reviewed publications in high-impact journals. Structured digital questionnaires were administered through a secure web-based platform following a double-blind protocol to ensure impartial data collection and minimize response bias. The statistical results are detailed in Figure 5 for reference.
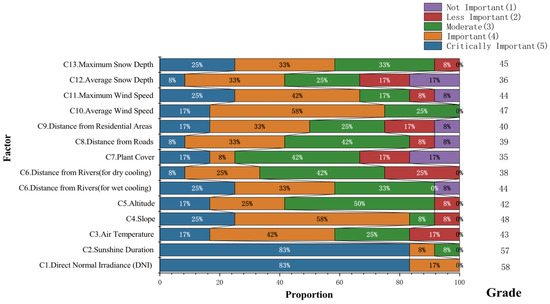
Figure 5.
Statistical results of expert questionnaires.
To address the observed discrepancies in the expert evaluations, systematic measures were adopted to safeguard the precision and validity of the research outcomes. First, aggregate scores for each evaluation criterion were computed, and they were then subjected to a pairwise comparative analysis. The resulting differentials were quantified using a standardized 1–9 numerical scale. This methodology facilitated a data-driven evaluation of inter-factor prioritization, significantly reducing potential biases associated with subjective expert judgments or nonconforming perspectives that diverge from consensus norms.
- (2)
- Weights calculated based on the results of expert questionnaire:
In accordance with Section 2.2, the judgment matrix is calculated, and the weights are obtained, as shown in Table 4.
Table 4.
Judgment matrix and weights used in AHP.
The calculated results show that the CRs for dry cooling and wet cooling were 0.02, and 0.01, below the threshold of 0.1. Thus, they satisfy the consistency check criteria. An analysis of the AHP weights revealed that the experts assigned significant importance to DNI (dry: 0.25; wet: 0.25) and sunshine duration (dry: 0.24; wet: 0.24) for both dry and wet cooling systems, with weights exceeding 20%, significantly surpassing those assigned to other factors. Conversely, vegetation cover and the average snow depth (dry: 0.2; wet: 0.2) exhibited comparatively lower weights. In the context of the AHP analysis, a notable disparity in the weight between dry and wet cooling was observed with regard to distance from rivers and lakes (dry: 0.02; wet: 0.05). However, there were no significant differences in general in the weightings of various factors for power plants with dry and wet cooling.
3.4.2. Selection of Candidate Points
Initially, the GIS overlay analysis was used to perform a preliminary screening of candidate points, with priority given to the exclusion of sites that failed to meet the predefined criteria. Subsequently, AHP was employed to determine the weights of the nine factors ranging from C1 to C9. Following this, a weighted overlay analysis was conducted to generate a suitability map and further refine the selection of candidate points. The detailed steps are outlined as follows:
- (1)
- Data Normalization
With the calculation method detailed in Section 2.3, the data on factors such as DNI, sunshine duration, air temperature, altitude, and distance from residential areas for each site were subjected to positive normalization, while those on the slope, distance from rivers and lakes, vegetation cover, and distance from roads were subjected to negative normalization. This procedure was implemented using the Raster Calculator tool within ArcGIS. The normalized data are presented in Table 5.
Table 5.
Data normalized for C1–C13.
- (2)
- Candidate Site Screening
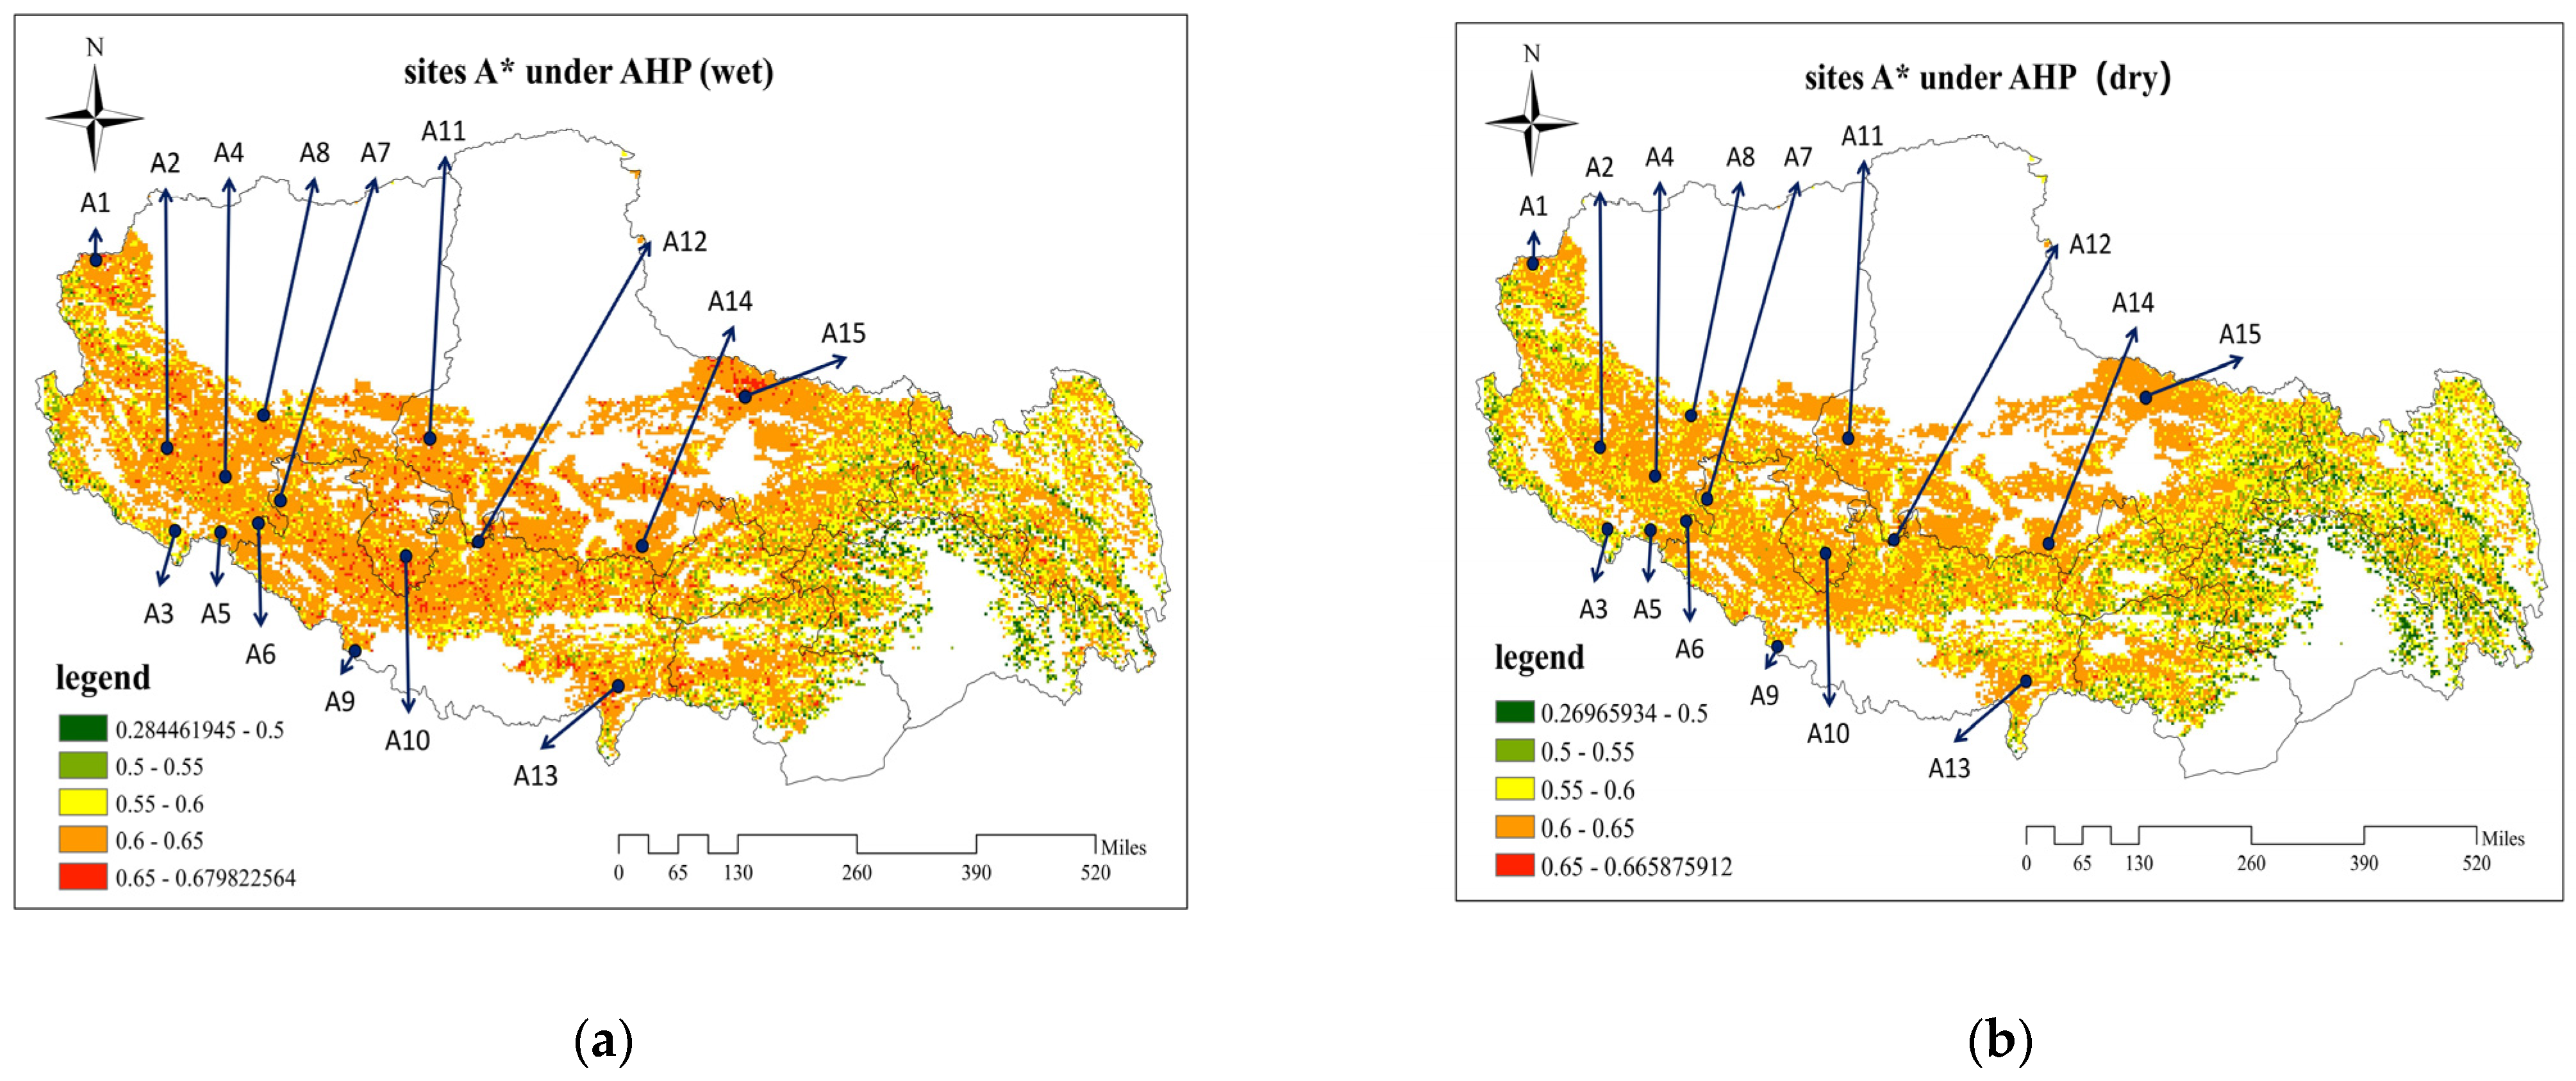
Preliminary Suitability Mapping: The AHP-derived weights for C1–C9 (Table 4) were applied in a weighted overlay analysis, generating a composite suitability index (0–1 scale). Areas scoring <0.65 (moderate suitability cutoff) were excluded, yielding 15 initial candidates (A1–A15, Figure 6), labeled A*.

Figure 6.
Suitable sites A*: (a) candidate points of AHP under wet cooling; (b) candidate points of AHP under dry cooling.
Secondary Environmental Filtering: The wind speed and snow depth data for these locations are listed in Table 6. Given the absence of a unified industry standard for snow accumulation thresholds in CSP stations, this study adopted the 10 mm criterion specified in the Emergency Plan for Snowstorm Prevention in Distributed Photovoltaic Stations, which mandates manual snow removal at snow depths ≥10 mm. Based on empirical engineering constraints and observational data, candidate sites A1–A3 were excluded from analysis due to their recorded snow depths exceeding this threshold. Consequently, the remaining sites (A4–A15) were identified as the final candidate points A. The normalized data for C1–C13 are detailed in Table 6 for an in-depth analysis.
Table 6.
Wind speed and snow depth.
3.5. Weights Determined Using EWM
In order to complement the subjective AHP weights, EWM was applied to quantify criteria importance based on environmental data heterogeneity (Section 2.3). The key steps and outcomes are as follows:
- (1)
- Data-Driven Weight Calculation
The entropy values (ej) and divergence degrees (gj) for all 13 criteria were computed using the normalized data in Table 7. A higher entropy reduction (e.g., gj = 0.19 for C6) indicated greater environmental variability, translating to elevated weights for wind speed (C10: 0.11; C11: 0.12) and water proximity (C6: 0.17).
Table 7.
EWM weights.
- (2)
- Contrast with Traditional Criteria
Solar-centric metrics (DNI: 0.04; sunshine duration: 0.04) were deprioritized due to minimal spatial variation across Tibet (DNI range: 2102–2280 kWh/m2). Temperature (C3: 0.13) and snow depth (C12: 0.05) gained prominence, reflecting localized climatic extremes (Figure 7).
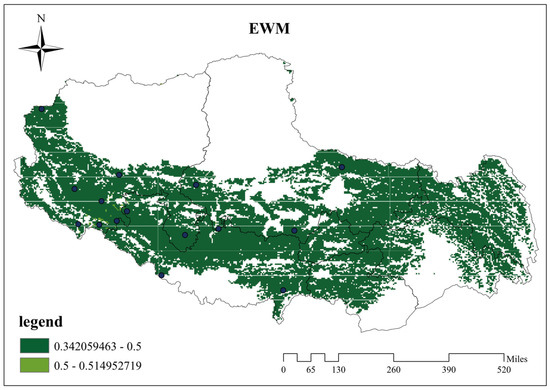
Figure 7.
EWM suitability diagram for C1–C9.
This divergence underscores the necessity of data-driven adjustments in regions with pronounced environmental gradients, where conventional solar-focused models may fail.
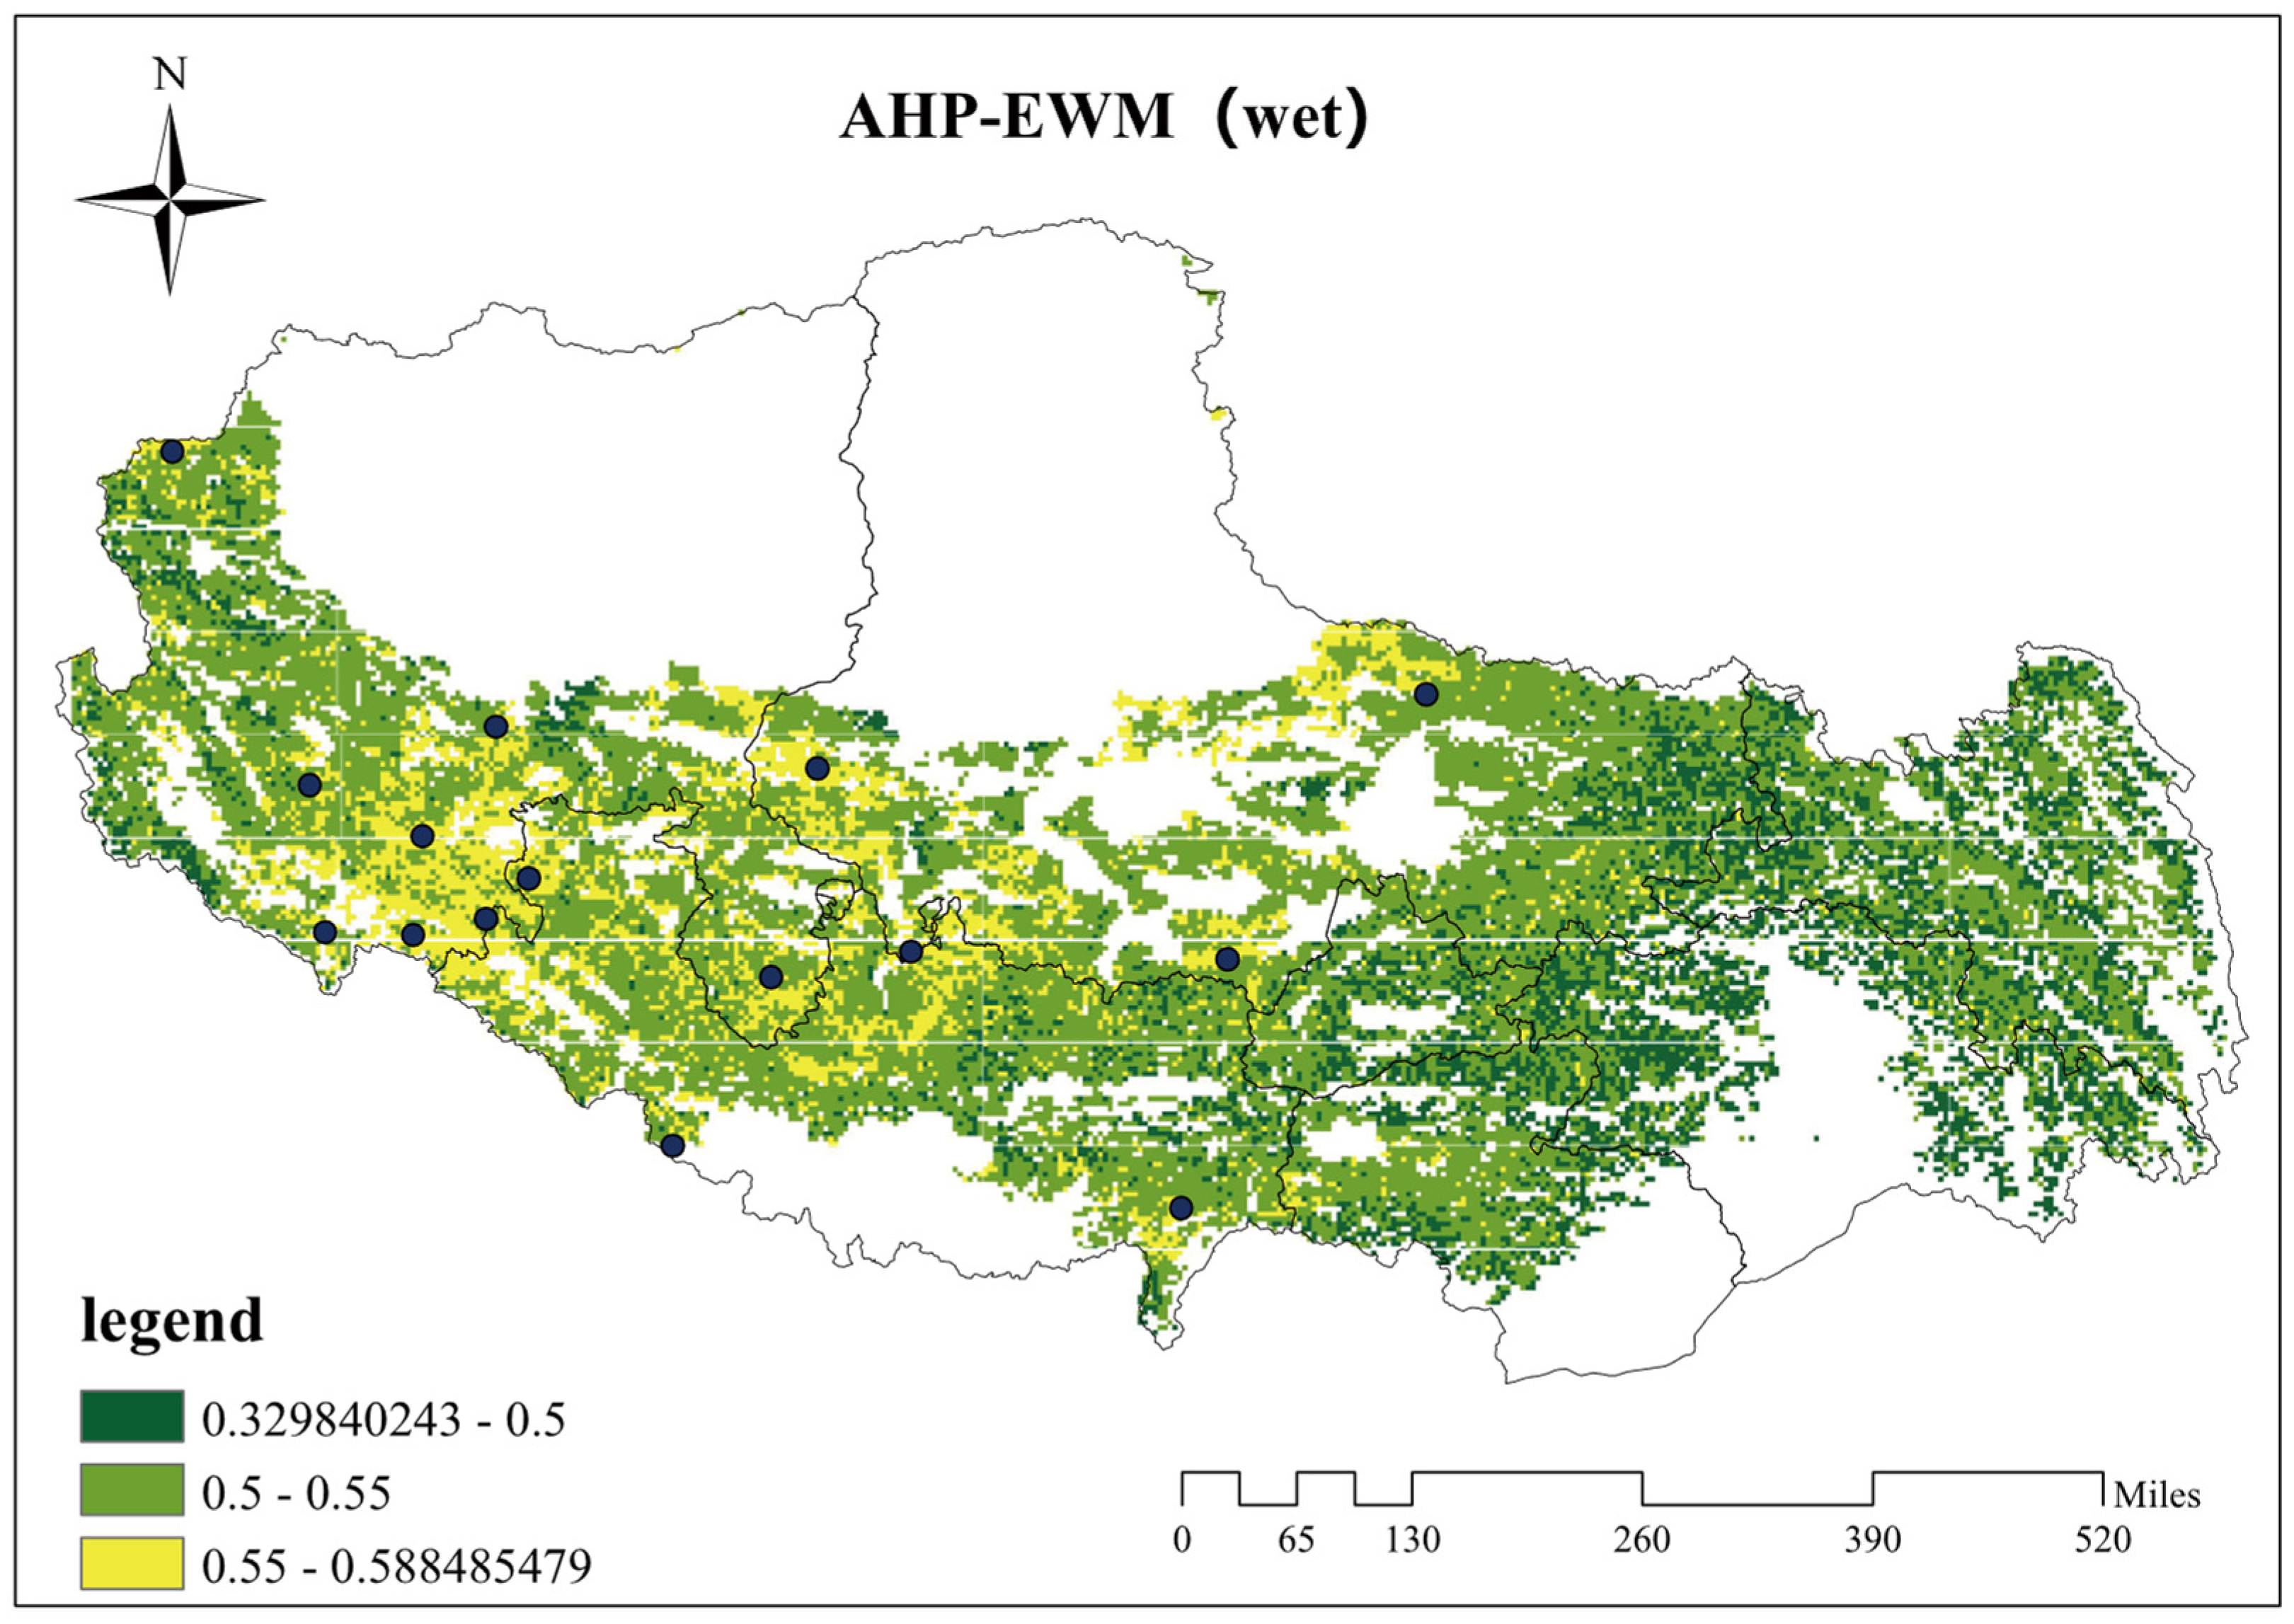
3.6. Hybrid AHP-EWM Weight Integration
To balance expert judgment (AHP) and environmental heterogeneity (EWM), a linearly combined weighting scheme was adopted. The key outcomes (Table 8) are as follows (Figure 8):
Table 8.
Final weights.

Figure 8.
Final suitability diagram for C1-C9.
Dominant Hybrid Weights: Solar resources retained a moderate influence (C1: 0.15; C2: 0.14), while wind speed (C10: 0.10) and water proximity (C6: 0.11) emerged as critical secondary factors. Low-impact criteria (vegetation cover: 0.03; snow depth: 0.03) aligned with the AHP/EWM consensus.
Cooling System Neutrality: The dry vs. wet cooling weights showed negligible differences (Δw < 0.01), validating the use of a unified model. Wet cooling was retained for cost efficiency, given Tibet’s adequate glacial water reserves.
3.7. Ranking of Suitable Points
The VIKOR method, proposed by Opricovic in 1998, is an MCDM approach based on the ideal solution, and it is particularly suitable for analyzing complex systems [34]. In comparison to the traditional TOPSIS (Technique for Order Preference by Similarity to Ideal Solution) method, the unique advantage of the VIKOR method lies in its incorporation of a decision-making coefficient, which allows for multiple prioritized compromise solutions [35]. In this section, the suitability of CSP locations is assessed using the VIKOR method, taking into account the weights derived from EWM, AHP, and AHP-EWM in the preceding sections. The specific results are detailed in Table 9.
Table 9.
VIKOR calculation and ranking.
The VIKOR analysis was executed through the following steps: The normalized criterion values (Table 6) and hybrid AHP-EWM weights (Table 8) were integrated as input data. The compromise coefficient was set to v = 0.5, assigning equal importance to group utility and individual regret. Extreme criterion values (maximum benefit and minimum cost) were derived to define ideal and nadir reference points. Sites A4–A15 were ranked based on their Qi scores (Table 9), with lower Qi values indicating higher suitability. These rankings were subsequently validated through a sensitivity analysis of standard weights (Section 4.1) and a sensitivity analysis of weight allocation in AHP-EWM (Section 4.2), confirming their robustness under varying weighting scenarios.
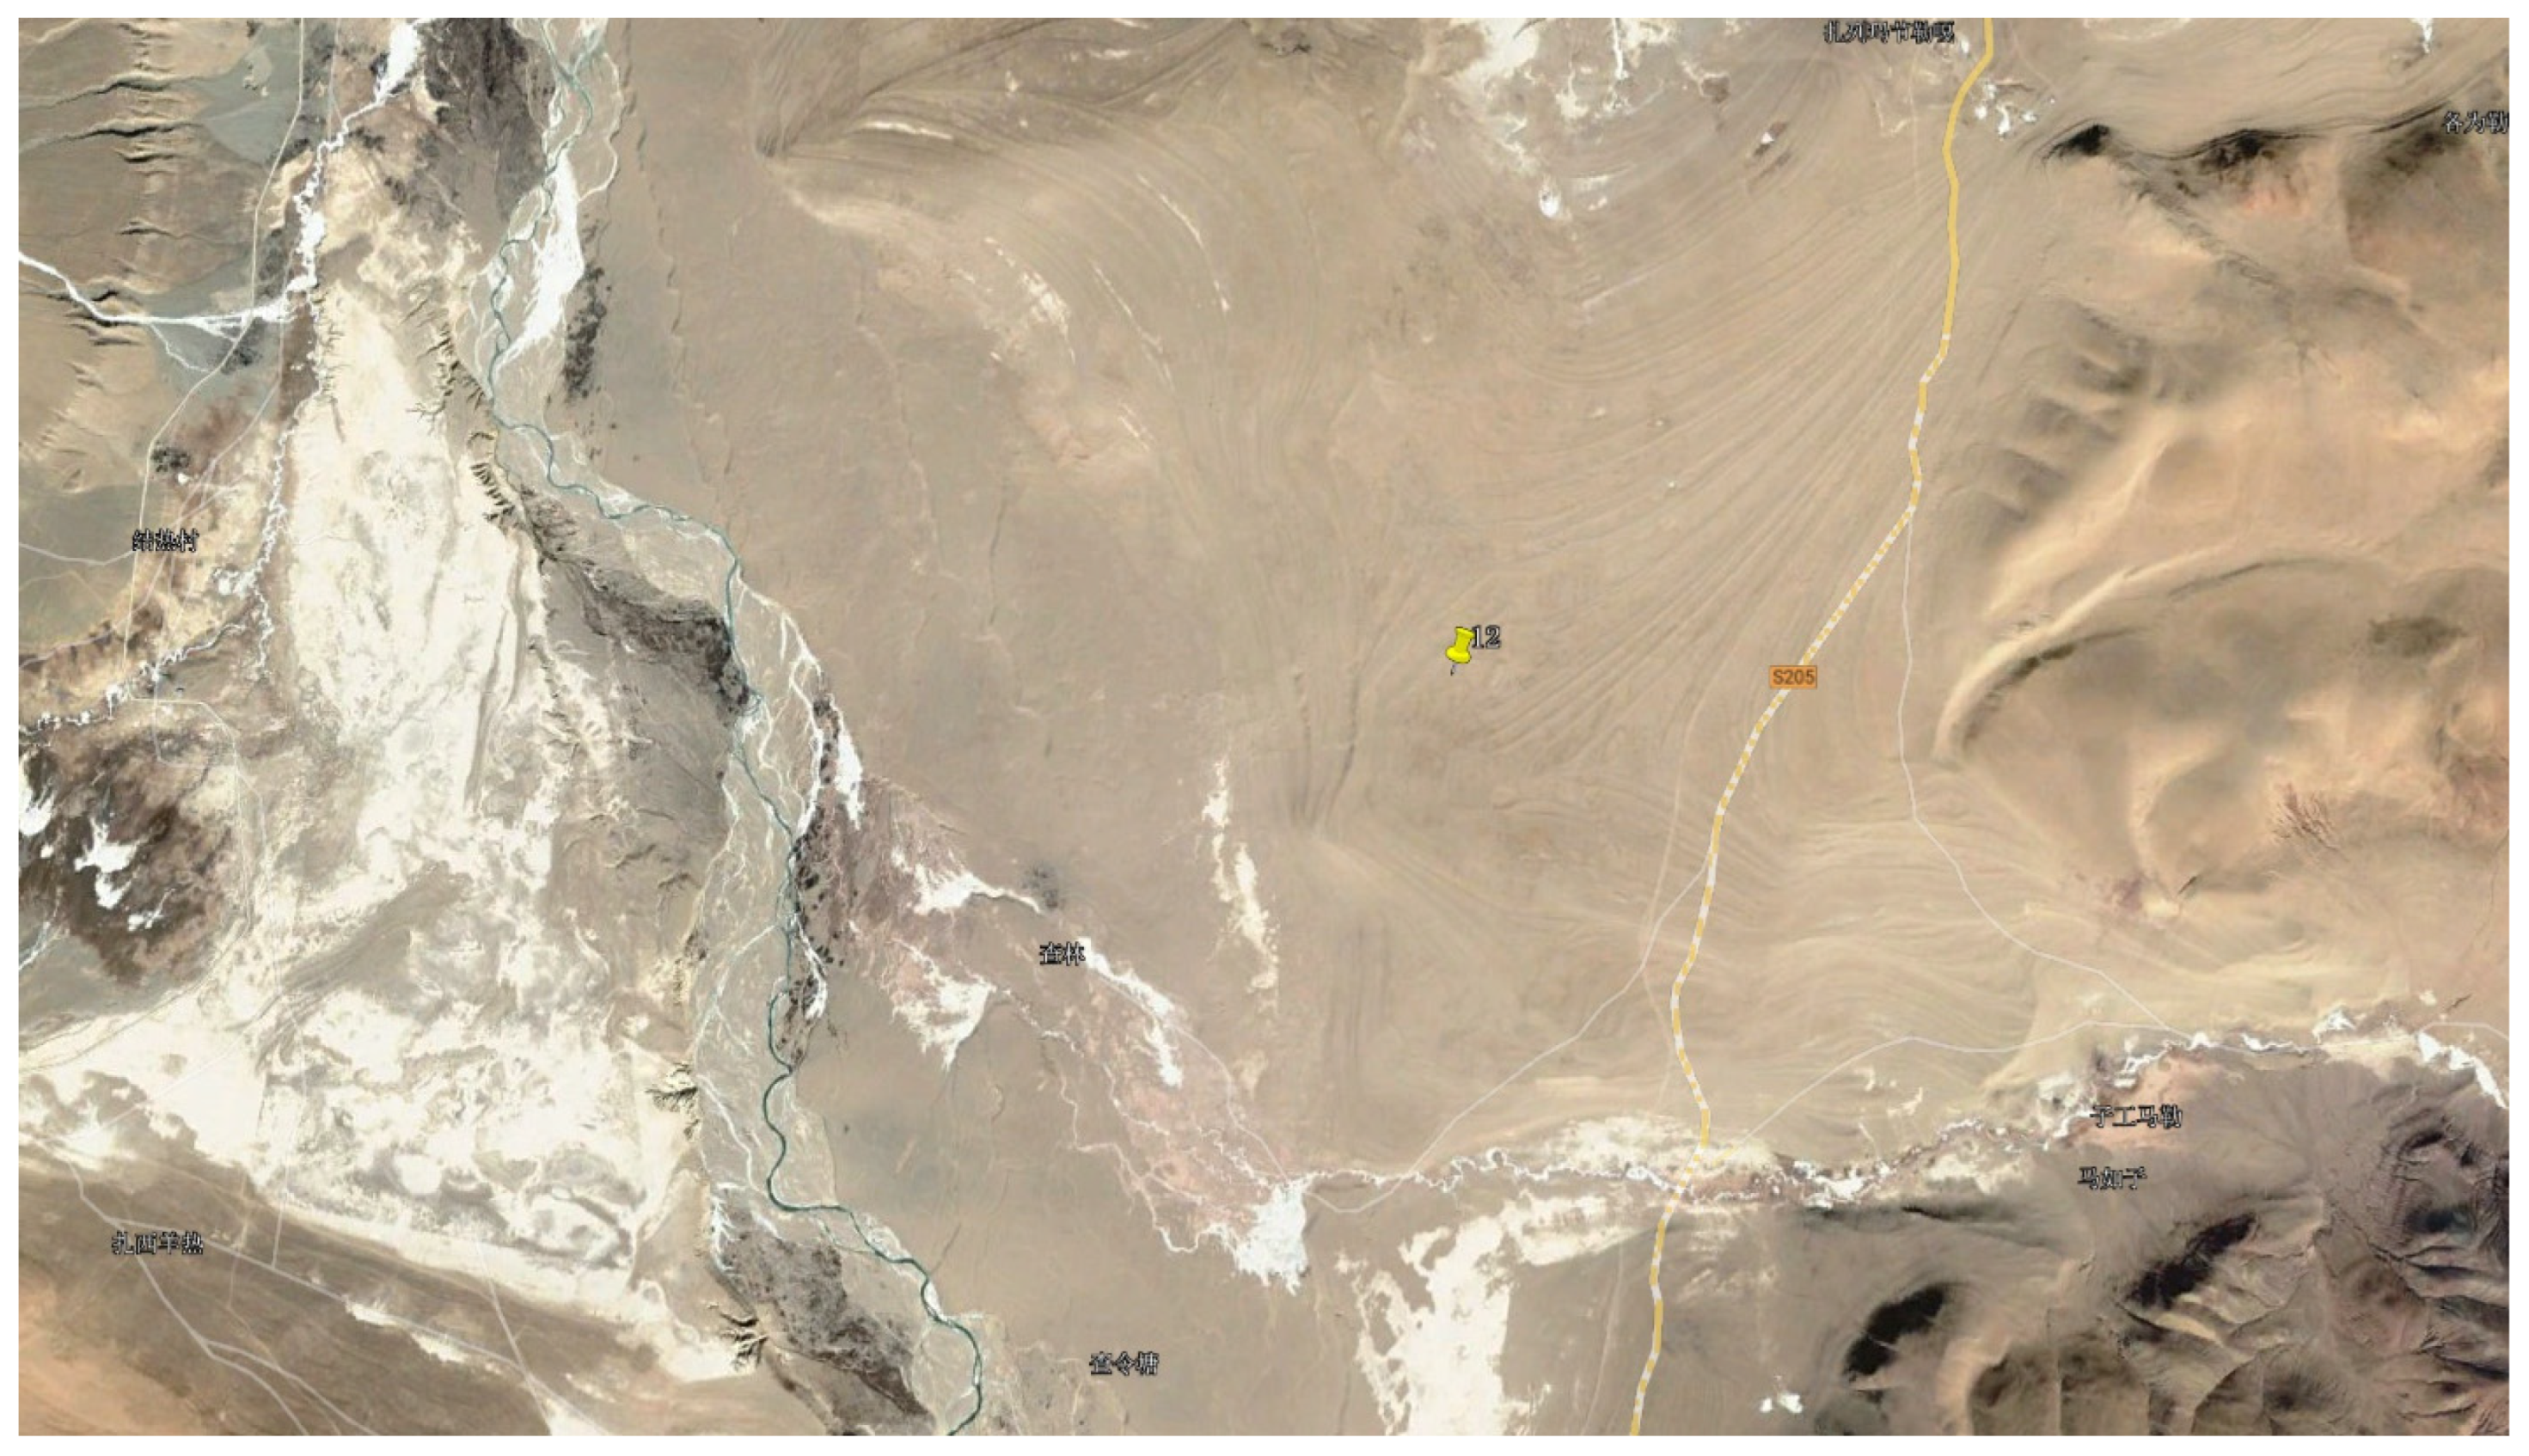
The A12 site was selected as the optimal location using the VIKOR multi-criteria decision method, demonstrating superior solar energy potential, with a DNI of 0.73 kWh/m2/day, and mitigating environmental risks associated with shallow snow accumulation (<1.0 m). Figure 9 presents its geospatial positioning through georeferenced Google Maps.
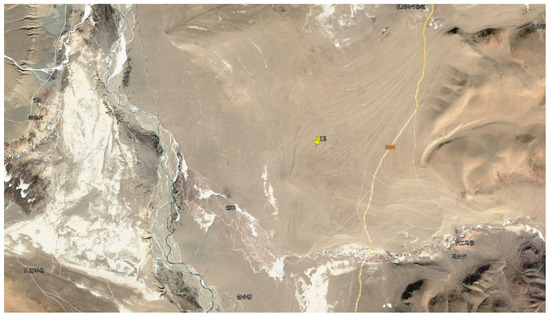
Figure 9.
The geographical context of A12.
4. Discussion and Analysis
4.1. Sensitivity Analyses of Standard Weights
Sensitivity analyses were conducted to assess the impact of varying weights on the outcomes of site selection, thereby ensuring the stability and reliability of the site-selection model. Such analyses explore how modifications in the weights assigned to specific key evaluation criteria influence the ranking of site-selection schemes, aiding in identifying factors that exert a significant influence on the results and guaranteeing an appropriate consideration of important factors. By comparing site-selection results under different weight configurations, a more comprehensive understanding of the influence of diverse decision factors on these outcomes can be attained, ultimately enhancing transparency and credibility within the decision-making process.
In this study, the criteria obtained were classified into three categories according to their weights.
Category 1 contains climatic conditions (C1, C2, and C3) and natural resources (C6 and C7).
Category 2 contains geographical conditions (C4 and C5) and infrastructure and social factors (C8 and C9).
Category 3 contains the special local environment (C10, C11, C12, and C13).
Five scenarios were derived from these classifications, with the percentage adjustments in weights for each scenario determined by the magnitude of the weights. The comprehensive classification and scheme of the sensitivity analysis are presented as follows:
Scenario 1: Using the ultimate weights obtained from the AHP-EWM methodology delineated in Section 3.4.
Scenario 2: Allocating uniform weights to all criteria.
Scenario 3: Enhancing the weights of Category 1 (C1, C2, C3, C6, and C7) by a factor of 50% using AHP-EWM.
Scenario 4: Amplifying the weights of Category 2 (C4, C5, C8, and C9) by a factor of 50% using AHP-EWM.
Scenario 5: Augmenting the weights of Category 3 (C10, C11, C12, and C13) by a factor of 50% based on AHP-EWM.
Adjustments in weight allocations led to variations in rankings. The VIKOR method was applied to rank the CSP candidate sites (A4–A15) under five scenarios, with ranking standard deviations calculated to identify sites with high or low variability. Higher standard deviations reflect greater performance differences across scenarios (Table 10).
Table 10.
Different rankings of the suitable sites for CSP under various scenarios and the standard deviations.
The sensitivity analysis shows that A7 and A9 exhibit smaller standard deviations, indicating higher consistency across scenarios. In contrast, A11 and A15 display larger deviations. A11 ranks consistently in the top three under Scenarios 1–4 but drops to seventh in Scenario 5, revealing its sensitivity to Category 3 criteria (local environmental factors: C10–C13). A15 fluctuates drastically from 3rd (Scenario 5) to 12th (Scenario 2), demonstrating extreme sensitivity to weight changes. Its improved ranking in Scenario 5 highlights its strong performance in local environmental conditions.
As shown in Figure 10, the minimal differences between Scenarios 1 and 3, as well as between Scenarios 2 and 4, suggest limited impacts from weight adjustments in Categories 1 and 2. However, Scenario 5 shows significant ranking shifts, emphasizing the critical influence of Category 3 criteria (the average/maximum wind speed and snow depth).

Figure 10.
Sensitivity analysis diagram of standard weights.
This analysis validates the scientific rationale of the AHP-EWM method and underscores the necessity of localized evaluation systems. The results highlight that, in Tibet’s extreme high-altitude climate, local environmental factors outweigh traditional criteria in CSP site selection.
4.2. Sensitivity Analysis of Weight Allocation in AHP-EWM
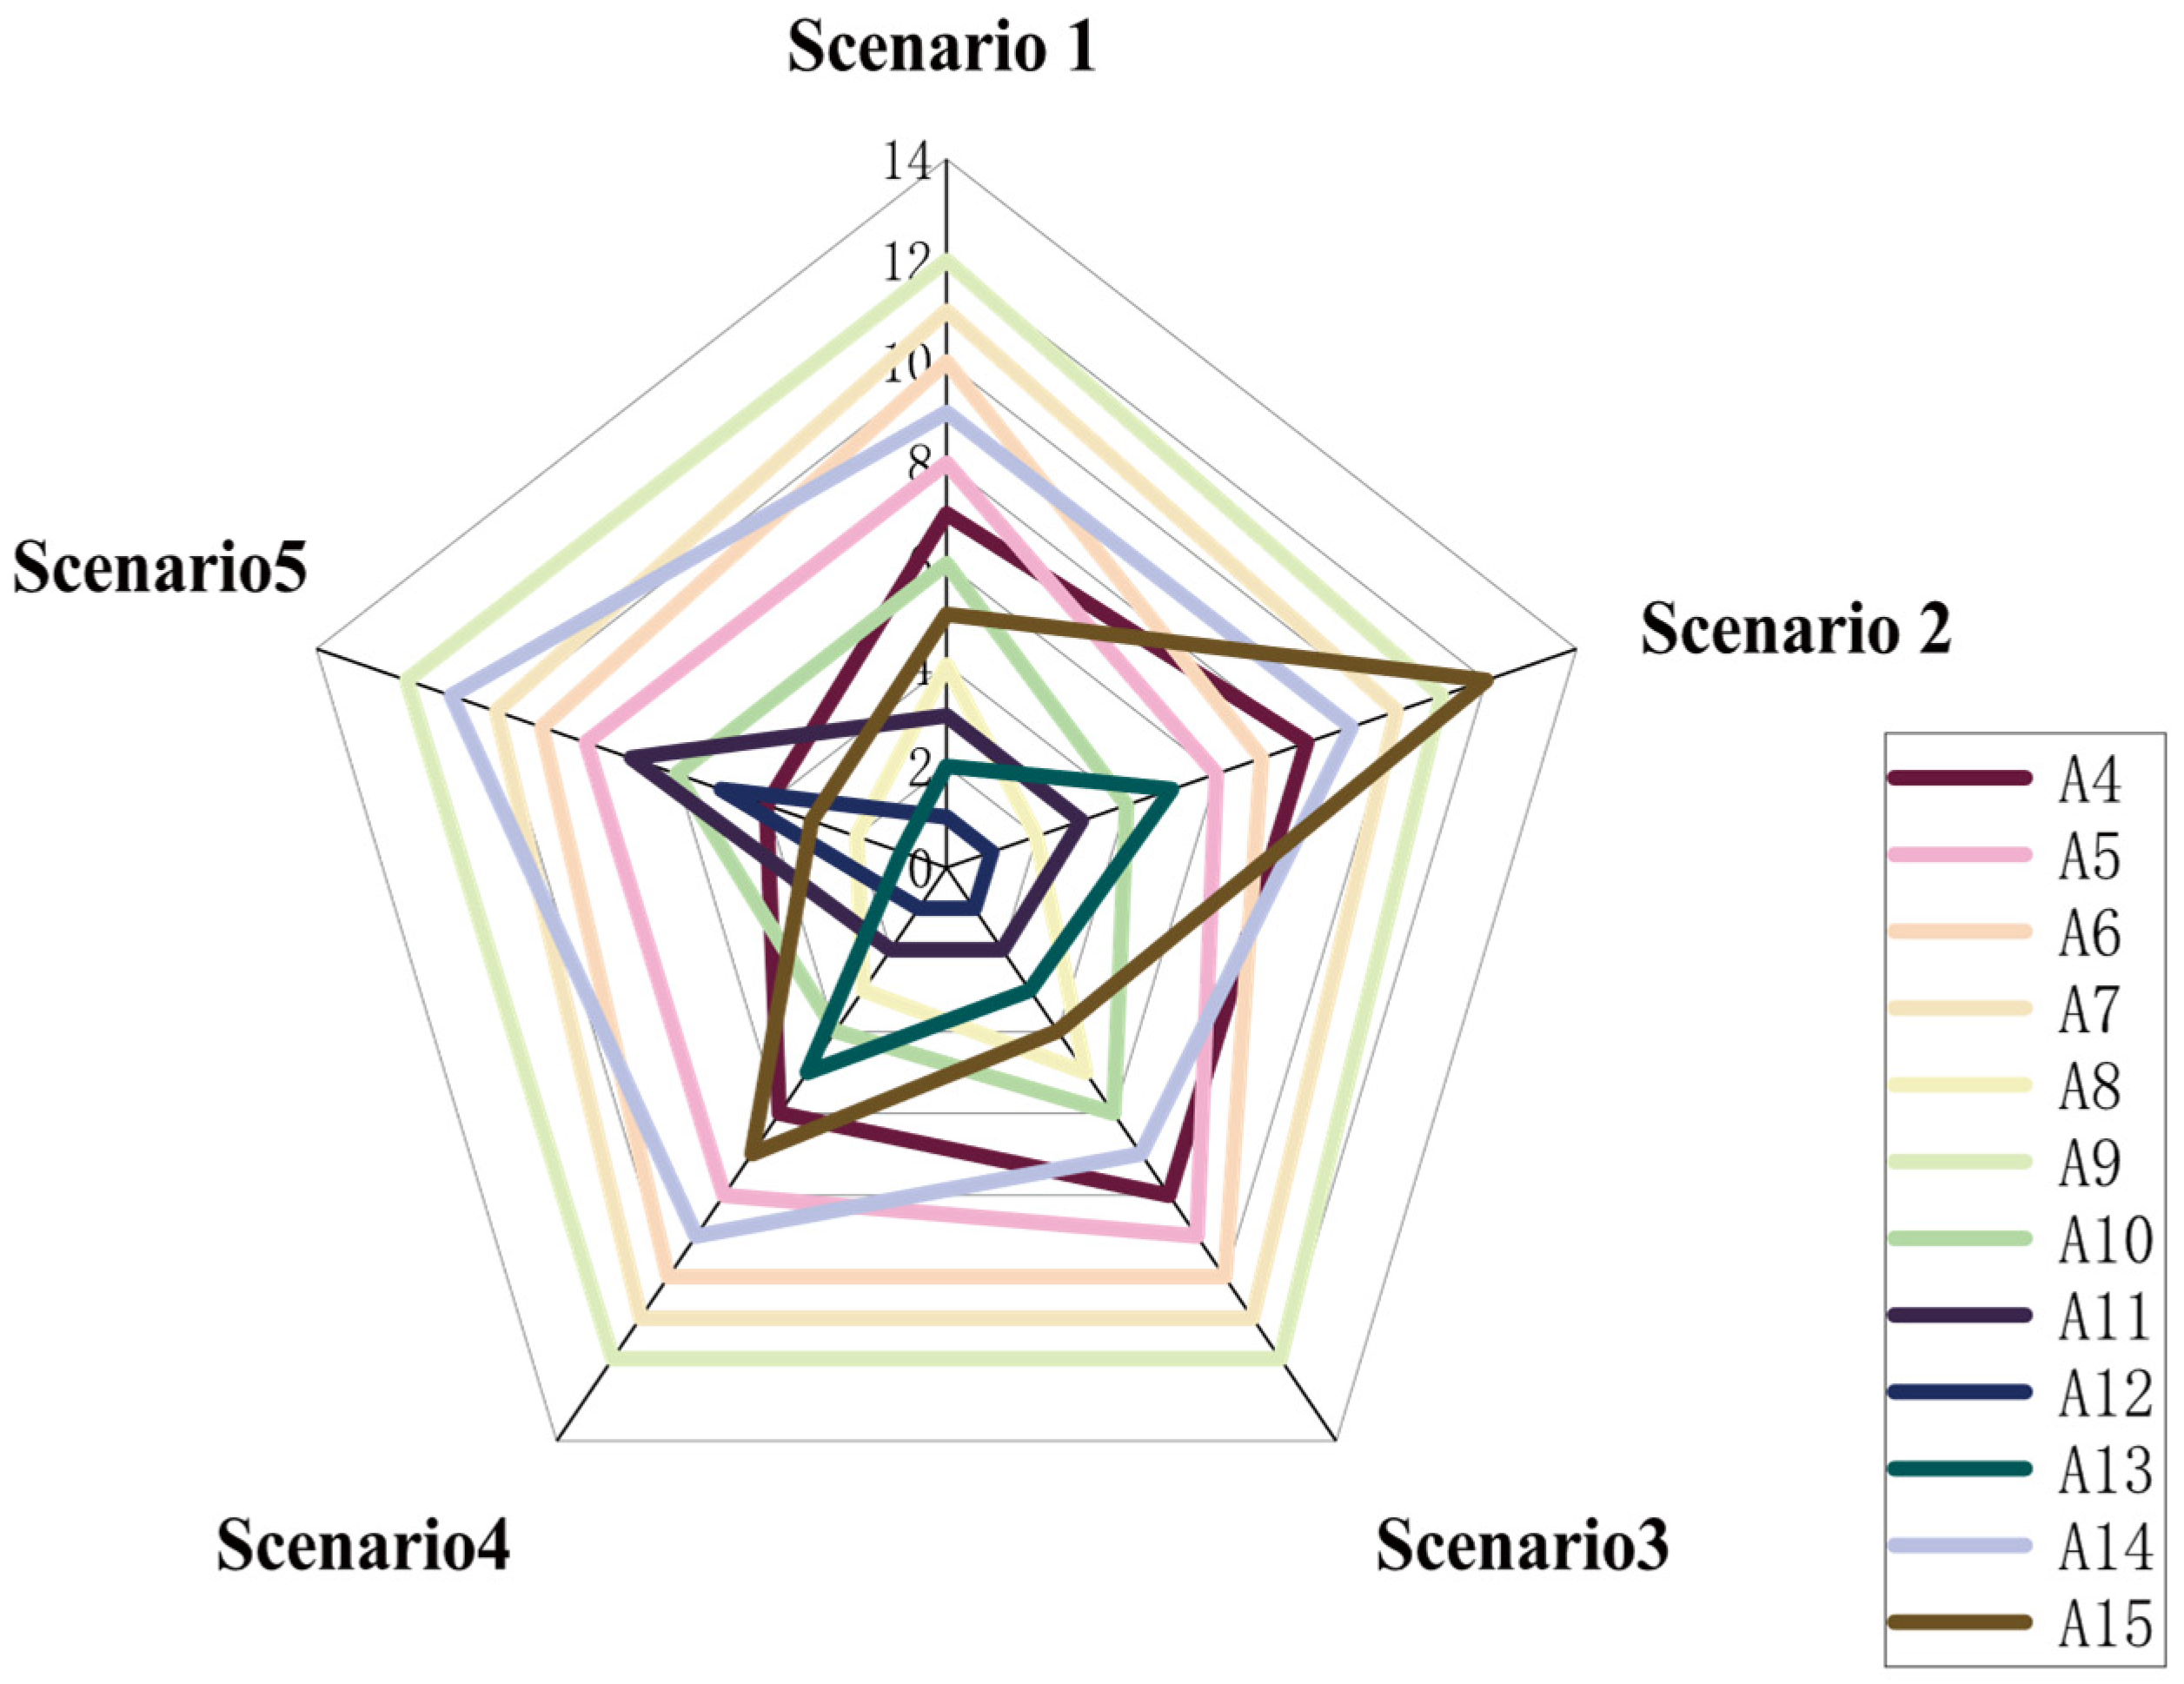
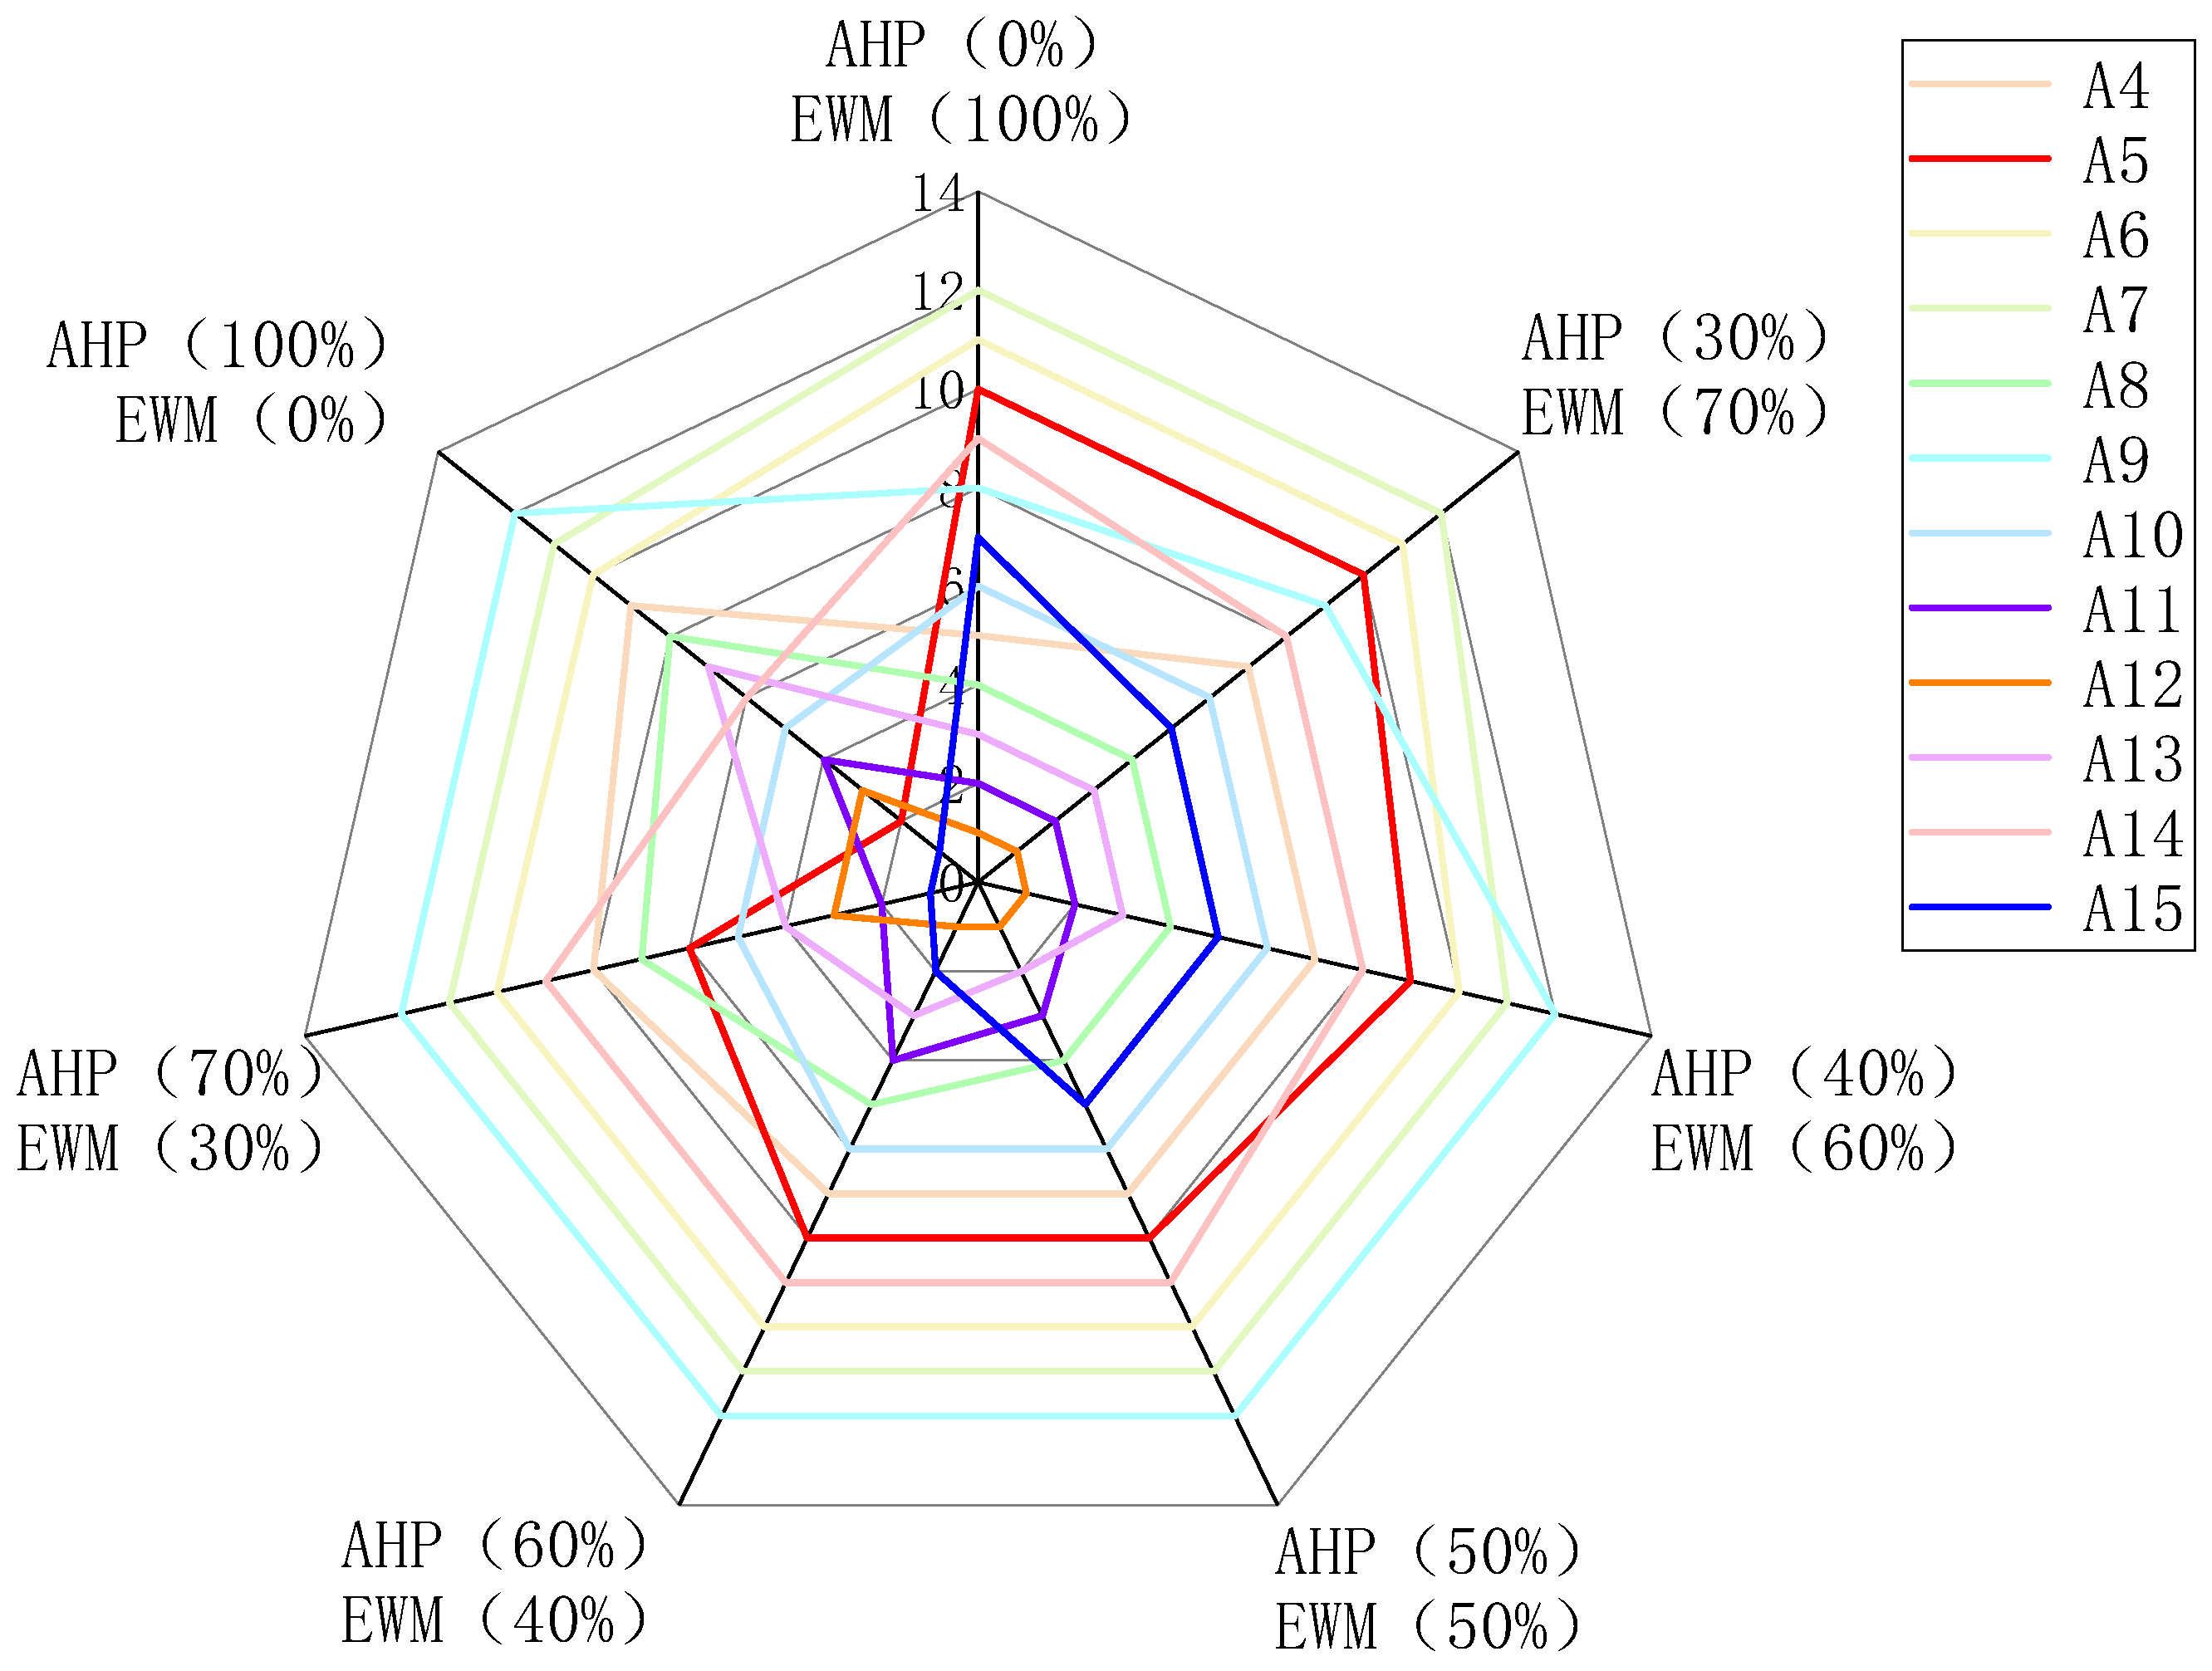
In order to validate the robustness of the hybrid AHP-EWM framework, the allocation ratio between the subjective (AHP) and objective (EWM) weights was systematically adjusted to analyze the impact of different weighting strategies on the ranking of candidate sites. The hybrid weights were calculated using a linear combination formula (Equation (13)), with seven scenarios defined by varying the AHP weight contribution ratio (α = 0%, 30%, 40%, 50%, 60%, 70%, and 100%), covering decision-making ranges from purely data-driven (EWM) to purely expert-driven (AHP). Based on the normalized indicator data (Table 6), the VIKOR method was applied to rank 12 candidate sites (A4–A15), with the results shown in Table 11 and visualized dynamically in a radar chart in Figure 11.
Table 11.
Rankings of suitable locations for constructing concentrated solar power plants under various AHP-EWM weight configurations.
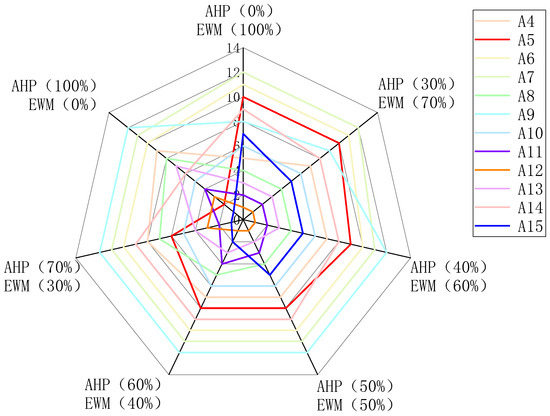
Figure 11.
Sensitivity analysis diagram of weight distribution in AHP-EWM.
The results for the pure EWM (α = 0%) show that environmental risk indicators dominate the ranking logic. Sites A12 (first) and A11 (second) stand out due to their low wind speeds (A12: 3.1 m/s; A11: 3.7 m/s) and minimal snow depths (both < 1.0 mm). Despite having the highest DNI value (0.8), A15 ranks seventh because its maximum snow depth (7.7 mm) approaches the equipment tolerance threshold (10 mm), highlighting EWM’s sensitivity to data heterogeneity.
The results for the pure AHP (α = 100%) reveal the significant influence of solar resource indicators. A15 (first) and A5 (second) are prioritized due to their high DNI (0.8 and 0.77) and sunshine duration (0.96 and 0.96), but A15’s environmental risks are underestimated. A12 drops to third place due to its slightly lower DNI (0.73), reflecting the overemphasis on resource potential in purely subjective methods.
As α increases, the weights of solar resources (C1 and C2) and infrastructure (C8 and C9) rise, pushing high-DNI sites (A15 and A5) upward in the rankings. For example, at α = 70%, A15 ascends to first place due to its outstanding DNI, though its snow-related risks are inadequately reflected. As 1−α increases, environmental heterogeneity (e.g., wind speed and snow depth) and data dispersion dominate the ranking, prioritizing low-risk sites (A12 and A11). At α = 30%, A12 retains first place owing to its low wind speed (3.1 m/s) and minimal snow depth (0.9 mm). In the balanced scenario (α = 50%), A12, A13 (second), and A11 (third) form the top tier, all satisfying a high DNI and controlled environmental risks (maximum snow depth <1.0 mm), demonstrating a balance between resource potential and safety.
- (1)
- Key conflicts and stability analysis:
A15’s “High-Resource–High-Risk” Nature: A15’s DNI (0.8) is the highest among all sites, but its maximum snow depth (7.7 mm) nears the equipment tolerance limits. This contradiction leads to ranking volatility—rising from seventh under the pure EWM to first under the pure AHP. Balancing this requires additional environmental constraints (e.g., snow depth).
- (2)
- Stability of A12 and A11:
A12 consistently ranks within the top two positions for α ≤ 60%, owing to its safe DNI (0.73), average wind speed (3.1 m/s), and snow depth (0.9 mm). A11, despite its environmental robustness (snow depth: 0.9 mm), is overtaken by A13 (DNI: 0.66) at α = 50% due to its slightly lower DNI (0.69), reflecting subtle competition among indicators.
- (3)
- A5’s Solar Dependency:
A high DNI (0.77) secures A5 the second position under the pure AHP, but its average wind speed (3.6 m/s) and snow depth (2.6 mm) cause its ranking to decline in hybrid scenarios (sixth at α = 70%), exposing the limitations of single-indicator dominance.
In conclusion, the hybrid model effectively resolves the “resource–risk” conflict through dynamic balance (α = 50%), prioritizing sites (A12, A13, and A11) that combine a high DNI (>0.66) with low environmental risks (snow depth < 1.0 mm). For high-altitude regions such as Tibet, weight adjustments should align with local conditions—snow-prone zones (α = 30–40% to prioritize low-risk sites) or plains (α = 60–70% to maximize energy output). This methodology is extendable to analogous extreme climate regions, providing a rigorous yet flexible decision-making framework for renewable energy planning.
5. Conclusions and Future Works
CSP development is crucial for China’s energy security, economic transformation, environmental protection, and global competitiveness. In this study, an optimized GIS-MCDM framework is proposed for CSP site selection in Tibet, and the key conclusions are as follows.
- Innovation in the Evaluation System:
For the first time, a site-selection index system tailored to Tibet’s unique plateau environment has been established, comprising three exclusion criteria (protected areas, land use, and DNI) and thirteen evaluation criteria. The inclusion of four special environmental criteria (e.g., wind speed and snow depth) significantly enhances the regional adaptability of the site-selection model. A sensitivity analysis revealed that, in regions such as Tibet, where solar resources are generally abundant, the weighting impact of special environmental criteria on site-selection outcomes surpasses that of traditional solar resource indicators (e.g., DNI and sunshine duration), highlighting the necessity of localized evaluation.
- Validation of Method Integration Effectiveness:
The hybrid AHP-EWM framework demonstrated a superior balance between expert-driven priorities and data-driven objectivity through a sensitivity analysis of weight allocation. The pure AHP (α = 100%) prioritized high-DNI sites such as A15 (DNI = 0.8) but ignored critical snow risks (7.7 mm), while the pure EWM (α = 0%) favored low-risk sites such as A12 (snow depth = 0.9 mm) yet undervalued solar potential. By balancing weights (α = 50%), the hybrid model identified optimal compromises—A12, A13, and A11—which balanced solar resources (DNI = 0.66–0.73), wind resilience (3.1–3.7 m/s), and minimal snow tolerance (<1.0 mm), resolving the “resource–risk” trade-off inherent to Tibet’s extreme environment.
- Impact of Cooling Modes and Optimization Recommendations:
An analysis of dry and wet cooling systems indicated a minimal influence of cooling modes on site rankings due to Tibet’s relatively balanced water resource distribution. However, wet cooling is recommended for priority adoption owing to its cost-effectiveness advantage.
Advancing prior investigations emphasizing the critical role of localized ecosystem parameters in renewable energy siting, a methodologically rigorous framework was established in this study. Building upon foundational work such as Sofia et al.’s [36] systematic evaluation of CSP plant location assessment systems, this study directly supports China’s 2060 carbon neutrality roadmap through spatially sensitive energy transition modeling. The proposed approach delivers actionable insights for sustainable infrastructure development in socio-ecologically vulnerable regions, simultaneously addressing energy security imperatives and low-carbon economic growth objectives.
Future research will focus on expanding three key areas: First, the GIS-MCDM model will be systematically incorporated into grid infrastructure planning tools to evaluate the viability of establishing grid connectivity in remote regions, thereby advancing the strategic long-term integration of CSP within regional energy frameworks. Second, the synergistic planning mechanisms between CSP systems and integrated wind–solar–hydro storage systems will be investigated to improve regional renewable energy utilization efficiency. Third, the proposed framework will be extended to additional extreme climate zones within the Qinghai–Tibet Plateau to validate its methodological generalizability. This study not only provides a robust scientific decision-making tool for CSP development in Tibet, but also establishes a valuable methodological foundation for renewable energy planning in analogous geographical environments.
Author Contributions
M.Y.: methodology, software, validation, visualization, writing—original draft. L.Z.: formal analysis, funding acquisition, supervision, writing—review and editing. Z.C.: data, software. J.W.: data. All authors have read and agreed to the published version of the manuscript.
Funding
This work was supported by Xi’an University of Architecture and Technology—Technical Path and Design Method of Zero-Carbon Building in Solar Energy Enrichment Area; and the “14th Five-Year” National Key Research and Development Plan Project (grant number 2022YFC3802701-01).
Institutional Review Board Statement
Ethical review and approval were waived for this study due to its nature as a non-interventional, anonymous social science study involving expert questionnaires. The study does not involve human participants or animals, collects no personal or sensitive data, and poses no physical or psychological risks. A formal waiver statement has been issued by Xi’an University of Architecture and Technology and submitted to the Editorial Office.
Informed Consent Statement
Informed consent was obtained from all participants involved in this study.
Data Availability Statement
The original contributions presented in this study are included in the article. Further inquiries can be directed to the corresponding author.
Conflicts of Interest
The authors declare no conflicts of interest.
Abbreviations
The following abbreviations are used in this manuscript:
| AHP | Analytic hierarchy process |
| AHP-EWM | Analytic hierarchy process–entropy weight method |
| CI | Consistency index |
| CR | Consistency ratio |
| CSP | Concentrated solar power |
| DEM | Digital elevation model |
| DNI | Direct normal irradiance |
| EWM | Entropy weight method |
| GHI | Global horizontal irradiation |
| GIS | Geographic information system |
| MCDM | Multi-criteria decision-making |
| RI | Random consistency index |
| VIKOR | VlseKriterijumska Optimizacija I Kompromisno Resenje |
References
- Yan, X.; Jiamei, P.; Jiahai, Y.; Guohao, Z. Concentrated solar power: Technology, economy analysis, and policy implications in China. Environ. Sci. Pollut. Res. 2022, 29, 1324–1337. [Google Scholar]
- Ren, L.; Zhao, X.; Yu, X.; Zhang, Y. Cost-benefit evolution for concentrated solar power in China. J. Clean. Prod. 2018, 190, 471–482. [Google Scholar]
- Luceño Sánchez, J.A.; Martín, M.; Macchietto, S. Optimal Concentrated Solar Plant (CSP) location accounting for social and environmental impact: A three-location study in Spain. In Proceedings of the 33rd European Symposium on Computer Aided Process Engineering, Athens, Greece, 18–21 June 2023; pp. 3031–3036. [Google Scholar]
- Guerras, L.S.; Martín, M. On the water footprint in power production: Sustainable design of wet cooling towers. Appl. Energy 2020, 263, 114620. [Google Scholar] [CrossRef]
- Hamiche, A.M.; Stambouli, A.B.; Flazi, S. A review of the water-energy nexus. Renew. Sustain. Energy Rev. 2016, 65, 319–331. [Google Scholar] [CrossRef]
- Heras, J.; Martín, M. Social issues in the energy transition: Effect on the design of the new power system. Appl. Energy 2020, 278, 115654. [Google Scholar] [CrossRef]
- Chu, C.-T.; Hawkes, A.D. A geographic information system-based global variable renewable potential assessment using spatially resolved simulation. Energy 2020, 193, 177–187. [Google Scholar] [CrossRef]
- Dupont, E.; Koppelaar, R.; Jeanmart, H. Global available solar energy under physical and energy return on investment constraints. Appl. Energy 2020, 257, 113968. [Google Scholar] [CrossRef]
- Falter, C.; Scharfenberg, N.; Habersetzer, A. Geographical Potential of Solar Thermochemical Jet Fuel Production. Energies 2020, 13, 802. [Google Scholar] [CrossRef]
- Omer, S.B. Location selection factors of concentrated solar power plant investments. Sustain. Energy Grids Netw. 2020, 22, 100319. [Google Scholar]
- Aqachmar, Z.; Allouhi, A.; Jamil, A.; Gagouch, B.; Kousksou, T. Parabolic trough solar thermal power plant Noor I in Morocco. Energy 2019, 178, 572–584. [Google Scholar] [CrossRef]
- Giamalaki, M.; Tsoutsos, T. Sustainable siting of solar power installations in Mediterranean using a GIS/AHP approach. Renew. Energy 2019, 141, 64–75. [Google Scholar] [CrossRef]
- Kasra, M.; Hossein, K. The potential and deployment viability of concentrated solar power (CSP) in Iran. Energy Strategy Rev. 2019, 24, 358–369. [Google Scholar]
- Yunna, W.; Shuai, G.; Haobo, Z.; Min, G. Decision framework of solar thermal power plant site selection based on linguistic Choquet operator. Appl. Energy 2014, 136, 303–311. [Google Scholar]
- Thomas, W.; Stefan, H. Creating a spatial multi-criteria decision support system for energy related integrated environmental impact assessment. Environ. Impact Assess. Rev. 2015, 52, 2–8. [Google Scholar]
- Keabile, T.; Mulalu, M. Assessment of the concentrated solar power potential in Botswana. Renew. Sustain. Energy Rev. 2019, 109, 294–306. [Google Scholar]
- Aly, A.; Jensen, S.S.; Pedersen, A.B. Solar power potential of Tanzania: Identifying CSP and PV hot spots through a GIS multicriteria decision making analysis. Renew. Energy 2017, 113, 159–175. [Google Scholar] [CrossRef]
- Alisa, Y.; Andrea, D.B.; Bruno, C.; Martin, K.P.; Nicolas, R. GIS-based assessment of photovoltaic (PV) and concentrated solar power (CSP) generation potential in West Africa. Renew. Sustain. Energy Rev. 2018, 81, 2088–2103. [Google Scholar]
- Deshmukh, R.; Wu, G.C.; Callaway, D.S.; Phadke, A. Geospatial and techno-economic analysis of wind and solar resources in India. Renew. Energy 2019, 134, 947–960. [Google Scholar] [CrossRef]
- Ghasemi, G.; Noorollahi, Y.; Alavi, H.; Marzband, M.; Shahbazi, M. Theoretical and technical potential evaluation of solar power generation in Iran. Renew. Energy 2019, 138, 1250–1261. [Google Scholar] [CrossRef]
- Omitaomu, O.A.; Nagendra, S.; Bhaduri, B.L. Mapping suitability areas for concentrated solar power plants using remote sensing data. J. Appl. Remote Sens. 2015, 9, 097697. [Google Scholar] [CrossRef]
- Enjavi-Arsanjani, M.; Hirbodi, K.; Yaghoubi, M. Solar Energy Potential and Performance Assessment of CSP Plants in Different Areas of Iran. Energy Procedia 2015, 69, 2039–2048. [Google Scholar] [CrossRef]
- Köberle, A.; Gernaat, D.E.H.J.; Vuuren, D.P.V. Assessing current and future techno-economic potential of concentrated solar power and photovoltaic electricity generation. Energy 2015, 89, 739–756. [Google Scholar] [CrossRef]
- Abdulrahman, B.; Al-Khayat, M.; Al-Qattan, A.; Rajab, A.; Al-Failkawi, F.; Al-Matar, A.A. Thermal efficiency and performance analysis of 50 MW concentrated solar power plant. Sustain. Energy Technol. Assess. 2024, 65, 103783. [Google Scholar] [CrossRef]
- Jbaihi, O.; Ouchani, F.Z.; Merrouni, A.A.; Cherkaoui, M.; Ghennioui, A.; Maâroufi, M. An AHP-GIS based site suitability analysis for integrating large-scale hybrid CSP+PV plants in Morocco: An approach to address the intermittency of solar energy. J. Clean. Prod. 2022, 369, 133250. [Google Scholar] [CrossRef]
- Mingze, Z.; Xincong, L. Location Evaluation of Multi-station Integration Based on AHP-Entropy Weight Method. In Proceedings of the 2020 IEEE Sustainable Power and Energy Conference (iSPEC), Chengdu, China, 23–25 November 2020. [Google Scholar]
- Yuyang, Z.; Long, C. Evaluation Model of Location Light Pollution Level Based on Analytic Hierarchy Process and Entropy Weight Method. In E3S Web of Conferences, Proceedings of the 5th International Conference on Environmental Prevention and Pollution Control Technol-ogies (EPPCT 2023), Chengdu, China, 21–23 April 2023; EDP Sciences: Ulysse, France, 2023. [Google Scholar]
- Feng, Z.; Li, G.; Wang, W.; Zhang, L.; Xiang, W.; He, X.; Zhang, M.; Wei, N. Emergency logistics centers site selection by multi-criteria decision-making and GIS. Int. J. Disaster Risk Reduct. 2023, 96, 103921. [Google Scholar] [CrossRef]
- Nguyen, X.T.; Ašonja, A.; Do, D.T. Enhancing Handheld Polishing Machine Selection: An Integrated Approach of Marcos Methods and Weight Determination Techniques. Appl. Eng. Lett. J. Eng. Appl. Sci. 2023, 8, 131–138. [Google Scholar] [CrossRef]
- Merrouni, A.A.; Elalaoui, F.E.; Ghennioui, A.; Mezrhab, A.; Mezrhab, A. A GIS-AHP combination for the sites assessment of large-scale CSP plants with dry and wet cooling systems. Case study: Eastern Morocco. Sol. Energy 2018, 166, 2–12. [Google Scholar] [CrossRef]
- Podvezko, V. Application of AHP technique. J. Bus. Econ. Manag. 2009, 10, 181–189. [Google Scholar] [CrossRef]
- Kong, H.; Wang, J.; Cao, J.; Zhou, M.; Fan, Y. Surface Solar Radiation Resource Evaluation of Xizang Region Based on Station Observation and High-Resolution Satellite Dataset. Remote Sens. 2024, 16, 1405. [Google Scholar] [CrossRef]
- Fatima-Zahra, O.; Ouafae, J.; Ahmed, A.M.; Mohammed, M.; Abdellatif, G. Yield analysis and economic assessment for GIS-mapping of large scale solar PV potential and integration in Morocco. Sustain. Energy Technol. Assess. 2021, 47, 101540. [Google Scholar]
- Yafeng, Y.; Hongrui, W.; Yong, Z.; Li, Z. Three-way decision approach for water ecological security evaluation and regulation coupled with VIKOR: A case study in Beijing-Tianjin-Hebei region. J. Clean. Prod. 2022, 379, 134666. [Google Scholar]
- Yusuf, T.İ.; Sevcan, K.; Büşra, B. An integrated AHP-modified VIKOR model for financial performance modeling in retail and wholesale trade companies. Decis. Anal. 2022, 3, 100077. [Google Scholar]
- Sofia, S.; Dimitra, G.V. A systematic review of site-selection procedures of PV and CSP technologies. Energy Rep. 2023, 9, 2947–2979. [Google Scholar]

Disclaimer/Publisher’s Note: The statements, opinions and data contained in all publications are solely those of the individual author(s) and contributor(s) and not of MDPI and/or the editor(s). MDPI and/or the editor(s) disclaim responsibility for any injury to people or property resulting from any ideas, methods, instructions or products referred to in the content. |
© 2025 by the authors. Licensee MDPI, Basel, Switzerland. This article is an open access article distributed under the terms and conditions of the Creative Commons Attribution (CC BY) license (https://creativecommons.org/licenses/by/4.0/).