Abstract
Mixed legume–grass pastures may enhance nitrogen recycling via litter and excreta compared to unfertilized grass monocultures. This study evaluated litter biomass, litter deposition rate, and the chemical and isotopic composition of Urochloa decumbens litter in monoculture and mixed pasture intercropped with Arachis pintoi cv. Belmonte at five planting spacings (0.40, 0.50, 0.60, 0.70, and 0.80 m) in a Ferralsol. Additionally, isotopic analysis of sheep feces under grazing was conducted across the dry season. The experiment was conducted according to a split-plot scheme, with spacings in the plots and the periods or years in the subplots, in a randomized block design, with four replications. Litter biomass was not significantly influenced by planting spacing; however, the litter deposition rate was substantially greater in mixed pastures, reaching up to 77.2 kg ha−1 day−1 in the second year. Isotopic analysis revealed that up to 39% of the litter carbon was derived from C3 plants (Arachis pintoi), while nitrogen concentration ranged from 8.3 g kg−1 in monoculture to 12.9 g kg−1 at 0.40 m spacing. Spatial arrangement was critical for optimizing nutrients dynamic. Narrower planting spacings (0.40–0.50 m) increased the proportion of Arachis pintoi and enhanced litter deposition rates, improving nitrogen inputs and cycling within mixed Urochloa decumbens.
1. Introduction
The adoption of mixed pastures that include leguminous species is a valuable strategy under the current global scenario of nitrogen (N) fertilizer shortage [1,2]. Additionally, this practice enhances organic matter deposition throughout the soil profile, integrating the well-recognized contribution of legumes and species diversity in mitigating the environmental impacts caused by monocultural systems [3].
Leguminous species, through biological nitrogen fixation, can reduce dependence on synthetic N fertilizers, decreasing production costs and mitigating greenhouse gas emissions linked to their manufacture and application [4].
N cycling in pastures can occur through various pathways, including N fertilization, livestock excreta, and litter deposition on the soil surface. Nitrogen fertilization is associated with increased nutrient losses via leaching and volatilization, predominantly as nitrous oxide (N2O) [5,6]. Similarly, animal excreta contribute substantially to nitrogen losses and exhibit a highly heterogeneous spatial distribution across pastures [7].
Conversely, the deposition of plant litter facilitates a more homogeneous redistribution of nitrogen within the system, providing a sustained, though modest, annual input of this essential nutrient [8]. Nevertheless, grass monocultures established under low fertilization regimes are characterized by the production of low-quality litter with inherently slow decomposition rates [9,10].
In diversified systems, the presence of leguminous litter fosters more efficient nutrient cycling and a more homogeneous distribution of nutrients across the pasture ecosystem [11]. This improvement is primarily due to higher nitrogen concentrations, lower C/N ratios, and greater decomposability of legume-derived litter [12].
Given these limitations in monoculture systems, several studies have emphasized the critical role of forage legumes in enhancing litter quality and, consequently, in improving soil health [13,14,15,16]. Legume-derived inputs are known to stimulate microbial activity, increase nutrient turnover, and support soil organic matter accumulation [17].
While there are recognized benefits to increasing the incorporation of legumes in tropical pasture systems, the impact of row spacing in clonal legumes on improving litter quality and deposition remains poorly understood, particularly when compared to the effects of this practice in grass monocultures [18]. Although forage peanut is generally established in rows spaced 0.50 m apart, there is a lack of studies evaluating how variations in row spacing—capable of influencing legume growth, interspecific competition, canopy structure, and soil cover—affect litter deposition and associated factors such as microclimatic conditions, residue distribution, and microbial habitat availability [19,20].
Consequently, this study was designed to compare the existent and deposited litter, litter deposition rates, and the chemical and isotopic characterization of litter in signal grass monoculture and mixed pastures with forage peanut (Arachis pintoi) across different row spacings (0.40, 0.50, 0.60, 0.70, and 0.80 m) during both the dry and rainy seasons over a two-year period.
Additionally, the isotopic characterization of sheep feces under grazing during the dry season of the second year was assessed to infer dietary intake patterns and the indirect contribution of legumes to nutrient cycling. Isotopic techniques offer a powerful approach to tracing nutrient pathways and assessing plant–animal–soil interactions under field conditions [21,22].
We hypothesize that the adoption of mixed pastures enhances the litter deposition rate and improves its chemical composition relative to grass monoculture and that narrower row spacings increase the existent and deposited litter.
2. Materials and Methods
2.1. Site Description
This study was conducted at the Teaching, Research, and Extension Unit in Forages of the Department of Animal Science at the Universidade Federal de Viçosa (UFV) in Viçosa, MG, Brazil. It was carried out in both signal grass (Urochloa decumbens Stapf. R.D. Webster) monoculture and signal grass–forage peanut (Arachis pintoi Krapov. and WC Greg. cv. Belmonte) mixed pastures, both established in December 2013. The pastures were well established and had a good cover, and weeds were manually removed to avoid interference. Meteorological data for the experimental period are presented in Figure 1.
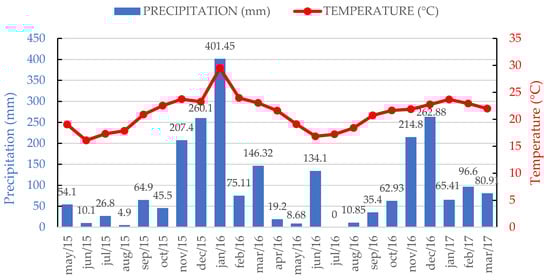
Figure 1.
Weather data recorded during the experimental period at the Department of Agricultural Engineering, Federal University of Viçosa (UFV). Data obtained from the Main Climatic Station of Viçosa. Source: Weather reports for the years 2015, 2016, and 2017. Cumulative precipitation: 673.8 mm in 2015, 1371.7 mm in 2016, and 242.9 mm in early 2017.
The soil in the experimental area is classified as Ferralsol (WRB/FAO). Prior to and during the study, liming and maintenance fertilization were conducted per block, following the recommendations of [23]. In January 2015, based on the results of a soil analysis (Table 1), 100 kg ha−1 of potassium (K) was applied to all blocks. Subsequently, an additional 60 kg ha−1 of phosphorus (P) was applied to block 2, while no phosphate fertilization was applied to the other blocks (1, 3, and 4). In 2016, 40 kg ha−1 of P and 160 kg ha−1 of limestone were applied exclusively to block 2. In 2017, 175 kg ha−1 of limestone was applied to block 2, and 40 kg ha−1 of P was applied to blocks 2 and 4.

Table 1.
Soil chemical properties of the experimental Ferralsol in January 2015 prior to the application of liming and maintenance fertilization.
Signal grass pastures were established in monoculture and mixed with forage peanut under various row spacing conditions. Half of the fertilizer was applied to the bottom of the forage peanut planting furrows, with the other half being applied between the furrow rows during the grass sowing, which took place two months after the legume planting.
Forage peanut (Arachis pintoi Krapov. and WC Greg. Cv. Belmonte) was planted at spacings of 0.40, 0.50, 0.60, 0.70, and 0.80 m, with the average stolon weight used for planting being 7.5 g. Signal grass (Urochloa decumbens Stapf. A. Rich. Cv. Basilisk) was sown at a rate of 3.0 kg ha−1 of pure viable seeds between planting rows.
Grazing was conducted by crossbred sheep (Santa Inês × Dorper) with an average body weight of 50 ± 5 kg using the “mob-stocking” technique [24]. Sheep were placed in paddocks when the average pasture height was 20 cm (pre-grazing). Approximately eight sheep were placed per paddock, grazing until the grass was reduced to an average residual height of 10 cm (post-grazing) after a few hours. Water was provided ad libitum in troughs within each paddock. The procedures for the use and handling of animals in this study were previously approved by the Animal Experimentation Ethics Committee on Studies with Production Animals at Federal University of Viçosa/UFV (protocol 032/2015). All methods were carried out in accordance with relevant guidelines and regulations.
2.2. Treatments
The experiment was conducted according to a split-plot scheme, with spacings in the plots (monoculture, 0.40, 0.50, 0.60, 0.70, and 0.80 m) and the periods (dry and rainy) or years (first and second) in the subplots, in a randomized block design, with four replications, totalizing 24 experimental units (paddocks), each with an area of 72 m2 (6 × 12 m). This study was conducted across both dry and rainy seasons over two years.
Existing litter consisted of material deposited on the soil following the natural senescence and death of plant parts, while deposited litter consisted of material added to the soil during grazing. Litter was assessed over a period of 688 days from 8 May 2015 to 25 March 2017. Grazing cycles were collected during the first dry period (dry/year 1): May 2015 to October 2015 (four grazing cycles); the first rainy season (rainy/year 1): November 2015 to April 2016 (four grazing cycles); the second dry period (dry/year 2): May 2016 to October 2016 (one grazing cycle); and the second rainy season (rainy/year 2): November 2016 to March 2017 (four grazing cycles).
2.3. Existing and Deposited Litter and Litter Deposition Rate
The existing litter (EL) in the pasture was collected before grazing and the deposited litter (DL) was collected in the same local after grazing using metal frames of 0.25 m2. Four litter samples were manually collected per paddock in each grazing cycle. The litter samples were weighed and placed in a forced-air oven at 55 °C for 72 h. After drying, they were weighed again until a constant mass was achieved. At each pre-grazing period, EL was collected at a newly demarcated location within each experimental unit. This procedure was followed consistently throughout the experimental period. The values were expressed in dry matter (DM) and converted to organic matter (OM) to prevent soil contamination interference. The litter deposition rate (LDR) was estimated using the method outlined by [25].
The deposition rate is determined by the litter present in the soil, less its decomposition over a given period, and is calculated as follows: Td = [L2 − L1 + (K × L1 × Δt)]/Δt, where Td = daily deposition rate (g m2 d−1); L2 = deposited litter (g m−2); L1 = existing litter, previously present (g m−2); K = relative decomposition rate (g g−1 d−1); and Δt = number of days corresponding to the resting period of each grazing cycle, which ranged from x to y days. The K value (0.00329 g g−1 d−1) was considered the mean value obtained for the signal grass and forage peanut litter mixture in a previous study [26].
2.4. Sheep Feces Samples
During the last grazing cycle from 8 to 13 May 2017 (dry season), a specific management protocol was implemented for the collection of sheep feces in the 24 paddocks. Two crossbred sheep (Santa Inês × Dorper), with an average body weight of 50 ± 5 kg, were placed in each paddock and allowed to graze for six days, with water provided ad libitum. At the end of the grazing period, feces samples were collected directly from the animals’ rectums to prevent contamination. The samples were placed in labeled plastic bags and dried in a forced-air oven at 55 °C until constant weight was achieved. The procedures for the use and handling of animals in this study were previously approved by the Animal Experimentation Ethics Committee on Studies with Production Animals at Federal University of Viçosa/UFV (protocol 032/2015). All methods were carried out in accordance with relevant guidelines and regulations.
2.5. Chemical Composition of Litter and Isotopic Characterization of Litter and Feces
Chemical analyses of existing litter (EL) samples collected during the grazing cycles of January 2016 (year 1) and February 2017 (year 2) were conducted at the Forage Laboratory of the Animal Science Department, Federal University of Viçosa (UFV), Brazil. Samples were pre-dried at 55 °C for 72 h, ground in a Wiley knife mill (Tecnal, R-TE-650/1, Piracicaba, SP, Brazil) with a 1 mm screen, and stored in plastic containers for subsequent analyses. Determinations included dry matter (DM), organic matter (OM), acid detergent fiber (ADF), and lignin, following methods 930.15, 942.05, and 973.18 of [27]. Acid detergent insoluble nitrogen (ADIN) was estimated by quantifying the N retained in the ADF solution, as described by [28]. Neutral detergent fiber corrected for ash and residual protein (NDFap) was determined following [29], with samples treated with heat-stable α-amylase and corrected for ash content, omitting sodium sulfite.
The concentrations of nitrogen (N), carbon (C), and stable δ13C were determined in both litter and feces samples at the Forage Laboratory of the North Florida Research and Education Center (NFREC), University of Florida, Marianna, USA. Prior to isotope analysis, all samples were finely ground in a ball mill (Mixer Mill MM400, Retsch, Newton, PA, USA) at 25 Hz for 9 min to obtain particle sizes smaller than 100 μm, following the protocol by [30]. Total C and N contents were measured using a CHNS elemental analyzer (Vario Micro Cube; Elementar, Hanau, Germany) based on the Dumas dry combustion method. The δ13C and δ15N values were assessed using an isotope ratio mass spectrometer (IRMS) (IsoPrime 100, Manchester, UK) coupled to the analyzer.
2.6. Statistical Analysis
The experiment was analyzed according to a split-plot scheme, with spacings in the plots (0 (no spacing) 0.40, 0.50, 0.60, 0.70, and 0.80 m) and the periods (dry and rainy) or years (first and second) in the subplots, in a randomized block design, with four replications. Fixed effects included spacing, season and year, and their interactions, while block was considered a random effect. Data were subjected to analysis of variance (ANOVA), and treatment means were compared using the F and Tukey’s test at the 5% probability level, using the SAEG 9.1 [31].
All response variables for the nitrogen, carbon, δ13C, C/N ratio, and the %C3-C in both litter and feces were analyzed using repeated-measures mixed model procedures as implemented in SAS PROC MIXED (SAS/STAT 15.1, SAS Institute Inc., Cary, NC, USA). Treatment, period, year, and all their interactions were considered fixed effects. Block and block x treatment were considered random effects. This experiment had a repeated nature because evaluations were repeated on the same experimental unit over sampling periods during a 2 year period. Repeated measures over time were modeled using a compound symmetry (CS) covariance structure, selected based on the lowest Akaike Information Criterion (AIC). Treatment means were compared using the LSMEANS procedure. Residual diagnostics included visual inspection of residuals versus predicted values and assessment of normality using Q–Q plots and the Shapiro–Wilk test to ensure the assumptions of homoscedasticity and normal distribution were met. The rate constant k in the equation y (%remaining biomass) = 83.25564 × e−0.00329 t [26] was used to determine the litter deposition rate for each experimental unit.
3. Results
3.1. Biomass of Existing and Deposited Litter and Litter Deposition Rate
No significant effect of treatments was observed on the biomass of deposited litter (DL), which averaged 961 kg ha−1. However, there was a significant interaction between season and year (p = 0.001) for existing litter (EL), revealing distinct temporal patterns (Table 2). In year 1, EL was greater during the dry season than in the rainy season. However, in year 2, there was no difference between the rainy season compared to the dry season (Table 2). Notably, EL declined from year 1 to year 2 during the dry season, whereas rainy-season EL remained statistically stable between years.
Table 2.
Biomass of existing litter (EL) and litter deposition rate (LDR) of signal grass in monoculture and mixed with forage peanut across different row spacing (cm) conditions during dry and rainy seasons over two years of study.
A significant interaction between row spacing and year (p = 0.036) was detected for LDR. In year 1, LDR values ranged from 29.5 to 44.0 kg ha−1 d−1 (organic matter), with no significant differences among treatments. In year 2, however, significant differences emerged: mixed systems under 0.40 m and 0.70 m spacings recorded the highest deposition rates (72.6 and 77.2 kg ha−1 d−1, respectively), both significantly surpassing the monoculture (48.1 kg ha−1 d−1) (Table 2). The increase in LDR over time was particularly evident in mixed systems. In contrast, the monoculture and the 0.60 m spacing showed relatively stable LDR values across years.
3.2. Chemical Composition of Litter
Most chemical attributes of EL, including mineral matter (23.6%), organic matter (76.4%), neutral detergent fiber corrected for the presence of ash and residual proteins in the OM base (NDFap) (60.8%), acid detergent fiber based on OM (ADF) (45.8%), insoluble nitrogen in acid detergent based on total nitrogen in OM (ADIN/NT) (26.1%), lignin in OM (20.6%), and lignin/NDF (0.34) or lignin/ADF (0.46) ratios, did not differ significantly among treatments (p > 0.05). However, a significant effect of row spacing was found for ADIN content expressed per unit of organic matter (p = 0.013) (Table 3). The 0.40 m and 0.50 m mixed treatments had the highest ADIN contents, significantly higher than the monoculture. A significant interaction between spacing and year (p = 0.008) was observed for the lignin/ADIN ratio. While most treatments remained stable over time, the 0.60 m spacing exhibited a sharp increase, from 64.40 in year 1 to 145.07 in year 2, exceeding ratios recorded at 0.40, 0.50, and 0.70 m, and indicating potentially more recalcitrant material (Table 3).
Table 3.
Concentrations of acid detergent insoluble nitrogen (ADIN) and the lignin/ADIN ratio of the existing signal grass litter in monoculture and the litter mixed with forage peanut with different spacing conditions over two years.
3.3. Nitrogen Concentration, Carbon/Nitrogen Ratio, Carbon Isotopic Signature, and C3:C4 Contribution in Litter
Row spacing significantly influenced nitrogen concentration (p = 0.001) and the C/N ratio (p = 0.001) in litter (Table 4). The 0.40 m, 0.50 m, and 0.70 m spacings in mixed pastures presented the highest nitrogen concentrations, significantly outperforming the monoculture. Inversely, the C/N ratio was highest in the monoculture (43.85), significantly exceeding values observed in 0.40 m, 0.50 m, and 0.70 m spacings.
Table 4.
Nitrogen concentration (N), carbon/nitrogen (C/N) ratio, isotopic carbon (δ13C), and proportion of C3 and C4 plants in the existing litter of signal grass in monoculture (spacing 0) and the litter mixed with forage peanut with different spacing conditions (cm).
Row spacing significantly affected δ13C values (p = 0.005), with more negative values in mixed pastures indicating a greater proportion of C3 (leguminous) residues (Table 4), while the monoculture had the least negative δ13C value. Consistently, the contribution of C3-derived litter was significantly greater at 0.40 m, 0.50 m, and 0.70 m than in the monoculture.
The effect of different periods on N concentration (p = 0.001) and C/N (p = 0.001) was also observed in the EL. A higher concentration of N (12.0 vs. 9.9 g/kg−1, SEM = 0.01) and a lower C/N ratio (32.2 vs. 39.2, SEM = 9.03) was found in the dry season than in the rainy season.
No effect of treatments on the carbon concentration in the EL was observed (p = 0.392; average of 36.6 g kg−1).
3.4. Carbon Isotopic Signature and C3:C4 Contribution in Sheep Feces
Row spacing exerted significant effects on fecal δ13C (p = 0.001) and on the estimated dietary proportions of C3 (p = 0.001) and C4 (p = 0.001) plants (Table 5).
Table 5.
Isotopic carbon (δ13C) and proportion of C4 and C3 plants in sheep feces under grazing signal grass in monoculture and mixed with forage peanut in different spacing conditions (cm).
The monoculture system (spacing 0) exhibited a δ13C of −16.44‰, with fecal composition dominated by C4 material (92.75%). The 0.50 m spacing showed the most negative δ13C (−18.95‰) and the highest C3 plant contribution (24.68%), statistically differing from all other treatments and indicating enhanced forage intake from forage peanut.
The 0.80 m spacing showed the lowest C3 proportion (8.18%) and a δ13C value (−16.58‰) statistically similar to the monoculture. Intermediate C3 contributions were recorded at 0.40 m (15.74%), 0.60 m (9.72%), and 0.70 m (14.95%). Overall, the 0.50 m spacing emerged as the most efficient in enhancing C3 intake, while the monoculture and 0.80 m treatments-maintained diets were largely based on C4 material (Table 5).
4. Discussion
4.1. Biomass of Existing and Deposited Litter and Litter Deposition Rate (Discussion)
Litter dynamics are strongly influenced by climatic variability and management practices, which directly effects nutrient cycling [32]. In year 1, higher litter biomass during the dry season can be attributed to forage senescence under water stress, combined with reduced decomposition due to low humidity. In contrast, the more balanced litter biomass between seasons in Year 2 suggests that established pastures with legumes are more resilient to climatic fluctuations.
Arachis pintoi inclusion consistently increased litter deposition compared to grass monoculture, playing an important role in enhancing nitrogen input via biological nitrogen fixation (BNF) and improving litter quality [33,34]. Narrower intercropping rows further intensified this effect by improving nutrient availability and nitrogen cycling, which corroborates the results of [19]. This mechanism promotes a positive feedback loop, where greater organic material input enhances soil fertility and system sustainability [35].
Grass monoculture exhibited stable but lower litter deposition, indicating limited capacity for nutrient cycling and greater dependence on external inputs. These results highlight the potential of diversified pastures, especially with optimized spatial arrangements, to improve nutrient cycling and long-term sustainability.
4.2. Chemical Composition of Litter (Discussion)
The highest NIDA-MO values in the narrowest spacings (0.40 and 0.50 m) can be attributed to the higher proportions of forage peanut, which has higher concentrations of nitrogen and lignin relative to signal grass. However, the NIDA/total N and lignin concentrations did not vary between treatments. In the second year of the study, a trend towards lower lignin/NIDA values was observed in those narrowest spacings. The higher lignin/NIDA ratio in the litter reflects the presence of a more recalcitrant component in the material deposited in the soil, which confers a lower rate of degradation and release of nutrients to the soil [36]. However, the higher N concentrations in the litter of mixed pastures with forage peanuts compared to the grass monoculture may cause a compensatory effect, adding a substrate with a higher degradation rate to the soil and contributing to mineralization instead of the immobilization of N by soil microorganisms [37]. Thus, the higher nitrogen concentration in the litter is an effective indicator of superior quality, which may promote greater mineralization and nitrogen input to the system, favoring the growth of forage species and, consequently, improving the diet of grazing animals.
These findings demonstrate that arrangements with narrower spacing promote not only greater litter deposition but also biomass with superior chemical characteristics to sustain nutrient cycling in the pasture ecosystem. On the other hand, grass monoculture depends on external inputs of chemical nitrogen for greater efficiency in nutrient cycling. Thus, the presence of legumes in grazing systems can be considered a beneficial factor as it sustainable improves pasture conditions [38], with the quality of the material deposited in the soil facilitating the return of nitrogen to the system and benefiting the production system as a whole [39].
4.3. Nitrogen Concentration, Carbon/Nitrogen Ratio, Carbon Isotopic Signature, and C3:C4 Contribution in Litter (Discussion)
The nitrogen concentration in the litter was consistently higher in mixed pastures containing forage peanut at spacings of 0.40 m and 0.50 m compared to the signal grass monoculture. This pattern highlights the significant contribution of biological nitrogen fixation by the legume, which enhances nitrogen availability in the litter. Increased nitrogen content improves the litter’s nutritional quality, facilitating microbial decomposition and accelerating nutrient mineralization. These effects play a key role in low-input pasture systems, where soil fertility largely depends on biological nitrogen inputs [40].
The C/N ratio followed an inverse trend, with monoculture litter exhibiting the highest values, indicating lower nitrogen relative to carbon and, consequently, slower decomposition rates. Mixed pastures had significantly lower C/N ratios, particularly at narrower spacings, which favor faster nutrient cycling and organic matter turnover [19]. These differences in litter quality are further supported by isotopic carbon (δ13C) data, which showed more negative values in mixed pastures, consistent with a higher proportion of C3 plant material derived from forage peanut. This shift contrasts with the dominance of C4 signal grass in monoculture, which contributes litter with different biochemical characteristics and slower nutrient release.
The increase in C3 biomass proportion at closer legume spacings enhances litter biochemical diversity, potentially improving soil organic matter dynamics and nutrient retention. In contrast, the monoculture’s litter composition, dominated by C4 grasses with higher C/N ratios and less nitrogen, may limit decomposition and nutrient availability. Therefore, integrating forage peanut into signal grass pastures, especially at optimized spacings, can improve the quality and cycling of organic matter, supporting more sustainable and productive pasture management [18]. These results support the complementary role of C3 and C4 species in mixed pastures, where the presence of Arachis pintoi contributes to higher nitrogen concentration in the total biomass, while U. decumbens maintains high carbon levels. Greater biomass and nutrient accumulation in U. decumbens–A. pintoi mixtures compared to grass monocultures, both in shoots and roots, have also been reported [19].
4.4. Carbon Isotopic Signature and C3:C4 Contribution in Sheep Feces (Discussion)
The isotopic composition of feces indicates that the inclusion of forage peanut in mixed pastures influenced the diet composition of grazing sheep, but with clear dependence on row spacing. The most significant effect was observed at the 0.50 m spacing, where δ13C values were significantly more negative (−18.95‰), reflecting a higher intake of C3 species. This was confirmed by the increased C3 plant contribution in the diet (24.68%), which was statistically higher compared to the monoculture (7.25%).
In contrast, at wider spacings (0.60 and 0.80 m), the δ13C values and the C3/C4 proportions were statistically similar to the monoculture, indicating minimal forage peanut intake and a diet dominated by signal grass (C4). The intermediate spacings (0.40 and 0.70 m) showed a tendency towards greater C3 consumption, but this was not statistically significant.
These results demonstrate that narrow spacing, particularly 0.50 m, is more effective at ensuring greater accessibility and intake of forage peanut by grazing animals. This reflects both the spatial arrangement favoring legume contribution and possibly higher forage peanut biomass availability under this configuration. In contrast, wider spacings reduce the legume contribution to the pasture structure, limiting its presence in the diet.
The dominance of C4 species in monoculture and in the wider spacings confirms the limited capacity of signal grass alone to diversify diet quality. Therefore, adopting mixed pastures with appropriate spatial arrangements not only enhances plant diversity but also effectively modifies the diet composition of grazing animals [41].
However, due to the short period of this study, it is recommended that it be repeated for longer periods to validate its results.
5. Conclusions
Optimizing spatial arrangement through narrower row spacings (0.40–0.50 m) leads to increased legume density, which is directly associated with higher rates of litter deposition, exceeding those observed under wider spacings and in monoculture systems. Better quality litter, richer in nitrogen, contributes to improved soil nutrient return and promotes more efficient nutrient cycling within pasture ecosystems.
Furthermore, the legume–grass mixture significantly influences the dietary intake of grazing sheep. The 0.50 m spacing yielded the most depleted δ13C values and the highest proportion of C3-derived carbon in feces, indicating increased legume consumption. This finding highlights the role of spatial configuration not only in botanical composition but also in animal foraging behavior and nutrient redistribution through excreta.
Overall, we recommend a spatial arrangement with narrower spacing (0.40–0.50 m) between Arachis pintoi intercropped with U. decumbens, which, managed with a pre-grazing height of 20 cm and a post-grazing height of 10 cm, contributes to maximizing ecosystem services and improving the functional sustainability of tropical legume–grass pasture systems under integrated livestock production.
Author Contributions
Conceptualization, K.G.R. and L.L.C.; methodology, K.G.R., L.L.C. and J.C.B.D.J.; software, P.R.C. and J.C.B.D.J.; validation K.G.R., L.L.C. and J.C.B.D.J.; formal analysis, L.L.C.; investigation, L.L.C.; resources, K.G.R. and O.G.P.; data curation, L.L.C.; writing—original draft preparation, L.L.C.; writing—review and editing, K.G.R. and I.A.d.S.; visualization, L.L.C., I.A.d.S., O.G.P., P.R.C., C.A.d.M.G. and J.C.B.D.J.; supervision, K.G.R.; project administration, K.G.R.; funding acquisition, K.G.R. All authors have read and agreed to the published version of the manuscript.
Funding
Conselho Nacional de Desenvolvimento Científico e Tecnológico (CNPq-APQ-454712/2014-6) and the Instituto Nacional de Ciência e Tecnologia-Ciência Animal (INCT-CA-465377-2014/9) for financial support.
Institutional Review Board Statement
Not applicable.
Informed Consent Statement
Not applicable.
Data Availability Statement
The original contributions presented in this study are included in the article. Further inquiries can be directed to the corresponding author.
Acknowledgments
To the CAPES (Coordenação de Aperfeiçoamento de Pessoal de Nível Superior) for awarding a scholarship to the first author, and the CNPq (Conselho Nacional de Desenvolvimento Científico e Tecnológico) for awarding a scholarship to the corresponding author (309784/2019-0).
Conflicts of Interest
The authors declare that there is no conflict of interest.
References
- Pereira, L.E.T.; Herling, V.R.; Tech, A.R.B. Current Scenario and Perspectives for Nitrogen Fertilization Strategies on Tropical Perennial Grass Pastures: A Review. Agronomy 2022, 12, 2079. [Google Scholar] [CrossRef]
- Boddey, R.M.; Casagrande, D.R.; Homem, B.G.C.; Alves, B.J.R. Forage Legumes in Grass Pastures in Tropical Brazil and Likely Impacts on Greenhouse Gas Emissions: A Review. Grass Forage Sci. 2020, 75, 357–371. [Google Scholar] [CrossRef]
- de Sousa, C.E.S.; Júnior, F.P.A.; da Silva Cardoso, A.; Ruggieri, A.C.; van Cleef, F.D.O.S.; de Pádua, F.T.; de Carvalho Almeida, J.C. Effects of Integrating Legumes or Trees on Soil C Stock and Organic Matter Dynamics in Tropical Grasslands. Appl. Soil Ecol. 2024, 202, 105560. [Google Scholar] [CrossRef]
- Abd-Alla, M.H.; Al-Amri, S.M.; El-Enany, A.W.E. Enhancing Rhizobium–Legume Symbiosis and Reducing Nitrogen Fertilizer Use Are Potential Options for Mitigating Climate Change. Agriculture 2023, 13, 2092. [Google Scholar] [CrossRef]
- Borré, J.G.; Ramalho, I.O.; Monteiro, R.C.; dos S. Souza, W.; da C. Soares, S.; de Souza, L.F.; Alves, B.J.R.; Casagrande, D.R.; Homem, B.G.C.; Boddey, R.M.; et al. Legume Integration or N Fertilisation Enhances the N Cycling in the Soil-Plant-Animal System. Nutr. Cycl. Agroecosyst. 2024, 130, 177–196. [Google Scholar] [CrossRef]
- Guimarães, B.C.; de Kássia Gomes, F.; Homem, B.G.C.; de Lima, I.B.G.; Spasiani, P.P.; Boddey, R.M.; Alves, B.J.R.; Casagrande, D.R. Emissions of N2O and NH3 from Cattle Excreta in Grass Pastures Fertilized with N or Mixed with a Forage Legume. Nutr. Cycl. Agroecosyst. 2022, 122, 325–346. [Google Scholar] [CrossRef]
- Carpinelli, S.; Da Fonseca, A.F.; Neto, P.H.W.; Dias, S.H.B.; Da Silveira Pontes, L. Spatial and Temporal Distribution of Cattle Dung and Nutrient Cycling in Integrated Crop-Livestock Systems. Agronomy 2020, 10, 672. [Google Scholar] [CrossRef]
- Silveira, M.L.; Kohmann, M.M. Chapter 3—Maintaining soil fertility and health for sustainable pastures. In Management Strategies for Sustainable Cattle Production in Southern Pastures; Rouquette, M., Aiken, G.E., Eds.; Academic Press: Cambridge, MA, USA, 2020; pp. 35–58. ISBN 978-0-12-814474-9. [Google Scholar]
- Sarabia, L.; Solorio, F.J.; Ramírez, L.; Ayala, A.; Aguilar, C.; Ku, J.; Almeida, C.; Cassador, R.; Alves, B.J.; Boddey, R.M. Improving the Nitrogen Cycling in Livestock Systems through Silvopastoral Systems. In Nutrient Dynamics for Sustainable Crop Production; Springer: Singapore, 2019. [Google Scholar] [CrossRef]
- Kohmann, M.M.; Sollenberger, L.E.; Dubeux, J.C.B.; Silveira, M.L.; Moreno, L.S.B.; da Silva, L.S.; Aryal, P. Nitrogen Fertilization and Proportion of Legume Affect Litter Decomposition and Nutrient Return in Grass Pastures. Crop Sci. 2018, 58, 2138–2148. [Google Scholar] [CrossRef]
- Aljazairi, S.; Ribas, A.; Llurba, R.; Ferrio, J.P.; Voltas, J.; Nogués, S.; Sebastiá, M.T. Sown Diversity Effects on the C and N Cycle and Interactions with Fertilization. Agronomy 2025, 15, 287. [Google Scholar] [CrossRef]
- Erdenebileg, E.; Wang, C.; Yu, W.; Ye, X.; Pan, X.; Huang, Z.; Liu, G.; Cornelissen, J.H.C. Carbon versus Nitrogen Release from Root and Leaf Litter Is Modulated by Litter Position and Plant Functional Type. J. Ecol. 2023, 111, 198–213. [Google Scholar] [CrossRef]
- Kumar, R.; Yadav, M.R.; Arif, M.; Mahala, D.M.; Kumar, D.; Ghasal, P.C.; Yadav, K.C.; Verma, R.K. Multiple Agroecosystem Services of Forage Legumes towards Agriculture Sustainability: An Overview. Indian J. Agric. Sci. 2020, 90, 1367–1377. [Google Scholar] [CrossRef]
- Capstaff, N.M.; Miller, A.J. Improving the Yield and Nutritional Quality of Forage Crops. Front. Plant Sci. 2018, 9, 535. [Google Scholar] [CrossRef]
- Dhakal, D.; Anowarul Islam, M. Grass-Legume Mixtures for Improved Soil Health in Cultivated Agroecosystem. Sustainability 2018, 10, 2718. [Google Scholar] [CrossRef]
- Denardin, L.G.d.O.; Moraes, J.M.A.S.; Tavares, D.S.; Pires, G.C.; Silva, L.S.; Pacheco, L.P.; Wruck, F.J.; Carneiro, M.A.C.; Souza, E.D. Mixed Grass–Legume Pastures in Integrated Crop-Livestock Systems: A Strategy to Improve Soil Health and Soybean Yield in the Brazilian Cerrado. Plant Soil 2025. [Google Scholar] [CrossRef]
- Gou, X.; Reich, P.B.; Qiu, L.; Shao, M.; Wei, G.; Wang, J.; Wei, X. Leguminous Plants Significantly Increase Soil Nitrogen Cycling across Global Climates and Ecosystem Types. Glob. Change Biol. 2023, 29, 4028–4043. [Google Scholar] [CrossRef]
- Dubeux, J.C.B.; Jaramillo, D.M.; Santos, E.R.S.; Garcia, L.; Queiroz, L.M.D.; Trumpp, K.R. Sustainable Intensification of Livestock Systems Using Forage Legumes in the Anthropocene. In Proceedings of the XXV International Grassland Congress (IGC 2023), Covington, KY, USA, 14–19 May 2023. [Google Scholar] [CrossRef]
- dos Anjos, A.J.; de Souza, I.A.; Coutinho, D.N.; da Silveira, T.C.; Macêdo, A.J.d.S.; Alves, W.S.; Pereira, O.G.; Dubeux, J.C.B.; Ribeiro, K.G. Carbon and Nitrogen Accumulation in Roots of Signal Grass–Forage Peanut Intercropped Pastures at Varying Planting Spacings. Agronomy 2024, 14, 3023. [Google Scholar] [CrossRef]
- dos Santos, A.M.G.; Dubeux, J.C.B., Jr.; dos Santos, M.V.F.; de Miranda Costa, S.B.; de Lima Côelho, D.; da Silva Santos, E.R.; Silva, N.G.M.; Oliveira, B.M.M.; Apolinário, V.X.O.; Coelho, J.J. The distance from tree legumes in silvopastoral systems modifies the litter in grass-composed pastures. J. Agric. Sci. 2024, 162, 59–66. [Google Scholar] [CrossRef]
- Scheer, C.; Rütting, T. Use of 15N Tracers to Study Nitrogen Flows in Agro-Ecosystems: Transformation, Losses and Plant Uptake. Nutr. Cycl. Agroecosyst. 2023, 125, 89–93. [Google Scholar] [CrossRef]
- Chalk, P.M. From Production to Consumption: Tracing C, N, and S Dynamics in Brazilian Agroecosystems Using Stable Isotopes. Pesqui. Agropecu. Bras. 2016, 51, 1039–1050. [Google Scholar] [CrossRef]
- Cantarutti, R.B.; Martins, C.E.; Carvalho, M.M.; Fonseca, D.M.; Arruda, M.L.; Vilela, H.; Oliveira, F.T.T. Pastagens. In 5a APROXIMAÇÃO. Recomendações para o uso de Corretivos e Fertilizantes em Minas Gerais; Comissão de Fertilizantes do Solo do Estado de Minas Gerais: Viçosa, Brazil, 1999; 332p. [Google Scholar]
- Allen, V.G.; Batello, C.; Berretta, E.J.; Hodgson, J.; Kothmann, M.; Li, X.; McIvor, J.; Milne, J.; Morris, C.; Peeters, A.; et al. An International Terminology for Grazing Lands and Grazing Animals. Grass Forage Sci. 2011, 66, 2–28. [Google Scholar] [CrossRef]
- Rezende, C.D.P.; Cantarutti, R.B.; Braga, J.M.; Gomide, J.A.; Pereira, J.M.; Ferreira, E.; Tarré, R.; Macedo, R.; Alves, B.J.R.; Urquiaga, S.; et al. Litter Deposition and Disappearance in Brachiaria Pastures in the Atlantic Forest Region of the South of Bahia, Brazil. Nutr. Cycl. Agroecosyst. 1999, 54, 99–112. [Google Scholar] [CrossRef]
- Freitas, C.A.S. Consórcio de Capim-Braquiária e Amendoim Forrageiro: Estabelecimento, Composição e Decomposição da Serrapilheira. Master’s Thesis, Curso de Zootecnia, Universidade Federal de Viçosa, Viçosa, Brazil, 2015; 60p. [Google Scholar]
- AOAC. The Association of Official Analytical Chemists International. Official Methods of Analysis; AOAC Inc.: Washington, DC, USA, 2016; Volume 38. [Google Scholar]
- Licitra, G.; Hernandez, T.M.; Van Soest, P.J. Standardization of Procedures for Nitrogen Fractionation of Ruminant Feeds. Anim. Feed. Sci. Technol. 1996, 57, 347–358. [Google Scholar] [CrossRef]
- Mertens, D.R.; Allen, M.; Carmany, J.; Clegg, J.; Davidowicz, A.; Drouches, M.; Frank, K.; Gambin, D.; Garkie, M.; Gildemeister, B.; et al. Gravimetric Determination of Amylase-Treated Neutral Detergent Fiber in Feeds with Refluxing in Beakers or Crucibles: Collaborative Study. J. AOAC Int. 2002, 85, 1217–1240. [Google Scholar] [CrossRef] [PubMed]
- Michener, R.; Lajtha, K. Stable Isotopes in Ecology and Environmental Science, 2nd ed.; Wiley: Hoboken, NJ, USA, 2008. [Google Scholar] [CrossRef]
- SAEG: Sistema de Análises Estatísticas e Genética, Versão 9.1; Universidade Federal de Viçosa: Viçosa, Brazil, 1997.
- Martínez-García, L.B.; Korthals, G.W.; Brussaard, L.; Mainardi, G.; De Deyn, G.B. Litter Quality Drives Nitrogen Release, and Agricultural Management (Organic vs. Conventional) Drives Carbon Loss during Litter Decomposition in Agro-Ecosystems. Soil Biol. Biochem. 2021, 153, 108115. [Google Scholar] [CrossRef]
- Jena, J.; Maitra, S.; Hossain, A.; Pramanick, B.; Gitari, H.I.; Praharaj, S.; Shankar, T.; Palai, J.B.; Rathore, A.; Mandal, T.K.; et al. Role of Legumes in Cropping Systems for Soil Ecosystem Improvement. In Ecosystem Services: Types, Management and Benefits; Nova Science Publishers, Inc.: Hauppauge, NY, USA, 2022. [Google Scholar]
- Borase, D.N.; Murugeasn, S.; Nath, C.P.; Hazra, K.K.; Singh, S.S.; Kumar, N.; Singh, U.; Praharaj, C.S. Long-Term Impact of Grain Legumes and Nutrient Management Practices on Soil Microbial Activity and Biochemical Properties. Arch. Agron. Soil Sci. 2021, 67, 2015–2032. [Google Scholar] [CrossRef]
- Kebede, E. Contribution, Utilization, and Improvement of Legumes-Driven Biological Nitrogen Fixation in Agricultural Systems. Front. Sustain. Food Syst. 2021, 5, 767998. [Google Scholar] [CrossRef]
- Cotrufo, M.F.; Wallenstein, M.D.; Boot, C.M.; Denef, K.; Paul, E. The Microbial Efficiency-Matrix Stabilization (MEMS) Framework Integrates Plant Litter Decomposition with Soil Organic Matter Stabilization: Do Labile Plant Inputs Form Stable Soil Organic Matter? Glob. Change Biol. 2013, 19, 988–995. [Google Scholar] [CrossRef]
- Chen, Z.X.; Elrys, A.S.; Zhang, H.M.; Tu, X.S.; Wang, J.; Cheng, Y.; Zhang, J.B.; Cai, Z.C. How Does Organic Amendment Affect Soil Microbial Nitrate Immobilization Rate? Soil Biol. Biochem. 2022, 173, 108784. [Google Scholar] [CrossRef]
- Hassen, A.; Talore, D.G.; Tesfamariam, E.H.; Friend, M.A.; Mpanza, T.D.E. Potential Use of Forage-Legume Intercropping Technologies to Adapt to Climate-Change Impacts on Mixed Crop-Livestock Systems in Africa: A Review. Reg. Environ. Change 2017, 17, 1713–1724. [Google Scholar] [CrossRef]
- Mahama, G.Y.; Prasad, P.V.V.; Roozeboom, K.L.; Nippert, J.B.; Rice, C.W. Cover Crops, Fertilizer Nitrogen Rates, and Economic Return of Grain Sorghum. Agron. J. 2016, 108, 1–16. [Google Scholar] [CrossRef]
- Oliveira, C.A.G.d.; Monteiro, E.d.C.; Souza, W.d.S.; Pio, P.V.A.; Machado, J.C.; Alves, B.J.R.; Boddey, R.M.; Urquiaga, S. Contribution of Biological Nitrogen Fixation to the Biomass Productivity of Elephant Grass Grown in Low-Fertility Soil for Energy Purposes. Agronomy 2025, 15, 605. [Google Scholar] [CrossRef]
- Distel, R.A.; Arroquy, J.I.; Lagrange, S.; Villalba, J.J. Designing Diverse Agricultural Pastures for Improving Ruminant Production Systems. Front. Sustain. Food Syst. 2020, 4, 596869. [Google Scholar] [CrossRef]

Disclaimer/Publisher’s Note: The statements, opinions and data contained in all publications are solely those of the individual author(s) and contributor(s) and not of MDPI and/or the editor(s). MDPI and/or the editor(s) disclaim responsibility for any injury to people or property resulting from any ideas, methods, instructions or products referred to in the content. |
© 2025 by the authors. Licensee MDPI, Basel, Switzerland. This article is an open access article distributed under the terms and conditions of the Creative Commons Attribution (CC BY) license (https://creativecommons.org/licenses/by/4.0/).