Article

Spatial Analysis of Network Attention on Tourism Resources for Sustainable Tourism Development in Western Hunan, China: A Multi-Source Data Approach

School of Architecture, Changsha University of Science & Technology, Changsha 410076, China
*
Authors to whom correspondence should be addressed.
Sustainability 2025, 17(2), 744; https://doi.org/10.3390/su17020744
Submission received: 24 November 2024 / Revised: 31 December 2024 / Accepted: 16 January 2025 / Published: 18 January 2025
(This article belongs to the Special Issue Leisure Involvement and Smart Sustainable Tourism)

Abstract

:
Understanding the tourism resource network attention is crucial for promoting sustainable tourism development. This study utilized multi-source data to assess tourism resource network attention in Western Hunan, with GIS spatial analysis and the Geodetector method applied to identify spatial patterns and influencing factors. The results indicate a distinct “dual-core” spatial clustering in network attention, with natural landscape resources centralized in Zhangjiajie and cultural landscape resources in Xiangxi Prefecture. Recreational tourism resources exhibit a similar clustering pattern around these primary and secondary centers. The factors and intensities influencing network attention differ by tourism resource type. For overall tourism resources, natural landscapes, and cultural landscapes, tourist attractions rating (X11) and attraction clustering degree (X12) are the primary drivers, with the strongest impact on natural landscapes (q = 0.648, 0.373), followed by overall resources (q = 0.361, 0.216) and cultural landscapes (q = 0.311, 0.206). In contrast, recreational resources are most influenced by nearby attractions and tourism service capacity (q(X12) = 0.743, q(X15) = 0.620), alongside notable effects from regional factors related to economic development, industrial structure, and tourism development (X1–X9). The interaction between inherent tourism resource characteristics (X10–X15) and regional environmental factors (X1–X9) enhances the driving effect on tourism resource network attention. These findings inform differentiated, resource-specific tourism planning strategies for sustainable development in Western Hunan, promoting balanced regional growth and optimized resource management through a data-driven approach.

Graphical Abstract

1. Introduction

Tourism network attention refers to the digital traces generated by tourists on online platforms as they obtain information, share experiences, and express opinions throughout their travel activities [1,2]. With the advent of 4G and 5G mobile networks, the activity levels of social media and tourism-related websites have reached unprecedented heights. These traces, recorded in the form of interactive events, images, or text, are often regarded as independent and genuine personal views and opinions [3,4,5,6,7]. The rise in online platforms has fundamentally reshaped the tourism landscape, transforming how tourists discover, plan, experience, and share their travels. This digital transformation presents both opportunities and challenges for destinations seeking to attract and engage visitors.
Western Hunan, located in central China, has stunning natural landscapes, diverse cultural heritages, and distinctive recreational activities, with ethnic minorities as the main residents, and tourism as the dominant industry. Tourism resources in western Hunan present a strong local color and have high visibility nationwide through numerous media campaigns. Analyzing the spatial pattern of different types of tourism resources in western Hunan by integrating multi-source data shall help the local government to subdivide and optimize the tourism resources with multi-cluster linkage. Particularly in the context of the ongoing digital transformation of the tourism industry, quantifying the drivers of different types of tourism resources in western Hunan is conducive to scientific and efficient system-based management. Tourist experience value and sustainable development of scenic spots can also be promoted by optimizing spatial patterns and regulating influencing factors.

2. Literature Review

Various forms of internet data contribute to understanding tourism network attention. Search engines like Google and Baidu reveal destination popularity through keyword search volumes, tracked by tools such as Google Trends and the Baidu Index [8,9]. Socially oriented platforms such as Facebook [3,10], TikTok [11], Mafengwo [12,13], Ctrip [14], Qunar, and Dianping [15,16], offer insights into tourist feedback and preferences through reviews, travel blogs, and photos. These diverse forms of internet data, widely recognized for their broad user coverage, large data volume, and rapid dissemination speed, have become critical resources for industry professionals seeking to analyze tourism network attention. Network attention data serves as a vital reference for tourist decision-making and policy-making and is widely applied in fields such as tourism demand forecasting [17,18,19], marketing [20,21], destination planning and management [22,23,24].
Understanding the spatial patterns of network attention and their influencing factors is essential for strategic tourism resource allocation and planning. Past studies have explored this issue at various scales, including national, regional, and urban levels [25,26,27,28], and within specific resource types such as national parks, winter tourism, red cultural tourism, and sports tourism [29,30,31]. These studies have identified a range of influencing factors, including socio-economic conditions [32,33], tourism resource endowments [34,35,36], service capacity [25,37], and transportation service capacity [38,39].
Despite these advances, existing research also has certain limitations: First, network attention data are frequently sourced from a single platform, often search engines like Google Trends or Baidu Index, limiting demographic coverage and data granularity. Integrating search engine data with multi-source information from online review platforms would provide broader coverage of diverse user groups and improve data accuracy [40,41]. Second, different types of tourism resources exhibit distinct characteristics that attract different groups of tourists, yet the spatial patterns and driving factors of their network attention remain insufficiently explored. For instance, studies in Hangzhou’s Xihu District and Qiandongnan Prefecture have identified factors influencing spatial patterns within specific resource types but lack cross-category comparative analyses. These gaps underscore the need for a more comprehensive approach to understanding network attention [42,43].
This study addresses these gaps by integrating multi-source data from search engines, social media, and tourism platforms to analyze the spatial patterns and key influencing factors of network attention for different resource types in Western Hunan. By bridging these research gaps, our work enriches the theoretical framework for tourism resource analysis and provides actionable insights for resource management and planning.

3. Study Area and Methods
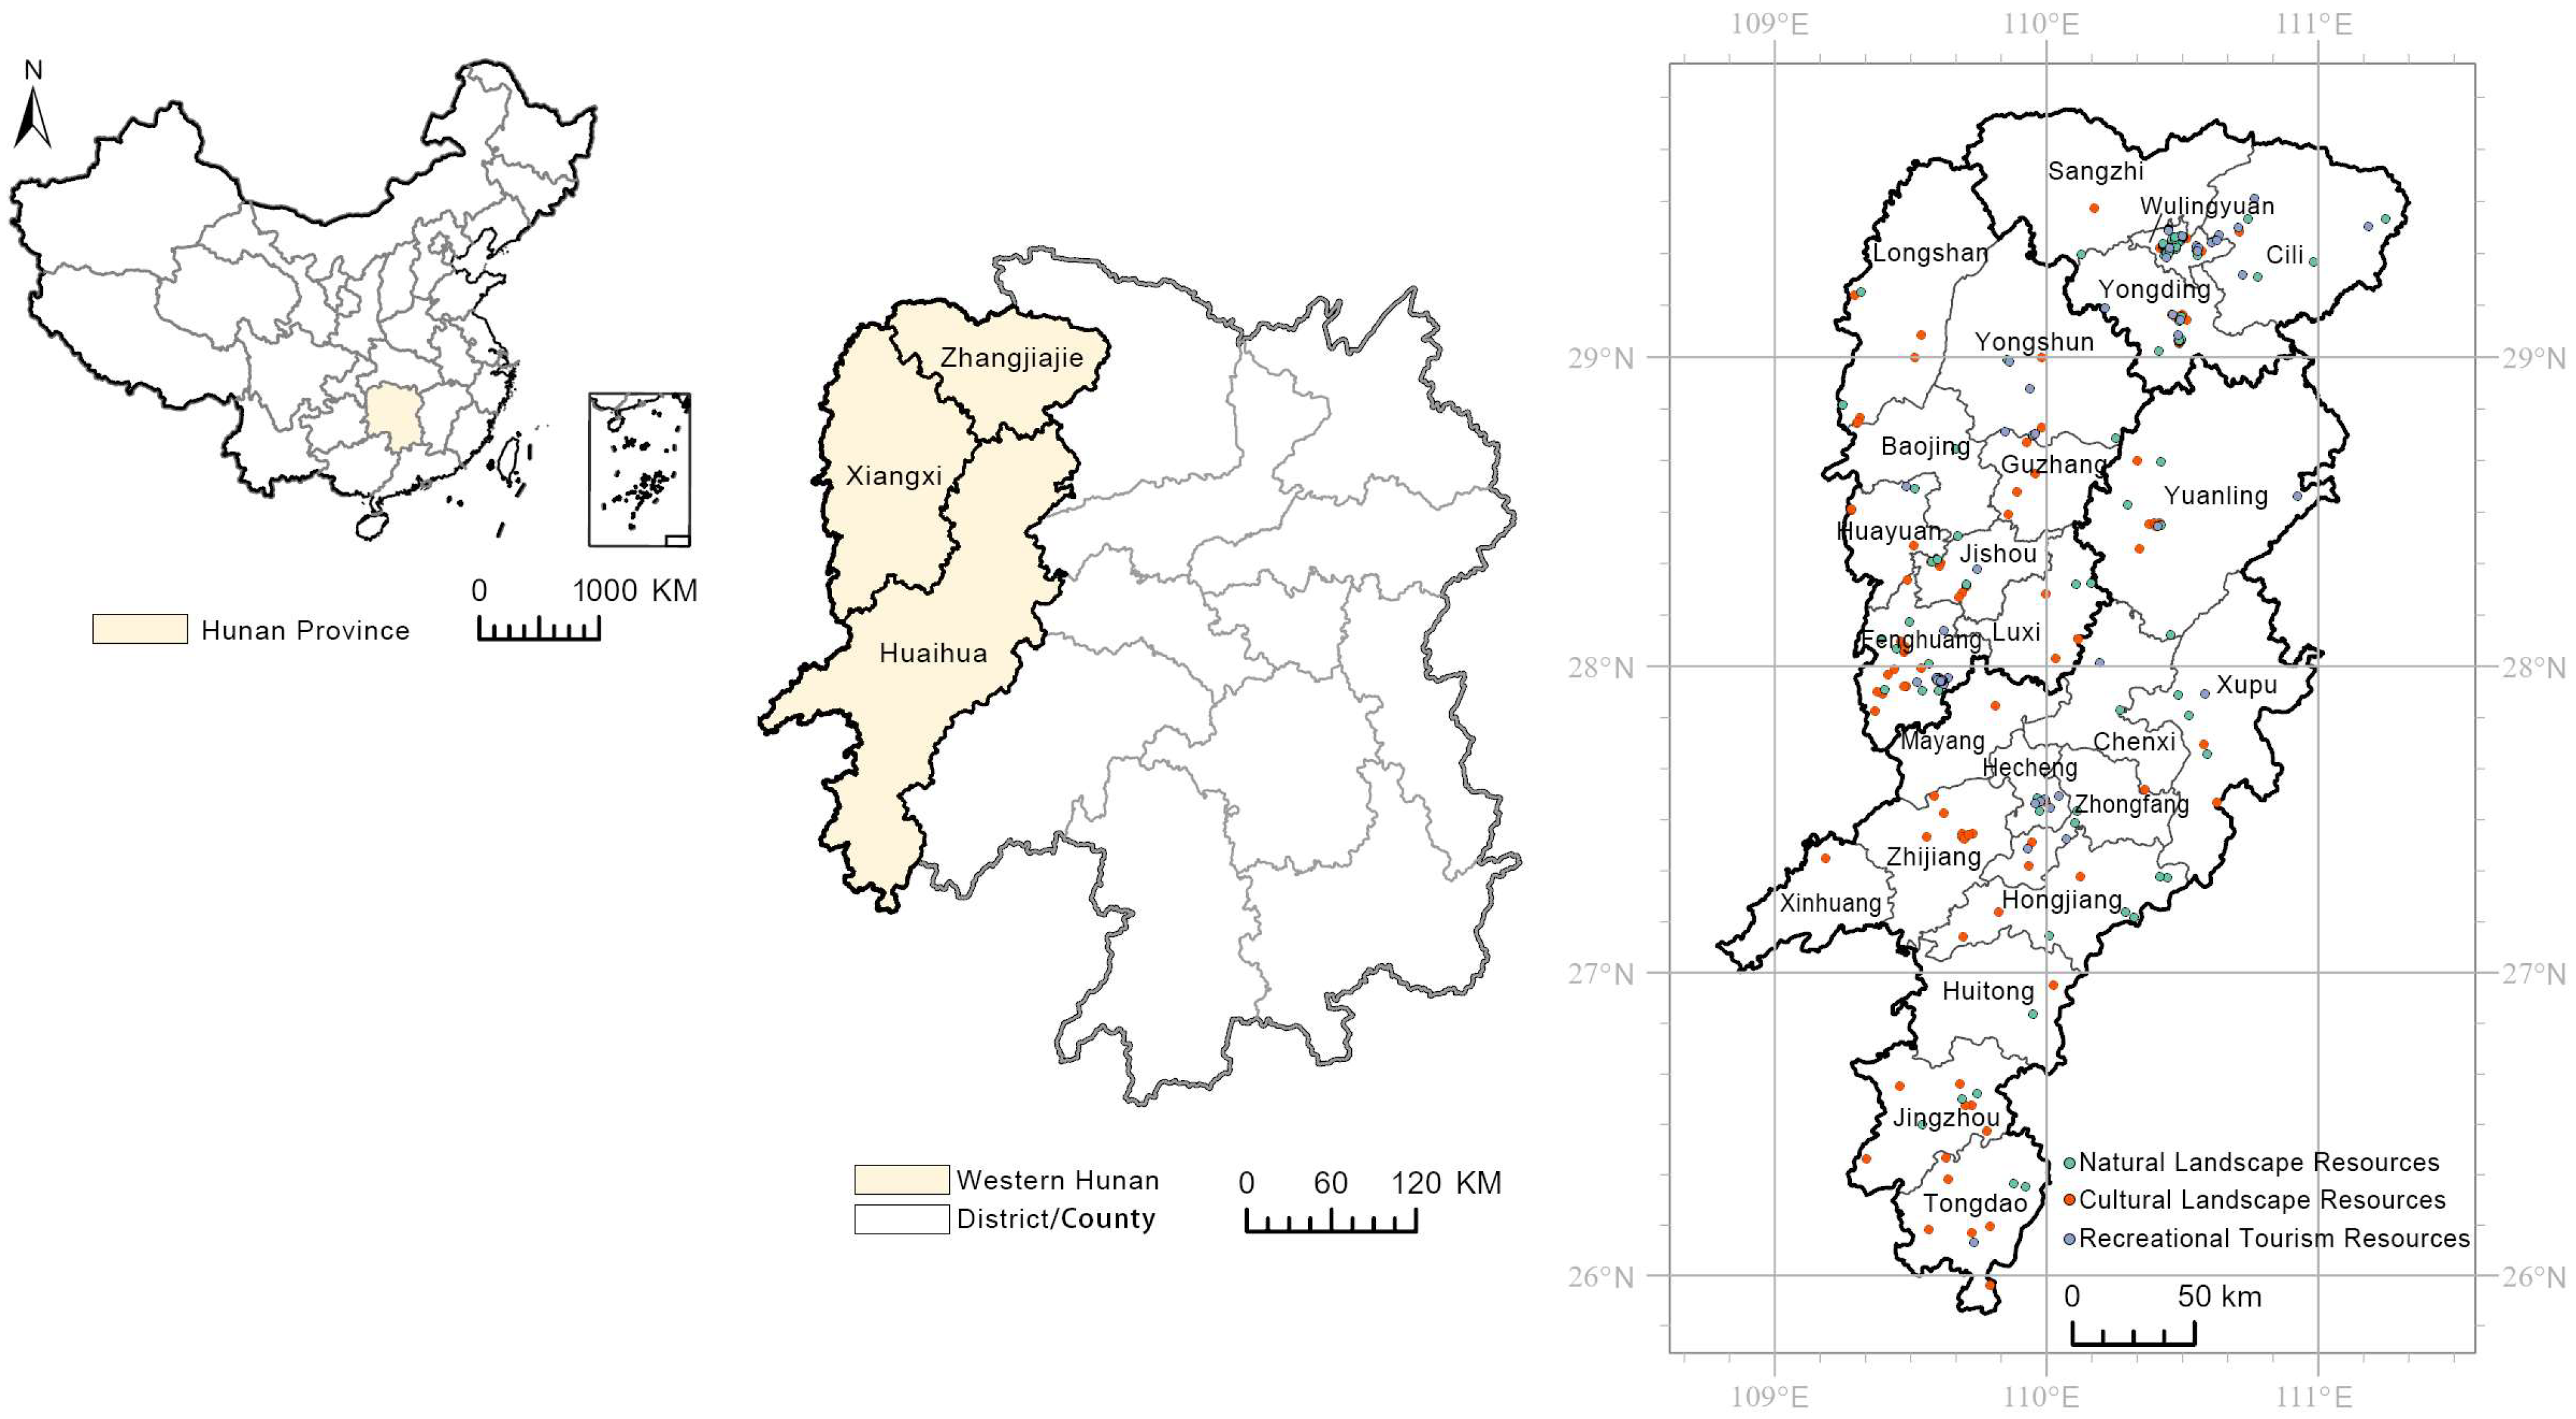
3.1. Research Area

The Western Hunan, located in the western part of Hunan Province, encompasses 24 cities, districts, and counties, including Zhangjiajie City, the Xiangxi Tujia and Miao Autonomous Prefecture (hereafter “Xiangxi Prefecture”), and Huaihua City (Figure 1). Surrounded by the Wuling and Xuefeng mountains and home to the Tujia, Miao, Dong, Yao, and other ethnic minorities, each with distinct cultural characteristics, this area boasts a unique blend of natural landscapes and rich ethnic culture, making it a distinctive eco-cultural tourism destination. Zhangjiajie’s Wulingyuan Scenic Area is renowned for its towering sandstone pillars, rare karst formations, a sea of clouds, and picturesque forests and rivers, earning the title “Paradise on Earth”. In Xiangxi Prefecture, the ancient town of Fenghuang and the Laosi City Ruins showcase the long history and cultural traditions of the Tujia and Miao ethnic groups, where well-preserved ancient architecture complements the rich folk heritage. Huaihua City, a key transportation hub to southwestern China, features cultural and leisure attractions such as the Miao and Dong ethnic customs in Jingzhou and the ancient city of Yuanling. Traditional handicrafts such as wood carving, batik, and local festivals further enhance the region’s unique tourism appeal.
In 2021, the document titled “Opinions on the Advancement of the Western Hunan Development and the Formation of a New Pattern in the New Era” issued by the local government, explicitly stated that Western Hunan should be developed into a pioneer area for high-quality development in poverty alleviation, a cluster for the growth of characteristic and advantageous industries, and an internationally renowned eco-cultural tourism destination. By 2023, Western Hunan received approximately 151.93 million tourists, with tourism revenue up to 169.44 billion Yuan, accounting for 50% of the local GDP. Tourism has become a pillar industry driving the development of the region. There are 136 A-class tourist attractions, including 3 in 5A-class (the highest rating) and 43 in 4A-class, according to the rating categories established by China’s Ministry of Culture and Tourism. Among them, the Wulingyuan and the Laosicheng Ruins have been listed as World Heritage sites by UNESCO and are globally renowned tourist destinations.

3.2. Data Sources and Pre-Processing

3.2.1. Tourism Resource Network Attention

Given the distinct characteristics of various tourism resources, the tourism resources in Western Hunan are classified into three categories based on the Chinese National Standard “Classification, Investigation, and Evaluation of Tourism Resources” (Standard NO: GB/T 18972-2017) and relevant literature [43,44]: natural landscape resources, cultural landscape resources, and recreational tourism resources. The natural landscape resources category encompasses attractions primarily related to natural resources, including diverse geographic environments and wildlife. The cultural landscape resources category refers to attractions rooted in social contexts, including aspects such as daily life, culture and the arts, material production, and ethnic customs. The recreational tourism resources category includes attractions designed to meet traveler’s specific needs for recreation, entertainment, shopping, and related experiences. In total, 351 tourism resource points were selected for this research, with 132 categorized as natural landscape resources, 167 as cultural landscape resources, and 52 as recreational tourism resources. The geographic coordinates of these resource points were collected using the Baidu Maps API.
Considering the comprehensiveness, accuracy, and availability of data, several platforms were selected as sources for assessing tourism resource network attention. Baidu is China’s leading search engine, widely used for information retrieval with broad demographic coverage. TikTok (Chinese version) is the most popular short-video platform with over 600 million daily active users, providing real-time insights into tourist engagement and interest. Among social-oriented platforms, Dianping.com offers extensive, tourism-focused user reviews and ratings. Ctrip.com is one of China’s largest travel booking platforms, featuring reviews of scenic areas. Mafengwo.cn is popular among young travelers, offering travel tips, blogs, and ratings for various tourist attractions. Qunar.com is another major travel booking platform, that provides comprehensive user feedback on tourism activities. These internet data sources encompass search engines, social media, and online review platforms, providing a comprehensive representation of tourism resource network attention. To maximize data coverage and ensure completeness, tourist spots featured on Dianping.com, Ctrip.com, Mafengwo.cn, and Qunar.com with user-shared content were first organized and summarized. Next, corresponding keywords for these tourist spots were searched using Baidu Index and TikTok Topics, with those not included in the results being excluded from further analysis. This process resulted in the collection of basic network attention data for 351 tourism resource points in Western Hunan. Data were collected from each platform from the date of each resource’s initial listing until February 2024. Finally, the data were standardized, weighted, and aggregated to determine the overall network attention for these sites (Table 1).

3.2.2. Influencing Factors

These factors are divided into five categories: economic development, industrial structure, tourism development, tourism endowment, and tourism service capacity. These categories encompass 15 individual factors, selected from regional conditions and the inherent characteristics of tourism resources to explain network attention to tourism resources in Western Hunan. At the regional condition level, economic development is represented by regional economic (X1), urbanization (X2), and residential living standards (X3). The industrial structure is reflected by tertiary sector share (X4) and tertiary sector size (X5). Tourism development is indicated by tourism revenue (X6), tourist arrivals (X7), tourism attractions development (X8), and travel agency development (X9). For inherent characteristics, tourism endowment comprises tourist attraction quality (X10), tourist attraction rating (X11), and attraction clustering degree (X12). Tourism service capacity is measured by catering service capacity (X13), accommodation service capacity (X14), and transportation service capacity (X15). See Table 2 for further details on these indicators.
The statistical data at the regional condition level were sourced from the China Statistical Yearbook 2023. Tourist attraction A-class was obtained from the List of Class A Tourist Attractions in Hunan Province. The number of Points of Interest (POIs) for neighboring attractions, catering services, and accommodation services was acquired from the Gaode Map open platform, while road network data were retrieved from the OpenStreetMap website. The POI data collection was completed in February 2024.

3.3. Methods

3.3.1. Entropy Weight Method

To reduce potential errors from subjectivity, the entropy weight method was employed to assign weights to each indicator based on the degree of information entropy, a measure of data disorder [45]. Higher entropy, indicative of greater data variability, implies higher information content and thus a greater assigned weight. Conversely, lower entropy suggests less variability and lower information content. The information entropy ej is calculated using the following formula:
e j = 1 ln ( n ) i = 1 n p i j × ln p i j
where pij represents the standardized value of the i-th sample for the j-th indicator, interpreted as a probability, and n is the number of samples. The term 1/ln(n) normalizes the entropy values to the range [0, 1]. The weight for the j-th indicator wj was calculated by normalizing the differentiation degree (1—ej, ensuring that indicators with higher information content have a greater influence on the overall evaluation. Calculated weights are presented in Table 3, which were computed using Python 3.13.

3.3.2. Indicators of Spatial Association

Spatial autocorrelation analysis in ArcGIS Pro (version 3.0.2) was employed to examine the spatial distribution patterns of network attention, assessing the degree to which values at one location are similar to neighboring locations. This analysis utilizes both global and local indicators. Global indicators describe overall spatial association across the dataset, while Local Indicators of Spatial Association (LISA) identify local clusters and spatial outliers by examining relationships between each spatial unit and its neighbors [46].
In this study, Global Moran’s I was used as the global indicator, measuring the overall degree of spatial clustering or dispersion. It is defined as follows:
I = n i = 1 n j = 1 n w i j ( x i x ¯ ) ( x j x ¯ ) i = 1 n j = 1 n w i j ( x i x ¯ ) 2
where n is the number of scenic spots, xi and xj are the network attention for the i-th and j-th samples, respectively; x ¯ denotes the average network attention, and wij is the distance-based spatial weight between scenic spots i and j. Global Moran’s I ranges from −1 to 1: −1 < I < 0 indicates dispersion, I = 0 indicates a random distribution, and 0 < I < 1 reflects clustering.
While Global Moran’s I provides an overall picture of spatial clustering, LISA was used to identify specific locations of clusters and spatial outliers [47]. Local Moran’s Ii is defined as:
I i = n ( x i x ¯ ) j = 1 n w i j ( x j x ¯ ) i = 1 n ( x i x ¯ ) 2
where n, xi, xj and x ¯ are defined as above, and wij is the adjacency spatial weight between locations i and j. The Local Moran’s I statistic indicates that when Ii > 0 indicates positive spatial correlation (similarity and clustering), while Ii < 0 indicates negative spatial autocorrelation (dissimilarity).
Based on Ii, four spatial clustering patterns of tourism resource network attention were identified:
  • High-High (H-H) Clusters: These represent spatial clusters of high network attention, indicating hotspots.
  • Low-Low (L-L) Clusters: These represent spatial clusters of low network attention, indicating cold spots.
  • High-Low (H-L) Outliers: These indicate locations with high network attention surrounded by areas of low network attention.
  • Low-High (L-H) Outliers: These indicate locations with low network attention surrounded by areas of high network attention.
Locations, where local spatial correlation was not statistically significant (i.e., where the null hypothesis was not rejected), were considered to exhibit no significant spatial clustering.

3.3.3. Kernel Density Analysis

Kernel density analysis, conducted using ArcGIS Pro (version 3.0.2), was utilized to describe the spatial clustering characteristics of network attention. This method estimates the density of network attention across a given area, generating a smooth surface that visualizes the spatial concentration of network attention. Higher density values correspond to areas with greater clustering of network attention, while lower density values indicate areas with less concentration. The kernel density estimate is calculated as follows:
f ( x ) = 1 n h i = 1 n k x x i h
where f(x) represents the kernel density estimate of network attention for tourist spots, n is the number of scenic spots, x − xi is the distance between location x to the sample point xi, and h is the bandwidth of the search radius that controls the smoothness of the resulting density surface, k represents the Gaussian kernel function, which weights the contribution of each sample point xi based on its distance from location x. Visualization of the resulting density surface allows for the identification of areas with high and low concentrations of online tourism attention.

3.3.4. Geodetector

A geodetector was a set of Excel-based tools used for identify factors influencing the spatial heterogeneity of network attention [48]. Within this framework, the factor detector assesses the explanatory power of a geographic variable X on the spatial variation in a dependent variable Y (network attention) by comparing the within-strata variance of Y to the total variance of Y. The underlying principle is that a stronger influence of X on the spatial distribution of Y leads to a smaller within-strata variance of Y relative to the total variance of Y. The strength of factor X’s influence is quantified by the q-statistic [48]:
q = 1 h = 1 L σ h 2 N h σ 2 N
where L represents the number of factor categories; N and σ2 denote the total sample size and variance of tourism resource sites, respectively; Nh and σh2 represent the sample size and variance of network attention in the h-th category; and q indicates the strength of factor X’s influence on the spatial distribution of network attention. The q value ranges from 0 to 1, where values closer to 1 indicate a stronger explanatory power of factor X, and values closer to 0 indicate a weaker influence.
The interaction detection method, implemented within Geodetector, aims to reveal nonlinear or complex interrelationships resulting from the interaction of multiple factors, thereby facilitating a more profound understanding of the research. Specifically, the interaction detector assesses the combined effect of two factors (X1 and X2) on network attention by comparing the q-values of the individual factors (q(X1) and q(X2)) and their interaction (q(X1∩X2))). Interaction types are categorized based on these comparisons, with criteria detailed in Table 4.

4. Results

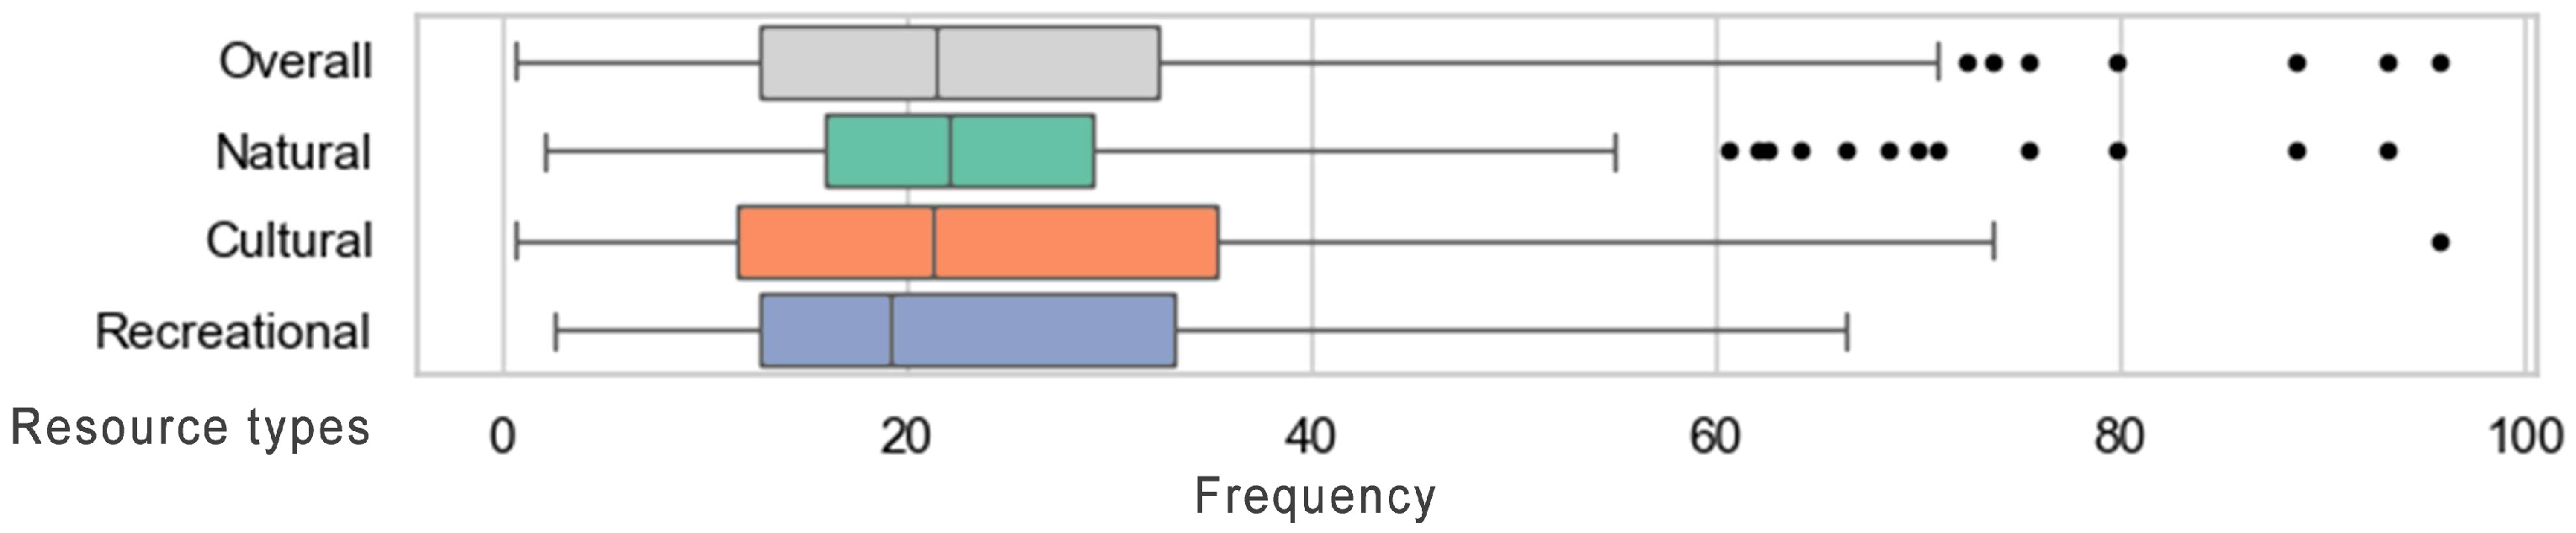
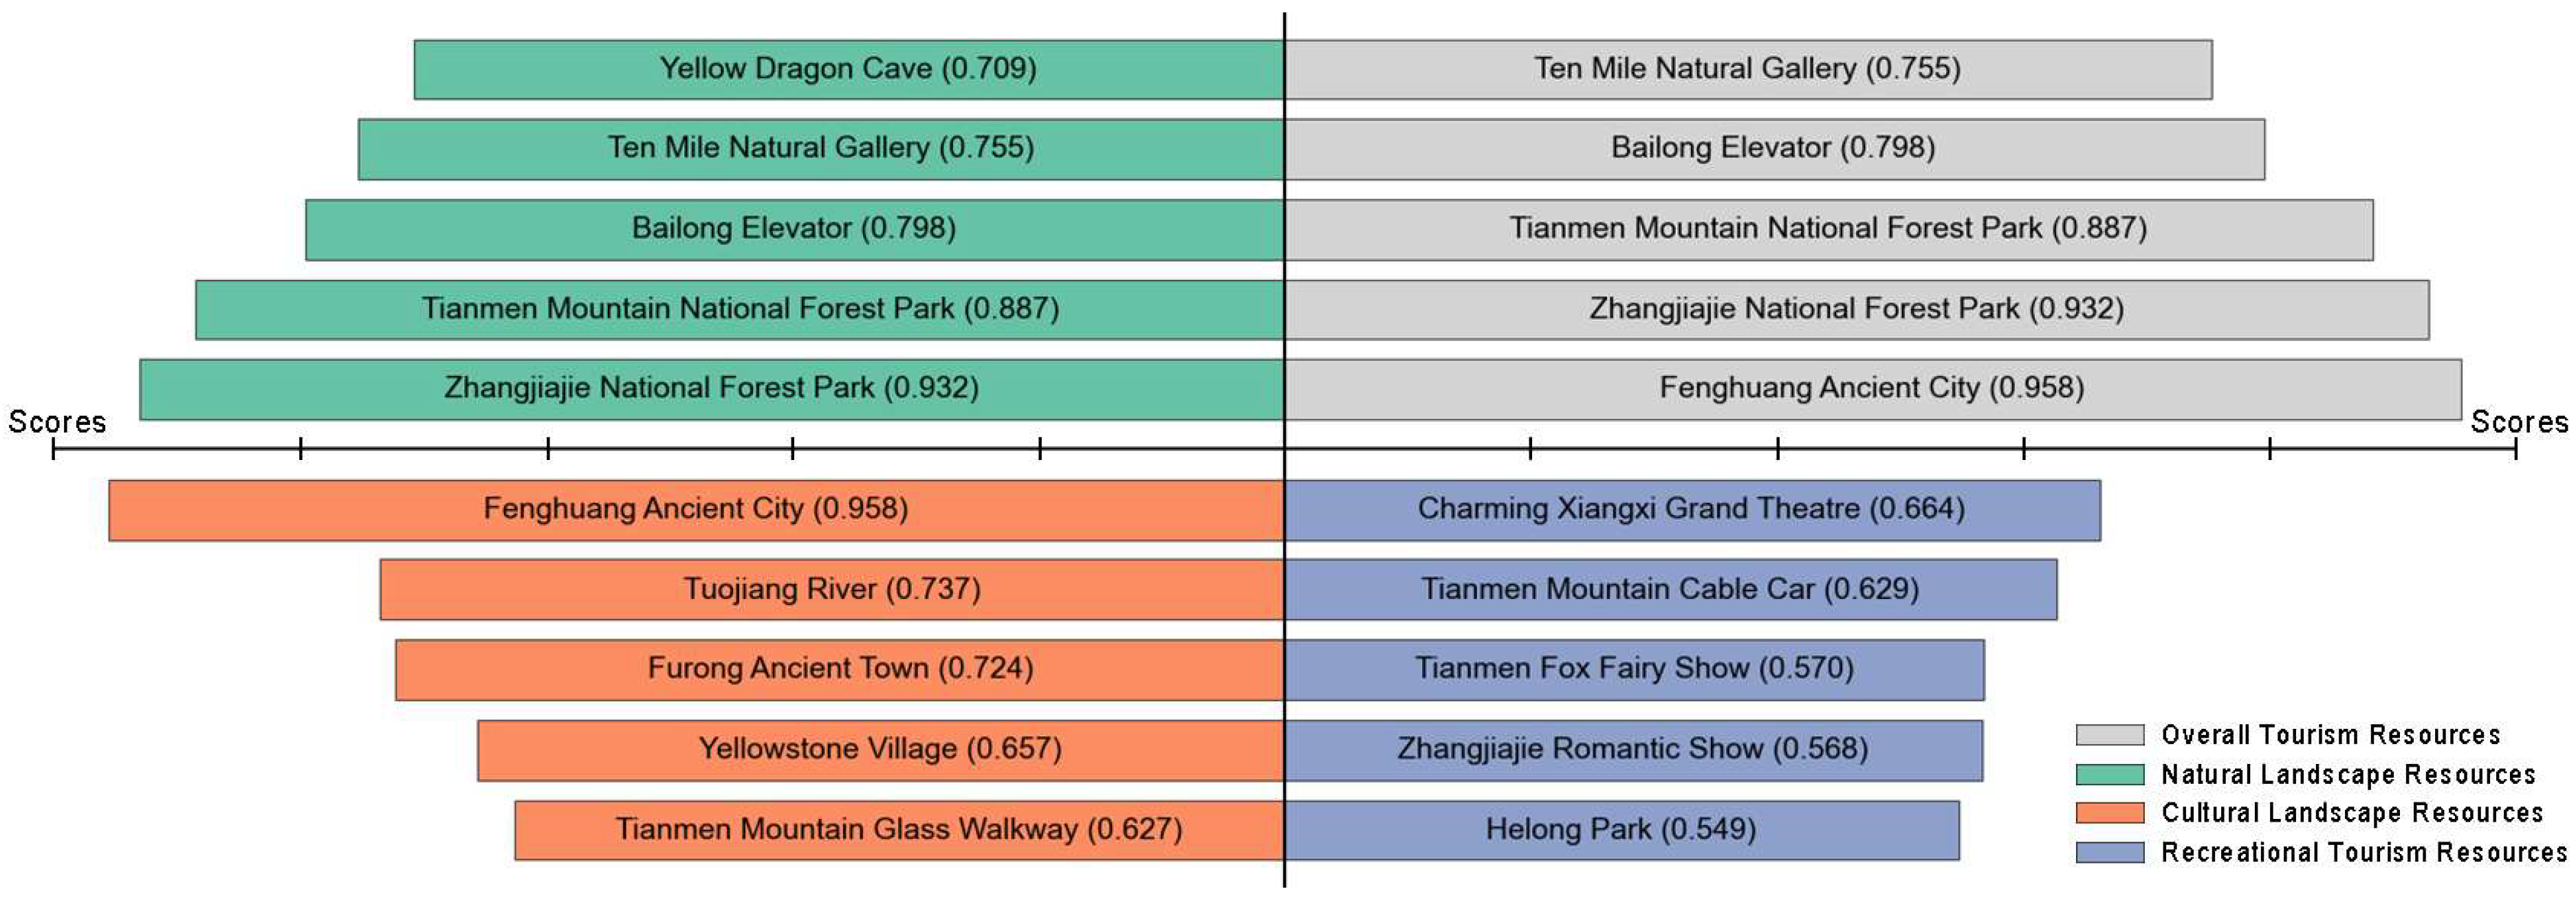
4.1. Evaluation of Network Attention

The network attention distribution for tourism resources across Western Hunan is relatively balanced, with a long upper whisker, short lower whisker, and several outliers, indicating a few sites with notably high attention. For natural landscape resources, the shorter box suggests concentrated attention levels with minimal variation. However, the slightly longer upper whisker and presence of several outliers suggest heightened attention at a few popular “viral” natural sites. Cultural landscape resources have the longest box, reflecting substantial variation in network attention among sites. In contrast, recreational tourism resources display a box shape similar to the overall data but with a median closer to the lower end, indicating that most resources receive comparatively low attention (Figure 2).
Specifically, among the top five tourism points in terms of network attention, all are natural landscape points located in Zhangjiajie, except for Fenghuang Ancient City in Xiangxi Prefecture. For natural landscape points, the top five are exclusively in Zhangjiajie. The top three cultural landscape points are all in Xiangxi Prefecture. Among recreational tourism points, four of the top five are immersive live performances or experience projects inspired by the natural beauty of Zhangjiajie (see Figure 3).

4.2. Characteristics of Spatial Distribution of Network Attention

4.2.1. Spatial Structure of Network Attention

The results of the kernel density analysis indicate that the spatial structure of network attention to tourism resources in Western Hunan follows a “dual-core” pattern, with “one primary and one secondary kernel”. The primary kernel is located in the Wulingyuan District of Zhangjiajie, which contains several major attractions with high network attention, such as Zhangjiajie National Forest Park, the Bailong Elevator, Ten Mile Natural Gallery, and Yellow Dragon Cave, all showing the highest density. The secondary kernel is in the southeastern part of Fenghuang County in Xiangxi Prefecture, centered around Fenghuang Ancient City, a prominent national historical and cultural site. Additional areas with relatively high kernel densities are found in the Yongding District of Zhangjiajie, particularly around the core area of Tianmen Mountain National Forest Park. In contrast, Huaihua shows a low kernel density with no significant concentration (Figure 4).
From the perspective of tourism resource types, natural landscape resources exhibit a spatial pattern characterized by a “strong center with poly-core”, with Zhangjiajie National Forest Park at its center. The cultural landscape resources form a “uni-polar and multi-core” structure centered around Fenghuang Ancient City, with several sub-core zones in the Wulingyuan District, Yongding District, Jishou, and Zhijiang County. Recreational tourism resources display a pattern of “one primary, one secondary, and one pole”, with the primary in Fenghuang, a secondary in the Wulingyuan District of Zhangjiajie, and a polar in the Hecheng District of Huaihua.

4.2.2. Clustering Patterns of Tourism Resource Network Attention

The global spatial autocorrelation analysis of tourism resource network attention, summarized in Table 5, shows a Moran’s I value of 0.095 (p < 0.01) for Western Hunan, indicating a clear spatial clustering pattern. However, from the perspective of resource types, the p-values for natural landscape and cultural landscape resources exceed 0.05, suggesting the null hypothesis cannot be rejected, meaning network attention for these types is randomly distributed in space (Table 5).
The local spatial autocorrelation analysis identifies 33 resource points as part of “High-High” clusters, where both the points and their neighbors exhibit high network attention. These hotspot clusters are in the Wulingyuan District, Yongding District, Sangzhi County, and Cili County of Zhangjiajie. In contrast, 27 resource points are identified as “Low-High” outliers, which have low attention themselves but are surrounded by high-attention spots, forming sub-hotspot clusters adjacent to the main hotspot areas in Wulingyuan, Yongding, and Cili Counties. Meanwhile, 12 resource points are classified as “High-Low” outliers, meaning they have high attention themselves but are surrounded by lower-attention areas. These points are primarily in Jishou, Guzhang County, Huayuan County, Fenghuang County, Yuanling County, Luxi County, and Jingzhou. A further 30 resource points fall into the “Low-Low” clusters, with low attention for themselves and their neighbors. The remaining 249 points exhibit no statistically significant clustering.
Regarding tourism resource types, hotspot clusters and sub-hotspot clusters for natural landscape resources are both concentrated in Wulingyuan District, Yongding District, and Cili County. For cultural landscape resources, hotspot clusters appear in Wulingyuan, Yongding, and Sangzhi Counties, with sub-hotspot clusters in Wulingyuan, Yongding, Jishou City, and Hongjiang City. For recreational tourism resources, hotspot clusters are in Wulingyuan District, Yongding District, and Cili County, with sub-hotspot clusters adjacent to these areas and Fenghuang and Yuanling Counties (Figure 5).

4.3. Influential Factors in the Formation of Spatial Patterns of Network Attention

4.3.1. Analysis of Influencing Factors

The Geodetector was applied to identify the factors influencing tourism resource network attention in Western Hunan. To support this analysis, a decision tree regression model was used to uncover hidden structures within the unsupervised data, identifying optimal split points for data segmentation, with the maximum number of leaf nodes set to 10 in this study.
The results show that, for overall tourism resources, 15 indicators passed the p-value test, with q-values generally falling within three data ranges. Tourist attraction rating (X11) (0.361) and the number of nearby attractions (X12) (0.216) had the highest q-values. Factors measuring tourism service capacity, such as catering service capacity (X13), accommodation service capacity (X14), and transportation service capacity (X15), showed moderate q-values, indicating a strong explanatory power for these factors on network tourism attention in Western Hunan. These are the main factors influencing network attention. In contrast, factors measuring economic development level, industrial structure and scale, and tourism infrastructure (X1–X9) had lower q-values, mostly around 0.140, indicating weaker explanatory power for network attention.
The Geodetector results also highlight variations in influencing factors across different types of tourism resources. For natural landscape resources, tourist attraction rating (X11) (0.648), and attraction clustering degree (X12) (0.373) are the most significant factors influencing the spatial pattern of network attention. In cultural landscape resources, the primary factors are tourist attraction rating (X11) (0.311), and attraction clustering degree (X12) (0.206). For recreational tourism resources, besides tourist attraction quality (X10), tourist attraction rating (X11) did not pass the p-value test; other factors showed strong explanatory power for network attention. The q-values for factors measuring economic development level, industrial structure and scale, and tourism infrastructure ranged from 0.400 to 0.500. In contrast, the factors with the strongest explanatory power were attraction clustering degree (X12) (0.743), catering service capacity (X13) (0.600), accommodation service capacity (X14) (0.586), and Transportation Service Capacity (X15) (0.620) (Table 6).

4.3.2. Analysis of Interaction Geodetector

The geographic detector interaction analysis reveals that the q-value consistently increases when any two influencing factors interact, and there are two types of enhancement: bi-factor enhancement and nonlinear enhancement, indicating that the combined explanatory power of interacting factors exceeds that of individual factors. Figure 6 illustrates the interaction effects of influencing factors on tourism resource network attention, measured by q-values from Geodetector analysis. The results reveal that paired factors consistently exert stronger combined effects than individual factors, with significant interactions involving tourist attractions rating (X11) and regional environmental factors such as total tourism revenue (X6), total tourist visits (X7), and urbanization level (X2), achieving high q-values (e.g., X11 ∩ X6 = 0.573). These findings suggest a synergistic effect where tourist attraction ratings significantly amplify network attention in regions with higher tourism revenue, visitor numbers, and urbanization levels. Similarly, attraction clustering degree (X12) interacts notably with regional factors, highlighting the importance of spatial arrangement in influencing network attention, particularly in well-developed tourism areas. Additionally, interactions between site-specific factors (X10–X15) and regional environmental factors (X1–X9) consistently show higher q-values, indicating a strong interplay between the inherent characteristics of tourism resources and their regional contexts. Notably, the interaction between tourist attraction rating (X11) and tourist attractions quality (X10) across regional indicators further emphasizes that high-quality scenic spots in economically developed areas are more likely to attract significant network attention.

5. Discussion

The overall distribution of network attention for tourism resources in Western Hunan appears balanced, with certain popular sites attracting significant attention. The spatial structure of network attention reveals a “dual-core” pattern featuring a primary and a secondary cluster, with distinct spatial heterogeneity evident across different resource types.
As exemplified by Zhangjiajie’s iconic mountains and rivers, natural landscape resources exhibit spatial continuity, resulting in clear clustering patterns in network attention. Network attention to natural landscapes is primarily influenced by Scenic Quality Scores and Attraction Clustering Degrees, as diverse and high-quality tourism resources can motivate tourists, enhancing their multidimensional experience and, consequently, the attraction’s appeal. Renown sites like Tianmen Mountain National Forest Park and Zhangjiajie National Forest Park attract exceptionally high network attention. Additionally, these popular sites generate spillover effects, creating high-attention clusters that extend to neighboring attractions.
Cultural landscape resources, largely composed of historical relics and cultural venues, are primarily concentrated in Fenghuang Ancient City, serving as a central hub for cultural tourism. Fenghuang Ancient City offers a variety of resources, including historical sites and folk museums, providing visitors with a culturally immersive experience in terms of both breadth and depth. This spatial concentration positions Fenghuang as a central node, forming a cohesive spatial cluster with strong interaction and spillover effects among resources. However, network attention to other cultural sites remains generally low outside of Fenghuang, likely due to limited appeal.
Recreational tourism resources exhibit low network attention, with a spatial pattern of “one primary, one secondary, and one pole”. These resources are primarily clustered around major natural and cultural attractions in Zhangjiajie and Xiangxi Prefecture, with key recreational activities such as the “Charming Xiangxi” and “Tianmen Fox Fairy” live performances in Zhangjiajie, and bonfire parties and art cruises in Fenghuang. Such recreational activities typically complement nearby major attractions and are closely linked to local daily leisure. Huaihua, in particular, due to its higher population density and relatively advanced economic conditions compared to other regions, sees a concentration of recreational resources in its downtown area, thus forming a local attention pole.
Previous studies have rarely explored network attention distribution and its influencing factors across tourism resources. Our study reveals that, in Western Hunan, distinct spatial heterogeneity exists in the network attention distribution patterns across resource types, each influenced by various factors. While these influencing factors align closely with those highlighted in prior studies, our findings reveal notable differences in impact intensity across tourism resources. Tourist attraction rating and attraction clustering degree are the primary drivers of spatial differentiation for overall resources, natural landscapes, and cultural landscapes. The impact of these factors is strongest for natural landscapes (q = 0.648 and 0.373, respectively), followed by overall resources (q = 0.361 and 0.216) and cultural landscapes (q = 0.311 and 0.206). Tourist attraction ratings often reflect visitors’ perceptions of quality, uniqueness, and esthetic appeal, which are particularly salient for natural landscapes. Scenic beauty is a key draw for tourists seeking nature-based experiences, leading to greater network attention and spatial differentiation. Cultural resources, such as historical sites and intangible cultural heritage, may be valued more for their intrinsic cultural or historical significance, which may not be fully captured by visitor ratings. This disparity explains the relatively lower q-value observed for cultural landscapes (0.311) compared to that of natural landscapes (0.648). Attraction clustering degree (q = 0.743) is a key determinant of network attention for recreational resources, as these activities often benefit from proximity and variety; closely clustered attractions create synergistic effects and encourage longer visits or multi-activity experiences. Similarly, tourism service capacity (q = 0.620) plays a crucial role, as recreational resources require robust support from services such as lodging, dining, and transportation to meet visitor expectations for convenience and comfort, thereby directly influencing experience quality and engagement.
The Geodetector analysis provides new insights into the formation of spatial clusters. The interaction between service capacity factors (X13–X15) and attraction clustering degree (X12) also contributes to the formation of high–high clusters in regions such as Zhangjiajie. These clusters benefit from well-developed tourism infrastructure, which enhances visitor experiences and satisfaction, thus amplifying network attention. For instance, regions with well-developed catering, accommodation, and transportation services not only attract a greater number of tourists but also foster repeat visitation, further enhancing their online presence. Similarly, the spatial clustering of attractions generates synergistic effects, attracting a larger number of visitors and increasing attention on digital platforms.
Furthermore, the factors influencing Western Hunan’s tourism resource network attention do not act independently but interact in interactive or nonlinear enhanced ways. The interaction between factors reflecting intrinsic site characteristics and those related to the regional environment can maximize the driving effect on network attention.
Based on the above research findings, the following recommendations are proposed to optimize the spatial layout of tourism resources and promote tourism development in Western Hunan:
At the regional level in Western Hunan, it is essential to highlight the unique tourism characteristics of each city and establish a differentiated development pattern characterized by “One Leader, One Center, and Multiple Clusters”.: Given that resource endowment is the key driver of network attention, efforts should prioritize developing the unique characteristics of each area. Zhangjiajie’s Wulingyuan and Yongding districts, with high network attention for natural landscapes and associated recreational resources, should advance a “Tourism Plus” strategy to expand offerings like sports events, extreme sports, and smart tourism. These additions can facilitate a shift from traditional sightseeing to experience-based tourism, solidifying Zhangjiajie’s role as a “leader” in regional tourism. Xiangxi Prefecture, with great attention to cultural landscapes due to its rich history and ethnic heritage, should develop traditional craft workshops, science museums, and cultural festivals to create an immersive “Xiangxi Cultural Tourism” experience, positioning the area as a “center” for cultural tourism. Although Huaihua’s tourism resource development is relatively low, its strategic location as a transportation hub provides advantageous conditions to strengthen the integration of transportation and tourism systems [49]. Subsequent efforts should focus on cultivating high-quality tourist resorts, well-known tourist towns, and villages to form core competence, creating complementary tourism “clusters” in the north and south for coordinated development.
Strengthen the integrated development of prominent tourist attractions and surroundings, building extensive tourism clusters: High-attraction areas with clustering potential should be further developed to create scale effects, boosting regional tourism impact. In Zhangjiajie, integrating natural landscapes across Wulingyuan District, Yongding District, and Cili County is essential. For Xiangxi Prefecture, areas such as Fenghuang County, Jishou, and Luxi County should integrate and enhance cultural tourism resources. In Huaihua, the cultural landscapes of Jingzhou Autonomous County and Hongjiang City, along with recreational resources in Yuanling County, should be prioritized for development to increase network attention and visitor appeal.
Enhance tourism service capacity and infrastructure to amplify resource synergies and visitor experience: Given the significant interactive effects between site-specific characteristics and the regional environment, strategic improvements should focus on areas with high network attention to maximize the positive impacts of tourism service capacities, such as transportation, accommodation, and catering. Enhancing these services around prominent attractions in Zhangjiajie, Xiangxi Prefecture, and Huaihua will improve the visitor experience and strengthen the overall tourism system’s attractiveness, creating an interconnected network of tourism resources with mutual benefits across the region.
This study employs multi-source network data to enhance the measurement method of network attention to tourism resources, addressing the shortcomings in analyzing network attention for different resource types and filling the gap in quantitative research on network attention to tourism resources in Western Hunan. However, certain limitations remain due to data sources. First, when analyzing the influence of factors on network attention, regional environmental data collected at the city or county level were uniformly assigned to tourism resource points within each region. While this approach ensured regional representativeness, it precluded the analysis of intra-regional variations. Future research could address this limitation by employing finer-grained data. For instance, indicators such as tourism revenue and tourist arrivals could be disaggregated to the level of individual tourism resource points (n = 351), assigning unique values to each point. This refinement would better capture the localized impacts of these factors, enhancing the precision and depth of the spatial analyses. Additionally, the “Topics Viewed” metric on TikTok reflects users’ interest in specific content. However, this metric is susceptible to the influence of viral trends and platform recommendation algorithms, often resulting in transient spikes in exposure and viewership. This characteristic complicates the assessment of a tourism resource’s intrinsic and long-term appeal. Future research should aim to harmonize data granularity, refine collection methods, and expand sources, including emerging platforms like RED (Xiaohongshu), to capture comprehensive network attention better.

6. Conclusions

This study uses multi-source data to measure the network attention of tourism resources, overcoming challenges related to incomplete data collection and limited data availability for various tourism resource types across multiple internet platforms in Western Hunan. By applying kernel density analysis, LISA, and Geodetector methods, the study examines the spatial distribution and influencing factors of tourism resource network attention from an overall and categorized perspective. The main findings are as follows:
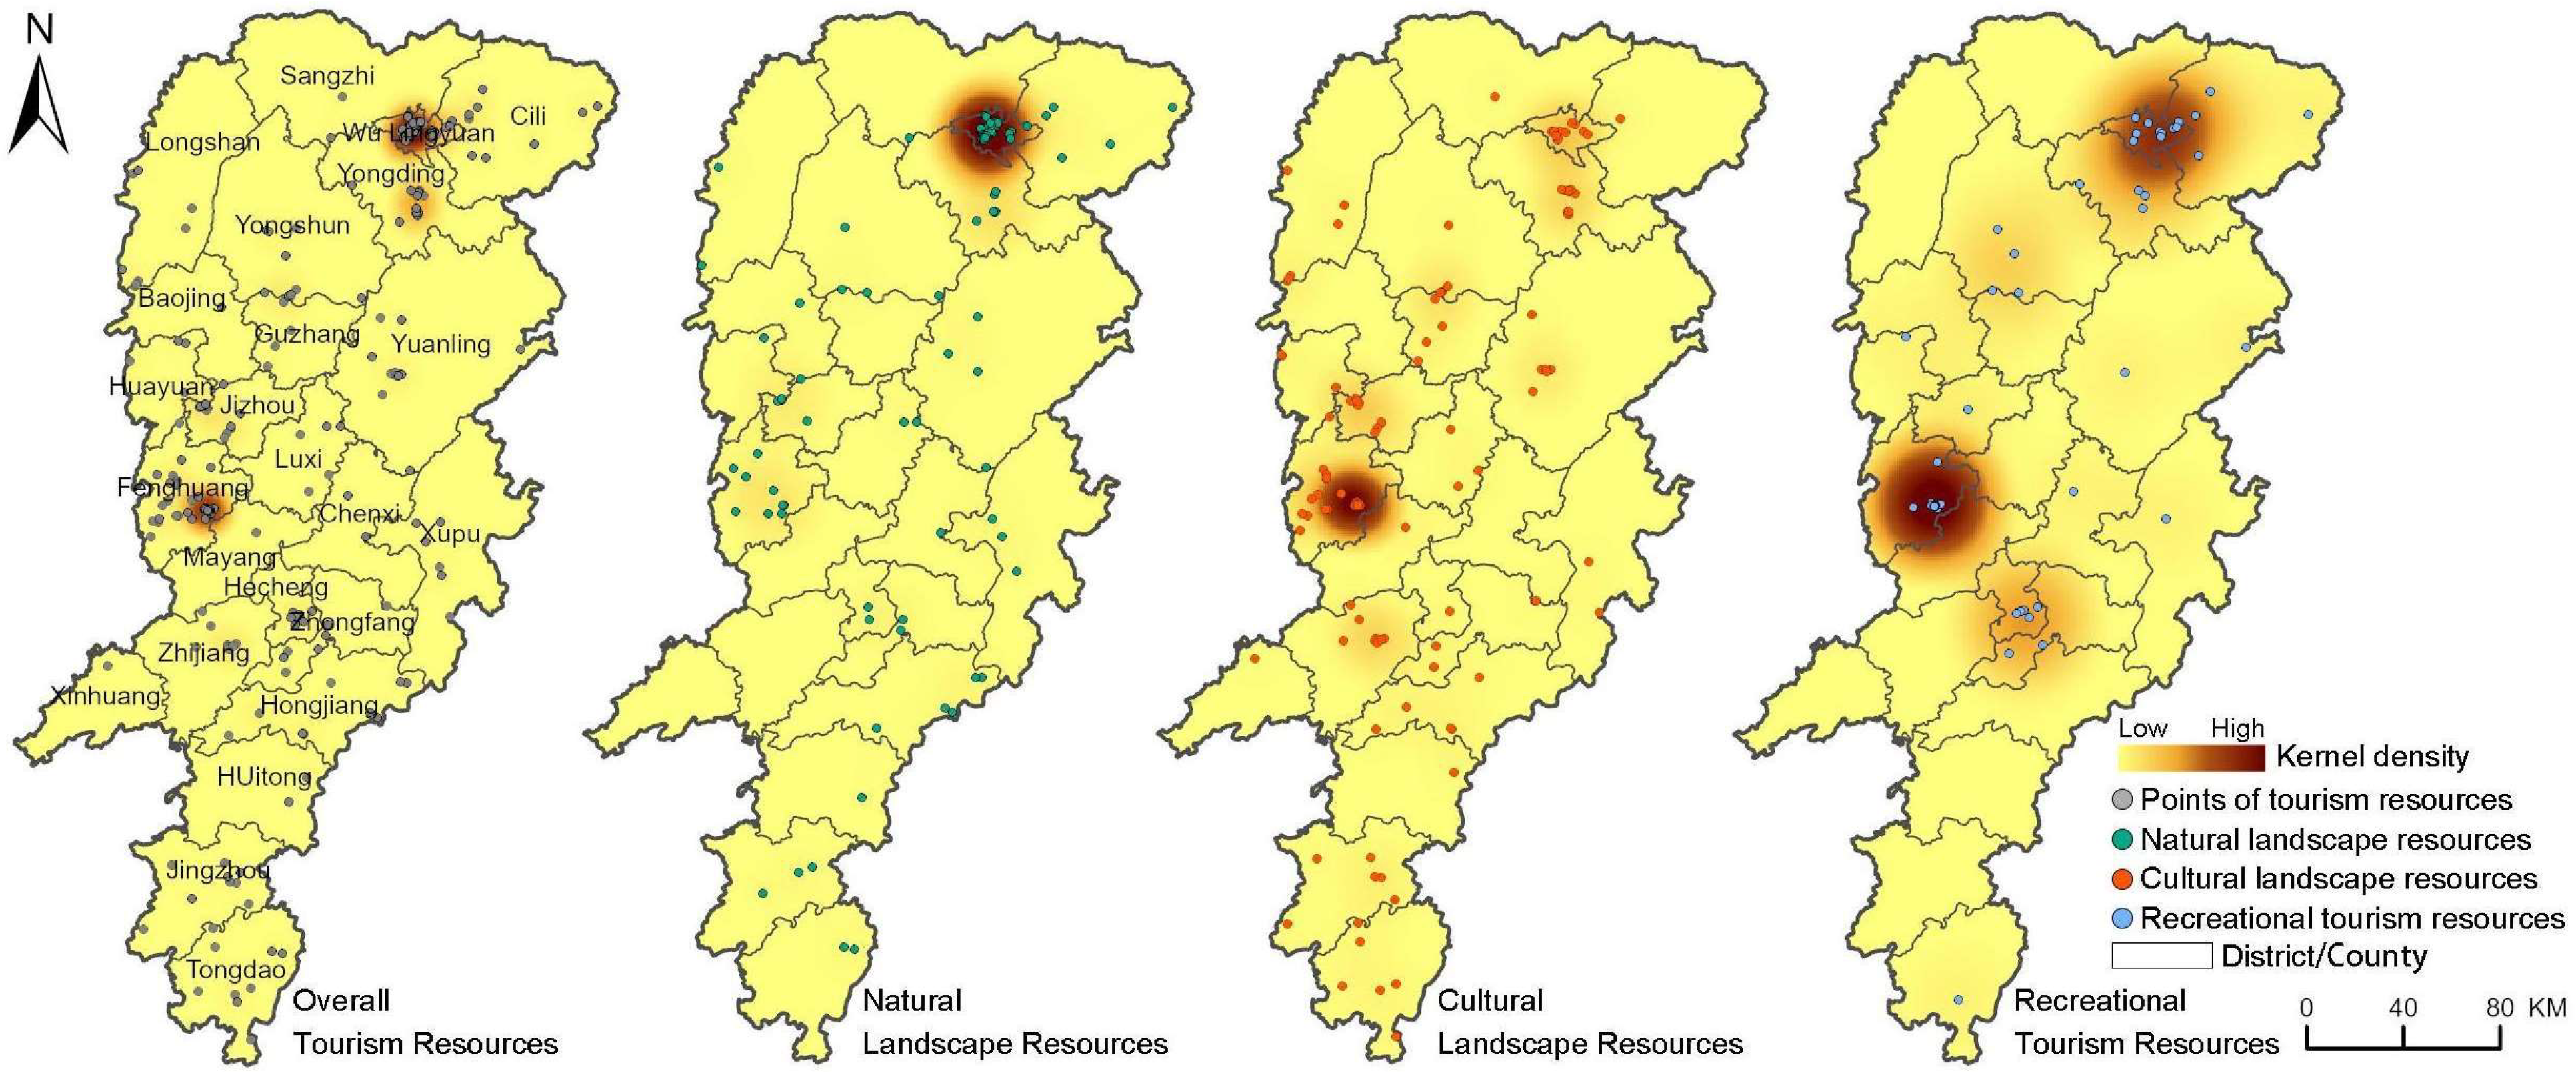
  • Distinct spatial clustering by resource type: Natural landscape resources in Western Hunan have the highest network attention, followed by cultural landscapes, with recreational tourism resources receiving the least attention. Spatially, the distribution of network attention forms a “dual-core” structure, with a primary and secondary. Different types of tourism resources exhibit local clustering patterns in different areas. Natural landscapes, cultural landscapes, and recreational tourism resources all have high-density centers, with Zhangjiajie and Fenghuang County of Xiangxi Prefecture serving as key cores, while Huaihua City shows generally low network attention, except for recreational tourism resources, which form a secondary high-density center in Hecheng District.
  • Varied influencing factors by resource type: For overall, natural, and cultural landscape resources, tourist attractions rating and attraction clustering Degree are primary drivers of spatial differentiation, with the strongest impact on natural landscapes. Recreational tourism resources, in contrast, are mainly influenced by attraction clustering degree and transportation service capacity, along with notable regional effects from economic development, industrial structure, and tourism infrastructure. Moreover, the collaborative development of inherent characteristics and regional conditions contributes to an enhanced level of network attention.
Tourism resource planning and development in Western Hunan should focus on the following points:
  • Leverage the unique characteristics of key regions: Strategic tourism investment should leverage the unique characteristics of Zhangjiajie, Xiangxi Prefecture, and Huaihua by implementing differentiated strategies that highlight their strengths. Focus on infrastructure for natural landscapes in Zhangjiajie, cultural preservation in Xiangxi, and service capacity in Huaihua, while creating a spatial layout of “one leading city, one central area, and multiple clusters”. This approach optimizes the regional environment for tourism development, enhances network attention, and fosters balanced urban-rural growth.
  • Strengthen regional cooperation: Fully utilize spatial clustering characteristics to enhance cooperation among attractions in regions with outlier clusters, promoting coordinated development between lower-value attractions and their adjacent high-value areas.
In summary, the use of multi-source data provides a more accurate reflection of tourism network attention, effectively mitigating the limitations of traditional data sources and offering more comprehensive data support for research on this topic. This approach identifies the strengths and weaknesses of tourism resources in specific regions, enabling the development of sustainable, tailored strategies. Additionally, the categorization of tourism resource types allows for more detailed analyses, helping to resolve challenges related to resource allocation and utilization efficiency. The concepts of “differentiated strategic layouts” and “regional coordinated cooperation” presented in this study offer practical guidance for regions facing uneven resource distribution or inter-regional competition. These strategies can maximize resource utilization efficiency and enhance overall destination attractiveness. Future research should focus on optimizing and expanding data collection methods, maintaining consistent data granularity, and reducing the impact of extraneous factors on network attention data. Moreover, integrating emerging technologies, such as real-time data collection and AI-driven predictive modeling, could significantly improve the accuracy and relevance of tourism network analysis. This integration would provide dynamic insights into tourism trends and behaviors, fostering innovative and sustainable tourism planning practices.

Author Contributions

Conceptualization, H.Z.; methodology, H.Z.; software, H.Z.; validation, H.Z.; formal analysis, H.Z.; resources, H.Z. and C.T.; writing—original draft preparation, H.Z.; writing—original draft, H.Z.; visualization, H.Z.; writing—review and editing, P.Z. and C.T.; validation, P.Z. supervision, C.Z. All authors have read and agreed to the published version of the manuscript.

Funding

This research was funded by the Humanities and Social Science Research Youth Fund Project of the Ministry of Education, grant number 23YJC850017, and the Changsha University of Science and Technology New Teachers Research Funding, grant number 097-000304174.

Institutional Review Board Statement

Not applicable.

Informed Consent Statement

Not applicable.

Data Availability Statement

The data presented in this study are available on request from the authors.

Conflicts of Interest

The authors declare no conflicts of interest.

References

  1. Lu, J.; Fang, S.; Ning, Z. Tourists Perceived Value about Heritage Tourism and lts PromotionStrategy:Based on Content Analysis of Network Information. Geogr. Geo-Inf. Sci. 2017, 112–117. [Google Scholar]
  2. Penpece Demirer, D.; Büyükeke, A. Unravelling Tourism Destination’s Competitiveness Using Big Data Analytics: A Comparative Analysis. Kybernetes, 2024; ahead-of-print. [Google Scholar] [CrossRef]
  3. Li, J.; Xu, L.; Tang, L.; Wang, S.; Li, L. Big Data in Tourism Research: A Literature Review. Tour. Manag. 2018, 68, 301–323. [Google Scholar] [CrossRef]
  4. Hernández, J.M.; Kirilenko, A.P.; Stepchenkova, S. Network Approach to Tourist Segmentation via User Generated Content. Ann. Tour. Res. 2018, 73, 35–47. [Google Scholar] [CrossRef]
  5. Liang, H.; Zhang, Q. Do Social Media Data Indicate Visits to Tourist Attractions? A Case Study of Shanghai, China. Open House Int. 2022, 47, 17–35. [Google Scholar] [CrossRef]
  6. Giglio, S.; Bertacchini, F.; Bilotta, E.; Pantano, P. Using Social Media to Identify Tourism Attractiveness in Six Italian Cities. Tour. Manag. 2019, 72, 306–312. [Google Scholar] [CrossRef]
  7. Nolasco-Cirugeda, A.; García-Mayor, C.; Lupu, C.; Bernabeu-Bautista, A. Scoping out Urban Areas of Tourist Interest Though Geolocated Social Media Data: Bucharest as a Case Study. Inf. Technol. Tour. 2022, 24, 361–387. [Google Scholar] [CrossRef]
  8. Park, S.; Lee, J.; Song, W. Short-Term Forecasting of Japanese Tourist Inflow to South Korea Using Google Trends Data. J. Travel Tour. Mark. 2017, 34, 357–368. [Google Scholar] [CrossRef]
  9. Zhang, G.; Yuan, H. Spatio-Temporal Evolution Characteristics and Spatial Differences in Urban Tourism Network Attention in China: Based on the Baidu Index. Sustainability 2022, 14, 13252. [Google Scholar] [CrossRef]
  10. Gunter, U.; Önder, I.; Gindl, S. Exploring the Predictive Ability of LIKES of Posts on the Facebook Pages of Four Major City DMOs in Austria. Tour. Econ. 2019, 25, 375–401. [Google Scholar] [CrossRef]
  11. Zhou, Q.; Sotiriadis, M.; Shen, S. Using TikTok in Tourism Destination Choice: A Young Chinese Tourists’ Perspective. Tour. Manag. Perspect. 2023, 46, 101101. [Google Scholar] [CrossRef]
  12. Wang, Z.; Zhu, Z.; Xu, M.; Qureshi, S. Fine-Grained Assessment of Greenspace Satisfaction at Regional Scale Using Content Analysis of Social Media and Machine Learning. Sci. Total Environ. 2021, 776, 145908. [Google Scholar] [CrossRef] [PubMed]
  13. Wang, Z.; Jin, Y.; Liu, Y.; Li, D.; Zhang, B. Comparing Social Media Data and Survey Data in Assessing the Attractiveness of Beijing Olympic Forest Park. Sustainability 2018, 10, 382. [Google Scholar] [CrossRef]
  14. Guo, S.; Yang, G.; Pei, T.; Ma, T.; Song, C.; Shu, H.; Du, Y.; Zhou, C. Analysis of Factors Affecting Urban Park Service Area in Beijing: Perspectives from Multi-Source Geographic Data. Landsc. Urban Plan. 2019, 181, 103–117. [Google Scholar] [CrossRef]
  15. Liang, H.; Zhang, Q. Temporal and Spatial Assessment of Urban Park Visits from Multiple Social Media Data Sets: A Case Study of Shanghai, China. J. Clean. Prod. 2021, 297, 126682. [Google Scholar] [CrossRef]
  16. Zhang, Z.; Zhang, Z.; Yang, Y. The Power of Expert Identity: How Website-Recognized Expert Reviews Influence Travelers’ Online Rating Behavior. Tour. Manag. 2016, 55, 15–24. [Google Scholar] [CrossRef]
  17. Alfred, R.; Chen, Z.; Eboy, O.V.; Luxuan, Z.; Renjie, L. Analyzing Trends in the Spatial-Temporal Visitation Patterns of Mainland Chinese Tourists in Sabah, Malaysia Based on Weibo Social Big Data. Heliyon 2023, 9, e15526. [Google Scholar] [CrossRef]
  18. Huarng, K.-H.; Yu, T.H.-K. Application of Google Trends to Forecast Tourism Demand. J. Internet Technol. 2019, 20, 1273–1280. [Google Scholar]
  19. Sun, Y.; Shao, Y.; Chan, E.H.W. Co-Visitation Network in Tourism-Driven Peri-Urban Area Based on Social Media Analytics: A Case Study in Shenzhen, China. Landsc. Urban Plan. 2020, 204, 103934. [Google Scholar] [CrossRef]
  20. Önder, I.; Gunter, U.; Gindl, S. Utilizing Facebook Statistics in Tourism Demand Modeling and Destination Marketing. J. Travel Res. 2020, 59, 195–208. [Google Scholar] [CrossRef]
  21. Hysa, B.; Karasek, A.; Zdonek, I. Social Media Usage by Different Generations as a Tool for Sustainable Tourism Marketing in Society 5.0 Idea. Sustainability 2021, 13, 1018. [Google Scholar] [CrossRef]
  22. Go, H.; Kang, M.; Nam, Y. The Traces of Ecotourism in a Digital World: Spatial and Trend Analysis of Geotagged Photographs on Social Media and Google Search Data for Sustainable Development. J. Hosp. Tour. Technol. 2020, 11, 183–202. [Google Scholar] [CrossRef]
  23. Bigne, E.; Ruiz, C.; Curras-Perez, R. Destination Appeal through Digitalized Comments. J. Bus. Res. 2019, 101, 447–453. [Google Scholar] [CrossRef]
  24. Song, H.; Qiu, R.T.R.; Park, J. A Review of Research on Tourism Demand Forecasting: Launching the Annals of Tourism Research Curated Collection on Tourism Demand Forecasting. Ann. Tour. Res. 2019, 75, 338–362. [Google Scholar] [CrossRef]
  25. Zhang, Y.; Jin, X.; Wang, Y.; Liu, R.; Jing, Y. Characterizing Spatial-Temporal Variation of Cultural Tourism Internet Attention in Western Triangle Economic Zone, China. Land 2022, 11, 2221. [Google Scholar] [CrossRef]
  26. Hou, X. Tourism Network Attention Variation of Chinese Cities under the COVID-19 Pandemic. Sustainability 2022, 14, 5131. [Google Scholar] [CrossRef]
  27. Wang, G.; Meng, Y. The Clustering Characteristics and Driving Mechanisms of Tourist Preference for 5A Scenic Spots from the Dynamic Spatio-Temporal Perspective: A Case of Jiangsu in Eastern Coastal Area of China. Sustainability 2023, 15, 1626. [Google Scholar] [CrossRef]
  28. Fu, Y.; Cai, Z.; Fang, C. Hotspot Identification and Causal Analysis of Chinese Rural Tourism at Different Spatial and Temporal Scales Based on Tourism Big Data. Sustainability 2024, 16, 1165. [Google Scholar] [CrossRef]
  29. Shanshan, J.; Ming, L.I.; Fengjun, T.; Rulian, W.U.; Qingqing, Y. Distribution Pattern and Driving Mechanism of Network Attention of Chinese Red Tourism Classic Scenic Spots. Econ. Geogr. 2022, 42, 211–220. [Google Scholar] [CrossRef]
  30. Wang, C.; Lu, C.; Ba, D.; Ma, B.; Qin, Z. Spatio-temporal evolution and influencing factors of network attention of representative ski resorts in China. J. Nat. Resour. 2022, 37, 2367. [Google Scholar] [CrossRef]
  31. Zheng, E.; Xue, C.; Chen, G.; Zhang, Y.; Zou, J. Unveiling Urban Marathon Development Characteristics and Urban Growth Strategies in China: Insights from Time Series Analysis of Baidu Search Index. PLoS ONE 2023, 18, e0287760. [Google Scholar] [CrossRef] [PubMed]
  32. Barkauskas, V.; Barkauskienė, K.; Jasinskas, E. Analysis of Macro Environmental Factors Influencing the Development of Rural Tourism: Lithuanian Case. Procedia-Soc. Behav. Sci. 2015, 213, 167–172. [Google Scholar] [CrossRef]
  33. Gao, N.; Li, J.; Zhang, X.; Zhou, Y.; Qiao, W. Spatio-temporal Differentiation Characteristics ofNetwork Attention to Study Tour in China and ltsInfluence Mechanism. Geogr. Geo-Inf. Sci. 2023, 68–76. [Google Scholar] [CrossRef]
  34. Hong, T.; Xu, C.X. Spatio-Temporal Evolution and Influencing Factors of Chinese Red Tourism Classic Scenic Spots Network Attention. J. Nat. Resour. 2021, 36, 1792–1810. [Google Scholar] [CrossRef]
  35. Gao, N.; Zhang, X.C.; Wang, L.Y. Spatio-Temporal Characteristics and Influencing Factors of Chinese Red Tourism Network Attention. J. Nat. Resour. 2020, 35, 1068–1089. [Google Scholar] [CrossRef]
  36. Hernández, J.M.; Santana-Jiménez, Y.; González-Martel, C. Factors Influencing the Co-Occurrence of Visits to Attractions: The Case of Madrid, Spain. Tour. Manag. 2021, 83, 104236. [Google Scholar] [CrossRef]
  37. Gutiérrez, J.; García-Palomares, J.C.; Romanillos, G.; Salas-Olmedo, M.H. The Eruption of Airbnb in Tourist Cities: Comparing Spatial Patterns of Hotels and Peer-to-Peer Accommodation in Barcelona. Tour. Manag. 2017, 62, 278–291. [Google Scholar] [CrossRef]
  38. Li, H.; Hui, Y.; Dai, S.; Pan, J. Spatiotemporal evolution of network attention of 5A tourist attractions anoits influencing factors in China. J. Chin. Ecotourism 2024, 14, 151–166. [Google Scholar]
  39. Prideaux, B. Factors Affecting Bilateral Tourism Flows. Ann. Tour. Res. 2005, 32, 780–801. [Google Scholar] [CrossRef]
  40. Chen, J.; Becken, S.; Stantic, B. Harnessing Social Media to Understand Tourist Mobility: The Role of Information Technology and Big Data. Tour. Rev. 2022, 77, 1219–1233. [Google Scholar] [CrossRef]
  41. Li, H.; Hu, M.; Li, G. Forecasting Tourism Demand with Multisource Big Data. Ann. Tour. Res. 2020, 83, 102912. [Google Scholar] [CrossRef]
  42. Zhu, T.; Yu, K.; Wang, B. Spatial Distribution Characteristics and Influencing Factors of Cultural and Tourism Resources in Xihu District of Hangzhou. Sustainability 2023, 15, 10978. [Google Scholar] [CrossRef]
  43. Hu, J.; Wang, R.; Li, Y.; Jia, Y.; Yu, J. Evaluationof Tourism Resources Attraction in Ethnic Areas Based onNetwork Information: A Case Study of Qiandongnan in Guizhou Province. Econ. Geogr. 2018, 38, 200–207. [Google Scholar] [CrossRef]
  44. Li, W.; Cui, T.; Ma, X.; Zhang, X. A study on the spatial patterns and causes of the attractiveness of scenic sports in Hangzhou. Tour. Sci. 2023, 37, 19–39. [Google Scholar] [CrossRef]
  45. Shannon, C.E. A Mathematical Theory of Communication. Bell Syst. Tech. J. 1948, 27, 379–423. [Google Scholar] [CrossRef]
  46. Moran, P.A.P. Notes on Continuous Stochastic Phenomena. Biometrika 1950, 37, 17–23. [Google Scholar] [CrossRef]
  47. Anselin, L. Local Indicators of Spatial Association—LISA. Geogr. Anal. 1995, 27, 93–115. [Google Scholar] [CrossRef]
  48. Wang, J.; Xu, C. Geodetector: Principle and prospective. Acta Geogr. Sin. 2017, 72, 116–134. [Google Scholar]
  49. Ye, M.; Wang, Z.; Tan, Y. The Characteristics and Effects of the Coupling Coordination betweenTraffic and Tourism Development in Xiangxi Region. Econ. Geogr. 2020, 40, 138–144. [Google Scholar] [CrossRef]
Figure 1. Location of the study area and points of tourism resources.
Sustainability 17 00744 g001
Figure 2. Box plot of tourism resource network attention in Western Hunan.
Sustainability 17 00744 g002
Figure 3. Ranking and scoring of the top five tourism resources in Western Hunan.
Sustainability 17 00744 g003
Figure 4. Kernel density analysis of network attention in Western Hunan.
Sustainability 17 00744 g004
Figure 5. Analysis of localized spatial autocorrelation in Western Hunan.
Sustainability 17 00744 g005
Figure 6. Interaction Effects of Influencing Factors on Tourism Resource Network Attention. Note: + indicates Enhance, bi-: q(X1⋂X2) > Max[q(X1),q(X2)], × indicates Enhance, nonlinear: q(X1⋂X2) > q(X1) + q(X2).
Sustainability 17 00744 g006
Table 1. Descriptive Statistics of Dataset.
Data SourcesIndicators Min.Max.MeanStd. Deviation
Baidu.comBaidu Index0336,9221519.6818,275.32
TiktokTopics Viewed1760,0014425.9742,090.47
Dianping.comNumber of Reviews012,173176.961014.20
Number of Review Images010,308146.92860.88
Number of Positive Reviews011,109151.13909.12
Qunar.comNumber of Reviews0102,481981.827246.50
Number of Review Images0504865.49320.29
Number of Positive Reviews098,392941.967019.16
Mafengwo.cnNumber of “Visited”032,4142065.644816.83
Number of Reviews05141160.45494.76
Number of Positive Reviews0166249.80135.06
Number of Review Images04459115.56377.82
Ctrip.comNumber of Reviews023,950313.931895.17
Number of Review Images011,666130.92845.14
Number of Positive Reviews021,055257.781633.24
Table 2. Influencing Factors for Network Attention.
DimensionCriteria LayerIndicator LayerIndicator Descriptions
Regional ConditionEconomic DevelopmentX1: Regional EconomicGross domestic product in each county-level region
X2: UrbanizationUrbanization level in each county-level region
X3: Residential Living StandardsGross domestic product per capita in each county-level region
Industrial StructureX4: Tertiary Sector ShareShare of tertiary sectors in gross domestic product
X5: Tertiary Sector SizeAdded value of the tertiary sectoring in each county-level region
Tourism DevelopmentX6: Tourism RevenueTourism revenue in each county-level region
X7: Tourist ArrivalsNumber of tourist arrivals in each county-level region
X8: Tourist Attractions DevelopmentNumber of A-class tourist attractions in each county-level region
X9: Travel Agency Development Number of travel agency developments in each county-level region
Inherent CharacteristicsTourism EndowmentX10: Tourist Attractions QualityA-class classification for tourist attractions
X11: Tourist Attractions RatingOnline platform rating for tourist attractions
X12: Attraction Clustering DegreeNumber of neighboring tourist attractions in 20 km
Tourism Service CapacityX13: Catering Service CapacityNumber of neighboring catering service POI in 10 km
X14: Accommodation Service CapacityNumber of neighboring accommodation service POI in 10 km
X15: Transportation Service CapacityNumber of neighboring road network densities in 10 km
Table 3. Evaluation Indicator System for Network Attention.
Data TypesData SourcesTotal WeightsIndicators Weights
Search EngineBaidu.com14.34%Baidu Index14.34%
Social MediaTiktok.com5.27%Topics Viewed5.27%
Travel Review PlatformDianping.com30.39%Number of Reviews9.93%
Number of Review Images10.32%
Number of Positive Reviews10.14%
Qunar.com15.00%Number of Reviews4.22%
Number of Review Images6.37%
Number of Positive Reviews4.41%
Mafengwo.cn23.66%Number of “Visited”3.57%
Number of Reviews5.73%
Number of Positive Reviews6.70%
Number of Review Images7.66%
Ctrip.com11.34%Number of Reviews2.91%
Number of Review Images4.67%
Number of Positive Reviews3.76%
Table 4. Criteria for Interaction Detector.
DescriptionType of Interaction
q(X1∩X2) < Min[q(X1),q(X2)]Nonlinear Weakened
Min[q(X1),q(X2)] < q(X1∩X2) < Max[q(X1),q(X2)]Unilinear Weakened
q(X1∩X2) > Max[q(X1),q(X2)]Bi-factor Enhancement
q(X1∩X2) = q(X1) + q(X2)Independent
q(X1∩X2) > q(X1) + q(X2)Nonlinear Enhancement
Note: X1 and X2 represent any two independent variables; the q indicates the explanatory power, with q ranging from [0, 1]. A higher q value signifies a stronger explanatory capacity of the independent variables.
Table 5. Tourism Resource Network Attention Global Moran’s I.
Resource TypesMoran’s IZ-Scorep-Value
Overall Tourism Resources0.09492.99330.0028
Natural landscape resources0.10081.85880.0631
Cultural landscape resources0.02930.61050.5415
Recreational Tourism Resources0.30485.13040.0000
Table 6. Geodetection Results of Single-Factor.
Resource Typesq-Value of Influencing Factors
X1X2X3X4X5X6X7X8X9X10X11X12X13X14X15
Overall0.140 ***0.135 ***0.143 ***0.131 ***0.137 ***0.143 ***0.133 ***0.123 ***0.132 ***0.143 ***0.361 ***0.216 ***0.184 ***0.172 ***0.174 **
Natural 0.648 ***0.373 **
Cultural 0.146 * 0.311 ***0.206 **0.161 **
Recreational0.494 ** 0.500 ***0.499 ***0.465 ** 0.495 ** 0.500 ** 0.500 ** 0.435 ** 0.487 ** 0.743 *** 0.600 * 0.586 * 0.620 **
Note: ***, **, and * denote 1%, 5%, and 10% significance levels, respectively.
Disclaimer/Publisher’s Note: The statements, opinions and data contained in all publications are solely those of the individual author(s) and contributor(s) and not of MDPI and/or the editor(s). MDPI and/or the editor(s) disclaim responsibility for any injury to people or property resulting from any ideas, methods, instructions or products referred to in the content.

