Article

Assessment and Examination of Emergency Management Capabilities in Chinese Rural Areas from a Machine Learning Perspective

1
College of Marxism, Xi’an University of Science and Technology, Xi’an 710054, China
2
Telfer School of Management, University of Ottawa, Ottawa, ON K1N 6N5, Canada
*
Author to whom correspondence should be addressed.
Sustainability 2025, 17(3), 1001; https://doi.org/10.3390/su17031001
Submission received: 8 December 2024 / Revised: 19 January 2025 / Accepted: 21 January 2025 / Published: 26 January 2025

Abstract

:
The Chinese government’s rural rejuvenation program depends on improving the national Rural Emergency Management Capability (REMC). To increase the resilience of Chinese rural areas against external dangers, REMC and its driving elements must be effectively categorized and evaluated. This study examines the variations in REMC levels and driving factors across different cities and regions, revealing the spatial distribution patterns and underlying mechanisms. To improve REMC in Chinese rural areas, this research employs the Projection Pursuit Method to assess REMC in 280 cities from 2006 to 2020. Additionally, we identify 22 driving factors and use the Random Forest algorithm from machine learning to analyze their impact on REMC. The analysis is conducted at both national and city levels to compare the influence of various driving factors in different regions. The findings show that China’s REMC levels have improved over time, driven by economic growth and the formation of urban clusters. Notably, some underdeveloped regions demonstrate higher REMC levels than more developed areas. The four most significant driving factors identified are rural road density, rural Internet penetration, per capita investment in fixed assets, and the density of township health centers. At the city level, rural Internet penetration and the e-commerce turnover of agricultural products have particularly strong driving effects. Moreover, the importance of driving factors varies across regions due to local conditions. This study offers valuable insights for the Chinese government to enhance REMC through region-specific strategies tailored to local circumstances.

1. Introduction

In recent years, the frequency of natural disasters and sudden public health events has increased, constantly challenging the emergency response capacities of governments at all levels and impacting national development. As a major agricultural country, China has a relatively low urbanization rate compared to highly developed nations. Moreover, many rural areas are located in marginal regions, facing fragile natural conditions, underdeveloped economies, and limited transportation infrastructure [1]. These factors significantly affect rural public safety. Due to limited resources and preparedness, rural areas struggle to cope with disasters, leading to substantial loss of life, property damage, and social disruptions. For instance, in 2023, natural disasters in China affected 95.44 million people, caused 691 fatalities or disappearances, and required the relocation of 3.344 million individuals. Additionally, 2.273 million houses were damaged, 10.54 million hectares of crops were destroyed, and the economic losses amounted to 345.45 billion yuan. The recurring nature of these disasters and the unique characteristics of rural areas highlight the critical need to improve emergency management capabilities. Rural emergency management plays a central role in the broader national system, influencing both public safety and governance modernization [2]. However, despite its importance, the rural emergency management system in China remains underdeveloped, requiring substantial improvements to enhance its effectiveness [3].
Globally, rural emergency management challenges in regions with similar geographical and economic characteristics have gained increasing attention. In many developing countries, particularly those in tropical and subtropical regions, rural areas are frequently exposed to natural disasters. For instance, in agricultural-dependent regions of India and Bangladesh, the absence of effective emergency management systems in response to monsoons, floods, and other calamities has resulted in inefficient post-disaster relief efforts and inequitable resource distribution. Similarly, in sub-Saharan Africa, poverty and underdeveloped infrastructure exacerbate the social consequences of natural disasters. These nations generally experience limited REMC, but they are actively pursuing solutions to address these shortcomings. Notable approaches include leveraging information technology, implementing disaster early warning systems, and fostering cross-regional cooperation to enhance disaster response efficiency and strengthen emergency management frameworks.
China has vast rural areas and a large agricultural population. Due to differences in geography, economic conditions, and population quality, Rural Emergency Management Capability (REMC) varies significantly across regions. The factors influencing REMC also differ from one area to another, posing new challenges to the existing evaluation indicator system for emergency management capabilities. Previous studies have primarily examined aspects such as emergency subjects, mechanisms, resources, and concepts [4]. However, most of these studies focus on specific elements of REMC, lacking a comprehensive and systematic analysis. To address this gap, the present study draws on existing research and emergency management theories to propose an evaluation system for REMC that includes four key dimensions: prevention and preparedness, monitoring and warning, emergency response and rescue, and post-disaster recovery and reconstruction. The goal is to provide a holistic evaluation of REMC. Given the complex and multifaceted nature of the evaluation, this study employs an exploratory data analysis technique called the Projection Pursuit Method, which is driven by sample data. Unlike traditional evaluation methods, this approach does not rely on formal mathematical constraints [5], making it particularly suitable for high-dimensional, nonlinear evaluation challenges. It has been successfully applied to various fields, such as debris flow disasters [6], emergency shelter suitability [7], seawall safety [8], and sudden public health events [9].
However, merely evaluating REMC is insufficient to provide concrete solutions for enhancing its capabilities. Therefore, it is essential to explore its driving factors. Through driving factor analysis, it is possible to identify which factors are most critical for improving rural emergency management capabilities, enabling policymakers to allocate limited resources to the areas where they can be most effective, rather than increasing investments indiscriminately. This analysis can also reveal the unique influencing factors behind the varying levels of capabilities across different regions, providing a basis for developing tailored improvement plans. Consequently, this study employs the Random Forest algorithm from machine learning to analyze the driving factors of REMC, focusing on five dimensions: digital construction, rural governance, economic development, rural environment, and living atmosphere, and selecting 22 driving factors to investigate the driving mechanisms of REMC.
In summary, this study provides a comprehensive evaluation of China’s REMC and explores its underlying driving factors. Specifically, the study aims to achieve the following objectives:
(1)
Investigate the developmental trends and spatial-temporal evolution patterns of REMC in China;
(2)
Select and eliminate driving factor indicators;
(3)
Explore the driving mechanisms of China’s REMC at both national and urban levels.
To achieve these objectives, this study utilizes the constructed evaluation indicators for emergency capabilities, employs the Projection Pursuit Method to comprehensively assess the REMC of 280 cities in China from 2006 to 2020, and leverages the Random Forest algorithm for driving factor analysis. Comparisons are made between national and urban levels, providing a comprehensive evaluation from macro to specific regions. The theoretical contributions of this study include enriching the construction of REMC evaluation indicators, expanding the application of the Projection Pursuit Method in the field of emergency management capabilities, and combining it with the Random Forest algorithm to assess REMC and analyze its driving factors, offering new research approaches for exploring REMC. The practical significance of this study lies in investigating the spatial-temporal evolution trends of China’s REMC, comparing regional characteristics, identifying key influencing factors, and providing decision support for governments to enhance REMC in a targeted manner.

2. Literature Review

2.1. Assessment of Rural Emergency Management Capability

In the context of assessing the influencing factors on rural emergency management capabilities, scholars have conducted in-depth investigations from multiple perspectives. These assessments primarily focus on the four stages of prevention, preparation, response, and recovery [10], or alternatively, the three phases of pre-disaster, disaster, and post-disaster management [11]. Firstly, economic conditions are identified as a critical factor influencing rural emergency management capabilities [12]. Due to the relatively low fiscal revenue in most rural areas, there is insufficient investment in infrastructure development, upgrading of early warning and monitoring systems, emergency supplies reserve, and professional team training. This directly undermines the ability of rural areas to respond swiftly and effectively to natural disasters, pandemics, and other emergencies [13]. Social mobilization capacity is another focal point of research, encompassing the ability of rural communities to organize and coordinate resources during emergencies [14]. Studies indicate that the social networks and capital within rural areas play a significant role in emergency management and rescue operations. Robust social mobilization capabilities facilitate the effective integration and utilization of various resources, expedite the transmission and sharing of information, and enhance the efficiency of responding to emergency events [15]. Furthermore, the establishment of information dissemination channels is equally indispensable, particularly in remote regions where information insufficiency can lead to delayed responses or improper measures. Developing a multi-channel, high-efficiency information dissemination mechanism is crucial to ensure that villagers can promptly and accurately receive disaster warnings and response guidance, thereby significantly improving rural emergency management capabilities [16].
In addition to the factors mentioned earlier, public education and drills, technological support, and regulatory policies are also key influences on enhancing rural emergency management capabilities. Public education and drills directly impact residents’ basic safety awareness and self-rescue abilities in rural areas [17]. Regular drills promote the spread of emergency management knowledge, strengthen safety awareness, and improve villagers’ self-rescue and mutual assistance skills during emergencies. Regarding technological support, the rapid advancement of information technology has made the use of smart technologies essential for improving rural emergency management efficiency. Tools like drone inspections and satellite remote sensing enable early warnings and real-time disaster monitoring. Additionally, mobile Internet and social media platforms facilitate the rapid dissemination of disaster information and rescue instructions, thereby accelerating response times [18]. Regulatory policies are critical in supporting the establishment of rural emergency management systems at both the national and local levels. These policies provide the financial and technical support necessary for rural emergency management and promote the development of laws and regulations, ensuring that emergency management activities comply with legal standards [19]. Through mechanisms such as dedicated funding, technical training, and legal advocacy, favorable conditions can be created to strengthen rural emergency management capabilities, ensuring optimal allocation and utilization of resources.

2.2. Driving Factors of Rural Emergency Management Capability

Rural emergency management capabilities are influenced by a range of social, economic, and natural factors [20], making their drivers multifaceted and complex. The improvement of these capabilities results from the interaction of various factors, with social elements playing a particularly important role [21]. First, rural governance and the living environment are crucial drivers of enhanced emergency management. Grassroots organizations, by establishing regulations, providing financial support, and offering technical guidance, can significantly promote the development and strengthening of rural emergency management systems. Second, residents’ quality of life and living conditions also play a major role in shaping rural emergency management capabilities.
Economic and natural factors are equally indispensable. In terms of economic factors, the level of rural economic development directly affects the availability and efficiency of emergency management resources, as well as the construction of digital infrastructure [22]. Rural areas with a more developed economy typically have the capacity to invest more in the construction of emergency management facilities, procurement of equipment, and personnel training, thereby enhancing overall emergency management capabilities. In terms of natural factors, the types, frequency, and intensity of natural disasters in rural areas directly influence the demands and challenges for emergency management capabilities [23]. For instance, regions frequently affected by floods, droughts, or earthquakes require more sophisticated early warning systems, scientific risk assessment methodologies, and efficient emergency response mechanisms [24].

2.3. Research Gaps

In the extant research, although scholars have explored the influencing factors of rural emergency management capabilities from various perspectives, certain deficiencies remain. Firstly, most studies focus on macro factors such as traditional economics, social mobilization, and information dissemination channels, with insufficient discussion of the application of digital technologies and their specific impacts. For example, the role of digital technologies in monitoring and early warning for emergency management, as well as in hazard identification, has not been adequately analyzed and evaluated. Secondly, there is a lack of in-depth exploration regarding how the crisis information processing capabilities of grassroots organizations and the mobilization of rescue forces can effectively enhance the speed and effectiveness of emergency management. These shortcomings may result in an incomplete assessment of rural emergency management capabilities, failing to accurately reflect the new features and demands of the digital age.
Additionally, there are some deficiencies in the study of driving factors. Existing research predominantly focuses on policy support, economic development levels, and natural conditions, with fewer discussions of whether digital technology driving factors and the living atmosphere of rural residents affect rural emergency management capabilities. For instance, issues such as digital infrastructure and agricultural digitization are rarely addressed in the current literature. Therefore, this paper places more emphasis on the application of digital technologies in rural emergency management, exploring their mechanisms for enhancing emergency management capabilities, to adapt to the evolving disaster environments and technological development requirements.

3. Methodology

3.1. Data Selection

3.1.1. Indicator System of Rural Emergency Management Capability

Drawing on the unique characteristics of rural China, this paper proposes four distinct mechanisms based on the balanced emergency management theory: prevention and preparedness, monitoring and early warning, emergency response and rescue, and post-event recovery and reconstruction. A comprehensive review of the literature reveals that the prevention and preparedness phase includes emergency support and publicity and drill capabilities; the monitoring and early warning phase covers monitoring and hazard investigation capabilities; the emergency response and rescue phase focuses on decision-making, command, and rescue coordination capabilities; and the post-event recovery and reconstruction phase involves recovery, reconstruction, and resettlement security capabilities. Digital technology plays a crucial role across all these phases of emergency management. Based on this framework, the paper develops four primary indicators, seven secondary indicators, and 25 tertiary indicators—such as emergency funding reserves, mobile communication signal strength, and response speed in emergency linkages (see Table 1)—to assess the emergency management capabilities of China’s digital villages.

3.1.2. Selection of Driving Factors

This study examines the driving factors of emergency management in China’s digital villages from the perspectives of socio-economic development and environmental conditions. Building on previous research, we classify these driving factors into five categories: digital infrastructure development, rural governance, economic development, rural environment, and living atmosphere, resulting in a total of 22 distinct factors. Detailed variables are presented in Table 2. Using machine learning techniques, we rank these factors across different rural areas in China, exploring the heterogeneity of driving factors among various villages.

3.2. Data Source

This research covers the period from 2005 to 2020, during which a set of 25 quantifiable parameters were used as comprehensive evaluation indicators for rural emergency management capabilities. These indicators were primarily drawn from authoritative sources, including “China’s Agricultural and Rural Annual Reports (2005–2020)”, “China Emergency Management Yearbook”, “National Comprehensive Risk Assessment Report on Natural Disasters”, “Research Report on Disaster Prevention and Mitigation Capabilities in Rural China”, “Disaster Loss Statistics Report from the Ministry of Agriculture and Rural Affairs”, and “Regulations on Emergency Response to Public Health Emergencies”. The computation of these indicators was carried out according to the respective formulas.
It is important to note that, in order to ensure the quality of the input data and the accuracy of the models, this study performed comprehensive data preprocessing before modeling. Preprocessing included the following steps:
(1)
Data Cleaning: Missing values, outliers, and duplicate data were addressed during this stage. For missing values, mean imputation and interpolation methods were employed, depending on the specific characteristics of the data.
(2)
Standardization and Normalization: To mitigate the impact of scale differences across various indicators, all data were standardized using Z-score normalization, ensuring that each variable had the same scale.
(3)
Feature Selection: Relevant driving factors that showed significant correlation with the target variable were selected through correlation analysis and stepwise regression. Redundant variables were eliminated during this process.
After the data preprocessing steps were completed, including data cleaning, standardization, and feature selection, the processed data were then used to identify the most significant driving factors through advanced analytical techniques. In particular, the Projection Pursuit Method was employed to effectively capture the underlying patterns and relationships within the high-dimensional data. This method allows for the extraction of meaningful low-dimensional projections, enabling a more accurate identification of influential factors while preserving the nonlinear interactions present in the data.

3.3. Research Methods

(1)
Projection Pursuit
Projection Pursuit (PP), introduced by American scientist Kruscal in the 1970s, is a method designed to address nonlinear, high-dimensional data issues. Due to the substantial computational demands of the PP algorithm, its practical application has faced certain challenges. To overcome the limitations of traditional optimization methods, this study combines the Real-coded Accelerated Genetic Algorithm with the Projection Pursuit technique for a systematic evaluation of rural emergency management capabilities. Detailed methodologies are presented in the following sections.
The evaluation sample set for digital rural emergency management capabilities is defined as { x ( i , j ) | i = 1,2 , n , j = 1,2 , p } , where x ( i , j ) represents the value of the j t h indicator in the i t h year, with n and p denoting the number of years and evaluation indicators, respectively. In this case, n = 11 ,     p = 25 . The first step involves standardizing the raw data. For indicators where higher values are preferred:
x i , j = x i , j x m i n j / x m a x j x m i n j x i , j = 1 x i , j x m a x j  
For indicators of rural emergency management capabilities where a lower value is preferable:
x i , j = x m a x j x i , j / x m a x j x m i n j x i , j = 0 x i , j x m a x j  
x m i n j and x m a x j represent the minimum and maximum values of the j t h indicator within the evaluation index system, respectively, while x i , j denotes the normalized value sequence. Using the optimal projection direction, a visual analysis of the 25 evaluation indicators for rural emergency management capabilities in China is conducted for each year. The P-dimensional normalized sample data x i , j j = 1,2 , p is projected into a one-dimensional value using a specific projection direction, a = a 1 , a 2 , a p :
z i = j = 1 p   a j x i , j i = 1,2 , n
In this context, a represents a unit vector indicating the projection direction, and z i denotes the integral linear projection value for the i t h rural emergency management capability evaluation sample, encapsulating the structural combination of data across multiple dimensions. The projection index z i aims to capture as much variation from x i , j as possible, reflecting the scattering characteristics of low concentration and high dispersion. Accordingly, the projection indicator function Q a is defined by the following formula:
Q a = S z · D z  
The variables S z and D z represent the standard deviation and local density of the projected values z i , respectively, and are defined as follows:
S z = i = 1 n   z i E z 2 n 1  
D z = i = 1 n   j = 1 n   R r i , j u R r i , j
E z denotes the expected value of the set z i i = 1,2 , n , and R represents the window radius for local density, typically set to 2 p . The quantity r i , j indicates the distance between samples, while u t is the unit step function, defined as 1 for t 0 and 0 for t < 0 .
Once the sample set of evaluation indices for rural emergency capabilities is determined, the variation in the projection direction a leads to a corresponding change in the projection index function Q a . Different projection directions reflect the distinct structural characteristics of the indexed data. When Equation (4) reaches its maximum, the corresponding a represents the optimal projection direction vector, encapsulating information such as the weights of each indicator. Thus, a can be computed by maximizing the projection indicator function, allowing for the determination of the respective weights for each evaluation indicator.
m a x Q a = S z · D z
The constraint is stipulated as:
j = 1 p   a 2 j = 1  
Given the challenges inherent in addressing complex nonlinear problems with optimization variables using traditional optimization methods, this paper employs a Genetic Algorithm (GA) to effect improvements.
Utilizing the optimal projection direction a derived from Equation (3), each sample’s projected value z ( i ) , which encapsulates information about the evaluation indicators, is computed. Higher values of z ( i ) indicate higher levels of rural emergency management capability. The implementation leverages Matlab 2018b for programming, with a total population size of N = 400 , crossover probability P c = 0.8 , mutation probability P m = 0.2 , number of optimization variables n = 12 , the requirement for M = 10 random numbers in mutation direction, and an acceleration factor of 7.
(2)
Random Forest
Using bootstrap resampling, the Random Forest (RF) constructs multiple resampled datasets from the original sample and builds decision trees for each bootstrap sample h x , θ where i = 1 ,   2 , k . The parameter set θ k is a random vector with independent and identically distributed (i.i.d.) components. The ensemble prediction is obtained by aggregating the predictions of multiple decision trees through a voting mechanism. Extensive theoretical and empirical studies show that RF offers high predictive accuracy and is robust against overfitting.
In this study, the variables are numeric and the training set is assumed to be independently sampled from the joint distribution of random vectors Y and X . The mean squared generalization error E X , Y ( Y h ( X ) ) 2 is computed for any numeric prediction value h ( x ) . The predicted value is the average of k regression trees h ( x ) , where i = 1,2 , k .
The primary steps of the algorithm are as follows: First, the original training set T = x 1 , y 1 , x 2 , y 2 , , x n , y n is labeled and a sequence of random vectors θ k ( i = 1,2 , , k ) is generated. Next, the Bootstrap sampling method is used to draw k sub-samples from dataset T, denoted as T i ( i = 1 ,   2 , , k ) . A regression model h x , θ i , i = 1 ,   2 , , k is established for each sub-sample. For each sub-sample set, the matrix X represents the independent variables, and it is assumed that the parameter set { θ k } is i.i.d. After k rounds of training, a series of regression tree models h 1 X , h 2 X , , h n X is obtained. For any new sample, the prediction is the average of the k results.
G ( x ) = 1 k i = 1 k   h i ( x )
The function G ( x ) represents the outcome of the Random Forest regression model, while h i denotes the result of an individual regression tree. Different sample sets are generated through bootstrap sampling and used to build separate regression tree models. This approach enhances predictive accuracy and increases model diversity. Ultimately, the results from all decision trees are aggregated.
The model’s performance is evaluated using the mean squared error (MSE), mean absolute error (MAE), and correlation coefficient R between the actual and predicted values of G ( x ) . Adjustments to the model are made based on these metrics. A favorable prediction is indicated by small values of RMSE and MAE, along with a correlation coefficient R close to 1. The metrics are defined as follows:
R M S E = i = 1 n   ( y ^ i y i ) n  
M A E = 1 n i = 1 n   | y ^ i y i |
R = ± i = 1 n   y ^ i y ¯ 2 i = 1 n   y i y ¯ 2
In the equation, y i and y ^ i represent the observed and predicted values of the i t h sample, respectively. y denotes the mean of the observed values, and n is the sample size.
To understand the mechanisms underlying China’s Rural Emergency Management Capability (REMC), this study employs a workflow using Random Forest to identify driving factors, consisting of three main steps: factor selection, model training, and core factor identification. First, 22 potential driving factors are screened based on the relationship between urban development and carbon emission efficiency, and Pearson correlation analysis is performed to identify multicollinearity among these factors. This helps select key representative factors. Next, multidimensional variables from urban-related datasets are used as input features to create the training dataset for the Random Forest model, with the importance of driving factors across various urban types as the output variables. The model’s accuracy is evaluated through testing and simulation. Finally, the trained Random Forest model, combined with cross-validation, is used to identify and rank the core driving factors for each city. This approach ensures a thorough and rigorous identification process, enhancing the model’s explanatory power and practical applicability in urban sustainability and carbon emission management.
It is important to note that all data processing and modeling in this study were conducted in a Python 3.8 (or higher) environment. The Projection Pursuit method was implemented using the sklearn library and custom algorithmic packages. During model training, grid search optimization was applied for hyperparameter tuning, focusing on key parameters such as learning rate, number of iterations, and projection dimensions. This optimization significantly improved the model’s predictive accuracy and computational efficiency.

4. Results and Discussion

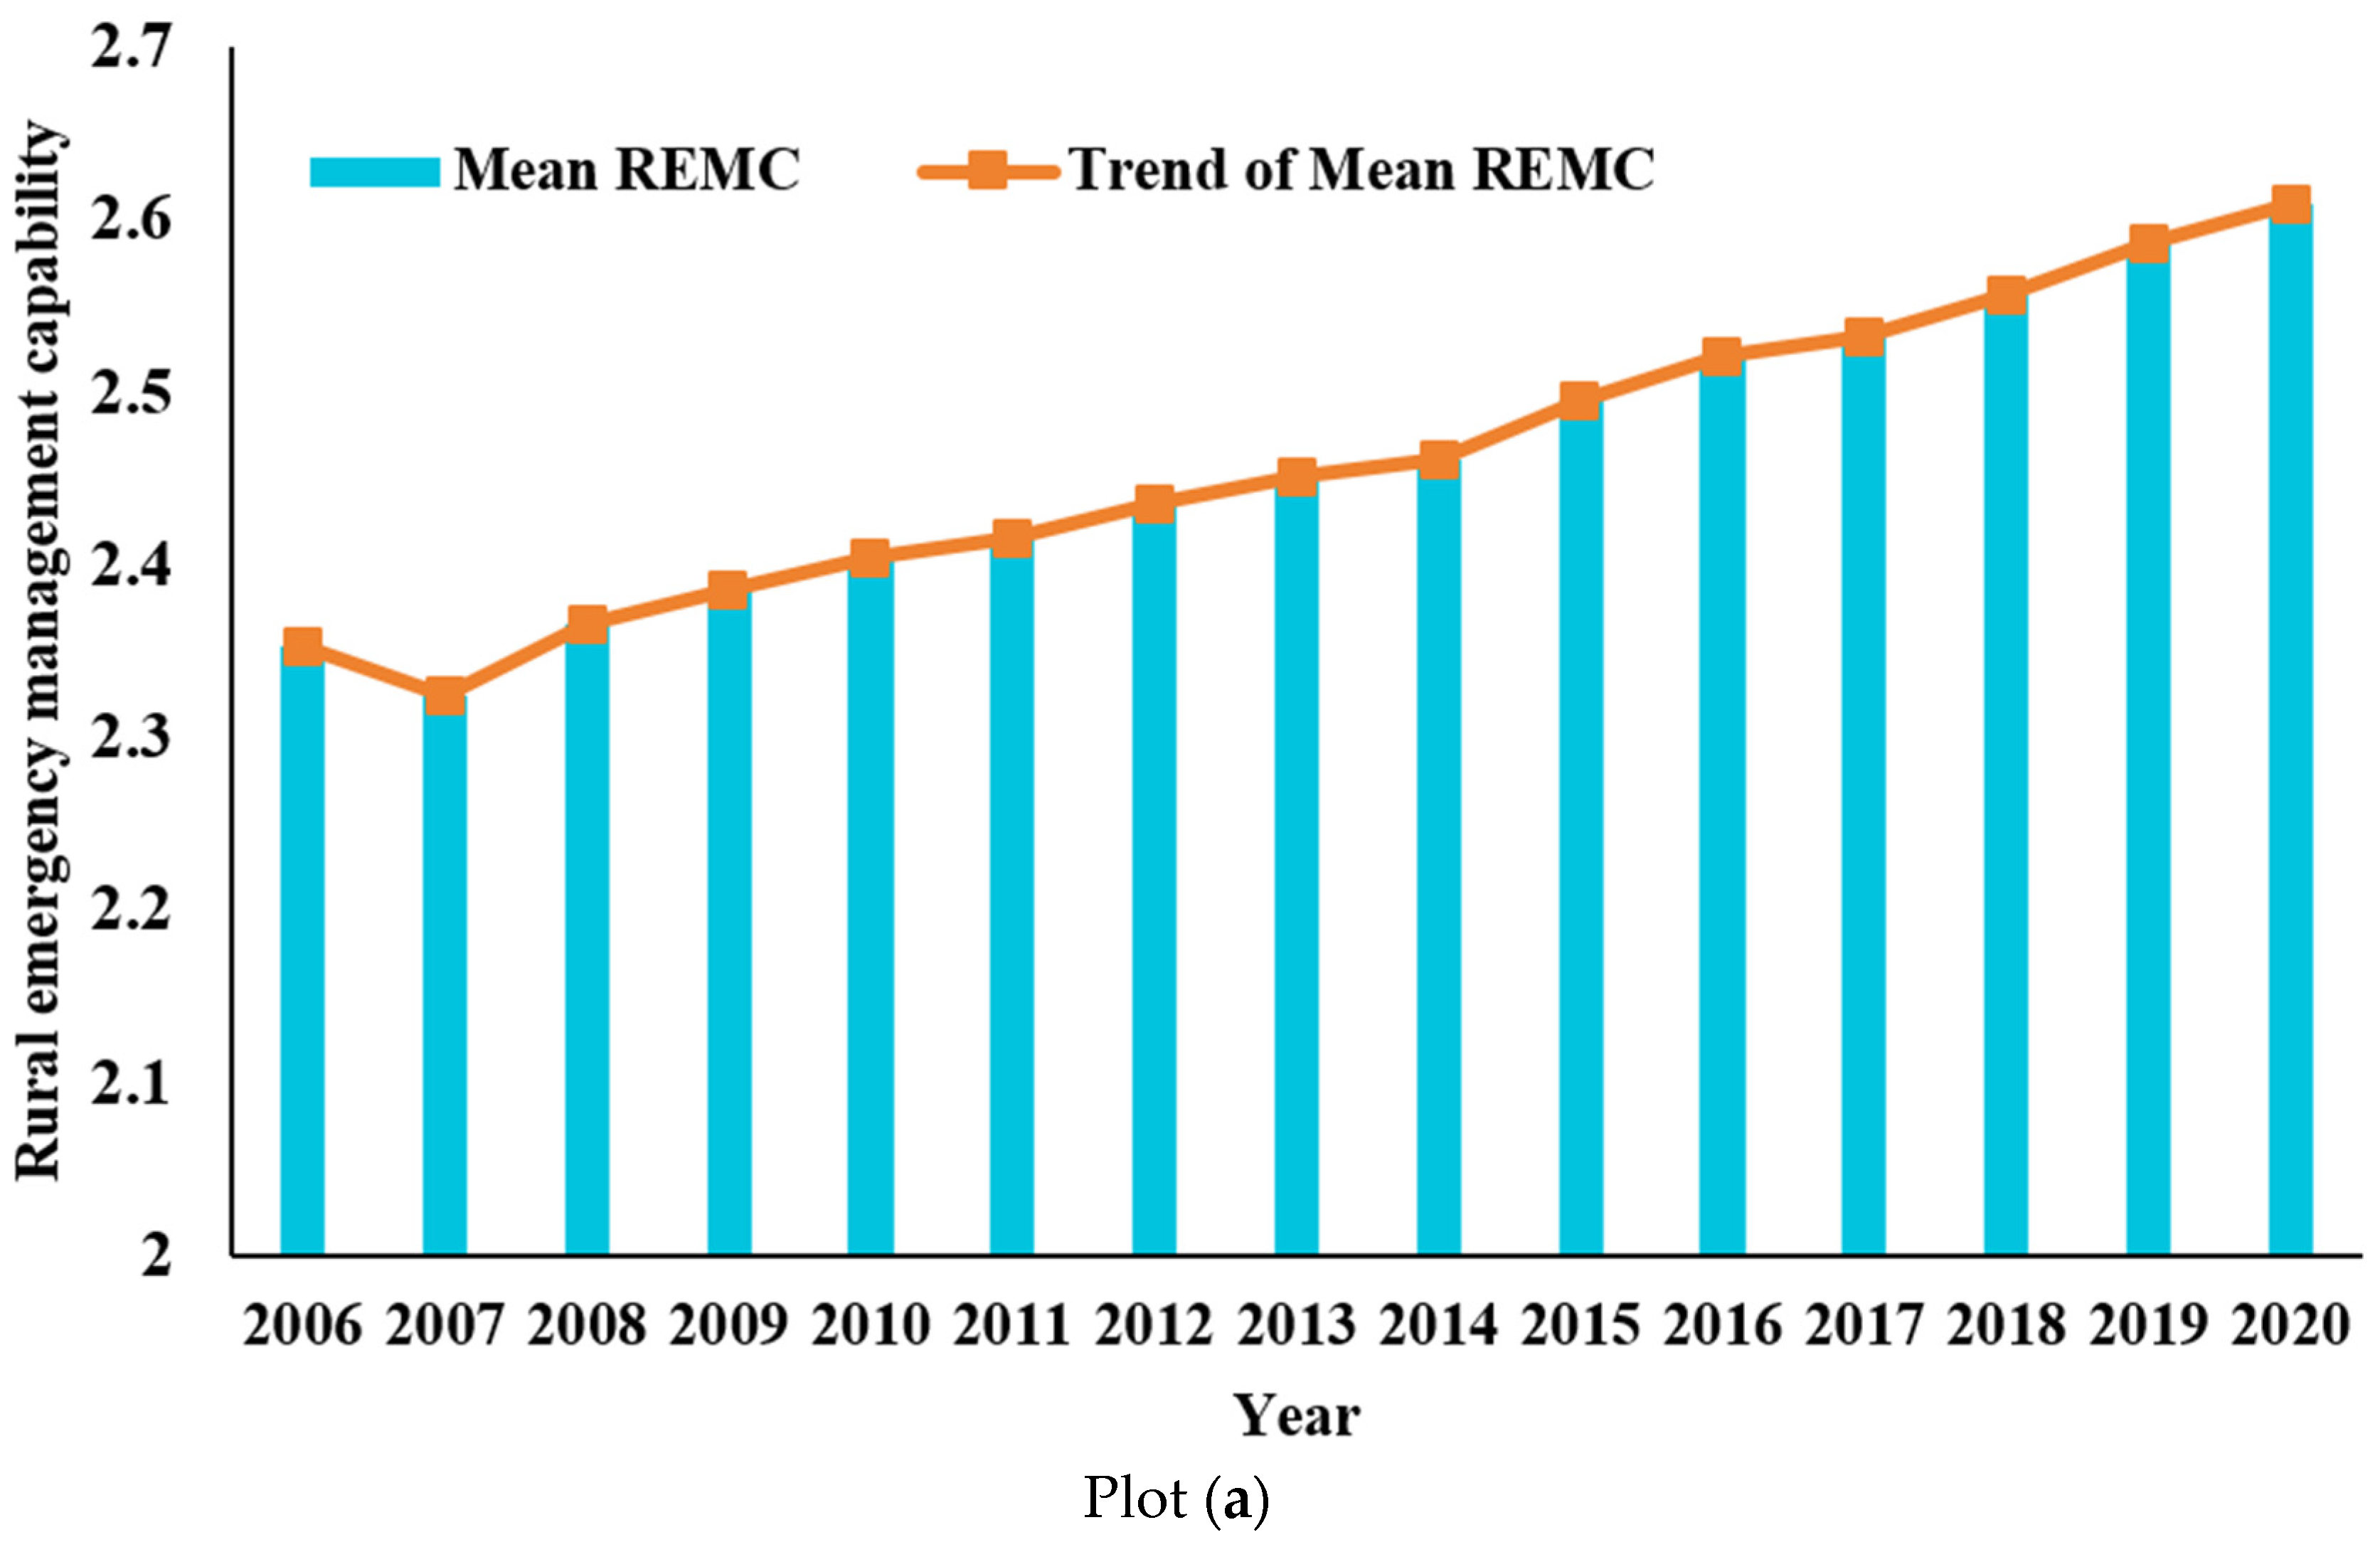
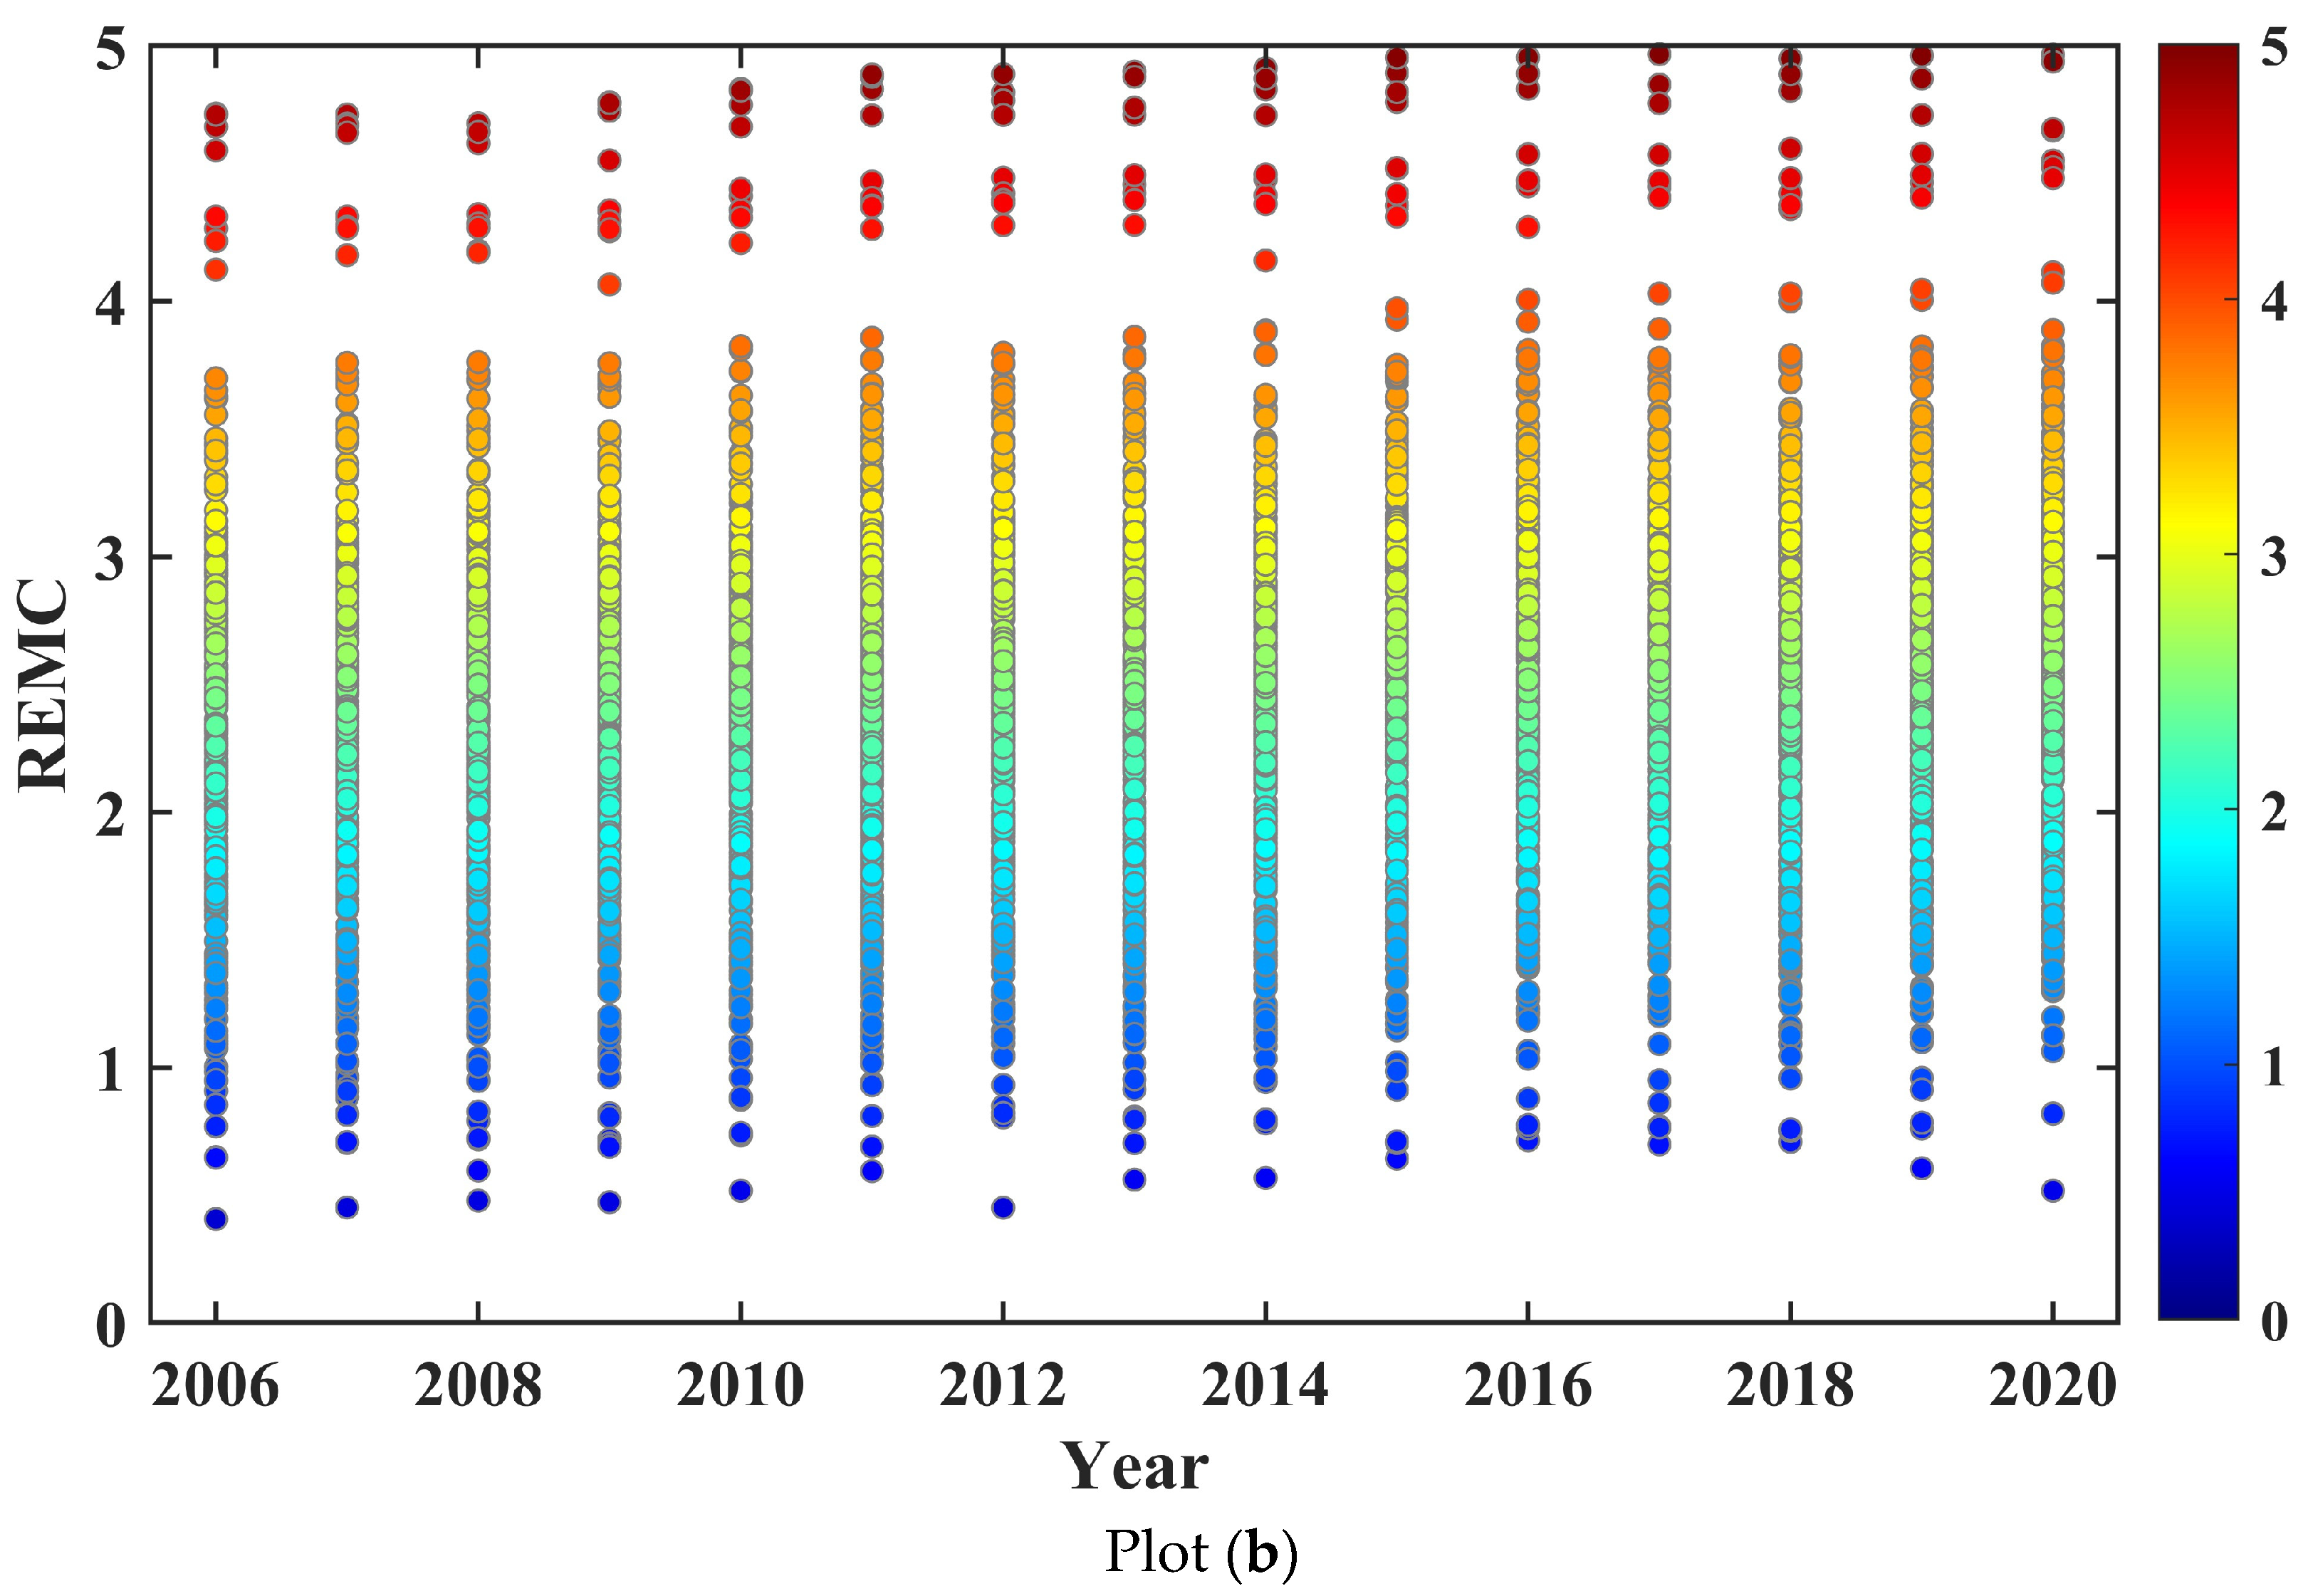
4.1. Spatial-Temporal Analysis of Rural Emergency Management Capability

This study assesses the level of REMC (Rural Emergency Management Capability) among 280 Chinese cities from 2006 to 2020. As depicted in Figure 1, subplot (a) illustrates the overall trend of REMC fluctuations over these years. It is evident that the REMC in China exhibited an overall increasing trend, consistent with the findings of study [50]. However, a decline was observed in 2007, primarily attributable to 2006 being a pivotal year for the construction of China’s emergency management system. Following the introduction of the “National Overall Emergency Plan for Public Emergencies” in 2006, local governments commenced the development and enhancement of emergency management mechanisms. The year 2007 may have been a period of transitional challenges, where the implementation of policies in rural areas lagged behind urban areas. The effects of the 2006 policy, particularly in some rural regions, were not immediately evident, with its full impact likely becoming apparent in 2008. Additionally, the acceleration of the urbanization process in China in 2007 may have led to reduced prioritization of rural areas in public services and resource allocation. Conversely, a significant surge in REMC began in 2015, coinciding with the commencement of the United Nations’ “Sendai Framework for Disaster Risk Reduction 2015–2030”. In response, the Chinese government enhanced the top-level design of emergency management, integrating the development of emergency capabilities in rural areas into national development planning. China actively engaged in international disaster risk reduction cooperation and applied advanced international concepts and technologies to rural emergency management, fostering rapid improvements in domestic emergency management levels.
Subplot (b) of Figure 1 specifically details the distribution of REMC across Chinese cities. It reveals that REMC values predominantly ranged between 2 and 3, with most cities exhibiting moderate to low REMC levels. However, over time, there is a noticeable upward shift in color blocks, and the number of cities with REMC values below 1 gradually decreases. This trend indicates an overall increase in REMC across most cities, corroborating the evolution observed in subplot (a).
To further explore the temporal and spatial distribution from 2006 to 2020, we employed the natural breaks method to categorize the REMC in China into five levels. The calculation results are illustrated in Figure 2. Overall, from 2006 to 2020, China’s REMC exhibited an upward trend. However, significant disparities in REMC existed among different cities. In 2006, REMC levels were generally low across regions, with central China, as a major agglomeration of agricultural activities, boasting a broad rural population base and rich emergency management experience, aligning with the findings of study [51]. By 2010 and 2015, REMC across the nation had notably increased, gradually forming urban clusters, where the REMC in the eastern and southern coastal regions began to catch up and even surpass that of inland areas. This development was largely attributable to their rapid economic growth and substantial investments in emergency management, which yielded significant anticipated economic and social benefits, reflecting an ideal state of sustainable development. By 2020, a distinct “urban cluster” spatial layout emerged, characterized by significant agglomeration effects in urban clusters such as the “Beijing–Tianjin–Hebei”, “Yangtze River Delta”, “Chengdu–Chongqing Urban Cluster”, “Central Plains Yellow River Basin”, and “Pearl River Delta”. These agglomeration effects facilitated enhanced regional collaboration in addressing potential safety risks.
Additionally, in the three economically less-developed provinces of Yunnan, Guizhou, and Sichuan, some areas exhibited higher REMC than those in the economically advanced eastern regions. This phenomenon could be attributed to the mountainous terrain and complex geological conditions in Yunnan, Guizhou, and Sichuan, which are prone to frequent natural disasters such as earthquakes, floods, and landslides. See Table 3 for details. The chronic incidence of such disasters has compelled local governments and communities to develop higher emergency awareness and management capabilities, thereby establishing robust emergency mechanisms. Moreover, the rural social structure in these regions is more cohesive, with closer interpersonal relationships, allowing for quicker responses to emergencies through autonomous village governance and mutual aid networks, forming a unique emergency management system. This situation underscores that emergency management levels are not solely determined by economic development but are also closely related to factors such as natural environment, policy support, social culture, and governance models. Economically less developed regions can “leapfrog” through these non-economic factors, offering valuable experiences for other regions in emergency management.

4.2. Driving Factors of Rural Emergency Management Capability

4.2.1. Multicollinearity Analysis and Random Forest Model Training

The Random Forest algorithm builds multiple decision trees by randomly selecting features and samples, effectively reducing the impact of feature correlation and collinearity. As a result, compared to other linear regression algorithms, Random Forest regression is less susceptible to multicollinearity. However, when highly collinear features are present in the dataset, it remains essential to evaluate the dataset when constructing the REMC regression model to prevent potential issues and ensure the accuracy of variable importance assessments. To validate the effectiveness of the model, we employed the ROC curve to assess its performance. The training results are presented in Appendix A.
This study selected 22 driving factors to explore the societal and economic mechanisms influencing REMC. The results reveal strong correlations among some factors. For example, the correlation coefficient between Rural Internet penetration (A1) and the Rural digital financial inclusion index (A4) is close to 1 (0.8–1.0), indicating a strong relationship, as shown in Figure 3. Conversely, a negative correlation exists between Coverage of township cultural centers (B4) and Level of agricultural mechanization (A3) (−0.7~−0.9), implying that an increase in B4 is typically associated with a decrease in A3, suggesting a conflicting relationship within the system. The correlation between B4 and Per capita household income (C1), as well as Quantity of rainfall (D3), is near 0, indicating a weak linear relationship and minimal driving effect of B4 on these indicators. B4 shows weak positive correlations (0.3–0.5) with other B-class indicators, such as the Number of Communist Party members in communes (B2), suggesting limited synergistic effects within this category. Additionally, Rural gas penetration (E5) has low positive correlations (0.3–0.5) with Rural cable broadcasting and television penetration (A2) and Growth rate of rural electricity consumption (C4), indicating weak synergistic effects. E5 also exhibits negative correlations (−0.3~−0.6) with Township financial expenditures (B3) and Cultivated land area per capita (D1), suggesting inhibitory effects on these indicators. Given these correlations, excluding the highly collinear indicators B4 and E5 is advisable.

4.2.2. Driving Factors Analysis

The variations in economic development levels, resource endowments, risk tolerance, geographical locations, and other factors across different regions inevitably lead to discrepancies in the driving forces influencing emergency management capabilities. Neglecting regional heterogeneity and redundancy in factor information can result in inaccurate predictions and policy formulations lacking rationality. Therefore, a quantitative screening of the driving factors of REMC is essential. This paper employs the Random Forest algorithm to screen and rank the driving factors of REMC across various cities in China, with the results illustrated in Figure 4 and Figure 5.
Figure 4 presents the pivotal measurements of REMC significance. Rural road density (D2), Rural Internet penetration (A1), Investment in fixed assets per capita (C2), and Density of township health centers (E3) emerge as the four most crucial driving factors. Firstly, as posited by [52], the density of rural roads dictates the swiftness with which relief supplies and personnel can reach disaster-stricken areas during calamities or emergencies. A dense rural road network furnishes multiple escape routes for residents, thereby mitigating casualties in disasters. Secondly, the Internet serves as a critical conduit for disseminating warning information and guiding emergency response measures. High penetration rates ensure rapid coverage of disaster information to a broader populace, enabling the Internet to support remote monitoring, online coordination, and the functioning of disaster management systems. For instance, leveraging the Internet enables the anticipation of disasters through weather forecasts and sensor data. Additionally, fixed asset investment reflects the economic development level and resource allocation capability of rural areas. Regions with higher per capita investment in fixed assets are more likely to possess the capacity to construct and maintain critical emergency infrastructure, such as fire stations, rescue equipment, and communication networks. Lastly, township health centers constitute the frontline for medical treatment in rural areas during disasters. A high density of health centers can curtail the time required for post-disaster treatment, thereby enhancing the survival rates of affected individuals. These centers also play a role in disaster prevention (e.g., vaccination, health education) and monitoring during peacetime, bolstering the capacity of rural areas to handle sudden public health events, in alignment with [7] findings. Collectively, these four factors encapsulate the core elements of rural emergency management from infrastructure (road density), information dissemination (Internet penetration), economic resources (fixed asset investment), and healthcare services (health center density).
Figure 5 illustrates the ranking by importance of the top 10 city-level driving factors influencing emergency management capabilities, revealing significant variations in these factors across different municipalities. For instance, while Rural road density (D2) is deemed the most crucial factor at a national level as depicted in Figure 4, at the city level, Rural Internet penetration (A1) emerges as the most significant factor, as shown in Figure 4. Conversely, E-commerce turnover of agricultural products (A5) holds relatively lower importance at a national level but assumes higher relevance at the city level.
This disparity arises because, regardless of whether an area is economically developed or underdeveloped, road accessibility forms the foundation of rural emergency management. Post-disaster efficiency in dispatching relief supplies, equipment, and personnel hinges on the density and smoothness of road networks. The spatial distribution characteristics of rural areas render insufficient road density the most significant bottleneck for nationwide emergency management capabilities. However, when comparing different cities, A1 becomes the core driving factor in rural emergency management, indicating that cities with stronger emergency management capabilities emphasize information technology (IT) infrastructure. Cities such as Hangzhou and Ningbo in the southeastern coastal region exemplify this trend. In these cities, organizational capabilities for emergency management are stronger, and they often boast well-established infrastructure, rendering road density less of a constraint, consistent with [49] findings. Consequently, Internet penetration, as a critical tool for IT-based management, assumes heightened importance. Despite A5 being less significant at a national level, its importance is notably elevated at the city level. For cities that rely heavily on agricultural production and trade, such as Hangzhou and Yiwu, the turnover of agricultural e-commerce plays a pivotal role in disaster response. These cities prioritize restoring rural economies and ensuring the stability of agricultural supply chains through e-commerce platforms, aligning with [53] research.
The disparities in emergency management across cities underscore the necessity for policy design to fully consider regional economies, technological levels, and disaster characteristics. These differences between national and city levels not only reflect the impacts of economic development and technological conditions but also highlight the need for more refined and regionally tailored policies in disaster emergency management.

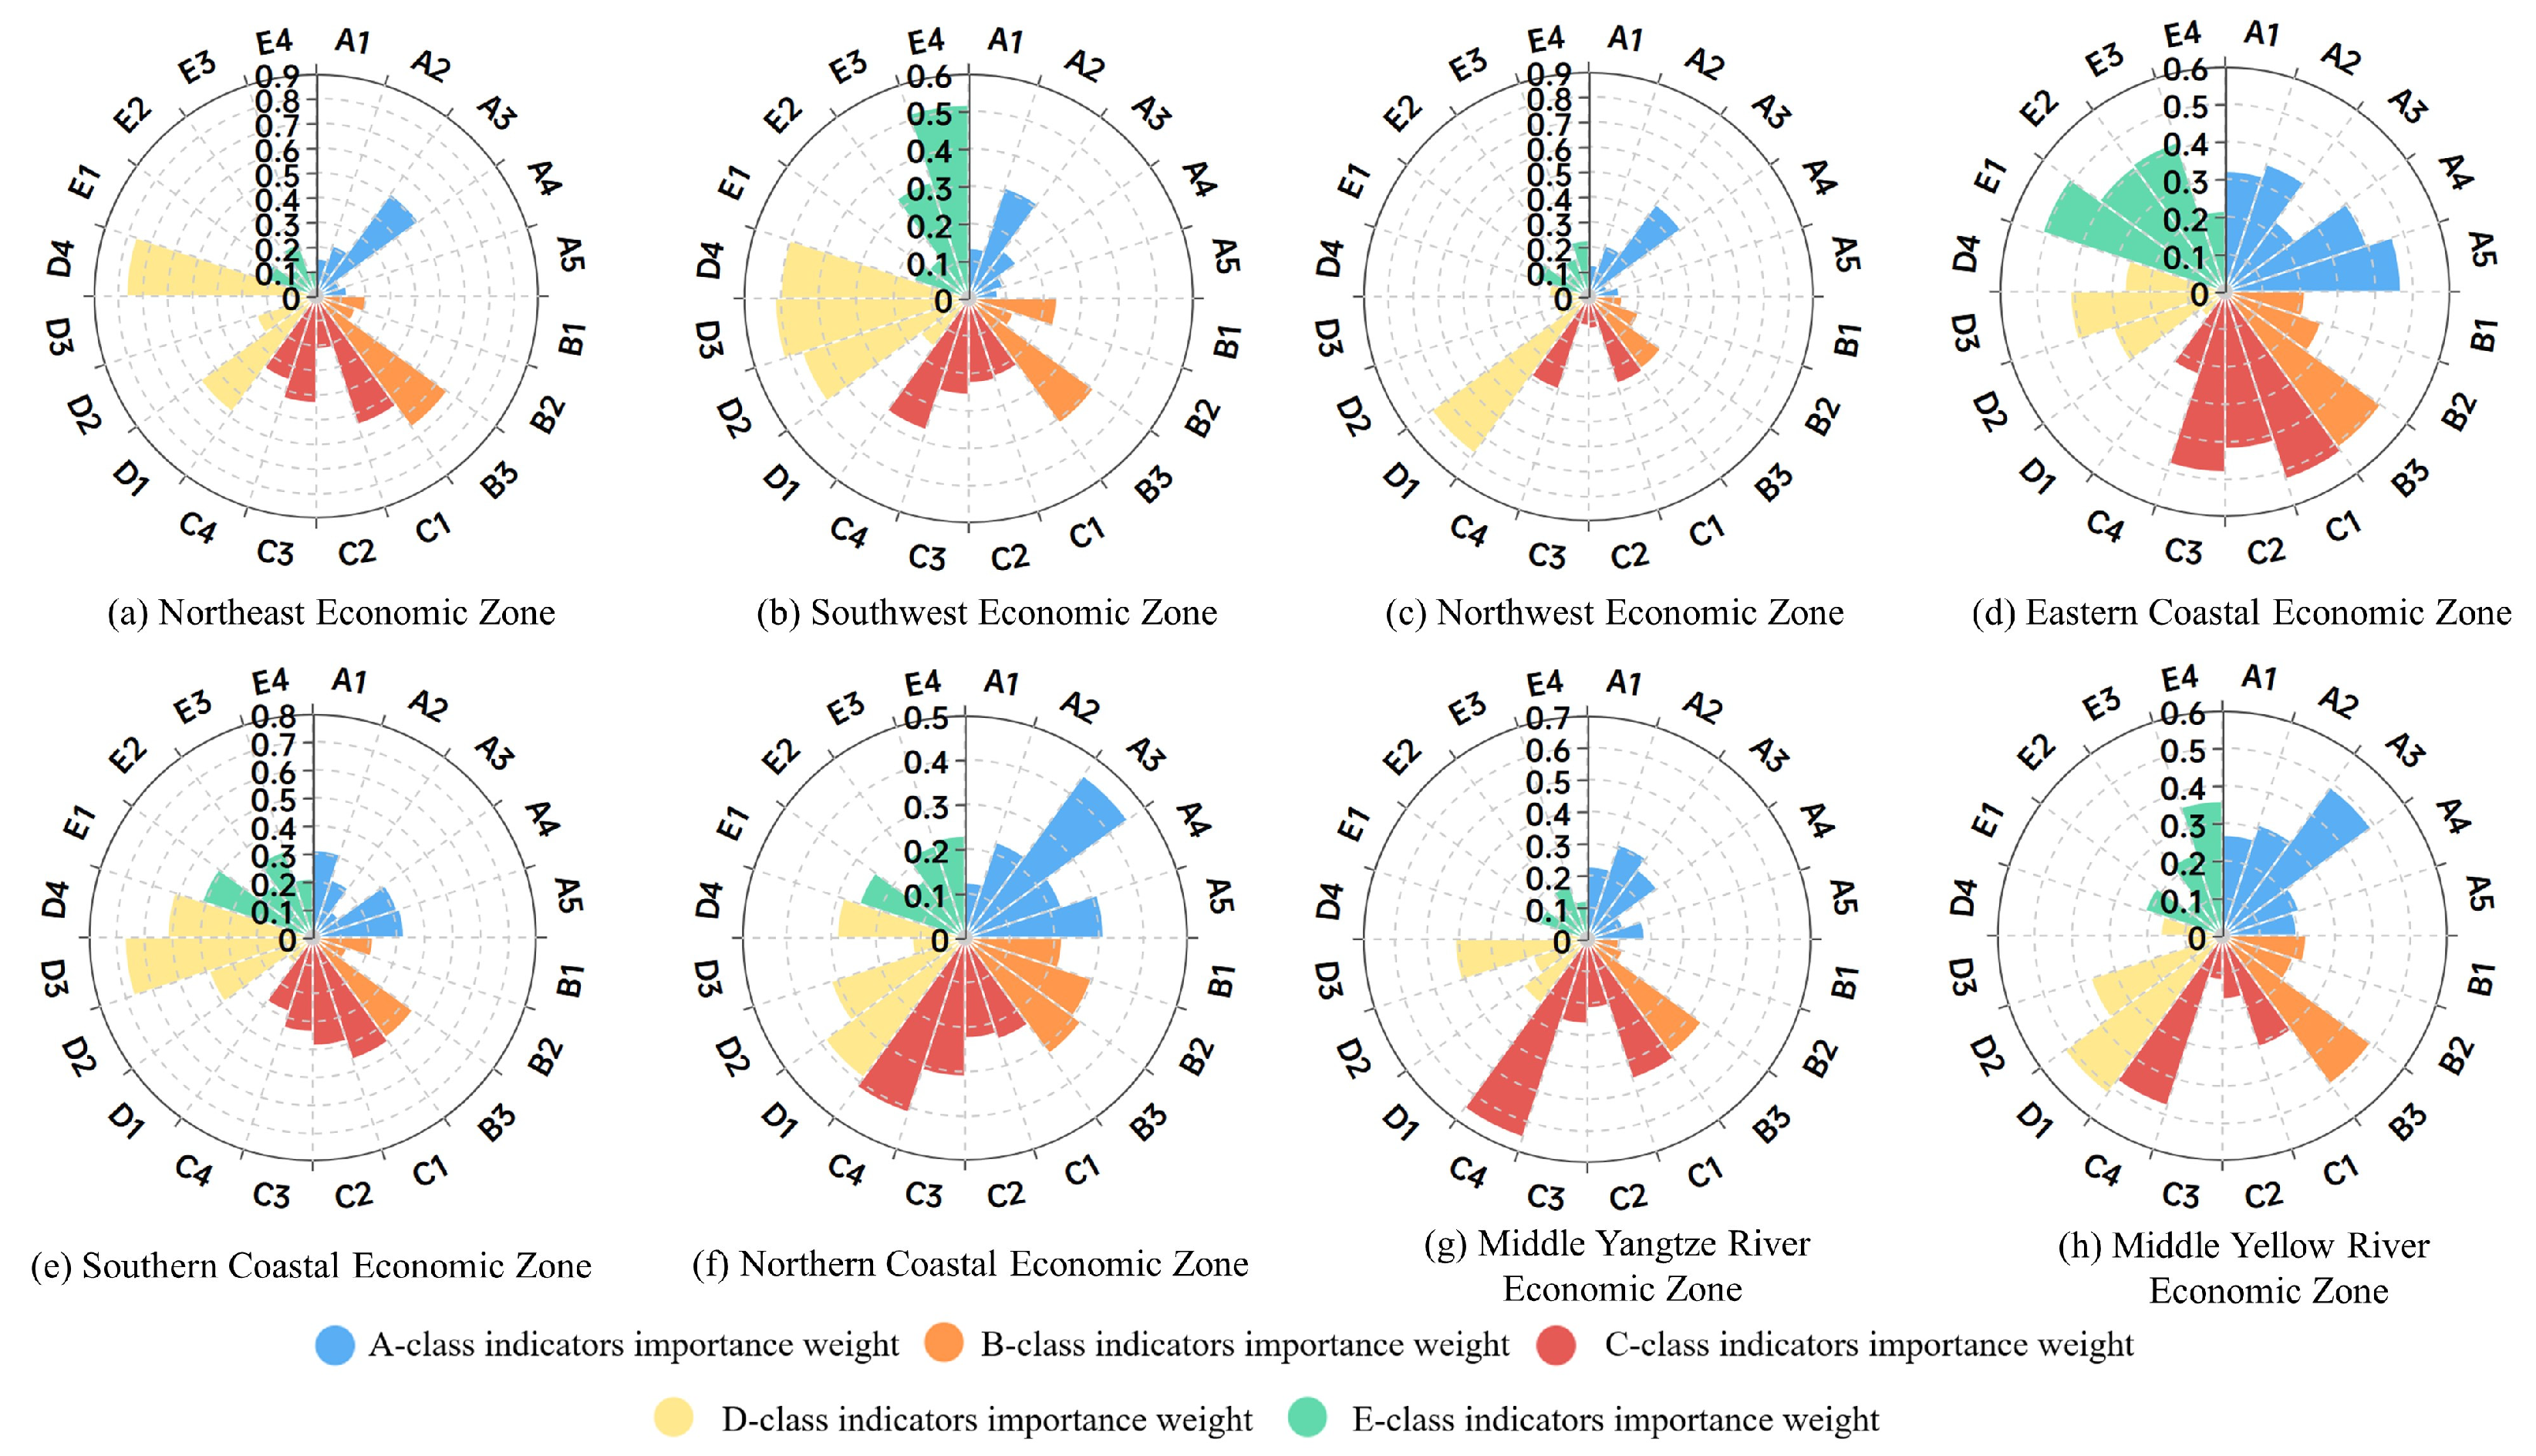
4.2.3. Regional Heterogeneity Analysis

Figure 6 compares the weightings of REMC driving factors across eight regions, revealing that A1 (Rural Internet penetration) generally holds a higher weight in most economic zones, particularly in the eastern and southern coastal economic regions. This observation indicates that digitalization and network technologies have become crucial supports for enhancing rural emergency management capabilities across various regions. In the northwest and southwest economic zones, despite being remote areas, the weight of A1 remains high, underscoring the importance of improving Internet penetration as a significant means to enhance emergency management efficiency. In remote areas such as the northwest and southwest regions, the weight of D2 (Rural road density) is noticeably higher than in other regions. This suggests that the development of rural transportation infrastructure in these areas directly determines the efficiency of emergency goods transportation and response capabilities, in alignment with [54] findings. In the Central Yellow River and the Central Yangtze economic zones, the weight of D2 is also relatively high, highlighting the critical role of transportation infrastructure in rural emergency management, especially in ensuring rapid accessibility during disasters. A5 (E-commerce turnover of agricultural products) has a higher weight in the southern and eastern coastal economic zones, reflecting these regions’ economic characteristics that rely heavily on agricultural trade and circulation. This likely indicates that agricultural e-commerce plays a significant role in ensuring the supply of materials during disasters and maintaining economic operations. In the Central Yangtze economic zone, the weight of A5 is also high, possibly related to the region’s significant status in agricultural circulation and the rapid development of its logistics industry.
C2 (Per capita fixed asset investment) has a relatively low weight in most regions, indicating limited direct impact on rural emergency management. This may be because fixed asset investment has a more long-term effect, whereas emergency management focuses more on short-term response capabilities. Particularly in the northwest and southwest economic zones, the weight of C2 is extremely low, suggesting that these regions may require more direct investments in infrastructure and resources rather than indirect economic development investments. Similarly, E4 (Per capita rural housing area) has a generally low weight across all regions. As housing area primarily reflects improvements in residents’ living conditions rather than emergency management efficiency, this metric has weaker correlations with response capabilities during disasters or emergencies, leading to its lower ranking in the weight order.
For the eastern coastal economic zone, the high weights of A1 (Internet penetration) and A5 (E-commerce turnover of agricultural products) indicate that the region has reached a highly digitalized and well-developed industrial chain stage, relying on information management and logistics circulation to optimize emergency management. For the northwest economic zone, D2 (Rural road density) dominates the weightings, indicating that infrastructure development remains a key focus to enhance emergency management capabilities. In comparison, the REMC in coastal regions is highly digitalized and has a complete industrial chain, relying on information management and logistics flow to optimize emergency management. This is determined by the characteristics of developed economy, policy support, and leading technology in these regions, which have advanced digital technology and abundant technical talents and are able to quickly respond to and apply new technologies to enhance emergency management capabilities. Although the northwest region is economically underdeveloped and its application of digital technology is insufficient, it can respond to the national policies (such as western development, precision poverty alleviation, and other policies) to vigorously improve its infrastructure and strengthen investment in the construction of rural roads and the construction of communication networks. This highlights a significant difference between coastal and inland areas in terms of the driving factors of emergency management capability, mainly due to the differences in economic foundation, technology application, and policy support. To address these differences, corresponding enhancement measures are proposed to help narrow the gap in emergency management capacity between regions and improve the overall effectiveness of the country’s emergency management system.
For the Central Yellow River economic zone, the weights of A1 and D2 are relatively balanced, suggesting that this region relies on both digitalization and transportation infrastructure. For the Central Yangtze economic zone, the higher weight of A5 (Agricultural e-commerce) is likely closely related to its economic characteristics as an important region for agricultural production and circulation.
The analysis reveals that the REMC driving factors across different economic zones exhibit distinct regional characteristics, influenced by infrastructure, digitalization capabilities, economic structure, and development models. These differences provide valuable references for formulating tailored emergency management strategies for each region.

5. Conclusions

This study integrates machine learning methodologies with Projection Pursuit techniques to compute the REMC in China and identify its primary drivers. The findings indicate that, between 2006 and 2020, China’s REMC exhibited an overall increasing trend, with the decline observed in 2007 being attributable to the policy directives in effect at that time. Over time, the REMC in coastal regions of the eastern and southern parts of the country began to catch up and subsequently surpass that of inland areas, forming urban agglomerations with economic hubs often at their centers. However, some economically less developed regions, such as the three provinces of Yunnan, Guizhou, and Sichuan, which are plagued by natural disasters, have higher REMC than economically developed regions due to their disaster experience, rural structure, and governance models. Nationally, factors such as Rural Road Density, Rural Internet Penetration, Per Capita Investment in Fixed Assets, and Density of Township Health Centers were found to significantly enhance the REMC. However, at the city level, Rural Internet Penetration and Agricultural E-commerce Turnover demonstrated stronger influences on REMC, with a strong correlation observed between Rural Internet Penetration and the Rural Digital Financial Inclusion Index. The driving factors of REMC vary across different regions. In economically underdeveloped areas of the northwest and southwest, the REMC is primarily influenced by rural road density, while in the eastern coastal economic zones, Internet penetration and agricultural product e-commerce levels exert a greater impact on REMC. Comparing inland and coastal regions, key factors affecting REMC may include the economic base, technology application, and policy support.
Based on the research outcomes, identifying the key factors for enhancing REMC in different types of cities facilitates a deeper understanding of their characteristics and development patterns, thereby enabling the formulation of more targeted emergency management policies. First of all, it is necessary to formulate strategies to improve emergency management according to local conditions. The southwest region needs to strengthen the early warning mechanism for natural disasters, enhance the emergency training of farmers, and improve the emergency response mechanism at the grassroots level. Northwest China needs to strengthen infrastructure construction, and it should continue to promote the upgrading of rural road density, improve transportation networks, ensure smooth emergency transportation in the event of disasters, and increase investment in building the capacity of rural infrastructure, especially bridges, tunnels, and other disaster-prone areas. The eastern coastal regions should focus on digitalization and e-commerce development, accelerating the spread and upgrading of rural Internet, and promoting the growth of rural e-commerce platforms. Agricultural product e-commerce models should be popularized in major agricultural provinces to enhance agricultural incomes while using information technology to improve disaster warning and emergency response speeds. Secondly, barriers between urban and rural areas should be dismantled to construct an emergency linkage mechanism between urban agglomerations and rural areas, especially in the eastern and southern coastal “urban agglomeration” regions. The clustering effect and technological advantages of economically developed cities should be leveraged to establish regional emergency material reserve centers and information-sharing platforms. In economically underdeveloped areas, closer collaboration with neighboring economic centers should be encouraged to enhance the fluidity and allocation efficiency of disaster emergency materials. Additionally, the construction of information and intelligent systems should be accelerated, with ongoing efforts to increase Internet coverage in rural areas, particularly through 5G network coverage and smart agricultural platforms, to enhance information acquisition and dissemination capabilities in rural areas. Emergency management information platforms should be promoted in rural areas to integrate weather warnings, disaster information, and emergency response resources, thereby improving the efficiency of grassroots emergency responses. Finally, efforts should be made to simultaneously enhance rural economic and emergency capabilities. The northwest and southwest regions should focus on the development of basic industries, increasing levels of fixed asset investment, particularly in agricultural infrastructure and reserve warehouses related to emergency capabilities. The eastern coastal regions should promote the completion of the agricultural e-commerce industry chain, increasing the efficiency of agricultural product circulation with the help of e-commerce, enhancing rural economic vitality, and introducing disaster insurance services through electronic trading platforms to disperse agricultural risks.
It is noteworthy that the method proposed in this study is not only applicable to rural emergency management in China but also has global applicability, particularly in rural areas of other developing countries facing similar challenges. For example, regions in India, Bangladesh, and parts of Africa are also confronted with frequent natural disasters and weak infrastructure. By employing Projection Pursuit and feature selection techniques, these areas can effectively identify key driving factors within different contexts, thereby optimizing their emergency management systems. Globally, rural emergency management faces similar challenges, making the method developed in this study highly adaptable and potentially impactful in the emergency management practices of various countries and regions. Furthermore, this study provides several policy recommendations to improve REMC. Firstly, governments can optimize resource allocation based on the key driving factors identified in this research, prioritizing high-risk areas to enhance disaster response efficiency. Secondly, policies should promote the development of disaster early warning systems, especially in rural areas with poor information flow, by encouraging the adoption of intelligent early warning technologies for more accurate disaster forecasting and response. Lastly, in terms of post-disaster recovery, governments could implement financial support policies, such as low-interest loans or disaster relief subsidies, to assist affected farmers in restoring production, while accelerating the development of rural infrastructure to enhance overall disaster prevention and mitigation capabilities. These policy measures can effectively strengthen the REMC, reducing the social and economic impacts of natural disasters.
This study employs Projection Pursuit techniques for the measurement of emergency management capacity and utilizes Random Forest methods to identify the REMC driving factors in different types of cities. In the future, other machine learning algorithms and data mining techniques can be applied to further investigate the correlations and impacts of REMC driving factors. Due to limited public data availability, this study selected only 22 driving factors. Future research should expand the range of driving factors and establish a more comprehensive indicator system. Additionally, incorporating factors such as rural planning, emergency policies, and farmer intentions into the model analysis will help in formulating more accurate and effective emergency management strategies. Future studies could also explore additional research methods, such as differential games and dynamic optimal control, to broaden the theoretical contributions to the field of emergency management.

Author Contributions

Conceptualization, J.W. and E.V.; methodology, J.W. and E.V.; writing—original draft preparation, J.W. and E.V.; writing—review and editing, J.W.; visualization, J.W.; supervision, J.W.; funding acquisition, J.W. All authors have read and agreed to the published version of the manuscript.

Funding

This research was funded by The Ministry of Education Humanities and Social Science Fund youth project, grant number 22YJCZH171 And The APC was funded by Jing Wang.

Data Availability Statement

The datasets used and/or analyzed for this study are available from the corresponding author upon reasonable request.

Conflicts of Interest

The authors declare no conflicts of interest.

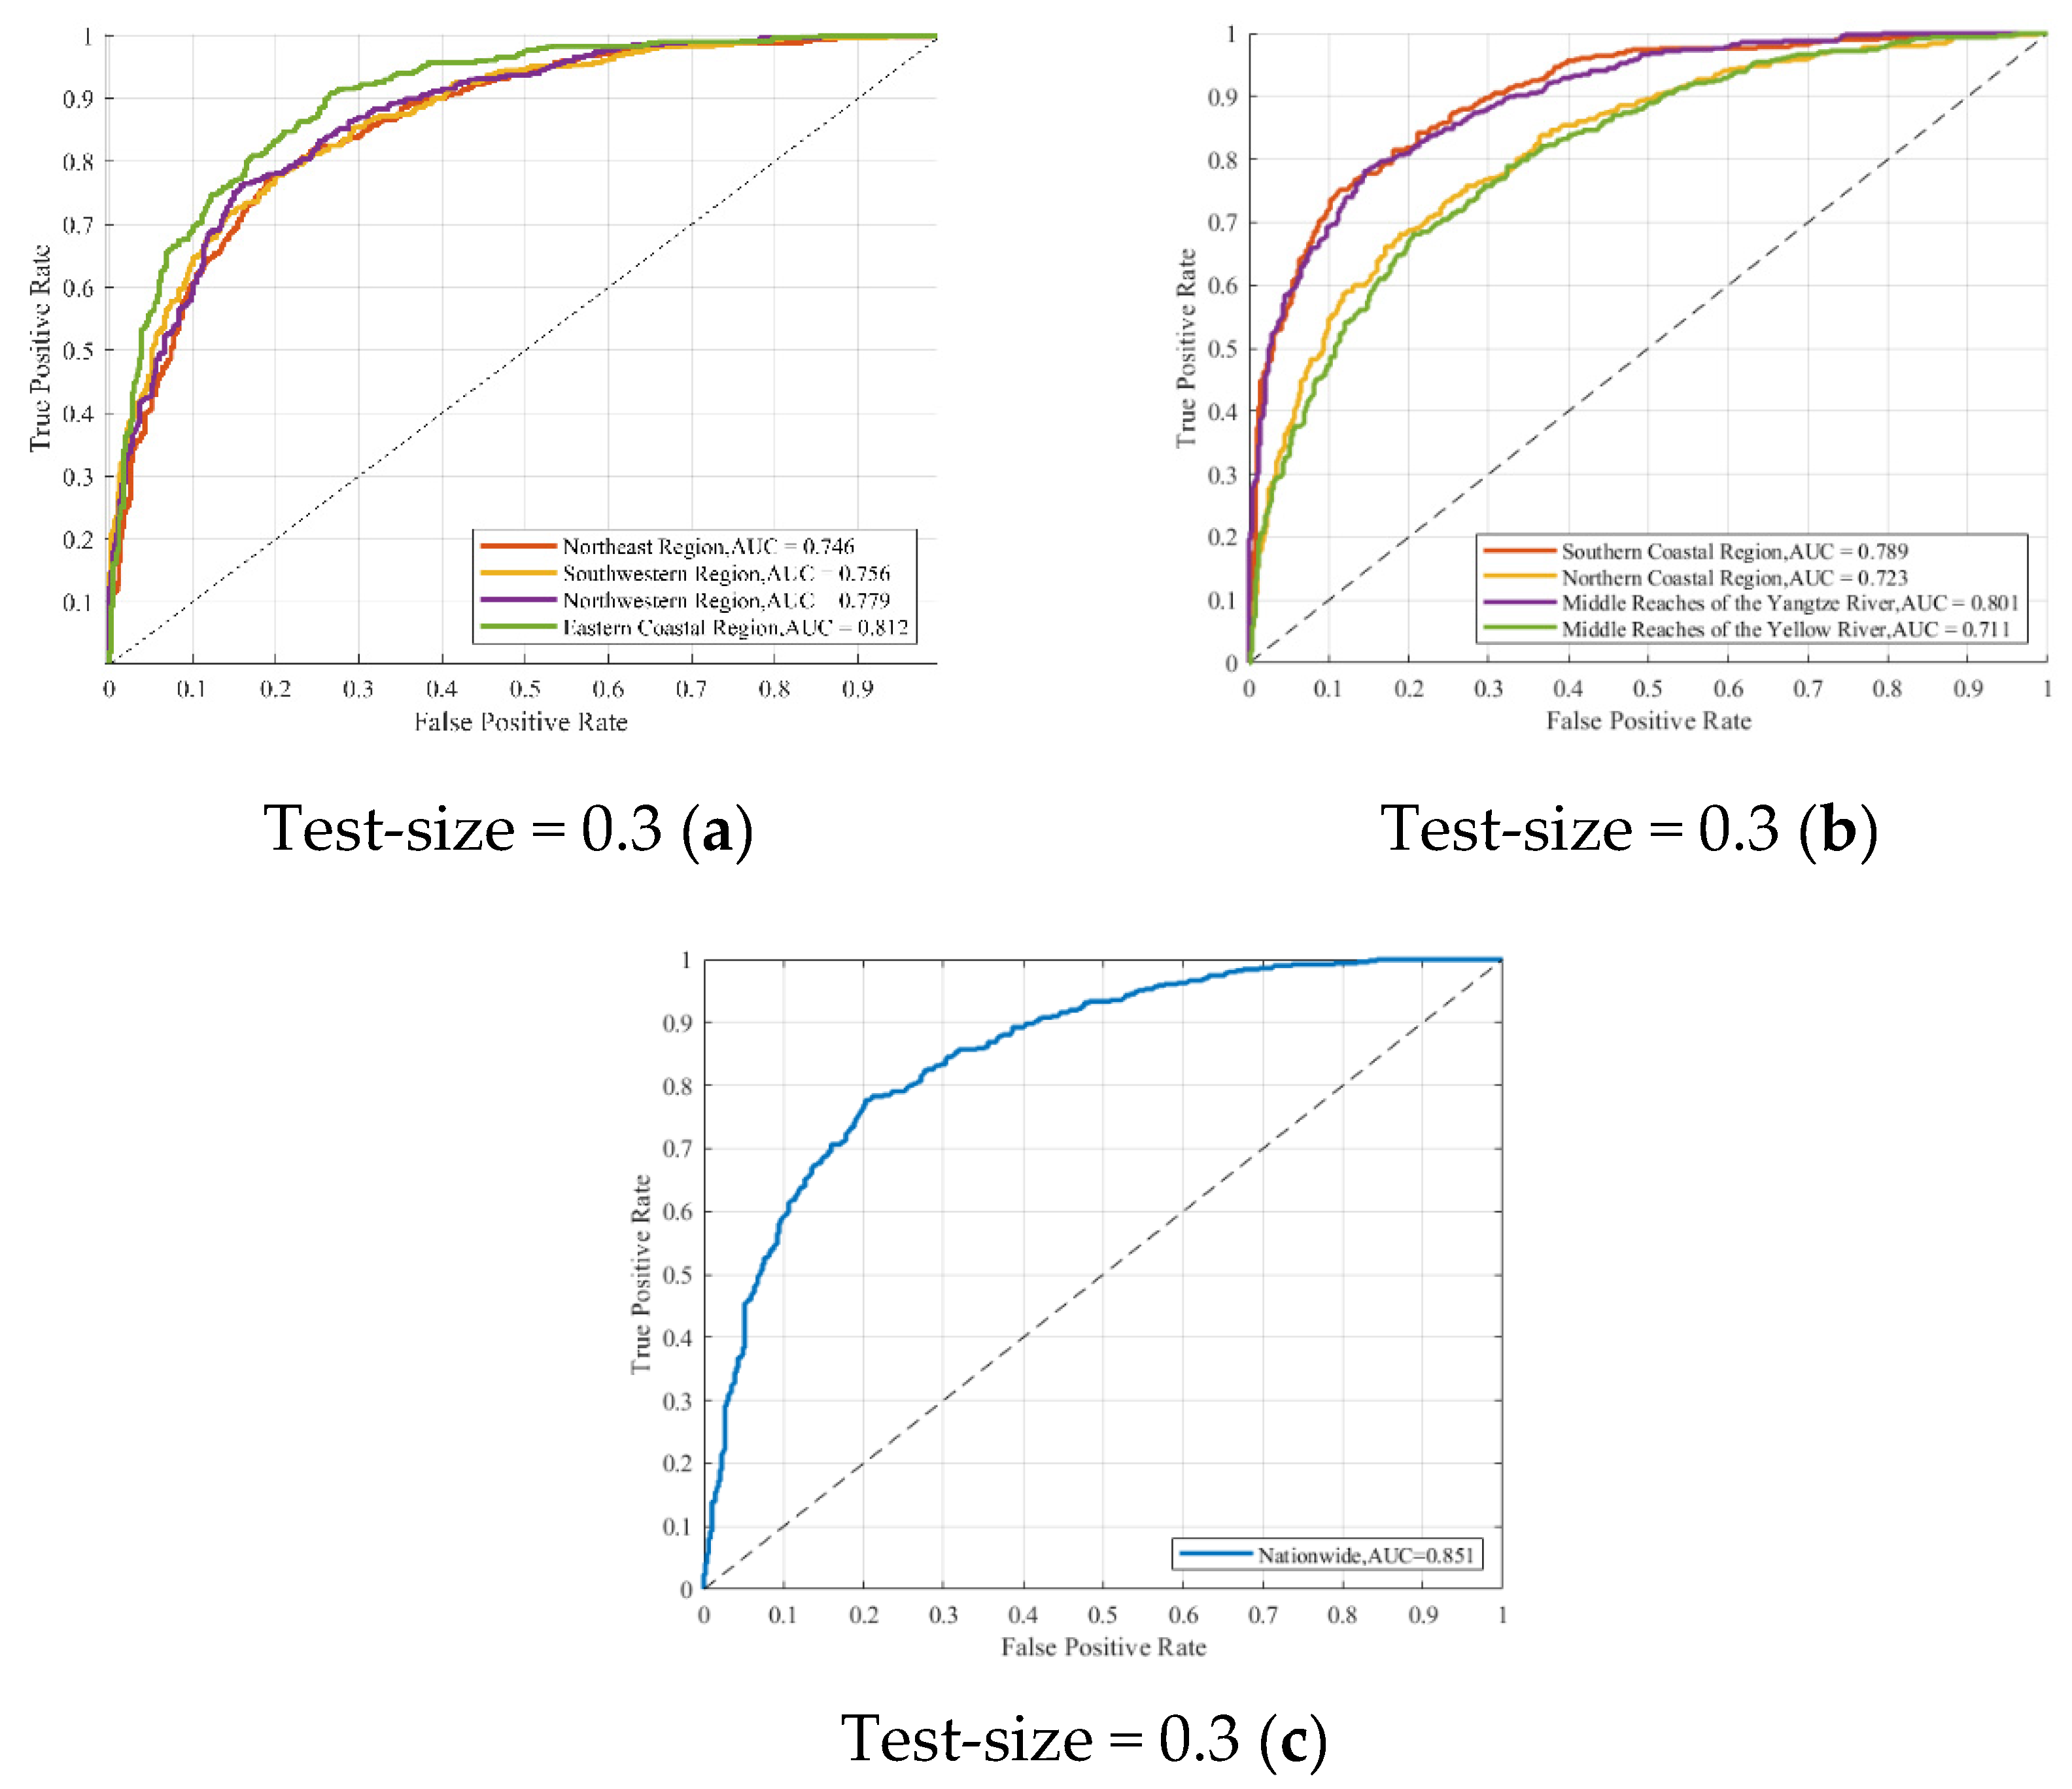
Appendix A. ROC Plots Results

Figure A1. Comparison of the ROC curves of the classifier at a 0.3 test sample ratio. (a) Test results in Northeast Region, Southwestern Region, Northwestern Region and Eastern coastal Region; (b) Test results in Southern Coastal Region, Northern Coastal Region, Middle Reaches of the Yangtze River and Middle Reaches of the Yellow River; (c) Nationwide test results.
Sustainability 17 01001 g0a1
Figure A2. Comparison of the ROC curves of the classifier at a 0.5 test sample ratio. (a) Test results in Northeast Region, Southwestern Region, Northwestern Region and Eastern coastal Region; (b) Test results in Southern Coastal Region, Northern Coastal Region, Middle Reaches of the Yangtze River and Middle Reaches of the Yellow River; (c) Nationwide test results.
Sustainability 17 01001 g0a2

References

  1. Aguilera, H.; Guardiola-Albert, C.; Moreno Merino, L.; Baquedano, C.; Díaz-Losada, E.; Robledo Ardila, P.A.; Durán Valsero, J.J. Building inexpensive topsoil saturated hydraulic conductivity maps for land planning based on machine learning and geostatistics. CATENA 2022, 208, 105788. [Google Scholar] [CrossRef]
  2. Kong, F.; Sun, S. Understanding and Strengthening the Emergency Management and Comprehensive Disaster Reduction in China’s Rural Areas: Lessons from Coping with the COVID-19 Epidemic. Sustainability 2021, 13, 3642. [Google Scholar] [CrossRef]
  3. Yang, J.; Hou, H.; Hu, H. Exploring the Intelligent Emergency Management Mode of Rural Natural Disasters in the Era of Digital Technology. Sustainability 2024, 16, 2366. [Google Scholar] [CrossRef]
  4. Su, C.; Deng, J.; Li, X.; Huang, W.; MA, J.; Wang, C.; Wang, X. Investment in enhancing resilience safety of chemical parks under blockchain technology: From the perspective of dynamic reward and punishment mechanisms. J. Loss Prev. Process Ind. 2024, 94, 105523. [Google Scholar] [CrossRef]
  5. Diaconis, P.; Freedman, D. Asymptotics of graphical projection pursuit. Ann. Stat. 1984, 12, 793–815. [Google Scholar] [CrossRef]
  6. Gu, X.; Shao, J.; Wu, S.; Wu, Q.; Bai, H. The risk assessment of debris flow hazards in zhouqu based on the projection pursuit classification model. Geotech. Geol. Eng. 2022, 40, 1267–1279. [Google Scholar] [CrossRef]
  7. Shao, H.; Sun, X.; Lin, Y.; Xian, W.; Zhou, Y.; Yuan, L.; Qi, J. A method for spatio-temporal process assessment of eco-geological environmental security in mining areas using catastrophe theory and projection pursuit model. Prog. Phys. Geogr. Earth Environ. 2021, 45, 647–668. [Google Scholar] [CrossRef]
  8. Lan, Z.; Huang, M. Safety assessment for seawall based on constrained maximum entropy projection pursuit model. Nat. Hazards 2018, 91, 1165–1178. [Google Scholar] [CrossRef]
  9. An, M.; Liu, M.; An, H.; Ramsey, T.S. Systematic evaluation of emergency management capacity for rural public health emergencies. Int. J. Disaster Risk Reduct. 2023, 85, 103493. [Google Scholar] [CrossRef]
  10. Sun, M.; Xu, N.; Li, C.; Wu, D.; Zou, J.; Wang, Y.; Luo, L.; Yu, M.; Zhang, Y.; Wang, H.; et al. The public health emergency management system in China: Trends from 2002 to 2012. BMC Public Health 2018, 18, 474. [Google Scholar] [CrossRef] [PubMed]
  11. Hu, J.; Chen, C.; Kuai, T. Improvement of Emergency Management Mechanism of Public Health Crisis in Rural China: A Review Article. Iran. J. Public. Health 2018, 47, 156–165. [Google Scholar] [PubMed]
  12. Wang, C.; Wu, J.; Guo, E.; Wang, Y. The TransIRIO model: Capturing the economic ripple effect of different economic behaviours in post-disaster emergency-Recovery-Reconstruction. Int. J. Disaster Risk Reduct. 2024, 110, 104634. [Google Scholar] [CrossRef]
  13. Nugroho, A.; Iqbal, R.M.; Fadhiela, K.; Apriyani, D.; Ginting, L.N.; Nurdin, S. Impacts of village fund on post disaster economic recovery in rural Aceh Indonesia. Int. J. Disaster Risk Reduct. 2022, 70, 102768. [Google Scholar] [CrossRef]
  14. Hou, C.; Wu, H. Rescuer, decision maker, and breadwinner: Women’s predominant leadership across the post-Wenchuan earthquake efforts in rural areas, Sichuan, China. Saf. Sci. 2020, 125, 104623. [Google Scholar] [CrossRef]
  15. Gehl, P.; Auclair, S.; Fayjaloun, R.; Meresse, P. Decision support for emergency road traffic management in post-earthquake conditions. Int. J. Disaster Risk Reduct. 2022, 77, 103098. [Google Scholar] [CrossRef]
  16. Sun, H.; Feng, Y.; Meng, Q. Information dissemination behavior of self-media in emergency: Considering the impact of information synergistic-hedging effect on public utility. Expert. Syst. Appl. 2024, 252, 124110. [Google Scholar] [CrossRef]
  17. Sun, Q.; Zhang, Y.; Wang, F. Relations of residents’ knowledge, satisfaction, perceived importance and participation in emergency management: A case study in modern and old urban communities of Ningbo, China. Int. J. Disaster Risk Reduct. 2022, 76, 102997. [Google Scholar] [CrossRef]
  18. Fei, L.; Li, T. Investigating determinants of public participation in community emergency preparedness in China using DEMATEL methodology. Int. J. Disaster Risk Reduct. 2024, 112, 104803. [Google Scholar] [CrossRef]
  19. Sarabdeen, J.; Chikhaoui, E.; Mohamed Ishak, M.M. Creating standards for Canadian health data protection during health emergency–An analysis of privacy regulations and laws. Heliyon 2022, 8, e09458. [Google Scholar] [CrossRef]
  20. Kontokosta, C.E.; Malik, A. The Resilience to Emergencies and Disasters Index: Applying big data to benchmark and validate neighborhood resilience capacity. Sustain. Cities Soc. 2018, 36, 272–285. [Google Scholar] [CrossRef]
  21. McIntyre, S.; Roy, G. Revisiting the dimensions of rural resilience: The COVID-19 pandemic. J. Rural. Stud. 2023, 103, 103107. [Google Scholar] [CrossRef]
  22. Marshall, A.; Wilson, C.-A.; Dale, A. Telecommunications and natural disasters in rural Australia: The role of digital capability in building disaster resilience. J. Rural. Stud. 2023, 100, 102996. [Google Scholar] [CrossRef]
  23. Gao, X.; Wang, C.; Sun, M.; Wang, X. Research on the driving factors of rural residents’ pro-environmental behavior under the background of frequent heat waves. Glob. Ecol. Conserv. 2024, 51, e02893. [Google Scholar] [CrossRef]
  24. Zhou, Y.; Wu, Z.; Liang, Q.; Xu, H.; Wang, H.; Xue, W. Threshold and real-time initiation mechanism of urban flood emergency response under combined disaster scenarios. Sustain. Cities Soc. 2024, 108, 105512. [Google Scholar] [CrossRef]
  25. Zhang, Y.; Liu, Q.; Li, X.; Zhang, X.; Qiu, Z. Spatial-temporal evolution characteristics and critical factors identification of urban resilience under public health emergencies. Sustain. Cities Soc. 2024, 102, 105221. [Google Scholar] [CrossRef]
  26. Li, J.; Pang, J.; Fan, X. Optimization of 5G base station coverage based on self-adaptive mutation genetic algorithm. Comput. Commun. 2024, 225, 83–95. [Google Scholar] [CrossRef]
  27. Li, S.-Y.; Huang, Z.-H.; Ge, F.-L.; Lin, W.-D.; Yang, F.-Q. An emergency linkage system of urban gas pipeline network based on Bayesian network. J. Loss Prev. Process Ind. 2024, 92, 105493. [Google Scholar] [CrossRef]
  28. Zhang, X.; Wang, C.; Wang, W.; Zhang, H. Inter-organizational collaboration after institutional reform in China: A perspective based on the revision of the emergency plan. Int. J. Disaster Risk Reduct. 2023, 98, 104084. [Google Scholar] [CrossRef]
  29. Yin, K.; Zhao, Y.; Zhou, S.; Li, X. How do storm surge disaster losses affect economic development?: Perspectives from disaster prevention and mitigation capacity. Sci. Total Environ. 2024, 951, 175526. [Google Scholar] [CrossRef] [PubMed]
  30. Xue, R.; Xiong, L. Two-stage evolutionary game model on complex networks for emergency logistics based on blockchain platform. Expert. Syst. Appl. 2024, 256, 124925. [Google Scholar] [CrossRef]
  31. Wang, X.; Dao, F.; Ji, Y.; Qiu, S.; Zhu, X.; Dong, W.; Wang, H.; Zhang, W.; Zheng, X. Crowdsourcing intelligence for improving disaster forecasts. Innov. 2024, 5, 100647. [Google Scholar] [CrossRef] [PubMed]
  32. Siam, M.R.K.; Lindell, M.K.; Wang, H. Modeling of multi-hazard warning dissemination time distributions: An agent-based approach. Int. J. Disaster Risk Reduct. 2024, 100, 104207. [Google Scholar] [CrossRef]
  33. Jin, Z.; Xu, H.; Kong, Z.; Pan, C. A resilient routing strategy based on deep reinforcement learning for urban emergency communication networks. Comput. Netw. 2024, 257, 110898. [Google Scholar] [CrossRef]
  34. Ruggiero, A.; Piotrowicz, W.D.; John, L. Enhancing societal resilience through the whole-of-society approach to crisis preparedness: Complex adaptive systems perspective–The case of Finland. Int. J. Disaster Risk Reduct. 2024, 114, 104944. [Google Scholar] [CrossRef]
  35. Zang, Y.; Huang, J.; Wang, H. Dynamic impact assessment of urban floods on the compound spatial network of buildings-roads-emergency service facilities. Sci. Total Environ. 2024, 926, 172007. [Google Scholar] [CrossRef]
  36. Jibhakate, S.M.; Timbadiya, P.V.; Patel, P.L. Dam-break flood hazard and risk assessment of large dam for emergency preparedness: A study of Ukai Dam, India. J. Hydrol. 2024, 640, 131659. [Google Scholar] [CrossRef]
  37. Yuan, H.; Huang, L.; Chen, T.; Chen, Y.; Zhang, H.; Chen, X.; Deng, Q.; He, Z.; Wang, J.; Wang, Y. Key technologies of the emergency platform in China. J. Saf. Sci. Resil. 2022, 3, 404–415. [Google Scholar] [CrossRef]
  38. Choudhury, M.; Bogdan, E.; Drolet, J.; Khatiwada, K. Developing a Digital Disaster Documents System for essential documents: Perspectives of decision-makers in disaster and emergency management in Canada. Int. J. Disaster Risk Reduct. 2024, 114, 104975. [Google Scholar] [CrossRef]
  39. Fei, L.; Li, T.; Liu, X.; Ding, W. A novel multi-source information fusion method for emergency spatial resilience assessment based on Dempster-Shafer theory. Inf. Sci. 2025, 686, 121373. [Google Scholar] [CrossRef]
  40. Enjolras, B.; Wøien Hansen, V.; Slagsvold Winsvold, M. Collaborative governance and effectiveness during emergency response actions in Norway. Int. J. Disaster Risk Reduct. 2024, 111, 104651. [Google Scholar] [CrossRef]
  41. Ma, C.; Song, M.; Zeng, W.; Wang, X.; Chen, T.; Wu, S. Enhancing Urban Emergency Response: A Euclidean Distance-Based Framework for Optimizing Rescue Facility Layouts. Sustain. Cities Soc. 2024, 118, 106006. [Google Scholar] [CrossRef]
  42. Zhou, S.-Y.; Huang, A.-C.; Wu, J.; Wang, Y.; Wang, L.-S.; Zhai, J.; Xing, Z.-X.; Jiang, J.-C.; Huang, C.-F. Establishment and assessment of urban meteorological disaster emergency response capability based on modeling methods. Int. J. Disaster Risk Reduct. 2022, 79, 103180. [Google Scholar] [CrossRef]
  43. Lagap, U.; Ghaffarian, S. Digital post-disaster risk management twinning: A review and improved conceptual framework. Int. J. Disaster Risk Reduct. 2024, 110, 104629. [Google Scholar] [CrossRef]
  44. Kong, J.; Zhang, C.; Simonovic, S.P. Resilience and risk-based restoration strategies for critical infrastructure under uncertain disaster scenarios. Sustain. Cities Soc. 2023, 92, 104510. [Google Scholar] [CrossRef]
  45. Bhagavathula, S.; Brundiers, K.; Stauffacher, M.; Kay, B. Fostering collaboration in city governments’ sustainability, emergency management and resilience work through competency-based capacity building. Int. J. Disaster Risk Reduct. 2021, 63, 102408. [Google Scholar] [CrossRef]
  46. Liu, J.; Liu, L.; Tu, Y.; Li, S.; Li, Z. Multi-stage Internet public opinion risk grading analysis of public health emergencies: An empirical study on Microblog in COVID-19. Inf. Process. Manag. 2022, 59, 102796. [Google Scholar] [CrossRef] [PubMed]
  47. Xu, Y.; Wang, W.; Chen, H.; Qu, M. Multicriteria assessment of the response capability of urban emergency shelters: A case study in Beijing. Nat. Hazards Res. 2024, 4, 324–335. [Google Scholar] [CrossRef]
  48. Mashi, S.A.; Oghenejabor, O.D.; Inkani, A.I. Disaster risks and management policies and practices in Nigeria: A critical appraisal of the National Emergency Management Agency Act. Int. J. Disaster Risk Reduct. 2019, 33, 253–265. [Google Scholar] [CrossRef]
  49. Aboueljinane, L.; Frichi, Y. A simulation optimization approach to investigate resource planning and coordination mechanisms in emergency systems. Simul. Model. Pract. Theory 2022, 119, 102586. [Google Scholar] [CrossRef]
  50. Kappel, R.; Chavez, A.; Melnick, M.; Siegfried, A.L. Supporting rural community emergency planning, response, and recovery. J. Public. Health Manag. Pract. 2024, 30, 130–132. [Google Scholar] [CrossRef]
  51. Mu, D.; Han, W.; Chen, A. Bibliometrical and practical study of scientific knowledge and technique of emergency management. Sci. Technol. Rev. 2019, 37, 48–53. [Google Scholar]
  52. An, L.; Zhao, Z. Research on the Operation Status and Optimization Countermeasures of Emergency Shelters in China. J. Saf. Crisis Manag. 2024, 14, 1–11. [Google Scholar]
  53. Wang, X. Emergency Parcel Movement and Structure Optimization of E-Commerce Logistics Network Parcel Based on LSTM Algorithm. In Proceedings of the 2023 IEEE International Conference on Electrical, Automation and Computer Engineering (ICEACE), Changchun, China, 29–31 December 2023; pp. 612–616. [Google Scholar]
  54. Chen, Z.; Liu, Y.; Feng, W.; Li, Y.; Li, L. Study on spatial tropism distribution of rural settlements in the Loess Hilly and Gully Region based on natural factors and traffic accessibility. J. Rural. Stud. 2022, 93, 441–448. [Google Scholar] [CrossRef]
Figure 1. Trend map of the evolution of REMC in China from 2006 to 2020. Note: Plot (a) describes the change trend value of mean REMC at the national level, and Plot (b) describes the REMC distribution of urban units.
Sustainability 17 01001 g001aSustainability 17 01001 g001b
Figure 2. REMC of prefecture-level cities in China in 2006, 2010, 2015, and 2020.
Sustainability 17 01001 g002
Figure 3. Determining the multicollinearity of drivers, based on the Random Forest algorithm to assess the correlation between the identified drivers in the model.
Sustainability 17 01001 g003
Figure 4. Results of screening and ranking of REMC drivers in China.
Sustainability 17 01001 g004
Figure 5. Summary of screening results for ranking importance of REMC drivers by city (TOP 10).
Sustainability 17 01001 g005
Figure 6. Comparison of REMC driver weights in eight economic regions.
Sustainability 17 01001 g006
Table 1. REMC evaluation indicator system containing three levels of indicators.
First-Level Indicator LayerSecondary Indicator LayerThird Level IndicatorsIndicator Calculation and DescriptionReference
Prevention and emergency preparednessEmergency response capacityEmergency fund reserveDisposable emergency funds per capita[25]
Mobile communication signal strengthCellular base stations per square kilometer[26]
Ability to conduct educational exercisesEmergency linkage response speedNumber of emergency response team arrivals per unit of time[27]
Emergency preparedness plan revision effortsNumber of emergency plan revisions per unit of time[28]
Disaster prevention and mitigation training effortsNumber of emergency response trainings per capita[29]
Monitoring and early warningMonitoring and early warning capabilityApplication rate of emergency data management platformTotal number of uses/total time interval[30]
Disaster forecasting accuracyQualification rate of testing equipment[31]
Early warning information dissemination capacityBroadcast population coverage[32]
Emergency communication capabilityArea covered/total area of target area[33]
Hazard investigation capabilityCrisis information handling capacityTotal processing time/total number of treatments[34]
Risk information accessibilityTotal acquisition time/total number of acquisitions[35]
Risk information research capacityNumber of accurate findings/total number of findings[36]
Risk informatization(Original amount of loss—New amount of loss)/original amount of loss[37]
Emergency response and rescueDecision making and command abilityDecision maker capacityNumber of emergency commands per decision maker[38]
Technical support capacityNumber of emergency technical personnel/total number of personnel in decision-making command centers[39]
Policing and maintenance capacityPer capita investment in policing[40]
Health rescue capacityNumber of health technicians/total number of emergency response teams[41]
Emergency response capacityOwnership of emergency response equipment per capita[42]
Post recovery and reconstructionRestoration and reconstruction capabilityDigital support for post-disaster reconstructionDigital technology investment/total disaster recovery investment[43]
Infrastructure resilienceInfrastructure restoration in one day[44]
Resilience to life orderAmount of benefit per capita for affected groups[45]
Ability to control public opinion on the InternetPublic opinion control inputs/total disaster recovery inputs[46]
Placement guarantee capabilityEmergency shelter capacityEmergency shelter capacity/total number of people[47]
Relief material mobilization capacityPer capita ownership of relief goods[48]
Redeployment of transportation capacityNumber of green transport corridors/total number of roads[49]
Table 2. REMC driver factors containing five dimensions.
First-Level Indicator LayerIndicator Calculation and Description
Digital constructionRural Internet penetration (A1)
Rural cable broadcasting and television penetration (A2)
Level of agricultural mechanization (A3)
Rural digital financial inclusion index (A4)
E-commerce turnover of agricultural products (A5)
Rural governanceNumber of village committees (B1)
Number of Communist Party members in communes (B2)
Township financial expenditures (B3)
Coverage of township cultural centers (B4)
Economic developmentPer capita household income (C1)
Investment in fixed assets per capita (C2)
Consumption expenditure per rural inhabitant (C3)
Growth rate of rural electricity consumption (C4)
Rural environmentCultivated land area per capita (D1)
Rural road density (D2)
Quantity of rainfall (D3)
Average temperatures (D4)
Living atmosphereYears of schooling per capita in rural areas (E1)
Number of participants on unemployment insurance (E2)
Density of township health centers (E3)
Rural per capita housing area (E4)
Rural gas penetration (E5)
Table 3. Table of damage and emergency measures in different areas.
ProvincesNatural DisasterEmergency Strategy
Yunnan ProvinceEarthquake disasters, freezing temperatures, snowstorms, biological disasters1. Strengthening seismic monitoring and early warning systems;
2. Establishing emergency stockpiles of materials for freezing temperatures and snowstorms;
3. Training in biological disaster prevention and control.
Guizhou ProvinceFloods, hailstorms, droughts, geological disasters1. Strengthening monitoring and early warning of potential geologic disaster sites;
2. Establishing an emergency water supply mechanism for droughts;
3. Conducting publicity on disaster prevention and mitigation for wind and hailstorms.
Sichuan ProvinceFloods, geological disasters, wind and hailstorms, freezing temperatures, and snowstorms1. Strengthening standards for seismic design and construction of buildings in earthquake-prone areas.
2. Establishing joint monitoring and early warning systems for floods and geological disasters.
3. Conducting emergency drills for freezing temperatures and snowstorms.
Disclaimer/Publisher’s Note: The statements, opinions and data contained in all publications are solely those of the individual author(s) and contributor(s) and not of MDPI and/or the editor(s). MDPI and/or the editor(s) disclaim responsibility for any injury to people or property resulting from any ideas, methods, instructions or products referred to in the content.

