Abstract
Rapid global urbanization during the late 20th and early 21st centuries has induced substantial land cover changes, posing significant threats to the United Nations Educational, Scientific and Cultural Organization’s (UNESCO) World Heritage Sites. In this study, we investigated the spatio-temporal change in urban development in response to land use transformations in the world cultural heritage site (CHS) of Taxila, Pakistan, to check the possible threats faced by the site. Land transfer matrices were used to assess the land cover change (LCC) between 1990 and 2024. Support vector machine and Getis–Ord Gi techniques were employed for LCC classification and spatial pattern interpretation, respectively, which were later evaluated by the high spatial resolution imagery of KH-9 (Keyhole-9), Google Earth Pro and Gaofen-2. The results indicate a significant increase in built-up area from 23.68 km2 to 78.5 km2, accompanied by a substantial rise in bare land from 8.56 km2 to 26.5 km2 between 1990 and 2024, which is quite irregular. LCC transformations were notable, with 13.1 km2 of cropland and 44.8 km2 vegetation being converted into 4.4 km2 of built-up area and 14.5 km2 into bare land during the 1990 to 2024 period. Getis–Ord Gi analysis observed a high Z-score value and showed low to high clustering patterns in the proximity of the Sarakhola and Bhir Mound sites from 1990 to 2024. Furthermore, high spatial resolution imagery indicates the loss of the core zone of the Sarakhola site from 0.0168 to 0.0032 km2 from 2004 to 2024, which was the major threat to its outstanding universal venue (OUV) status. The findings of the current study indicate that the CHS under study is facing an alarming situation for conservation due to rapid urban development and encroachment. Therefore, local government should strictly implement the heritage law and revisit their policies to promote conservation efforts to maintain the authenticity and integrity of this world CHS.
1. Introduction
The world experiences significant land cover changes influenced by urbanization, infrastructure development, deforestation and resource exploitation, illustrating a dynamic relationship of anthropogenic activities [1]. The global population has been experiencing a significant surge in urbanization over the past two decades [2]. A similar pattern has been seen in the world cultural heritage sites in Taxila, Pakistan, which faces significant threats from rapid urbanization and unplanned infrastructure development [3]. Since 1990, the Taxila region’s population has more than tripled, driving profound land cover changes through unplanned urban development and infrastructure growth [4]. This unprecedented urban growth has led to extensive land cover changes that threaten both the physical integrity and the historical authenticity of this invaluable cultural heritage [5]. In 2010, the global urban population accounted for 51% of the worldwide population. This trend is projected to continue, with estimates suggesting that by the year 2050, a staggering 80% of the world’s population will reside in urban areas [6,7]. This rapid growth of urban populations exerts immense pressure on land resources, driving significant land cover transitions as cities expand the demand for housing, road connectivity and industry, and transforming natural landscapes into artificial surfaces [8,9]. This process pressurizes the natural landscape and strains existing resources [10], leading to the loss of archaeological relics that cannot be fully restored once destroyed [11,12].
Cultural heritage (CH) represents an invaluable collection of human history, transmitting knowledge, values and identities across generations. The preservation of CH, particularly at World Heritage Sites, ensures the continuity of cultural identity, historical authenticity, and integrity for future generations [13,14,15]. The preservation of the archaeological landscape emphasizes the outstanding universal value (OUV) of heritage sites, which highlights cultural identity and promotes a sense of belonging [16,17]. Furthermore, CH acts as a bridge between societies’ continued existence and evolution by transmitting knowledge, values and identities [18].
Addressing these issues is vital to fulfilling global conservation commitments, particularly in the context of the United Nations’ Sustainable Development Goals (SDGs) [19]. This commitment was further reinforced in 2015 when the United Nations adopted the Sustainable Development Goals (SDGs), including Target 11.4, which focuses on protecting and conserving cultural and natural heritage as a foundation of sustainable development. However, translating these global objectives into local action remains a challenge, as evidenced by UNESCO’s reports on the world cultural heritage sites of Taxila in Pakistan [20,21]. The United Nations Educational, Scientific and Cultural Organization (UNESCO), through the World Heritage Convention (WHC), has long emphasized the global importance of cultural heritage (CH) and has established a framework for its preservation [22]. A review of UNESCO’s reports from 1995 to 2013 (1995, 1999, 2000, 2013) reveals ongoing challenges in preserving Taxila’s archaeological landscape. While the 1995 report highlighted uncontrolled vegetation as a threat [23], later reports suggest this issue persisted [24]. New concerns also emerged, including urban development and encroachment and urban utilities, affecting the heritage site’s integrity and authenticity. Overall, these reports reveal a continuous effort to manage Taxila effectively, and UNESCO potentially assists the local government in preserving Taxila’s cultural heritage [23,24,25,26,27].
The natural threats and anthropogenic activities indicated by the studies have affected World Heritage Sites. Natural threats such as soil erosion, landslides, sea level rise and human activities like urban development, tourism, and warfare significantly contribute to the destruction of cultural heritage sites [28]. Urban development is the primary drive for change in the area’s land cover, landscape and road networks that threaten World Heritage Sites, which are reported in the endangered list of world heritage by the World Heritage Committee [29,30]. Most of the world’s cultural heritage listed sites are located in urban areas, making them susceptible to the challenges posed by urban development [31].
Remote sensing introduces modern techniques to archaeological investigations, providing high-resolution multispectral data for mapping and monitoring features and landscapes [32]. This technology offers detailed high spatial resolution and allows for the precise detection, monitoring and mapping of archaeological features and spectral information of buried archaeological features [33]. Li, Guangdong et al. highlighted urban expansion’s potential threat to cultural heritage sites [34]. Urbanization patterns and their effects on cultural heritage sites were examined by Gwendolyn et al. through the analysis of aerial photographs, satellite imagery and archaeological archives. Similarly, in 2018, a study conducted by Zhang et al. examined the extent of urbanization using nighttime data (NTD) around 152 Buddhist monasteries across the Tibetan plateau [35]. In 2020, Xiao et al. calculated the Urban Intensity Index (UII) globally, utilizing nighttime data, human settlement patterns and world population statistics [36]. Similarly, a 2023 study by Nath et al. revealed that Kaziranga Park in India lost grasslands, water and cropland over 30 years with rising built-up areas, threatening its UNESCO World Heritage status [37]. Guo et al. (2023) found that 70% of World Heritage Sites faced worsening land cover change between 2015 and 2020, which threatened conservation efforts for these cultural treasures [38].
Despite the global success of such approaches, these methodologies have not been systematically applied to Taxila, leaving critical gaps in understanding and managing its conservation needs. Pakistan’s rapid economic development is driving urban development, placing significant pressure on land resources and potentially threatening the World Heritage Site of Taxila [25,39]. Since 1990, Taxila’s population has increased more than three times, leading to significant land cover changes driven by unplanned urban development and infrastructure growth. These pressures have altered the site’s surroundings, eroded its cultural landscape, and introduced challenges that hinder its effective preservation. A review of UNESCO’s reports on Taxila (1995–2013) highlights persistent threats, including urban encroachment, and urban utilities, which compromise the site’s integrity. Despite these well-documented challenges, no comprehensive studies have explored the spatio-temporal dynamics of land cover changes or assessed their specific impact on the Taxila World Heritage Site. This gap in research limits the ability to develop targeted conservation strategies to mitigate the effects of urban expansion. Therefore, there is a need to monitor, investigate, and highlight the threats caused by urban development to Taxila’s world cultural heritage. So, considering the new emerging issues, such as urban development and the conservation literature, this study aims to (1) monitor spatio-temporal land cover change scenarios from 1990 to 2024; (2) determine the land cover transition and its trends; and (3) determine the spatio-temporal change in built-up area around the core zone of the world cultural heritage site of Taxila using hot spot and cold spot analysis. By focusing on Taxila within the broader context of global urbanization and SDG-11.4, this research provides actionable insights to preserve its archaeological landscape while contributing to the global dialogue on heritage conservation.
2. Study Area and Data
2.1. Study Area
The study area focuses on Taxila (Figure 1), designated as a UNESCO world cultural heritage site in the Pothohar region, approximately 25 km from Rawalpindi, Punjab, Pakistan. Taxila’s strategic location in the subcontinent serves as a pivotal nexus connecting the western areas of China to the eastern part of Pakistan, Afghanistan, and further southwest to Iran. Its landscape consists of a wide valley surrounded by notable hills and ridges, including the Murree Hills, Hazara Hills, and Margalla Hills. The city is situated at an elevation of approximately 549 m (1801 feet) above sea level. It experiences a subtropical climate characterized by hot summers with heavy monsoon rains, and the temperature ranges from 15 °C to 40 °C during the warmer months. In contrast, cooler temperatures in the region range between 5 °C and 15 °C during the winter. These geographical and climatic conditions significantly influence the area’s ecological dynamics and human activities, making them important considerations for conservation planning.

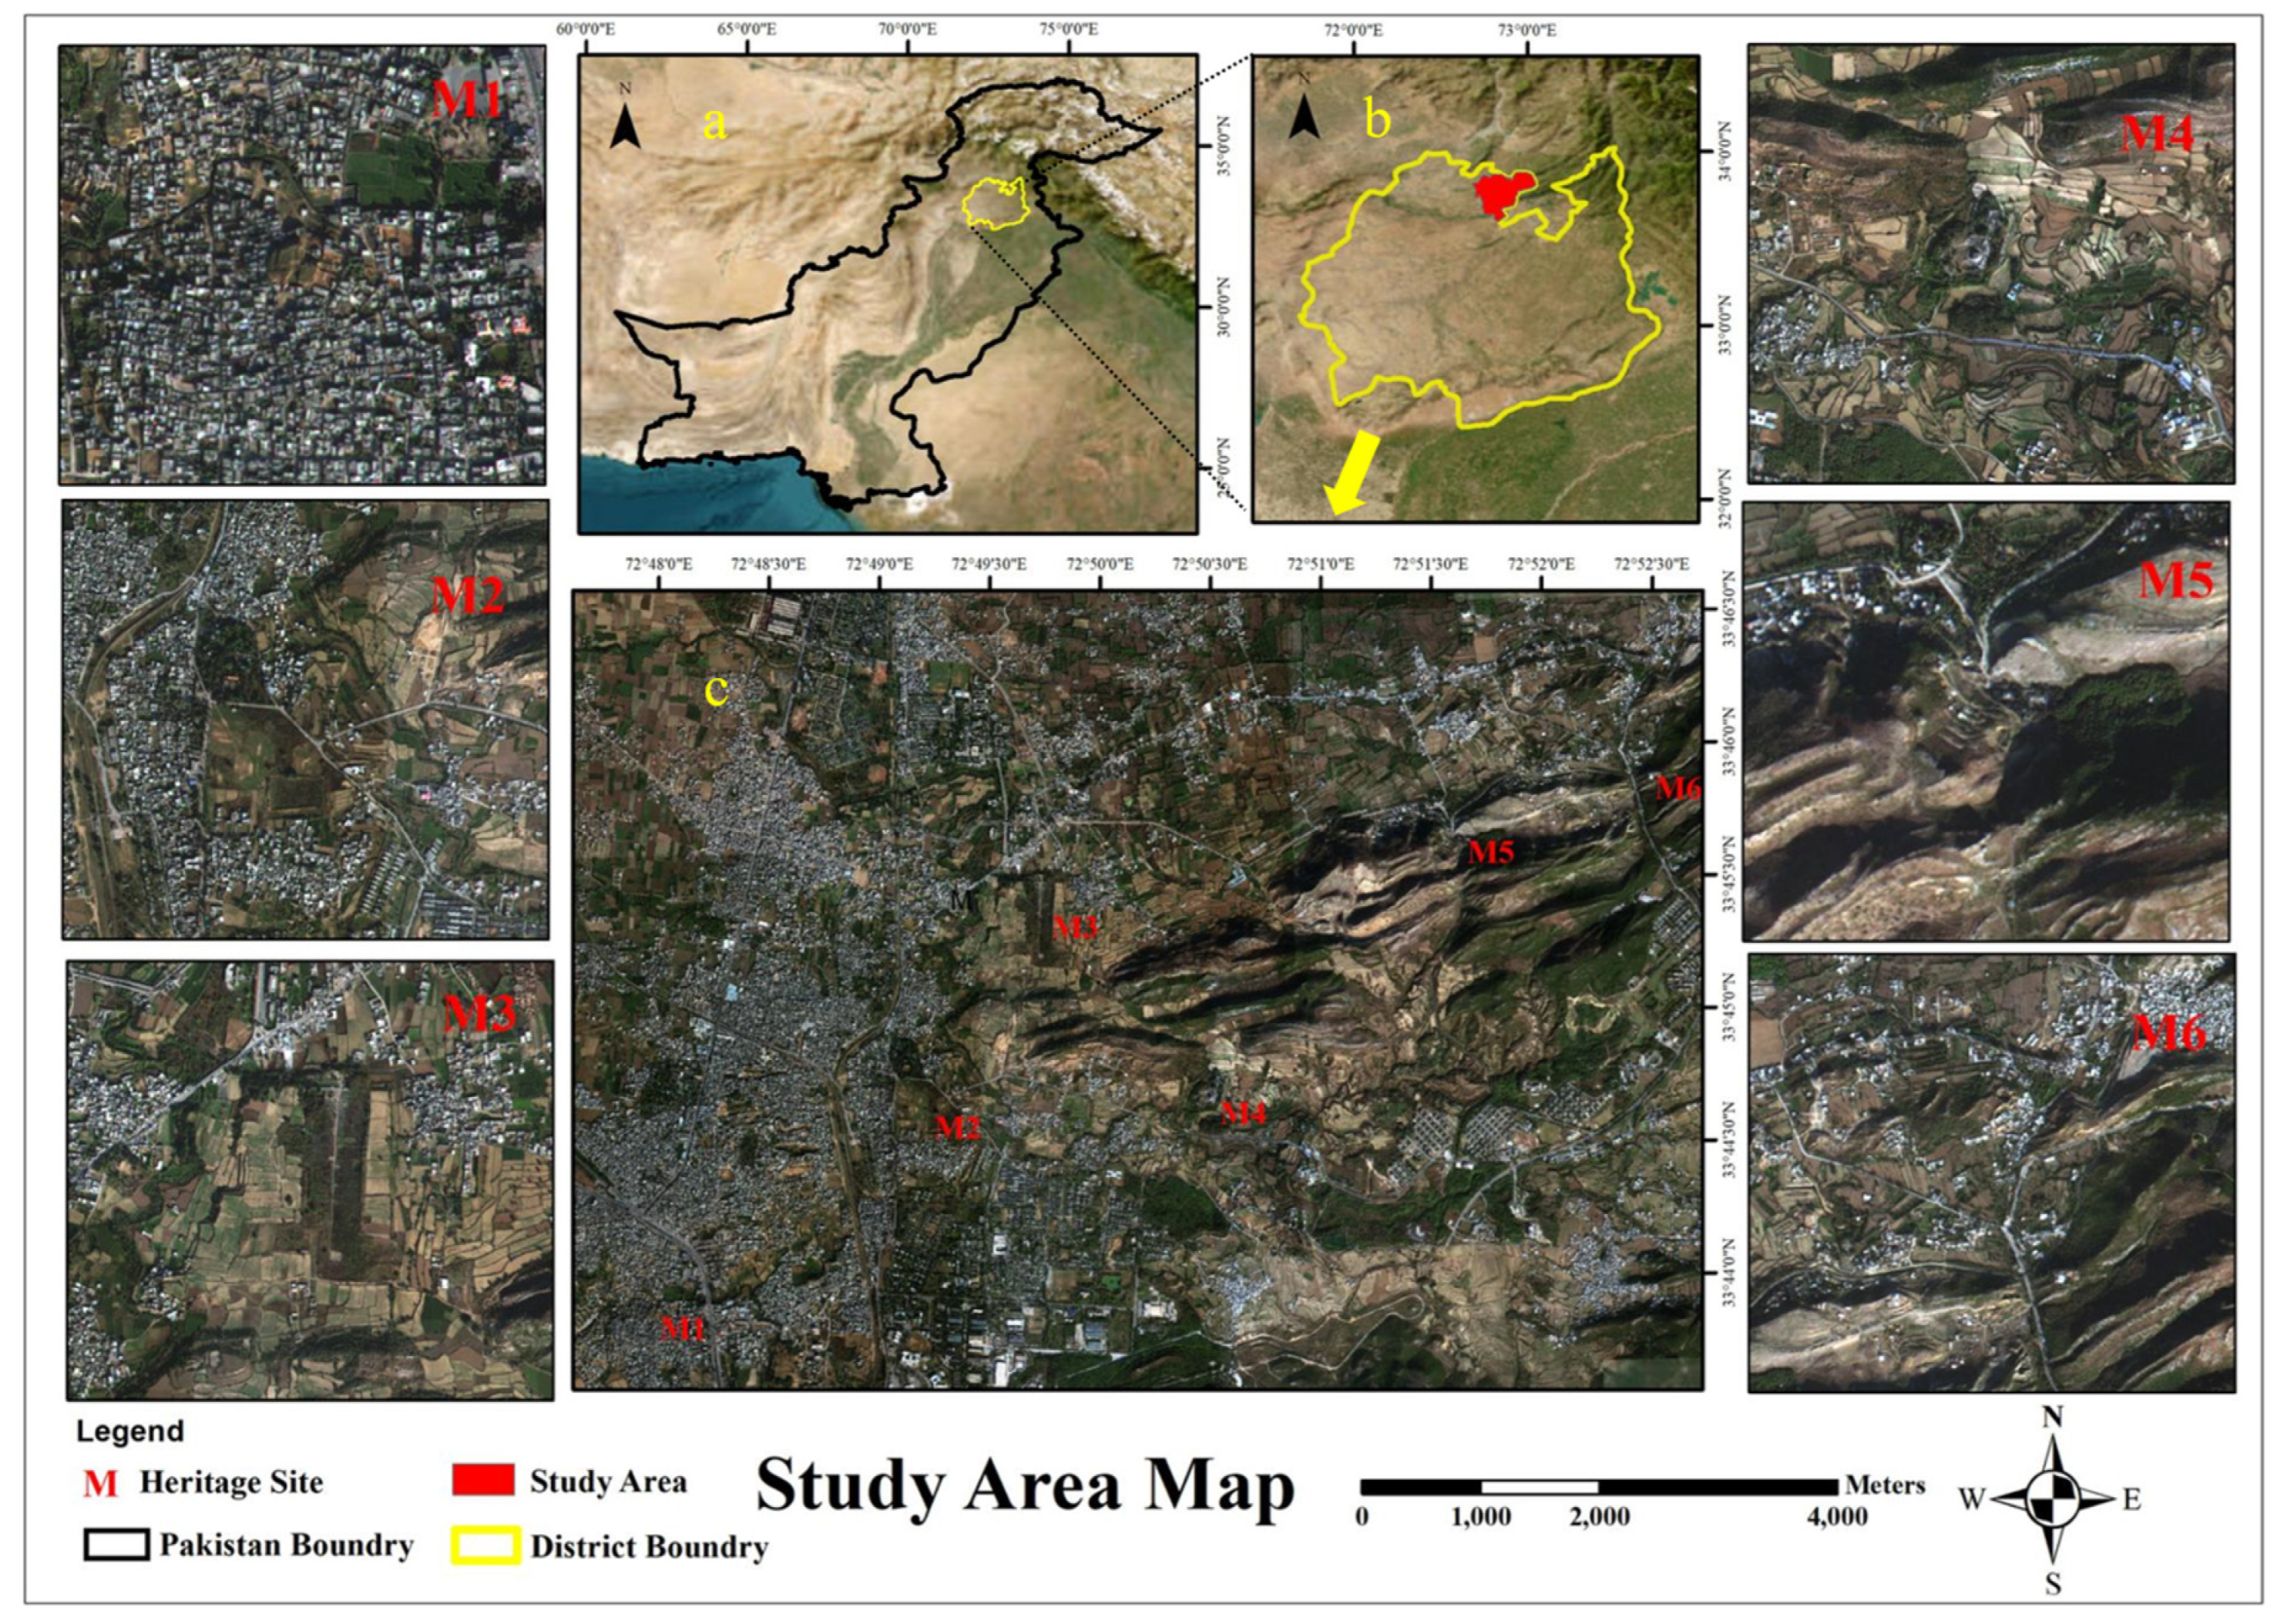
Figure 1.
Study area map of world cultural heritage sites in Taxila. All right and left panels represent heritage sites such as M1 Sarakhola Mound, M2 Bhir Mound, M3 Sirkap Remains, M4 Dhirmajika Stupa, M5 Mohra Mardud, and M6 Julian Stupa. (a) Pakistan boundary; (b) district boundary; (c) study area map of Taxila World Heritage Site.
Taxila’s historical significance is equally remarkable. Its rich heritage dates back to prehistoric times, as evidenced by the Khanpur Cave, which reveals traces of early human existence. During the late Neolithic era, early urban settlements (Sarakhola) marked a significant development in the subcontinent [40]. Additionally, the historic entry of Alexander the Great into the Bhir Mound in Taxila established a crucial connection between Taxila and the ancient Silk Road, extending into the western regions of China within the subcontinent. These pivotal events, alongside the early formation of urban settlements in Taxila, serve as criteria for UNESCO to designate the cultural heritage sites for outstanding universal status [41]. Notably, Chinese Buddhist pilgrims travel this route from west China to Taxila for pilgrimage purposes. Moreover, it served as the primary gateway to enter the subcontinent from the west, highlighting its historical significance [42,43].
In recent years, the population of Taxila has increased from 222,840 (1990) to 739,244 (2023) [4], nearly tripling in the last three decades. This upsurge has put pressure on existing resources and caused land cover changes around the world CHS of Taxila. Therefore, comprehensive monitoring and change detection were necessary at this site to initiate appropriate conservation measures for the preservation of this cultural heritage asset.
2.2. Remote Sensing Imagery
The analysis of land use and cover is critical to this study. Landsat satellite series datasets were employed to assess the dynamics of land cover change at Taxila spanning from 1990 to 2024, with intervals of ten years. These datasets were acquired from the United States Geological Survey (USGS) Earth Explorer website [44], as outlined in the provided Table 1. Late January and March were selected as target months due to their typically favorable atmospheric conditions and reduced haze and cloud coverage in the study area. The satellite images were employed to analyze the impact of land cover changes on Taxila over three decades.

Table 1.
Multispectral satellite dataset description.
It was taken care that downloaded imageries met the minimum criteria requirements such as cloud coverage, target months free from scan line error, clear study area and good quality. The sensor specifications were a thematic mapper (TM), enhanced thematic mapper and operational land imagery (OLI). The spatial resolution of all imageries was 30 m. Additionally, historical remote sensing images (declassified KH-9) were obtained from the USGS Earth Explorer. Furthermore, high spatial resolution imagery from Maxar satellites (Google Earth Pro) and Gaofen-2 from Natural Resources Satellite Sensing were utilized. The Gaofen-2 images underwent a pan sharpening process using the Gram–Schmidt technique to achieve a high spatial resolution of 1 m the details of the satellite imageries are presented in Table 2.
Table 2.
Details of the high spatial resolution satellite imagery.
2.3. Satellite Imageries and Classification
The USGS currently offers surface reflectance data, which undergoes pre-processing steps, including radiometric calibration and atmospheric correction. This dataset is instrumental in assessing land cover changes with enhanced accuracy and reliability [45,46]. For land cover change classification, the training data were collected with different spectral band combinations to the image with the help of historical Google Earth Pro software 7.3 [47], a high multispectral spatial resolution Gaofen-2 image and background knowledge of the study area. Subsequently, the image underwent classification into six distinct land cover classes, namely built-up area, tree cover, cropland, vegetation, water bodies, and bare land, by applying supervised classification methodologies. A sufficient number of training samples were gathered for each class to ensure robust representation across all land type classes. Additionally, satellite image enhancement was attained using different band combination techniques to get maximum accuracy for the classification [48,49]. The acquisition of training samples involved polygons based on spectral signature values corresponding to each land type class, supplemented by background knowledge of the study area of the feature type. Subsequently, a supervised classification approach was employed, utilizing vector machine algorithms supported by ENVI 5.6 software.
2.4. Post-Classification, Accuracy Assessment, and Change Detection
Following the post-classification phase, accuracy assessment and spatial change detection procedures were conducted to validate the classification outcomes. Such verification processes were essential to ensure the reliability and accuracy of the classification results [50]. So, the accuracy assessment was collected by using the ground truthing technique [51] of the images from 1990, 2000, 2010 and 2024, respectively, with the help of Google Earth Pro software 7.3 archived imagery [52] and high-resolution imageries from Gaofen-2. The accuracy samples were systematically collected utilizing ArcMap 10.8 software. Subsequently, the Kappa coefficient and overall accuracy measures were applied as a metric to evaluate the accuracy of the classification, providing a scientifically rigorous assessment of the classification’s reliability and precision.
Kappa coefficient is a statistic that measures the agreement between observed and expected classifications. The Kappa coefficient was calculated [53] using the following Equation (1):
where Po is the relative observed agreement among rasters (overall accuracy) [53], and Pe is the hypothetical probability of chance agreement. Pe can be calculated using the following Equation (2):
The overall accuracy was measured using the following Equation (3):
The land transition matrix technique was utilized after the land cover classification (details are presented in Table 3) to assess the land cover changes in the study area [54]. The transition matrix is an n × n matrix where each entry T[i,j] represents the proportion of land cover type that transitioned from land cover class ‘i’ at the time ‘t1’ to class ‘j’ at time ‘t2’. The transition matrix can be calculated by the following Equation (4) [55]:
where each row ‘i’ represents the initial land cover class at ‘t1’. Each column ‘j’ represents the resulting land cover class at ‘t2’. Diagonal elements T[i’i] capture the persistence of each land cover type, indicating areas where no change occurred.
Table 3.
Description of the classifications.
2.5. Hot Spot and Cold Spot Analysis (Getis–Ord Gi)]
The Getis–Ord Gi* statistic was employed to identify spatial clusters of urban development around the Taxila world cultural heritage site (CHS). This method calculates Z scores for each feature, revealing significant clustering or dispersion relative to its neighbors [56]. While effective, limitations such as sensitivity to distance thresholds, boundary distortions and challenges with 30 m resolution data required careful mitigation. A sensitivity analysis tested distance thresholds of 100 m, 200 m and 500 m, with 200 m selected for its stability and consistency with patterns observed in high-resolution imagery (KH-9, Gaofen-2 and Google Earth Pro). Buffering reduced boundary effects, and validation through satellite imagery and field surveys ensured accuracy. Despite the limitations of Landsat data, high-resolution datasets and refinements enhanced robustness. The analysis revealed significant clustering, particularly around Sarakhola and Bhir Mound, highlighting progressive urban encroachment. The Gi* statistic was computed following Equation (5) [57].
The Z score and p-value presented in Table 4, essential for determining the significance of the computed index, are among the many important metrics that this analysis computes for each characteristic. The Z score standardizes a feature’s value to the mean and standard deviation, giving information about the feature’s relative position within the dataset. This indicates probable hot spots (high values) or cold spots (low values) in the urban region by letting us know if the feature’s value is noticeably greater or lower than the average [58]. A detailed methodology flowchart is attached as Figure 2.
Table 4.
Thresholds of the Z scores and p-values from hot spot and cold spot analyses.

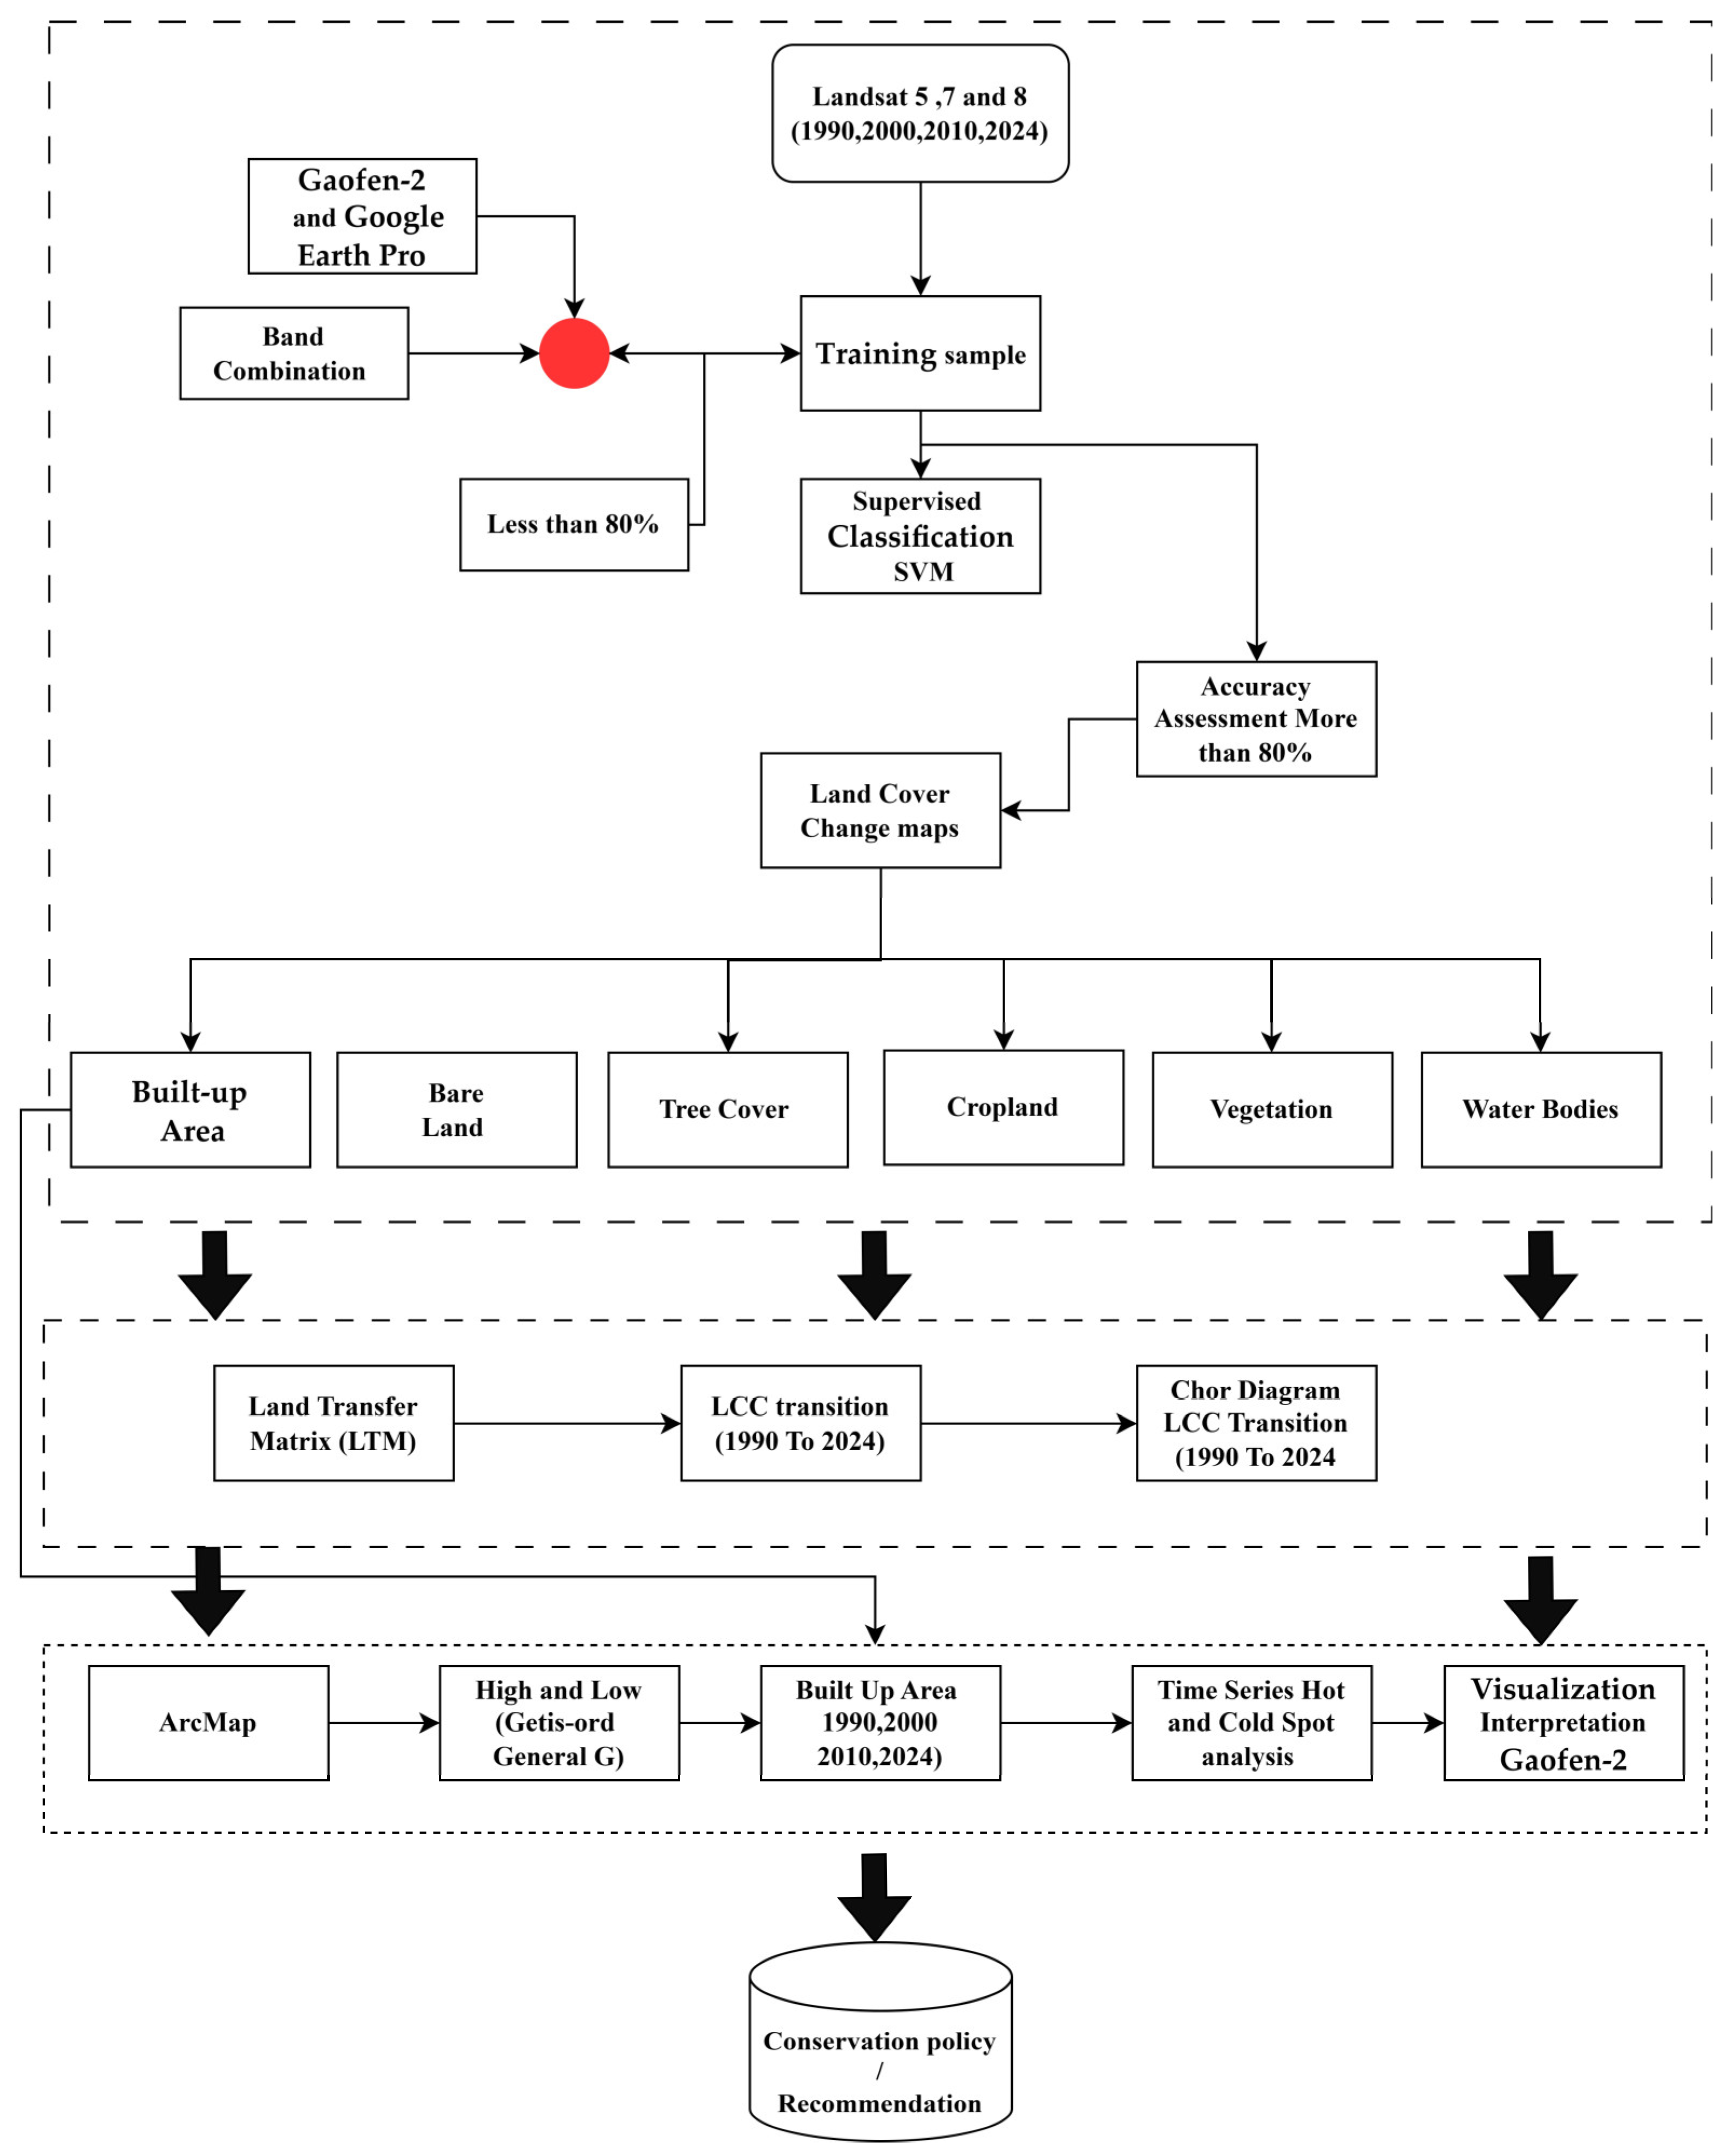
Figure 2.
Flowchart indicating the detailed procedures for data collection, pre-processing and evaluation of results.
3. Results
3.1. Land Cover Changes
The distribution of land cover change, with observations at 10-year intervals (except for the final interval), was divided into six distinct land types. In the Pothohar region, Taxila’s land classification map prominently highlights major land types: built-up area, bare land and cropland, along with vegetation, are shown in Figure 3, and Table 3 elaborates on the dynamics of land cover changes from 1990 to 2024 for the World Heritage Site of Taxila. On the other hand, the classification accuracy for the region of interest was assessed using the Kappa coefficient and overall accuracy, based on 250 sample points corresponding to built-up, bare land, cropland, tree cover, vegetation, and water bodies. The results indicate that the Kappa coefficient and overall accuracy were approximately 0.85 and 88% for 1990, respectively. In 2000, these values were around 0.84 and 87%. By 2010, the Kappa coefficient had decreased to 0.83, with an overall accuracy of 87%. However, by 2024, the Kappa coefficient increased to 0.87, with an overall accuracy of 90%, as shown in Table 5. A further confusion matrix of all land type classes is attached as Tables S1–S4 in the Supplementary Data.
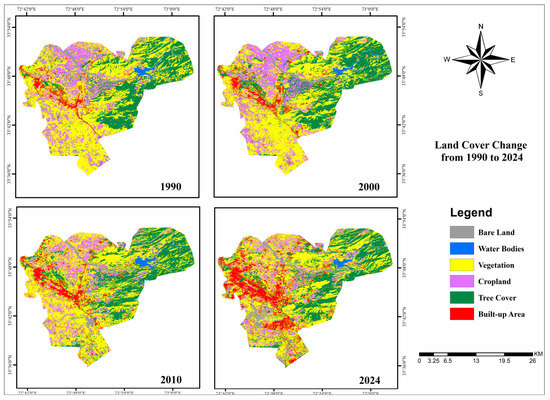
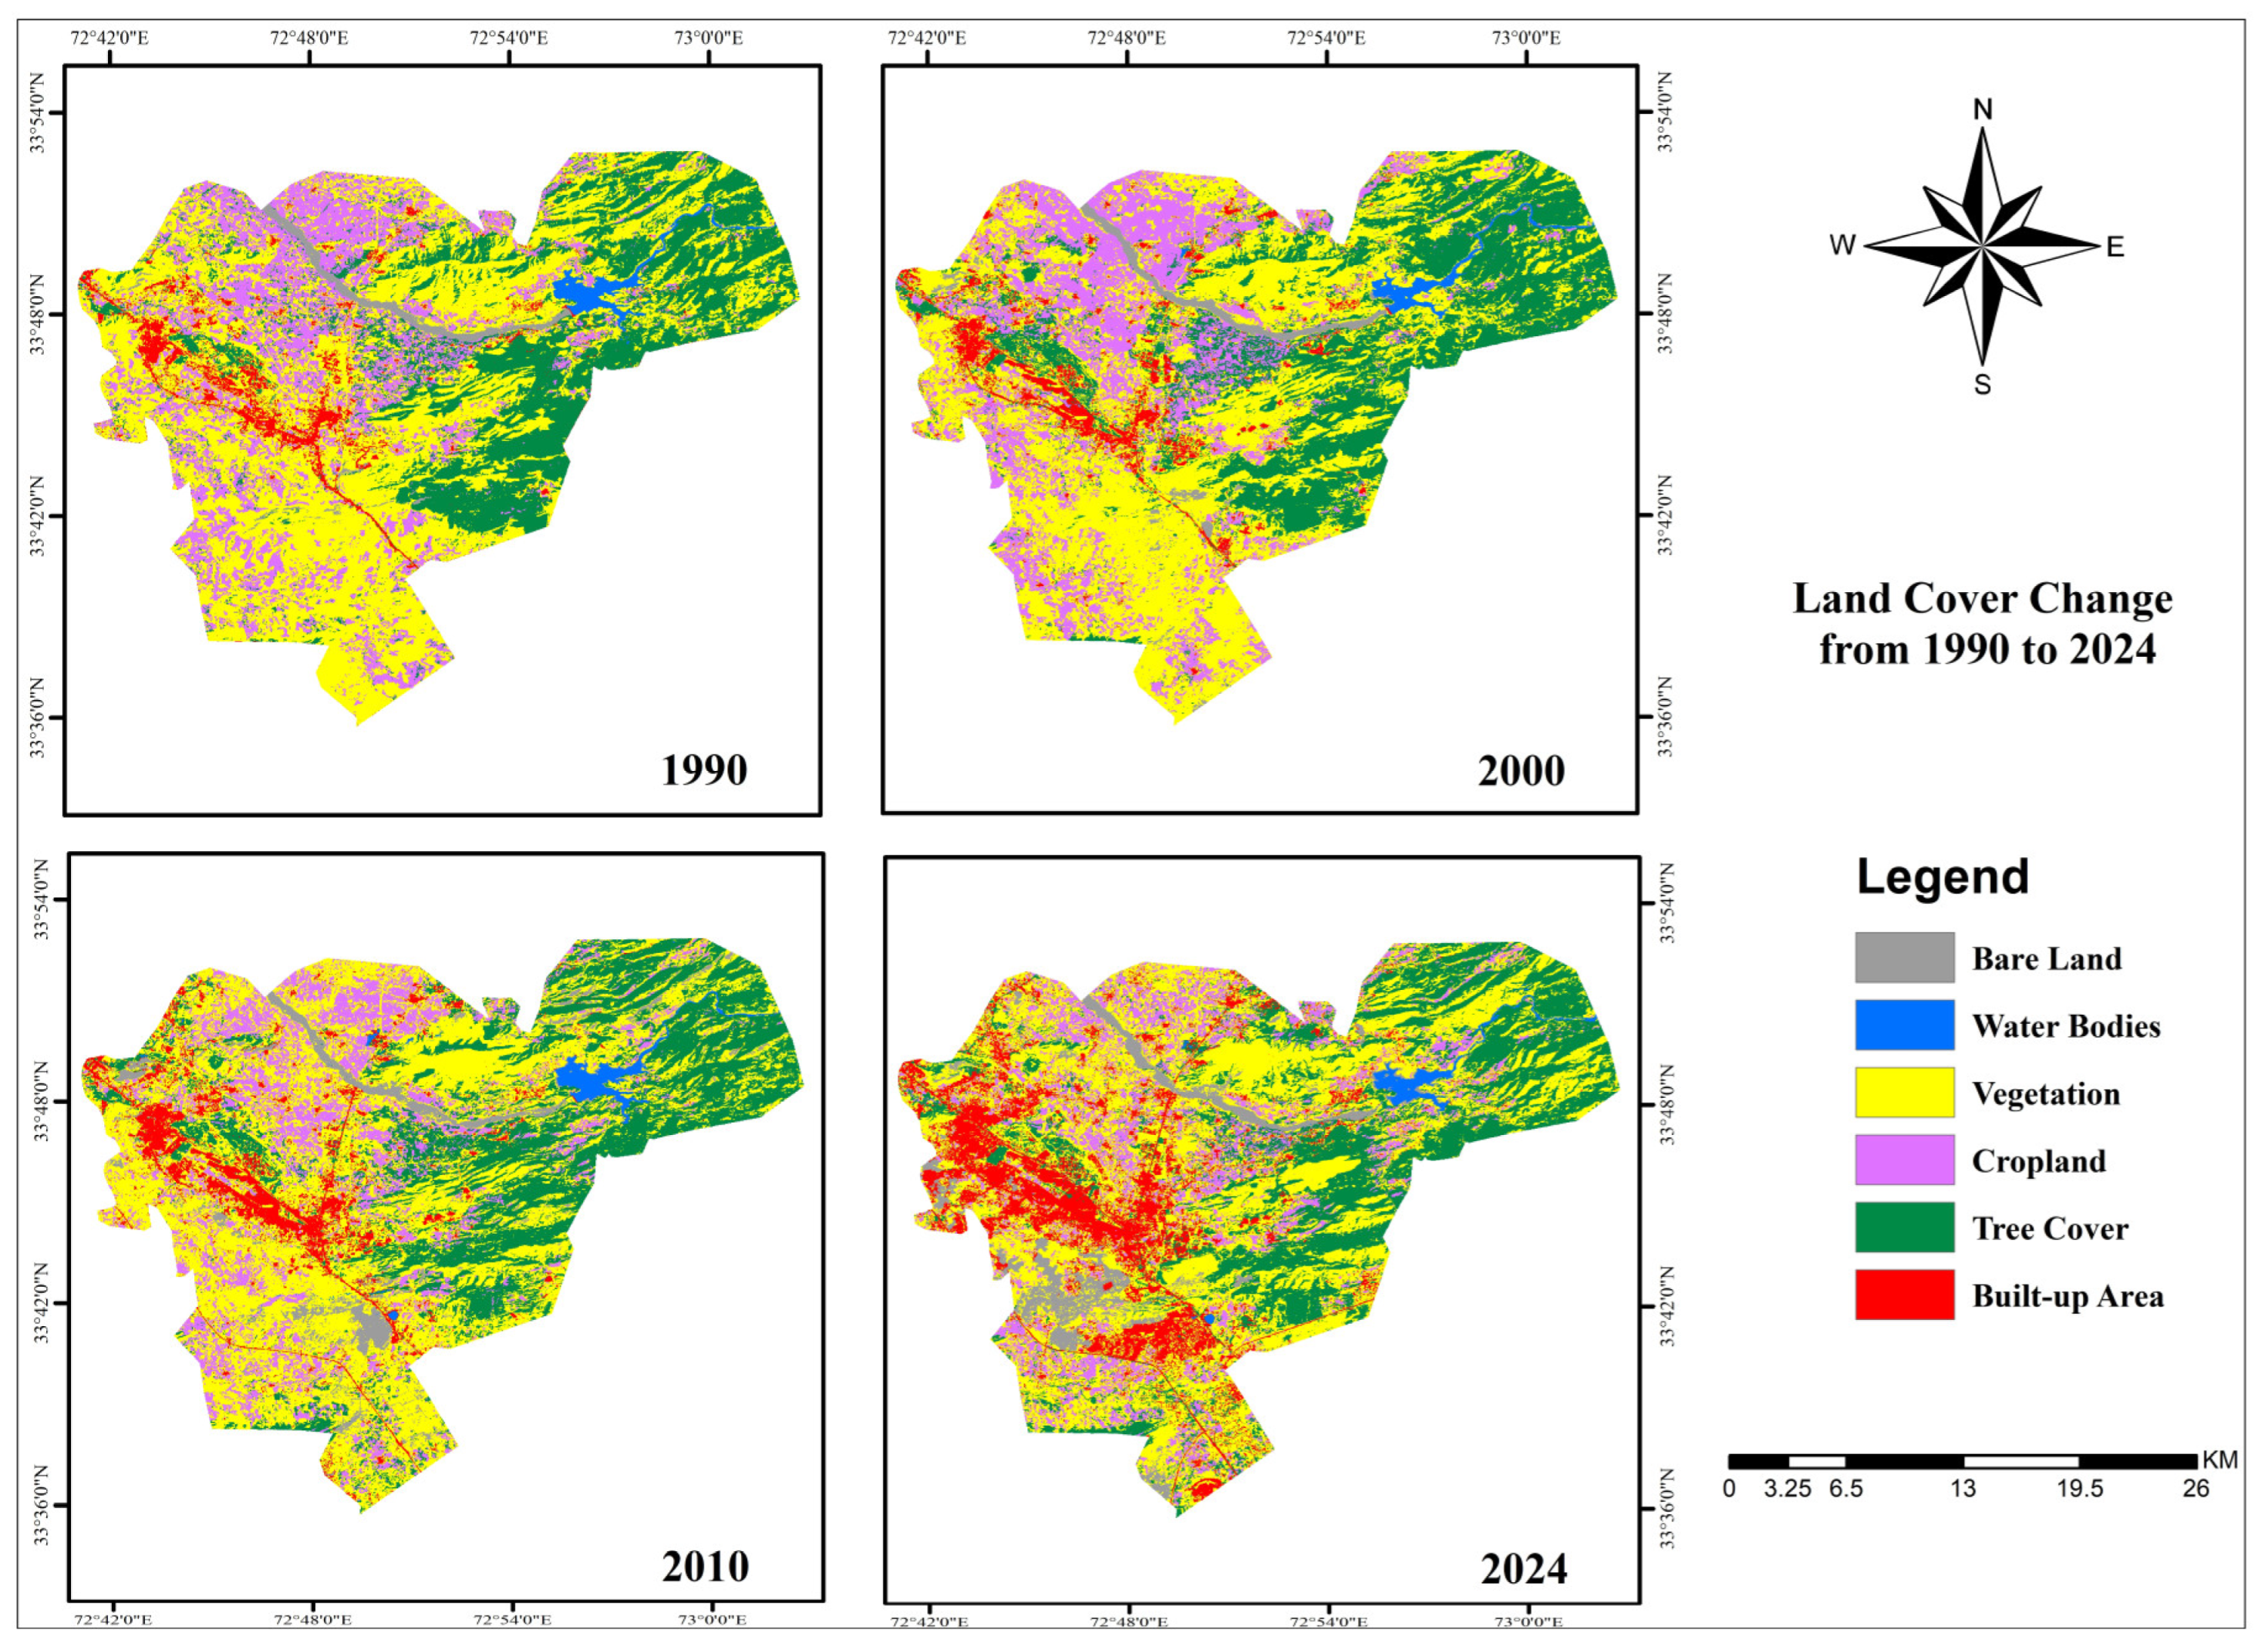
Figure 3.
Land cover change classification from 1990 to 2024.
Table 5.
Overall accuracy and Kappa coefficient of the six land cover types.
By analyzing Figure 3 and Table 6, clear trends in land cover change in the study area can be observed over the past three decades (1990–2024). The built-up area increased sharply from 4.2% in 1990 to 7.2% in 2010 and further to 13.8% in 2024. This trend, evident in the red areas of Figure 3, highlights ongoing urbanization and infrastructure development, which likely corresponds to population growth and increased human activity in the region. A notable decrease in cropland is observed, from 20.43% in 1990 to 13.18% in 2024. Similarly, vegetation declined consistently, from 48.95% in 1990 to 43.78% in 2024. These losses can be attributed to the expansion of built-up areas and bare land, as shown in Figure 3. Tree cover initially increased from 23.74% in 1990 to 25.97% in 2000, possibly due to conservation efforts. However, a subsequent decline to 23.58% by 2024 indicates a reversal, potentially due to increased urban sprawl.
Table 6.
Trends in LCC of the World Heritage Site of Taxila between 1990 and 2024 (km2).
Bare land, though initially low at 1.5% in 1990, increased significantly to 4.19% in 2010 and 4.66% by 2024. This increase, represented in grey areas in Figure 3, highlights the abandonment of previously utilized land.
Figure 4a shows a comparative bar chart illustrating how different land cover types have changed over time. By comparing the heights of these bars across years, one can observe trends such as increases in built-up area or decreases in cropland. Figure 4b shows a three-dimensional perspective of the same land cover data shown in Figure 3; by viewing the data in a 3D format, it becomes easier to visualize relative differences in the magnitude of land cover type in the study area. Furthermore, in the Figure 4c line graph, the focus shifts from absolute areas to proportions or percentages of each land cover category over time, making trends clearer.
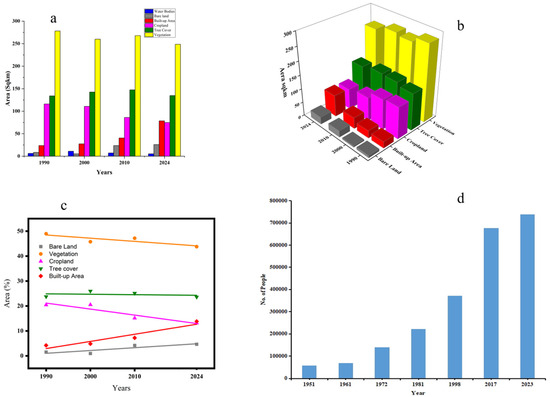
Figure 4.
Time series graphs. (a) LCC change from 1990 to 2024; (b) 3D bar graph of different land types; (c) trend line graph of major land types; (d) population graph of Taxila from 1961 to 2023 (Pakistan Bureau of Statistics).
There is a steady decline in bare land and a corresponding increase in built-up area. In Figure 4d, the trend line illustrates population growth in Taxila at various time intervals based on census data from the Pakistan Bureau of Statistics. In 1951, the population was approximately 50,000, rising to 322,840 by 1998 and reaching around 739,244 by the 2023 census.
3.2. LCC Transition over the Period of 1990–2024
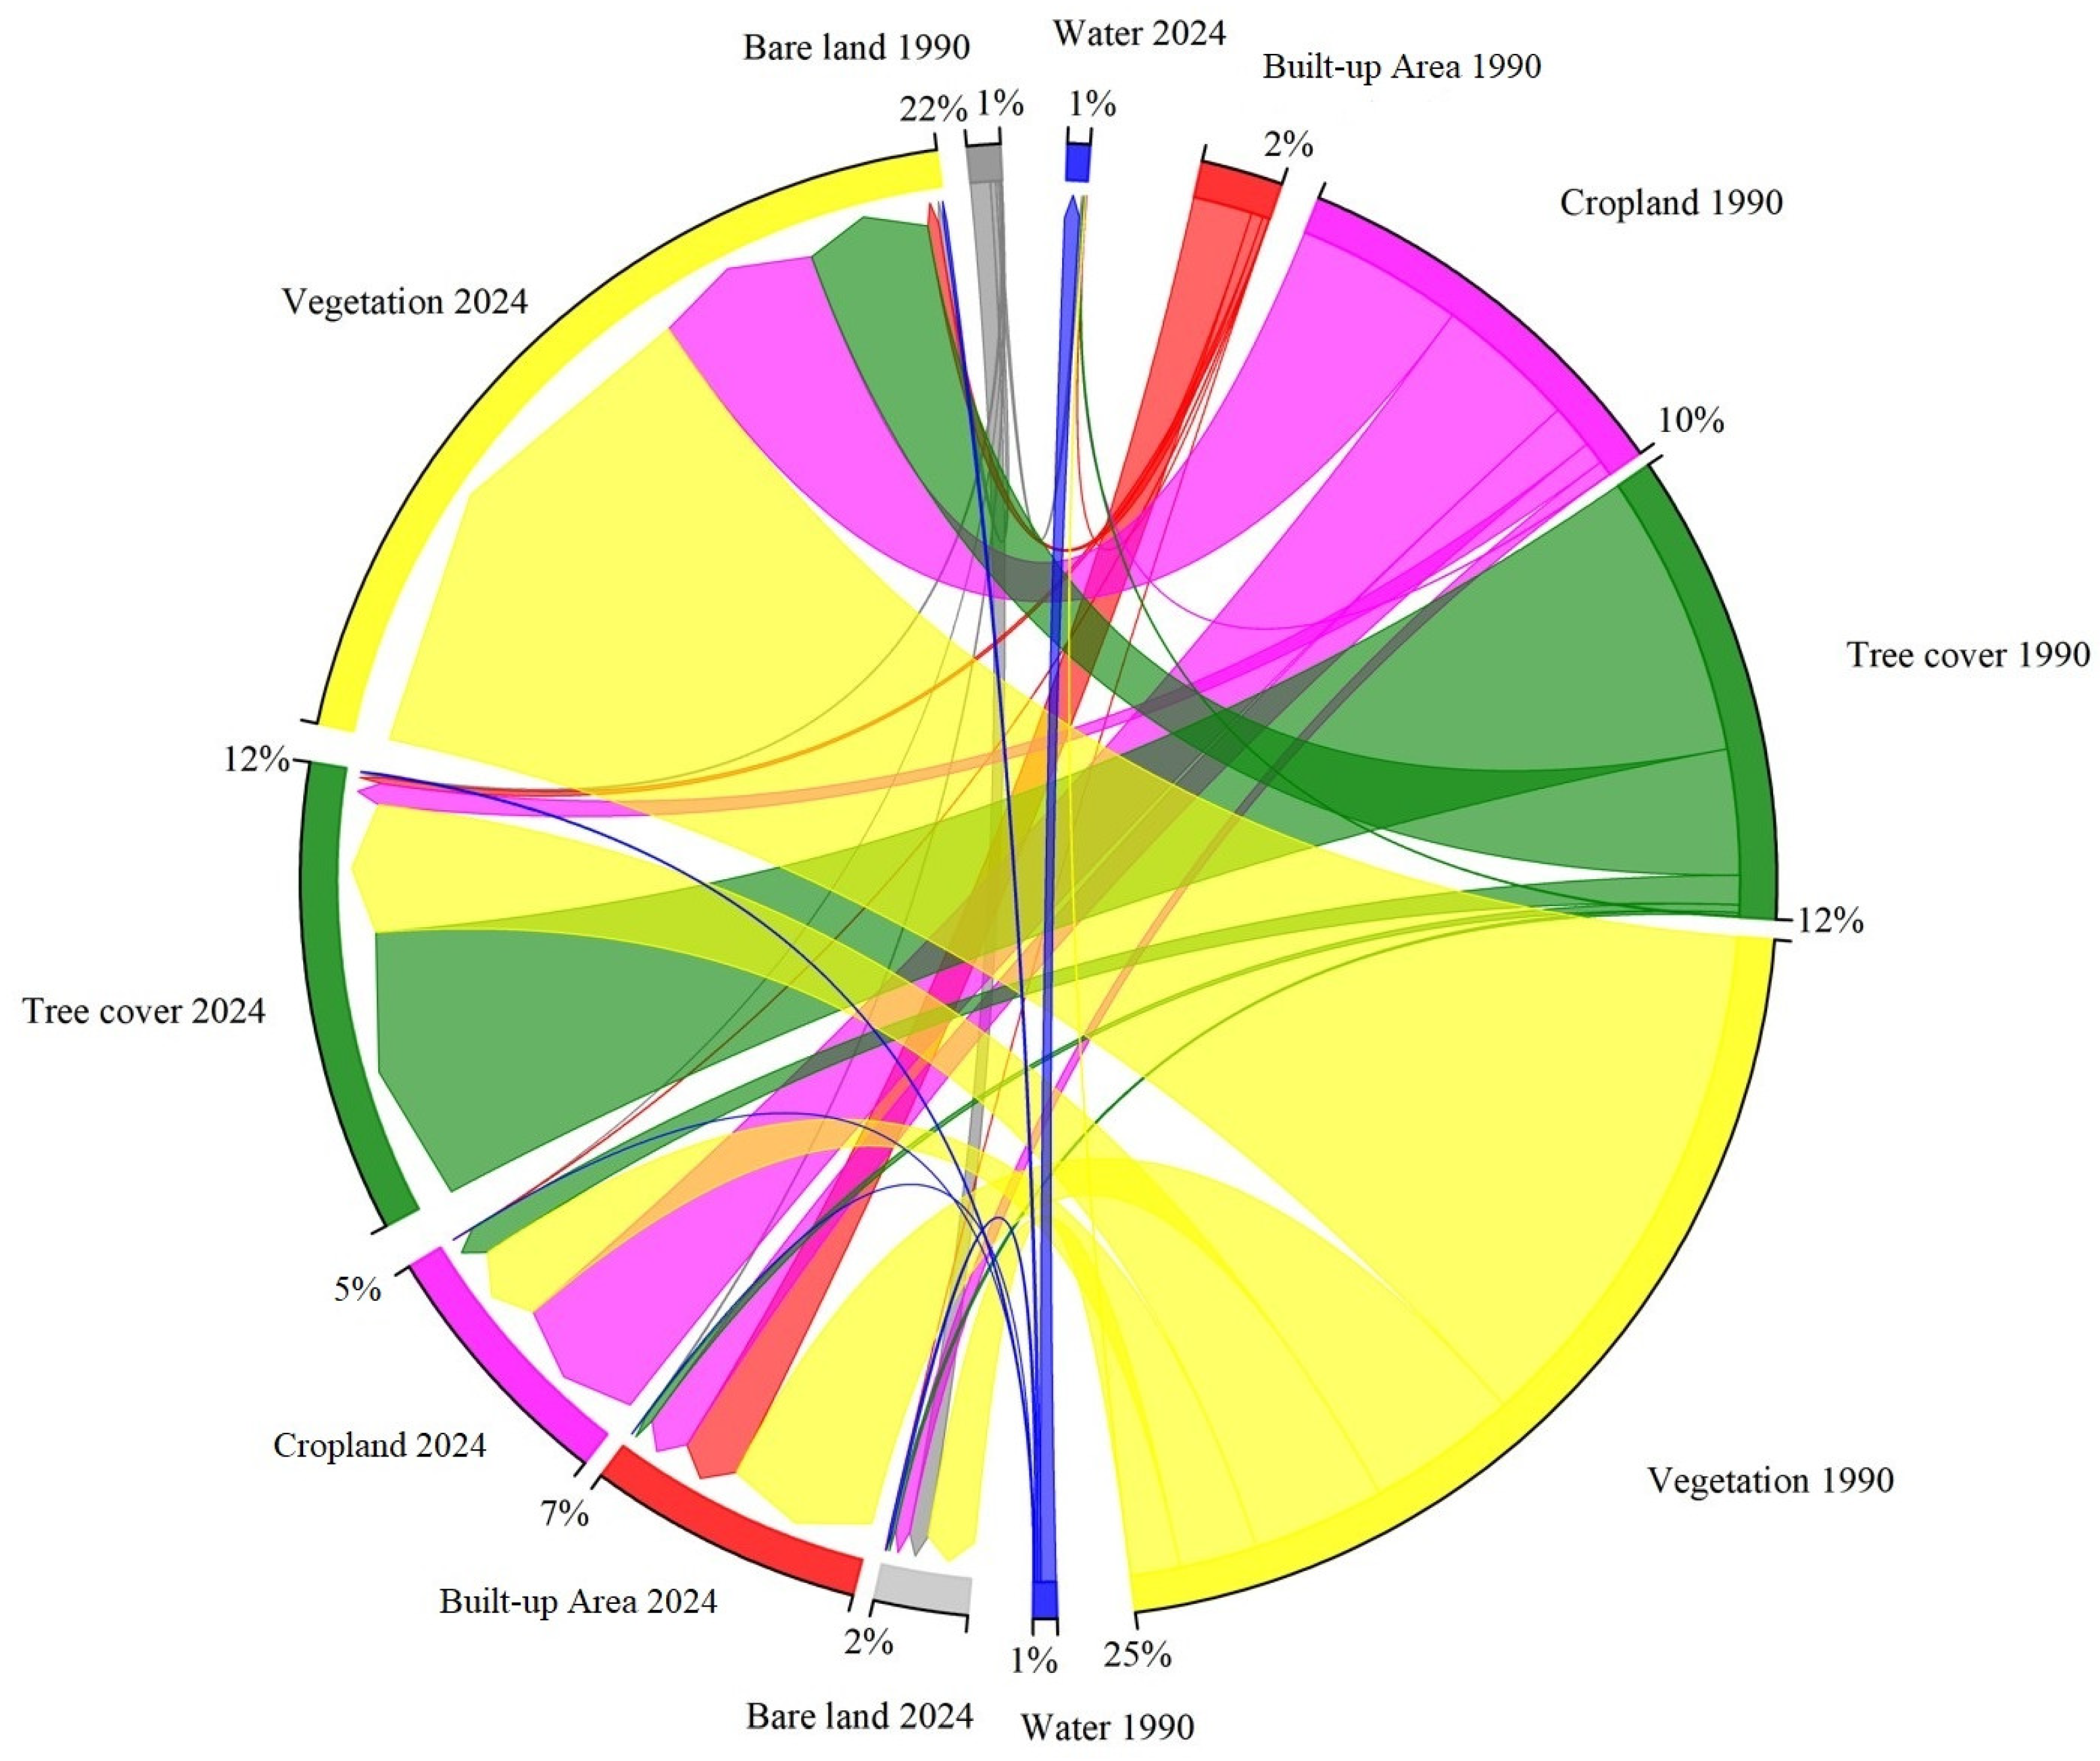
We have employed a land transfer matrix to further analyze the transition of LCC from 1990 to 2024, which provided the results for alterations in each land cover type to the other over the time span of the last three decades. As can be seen from Table 7 and Figure 5, a significant portion of the cropland and vegetation was converted into a built-up area of 13.1 km2 and 44.8 km2, respectively, from 1990 to 2024. This is similar to the 4.4 km2 of cropland and 14.5 km2 of vegetation land transfer into bare land and the minor change of bare land (1.6 km2) into vegetation land from 1990 to 2024.
Table 7.
Land transfer matrix from 1990 to 2024 (area in sq.km).
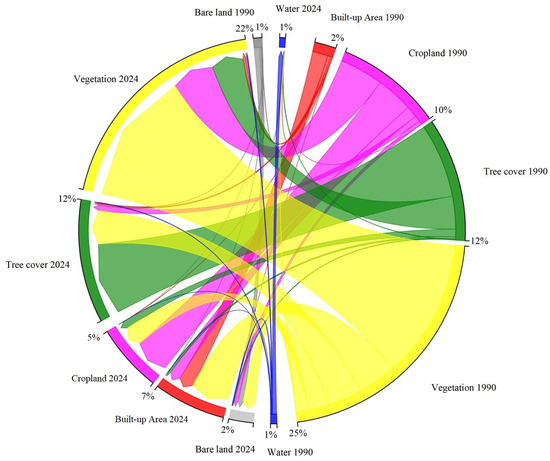
Figure 5.
Chord diagram representing the transformation of land classes in the study area from 1990 to 2024.
3.3. Impact of Urban Development and Encroachment on CHS Taxila
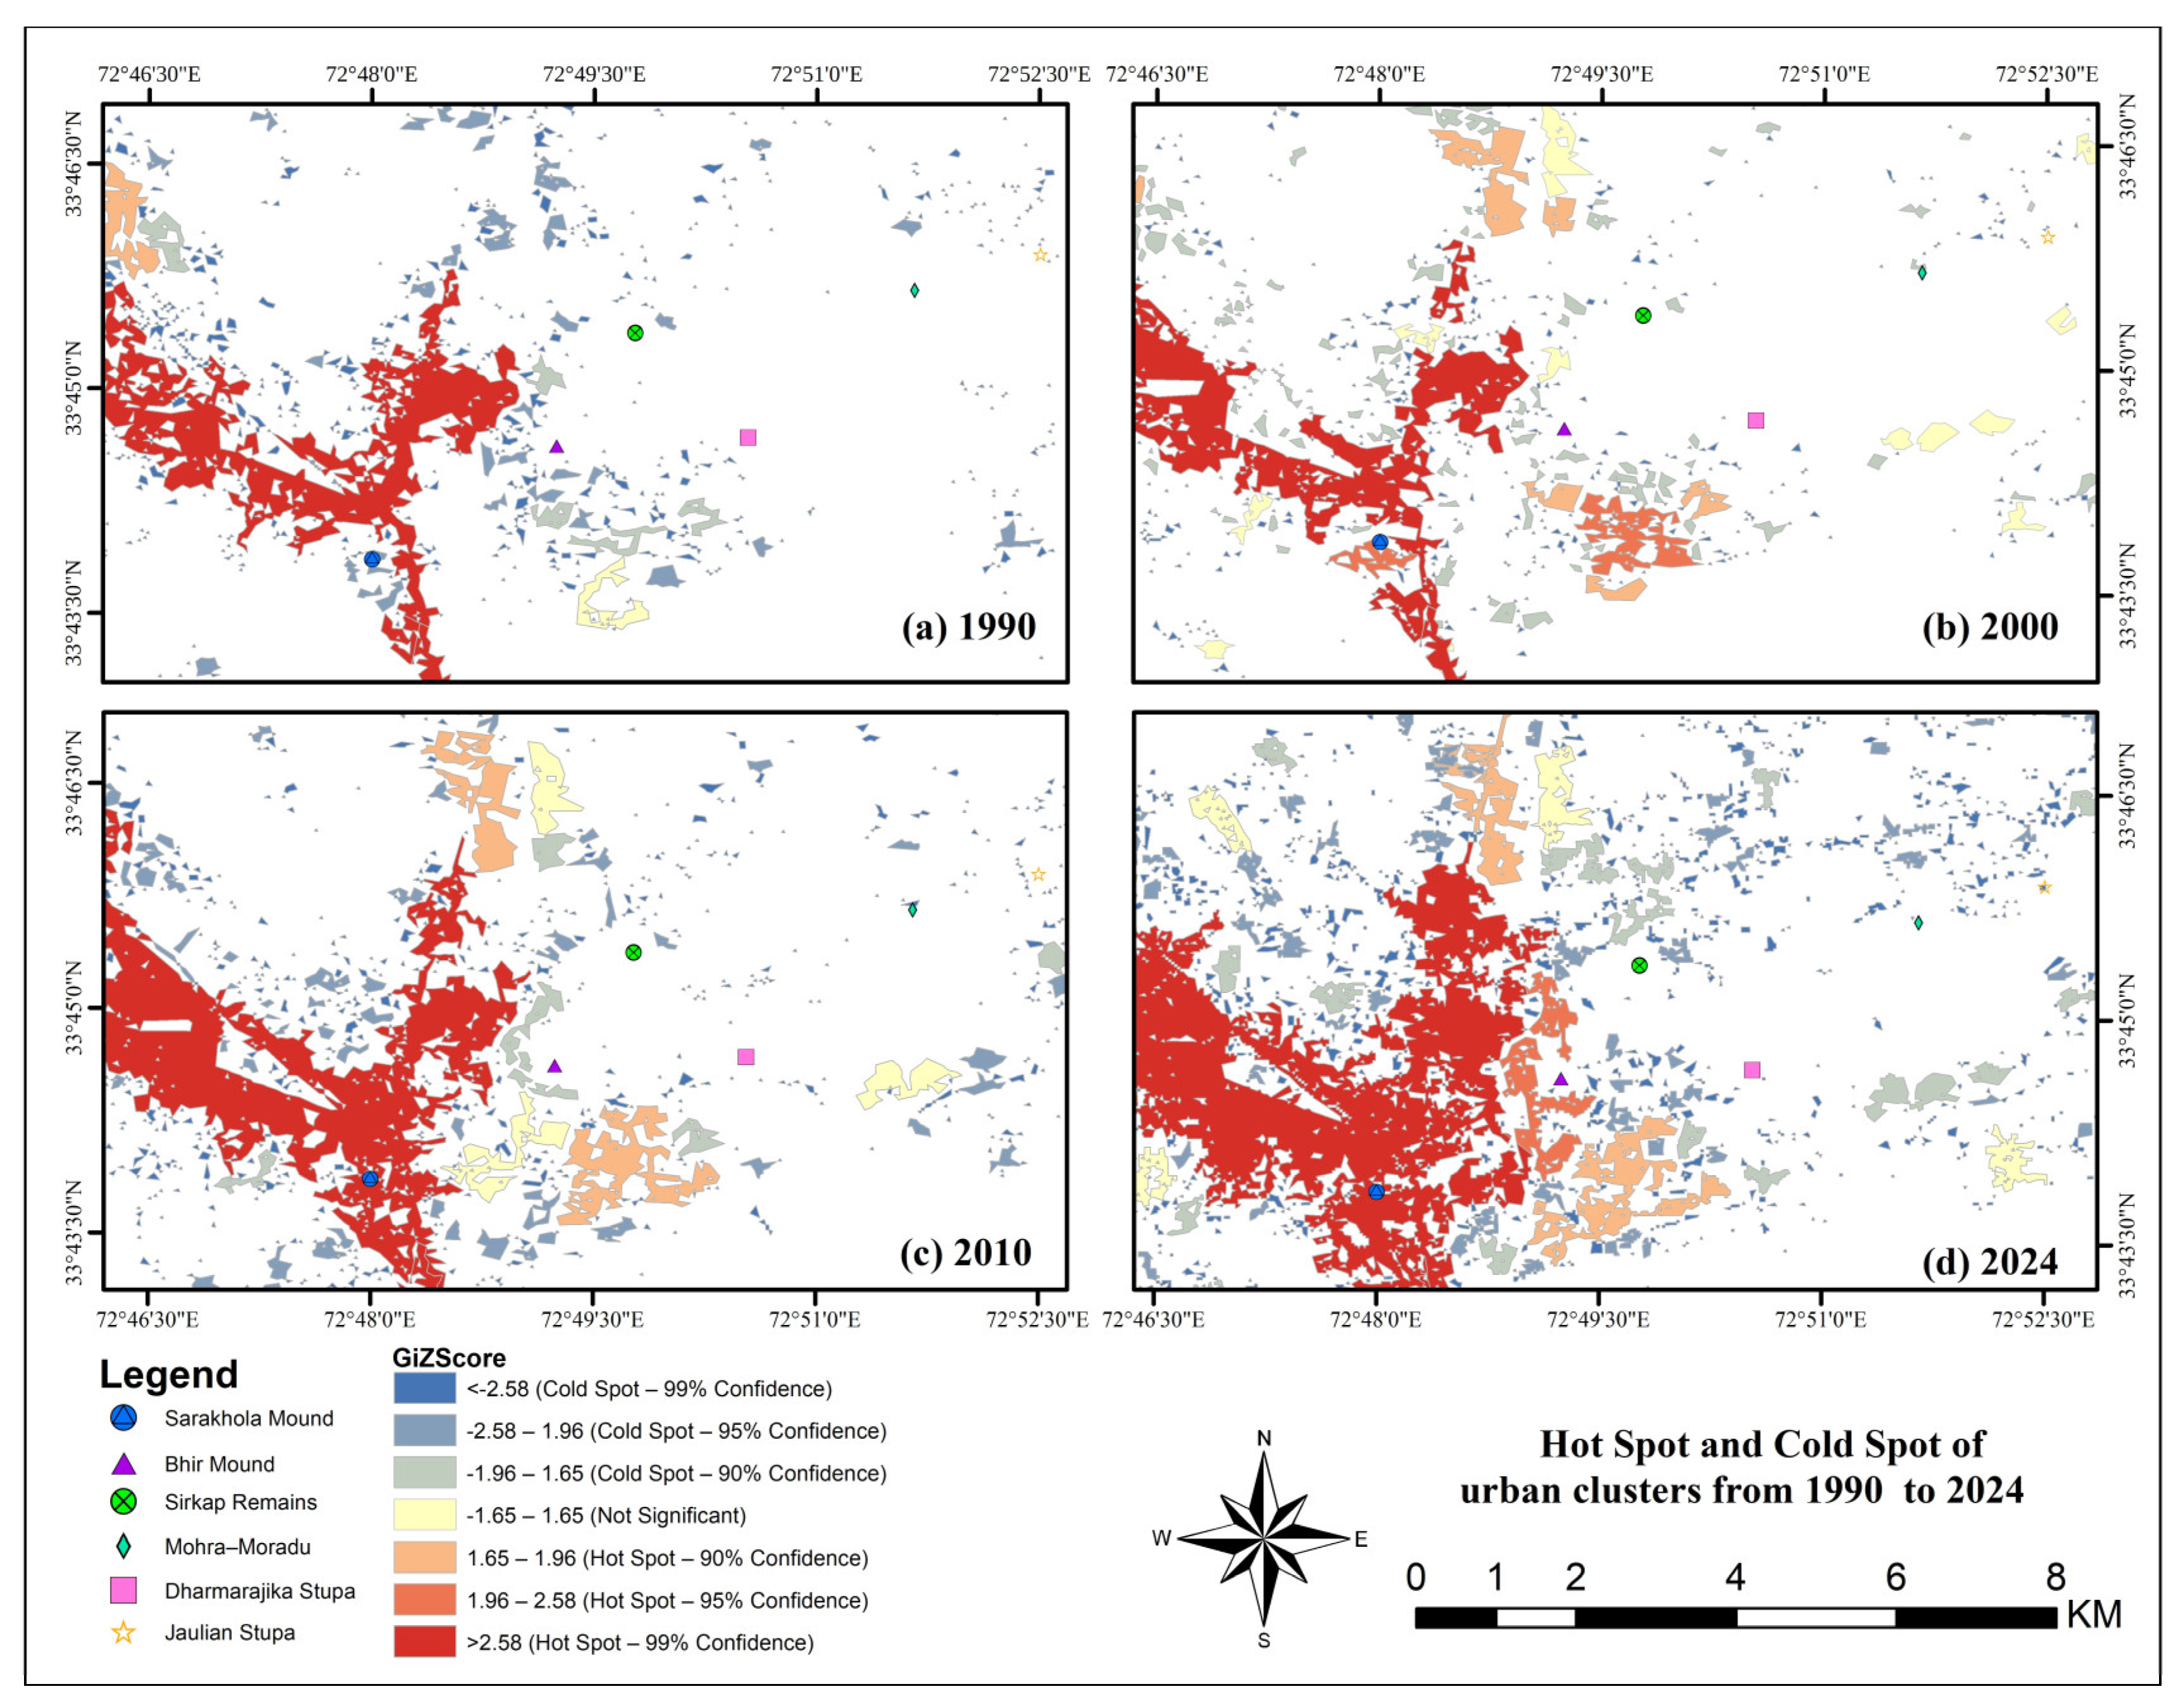
To check the impact of urban development and encroachment on Taxila’s world CHS, this study has applied the Getis–Ord Gi technique. The results in Figure 6 indicate that the spatial pattern of the urban cluster has a significant value from 1990 to 2024. All heritage sites observed a cold-spot pattern with low Z values in 1990, indicating a high to low cluster formation. By 2000, the Z value for the Sarakhol site increased to 1.96, demonstrating a low cluster pattern as a hot spot, while the remaining sites continued to show cold spot characteristics (high cluster). In 2010 and 2024, the Sarakhol site observed maximum hot-spot values, indicating high clusters. Bhir Mound showed a cold spot (low cluster) in 2010 and shifted to a hot spot (low cluster) in 2024, while other sites showed no significant changes.
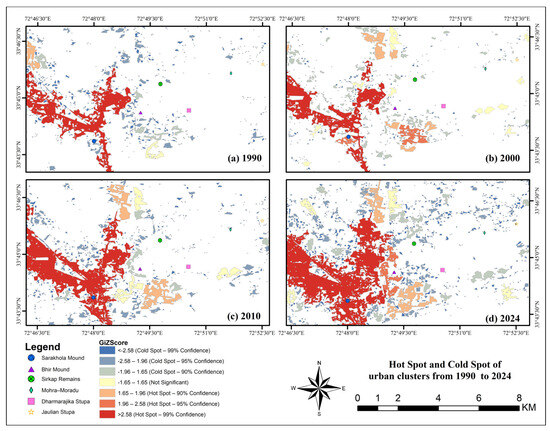
Figure 6.
Hot spot and cold spot analyses of urban clusters from 1990 to 2024.
Figure 7 illustrates the impact of urban development and encroachment on Taxila’s world cultural heritage sites. The graph reveals that Sarakhol and Bhir Mound were the most affected sites by urban development. Sarakhol exhibited a significant increase in area, expanding from 0.2423 km2 in 1990 to 0.3397 km2 in 2000 and further growing to 0.554 km2 and 0.627 km2 in 2010 and 2024, respectively. Similarly, Bhir Mound showed considerable growth, with its area increasing from 0.0665 km2 in 1990 to 0.074 km2 in 2000, 0.114 km2 in 2010, and 0.2733 km2 in 2024. In contrast, other sites depicted in Figure 7b demonstrated less significant changes than Sarakhol and Bhir Mound. High spatial resolution images in Figure 7c,d indicate increasing urban encroachment around these two sites. In 2004, the Sarakhola core zone was 0.0168 km2, shrinking to 0.0077 km2 and 0.0032 in 2015 and 2024, respectively. Concurrently, a similar trend is observed at the Bhir Mound site, where the distance between the core zone of the CHS and the adjacent urban residential areas has been progressively decreasing.
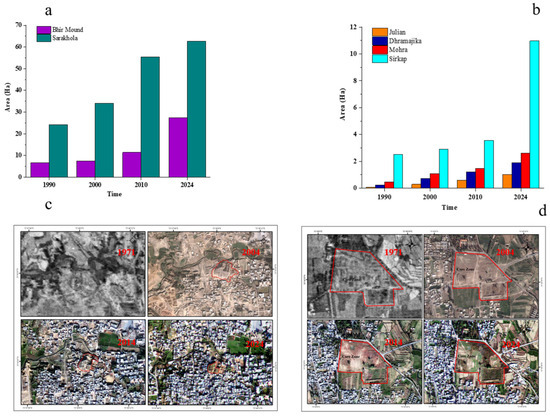
Figure 7.
Spatio-temporal change in built-up area around world cultural heritage sites in Taxila. (a) Sarakhol and Bhir Mound (Ha): 500 m built-up area. (b) Other heritage sites: 500-m built-up area (Ha). (c) Spatio-temporal change in the core zone of Sarakhol (Ha). (d) Spatio-temporal change in Bhir Mound.
4. Discussion
Urban development has pressured the region surrounding Taxila, a world-renowned CHS. Effective management and monitoring are essential to preserve this archaeological treasure. The widespread availability and affordability of remote sensing technology facilitate reliable data acquisition, which is crucial for developing innovative monitoring systems. These systems support preservation efforts and mitigation strategies aimed at safeguarding the region’s cultural heritage and landscape [59,60]. This study quantitatively analyzed urban development in the Taxila world CHS between 1990 and 2024. A marked increase in built-up area, the predominant land use class, was observed, expanding from 23.68 km2 in 1990 to 78.5 km2 by 2024 (Table 4). This rapid growth, particularly evident post-2010, is attributed to the development of new urban housing communities in response to the growing population in Pakistan [61,62]. Indeed, the increase in population required new commercial and residential areas, as well as public utilities, which was the main problem for conservation efforts toward CHSs [54]. Trend line analysis and high-resolution Gaofen-2 imagery (Figure 4 and Figure 7) verify the urban development phenomena. Furthermore, our results indicate the increase in built-up area was mainly due to the loss of crop and vegetation land. Concurrently, a chord diagram (Figure 5) illustrates a significant transformation of cropland (13.1 km2) and vegetation (44.8 km2) into built-up area (4.4 km2) and bare land (14.5 km2) land cover classes. Notably, this pattern aligns with trends in Pakistan’s urban planning policies. For instance, the Ravi Urban Development Authority (RUDA) in Lahore has acquired approximately 400 km2 of farmland for urban projects, demonstrating how farmland, rather than forested areas, is often targeted for development [63,64]. These findings underscore the escalating pressure on the site’s conservation efforts and highlight the urgent need for effective land use planning and management strategies to mitigate the negative impacts of urban development on the World Heritage Site.
Getis–Ord Gi analysis revealed predominantly positive Z statistic values, indicating a random cluster that is likely due to the low resolution of the dataset. However, proximity to the cultural heritage site revealed spatial variations in the cluster patterns (Figure 6). Getis–Ord analysis revealed high Z-score values for Sarakhol and Bhir Mound between 1990 and 2024, which indicated a shift from low to high clustering. Conversely, the remaining four sites exhibited low Z-score values, suggesting cold-spot conditions [58]. These findings were thoroughly validated by the results from 500 m built-up area and high spatial resolution KH-9, Google Earth Pro and Gaofen-2 imagery from 1971, 2004, 2015 and 2024, respectively. Sarakhola’s built-up area expanded from 0.2423 km2 in 1990 to 0.627 km2 in 2024, reflecting a 159% increase. In contrast, Bhir Mound exhibited an even more substantial rise from 0.0665 to 0.2733 km2, corresponding to a 311% expansion. Figure 7c shows reductions in the Sarakhol core zone from 0.0168 km2 in 2004 to 0.0077 km2 and 0.0032 km2 by 2015 and 2024, respectively. These results underscore the critical need for Pakistan to enhance monitoring and strictly implement the Antiquities Act 1975 to sustain its OUV status from UNESCO [14,27].
Analyzing the land cover change and spatial urban distribution patterns reveals a pronounced clustering around the archaeological landscape over time. While the environmental consequences of urban expansion can vary, it is evident that unplanned urban growth consistently exacerbates negative impacts. Urban expansion poses a significant threat to the integrity of Taxila and mirrors challenges faced by numerous developing and developed countries [35]. Furthermore, urban development and encroachments around archaeological sites, such as Saraikhol, Bhir Mound, and other sites, highlight a lack of buffer zone protection [10]. This inadequate protection is one among other ongoing issues that significantly irrevocably damage these invaluable CHSs.
In the study area of Taxila, the expansion of urban areas from 1990 to 2024 has resulted in a significant loss of cropland and vegetation, as illustrated in Figure 5. This transformation is primarily characterized by converting agricultural and vegetated areas into built-up area. The challenges in Taxila reflect global issues faced by cultural heritage sites. The Giza Pyramids in Egypt face urban encroachments from Cairo’s rapid expansion [65]. Similarly, Hue monuments in Vietnam struggle with unplanned urbanization causing damage to archaeological zones [66], and in Jordan, uncontrolled urban growth threatens the site’s integrity [67]. These examples highlight the need for effective strategies to safeguard Taxila’s world cultural heritage. Additionally, the lack of an adequate buffer zone around the core heritage zone has been a critical factor in this urban encroachment. Consequently, residential areas, commercial developments, quarrying activities, road networks, and public utilities have increasingly encroached upon the core zone [25]. This uncontrolled urban sprawl threatens the integrity of the world cultural heritage site and disrupts the historical landscape. The absence of stringent land use regulations and effective urban planning strategies has exacerbated this situation. Additionally, the region’s rapid population growth and economic development in the region have intensified the pressure on these culturally significant areas, potentially compromising their OUV, as recognized by UNESCO.
5. Conclusions
While this study provides valuable insights into the land cover changes and urban encroachment affecting Taxila’s world cultural heritage site (CHS), it is not without limitations. The reliance on Landsat imagery (30 m resolution) may overlook small-scale or recent encroachments, which introduce data uncertainty in detecting finer landscape transformations. Moreover, methodological constraints, such as the choice of classification algorithms and the resolution of data used in hot spot and cold spot analyses, could influence the observed clustering patterns. Despite these constraints, our findings reveal a significant expansion in built-up area from 23.68 km2 to 78.5 km2 between 1990 and 2024, primarily at the expense of cropland and vegetation (reduced by 13.1 km2 and 44.8 km2, respectively). Sarakhol and Bhir Mound experienced particularly intense urbanization, with Sarakhol’s core zone diminishing by 81% between 2004 and 2024.
Moving forward, integrating socioeconomic data such as demographic trends, land ownership, and economic indicators would yield a more holistic understanding of the drivers behind rapid urbanization near heritage sites. Additionally, employing higher-resolution or multisensor imagery such as Sentinel-2, commercial satellites and LiDAR may improve the detection of subtle encroachment patterns. The conservation of CHSs is critical for preserving their historical and cultural significance, as these sites offer tangible links to our past. To safeguard Taxila’s integrity, buffer zones should be delineated by integrating data from field surveys, high-resolution satellite imagery, spatial data, topography and the historical and cultural significance of the area. By incorporating these data delineation, the buffer would be determined. For instance, a 100 m buffer around the most significant historical and cultural feature could ensure the utmost protection, with 200 m surrounding areas that are still of historical importance but may allow limited developments under strict conservation regulation. Additionally, these buffer zones can be integrated into local urban planning policies through zoning laws, creating a legal framework to limit encroachment and safeguard the integrity of the World Heritage Site. Finally, revising outdated regulations such as the Antiquities Act 1975, enhancing monitoring systems and implementing stricter penalties for violations would strengthen heritage protection and maintain the outstanding universal value of these archaeological treasures for future generations.
Supplementary Materials
The following supporting information can be downloaded at: https://www.mdpi.com/article/10.3390/su17031059/s1, Table S1: shows details of confusion matrices along with user accuracy, producer accuracy, overall accuracy, and Kappa co-efficient for the year 1990, Table S2 shows details of confusion matrices along with user accuracy, producer accuracy, overall accuracy, and Kappa co-efficient for the year 2000, Table S3 shows details of confusion matrices along with user accuracy, producer accuracy, overall accuracy, and Kappa co-efficient for the year 2010, Table S4 shows details of confusion matrices along with user accuracy, producer accuracy, overall accuracy, and Kappa co-efficient for the year 2024.
Author Contributions
Conceptualization, N.u.S.Z.B. and X.W.; methodology, N.u.S.Z.B., X.W., L.L. and H.U.H.; software, N.u.S.Z.B.; validation, N.u.S.Z.B., X.W. and H.U.H.; formal analysis, N.u.S.Z.B. and X.W.; investigation, N.u.S.Z.B. and X.W.; writing—original draft preparation, N.u.S.Z.B.; writing—review and editing, N.u.S.Z.B., X.W., L.L. and H.U.H.; visualization, N.u.S.Z.B.; supervision, X.W. All authors have read and agreed to the published version of the manuscript.
Funding
This work was funded by the Construction of the China-Central Asia Human and Environment “Belt and Road” Joint Laboratory and Joint Research on Ancient Human Culture and Environment in Sulh River Basin (Grant No. E3BD052004, November 2022 to October 2025). The National Natural Science Foundation of China (42471370). Key Project of Sichuan Province’s Financial Support for the Protection and Utilization of Historical and Cultural Heritage: Remote Sensing Archaeology and Construction of the Joint Laboratory of Sichuan Province (2023–2026).
Institutional Review Board Statement
Not Applicable.
Informed Consent Statement
Not Applicable.
Data Availability Statement
The corresponding author will provide the data upon request.
Acknowledgments
The authors would like to acknowledge the Taxila Museum for providing the necessary data and the Alliance of International Science Organizations (ANSO) for providing the ANSO Scholarship for Young Talents scholarship program. Moreover, the authors are sincerely grateful in anticipation to the reviewers and editors for their constructive comments toward the improvement of the manuscript.
Conflicts of Interest
The authors declare no conflicts of interest.
References
- Alqahtany, A.; Aravindakshan, S. Urbanization in Saudi Arabia and sustainability challenges of cities and heritage sites: Heuristical insights. J. Cult. Herit. Manag. Sustain. Dev. 2021, 12, 408–425. [Google Scholar] [CrossRef]
- Al Shawabkeh, R.; AlHaddad, M.; Al_Fugara, A.; Arar, M.; Alhammad, R.; Alshraah, M.; Alhamouri, M. Toward sustainable urban growth: Spatial modeling for the impact of cultural and natural heritage on city growth and their role in developing sustainable tourism. Alex. Eng. J. 2023, 69, 639–676. [Google Scholar] [CrossRef]
- Zaina, F.; Abedin, Z.U.; Tariq, S.; Khan, M.J. Evaluation of risks to UNESCO World Heritage (WH) sites in Taxila, Pakistan using ground-based and satellite remote sensing techniques. J. Cult. Herit. 2022, 55, 195–209. [Google Scholar] [CrossRef]
- Pakistan Bureau of Statistics. 7th Population and Housing Census. 2023. Available online: https://www.pbs.gov.pk/digital-census/detailed-results (accessed on 5 September 2024).
- Luo, L.; Wang, X.; Guo, H.; Lasaponara, R.; Zong, X.; Masini, N.; Wang, G.; Shi, P.; Khatteli, H.; Chen, F.; et al. Airborne and spaceborne remote sensing for archaeological and cultural heritage applications: A review of the century (1907–2017). Remote Sens. Environ. 2019, 232, 111280. [Google Scholar] [CrossRef]
- Fu, L.; Zhang, Q.; Tang, Y.; Pan, J.; Li, Q. Assessment of urbanization impact on cultural heritage based on a risk-based cumulative impact assessment method. Herit. Sci. 2023, 11, 177. [Google Scholar] [CrossRef]
- UNPF. An Urbanizing World. In Urbanization, 3 October 2016th ed; UNPF: New York, NY, USA, 2016; Available online: https://www.unfpa.org/urbanization (accessed on 15 September 2024).
- Alnsour, J.; Arabeyyat, A.; Hyasat, A.; Al-Habees, M.; Aldweik, R. The Impact of Urbanization on Cultural Heritage Buildings in Jordan: As-Salt as a Case Study. Future Cities Environ. 2023, 9, 21. [Google Scholar] [CrossRef]
- Hussan, H.U.; Li, H.; Liu, Q.; Bashir, B.; Hu, T.; Zhong, S. Investigating Land Cover Changes and Their Impact on Land Surface Temperature in Khyber Pakhtunkhwa, Pakistan. Sustainability 2024, 16, 2775. [Google Scholar] [CrossRef]
- Sukwai, J.; Mishima, N.; Srinurak, N. Balancing cultural heritage conservation: Visual integrity assessment to support change management in the buffer zone of Chiang Mai historic city using GIS and computer-generated 3D modeling. Land 2022, 11, 666. [Google Scholar] [CrossRef]
- Wang, X.; Lasaponara, R.; Luo, L.; Chen, F.; Wan, H.; Yang, R.; Zhen, J. Digital Heritage. In Manual of Digital Earth; Springer: Singapore, 2019; pp. 565–591. [Google Scholar] [CrossRef]
- Li, Q.; Guo, H.; Luo, L.; Wang, X.; Yang, S. Impact Analysis of Land Use and Land Cover Change on Karez in Turpan Basin of China. Remote Sens. 2023, 15, 2146. [Google Scholar] [CrossRef]
- Yao, Y.; Wang, X.; Lu, L.; Liu, C.; Wu, Q.; Ren, H.; Yang, S.; Sun, R.; Luo, L.; Wu, K. Proportionated Distributions in Spatiotemporal Structure of the World Cultural Heritage Sites: Analysis and Countermeasures. Sustainability 2021, 13, 2148. [Google Scholar] [CrossRef]
- Luo, L.; Liu, J.; Cigna, F.; Evans, D.; Hernandez, M.; Tapete, D.; Shadie, P.; Agapiou, A.; Elfadaly, A.; Chen, M.; et al. Space Technology: A powerful tool for safeguarding World Heritage. Innovation 2023, 4, 100420. [Google Scholar] [CrossRef]
- UNESCO. The UNESCO Recommendation on the Historic Urban Landscape Report of the Second Consultation on Its Implementation by Member States, 2019 UNESCO World Heritage Centre. 2019. Available online: https://whc.unesco.org/en/hul/ (accessed on 18 September 2024).
- Shirvani Dastgerdi, A.; Sargolini, M.; Broussard Allred, S.; Chatrchyan, A.; De Luca, G. Climate change and sustaining heritage resources: A framework for boosting cultural and natural heritage conservation in Central Italy. Climate 2020, 8, 26. [Google Scholar] [CrossRef]
- Nikolaeva, J.V.; Bogoliubova, N.M.; Fokin, V.I.; Eltc, E.E.; Portnyagina, M.D. World cultural heritage in the context of globalization: Trends, issues and solutions. Int. J. Sci. Technol. Res. 2019, 8, 842–845. [Google Scholar]
- Hoang, K.V. The benefits of preserving and promoting cultural heritage values for the sustainable development of the country. In E3S Web of Conferences; EDP Sciences: Paris, France, 2021; p. 00076. [Google Scholar]
- Mendoza, M.A.D.; Franco, E.D.L.H.; Gómez, J.E.G. Technologies for the preservation of cultural heritage—A systematic review of the literature. Sustainability 2023, 15, 1059. [Google Scholar] [CrossRef]
- Cao, J.; Li, T. Analysis of spatiotemporal changes in cultural heritage protected cities and their influencing factors: Evidence from China. Ecol. Indic. 2023, 151, 110327. [Google Scholar] [CrossRef]
- Somuncu, M.; Khan, A.A. Current Status of Management and Protection of Taxila World Heritage Site, Pakistan. Ank. Üniversitesi Çevrebilimleri Derg. 2010, 2, 45–60. [Google Scholar] [CrossRef]
- Labadi, S. UNESCO world heritage convention (1972). In Encyclopedia of Global Archaeology; Springer: Berlin/Heidelberg, Germany, 2020; pp. 10822–10829. [Google Scholar]
- UNESCO. State of Conservation Report. 1995. Available online: https://whc.unesco.org/en/soc/2027 (accessed on 19 September 2024).
- UNESCO. State of Conservation Report. 1999. Available online: https://whc.unesco.org/en/soc/2347 (accessed on 19 September 2024).
- UNESCO. Periodic Reporting Cycle 2, Section II. 2012. Available online: https://whc.unesco.org/en/list/139/documents/ (accessed on 19 September 2024).
- UNESCO. State of Conservation Report. 2000. Available online: https://whc.unesco.org/en/soc/3077 (accessed on 19 September 2024).
- Khan, N.A.; Nuti, C.; Monti, G.; Micheli, M. Critical Review of Pakistani Current Legislation on Sustainable Protection of Cultural Heritage. Sustainability 2022, 14, 3633. [Google Scholar] [CrossRef]
- Saha, A.; Pal, S.C.; Santosh, M.; Janizadeh, S.; Chowdhuri, I.; Norouzi, A.; Roy, P.; Chakrabortty, R. Modelling multi-hazard threats to cultural heritage sites and environmental sustainability: The present and future scenarios. J. Clean. Prod. 2021, 320, 128713. [Google Scholar] [CrossRef]
- WHC. List of World Heritage in Danger. 2020. Available online: https://whc.unesco.org/en/danger/ (accessed on 19 September 2024).
- Machat, C.; Ziesemer, J. Heritage at Risk World Report 2016–2019 on Monuments and Sites in Danger; Hendrik BÄßLER Verlag: Berlin, Germany, 2020; p. 173. Available online: https://openarchive.icomos.org/id/eprint/2430/ (accessed on 19 September 2024).
- World Heritage Convention. Managing Historic Cities World Heritage Series n°27. 2010. Available online: https://whc.unesco.org/en/news/678/ (accessed on 20 October 2024).
- Luo, L.; Wang, X.; Guo, H. Remote sensing archaeology: The next century. Innovation 2022, 3, 100335. [Google Scholar] [CrossRef]
- Elfadaly, A.; Abate, N.; Masini, N.; Lasaponara, R. SAR Sentinel 1 Imaging and Detection of Palaeo-Landscape Features in the Mediterranean Area. Remote Sens. 2020, 12, 2611. [Google Scholar] [CrossRef]
- Li, G.; Fang, C.; Li, Y.; Wang, Z.; Sun, S.; He, S.; Qi, W.; Bao, C.; Ma, H.; Fan, Y.; et al. Global impacts of future urban expansion on terrestrial vertebrate diversity. Nat. Commun. 2022, 13, 1628. [Google Scholar] [CrossRef]
- Zhang, Y.; Zhang, H.; Sun, Z. Effects of urban growth on architectural heritage: The case of buddhist monasteries in the Qinghai-Tibet Plateau. Sustainability 2018, 10, 1593. [Google Scholar] [CrossRef]
- Xiao, D.; Lu, L.; Wang, X.; Nitivattananon, V.; Guo, H.; Hui, W. An urbanization monitoring dataset for world cultural heritage in the Belt and Road region. Big Earth Data 2021, 6, 127–140. [Google Scholar] [CrossRef]
- Nath, N.; Sahariah, D.; Meraj, G.; Debnath, J.; Kumar, P.; Lahon, D.; Chand, K.; Farooq, M.; Chandan, P.; Singh, S.K.; et al. Land use and land cover change monitoring and prediction of a UNESCO world heritage site: Kaziranga eco-sensitive zone using cellular automata-Markov model. Land 2023, 12, 151. [Google Scholar] [CrossRef]
- Guo, H.; Chen, F.; Tang, Y.; Ding, Y.; Chen, M.; Zhou, W.; Zhu, M.; Gao, S.; Yang, R.; Zheng, W.; et al. Progress toward the sustainable development of world cultural heritage sites facing land-cover changes. Innovation 2023, 4, 100496. [Google Scholar] [CrossRef] [PubMed]
- Kamran; Khan, J.A.; Khayyam, U.; Waheed, A.; Khokhar, M.F. Exploring the nexus between land use land cover (LULC) changes and population growth in a planned city of islamabad and unplanned city of Rawalpindi, Pakistan. Heliyon 2023, 9, e13297. [Google Scholar] [CrossRef]
- Mughal, M.R. Archaeological field research in Pakistan since independence: An overview. Bull. Deccan Coll. Res. Inst. 1990, 49, 261–278. [Google Scholar]
- UNESCO. United Nation Educational, Scientific and Cultural Organization 1980. Available online: https://whc.unesco.org/en/list/1399/ (accessed on 20 October 2024).
- Marshall, J. Taxila: An Illustrated Account of Archaeological Excavations Carried Out at Taxila; Bhartiya Publishing House: Varanasi, India, 1975; p. 473. [Google Scholar]
- Ahmed, N. The History and Archaeology of Taxila; University of London, School of Oriental and African Studies: London, UK, 1958. [Google Scholar]
- USGS. USGS Earth Explorer. 2020. Available online: https://earthexplorer.usgs.gov (accessed on 3 August 2024).
- Potapov, P.; Hansen, M.C.; Kommareddy, I.; Kommareddy, A.; Turubanova, S.; Pickens, A.; Adusei, B.; Tyukavina, A.; Ying, Q. Landsat analysis ready data for global land cover and land cover change mapping. Remote Sens. 2020, 12, 426. [Google Scholar] [CrossRef]
- Mishra, A.P.; Khali, H.; Singh, S.; Pande, C.B.; Singh, R.; Chaurasia, S.K. An assessment of in-situ water quality parameters and its variation with Landsat 8 level 1 surface reflectance datasets. Int. J. Environ. Anal. Chem. 2023, 103, 6344–6366. [Google Scholar] [CrossRef]
- Luo, L.; Wang, X.; Guo, H.; Lasaponara, R.; Shi, P.; Bachagha, N.; Li, L.; Yao, Y.; Masini, N.; Chen, F.; et al. Google Earth as a powerful tool for archaeological and cultural heritage applications: A review. Remote Sens. 2018, 10, 1558. [Google Scholar] [CrossRef]
- Shafizadeh-Moghadam, H.; Khazaei, M.; Alavipanah, S.K.; Weng, Q. Google Earth Engine for large-scale land use and land cover mapping: An object-based classification approach using spectral, textural and topographical factors. GIScience Remote Sens. 2021, 58, 914–928. [Google Scholar] [CrossRef]
- Panuju, D.R.; Paull, D.J.; Griffin, A.L. Change Detection Techniques Based on Multispectral Images for Investigating Land Cover Dynamics. Remote Sens. 2020, 12, 1781. [Google Scholar] [CrossRef]
- Chughtai, A.H.; Abbasi, H.; Karas, I.R. A review on change detection method and accuracy assessment for land use land cover. Remote Sens. Appl. Soc. Environ. 2021, 22, 100482. [Google Scholar] [CrossRef]
- Pandey, P.C.; Koutsias, N.; Petropoulos, G.P.; Srivastava, P.K.; Ben Dor, E. Land Use/Land Cover in view of Earth Observation: Data Sources, Input Dimensions and Classifiers—A Review of the State of the Art. Geocarto Int. 2020, 36, 957–988. [Google Scholar] [CrossRef]
- Li, W.; Dong, R.; Fu, H.; Wang, J.; Yu, L.; Gong, P. Integrating Google Earth imagery with Landsat data to improve 30-m resolution land cover mapping. Remote Sens. Environ. 2020, 237, 111563. [Google Scholar] [CrossRef]
- Rwanga, S.S.; Ndambuki, J.M. Accuracy Assessment of Land Use/Land Cover Classification Using Remote Sensing and GIS. Int. J. Geosci. 2017, 8, 611–622. [Google Scholar] [CrossRef]
- Sardaro, R.; La Sala, P.; De Pascale, G.; Faccilongo, N. The conservation of cultural heritage in rural areas: Stakeholder preferences regarding historical rural buildings in Apulia, southern Italy. Land Use Policy 2021, 109, 105662. [Google Scholar] [CrossRef]
- Zhang, Z.; Wei, Y.; Li, X.; Wan, D.; Shi, Z. Study on Tianjin Land-Cover Dynamic Changes, Driving Factor Analysis, and Forecasting. Land 2024, 13, 726. [Google Scholar] [CrossRef]
- Xu, H.; Croot, P.; Zhang, C. Discovering hidden spatial patterns and their associations with controlling factors for potentially toxic elements in topsoil using hot spot analysis and K-means clustering analysis. Environ. Int. 2021, 151, 106456. [Google Scholar] [CrossRef]
- Fischer, M.M.; Getis, A. Handbook of Applied Spatial Analysis: Software Tools, Methods and Applications; Springer: Berlin, Germany, 2010; pp. 125–134. [Google Scholar]
- Elfadaly, A.; Attia, W.; Qelichi, M.M.; Murgante, B.; Lasaponara, R. Management of cultural heritage sites using remote sensing indices and spatial analysis techniques. Surv. Geophys. 2018, 39, 1347–1377. [Google Scholar] [CrossRef]
- Lasaponara, R.; Murgante, B.; Elfadaly, A.; Qelichi, M.M.; Shahraki, S.Z.; Wafa, O.; Attia, W. Spatial open data for monitoring risks and preserving archaeological areas and landscape: Case studies at Kom el Shoqafa, Egypt and Shush, Iran. Sustainability 2017, 9, 572. [Google Scholar] [CrossRef]
- Moullou, D.; Vital, R.; Sylaiou, S.; Ragia, L. Digital Tools for Data Acquisition and Heritage Management in Archaeology and Their Impact on Archaeological Practices. Heritage 2023, 7, 107–121. [Google Scholar] [CrossRef]
- Zahoor, S.; Abdul, G.; Awan, A. Impact of Expansion of Housing Societies on Agricultural Production in Pakistan. Glob. J. Manag. Soc. Sci. Humanit. 2023, 9, 1–57. [Google Scholar] [CrossRef]
- Rehman, A.; Jamil, F. Impact of urban residential location choice on housing, travel demands and associated costs: Comparative analysis with empirical evidence from Pakistan. Transp. Res. Interdiscip. Perspect. 2021, 10, 100357. [Google Scholar] [CrossRef]
- Mumtaz, F.; Yu, T.; De Leeuw, G.; Zhao, L.; Fan, C.; Elnashar, A.; Bashir, B.; Wang, G.; Li, L.; Naeem, S.; et al. Modeling spatio-temporal land transformation and its associated impacts on land surface temperature (LST). Remote Sens. 2020, 12, 2987. [Google Scholar] [CrossRef]
- Mumtaz, F.; Li, J.; Liu, Q.; Arshad, A.; Dong, Y.; Liu, C.; Zhao, J.; Bashir, B.; Gu, C.; Wang, X.; et al. Spatio-temporal dynamics of land use transitions associated with human activities over Eurasian Steppe: Evidence from improved residual analysis. Sci. Total. Environ. 2023, 905, 166940. [Google Scholar] [CrossRef]
- Elfadaly, A.; Zanaty, N.; Mostafa, W.; Hendawy, E.; Lasaponara, R. Multi-Sensor Satellite Images for Detecting the Effects of Land-Use Changes on the Archaeological Area of Giza Necropolis, Egypt. Land 2024, 13, 471. [Google Scholar] [CrossRef]
- Pham, V.-M.; Van Nghiem, S.; Van Pham, C.; Luu, M.P.T.; Bui, Q.-T. Urbanization impact on landscape patterns in cultural heritage preservation sites: A case study of the complex of Huế Monuments, Vietnam. Landsc. Ecol. 2021, 36, 1235–1260. [Google Scholar] [CrossRef]
- Ababneh, A.; Al-Saad, S.; Al-Shorman, A.; AL Kharouf, R. Land Use Change at the Historical Tourist Attractions of Umm Qais, Jordan: GIS and Markov Chain Analyses. Int. J. Hist. Archaeol. 2018, 23, 235–259. [Google Scholar] [CrossRef]


Disclaimer/Publisher’s Note: The statements, opinions and data contained in all publications are solely those of the individual author(s) and contributor(s) and not of MDPI and/or the editor(s). MDPI and/or the editor(s) disclaim responsibility for any injury to people or property resulting from any ideas, methods, instructions or products referred to in the content. |
© 2025 by the authors. Licensee MDPI, Basel, Switzerland. This article is an open access article distributed under the terms and conditions of the Creative Commons Attribution (CC BY) license (https://creativecommons.org/licenses/by/4.0/).