Abstract
The fuel cell electric vehicle (FCEV) is a promising transportation technology for resolving the air pollution and climate change issues in the United States. However, a large-scale penetration of FCEVs would require a sustained supply of hydrogen which does not exist now. Water electrolysis can produce hydrogen reliably and sustainably if the electricity grid is clean, but the impacts of FCEVs on the electricity grid are unknown. In this paper, we develop a comprehensive framework to model FCEV-driving and -refueling behaviors, the water electrolysis process, and electricity grid operation. We chose the Western Electricity Coordinating Council (WECC) region for this case study. We modeled the existing WECC electricity grids and accounted for the additional electricity loads from FCEVs using a Production Cost Model (PCM). Additionally, the hydrogen need for five million FCEVs leads to a 3% increase in electricity load for WECC. Our results show that an inflexible hydrogen-producing process leads to a 1.55% increase to the average cost of electricity, while a flexible scenario leads to only a 0.9% increase. On the other hand, oversized electrolyzers could take advantage of cheaper electricity generation opportunities, thus lowering total system costs.
1. Introduction
Renewable energy sources could mitigate air pollution, reduce carbon dioxide emissions, and improve energy security. Currently, around 29% of the total greenhouse gas (GHG) emissions come from the transportation sector, around 60% of which come from light-duty vehicles [1]. Advanced vehicle technologies, such as fuel cell electric vehicles (FCEVs) and battery electric vehicles (BEVs) are projected to substantially reduce GHG and air pollutant emissions [2]. Among emerging clean technologies, fuel cell electric vehicles (FCEVs) have garnered significant attention due to their potential to reduce emissions while maintaining high performance. Unlike battery electric vehicles (BEVs), FCEVs use hydrogen fuel cells to generate electricity, providing advantages such as faster refueling times and longer driving ranges. Despite these benefits, the large-scale adoption of FCEVs faces critical challenges, particularly in the development of a reliable and sustainable hydrogen supply chain, which is currently lacking [3]. Compared to battery electric vehicles, FCEVs have several unique advantages such as a charging rate comparable to conventional gasoline vehicles and a much larger vehicle range [4]. So far, several FCEVs, including Toyota Mirai, Hyundai Tucson, and Honda Clarity, have been commercialized and are available to purchase or rent in the US market. The details of these FCEVs can be found in Table A1 and Table A2 (Appendix A section).
In energy systems, renewable energy such as solar energy and non-renewable energy such as fossil energy can generate electricity and transport it to the grid, and then directly use the electric energy of the grid for electrolytic hydrogen production, which is the conversion of electric energy to hydrogen energy. Hydrogen is stored by hydrogen storage facilities. The hydrogen energy conversion process involves the use of hydrogen as an alternative fuel in energy systems, particularly through fuel cells which convert chemical energy directly into electrical energy, thereby increasing efficiency and minimizing energy loss [5]. The electricity generated by hydrogen can be used not only to power vehicles but also to transport it into the grid to regulate it. The whole process of energy conversion is shown in Figure 1.
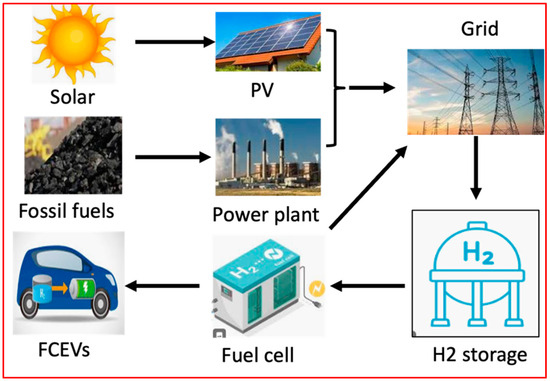
Figure 1.
Schematic diagram for energy conversion.
In recent years, hydrogen technology has attracted increasing attention across the world. In the United States, the Fuel Cell Technology Office (FCTO) in the Department of Energy led a comprehensive portfolio of research programs and projects on hydrogen technology [6]. In China, the central government has set a goal to sell 1 million FCEVs by 2030 [7]. However, once there is a non-negligible stock of FCEVs on road, the demand for hydrogen to refuel these FCEVs would be very large, and building a hydrogen production, delivery, and charging infrastructure of such a scale is a challenging task.
Several studies have explored the environmental benefits of hydrogen and FCEVs. For example, Bampaou [8] reviewed the advancements in hydrogen infrastructure, while Jayachandran [9] discussed the global role of hydrogen in achieving climate goals. Yet, these studies primarily focus on hydrogen production feasibility and its environmental impact without thoroughly addressing its interaction with electricity grid operations. On the other hand, grid-focused research, such as Das et al. [10] and Hartvigsson et al. [11], analyzed the impacts of additional electricity loads from BEVs. However, these studies do not examine the unique dynamics introduced by hydrogen production for FCEVs, particularly when integrating flexible or inflexible production processes. This gap in understanding calls for a deeper investigation into how FCEVs and hydrogen production interact with electricity grids under varying scenarios of adoption and technology design. Hydrogen can be produced via water electrolysis. It is a mature process with inputs that are simply electricity and water. Compared to other hydrogen production technologies, water electrolysis has several unique advantages [12]. First, an electrolyzer is a modular instrument and can scale up very quickly. Second, electricity grids are parts of the existing infrastructure, so there is much less need to build a new infrastructure except for installing electrolyzers at the refueling stations. Third, the distributed production nature of electrolyzers could improve the resiliency and security of the infrastructure.
One potential drawback of electrolysis is a potentially high cost to produce hydrogen. Much previous literature only focus on the cost analysis of the water electrolysis, e.g., proton exchange membrane electrolysis, alkaline electrolysis, and solid oxide electrolysis [13,14]. Some studies also only highlight the infrastructure factors that affect the total cost, e.g., hydrogen storage capacity and gas injection limits [15,16]. And other studies focus on emission reduction as the main research goal [17,18,19]. Electric traction, primarily in rail transport, reduces oil dependency but often relies on fossil fuels for electricity. Electric vehicles achieve higher energy conversion efficiencies (80–90%) compared to fossil fuel vehicles (30–45%) [20].
When using this technology to regular electricity, both the load and economic influence on the grid is significant because of water electrolysis. In this study, we investigated the impact of hydrogen production from water electrolysis powered by an actual electricity grid on the electricity grid, as well as the economic viability of hydrogen produced. To do so, we have developed a comprehensive framework to model FCEV-driving and -refueling behaviors, water electrolysis process, and electricity grid operation. We choose the Western Electricity Coordinating Council (WECC) region in the United States for a case study. California, which is the most populated state in WECC, leads the world in FCEV research, development, and commercialization.
This paper addresses these challenges by developing a comprehensive modeling framework that integrates FCEV-driving and -refueling patterns, hydrogen production through water electrolysis, and electricity grid operations. Focusing on the Western Electricity Coordinating Council (WECC) region, this study evaluates the impacts of FCEV penetration on electricity demand and grid performance. The WECC region is particularly relevant due to its diverse energy mix and significant reliance on renewable energy sources.
The main contributions of this work include the following:
- Quantifying the additional electricity demand from FCEVs and its impacts on grid operations;
- Comparing the cost implications of flexible versus inflexible hydrogen production processes;
- Exploring the benefits of oversized electrolyzers in utilizing low-cost electricity generation opportunities.
This paper is divided into four sections. In the first section, we discussed the backgrounds, status, opportunities, and challenges of hydrogen production and fuel cell electric vehicles. In the second section, we described the method details and assumptions for the linked framework to investigate the impact of FCEVs on the electricity grid. In the third section, we discussed the results in this work. Finally, we concluded our findings in the final section.
2. Methodology
This section outlines the integrated framework developed to evaluate the impact of fuel cell electric vehicles (FCEVs) on the electricity grid. The framework is structured into four key components:
- FCEV Technology Specifications and Load Characterization: We begin by introducing the technical specifications of FCEVs, including their energy requirements, and detail the process of characterizing electricity loads associated with FCEV adoption.
- Driving and Refueling Behavior Modeling: Next, we model the driving and refueling behaviors of an FCEV fleet using a V2G simulator to estimate the corresponding energy consumption. This step provides a comprehensive understanding of how FCEVs interact with energy systems during operation.
- Hydrogen Refueling Profiles and Station Allocation: We then map FCEV refueling profiles at the station level, considering spatial distribution, to allocate hydrogen refueling stations effectively. This step ensures that the hydrogen demand is distributed in a manner consistent with geographic and operational constraints.
- Electricity Grid Simulation with PLEXOS: Finally, we simulate the existing Western Electricity Coordinating Council (WECC) electricity grids using the Production Cost Model (PCM), PLEXOS. This simulation accounts for the additional electricity load introduced by FCEVs, providing insights into their impact on grid operation and cost dynamics.
This framework provides a systematic approach to analyze the interplay between FCEVs, hydrogen production, and electricity grid operations.
2.1. Electricity Load Characterization
2.1.1. Household Electricity Consumption
Based on the statistical information provided by the US Energy Information Administration (EIA) [21], a typical US residential household consumed about 10,399 kWh of electricity per year (i.e., 28.5 kWh per day). Table 1 summarizes the electricity rates for the five most expensive and five cheapest states in the United States. There is considerable variation in household electricity loads across US states. Hawaii has the highest electricity rate (27.47 cents per kWh) and the lowest average monthly electricity consumption (505 kWh per household). In contrast, Louisiana has the cheapest electricity rate (9.34 cents per kWh) and a much higher average monthly household electricity consumption (1240 kWh per household) [22]. It is clear that household electricity consumption is sensitive to the electricity rate.

Table 1.
Average household electricity loads and average electricity rates for ten selected states in the United States (2016).
2.1.2. FCEV Specification and Electricity Consumption
In this study, we assume a fleet of identical FCEVs. We assume all FCEVs are Toyota Mirai, which is the best-selling FCEV across the world [23]. Toyota Mirai has a 5 kg hydrogen tank and is able to drive for 500 km with a full tank of hydrogen. Toyota Mirai has an average energy consumption of 100 km per hydrogen kg [24]. According to the US National Household Travel Survey (NHTS) [25], the average driving distance per day is 56.33 km. In other words, 0.56 kg of hydrogen is needed for each FCEV per day.
Depending on the efficiency of the water electrolysis process, 48–67.5 kWh electricity is needed to split water to generate 1 kg of hydrogen [26]. For reference, we adopt the value 54.3, which means 54.3 kWh electricity can generate 1 kg of hydrogen. The Toyota Mirai, as the representative of fuel cell electric vehicle, consumes 1 kg of hydrogen for every 96.56 km. Combining with the above NHTS data, 30.4 kWh of electricity is needed to generate the amount of hydrogen. In other worlds, a fuel cell electric vehicle generates about the same electricity load as a typical US household for a day.
2.2. Hourly Demand of Hydrogen for FCEVs
In this section, we briefly introduce the framework used to estimate the hourly demand of hydrogen for FCEVs. The framework is summarized in Figure 2.
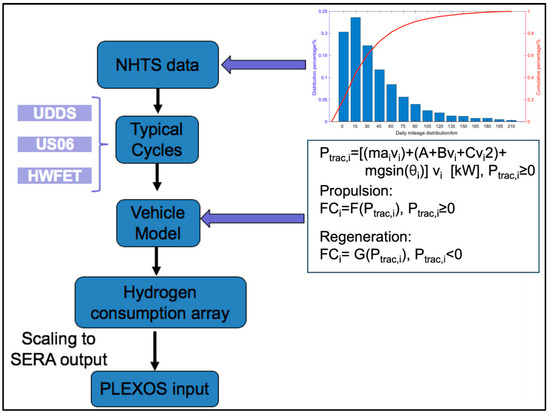
Figure 2.
Schematic diagram for calculation of time-varying hydrogen demand.
First, we estimated the distributions of driving trips according to the US NHTS survey data. Conducted by the Federal Highway Administration (FHWA), the NHTS is the only source that provides a good national representation on travel behaviors in the United States [27]. The NHTS data include daily non-commercial travel via all transportation modes. It also collects the socio-economic information of the travelers, including information about their households and vehicles. While there might be sample selection issues with the NHTS data, it is still the best data source to model vehicle trips for this project.
Then, we use the vehicle model to calculate the time-varying hydrogen consumption array for the assumed distribution of driving trips, specifications of Toyota Mirai, and three representative drive cycles (UDDS, US06, and HWFET) [28,29]. The hydrogen consumption array represents the hourly hydrogen refueling profile for one representative FCEV. We rely on the Scenario Evaluation and Regionalization Analysis (SERA) model [30] to generate the scenarios for FCEV adoption and the number of FCEVs predicted. We then scale the hydrogen consumption array with the predicted number of FCEVs. Finally, with the assumed water electrolysis process data, we can estimate the hourly electricity loads for refueling the FCEV fleet assumed. These hourly electricity loads are inputted to the PLEXOS model for performing electricity grid dispatch simulation [31].
2.3. Hourly Demand of Hydrogen for FCEVs in Western United States
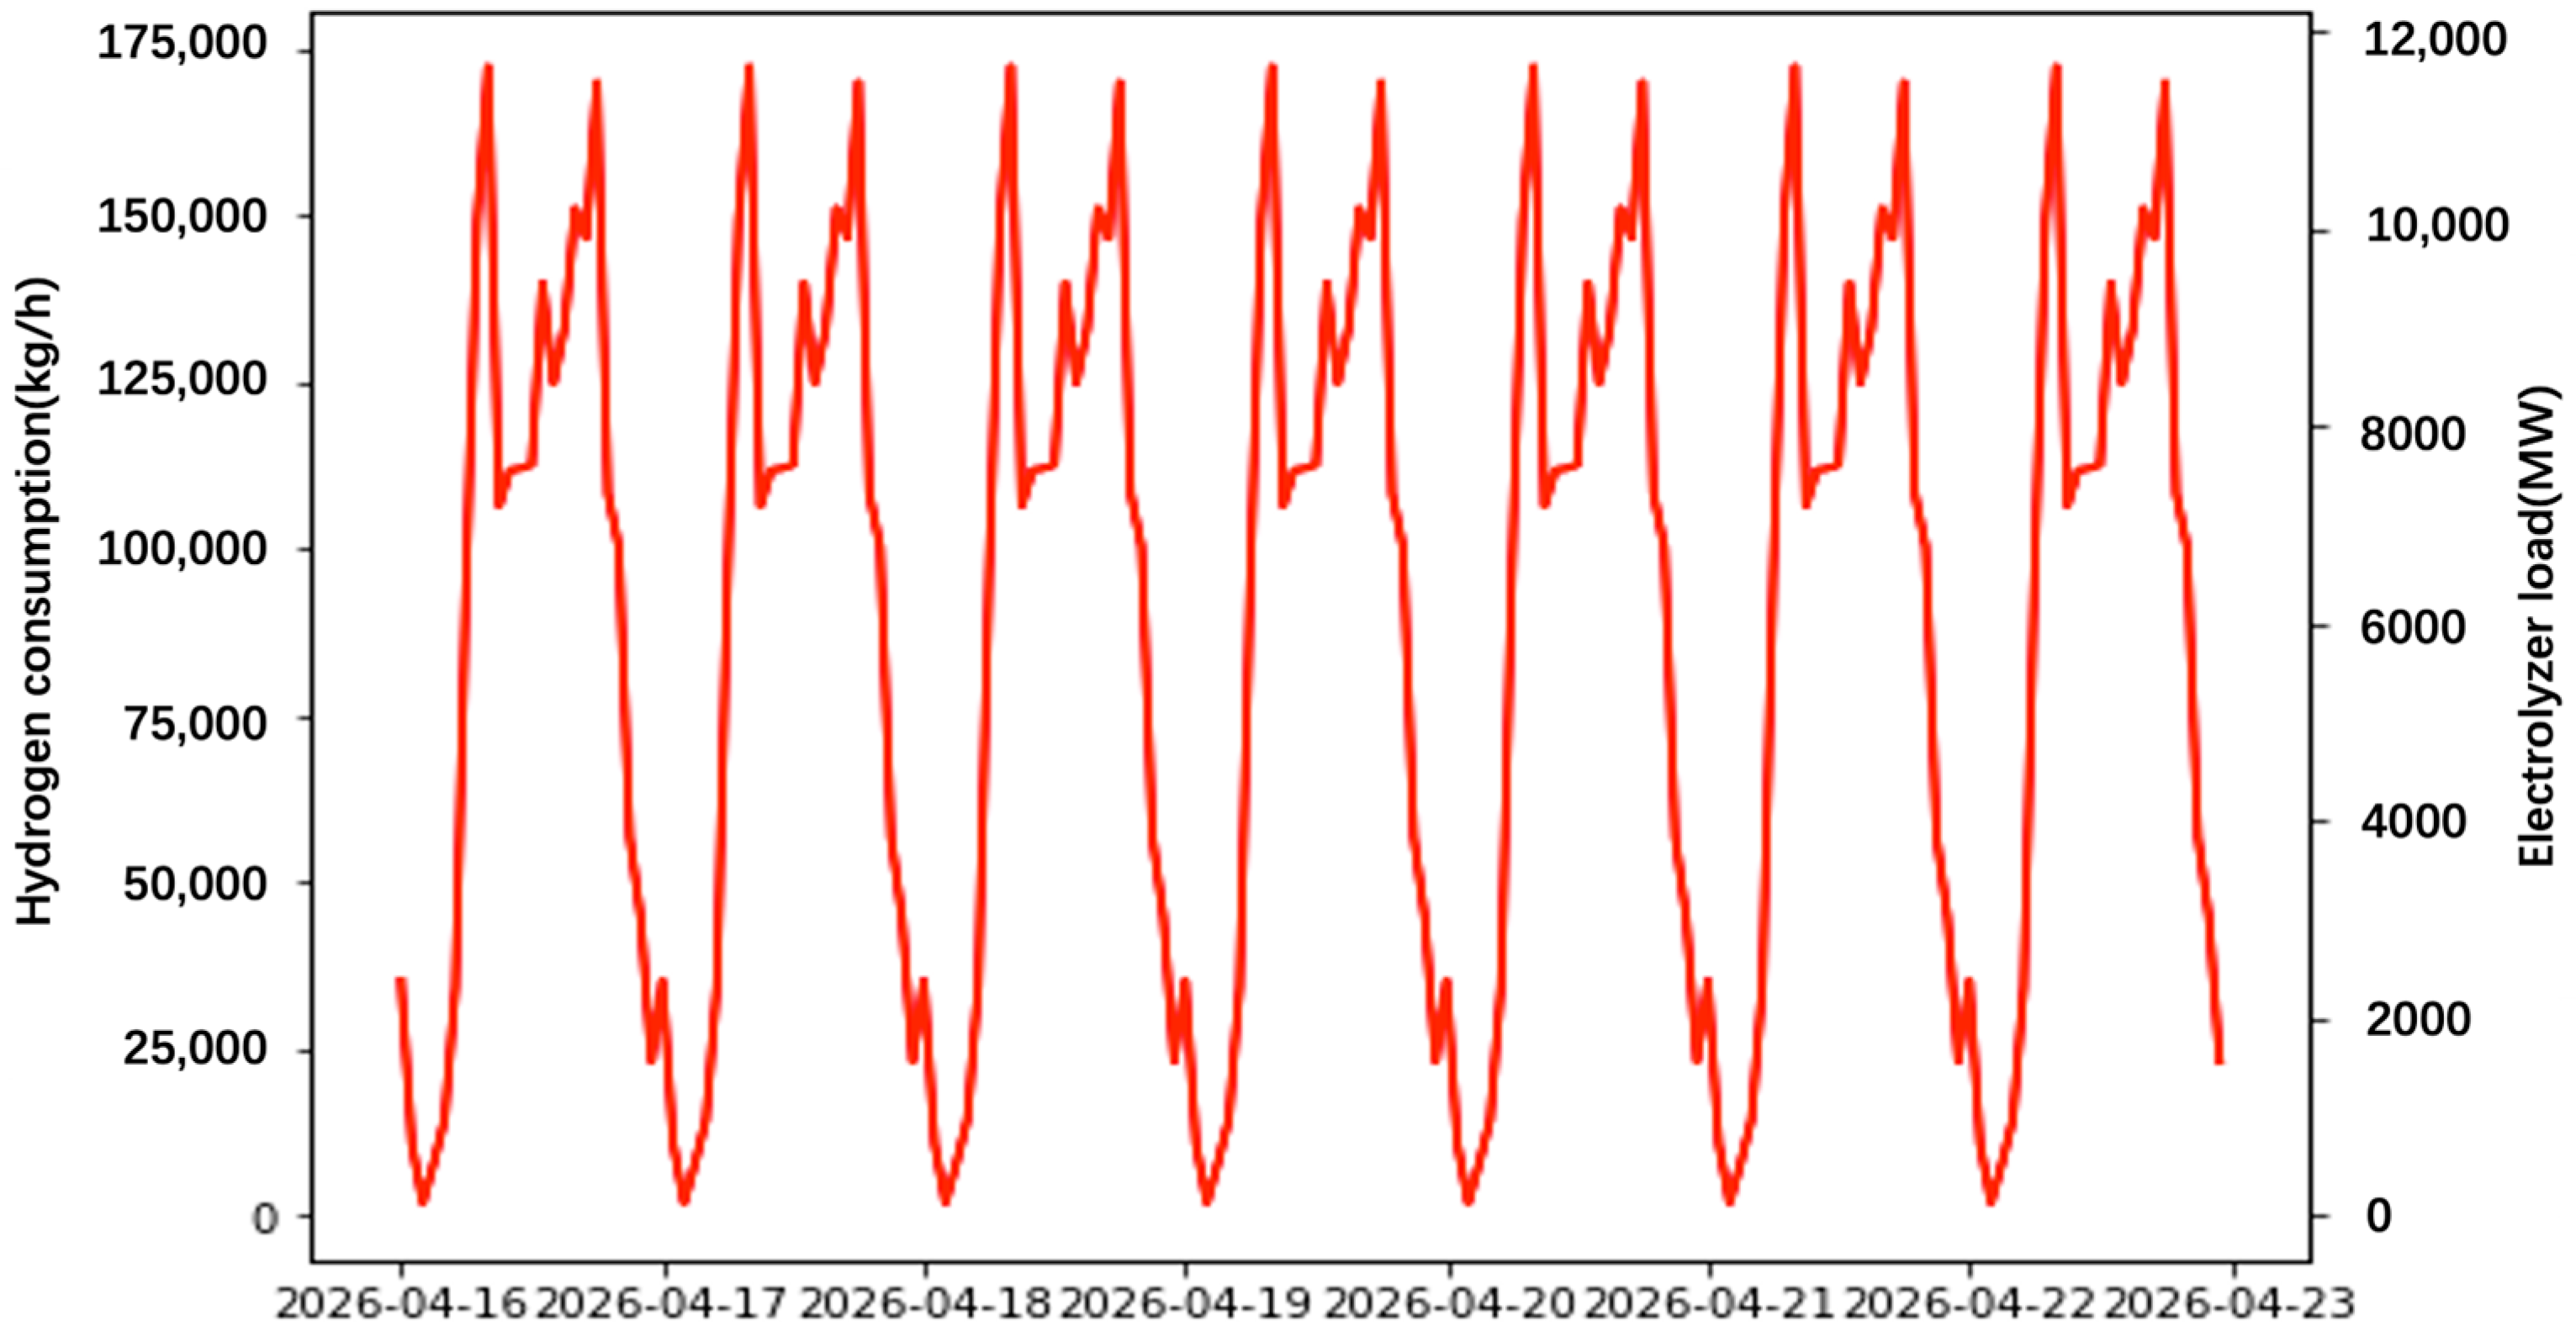
The Scenario Evaluation and Regionalization Analysis (SERA) model predicts the number of FCEVs on road and the number of hydrogen-refueling stations needed to support these vehicles. In this project, we only consider the western states in the WECC region. We calculate the hydrogen-refueling demand of the whole FCEVs in the region of California. The number of FCEVs in California is assumed to be 5 million [32]. This plot represents the calculated energy refueling rate of FCEVs. Using driving patterns derived from NHTS data and the energy consumption rate, we have converted this into the corresponding hydrogen refueling demand.
To reduce the amount of calculation, by scaling the number of vehicles, the hydrogen refueling demand is calculated as shown as follows:
represents the hydrogen-refueling demand for the predicted number of FCEVs. is the predicted number of FCEVs. is the base number of FCEVs. is the hydrogen-refueling demand for the base number of FCEVs. For the whole WECC, = 4,810,320 and = 5000. The hydrogen-refueling demand curve for the predicted FCEVs in 2026 () is shown in Figure 3. It is worth noting that the electricity load to generate the hydrogen demand can be flexible or inflexible depending on the design of the hydrogen production and refueling infrastructure.
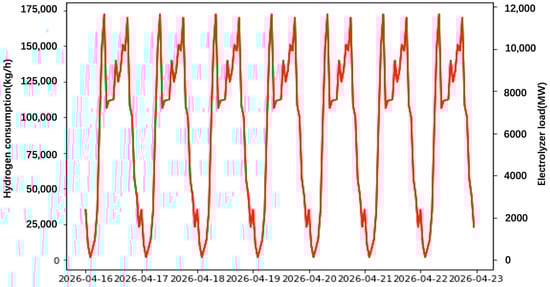
Figure 3.
Hydrogen-refueling demand curve for California in 2026.
In order to investigate the flexibility of the electricity load of FCEVs on the electricity grid operation, we consider three scenarios in this paper.
- (1)
- Business-as-usual (BAU). This is the reference scenario for the WECC electricity grid in 2024. In the BAU scenario, we assume no electricity loads to produce hydrogen for FCEVs.
- (2)
- Flex block scenario. This scenario, on top of the BAU scenario, considers the electricity load to meet the hydrogen needs for the predicted FCEV stock. In this scenario, the capacity of electrolyzers is set to meet the hourly average hydrogen demand for FCEV refueling. Thus, over the whole year, the electrolyzers, working at full utilization (a capacity factor of 100%), could produce just the amount of hydrogen needed for the predicted number of FCEVs. For simplicity, we assume there is enough hydrogen storage in the system. This scenario offers no flexibility in electrolyzer operation, and there is no extra electrolyzer capacity to generate more hydrogen even if the hydrogen demand increases.
- (3)
- Flexible scenarios. These scenarios also consider the electricity load to meet the hydrogen needs for the predicted FCEV stock on top of the BAU scenario. In the flexible scenarios, the capacity of electrolyzers is larger than those determined in the Flex block case. This is more realistic and potentially beneficial since electrolyzers now have extra capacity to generate hydrogen at times of lower electricity costs or to meet increases in future hydrogen demand. For these series of scenarios, we use capacity factors of electrolyzes in each scenario to characterize different flexible scenarios considered. Again, we assume there is enough hydrogen storage in the system.
For the 5 million FCEVs considered in this paper, their total annual hydrogen demand is 981 million kg. Using water electrolysis, a total of 53.3 TWh electricity is needed to generate hydrogen demand. Equally, the average capacity size of the electrolyzer is 6 GW.
Given the total demand for the hydrogen () and number of hours in a year (T), the average power of hydrogen production infrastructure (), which is also considered as the minimum size of electrolyzer (without flexibility), can be calculated with the following formula:
To refuel the 5 million FCEVs, the minimum size of electrolyzers () is 7812MW. Finally, capacity factor is defined as follows:
where represents the maximum hydrogen generation potential of the electrolyzers considered in each scenario. In the Flex_Block scenario, the capacity factor of electrolyzes is 100%. In the Flex_50% scenario, the capacity factor of electrolyzers is 50%, which means that is twice as large as .
Compared to the Flex_Block scenario, electrolyzers in the Flex_50% scenario offer more flexibility to generate hydrogen. For example, these electrolyzers can generate more hydrogen when the cost of marginal electricity production is low. For times when the cost of electricity generation is high, these electrolyzers can choose to generate less electricity. In principle, the larger the size of the electrolyzer, the more flexibility is offered by the hydrogen production process, and there are more opportunities to reduce the system cost. However, beyond a certain point, cost savings from eletrolyzer operation may not be large enough to justify the upfront cost for larger electrolyzers. Thus, there is an optimum point of flexibility that minimizes the total system cost.
2.4. Modeling Hydrogen Production and Storage in PLEXOS
We use PLEXOS to model the integrated systems of electricity grids and the hydrogen production and storage facilities. PLEXOS is a widely used Production Cost Model for simulating the operation of electricity grids and is able to investigate and optimize the impact of additional electronic vehicle loads on grid operation [33]. Also, it can investigate the effects of FCEVs on grid system, such as determining the size of required batteries and hydrogen storage [34].
Conceptually, a model of hydrogen production and storage facilities should be able to capture the following three key characteristics. First, it should be able to model the flexibility of hydrogen production. As long as refueling stations have enough hydrogen in storage to refuel FCEVs, the level of operation for the electrolyzers is flexible. Second, it should be able to model the limited capacity of the hydrogen storage. Third, it should be able to represent both hydrogen production and consumption (i.e., refueling) flows.
Empirically, we chose the pumped-storage hydroelectric (PSH) power station object that has been defined in PLEXOS to model hydrogen production and storage facilities. A PSH station has two operation modes: (1) a generation mode which allows water to flow from the head reservoir to the tail reservoir to storage electricity and (2) a pumping mode which consumes electricity to move water from the tail reservoir to the head reservoir.
Here, we describe how to model hydrogen production and storage facilities using the PSH object in PLEXOS. Figure 4 illustrates the working modes of the PSH station model in PLEXOS. is the electricity generating power by using the hydrogen; is the pump power, which represents the hydrogen production rate; is the maximum pumping power, which represents the maximum hydrogen production rate.
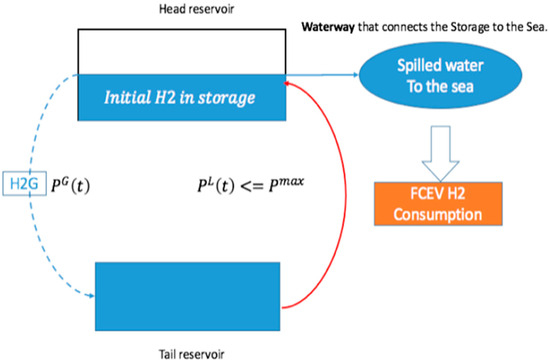
Figure 4.
Conceptual diagram to represent hydrogen production and storage facilities in PLEXOS based on PSH object.
In particular, we describe the comparison between PSH and our model of hydrogen production and storage as follows:
- (1)
- In the PSH, the head reservoir storages energy by keeping the water at a higher altitude. In our model, we use the head reservoir to represent the amount of hydrogen stored in hydrogen storage facilities.
- (2)
- Refueling FCEVs depletes the hydrogen storage facilities, which is analogous to water flows from the head reservoir to the open sea. This analogy enables our model to constrain the status of the head reservoir to guarantee there is always enough hydrogen to meet FCEVs’ refueling demand.
- (3)
- In PSH, water is pumped from the tail reservoir to the head reservoir (the red arrow line in Figure 4), which consumes electricity from the grids to store energy. In our model, this process simulates hydrogen production which also consumes electricity to store energy (as hydrogen).
- (4)
- In PSH, water flows from the head reservoir to the tail reservoir to generate (or discharge) electricity (dash blue arrow line in Figure 4). In our model, this would indicate electricity generation from hydrogen via either fuel cell or combustion at refueling stations. This would effectively make hydrogen refueling stations two-way channels to convert hydrogen and electricity (H2G).
It should be noted that, in this paper, we only simulate hydrogen production via water electrolysis (i.e., electricity to hydrogen), but not electricity production by hydrogen. As shown in Figure 4, this means that water cannot flow from head reservoir to the tail reservoir. However, the conceptual model can be used to simulate the H2G case in the future.
3. Results
3.1. Average Cost of Electricity
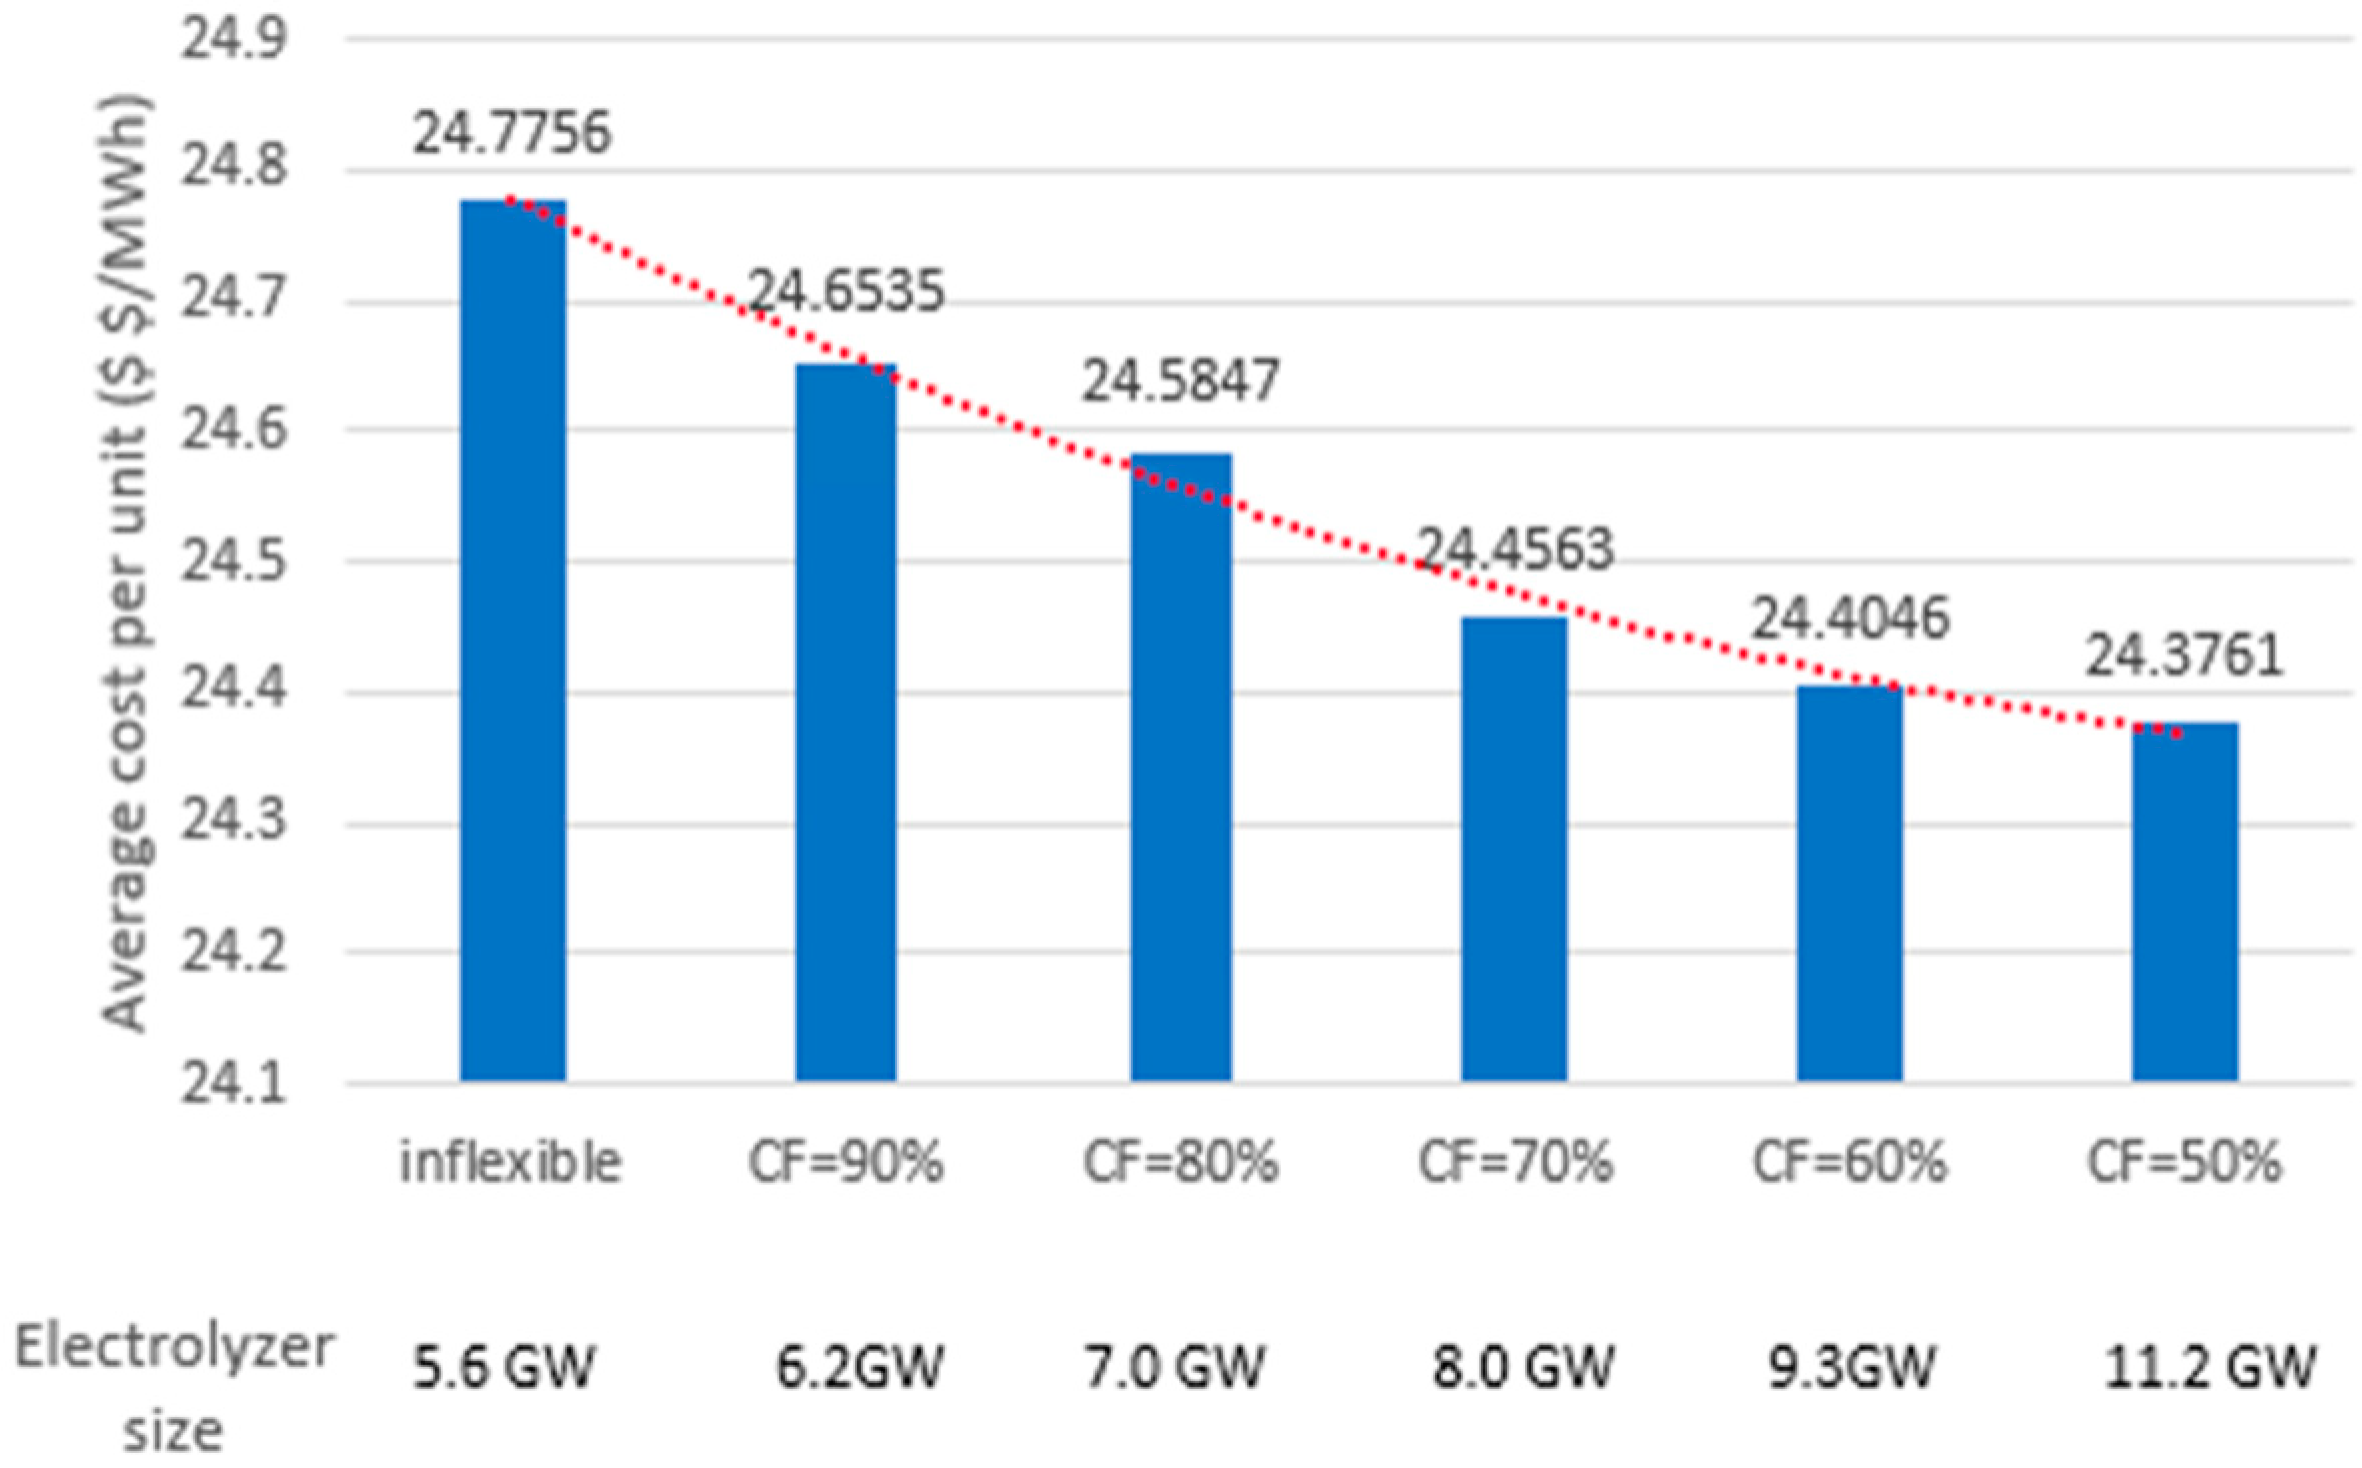
Figure 5 shows the average cost of electricity across different scenarios. The average is calculated by the total generation cost and the whole load. The total generation cost contains the generation cost, startup, and shutdown costs. The generation cost is related to fuel consumption cost and maintenance and operation cost. The startup and shutdown cost represent the expense once the operation status of generator plants changes. In terms of the startup and shutdown cost, it is preferable to avoid the frequent switching on and off for the generator plants. The total load contains the customer load request and the energy loss during delivery process.
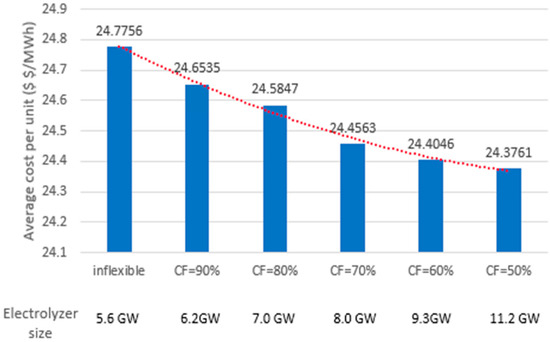
Figure 5.
The average cost of electricity in WECC area.
Note that the total generation cost does not include any electrolyzer costs, which were not straightforward to estimate because they involved several assumptions that were difficult to determine accurately (e.g., capital costs and maintenance costs). Figure 5 shows the result that the average electricity cost per unit decreases with the electrolyzer increasing. However, the decreasing rate is becoming smaller and smaller. It is unreasonable to pursue a super larger electrolyzer capacity.
3.2. Characteristics of Daily Electricity Load for Hydrogen Production
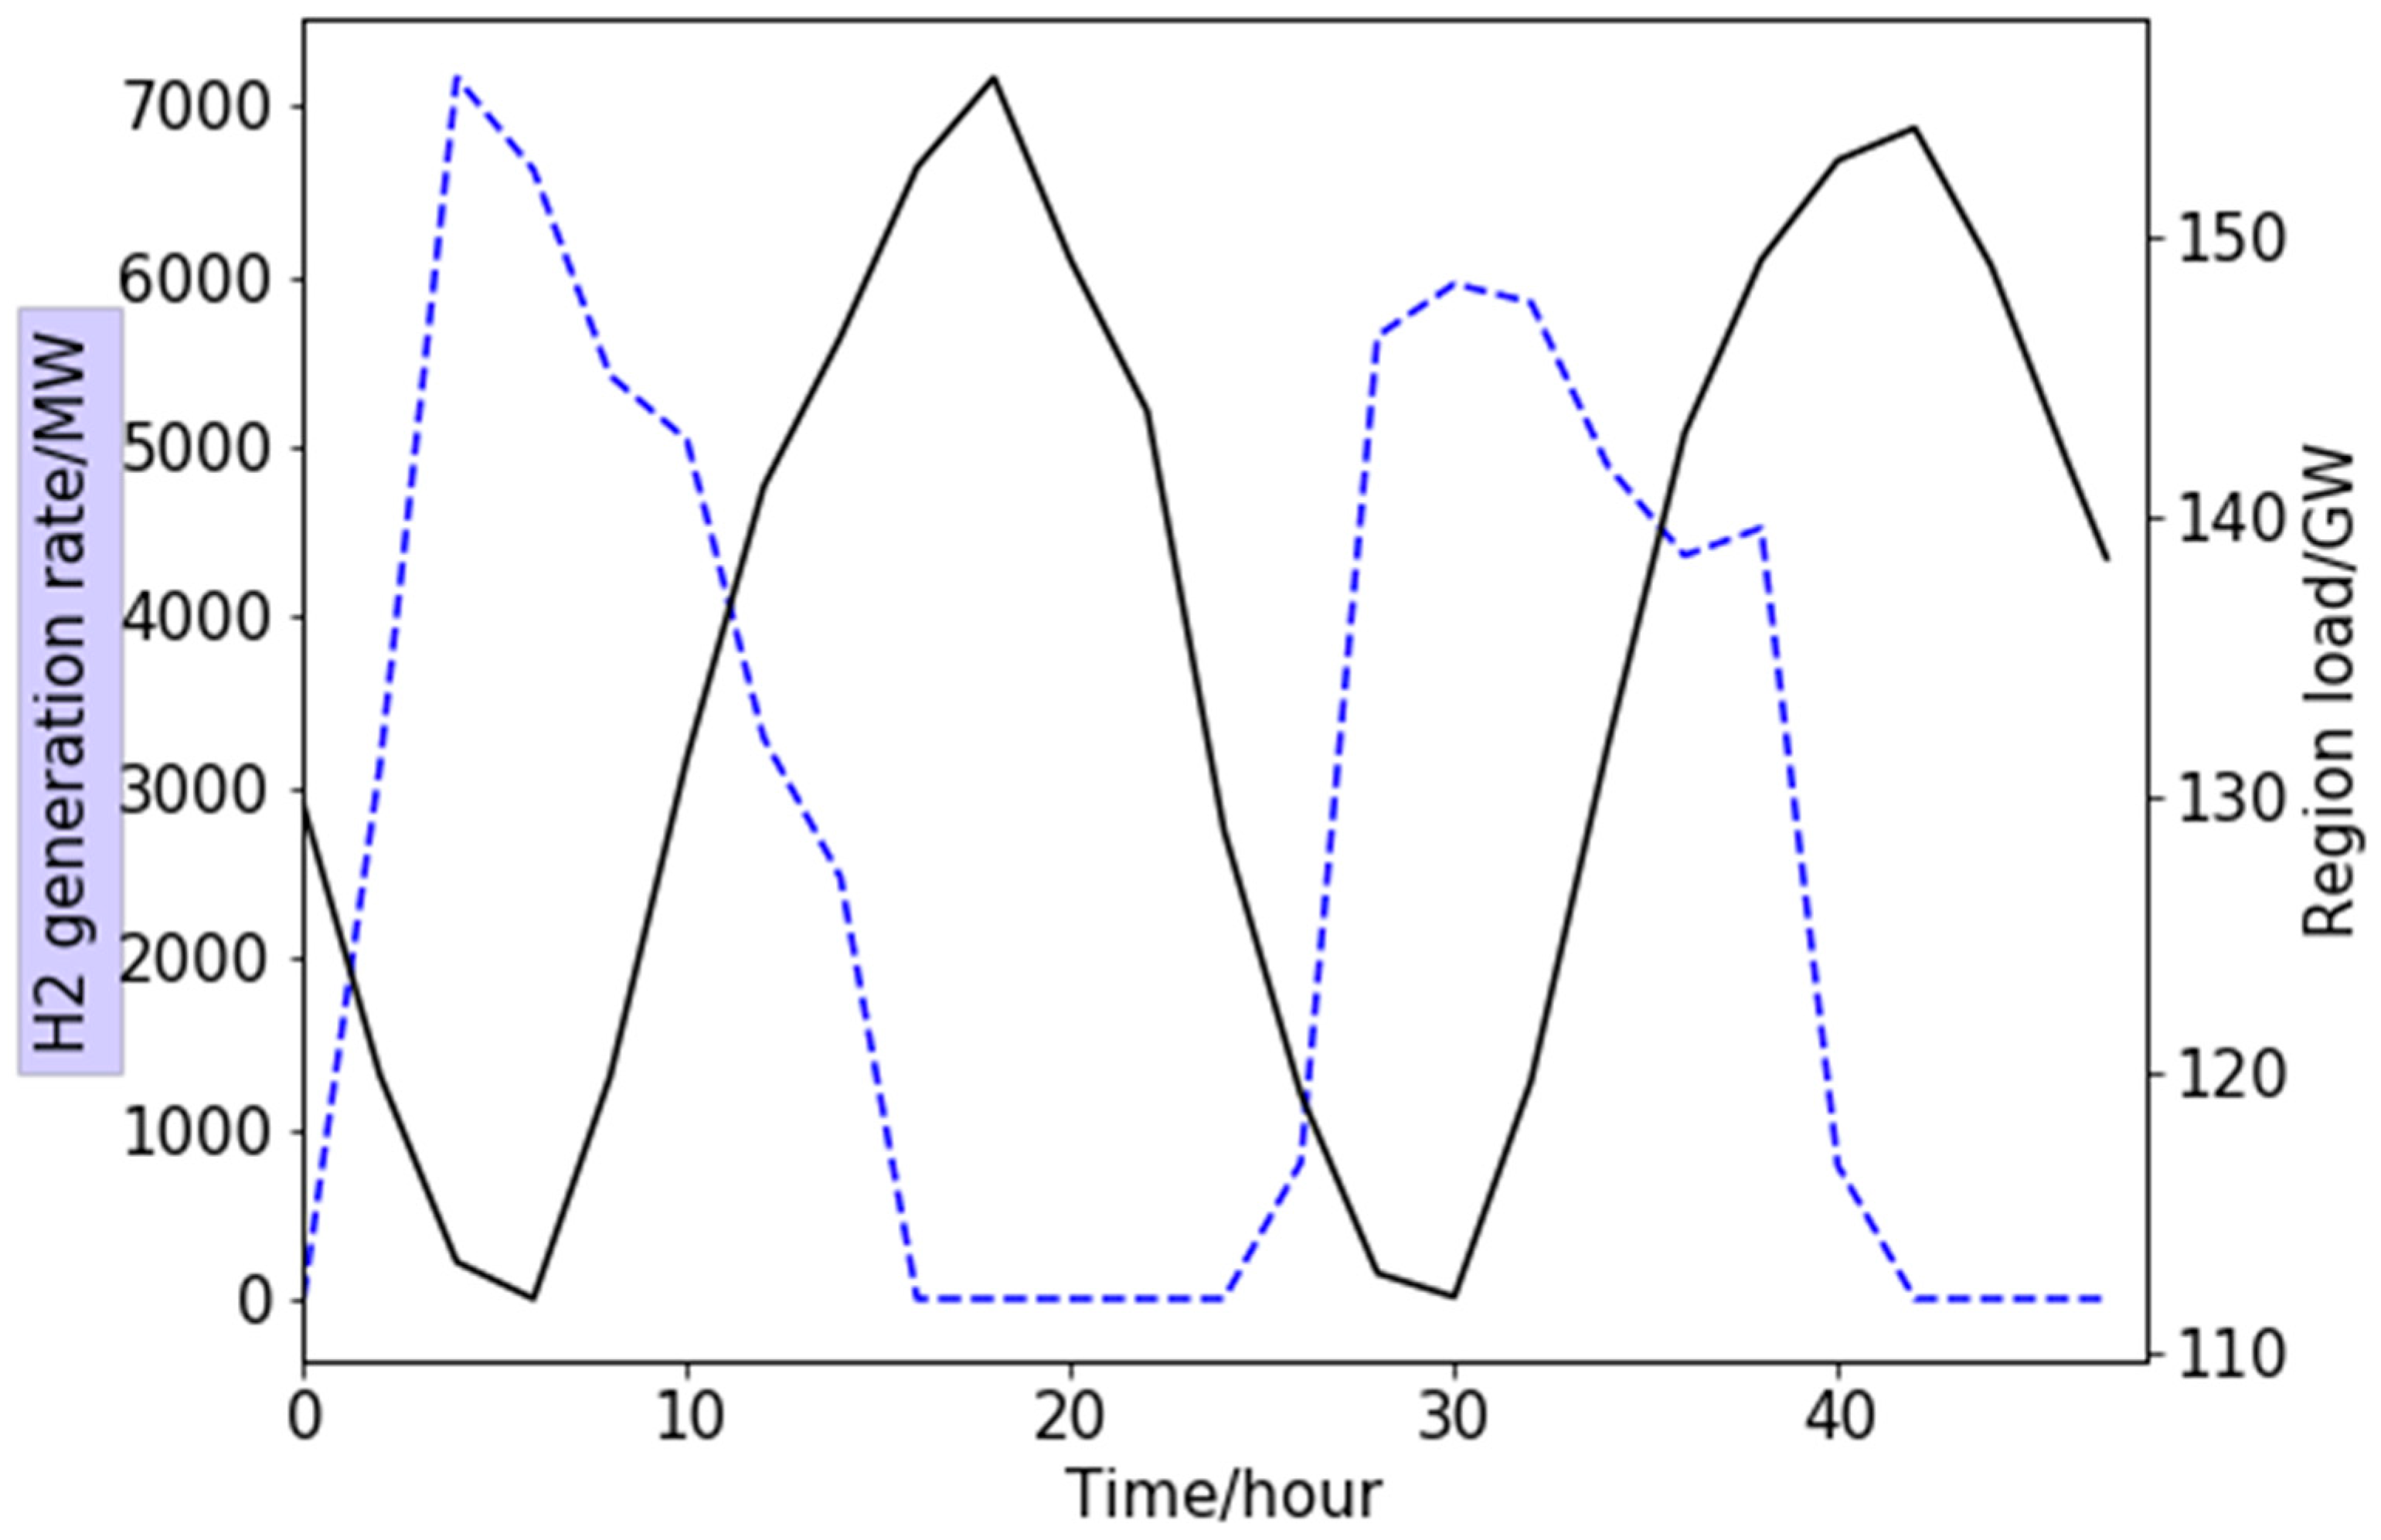
We show the daily electricity load for hydrogen production over a selection of two days in Figure 6. Here, we consider a Flex_50% scenario, where the capacity of electrolyzers is twice as large as the average hydrogen production capacity needed for meeting five million FCEVs in WECC. We limit the system to have the same hydrogen storage levels at the end of each day to eliminate the impact of seasonal variations.
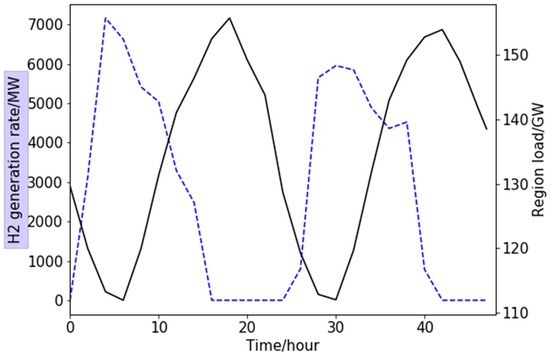
Figure 6.
Characteristics of hourly electricity load for hydrogen production (blue curve) and hourly electricity load for the BAU scenario (black curve) over a selected two-day period.
We find that the system-optimized operation of electrolyzers would help smooth out the daily variation in electricity loads. For instance, when the existing electricity load for the grid is at a relatively low level (0–11 and 24–35 h), electrolyzers operate at a high utilization rate. However, when the existing electricity load for the grid is at a relatively high level (12–24 and 36–47 h), electrolyzers operate at a lower utilization rate, producing much less hydrogen. Furthermore, these daily patterns persist for days in the same season.
3.3. Characteristics of Seasonal Electricity Load for Hydrogen Production
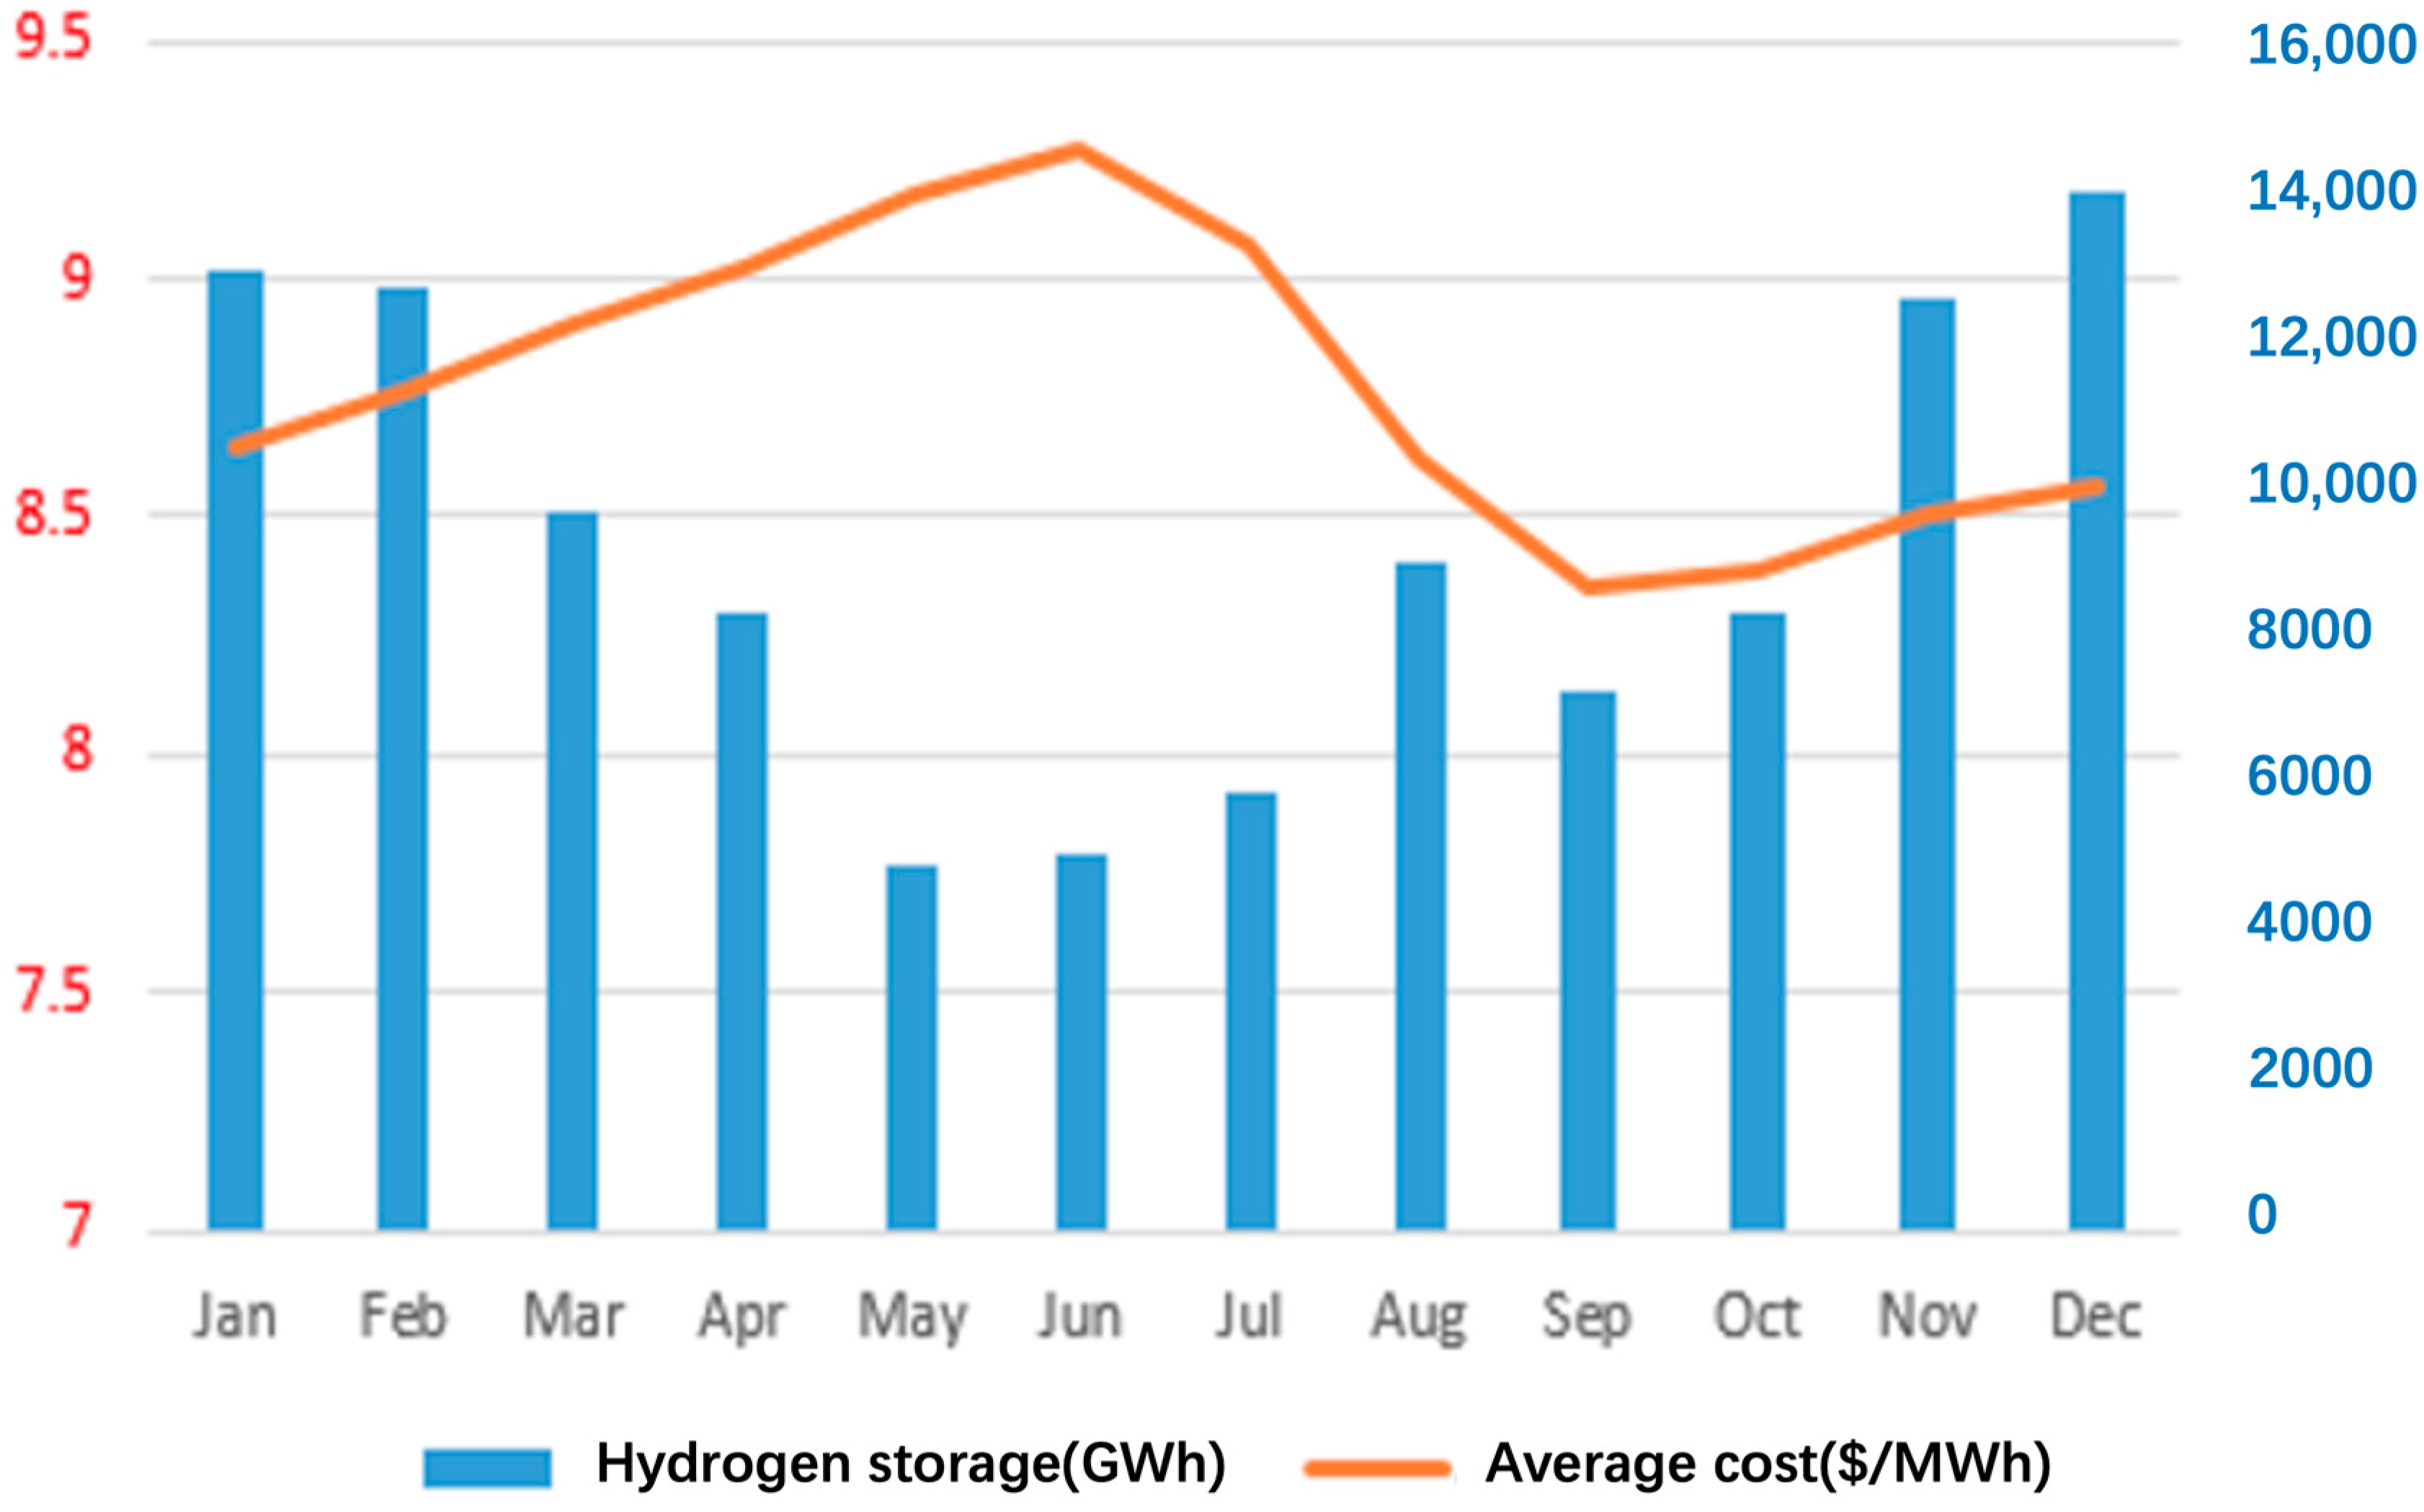
We show the monthly electricity load for hydrogen production over a full year (2025) in Figure 7. Contrary to the previous optimization where hydrogen storage is set to reach a given level at the end of each day, in this optimization, we allow infinite hydrogen storage so that hydrogen storage over long periods of time is technically available.

Figure 7.
Monthly hydrogen storage levels (blue bars) and monthly average cost of electricity generation (orange curve).
We find that there is a strong seasonal pattern of hydrogen storage across a year. Extra hydrogen is produced and stored in July, October, November, and December. On the other hand, less hydrogen is produced, so additional hydrogen has to be supplied by depleting hydrogen storage in March, May, and September. The changes in hydrogen storage levels reflect the cost of hydrogen production of which electricity cost is a primary factor [35]. Indeed, the level of hydrogen storage is inversely correlated with the average cost of electricity generation over the year (Figure 7). In particular, the hydrogen storage level is low when the average electricity cost is high (May to July). This result is also consistent with the other relevant studies [36,37]. It will help develop hydrogen production and storage strategies to optimize the economic operation of the electricity system [38].
3.4. Flexibility of Hydrogen Production Reduces Total System Costs of Electricity Generation
The results in the previous two sections indicate that the flexibility of hydrogen production may reduce total system costs for generating electricity. For a more detailed analysis, we compare the electricity costs across these scenarios, BAU, Flex_block, and Flex_50%. We find, to meet the hydrogen need for five million FCEVs, which leads to a 3% increase in electricity load for WECC, the average cost of electricity in Flex_block increases 1.55% compared to the BAU scenario. For meeting the need of the same FCEV fleet, the Flex_50% scenario only increases the average electricity cost by 0.91%. In other words, the flexibility of hydrogen production provided by oversized electrolyzers with twice as large offsets at 41.5% of the cost increases induced by additional electricity loads of meeting FCEVs. In short, oversizing hydrogen production infrastructure could help mitigate the economic impacts of powering FCEVs with the existing electricity grid.
4. Discussion
The findings from this study highlight the critical role of hydrogen production flexibility in mitigating the economic and operational challenges posed by the integration of fuel cell electric vehicles (FCEVs) into the electricity grid. First, our results demonstrate that the average electricity cost decreases with increasing electrolyzer capacity, although this reduction diminishes at higher capacities. This indicates that while oversized electrolyzers can provide economic benefits, their scalability must be carefully balanced to avoid diminishing returns.
Daily and seasonal electricity load patterns for hydrogen production further reveal that the system-optimized operation of electrolyzers can significantly smoothen electricity demand fluctuations. By operating at high utilization rates during off-peak electricity demand and low utilization rates during peak demand, electrolyzers can act as a flexible load, reducing the strain on the electricity grid. Seasonal hydrogen storage further complements this flexibility, allowing hydrogen production to align with lower electricity generation costs.
Additionally, our analysis shows that doubling electrolyzer capacity reduces the cost impact of additional FCEV-related electricity loads by 41.5%, compared to a scenario with inflexible hydrogen production. This underscores the importance of infrastructure planning for oversized hydrogen production systems to accommodate the expected rise in FCEV adoption. Such measures not only reduce electricity costs but also enhance grid resilience and sustainability by optimizing hydrogen production profiles to smooth temporal variations in electricity demand.
5. Conclusions
This study provides valuable insights into the interplay between FCEV adoption, hydrogen production, and electricity grid operations. The major findings are summarized as follows:
- Hydrogen production via water electrolysis can serve as a flexible load, helping to smooth load curves and reduce total system costs for the electricity grid.
- The additional electricity load to meet the needs of five million FCEVs in the western United States accounts for approximately 3% of the existing electricity load. In a scenario without flexibility (Flex_block), this load increases electricity costs by 1.55%. However, with flexible hydrogen production configurations (Flex_50%), the cost increase is reduced to only 0.91%, achieving a 42% reduction in cost impact.
- Oversizing electrolyzer capacity and optimizing hydrogen production profiles significantly mitigate the economic impacts of integrating FCEVs into the electricity grid, demonstrating the importance of flexible hydrogen production processes.
- Seasonal hydrogen storage helps align hydrogen production with periods of lower electricity generation costs, further optimizing the economic operation of the energy system.
- These findings emphasize the potential of flexible hydrogen production in achieving sustainable transportation and energy systems. By addressing the challenges of FCEV integration, this study contributes to the understanding of sustainable solutions for a low-carbon energy future.
Future research should focus on multi-time-scale optimization to capture the full extent of flexibility benefits for power systems. Further exploration of the integration of hydrogen production with renewable energy, energy storage, and demand response is necessary to develop a more efficient and resilient energy system. These efforts will be critical in ensuring the successful large-scale deployment of FCEVs and advancing the transition to a low-carbon economy.
Author Contributions
Writing, Methodology, C.Z. (Cong Zhang); Investigation, Y.S. and C.Z. (Chuanfang Zhang); Resources, M.L.; Writing—review & editing, C.Z. (Cong Zhang); Supervision, C.Z. (Cong Zhang); Formal analysis, J.L. All authors have read and agreed to the published version of the manuscript.
Funding
This research was funded by Shandong Provincial Natural Science Foundation Project, grant number ZR2023QE192 and 2027HWYQ-071.
Institutional Review Board Statement
Not applicable.
Informed Consent Statement
Not applicable.
Data Availability Statement
The raw data supporting the conclusions of this article will be made available by the authors on request.
Acknowledgments
We would like to extend our sincere gratitude to the sponsoring organizations for their financial support, which has been instrumental in the successful completion of this project.
Conflicts of Interest
Author Ming Li was employed by the company Shandong Inspur Database Technology Co., Ltd. The remaining authors declare that the research was conducted in the absence of any commercial or financial relationships that could be construed as a potential conflict of interest.
Appendix A
Table A1.
Information on some FCEVs.
Table A1.
Information on some FCEVs.
| FCEV Brand | Country | Time to Market | Price (Dollars) |
|---|---|---|---|
| Toyota Mirai | Japan | 2020 | 50,495 |
| Hyundai Tucson Fuel Cell | Korea | 2013 | Mainly available on lease |
| Honda Clarity | Japan | 2016 | 60,000 |
| Hyundai Nexo | Korea | 2018 | 58,935 |
Table A2.
Detailed characteristics of Toyota Mirai.
Table A2.
Detailed characteristics of Toyota Mirai.
| Item | Characteristics |
|---|---|
| Type of drive | Electric hybrid drive |
| Dynamical system | Hydrogen fuel cell stacks and electric motors |
| Fuel cell stack | Proton exchange membrane fuel Cell (PEMFC): The mass power density is 4.0 kW/kg. (Developed by Toyota Motor Company) |
| Electromotor | The maximum power output is 134 kW (about 182 HP) and the maximum torque is 300 Nm. (Developed by Toyota Motor Company) |
| Hydrogen storage system | Three 70 MPa high pressure hydrogen storage tanks (total 5 kg). (Developed by Toyota and Toray) |
| hydrogen engine | Hydrogen consumption rate is about 1.0 kg/100 km. (Developed by Toyota Motor Company) |
| sales volume | Cumulative sales worldwide are approximately 22,000. |
References
- U.S. Environmental Protection Agency , Transportation Sector Emissions. 2025. Available online: https://www.epa.gov/ghgemissions/transportation-sector-emissions (accessed on 21 January 2025).
- Oad, A.; Ahmad, H.G.; Talpur, M.S.H.; Zhao, C.; Pervez, A. Green smart grid predictive analysis to integrate sustainable energy of emerging V2G in smart city technologies. Optik 2023, 272, 170146. [Google Scholar] [CrossRef]
- Staffell, I.; Scamman, D.; Abad, A.V.; Balcombe, P.; Dodds, P.E.; Ekins, P.; Shah, N.; Ward, K.R. The role of hydrogen and fuel cells in the global energy system. Energy Environ. Sci. 2019, 12, 463–491. [Google Scholar] [CrossRef]
- Zhang, W.; Fang, X.; Sun, C. The alternative path for fossil oil: Electric vehicles or hydrogen fuel cell vehicles. J. Environ. Manag. 2023, 341, 118019. [Google Scholar] [CrossRef]
- Kumar, P.; Singh, O. Fuel Cell and Hydrogen-Based Hybrid Energy Conversion Technologies. In Prospects of Hydrogen Fueled Power Generation; River Publishers: Copenhagen, Denmark, 2024; pp. 207–221. [Google Scholar] [CrossRef]
- Williams, M.C.; Strakey, J.P.; Surdoval, W.A. The U.S. Department of Energy, Office of Fossil Energy Stationary Fuel Cell Program. J. Power Sources 2005, 143, 191–196. [Google Scholar] [CrossRef]
- China’s Hydrogen Economy Is Coming. 2019. Available online: https://www.bloomberg.com/opinion/articles/2019-03-23/now-china-wants-to-lead-the-world-in-hydrogen-fuel-cells (accessed on 29 March 2019).
- Bampaou, M.; Panopoulos, K.D. An overview of hydrogen valleys: Current status, challenges and their role in increased renewable energy penetration. Renew. Sustain. Energy Rev. 2025, 207, 114923. [Google Scholar] [CrossRef]
- Jayachandran, M.; Gatla, R.K.; Flah, A.; Milyani, A.H.; Milyani, H.M.; Blazek, V.; Prokop, L.; Kraiem, H. Challenges and Opportunities in Green Hydrogen Adoption for Decarbonizing Hard-to-Abate Industries: A Comprehensive Review. IEEE Access 2024, 12, 23363–23388. [Google Scholar] [CrossRef]
- Das, H.S.; Rahman, M.M.; Li, S.; Tan, C.W. Electric vehicles standards, charging infrastructure, and impact on grid integration: A technological review. Renew. Sustain. Energy Rev. 2020, 120, 109618. [Google Scholar] [CrossRef]
- Hartvigsson, E.; Taljegard, M.; Odenberger, M.; Chen, P. A Large-Scale High Resolution Geographic Analysis of Impacts from Electric Vehicle Charging on Low-Voltage Grids. Energy 2021, 261, 125180. [Google Scholar] [CrossRef]
- Aldhanhani, T.; Abraham, A.; Hamidouche, W.; Shaaban, M. Future Trends in Smart Green IoV: Vehicle-to-Everything in the Era of Electric Vehicles. IEEE Open J. Veh. Technol. 2024, 5, 278–297. [Google Scholar] [CrossRef]
- Saba, S.M.; Müller, M.; Robinius, M.; Stolten, D. The investment costs of electrolysis—A comparison of cost studies from the past 30 years. Int. J. Hydrogen Energy 2018, 43, 1209–1223. [Google Scholar] [CrossRef]
- Lee, B.; Chae, H.; Choi, N.H.; Moon, C.; Moon, S.; Lim, H. Economic evaluation with sensitivity and profitability analysis for hydrogen production from water electrolysis in Korea. Int. J. Hydrogen Energy 2017, 42, 6462–6471. [Google Scholar] [CrossRef]
- Kopacak, N.; Guldorum, H.C.; Erdinc, O. Development of a Cost Minimization Oriented Optimization Algorithm for Green Hydrogen Production in a Multi-Energy System Considering EVs and FCEVs Availability. IEEE Access 2024, 12, 114705–114721. [Google Scholar] [CrossRef]
- Hai, T.; Aksoy, M.; Faraji, H. Techno-economic investigation of grid integrated renewable energy resources with hydrogen storage systems. J. Energy Storage 2024, 86, 111248. [Google Scholar] [CrossRef]
- Sorrenti, I.; Zheng, Y.; Singlitico, A.; You, S. Low-carbon and cost-efficient hydrogen optimisation through a grid-connected electrolyser: The case of GreenLab skive. Renew. Sustain. Energy Rev. 2023, 171, 113033. [Google Scholar] [CrossRef]
- Peng, L.; Guo, Y.; Liu, S.; He, G.; Mauzerall, D.L. Subsidizing Grid-Based Electrolytic Hydrogen Will Increase Greenhouse Gas Emissions in Coal Dominated Power Systems. Environ. Sci. Technol. 2024, 58, 5187–5195. [Google Scholar] [CrossRef] [PubMed]
- Morales-España, G.; Hernández-Serna, R.; Tejada-Arango, D.A.; Weeda, M. Impact of large-scale hydrogen electrification and retrofitting of natural gas infrastructure on the European power system. Int. J. Electr. Power Energy Syst. 2023, 155, 109686. [Google Scholar] [CrossRef]
- Skrúcaný, T.; Milojević, S.; Semanová, Š.; Čechovič, T.; Figlus, T.; Synák, F. The Energy Efficiency of Electric Energy as a Traction Used in Transport. Transp. Tech. Technol. 2019, 14, 9–14. [Google Scholar] [CrossRef]
- How Much Electricity Does an American Home Use?—FAQ—U.S. Energy Information Administration (EIA), (n.d.). Available online: https://www.eia.gov/tools/faqs/faq.php?id=97&t=3 (accessed on 1 April 2019).
- Energy Rankings: Which States Use the Most Electricity per Household? | Choose Energy®, (n.d.). Available online: https://www.chooseenergy.com/news/article/the-states-that-use-the-most-and-least-amount-of-energy-per-household/ (accessed on 14 May 2019).
- There Are 6,500 Hydrogen Fuel Cell Cars Worldwide (Half In California), Evs. 2018. Available online: https://insideevs.com/there-is-only-6500-hydrogen-fuel-cell-cars-in-the-world-half-in-california-report/ (accessed on 2 April 2019).
- Toyota Mirai, Wikipedia. 2019. Available online: https://en.wikipedia.org/w/index.php?title=Toyota_Mirai&oldid=889020411 (accessed on 2 April 2019).
- Zhang, C.; Min, H.; Yu, Y.; Wang, D.; Luke, J.; Opila, D.; Saxena, S. Using CPE Function to Size Capacitor Storage for Electric Vehicles and Quantifying Battery Degradation during Different Driving Cycles. Energies 2016, 9, 903. [Google Scholar] [CrossRef]
- Hydrogen Production from Renewables—Renewable Energy Focus, (n.d.). Available online: http://www.renewableenergyfocus.com/view/3157/hydrogen-production-from-renewables/ (accessed on 2 April 2019).
- National Household Travel Survey, (n.d.). Available online: https://nhts.ornl.gov/ (accessed on 2 April 2019).
- Samveg, Contribute to Samveg/V2G-Sim-Beta Development by Creating an Account on GitHub. 2019. Available online: https://github.com/Samveg/V2G-Sim-beta (accessed on 2 April 2019).
- Wang, D.; Coignard, J.; Zeng, T.; Zhang, C.; Saxena, S. Quantifying electric vehicle battery degradation from driving vs. vehicle-to-grid services. J. Power Sources 2016, 332, 193–203. [Google Scholar] [CrossRef]
- Wang, D.; Muratori, M.; Eichman, J.; Wei, M.; Saxena, S.; Zhang, C. Quantifying the flexibility of hydrogen production systems to support large-scale renewable energy integration. J. Power Sources 2018, 399, 383–391. [Google Scholar] [CrossRef]
- PLEXOS® Simulation Software, Energy Ex (n.d.). Available online: https://www.energyexemplar.com/plexos (accessed on 2 April 2019).
- California to Have 5 Million Zero-Emission Vehicles on Its Roads by 2030—Climate Action, (n.d.). Available online: http://www.climateaction.org/news/california-to-have-5-million-zero-emission-vehicles-on-its-roads-by-2030 (accessed on 17 July 2019).
- Sun, Z.; Zhao, C.; Yan, Z. An Optimizing Power System Dispatch with An Extra EV Load Using PLEXOS Appoach. In Proceedings of the 2018 China International Conference on Electricity Distribution (CICED), Tianjin, China, 17–19 September 2018; pp. 162–167. [Google Scholar] [CrossRef]
- Varhegyi, G.; Nour, M. Design and Analysis of an Off-Grid Green Hydrogen Refueling Station for Edinburgh’s Public Transport Using PLEXOS. Res. Sq. 2024, preprint. [Google Scholar] [CrossRef]
- Zhang, K.; Ding, L.; Chen, J.; Hou, C.; Lv, H. The comprehensive analysis of hydrogen energy storage technology in the new power system. In Proceedings of the 2024 6th International Conference on Energy Systems and Electrical Power (ICESEP), Wuhan, China, 21–23 June 2024; pp. 218–221. [Google Scholar] [CrossRef]
- Blacharski, T.; Kogut, K.; Szurlej, A. The perspectives for the use of hydrogen for electricity storage considering the foreign experience. In Proceedings of the E3S Web of Conferences, Energy and Fuels 2016, Krakow, Poland, 21–23 September 2016; Suwała, W., Dudek, M., Leszczyński, J., Łopata, S., Eds.; p. 01045. [Google Scholar] [CrossRef]
- Chen, M.; Chen, S.; Wei, Z.; Sun, G.; Zhou, Y. Optimal Dispatch of Electricity-gas-hydrogen Hybrid Integrated Energy System Considering Seasonal Hydrogen Storage. Power Syst. Technol. 2024, 49, 32–40. [Google Scholar] [CrossRef]
- Lu, M.; Li, X.; Li, F.; Xiong, W.; Li, X. Two-stage Stochastic Programming of Seasonal Hydrogen Energy Storage and Mixed Hydrogen-fueled Gas Turbine System. Proc. CSEE 2022, 43, 6978–6991. [Google Scholar] [CrossRef]


Disclaimer/Publisher’s Note: The statements, opinions and data contained in all publications are solely those of the individual author(s) and contributor(s) and not of MDPI and/or the editor(s). MDPI and/or the editor(s) disclaim responsibility for any injury to people or property resulting from any ideas, methods, instructions or products referred to in the content. |
© 2025 by the authors. Licensee MDPI, Basel, Switzerland. This article is an open access article distributed under the terms and conditions of the Creative Commons Attribution (CC BY) license (https://creativecommons.org/licenses/by/4.0/).