Abstract
Controlling vehicle speed is crucial for reducing exhaust emissions and ensuring the sustainable development of road transportation. Currently, speed limits on expressways are primarily set from a safety perspective, with limited research addressing speed limits from an environmental protection standpoint. In this study, based on real-world vehicle experiments and a vehicle flow exhaust emission model, we investigated the exhaust emission characteristics of light passenger vehicles (categorized as M1) and freight vehicles (categorized as N, including N1-minivans, N2-light heavy-duty vehicles, N3-medium heavy-duty vehicles, and N4-large heavy-duty vehicles) both individually and in traffic flows at varying speeds. We take carbon monoxide (CO), nitrogen oxides (NOx), particular matter (PM), and hydrocarbons (HCs) as representative emission components. The emission rate ranking of typical exhaust factors differs between M1-light passenger vehicles and N-freight vehicles. For M1-light passenger vehicles, the order is CO > HC > NOx > PM2.5, while for N-freight vehicles, it is NOx > CO > PM2.5 > HC. Conversely, for freight vehicles, higher speeds correlate with increased exhaust emissions in general, although carbon emissions specifically decrease as the speed increases. The results indicate the following speed limits conducive to sustainable road transportation development and low exhaust and carbon emissions: 90–110 km/h for light passenger vehicles and 80–100 km/h for freight vehicles.
1. Introduction
The global challenge of mitigating vehicular exhaust emissions has become increasingly urgent in recent years, driven by growing concerns over environmental degradation and public health impacts [1,2,3]. Despite significant advancements in automotive technology and the gradual shift toward cleaner energy sources [4,5], fossil fuel–powered vehicles continue to dominate in global transportation networks, particularly in highway settings. This persistent reliance on conventional vehicles underscores the critical need for innovative strategies to minimize their environmental footprint while maintaining operational efficiency.
Different countries have established vehicle emission standards tailored to their specific national conditions. The EU’s Euro standards progressively impose stricter limits on CO, NOx, and PM emissions, with a particular focus on Real Driving Emissions (RDE) [6]. The United States enforces Environmental Protection Agency (EPA) federal standards alongside California’s LEV regulations, which prioritize stringent controls on Non-methane organic gases (NMOG) and PM [7]. China’s National standards [8] align closely with EU regulations, advancing systematically from China I to VI. Australia has adopted Australian Design Rules (ADR) standards [9], equivalent to Euro 5.
To reduce vehicle exhaust emissions, technologies such as TWC (Three-Way Catalytic Converter), GPF (Gasoline Particulate Trap), DOC (Diesel Oxidation Catalytic Converter), SCR (Selective Catalytic Oxidizer), DPF (Diesel Particulate Trap), and ASC (Ammonia Leakage Catalytic Converter) were used to treat the exhaust [10,11,12,13]. Recent innovations in engine technologies, such as the use of extreme Miller cycle strategies in heavy-duty diesel engines, have demonstrated the potential to improve efficiency and reduce emissions at high speeds [14]. Recent research on automotive emission control has primarily focused on technological solutions such as advanced catalytic converters and exhaust treatment systems [15,16,17]. These innovations have undoubtedly contributed to substantial reductions in pollutant levels. Collectively, these standards and technologies aim to reduce vehicle emissions and promote environmental protection through technically feasible measures. However, it remains to be explored whether detailed management approaches under existing emission standards could further enhance the green and sustainable development of expressways.
The relationship between vehicle speed and exhaust emissions is complex and multifaceted [18], varying significantly across different vehicle models, engine types, and driving conditions. While it is generally understood that extreme speeds—both high and low—can lead to increased emissions [19,20], the specific thresholds at which different vehicle types optimize their emission output remain largely undefined, especially in the context of highway travel. Studies have shown that at extremely high speeds, both fuel consumption and the emission of pollutants [21], such as CO2, can increase sharply because of various factors, such as increased aerodynamic drag and engine inefficiency [22]. Similarly, driving at very low speeds can result in suboptimal engine performance and elevated emissions, as vehicles struggle to maintain momentum [23,24]. This U-shaped relationship between speed and emissions highlights the need for a more nuanced understanding of the speed ranges that minimize pollutant output for different vehicle categories. Furthermore, an in-depth analysis of vehicle-specific speed limits and their impact on overall emission performance is essential.
Concurrently, a body of literature focused on the impact of driving behavior on emissions [25,26,27] has emerged, with several studies highlighting the importance of maintaining stable speeds to minimize pollutant output [26,28,29]. However, these investigations often adopt a one-size-fits-all approach, failing to account for the diverse range of vehicle models that populate modern highways. Studies have shown that aggressive driving behaviors, such as rapid acceleration, sudden braking, and frequent stop-and-go driving in urban settings, can significantly increase the emissions of particulate matter, gaseous pollutants, and particle-bound polycyclic aromatic hydrocarbons (PAHs), especially for diesel vehicles [28]. Conversely, eco-driving techniques that encourage smooth, steady acceleration and deceleration have been found to reduce fuel consumption and emissions across a variety of vehicle types [30,31].
While these insights are valuable, most of the research has focused on urban [29,32] and suburban driving conditions [33,34], leaving a gap in our understanding of how driving behavior impacts emissions in the highway setting [35,36]. The complex interactions among vehicle type, speed, and driving pattern require further investigation to develop a more comprehensive emission control strategy for highway transportation.
Currently, with the advancement of new road management technologies [37,38], variable speed limit management has been applied in speed regulation [39,40]. However, most studies on speed limit values focus primarily on safety considerations [41,42], alongside traffic flow efficiency [43,44,45]. Few studies have combined the study of emissions with speed limits, exploring speed regulation from the perspective of vehicle emission performance. The current state of knowledge reveals a significant gap in our understanding of vehicle-specific speed limits for optimal emission control, particularly under highway conditions. While extensive research has been conducted on the effects of fuel type, fuel consumption [46,47,48,49], engine performance [50,51], and urban driving patterns [52,53,54,55] on emissions, few studies have aimed to establish specific speed ranges for different vehicle categories tailored to minimize exhaust emissions during highway travel. This knowledge gap hinders the development of more sophisticated and effective emission control strategies that can be implemented through smart traffic management systems or vehicle-specific speed recommendations. Addressing this research gap is crucial for several reasons. First, it can inform more nuanced and effective highway speed limit policies that balance emission reduction with traffic flow efficiency. Second, it can guide the development of intelligent vehicle systems that automatically adjust speed for optimal emission performance based on vehicle type and road conditions. Lastly, such research can provide valuable insights for vehicle manufacturers, enabling them to design future models with speed ranges optimized for emission control.
Given these considerations, the primary goal of this study is to determine optimal speed ranges for various vehicle models to minimize exhaust emissions on highways while ensuring efficient transportation. Based on controlled experiments and model analysis, we seek to move beyond general speed recommendations, providing tailored strategies that align with the distinct characteristics of different vehicle categories. These findings lay a foundation for more precise speed management policies, promoting sustainable transportation and innovations in vehicle design and traffic systems.
2. Method
2.1. Approach Overview
Vehicle exhaust comprises a complex mixture of pollutants, including solid suspended particles, carbon monoxide (CO), carbon dioxide (CO2), hydrocarbons (HCs), nitrogen oxides (NOx), and sulfur oxides (SOx), with emissions differing across vehicle types, among which M1-light passenger vehicles powered by gasoline and N- freight vehicles powered by diesel dominate expressway traffic. Thus, to determine optimal speed limits for eco-friendly driving in line with sustainable environmental goals, we need to identify key indicators that reflect the exhaust emission characteristics of different vehicles.
Considering the toxicity of emissions, public concern, and the comprehensiveness of the indicators, CO, NOx, particulate matter (PM2.5), and HCs were selected as representative emission components. By analyzing the variations in these indicators at different speeds, we can pinpoint the speed ranges that minimize exhaust emissions. This will provide valuable insights and recommendations for the operational management of expressways.
We first perform real-vehicle experiments to analyze the exhaust emission characteristics of M1-light passenger and N-freight vehicles traveling at different speeds. Given that the results of single-vehicle tests may be influenced by factors such as vehicle type, driving behavior, engine characteristics, vehicle age, and performance, resulting in some variability, further analysis is necessary on the exhaust characteristics of traffic flow based on single-vehicle analyses. We thus refine the macro-model of exhaust emissions with data from the single-vehicle experiments and validate these results with traffic flow data to allow for their generalization.
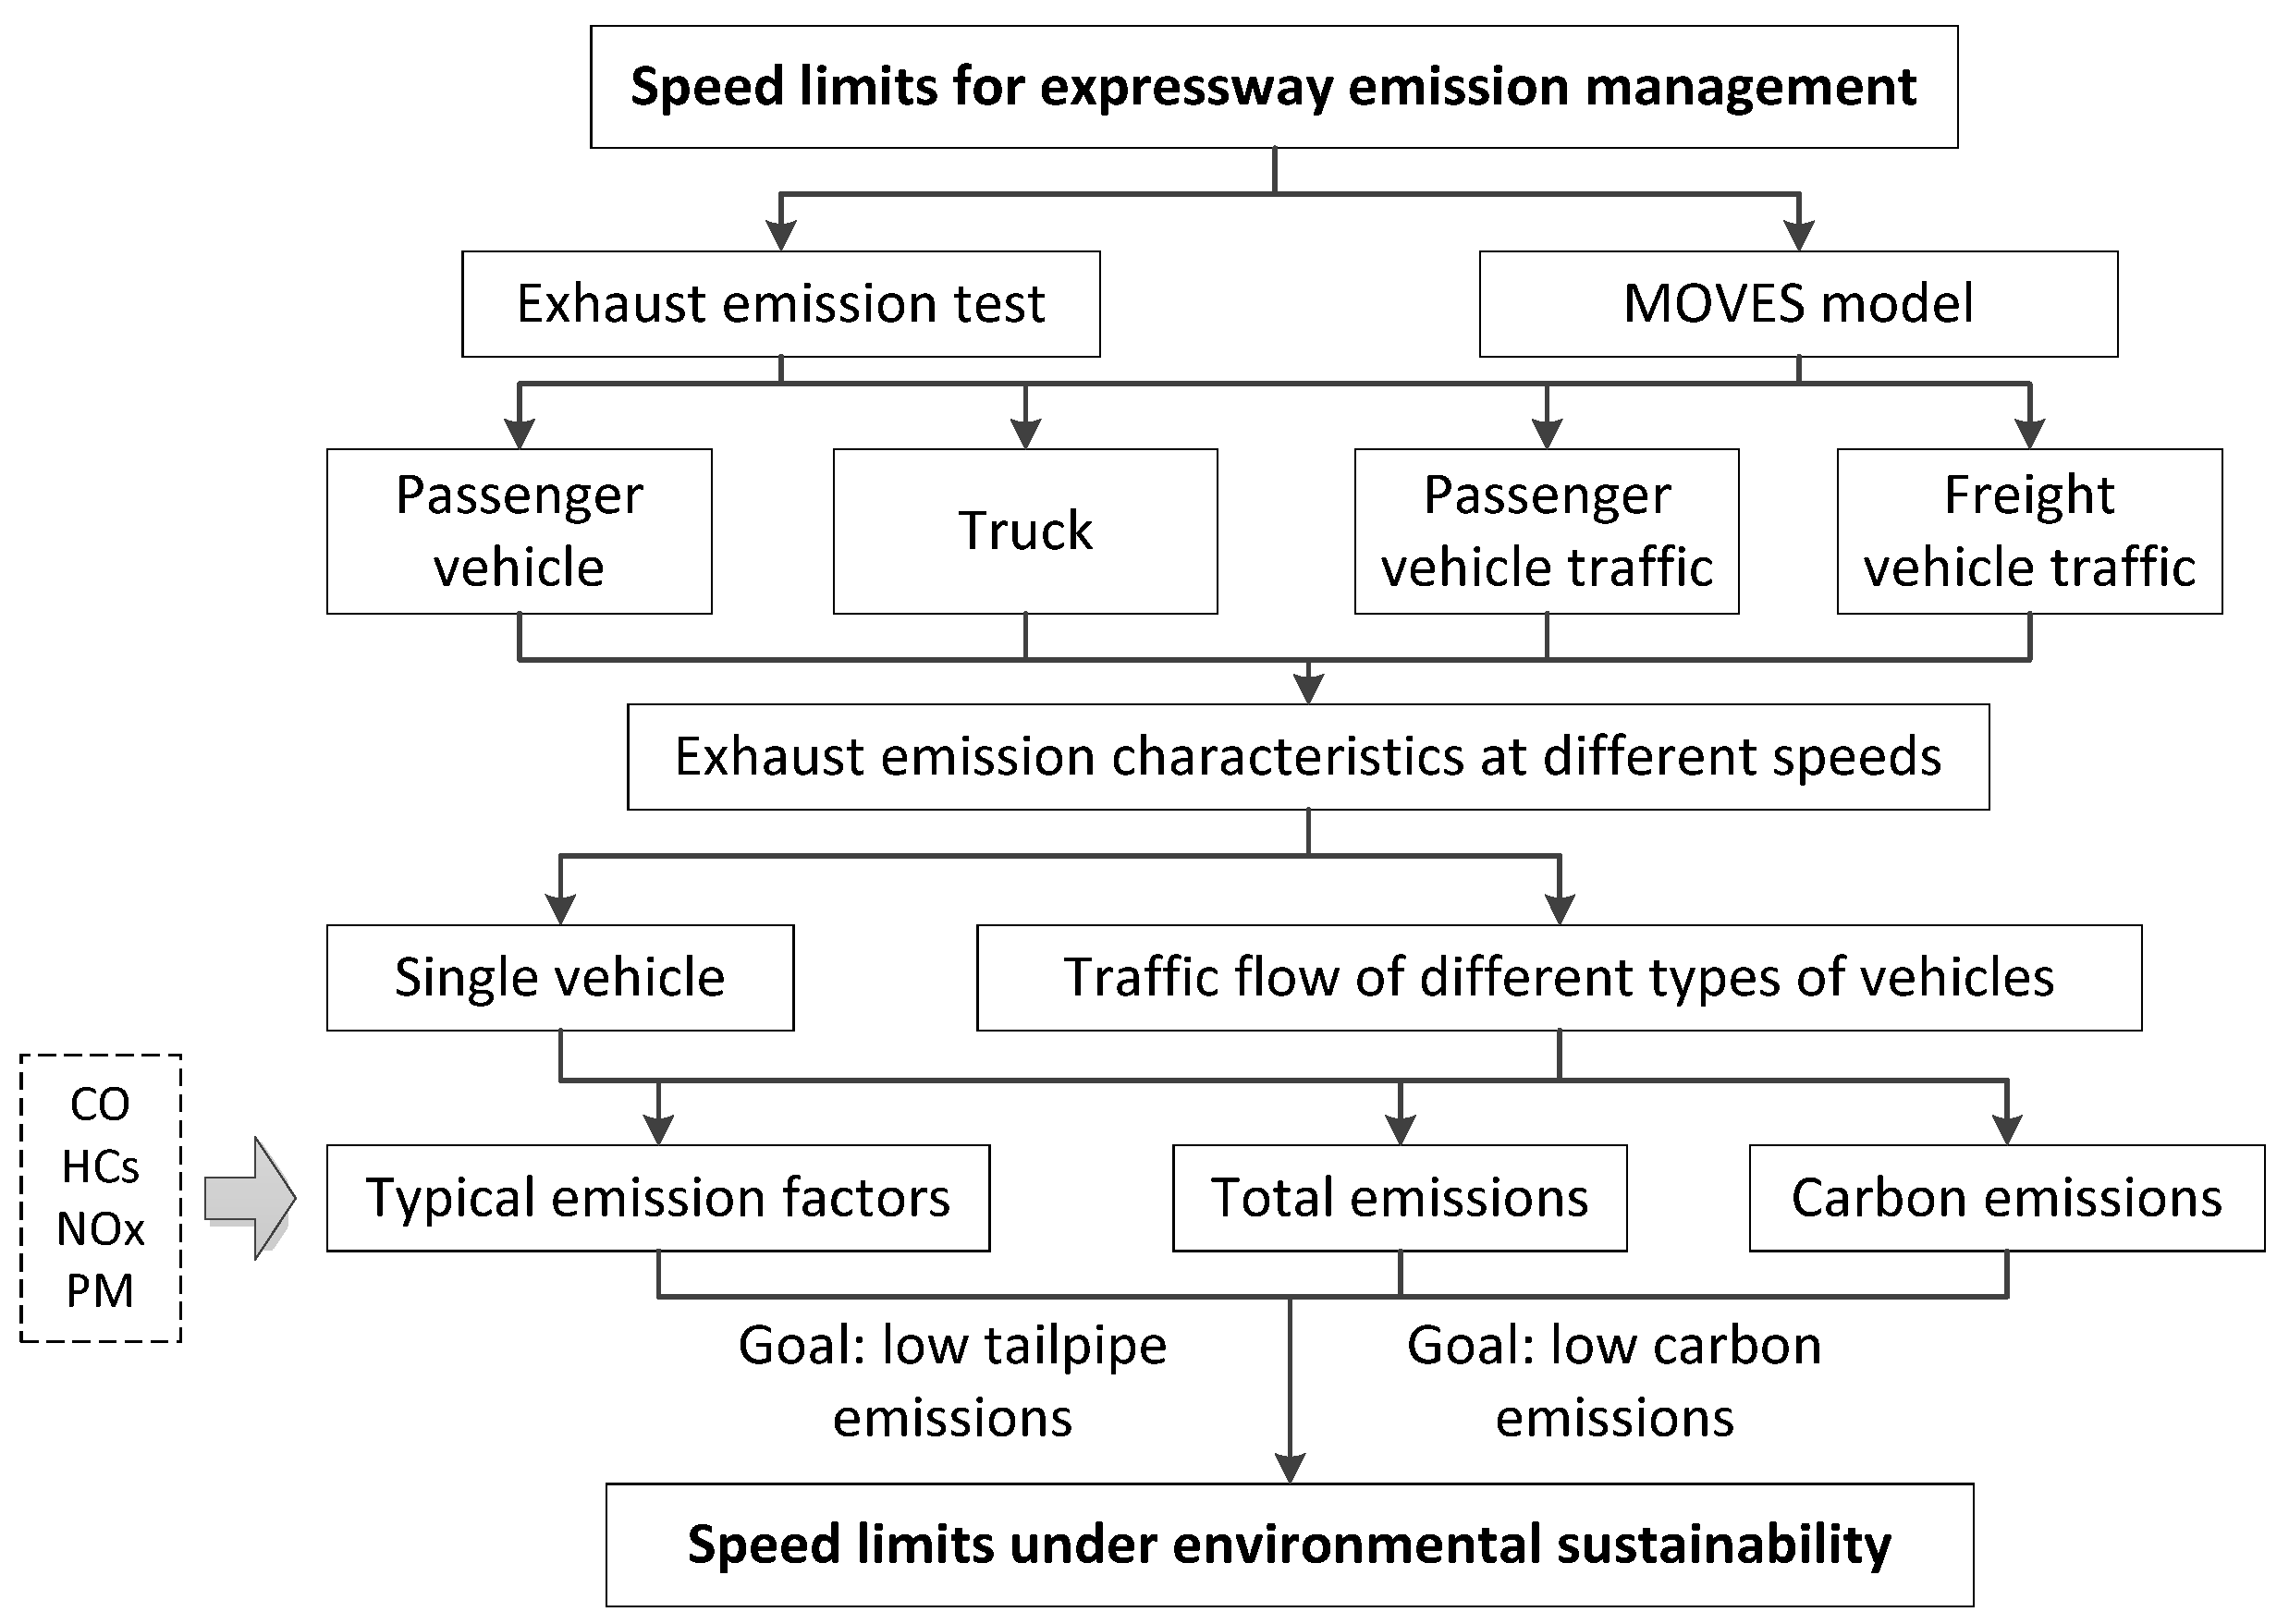
The analysis of traffic flow emissions employs single-vehicle experimental data to optimize the MOVES (MOtor Vehicle Emission Simulator) model and calibrate key parameters for expressway projects, enabling the prediction of traffic flow exhaust emissions. By combining the results from single-vehicle exhaust emissions with traffic flow predictions, we can examine the variation characteristics of typical emissions, total exhaust emissions, and carbon emissions with speed for different vehicle types, which include M1-light passenger vehicles, N1-minivans, N2-light heavy-duty vehicles, N3-medium heavy-duty vehicles, and N4-large heavy-duty vehicles. Ultimately, the findings yield conclusions regarding the exhaust emission characteristics of vehicles on expressways and establish speed limit thresholds for various vehicle types from the perspectives of optimizing exhaust emission control and fostering sustainable travel environments on expressways. The conceptual framework is shown in Figure 1.
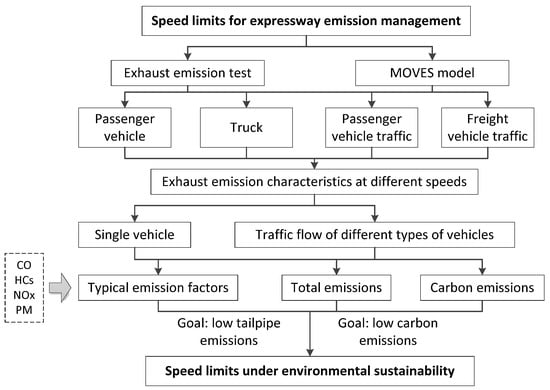
Figure 1.
Conceptual framework for determining speed limits for emission control purposes.
2.2. Single-Vehicle Exhaust Emission Test
This single-vehicle exhaust emission test was performed to investigate the relationship between vehicle speed and exhaust emissions. To create ideal test conditions, we needed to eliminate external factors on expressways that could affect pollutant emission levels. By controlling for variables and minimizing interference, we isolated vehicle speed as the only factor under examination. Given the importance of repeatability and control, the tests were conducted indoors using a chassis dynamometer to simulate driving conditions.
In the experiment, the vehicle was fixed to the chassis dynamometer, while the wheels drove the rollers to maintain stable speeds under different conditions. The exhaust emissions were collected using the British-made KANE AUTO5-1 exhaust emission tester at various speeds. The instrument captured the typical components and quantities of exhaust emissions for representative vehicle models. The AUTO5-1 is a handheld, five-component automotive exhaust analyzer capable of simultaneously measuring CO, HCs, O2, CO2, NO, oil temperature, and engine speed. With its compact size, lightweight design, and the ability to operate without an external power supply or fixed monitoring station, the device offers flexibility and real-time data collection. The AUTO5-1 can store up to 250 sets of test results, making it ideal for this experimental setup.
The selection of vehicle types for this study was based on traffic volume statistics gathered from multiple expressways in China, which revealed that the traffic composition is dominated by M1-light passenger vehicles. The proportions of representative vehicle types are shown in Table 1. From a developmental perspective, expressways primarily serve passenger transportation, with freight transport relying predominantly on railways. Additionally, the number of motor vehicles in China increases annually, suggesting that in the future, expressway traffic will remain primarily composed of M1.

Table 1.
Traffic composition of different road sections.
Considering the high speeds typical of expressway traffic, the speed ranges for the real-world experiments were determined based on an analysis of operational speeds from multiple expressway sections with various lane configurations. The statistical data (as shown in Table 2) reveal differences in speed distribution between light and heavy vehicles. Based on the results, the speed ranges were appropriately extended for each vehicle type. In the experiments, the exhaust emissions from M1-light passenger vehicles were analyzed at speeds ranging from 60 to 130 km/h, while for N- freight vehicles, the range was 40 to 100 km/h.
Table 2.
Vehicle speed range statistics for different numbers of lanes.
Given the current distribution of vehicle types and projected future trends, it is essential to understand the exhaust emission characteristics of vehicle types with the largest traffic composition share. Thus, representative models with a significant proportion of expressway traffic were selected for the experiments. The Volvo XC40 (manufacturer: Volvo Cars, produced in Shanghai, China) was chosen as the representative model for the former, and the Dongfeng DFL1160B(manufacturer: Dongfeng Motor Corporation, production in Wuhan, China) was selected to represent the latter. Key parameters of the test vehicles are shown in Table 3.
Table 3.
Summary of key parameters of experimental vehicles.
2.3. Traffic Flow Exhaust Emissions Based on the MOVES Model
While single-vehicle experiments provide valuable insights, they may not be able to provide a comprehensive view of the overall environmental impact of exhaust emissions on expressways, requiring further analysis of traffic flow exhaust emission characteristics. The MOVES model is used to predict exhaust emissions relative to various vehicle types at different speeds, calibrating key parameters with the data obtained from real-world vehicle experiments. This allows for the construction of a simulation model that predicts traffic flow exhaust emissions at different speeds under otherwise identical conditions.
MOVES 2014 is the most widely used software for evaluating and predicting vehicle emissions, applicable across various scenarios. It works in conjunction with a MySQL database to predict regional pollutant emissions. The model incorporates vehicle-specific power (VSP), which is subdivided through cluster analysis, enabling a detailed study of the relationship between fuel consumption and emissions for different vehicle types.
MOVES can be applied at various levels (i.e., macro-, meso-, and micro-levels), and this study focuses on the micro-level, examining traffic emissions on a detailed scale. The micro-level module (project model) was selected for parameter calibration and analysis. Taking actual engineering projects as a reference, we can analyze the exhaust emissions from M1-light passenger and N-freight vehicles traveling at different speeds, assuming identical traffic volumes, compositions, and vehicle characteristics. The simulation process for traffic flow exhaust emissions based on MOVES is illustrated in Figure 2.
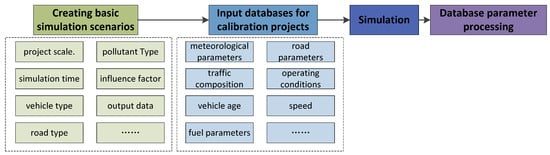
Figure 2.
Simulation process for traffic flow exhaust emissions based on MOVES.
Considering that the MOVES model’s database is based on motor vehicle exhaust emission data from various states and counties in the United States (US), we needed to localize the model parameters by investigating the actual traffic conditions, road types, vehicles, fuels, and other relevant information in China. This localization process involves incorporating data collected from single-vehicle exhaust emission experiments.
The required input parameters for the MOVES model at the micro-level—road type, geographic location, vehicle type, simulation time, vehicle age, and fuel type—were modified accordingly (the results of these adjustments are presented in Table 4). Additionally, all the necessary input and output files for the model were established, and constraints were integrated into the simulation setup. Localizing the parameters and configuring the files completed the simulation file for the MOVES model.
Table 4.
Key parameters calibrated for MOVES model.
3. Results and Discussion
Based on results from real-vehicle experiments and model analyses, the characteristics of exhaust emissions can be examined. In this study, we conducted a statistical analysis of the emission levels of typical pollutants, i.e., CO, NOx, HCs, and PM2.5, at different speeds, calculating the total exhaust emissions and extracting the carbon-related emissions. We fitted curves representing the changes in exhaust characteristics and carbon emissions from both single vehicles and multi-vehicle traffic flow as functions of speed, thereby analyzing the quantitative features of vehicle exhaust emissions at various speeds.
3.1. Typical Emissions for Single Vehicles
3.1.1. Exhaust Emissions from a Light Passenger Vehicle Traveling at Different Speeds
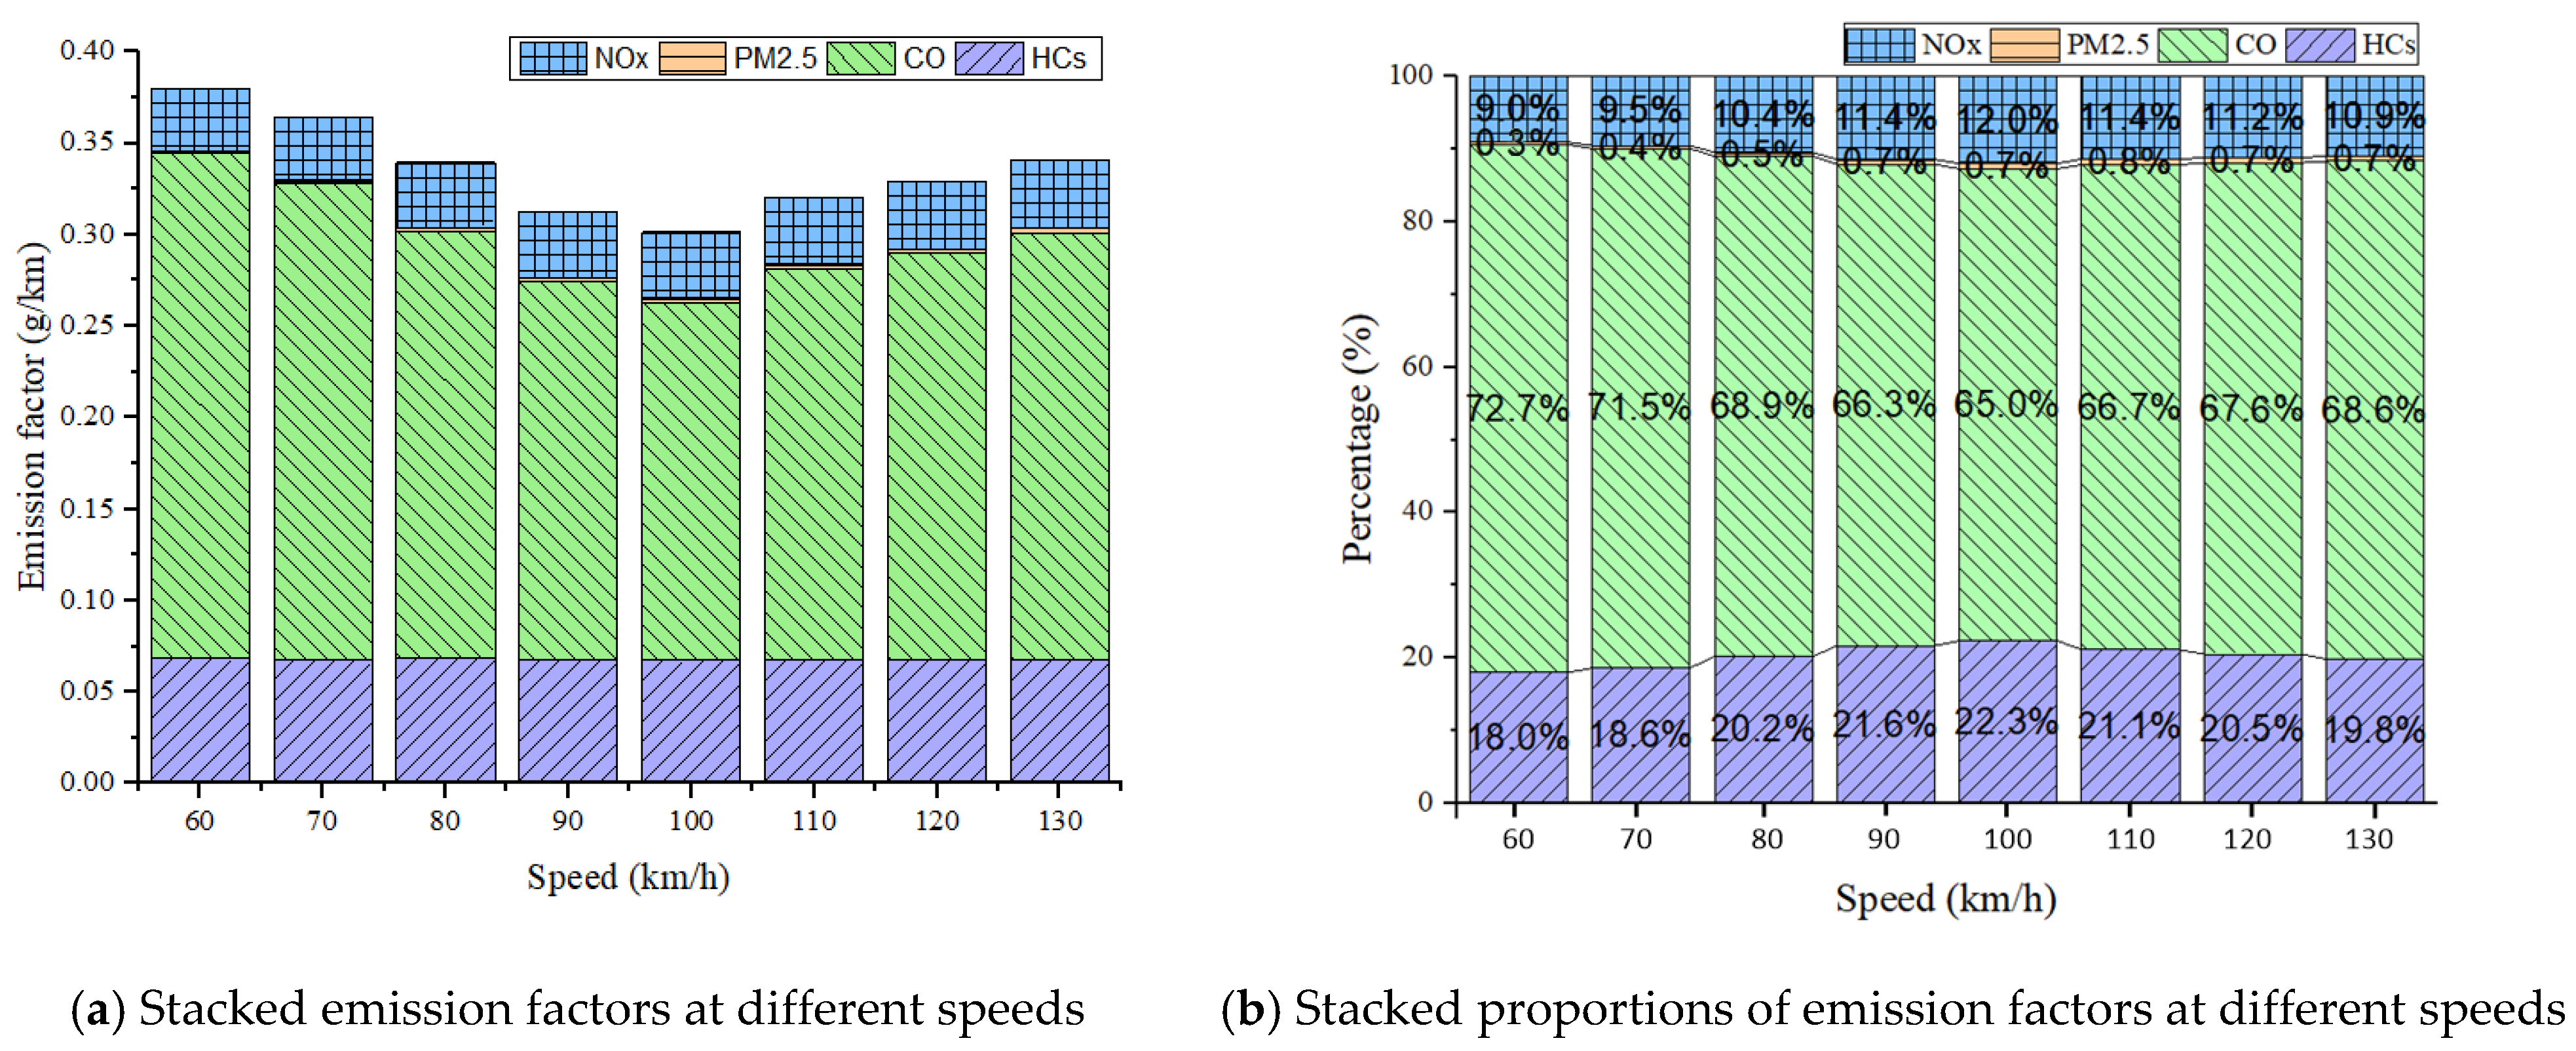
To analyze the emission variations for an M1-light passenger vehicle traveling at different speeds, we considered the accumulated changes in emission components, their proportional contributions, and total emission volumes.
- Changes in emission accumulation
The trends in emission accumulation for various factors at different speeds (see Figure 3a) indicate that among the typical pollutants, NOx emissions are the lowest, while CO emissions are the highest, followed by HCs, with PM2.5 emissions being slightly lower than HCs.
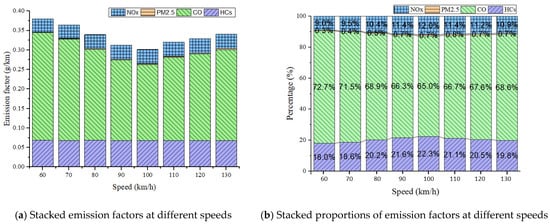
Figure 3.
Changes in total emissions for light passenger vehicles.
The total accumulation of emissions for M1 exhibits a U-shaped variation trend with speed. At speeds within the range of 60 km/h to 100 km/h, they show a decreasing trend; in contrast, at speeds between 100 km/h and 130 km/h, there is an increase in emission accumulation. The minimum amount, approximately 0.28 g/km, was recorded at 100 km/h. Conversely, at 60 km/h, the accumulation is the highest, around 0.36 g/km, which is slightly higher than the 0.32 g/km recorded at 130 km/h.
The variation in the proportions of different emissions at various speeds shows a maximum difference of 3% (see Figure 3b), which is negligible from a dimensional perspective.
- 2.
- Variations in emission factors
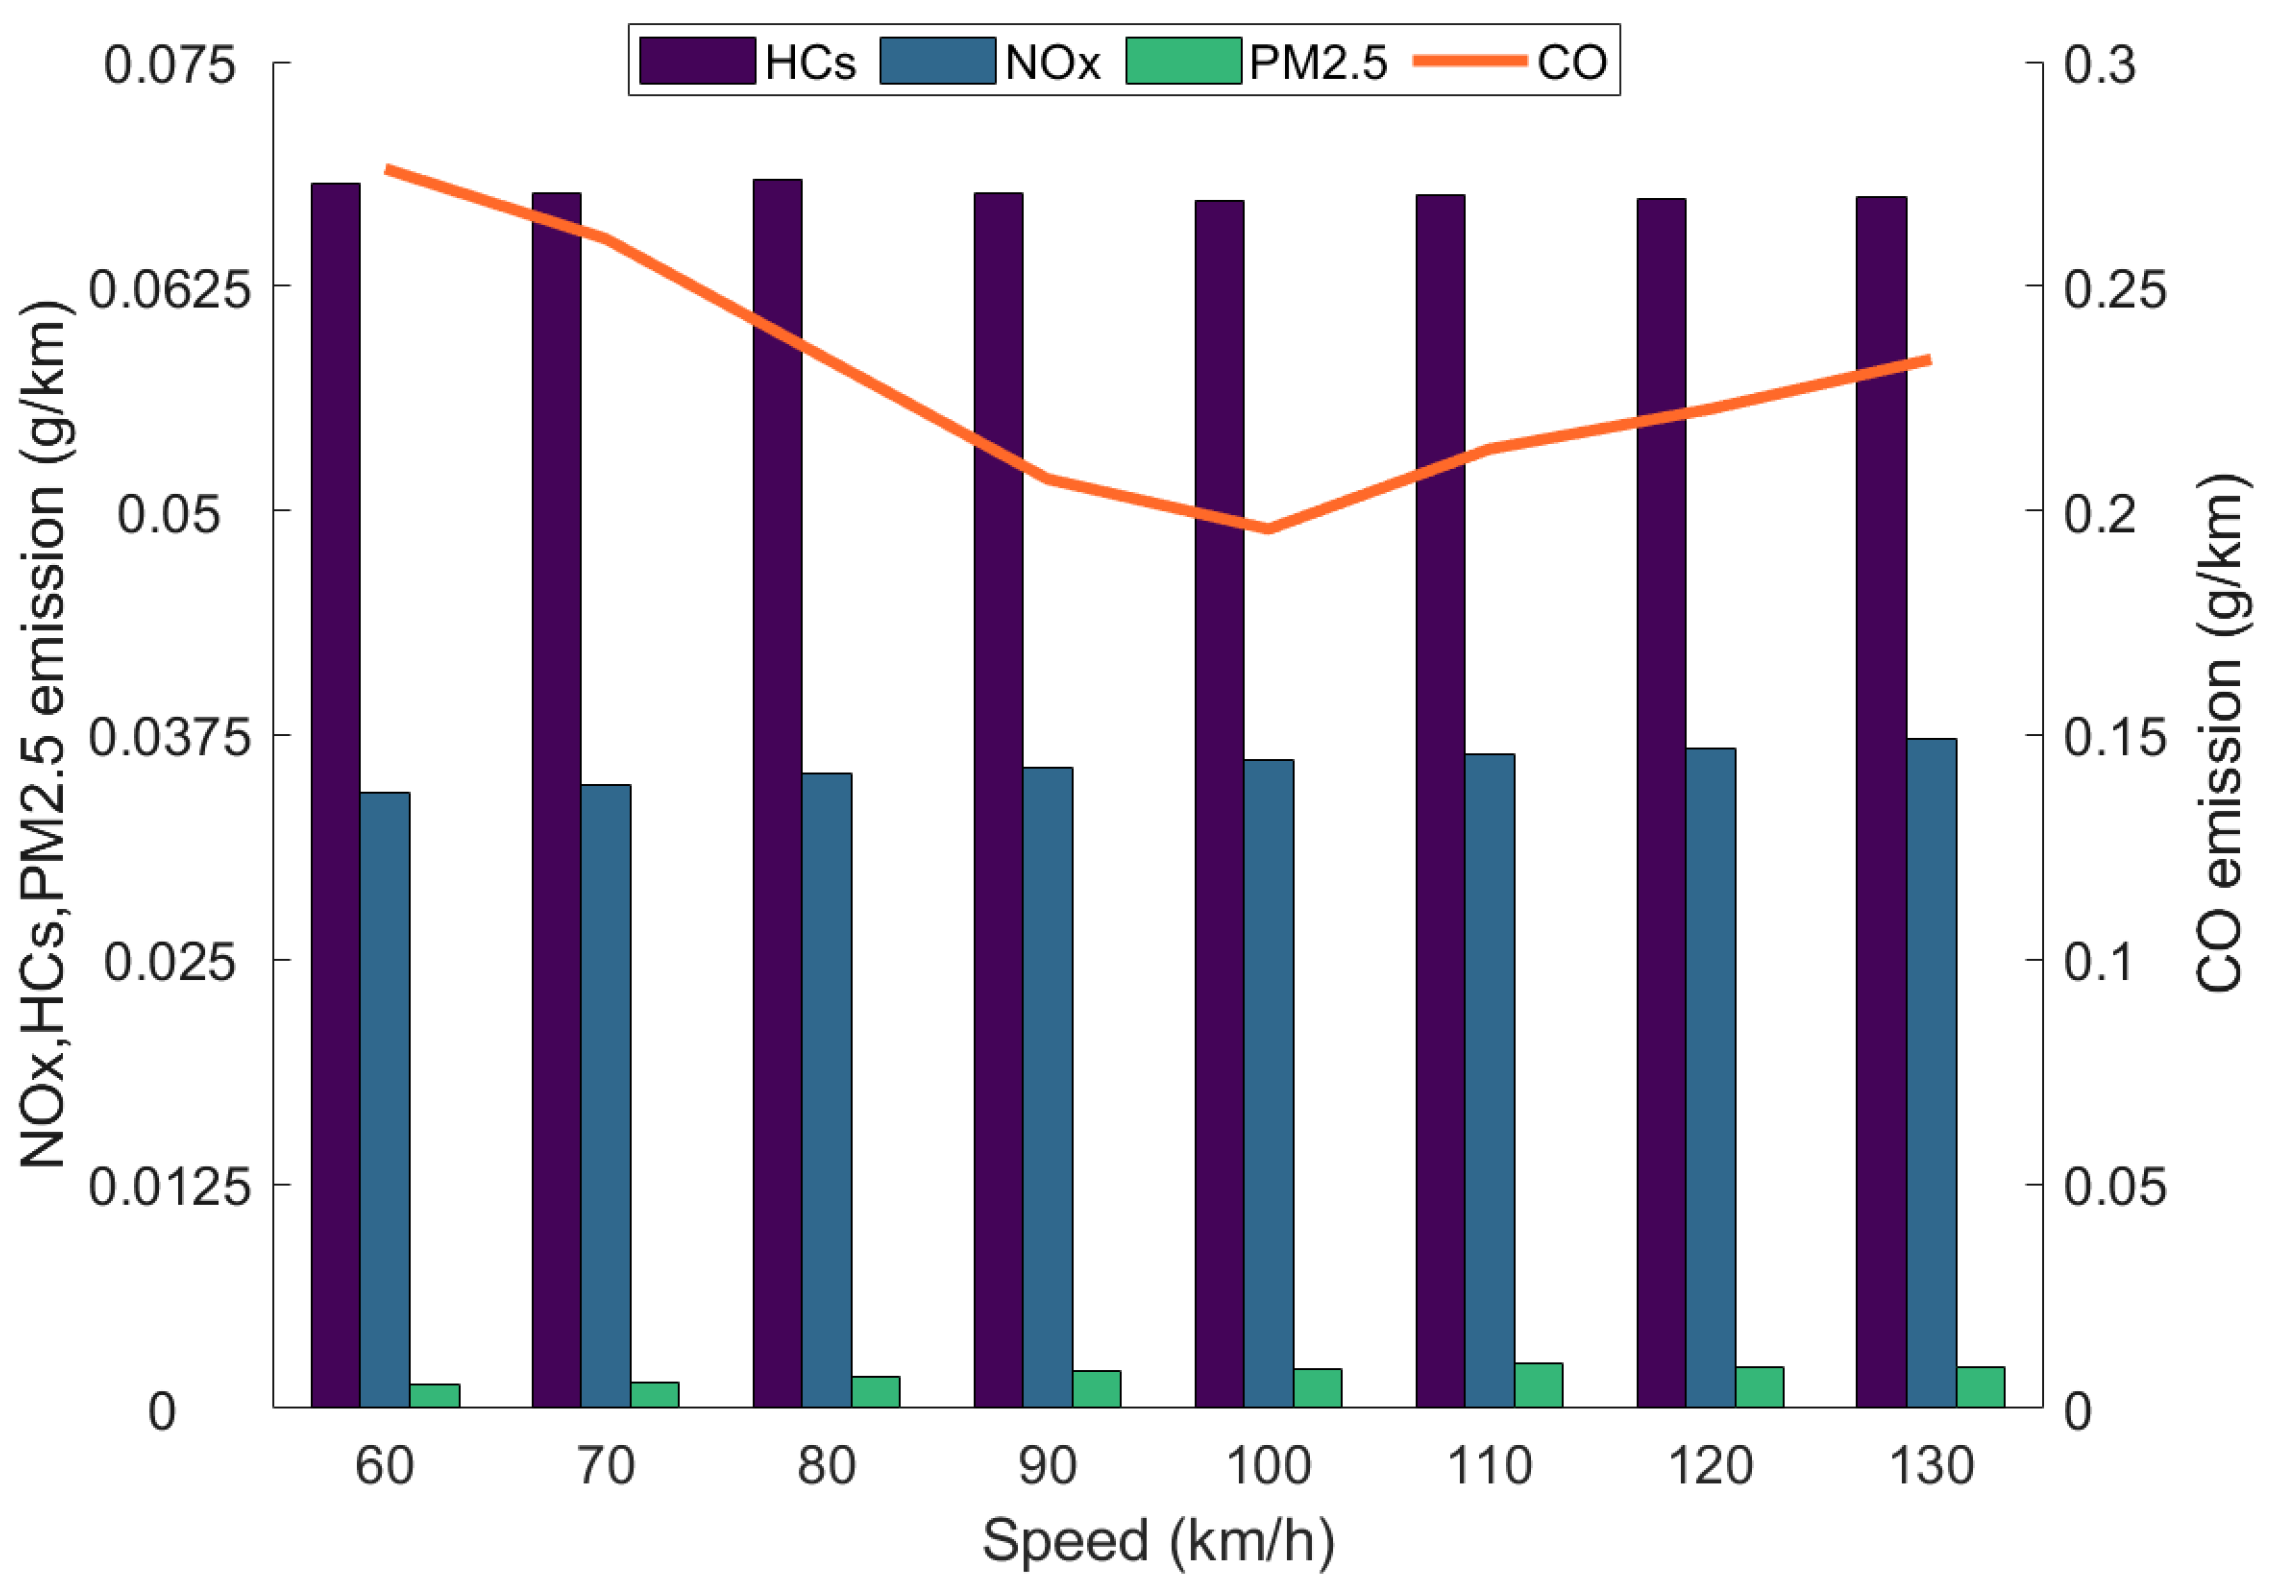
The trends in emission factors for M1-light passenger vehicles are illustrated in Figure 4. Within the experimental speed range of 60–130 km/h, CO emissions range from 0.195 to 0.276 g/km, NOx emissions range from 0.034 to 0.038 g/km, HCs + NOx emissions are below 0.108 g/km, and PM emissions are below 0.0025 g/km. These values comply with the permitted emissions limits in Table 3.
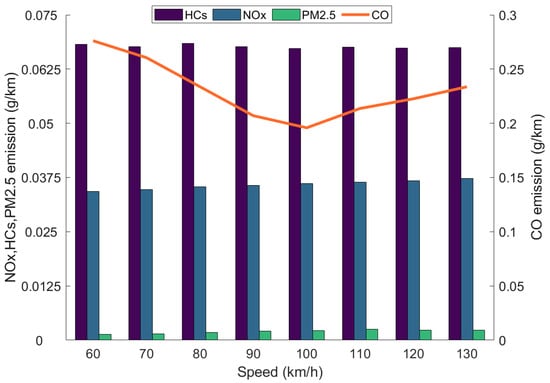
Figure 4.
Emission factor trends as functions of speed for light passenger vehicles.
When the vehicle speed ranges from 60 to 130 km/h, HCs emissions remain relatively stable, ranging from 0.067 to 0.0685 g/km. In contrast, NOx emissions exhibit an overall increasing trend with the increase in speed. At 110 km/h, a notable spike appears in NOx emissions at a maximum value; however, they decrease at speeds greater than 110 km/h. Although PM2.5 emissions increase with speed, the differences in PM2.5 emissions at various speeds are minimal, with adjacent speed intervals differing by only about 0.05 mg/km.
CO typically exhibits the highest emissions. The lowest CO emissions value, approximately 0.19 g/km, occurs at 100 km/h. From 60 to 100 km/h, the CO emissions decrease rapidly; however, they increase steadily at speeds exceeding 100 km/h.
Overall, the trends of the emission factors indicate that speed significantly impacts CO emissions, with NOx emissions slightly fluctuating with speed. In contrast, HCs and PM2.5 show lower sensitivities to speed. The typical speed range of 80–110 km/h serves as a transitional interval for the changes in these emission characteristics.
3.1.2. Exhaust Emissions from a Freight Vehicle Traveling at Different Speeds
- 1.
- Changes in emission accumulation
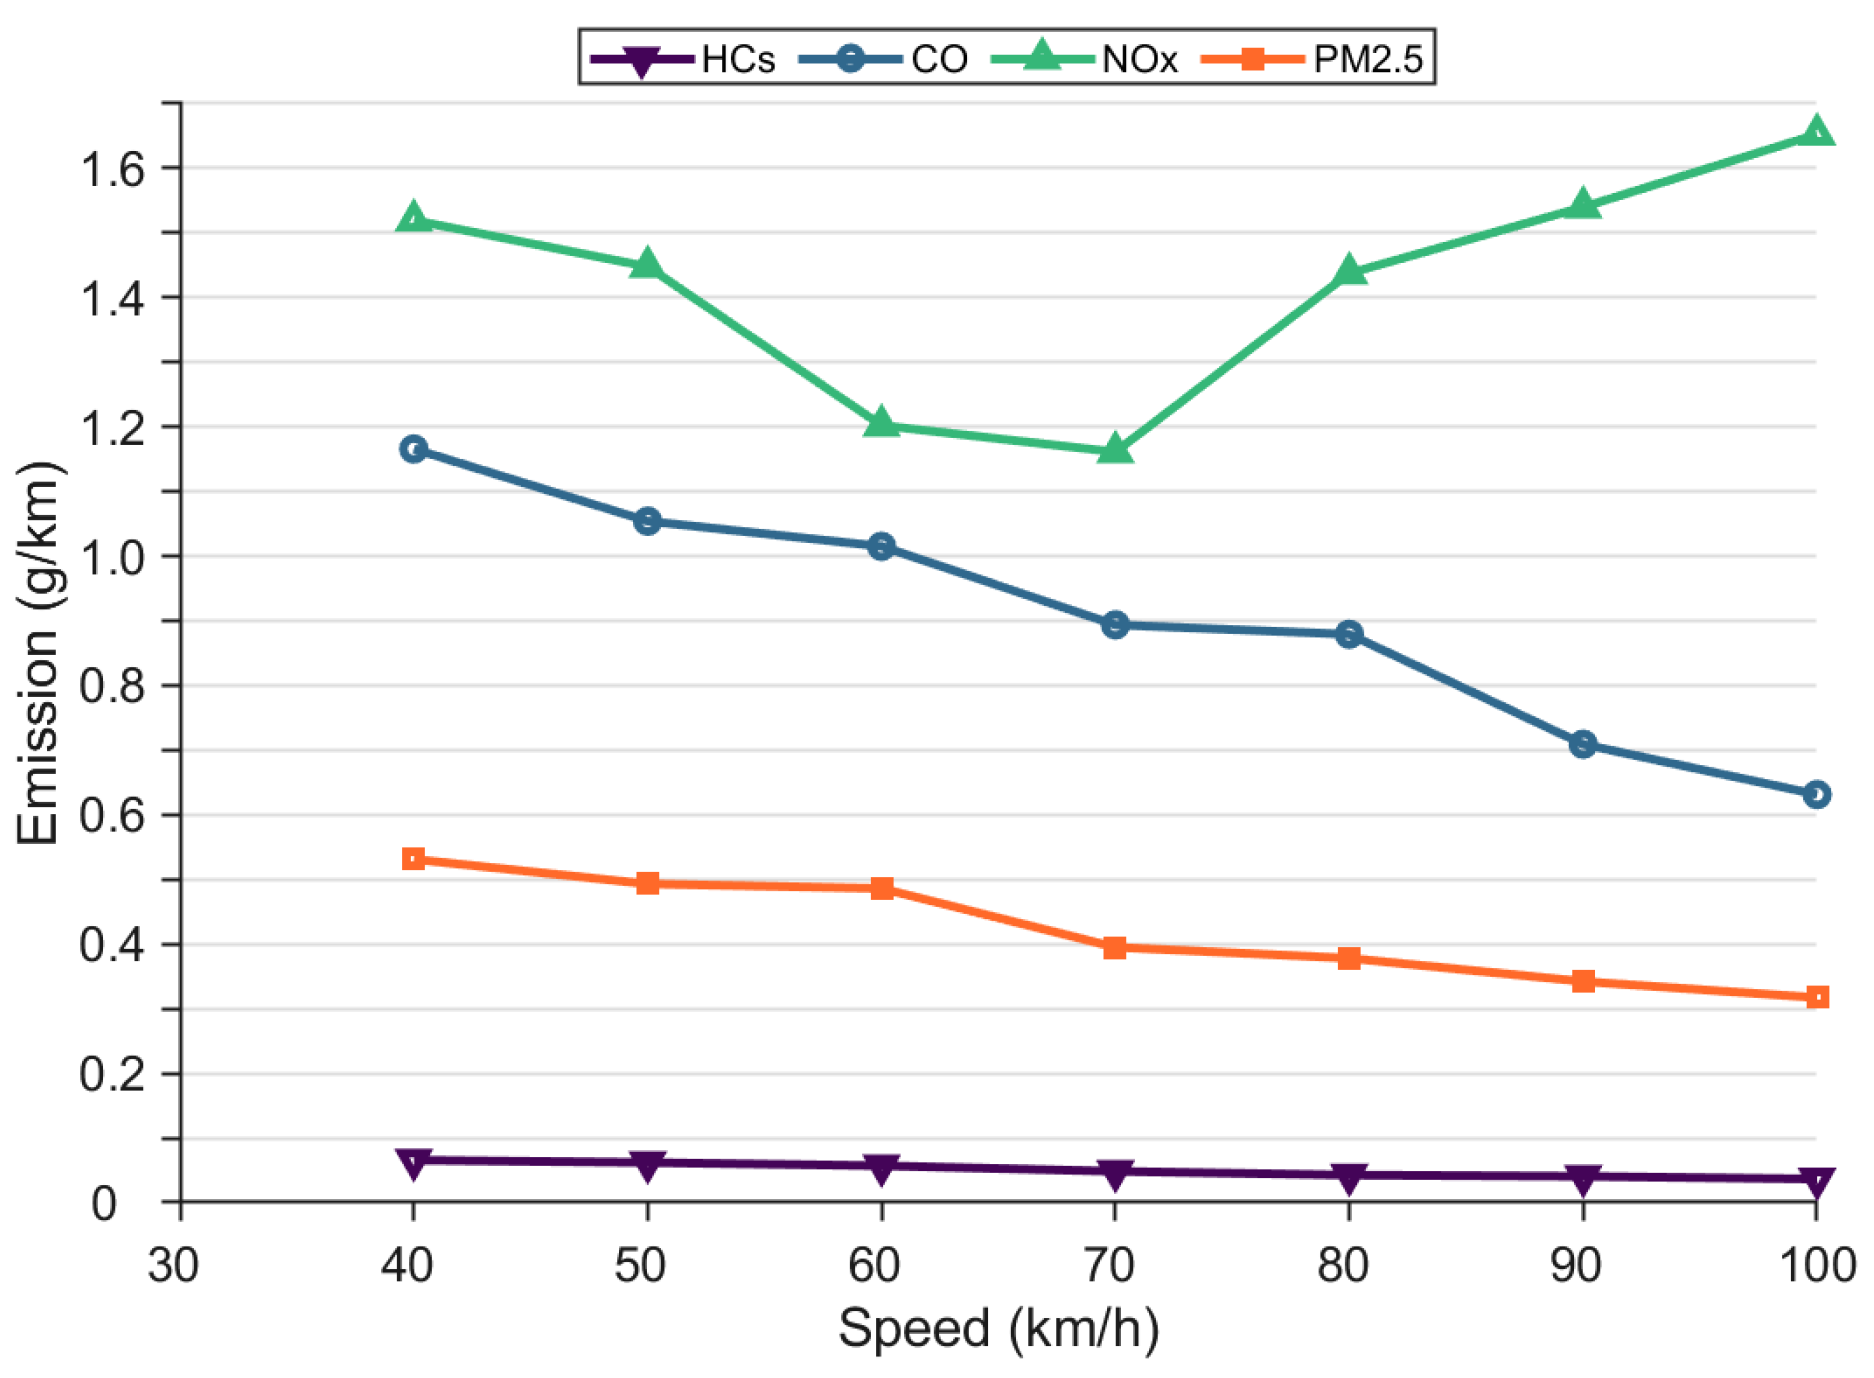
A comparison of the emission trends of an M1-light passenger vehicle and an N-freight vehicle (see Figure 4 and Figure 5) shows that the exhaust emissions from the latter are significantly higher than those from the former, where NOx emissions are the highest, followed by CO, PM2.5, and then HCs.
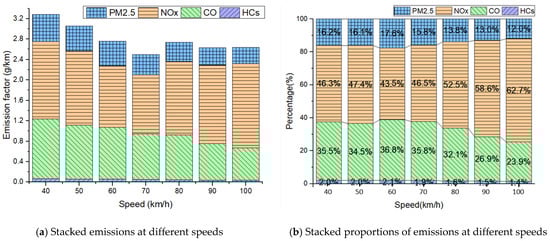
Figure 5.
Emission factor trends for freight vehicles.
As illustrated in Figure 5, the total accumulation of emissions from N-freight vehicles shows an overall trend characterized by an initial decrease, followed by an increase with speed. The lowest accumulation of approximately 2.5 g/km is at 70 km/h. As the speed increases, the proportion of NOx emissions in the total emissions increases significantly, while the proportion of CO emissions shows a notable decrease.
- 2.
- Variations in specific emissions
Within the experimental speed range of 40–100 km/h, the emission factors are as follows: NOx ranges from 1.2 to 1.54 g/km, CO from 0.63 to 1.17 g/km, PM2.5 from 0.31 to 0.53 g/km, and HCs from 0.036 to 0.065 g/km. Among these, the CO, NOx, and HCs emissions generally comply with the permitted emissions limits for the tested vehicles. However, due to the absence of the Diesel Particulate Filter (DPF) in the test vehicle, PM emissions are excessively high. The trends in the emission factors for the freight vehicle differ from those of the M1-light passenger vehicle. CO, HCs, and PM2.5 emissions generally show a decreasing trend, while NOx emissions exhibit a U-shaped pattern, decreasing initially and then increasing (see Figure 6).
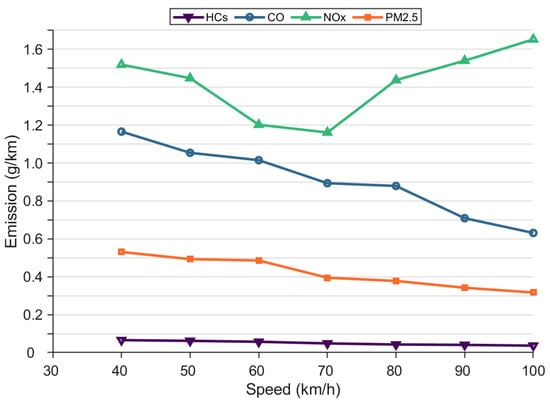
Figure 6.
Changes in emissions for freight vehicles traveling at different speeds.
Although HCs emissions decrease overall with increasing speed, the rate of reduction varies across different speed intervals. The most significant decline in HCs emissions occurs between 60 and 70 km/h. At speeds exceeding 80 km/h, the downward trend in HCs emissions noticeably slows. NOx emissions, on the other hand, reach their lowest point at 70 km/h, demonstrating a U-shaped variation. At 40 km/h, CO emissions are at their highest, while at speeds of 50–60 and 70–80 km/h, the decrease is gradual, resulting in a step-like reduction pattern. This pattern is primarily attributed to the lower combustion efficiency of diesel engines at low speeds, whereas efficiency improves significantly at medium and high speeds, leading to a reduction in CO emissions. PM2.5 emissions also decrease as the speed increases, with a notable reduction occurring between 60 and 70 km/h. As speed increases from 70 km/h, the decline in PM2.5 emissions slows considerably. CO, NOx, and PM2.5 show higher sensitivity to vehicle speed than HCs, with their emission rates being significantly affected by speed changes.
3.2. Typical Emissions for Traffic Flow
3.2.1. Emission Characteristics of Light Passenger Vehicles Traveling at Different Speeds
Simulations of M1-light passenger vehicle exhaust emissions were conducted at average traffic speeds ranging from 50 to 130 km/h with intervals of 10 km/h. The relationship between speed and the emission rates of various pollutants (CO, NOx, HCs, and PM2.5) using the MOVES model is illustrated in Figure 7. Overall, at low speeds, incomplete gasoline combustion leads to higher emission rates [57]. As speed increases, improved combustion efficiency and the optimized performance of exhaust after-treatment systems result in a reduction of CO, NOX, and PM2.5 emission rates. However, as speed continues to rise, the effects of fuel evaporation become more pronounced, causing HCs emissions to decrease initially before increasing.

Figure 7.
Relationship between simulated emission rates and speed for light passenger vehicles using MOVES.
- CO has the highest emission rate, followed by HCs, NOx, and PM2.5. A significant difference in the order of magnitude of the emission rates is clear; for example, CO emissions are nearly 100 times those of PM2.5, about twice those of HCs, and 5 to 10 times those of NOx.
- Within the simulated speed range, the CO emission rates decrease with the increase in speed. The lower the vehicle speed, the faster the reduction in CO emissions, which follows an initial rapid decline that gradually levels off.
- The trend in HCs emissions is opposite that of CO; HCs emissions increase slowly at first and then rapidly as the speed increases.
- NOx emissions gradually decrease with the increase in speed, reaching a minimum of 1.15 g/km at 100 km/h; when increasing speed from 100 km/h, NOx emissions increase again.
- PM2.5 emissions show an overall increasing trend with speed; however, at 80 km/h, their rate drops to a minimum of 0.0067 g/km.
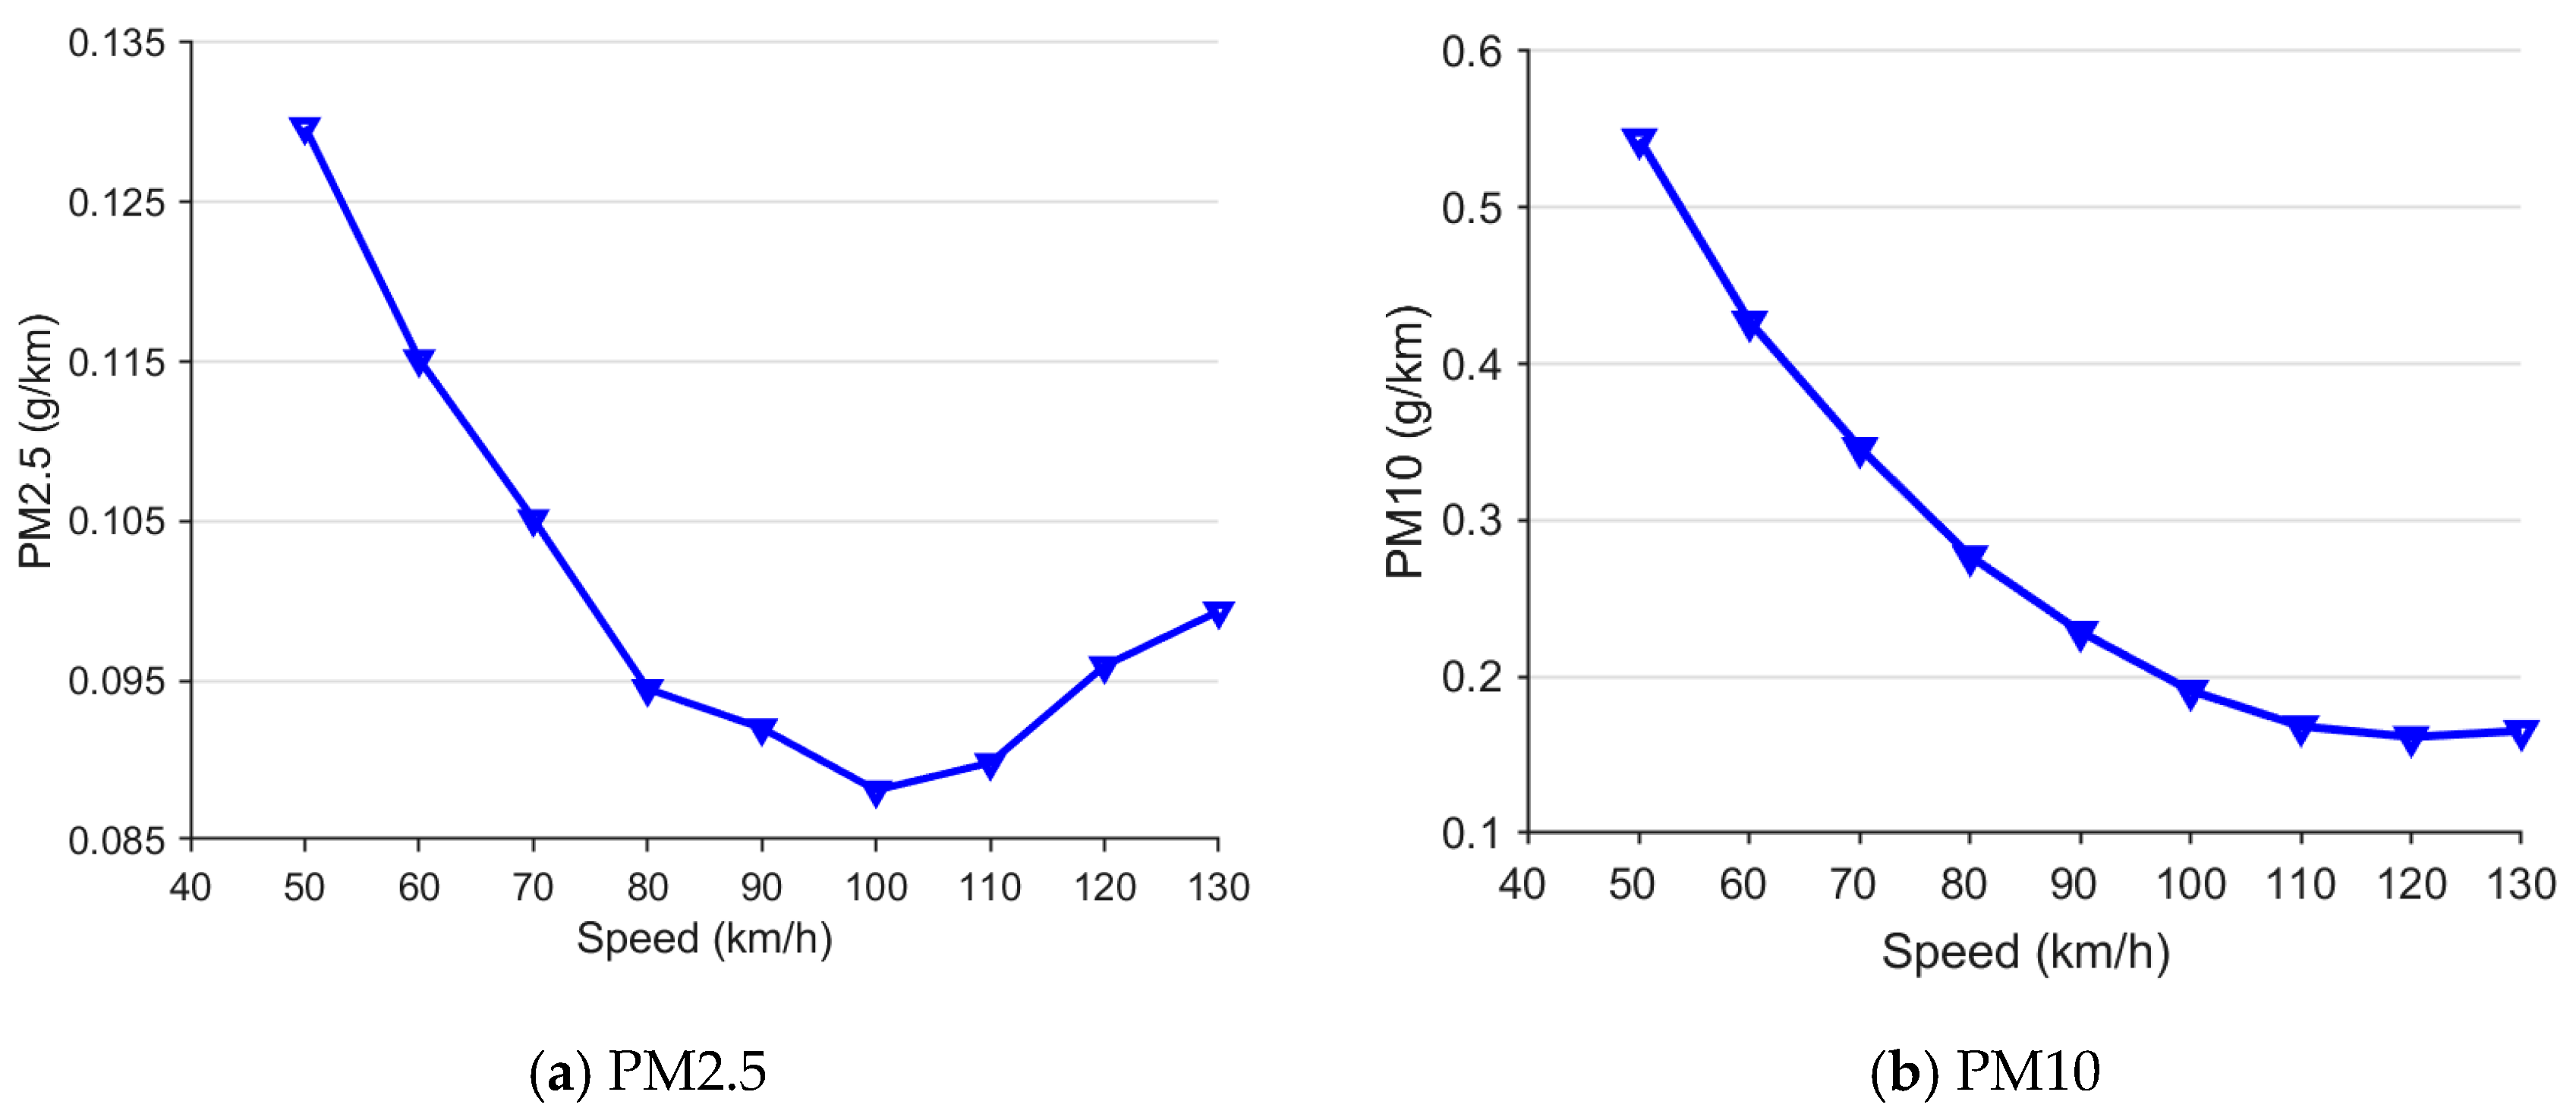
Additionally, it is important to consider that PM generated during vehicle operation originates not only from exhaust emissions but also from brake friction, tire wear, road surface wear, and dust [58,59]. To further explore the relationship between PM and vehicle speed, the MOVES non-exhaust emissions module was activated to predict PM2.5 and PM10 emissions. These were combined with the PM from vehicle exhaust emissions to plot the PM generation at varying speeds for M1-light passenger vehicle traffic flow, as shown in Figure 8.

Figure 8.
PM of Light Passenger Vehicle Traffic Flow at Different Speeds.
Both PM2.5 and PM10 demonstrated a general “U-shaped” trend with increasing speed. At medium to high speeds (greater than 80 km/h), PM2.5 and PM10 emissions were relatively low, particularly for PM10, which exhibited significantly reduced emissions.
3.2.2. Emission Characteristics of Freight Vehicles Traveling at Different Speeds
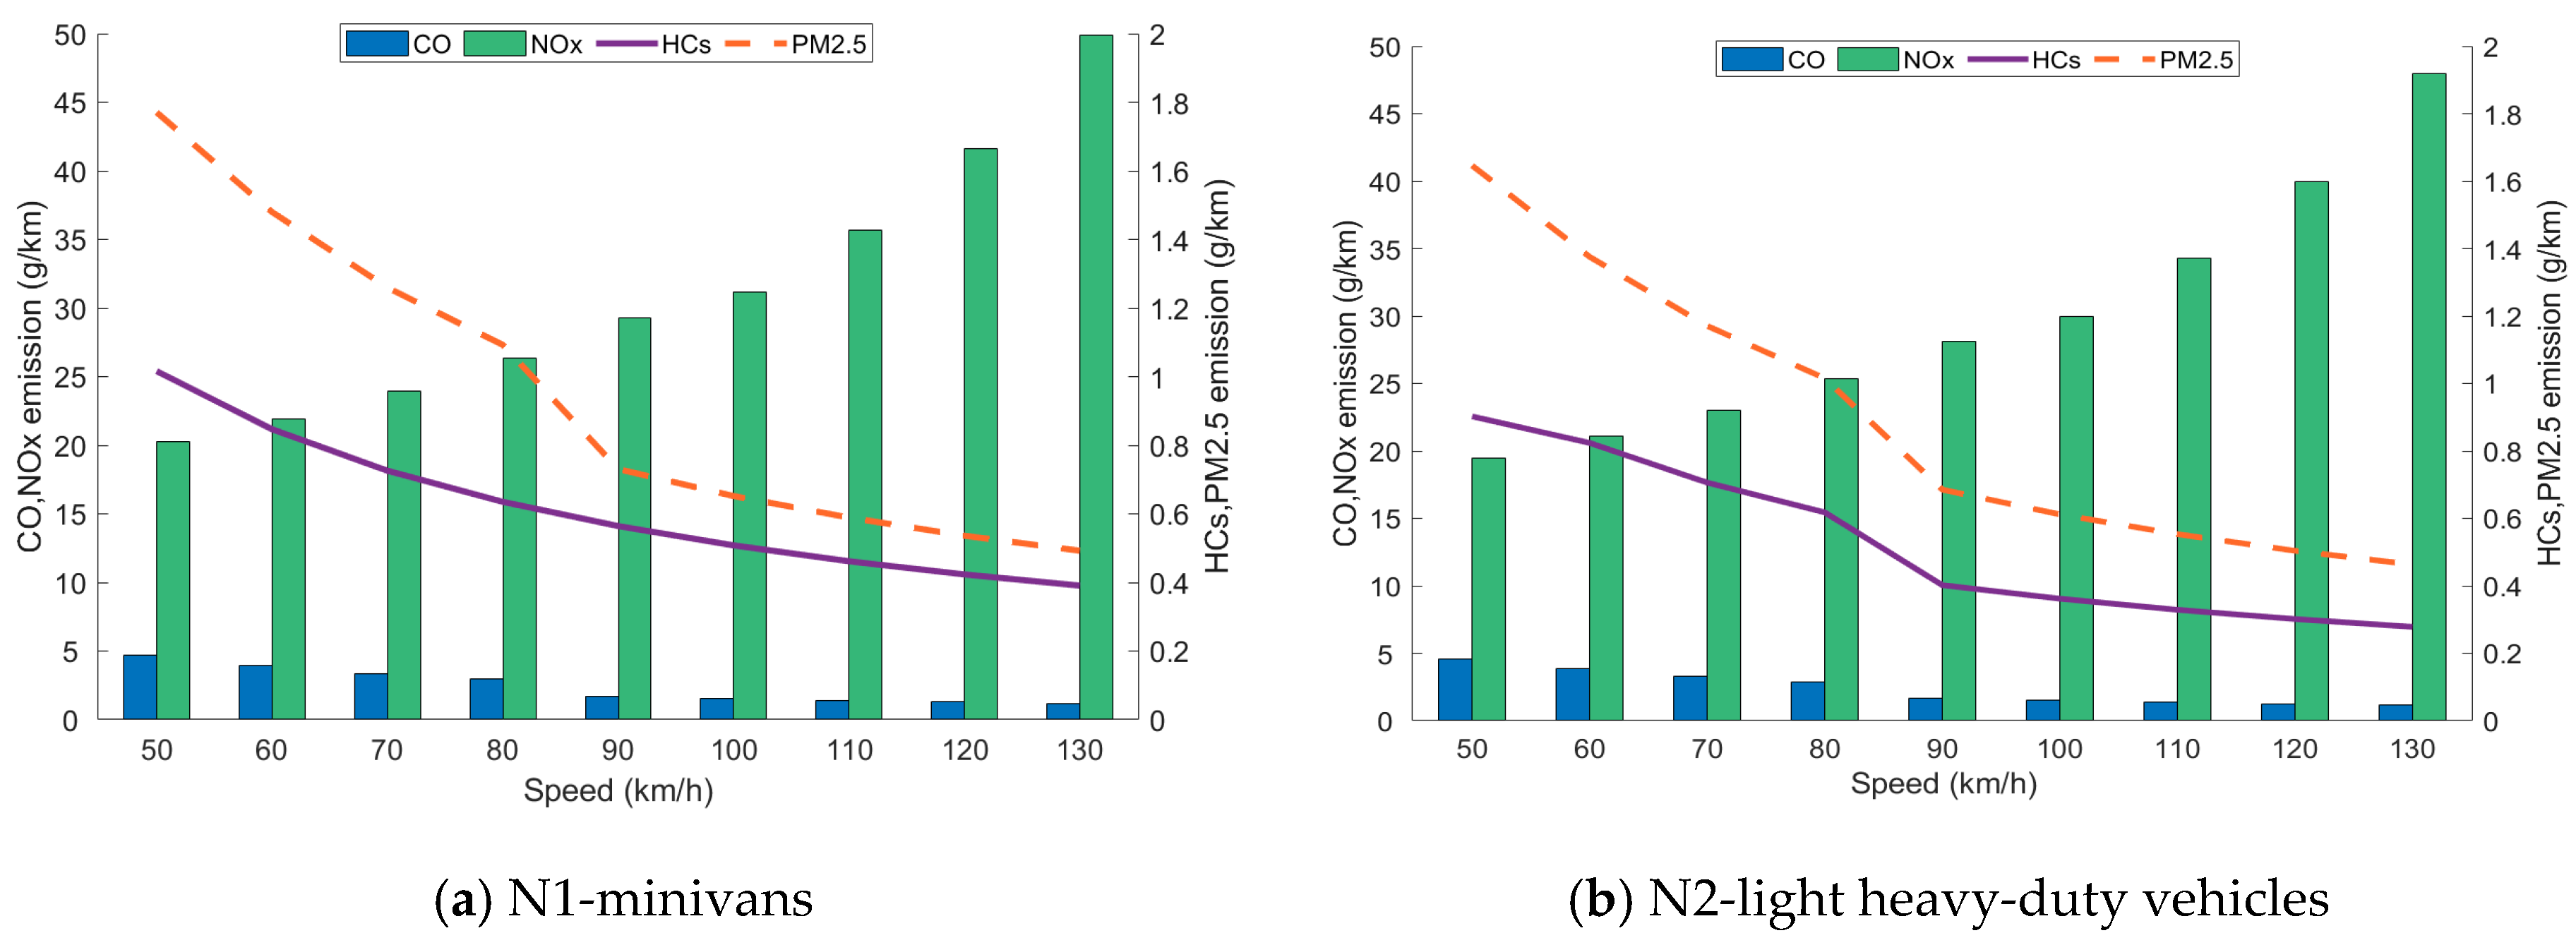
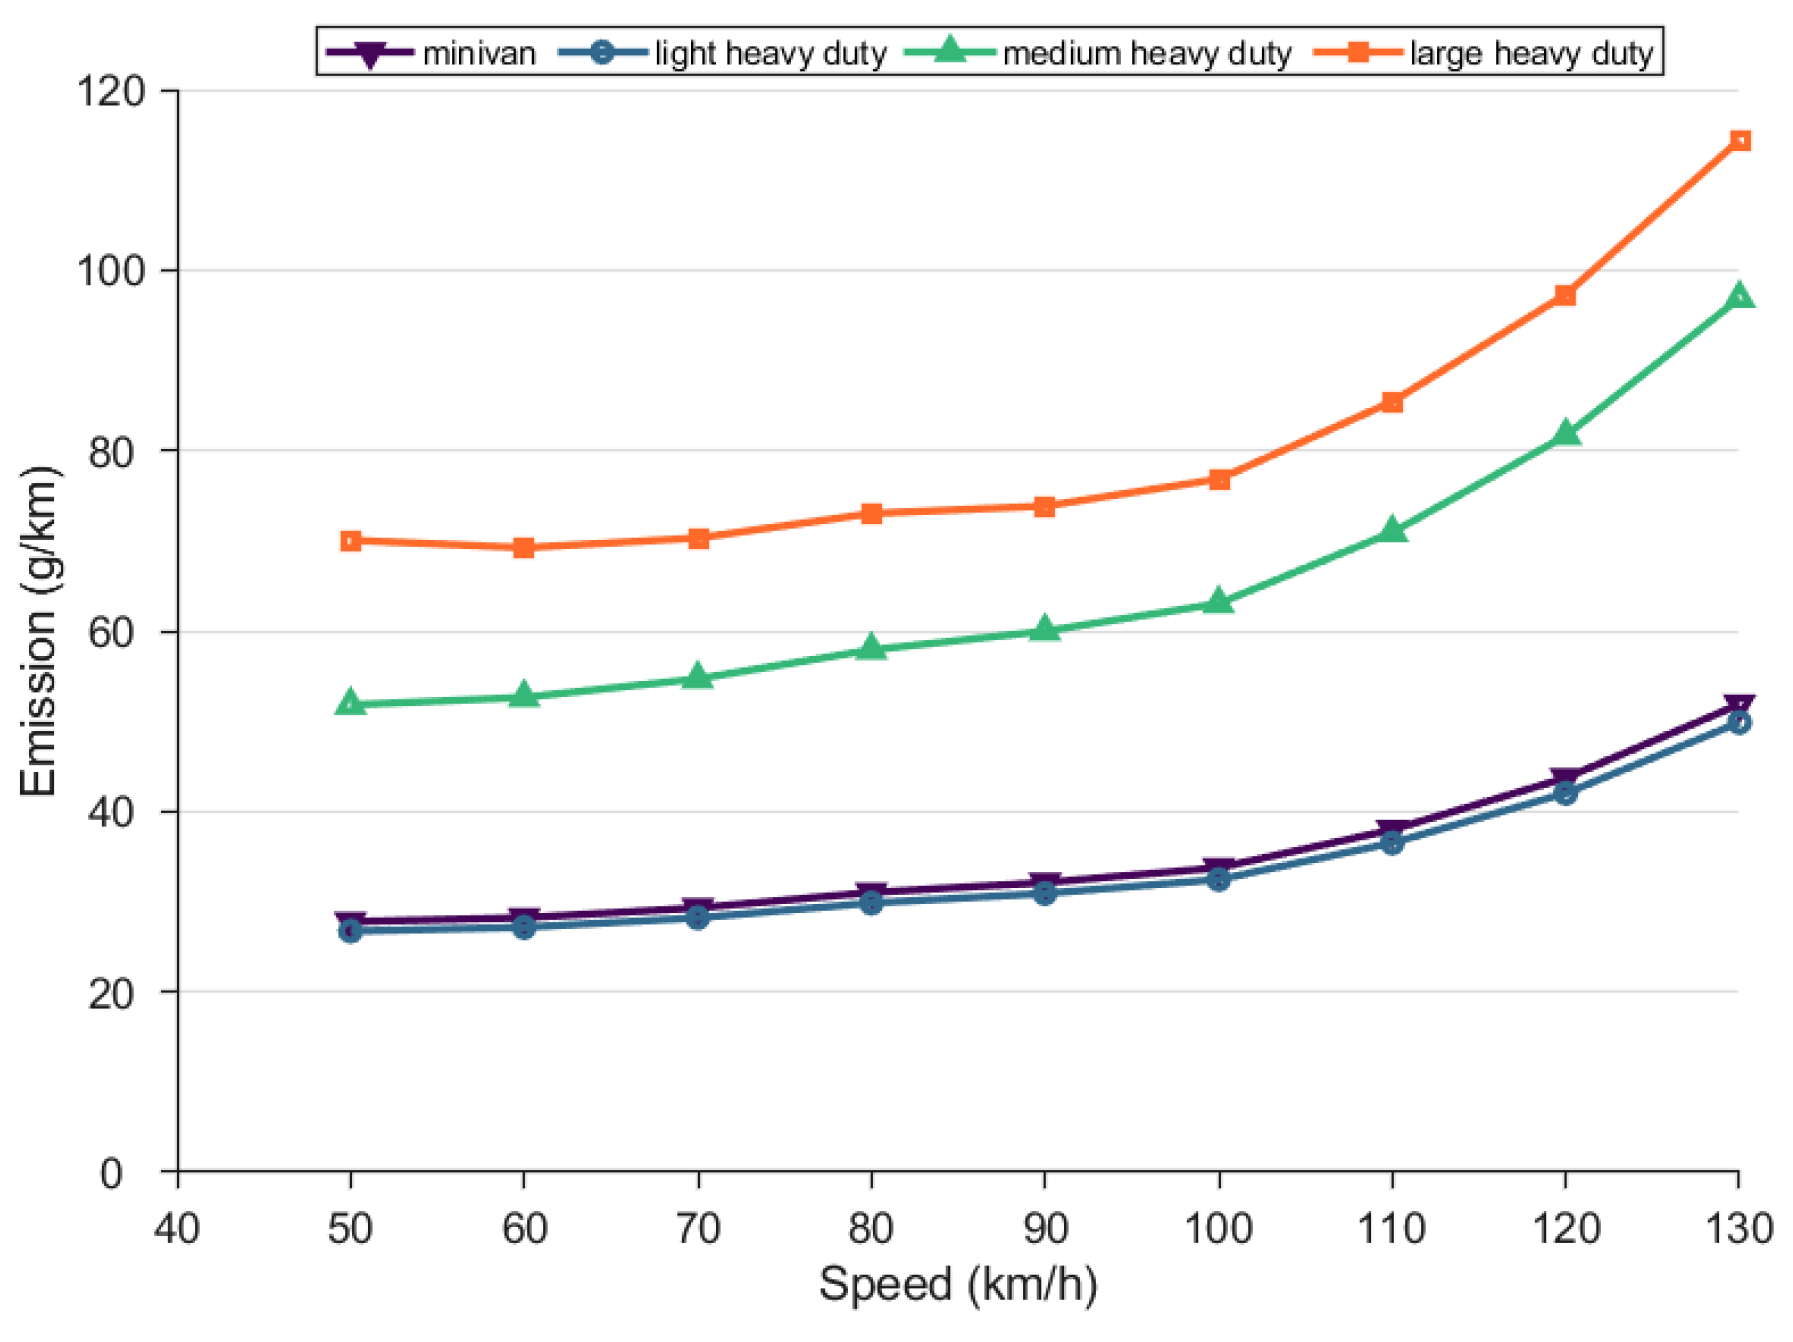
In the MOVES model, emissions from N-freight vehicles are categorized into four classes: N1-minivans and N2-light (total weight between 6.3 and 8.77 t), N3-medium (total weight between 8.77 and 14.85 t), and N4-large (total weight over 14.85 t) heavy-duty vehicles. The exhaust emissions were simulated for heavy trucks at speeds ranging from 50 to 130 km/h with intervals of 10 km/h. The simulation results for CO, NOx, HCs, and PM2.5 emissions for the four vehicle types are illustrated in Figure 9 and are detailed as follows:
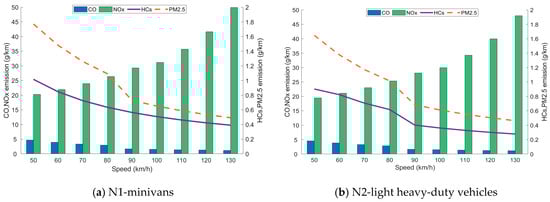
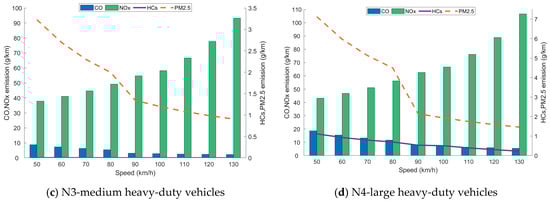
Figure 9.
Emission rates of CO, NOx, HCs, and PM2.5 for freight vehicles as a function of speed.
- Notable differences in the magnitudes of the emission factors are evident among the four types of heavy trucks. NOx emissions are the highest, followed by CO, PM2.5, and then HCs. Specifically, NOx emissions are about ten times those of CO, nearly thirty times those of PM2.5, and close to ten thousand times those of HCs.
- Regarding the differences in emissions among vehicle types, the following trend was observed: N4-large heavy-duty vehicles > N3-medium heavy-duty vehicles > N2-light heavy-duty vehicles > N1-minivans. The emission rates of N2 and N1 are quite similar, while the emissions of N3 are approximately double that of N2. N4 vehicles emit about twice the CO and PM2.5 emitted by N3 vehicles, whereas NOx and HCs emissions show similar magnitudes for these two vehicle types.
- The trends in CO, PM2.5, and HCs emissions across the four vehicle types are consistent: they all decrease with the increase in speed, initially dropping rapidly before tapering off. At low speeds, freight vehicle engines operate under low loads, leading to reduced combustion efficiency. As speed increases, the engine transitions to a more stable operating condition, resulting in improved combustion efficiency [60]. Increasing speed up to 80 km/h, the decrease in CO, PM2.5, and HCs emissions is more pronounced; above 90 km/h, the reduction becomes slower. The steepest declines for these three emission factors occur within the 80–90 km/h range.
- In contrast, NOx emissions increase at higher vehicle speeds. As vehicle speed increases, the engine’s power demand rises, leading to elevated combustion chamber temperatures and pressures, which significantly promote the formation of NOx. Increasing speed up to 90 km/h, the increase in NOx emissions is gradual; however, above 100 km/h, the rate of increase accelerates. In the range of 90–100 km/h, the increase in NOx emission rate is slowest.
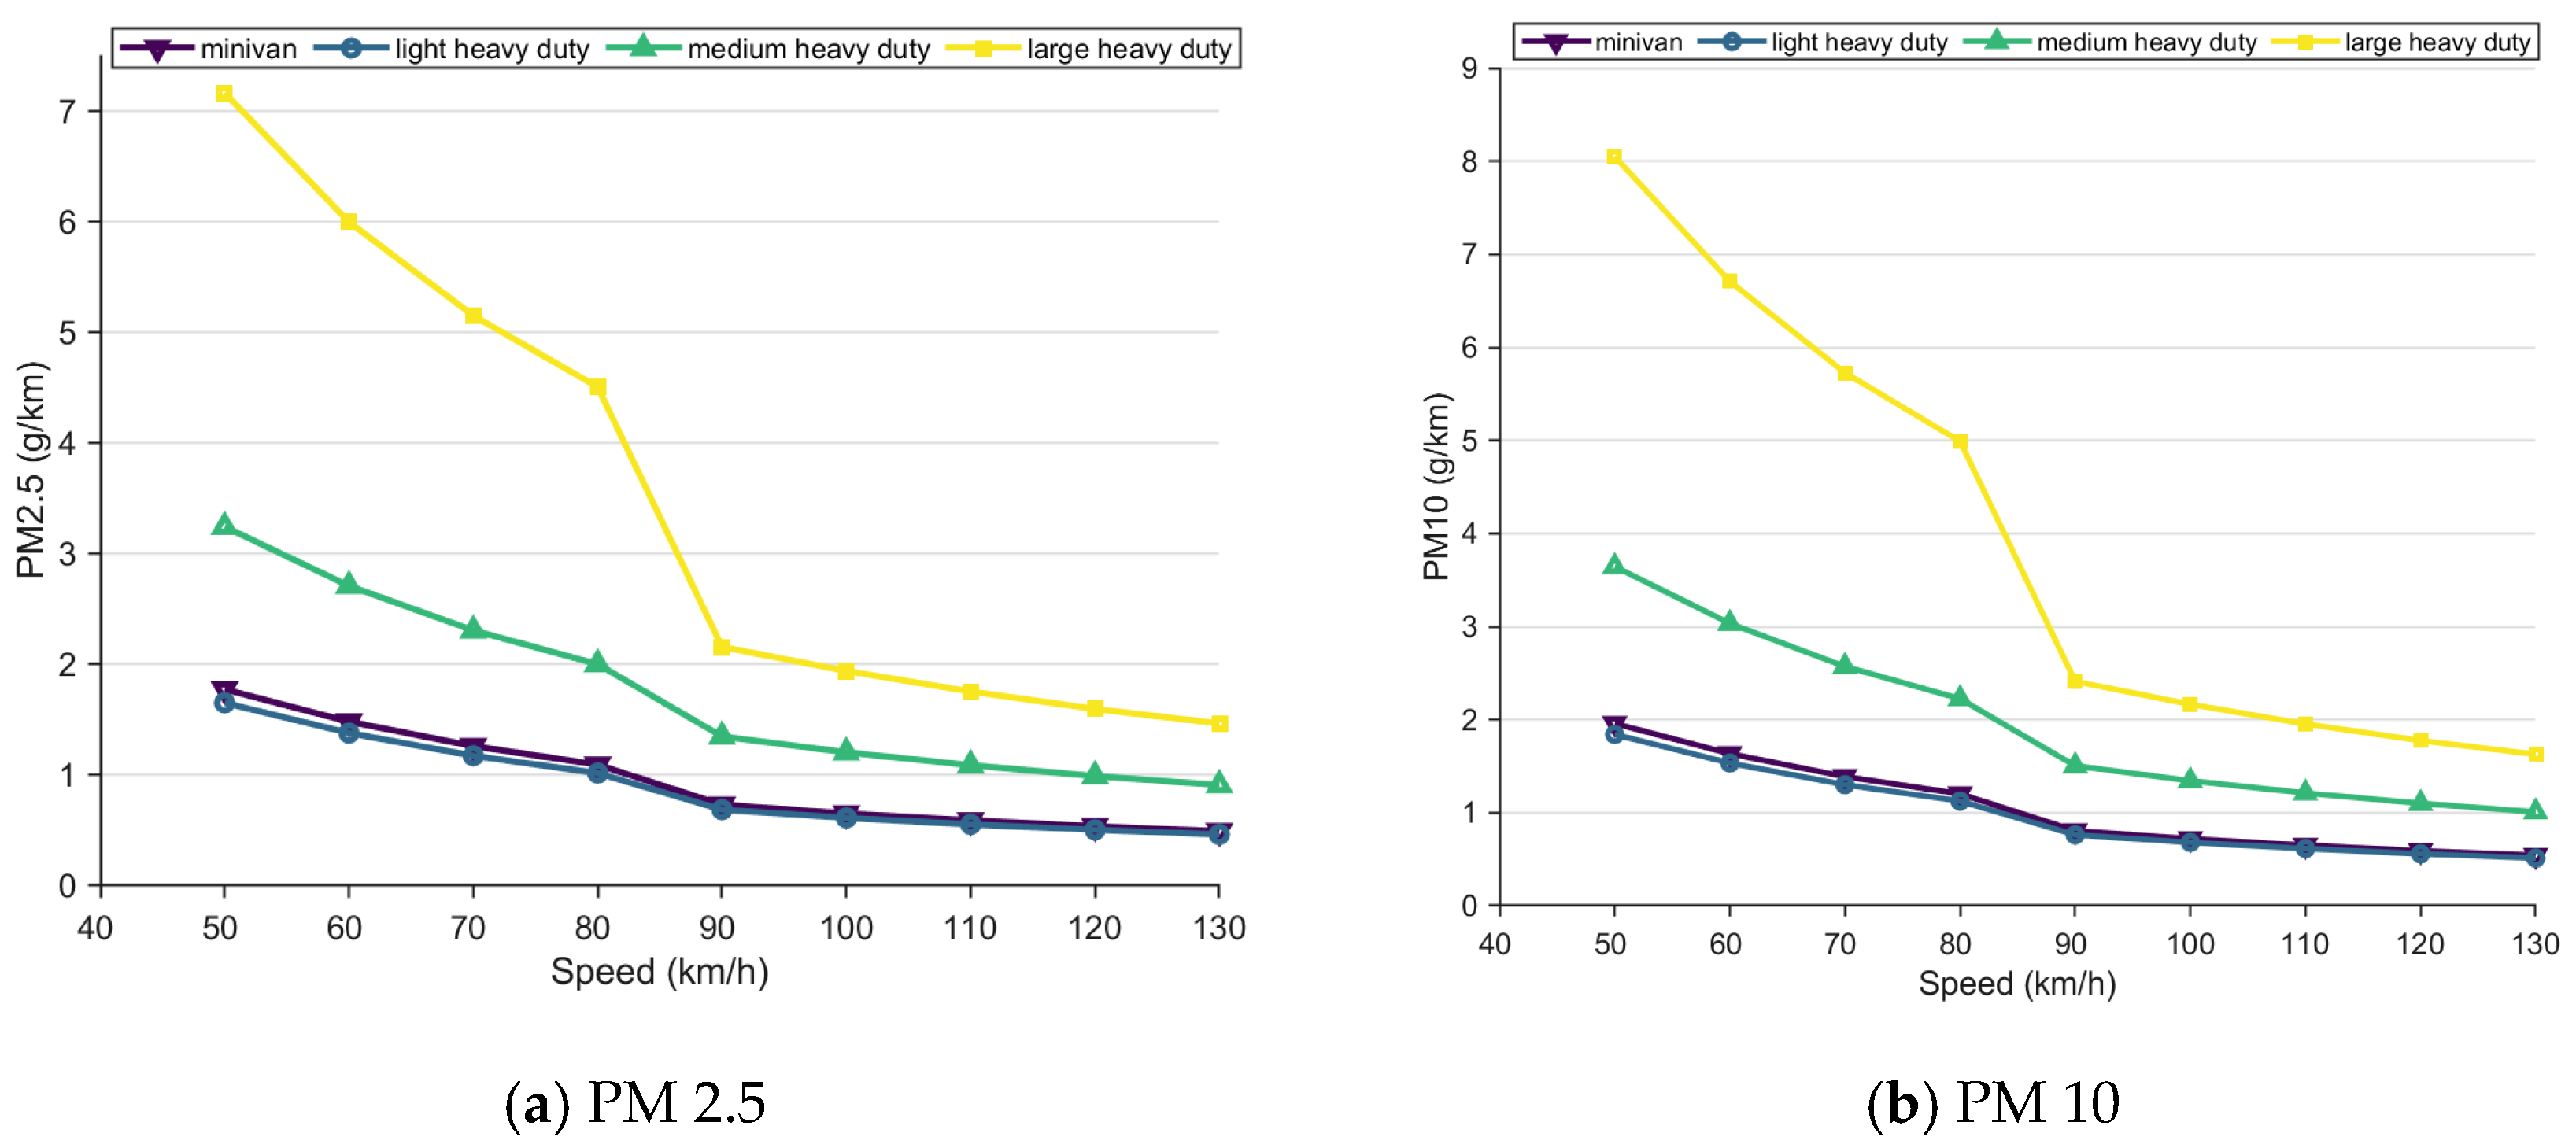
- Similarly to M1-light passenger vehicles traffic flow, the MOVES non-exhaust emissions module was utilized to generate non-exhaust sources of PM. These were combined with the PM from exhaust emissions to analyze the PM2.5 and PM10 produced during freight vehicle traffic flow, as shown in Figure 10. Numerically, the total PM was significantly higher than CO and HCs emissions and second only to NOx. The primary contributors were brake system and tire wear. Both PM2.5 and PM10 decreased with increasing speed, with a marked reduction in PM generation observed at speeds exceeding 80 km/h.
 Figure 10. PM of freight vehicle traffic flow at different speeds.
3.3. Total Exhaust Emission Characteristics
Due to differences in gasoline and diesel fuels, engine technologies, vehicle weight, and load capacities [61,62,63], the exhaust emissions of N-freight vehicles are higher than those of M1-light passenger vehicles. Moreover, the total exhaust emissions of these two vehicle types exhibit different trends with speed variations.
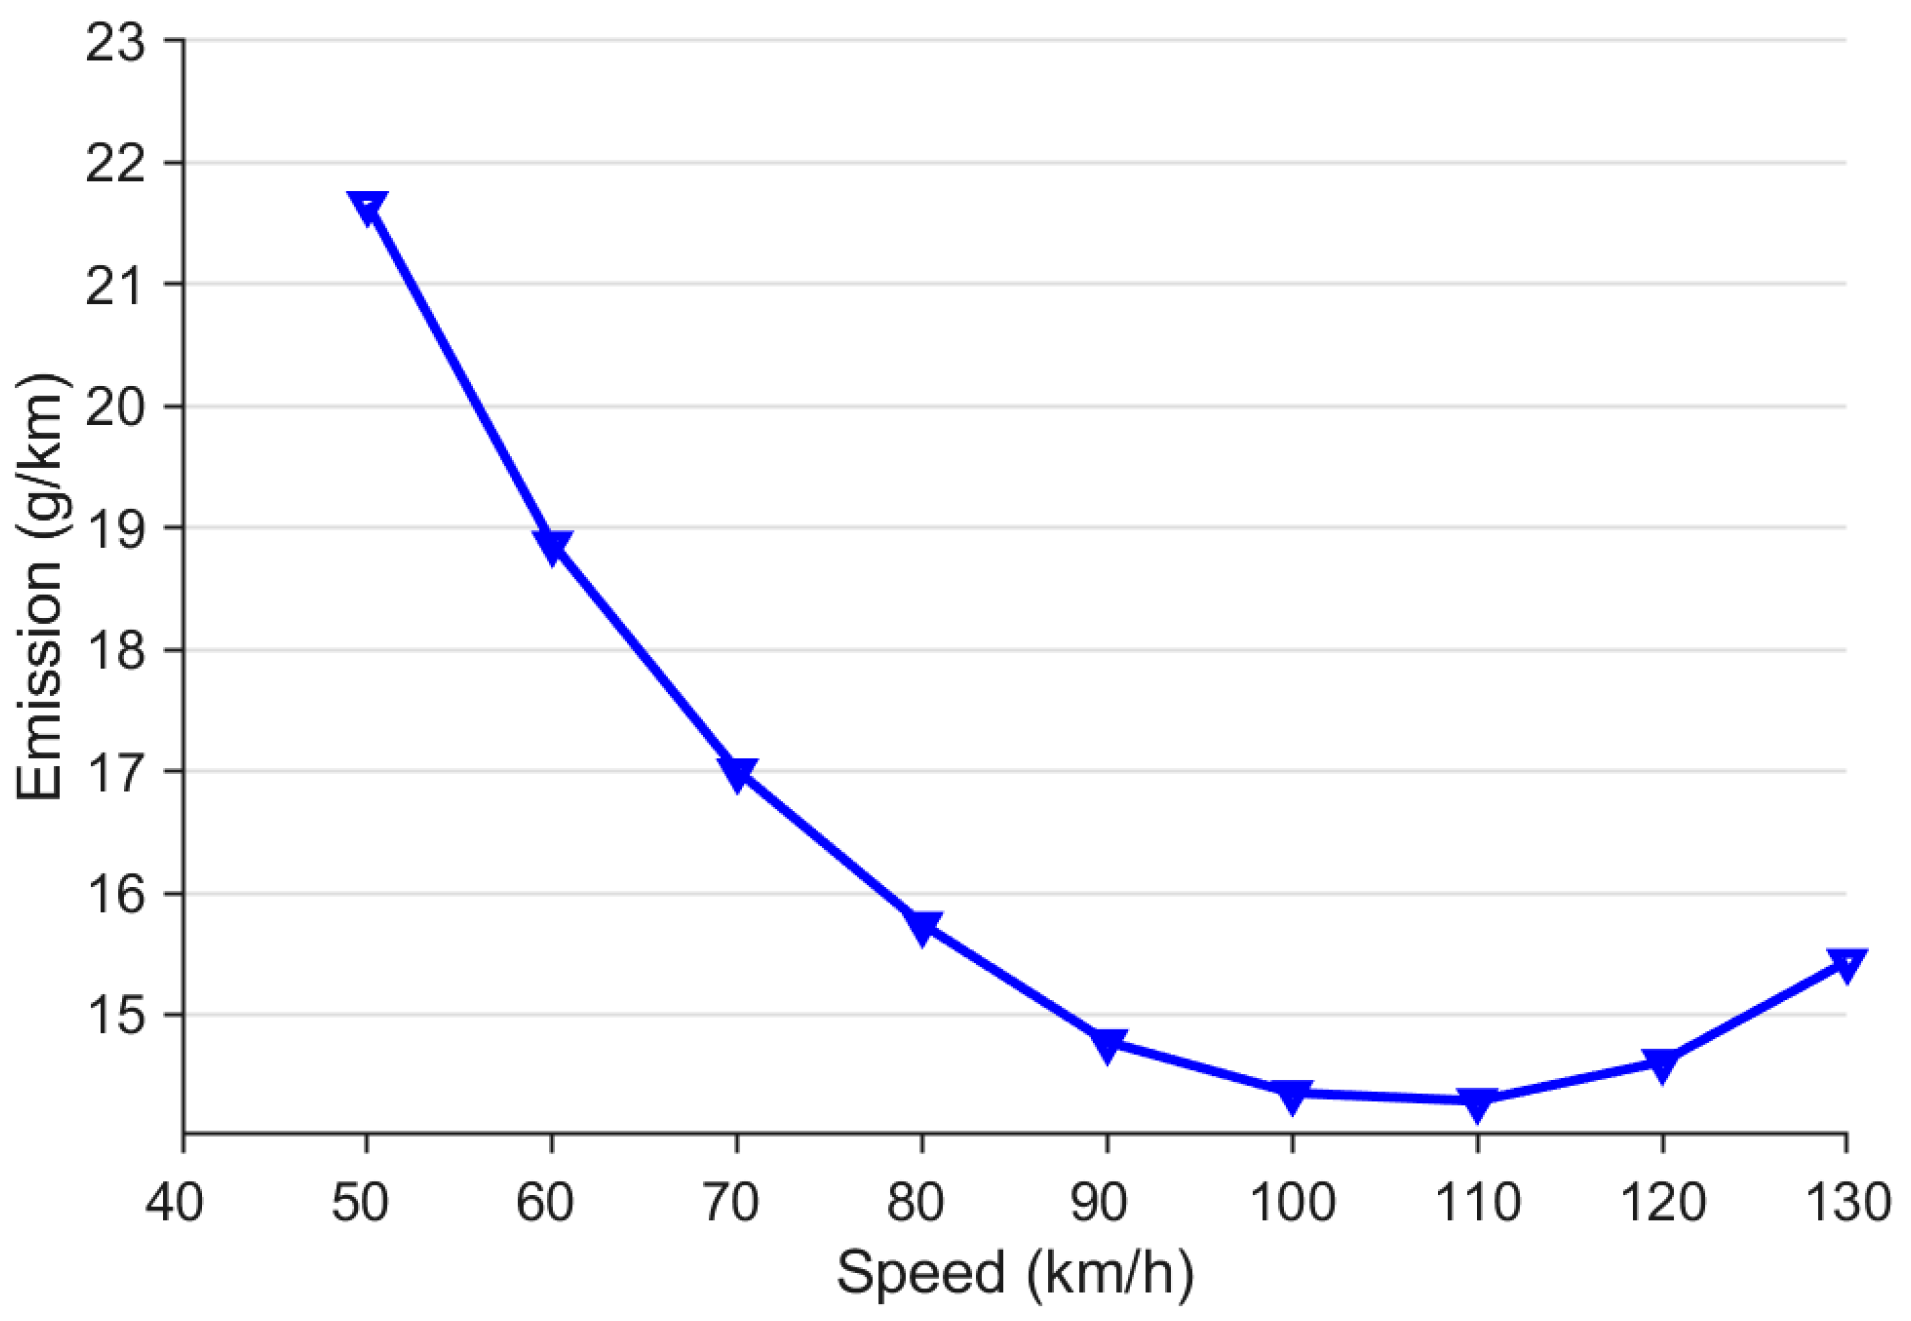
For M1, the analysis of the accumulation of emissions at various speeds (Figure 3a), alongside the total exhaust emissions statistics based on the MOVES model (Figure 11), reveals a trend of first decreasing and then increasing with speed. Following the fitting of the data in Figure 3a and Figure 11, the results of the changes in exhaust emissions from single-passenger cars and cars within traffic flow with speed are as follows:
where is the exhaust emissions from single passenger vehicles (g/km) and is the speed (km/h).
where is the exhaust emissions from the traffic flow of passenger vehicles (g/km).
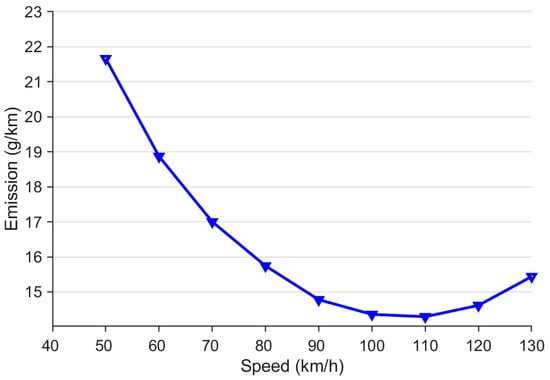
Figure 11.
Total emission changes for light passenger vehicles based on MOVES.
The values for Equations (1) and (2) are 0.927 and 0.9971, respectively, indicating that the fitted curves effectively reflect the majority of the exhaust emissions. Thus, the exhaust emissions in both cases present a quadratic relationship with speed. At speeds below 80 km/h, the total exhaust emissions significantly decrease; however, increasing beyond 120 km/h, an upward trend in emissions is evident. This indicates that the speed range of 90–120 km/h yields optimal exhaust emissions from M1-light passenger vehicles, with minimum emissions occurring at 110 km/h.
In contrast, for N-freight vehicles, a slight discrepancy is noted between the exhaust emission data from single-vehicle experiments and those predicted by the MOVES model. By fitting the data in Figure 5a and Figure 12, we obtained the following exhaust emissions from single trucks and trucks within traffic flow according to speed:
where is the exhaust emissions from single freight vehicles (g/km); is the exhaust emissions from the traffic flow of N1 (g/km); is the exhaust emissions from the traffic flow of N2 (g/km); is the exhaust emissions from the traffic flow of N3 (g/km); and is the exhaust emissions from the traffic flow of N4 (g/km).
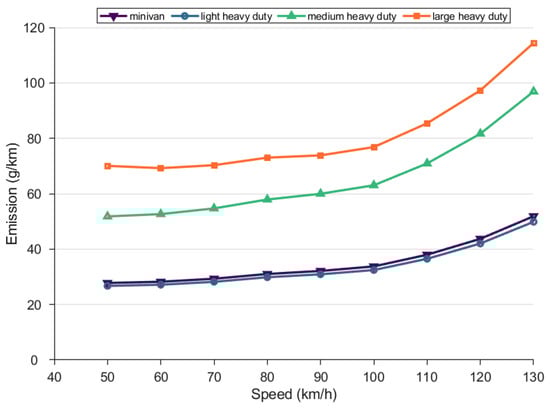
Figure 12.
Total emission changes for freight vehicles based on MOVES.
In Equations (3)–(7), the values are all greater than 0.8, indicating that the fitted results accurately reflect the changes in exhaust emissions from N-freight vehicles with speed, confirming a quadratic relationship between these two factors. Further analysis of the emission trends in Figure 5a and Figure 11 reveals that according to the single-vehicle experimental data (Figure 5a), the total exhaust emissions generally decrease with the increase in speed and then increase, with minimal emissions at around 70 km/h. According to the MOVES-based traffic emission data (Figure 11), the exhaust emissions of the four types of N-freight vehicles increase with speed, with higher speeds leading to greater emissions. The turning point for the growth trend of exhaust emissions occurs at 100 km/h; at speeds increasing up to 100 km/h, the total emissions increase slowly, while above 100 km/h, they increase markedly. Thus, at speeds below 100 km/h, the exhaust emissions from N-freight vehicles are relatively low, with the minimum emissions occurring at 70 km/h in single-vehicle tests.
3.4. Carbon Emission Characteristics
In the context of promoting the green development of transportation on highways, it is essential to consider carbon pollution, specifically, from motor vehicle exhaust alongside total exhaust emissions. The primary carbon pollutants from motor vehicles in China include CO, CH4, and EC. Focusing on low carbon emissions as a control objective, we analyze carbon emission characteristics based on single-vehicle measurement and MOVES simulation data.
For M1-light passenger vehicles, the carbon emissions from the single-vehicle measurement data (Figure 13a) and that derived from the MOVES simulation (Figure 13b) exhibit a trend characterized by an initial decrease and a subsequent increase with speed. The carbon emissions are relatively low in the speed range of 90–110 km/h, reaching their minimum at 100 km/h. By fitting the data, we obtained the following results of carbon emissions from passenger vehicles as units and within traffic flow according to speed:
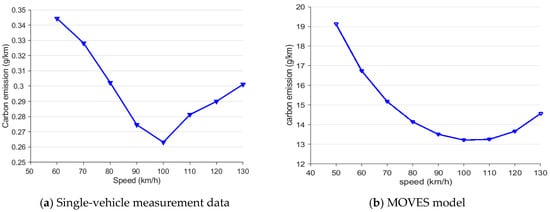
Figure 13.
Changes in carbon emissions from light passenger vehicles.
Carbon emissions from single-passenger vehicles are as follows:
where is the carbon emissions from single passenger vehicles (g/km) and is the speed (km/h).
Carbon emissions from the traffic flow of passenger vehicles are as follows:
where is the carbon emissions from the traffic flow of passenger vehicles (g/km). The values for Equations (8) and (9) are greater than 0.9, indicating that the fitted equations effectively explain the variations in carbon emissions with speed. This demonstrates that the carbon emissions from M1 follow a quadratic relationship with speed.
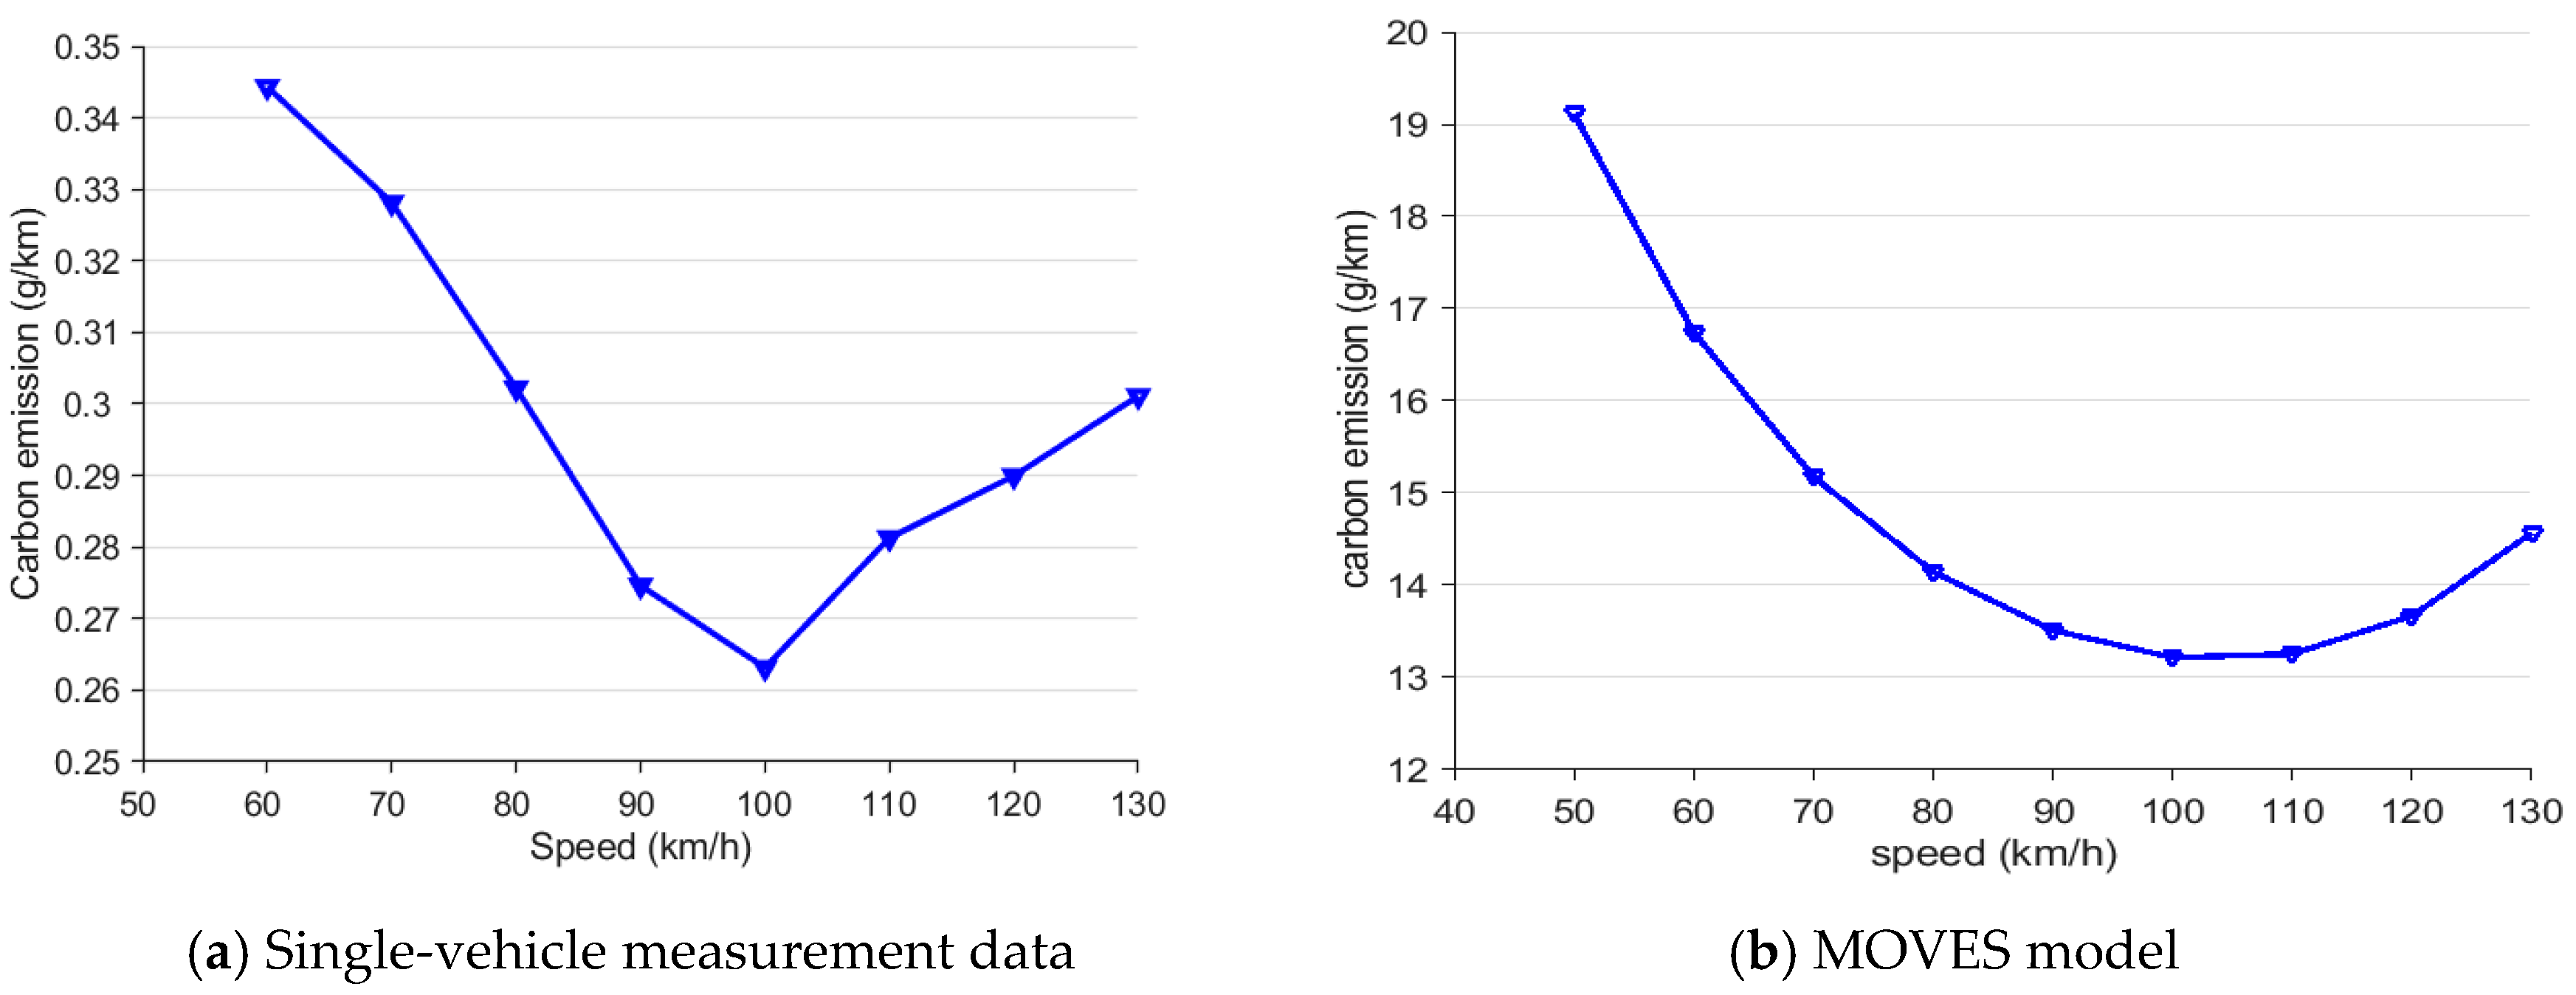
In terms of carbon emissions from N-freight vehicles, the trends observed in both sets of data are consistent, with emissions decreasing as the speed increases. In the single-vehicle experimental data (Figure 14a), two significant drops in carbon emissions occur within 60–70 and 80–90 km/h. Similarly, in the MOVES-based traffic flow data (Figure 14b), a notable decrease is also observed in the 80–90 km/h range. The results of the carbon emissions from N according to speed are as follows:
where is the carbon emissions from single freight vehicles (g/km); is the carbon emissions from the traffic flow of N1 (g/km); is the carbon emissions from the traffic flow of N2 (g/km); is the carbon emissions from the traffic flow of N3 (g/km); and is the carbon emissions from the traffic flow of N4 (g/km). In Equations (10)–(14), all values are greater than 0.9, indicating that the carbon emissions from freight vehicles exhibit a linear relationship with speed.
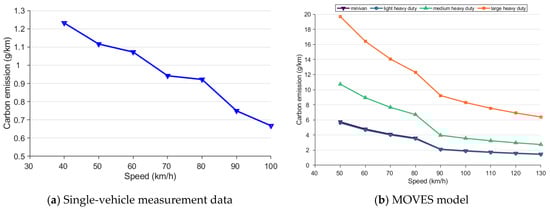
Figure 14.
Changes in carbon emissions from freight vehicles.
4. Conclusions
4.1. Comparison of Emission Characteristics
Based on the analysis of typical emission factors, total exhaust emissions, and carbon emissions, we draw the following conclusions regarding the emission characteristics of M1-light passenger vehicles and N-freight vehicles, as well as single-vehicle and traffic flow emissions.
4.1.1. Exhaust Emissions from Light Passenger Vehicles and Freight Vehicles
- By comparing the results from real-vehicle exhaust tests, it is evident that N- freight vehicles produce significantly higher exhaust emissions than M1. However, both vehicle types exhibit a similar trend in total exhaust emissions, which can be modeled with a quadratic function relative to the speed. Specifically, the speed corresponding to the minimum total exhaust emissions depends on vehicle type, i.e., 100 km/h for M1 and 70 km/h for N, indicating that the optimal speed for the former vehicle type is higher.
- The carbon emissions of M1 display a quadratic relationship with speed, showing a minimum carbon emission value within a plausible speed range, while N vehicles demonstrate a linear relationship, where carbon emissions decrease with the increase in speed.
- Regarding emission factors, significant differences in exhaust emission characteristics were observed between M1 and N at different speeds. At low speeds, M1 vehicles exhibit higher CO emissions due to incomplete combustion, with CO accounting for approximately 70% of the total exhaust. As the vehicle speed increases, combustion efficiency improves, leading to a gradual decrease in CO emissions, while NOx emissions increase.
- In contrast, N vehicles primarily emit NOX due to the high-pressure combustion characteristics of diesel engines, which generate a large amount of NOX under high-temperature, high-pressure conditions. Additionally, the PM2.5 emissions from freight vehicles are significantly higher than those from light passenger vehicles.
- Additionally, the PM emissions generated during vehicle operation exhibit distinct patterns between M1 and N vehicles. The PM2.5 and PM10 emissions of M1 are relatively low and follow a “U”-shaped trend as speed increases. The optimal speed range for minimizing PM2.5 emissions is between 80–110 km/h, while speeds above 90 km/h correspond to lower PM10 emissions. In contrast, N-freight vehicles, characterized by higher loads and diesel engine properties, emit significantly more particulate matter. For these vehicles, PM emissions decrease consistently with increasing speed. Based on the trends of PM2.5 and PM10 emissions, speeds above 90 km/h are identified as optimal for reducing PM emissions from freight vehicles.
4.1.2. Single-Vehicle Emissions vs. Traffic Flow Emissions
- The emission levels of typical factors differ between the single-vehicle and traffic flow cases. For M1-light passenger vehicles, the ranking of typical emission factors in both single-vehicle and traffic flow emissions is as follows: CO > HCs > NOx > PM2.5. CO emissions far exceed those of the other factors, indicating that CO is the primary pollutant in M1-light passenger vehicle exhaust.
- The trends in typical emission factors differ between the single-vehicle and traffic flow cases. In the former, CO initially decreases before increasing with speed, whereas in the latter, CO decreases with speed. HCs emissions in single-vehicle exhaust show an overall downward trend with some fluctuations; NOx and PM2.5 emissions increase with speed.
- For N-freight vehicles, the ranking of typical emission factors is NOx > CO > PM2.5 > HCs, indicating that NOx is the primary pollutant. In single-vehicle emissions, CO, HCs, and PM2.5 decrease with the increase in speed, while NOx initially decreases and then increases. In traffic flow emissions, the trends for CO, PM2.5, and HCs are consistent with those for single-vehicle emissions, while NOx increases with vehicle speed.
The differences in the data may stem from the fact that the real-vehicle experiments focused on a single model and individual-vehicle emissions. An individual vehicle may exhibit variability in emissions, whereas the MOVES model analyzes emissions in the context of highway environments, avoiding the bias associated with single-vehicle emissions, resulting in more macro-level insights. In the analysis, it is thus essential to consider the common patterns evident in both sets of data.
4.2. Speed Limits
Based on the data reported in Section 3 regarding the characteristics of total exhaust emissions and carbon emissions, the selection of speed ranges should prioritize low exhaust and, specifically, low carbon emissions. According to the analyses in Section 3.3 and Section 3.4, along with the fitting of the formulas, the carbon and exhaust emissions from M1-light passenger vehicles, whether taken individually or in traffic flow, satisfy a quadratic function relative to speed. The speeds at which exhaust emissions are minimized were calculated, as shown in Table 5. Moreover, based on the emission curves, the speed range for low exhaust emissions from M1-light passenger vehicles was found to be 90–120 km/h, while for low carbon emissions, the range is 90–110 km/h.
Table 5.
Summary of calculated speed for minimum exhaust and carbon emissions from light passenger vehicles.
For N-freight vehicles, the relationship between exhaust emissions and speed changes conforms to a quadratic function, while carbon emissions relate linearly to speed changes. Therefore, for the target of low exhaust emissions, the minimum speed values corresponding to minimum emissions are provided in Table 6. Considering the emission curves, the speed limit for N should be set to 100 km/h (as growth rates are relatively slow below this speed, but total exhaust emissions increase significantly above this value). For low carbon emissions specifically, based on the carbon emissions curve, the speed limit for N should ideally be set to 80 km/h, which corresponds to the second significant drop in carbon emissions observed in the real measurements and MOVES simulations.
Table 6.
Summary of calculated speed for minimum exhaust emissions for freight vehicles.
In summary, the consolidated speed limits for M1-light passenger and N-freight vehicles for achieving sustainable transportation development, focusing on low exhaust and carbon emissions, are presented in Table 7.
Table 7.
Speed limits for small and large vehicles for low-exhaust and low-carbon targets.
In summary, in this study, we investigated speed limits for various vehicle types from the perspective of the spatial environment to promote the green and sustainable development of transportation on expressways. Based on real-vehicle exhaust emission tests and the MOVES model, our analysis focused on the emission of CO, NOx, HCs, and PM2.5, as well as total exhaust emissions and carbon emissions. We examined the exhaust emission patterns of vehicles as single units and within traffic flow at different speeds, with the objective of minimizing exhaust emissions and carbon output, ultimately proposing optimal speed limits for highway vehicles that align with sustainable development goals.
The single-vehicle data obtained in this study may exhibit some deviation because of factors such as mechanical wear, vehicle performance, and laboratory conditions. In traffic flow data analysis, in terms of traffic composition, which was surveyed on actual expressways, differences across various roads exist. Furthermore, with the development and proliferation of electric vehicles, changes in the traffic composition, particularly an increase in the proportion of electric vehicles on expressways, can lead to alterations in traffic flow exhaust emissions and impact the environmental sustainability of the entire industrial chain. In future research, it will be essential to focus on the exhaust emission characteristics of vehicles operating at low speeds (30–50 km/h) on urban roads and to establish speed limits that align with the goals of sustainable urban transportation.
The significance of this research extends beyond academic circles, offering practical implications for policymakers, highway administrators, and the automotive industry. By bridging the gap between vehicle-specific performance characteristics and practical highway management solutions, we aim to offer valuable insights for the ongoing development of more sustainable transportation systems. Although the proposed low carbon, low tailpipe emission limited speed range may conflict slightly with efficient, fast travel on expressways and fuel consumption economy, expressway management should not be pursued as a single goal, but rather as a systematic and holistic approach, trying to achieve synergistic management of different goals. By providing empirical evidence on optimal speed ranges for emission control, this study can inform the development of more effective and targeted policies for highway speed management. Ultimately, the broader goals of environmental protection and public health improvement are advanced.
Author Contributions
Conceptualization, W.L. and J.L.; formal analysis, W.L. and C.W.; funding acquisition, J.L.; investigation, Z.W.; methodology, Q.Y.; software, W.L., D.S. and C.W.; supervision, Q.Y.; writing—original draft, W.L.; writing—review and editing, J.L. and Q.Y. All authors have read and agreed to the published version of the manuscript.
Funding
This study was funded by the National Key R&D Program of China [2022YFC3002600], the Scientific Research Project of Henan Provincial Department of Transportation [2023-3-1] and Science and Technology Innovation Fund Project of CCCC First Highway Consultants Co., Ltd. [KCJJ2022-14].
Institutional Review Board Statement
Ethical approval was waived as the experiment would not cause any mental injury to the participants, have any negative social impact, or affect the participants’ subsequent behaviors. Although our research institutions do not have a dedicated ethics review board, several experts have assessed the research plan as thoroughly as feasible.
Informed Consent Statement
Informed consent was obtained from all the subjects involved in the study.
Data Availability Statement
The data used to support the findings of this study are available from the corresponding author upon request.
Conflicts of Interest
Author Weiwei Liu, Jianbei Liu, Donghui Shan and Chao Wang were employed by the company CCCC First Highway Consultants Co., Ltd. Author Zhiwei Wu was employed by the company Henan Zhonggong Design & Research Group Co., Ltd. The remaining author declares that the research was conducted in the absence of any commercial or financial relationships that could be construed as a potential conflict of interest. The authors declare that this study received funding from Science and Technology Innovation Fund Project of CCCC First Highway Consultants Co., Ltd. The funder had the following involvement with the study: KCJJ2022-14. The funder was not involved in the study design, collection, analysis, interpretation of data, the writing of this article or the decision to submit it for publication.
References
- Olmo, N.R.S.; do Nascimento Saldiva, P.H.; Braga, A.L.F.; Lin, C.A.; de Paula Santos, U.; Pereira, L.A.A. A review of low-level air pollution and adverse effects on human health: Implications for epidemiological studies and public policy. Clinics 2011, 66, 681–690. [Google Scholar] [CrossRef] [PubMed]
- Hossain Lipu, M.S.; Miah, M.S.; Ansari, S.; Wali, S.B.; Jamal, T.; Elavarasan, R.M.; Kumar, S.; Naushad Ali, M.M.; Sarker, M.R.; Aljanad, A.; et al. Smart Battery Management Technology in Electric Vehicle Applications: Analytical and Technical Assessment toward Emerging Future Directions. Batteries 2022, 8, 219. [Google Scholar] [CrossRef]
- Yadav, D.; Goyal, R.; Yadav, V.S. A review of control strategies for automotive evaporative emissions practiced worldwide. AIP Conf. Proc. 2019, 2148, 30024. [Google Scholar]
- Liu, X.; Li, X.; Wang, X.; Tai, S.; Hou, W.; Zhang, Y.; Yue, M. A Multi-Physics Control Model for Automotive Proton Exchange Membrane Fuel Cells. In Proceedings of the 2024 International Conference on Control, Automation and Diagnosis (ICCAD), Paris, France, 15–17 May 2024; pp. 1–5. [Google Scholar]
- Gren, L.; Malmborg, V.B.; Falk, J.; Markula, L.; Novakovic, M.; Shamun, S.; Eriksson, A.C.; Kristensen, T.B.; Svenningsson, B.; Tunér, M.; et al. Effects of renewable fuel and exhaust aftertreatment on primary and secondary emissions from a modern heavy-duty diesel engine. J. Aerosol Sci. 2021, 156, 105781. [Google Scholar] [CrossRef]
- Emission Standards: Europe: Heavy-Duty Truck and Bus Engines. Available online: https://dieselnet.com/standards/eu/hd.php (accessed on 19 November 2024).
- Proposed Rule for Amendments Related to: Tier 3 Motor Vehicle Emission and Fuel Standards, Nonroad Engine and Equipment|US EPA. Available online: https://www.epa.gov/regulations-emissions-vehicles-and-engines/proposed-rule-amendments-related-tier-3-motor-vehicle (accessed on 19 November 2024).
- Limits and Measurement Methods for Emissions from Light-Duty Vehicles (CHINA 6)_Ministry of Ecological Environment of the People’s Republic of China. Available online: https://www.mee.gov.cn/ywgz/fgbz/bz/bzwb/dqhjbh/dqydywrwpfbz/201612/t20161223_369476.shtml (accessed on 19 November 2024).
- Vehicle Standards Historical Documents. Available online: https://www.infrastructure.gov.au/infrastructure-transport-vehicles/vehicles/vehicle-design-regulation/vehicle-standards-historical-documents (accessed on 19 November 2024).
- Mu, M.; Li, X.; Qiu, Y.; Shi, Y. Study on a New Gasoline Particulate Filter Structure Based on the Nested Cylinder and Diversion Channel Plug. Energies 2019, 12, 2045. [Google Scholar] [CrossRef]
- Wu, G.; Feng, G.; Li, Y.; Ling, T.; Peng, X.; Su, Z.; Zhao, X. A Review of Thermal Energy Management of Diesel Exhaust after-Treatment Systems Technology and Efficiency Enhancement Approaches. Energies 2024, 17, 584. [Google Scholar] [CrossRef]
- De Nino, A.; Maiuolo, L.; Costanzo, P.; Algieri, V.; Jiritano, A.; Olivito, F.; Tallarida, M.A. Recent Progress in Catalytic Synthesis of 1,2,3-Triazoles. Catalysts 2021, 11, 1120. [Google Scholar] [CrossRef]
- Giechaskiel, B.; Melas, A.; Valverde, V.; Otura, M.; Martini, G. Challenging Conditions for Gasoline Particulate Filters (GPFs). Catalysts 2022, 12, 70. [Google Scholar] [CrossRef]
- Garcia, E.; Triantopoulos, V.; Trzaska, J.; Taylor, M.; Li, J.; Boehman, A.L. Extreme Miller cycle with high intake boost for improved efficiency and emissions in heavy-duty diesel engines. Int. J. Engine Res. 2021, 24, 552–566. [Google Scholar] [CrossRef]
- DeRoy, P.; Ramanujan, A.; Rostamzadeh, C.; Worden, M.; Monti, T.; Schulz, W. Investigation of the Effectiveness of RF Absorbers for Mitigation of Automotive Radiated Emission by Measurement and Simulation. In Proceedings of the 2019 IEEE International Symposium on Electromagnetic Compatibility, Signal & Power Integrity (EMC+SIPI), New Orleans, LA, USA, 22–26 July 2019; pp. 178–183. [Google Scholar]
- Paulo Bressan, C.D.C. Application of Hall Effect Sensor in temperature control valve of automotive Internal Combustion Engine. Int. J. Adv. Eng. Res. Sci. 2019, 4, 439–443. [Google Scholar] [CrossRef]
- Saravanan, M.; Senthil, J.; Sudhakar, S.; Sathish Kumar, L.; Sowmithri, O. Embedded Control System for Recent Petrol Engine Control. Int. J. Innov. Technol. Explor. Engineering 2019, 9, 508–511. [Google Scholar]
- Bishop, J.D.K.; Molden, N.; Boies, A.M. Using portable emissions measurement systems (PEMS) to derive more accurate estimates of fuel use and nitrogen oxides emissions from modern Euro 6 passenger cars under real-world driving conditions. Appl. Energ. 2019, 242, 942–973. [Google Scholar] [CrossRef]
- Wang, P.; Zhang, R.; Sun, S.; Gao, M.; Zheng, B.; Zhang, D.; Zhang, Y.; Carmichael, G.R.; Zhang, H. Aggravated air pollution and health burden due to traffic congestion in urban China. Atmos. Chem. Phys. 2023, 23, 2983–2996. [Google Scholar] [CrossRef]
- Fondzenyuy, S.K.; Turner, B.M.; Burlacu, A.F.; Jurewicz, C.; Usami, D.S.; Feudjio, S.L.T.; Persia, L. The Impact of Speed Limit Change on Emissions: A Systematic Review of Literature. Sustainability 2024, 16, 7712. [Google Scholar] [CrossRef]
- Skrúcaný, T.; Kendra, M.; Stopka, O.; Milojević, S.; Figlus, T.; Csiszár, C. Impact of the Electric Mobility Implementation on the Greenhouse Gases Production in Central European Countries. Sustainability 2019, 11, 4948. [Google Scholar] [CrossRef]
- Shang, X.; Huang, S.; Zheng, J. A Study on Time-Varying Synergy of Energy Consumption, Economic Growth, and CO2 Emissions in China. J. Adv. Comput. Intell. Intell. Inform. 2023, 27, 1056–1069. [Google Scholar] [CrossRef]
- André, M.; Hammarström, U. Driving speeds in Europe for pollutant emissions estimation. Transp. Res. Part D Transp. Environ. 2000, 5, 321–335. [Google Scholar] [CrossRef]
- Moawad, A.; Zebiak, M.; Han, J.; Karbowski, D.; Zhang, Y.; Rousseau, A. Effect of adaptive cruise control on fuel consumption in real-world driving conditions. Nat. Commun. 2024, 15, 10016. [Google Scholar] [CrossRef]
- Li, Z.; Ming-ming, F.; Yang, L.; Hong, C.; Rui, W.; Zhi-kun, Y. Construction of a Trip Dynamic Factor to Characterize the Real Driving Emissions of Vehicles. China J. Highw. Transp. 2024, 37, 315–324. [Google Scholar]
- Du, X.; Kang, X.; Gao, Y.; Wang, X. Driving behavior characterization and traffic emission analysis considering the vehicle trajectory. Front. Psychol. 2024, 14, 1341611. [Google Scholar] [CrossRef]
- Lyu, Z.; Pons, D.; Zhang, Y. Emissions and Total Cost of Ownership for Diesel and Battery Electric Freight Pickup and Delivery Trucks in New Zealand: Implications for Transition. Sustainability 2023, 15, 7902. [Google Scholar] [CrossRef]
- Dhital, N.B.; Wang, S.; Lee, C.; Su, J.; Tsai, M.; Jhou, Y.; Yang, H. Effects of driving behavior on real-world emissions of particulate matter, gaseous pollutants and particle-bound PAHs for diesel trucks. Environ. Pollut. 2021, 286, 117292. [Google Scholar] [CrossRef] [PubMed]
- Acuto, F.; Coelho, M.C.; Fernandes, P.; Giuffrè, T.; Macioszek, E.; Granà, A. Assessing the Environmental Performances of Urban Roundabouts Using the VSP Methodology and AIMSUN. Energies 2022, 15, 1371. [Google Scholar] [CrossRef]
- Goedertier, F.; Weijters, B.; Vanpaemel, P. The Longitudinal Effect of Digitally Administered Feedback on the Eco-Driving Behavior of Company Car Drivers. Sustainability 2023, 15, 16571. [Google Scholar] [CrossRef]
- Al-Hadhrami, B.M. Implementation of a Management System to Mitigate Carbon Dioxide Emissions from Light Vehicles Transportation Through Improved Driving Behavior in the State of Kuwait. In Proceedings of the SPE International Health, Safety, Environment and Sustainability Conference and Exhibition, Abu Dhabi, United Arab Emirates, 10–12 September 2024; p. D021S017R005. [Google Scholar]
- He, W.; Duan, L.; Zhang, Z.; Zhao, X.; Cheng, Y. Analysis of the Characteristics of Real-World Emission Factors and VSP Distributions—A Case Study in Beijing. Sustainability 2022, 14, 11512. [Google Scholar] [CrossRef]
- Aggelakakis, A.; Anagnostopoulou, A.; Tromaras, A.; Boile, M.; Mantzinou, N. Influence of Traffic Emissions on Urban Air Quality: A Case Study of a Medium Sized City; Springer International Publishing: Cham, Switzerland, 2019; pp. 323–329. [Google Scholar]
- Lyu, P.; Wang, P.S.; Liu, Y.; Wang, Y. Review of the studies on emission evaluation approaches for operating vehicles. J. Traffic Transp. Eng. Engl. Ed. 2021, 8, 493–509. [Google Scholar] [CrossRef]
- Duan, Y.; Gao, Y.; Zhao, J.; Xue, Y.; Zhang, W.; Wu, W.; Jiang, H.; Cao, D. Agricultural Methane Emissions in China: Inventories, Driving Forces and Mitigation Strategies. Environ. Sci. Technol. 2023, 57, 13292–13303. [Google Scholar] [CrossRef]
- Miotti, M.; Needell, Z.A.; Ramakrishnan, S.; Heywood, J.; Trancik, J.E. Quantifying the impact of driving style changes on light-duty vehicle fuel consumption. Transp. Res. Part D Transp. Environ. 2021, 98, 102918. [Google Scholar] [CrossRef]
- Wu, J.; Qu, X. Intersection control with connected and automated vehicles: A review. J. Intell. Connect. Veh. 2022, 5, 260–269. [Google Scholar] [CrossRef]
- Luo, Y.; Ci, Y.; Jiang, S.; Wei, X. A novel lightweight real-time traffic sign detection method based on an embedded device and YOLOv8. J. Real-Time Image Process. 2024, 21, 24. [Google Scholar] [CrossRef]
- Yang, J.; Wang, P.; Ju, Y. Variable Speed Limit Intelligent Decision-Making Control Strategy Based on Deep Reinforcement Learning under Emergencies. Sustainability 2024, 16, 965. [Google Scholar] [CrossRef]
- Li, H.; Zhang, T.; Hgao, C.; Wang, J. Prediction Method for Remaining Useful Life of Rolling Bearings Using Variable Interval Sampling. In Proceedings of the 2022 IEEE 6th Information Technology and Mechatronics Engineering Conference (ITOEC), Chongqing, China, 4–6 March 2022; pp. 55–60. [Google Scholar]
- Jin-jun, T.; Qiang, F.; Cheng-cheng, W.; Chen, Y.; Xuan, Z.; Chang-jing, X. Multi-objective Optimization of Variable Speed Limit Control Strategy on Expressway. J. Transp. Syst. Eng. Inf. Technol. 2023, 23, 252–261. [Google Scholar]
- Wei-wei, L.; Jian-bei, L.; Qiang, Y.; Zhong-bin, L.; Jian-qiang, G. Variable Speed Limit Method for Rainy Weather Considering Freeway Operation Risk. China J. Highw. Transp. 2022, 35, 38–50. [Google Scholar]
- Wu, L.; Ci, Y.; Sun, Y.; Qi, W. Research on Joint Control of On-Ramp Metering and Mainline Speed Guidance in the Urban Expressway Based on MPC and Connected Vehicles. J. Adv. Transp. 2020, 2020, 7518087. [Google Scholar] [CrossRef]
- Ghadiri, S.M.; Torkan, R.; Mohd Sadullah, A.F. Speed Limit Compliance Index (SLCI): A Conceptual Method to Enhance the Efficiency of the Advisory Intelligent Speed Adaptation System. J. Adv. Transp. 2022, 2022, 2452922. [Google Scholar] [CrossRef]
- Qu, X.; Yang, M.; Ji, J.; Li, L.; Ran, B. Analyzing the Safety Impacts of Variable Speed Limit Control on Aggregated Driving Behavior Based on Traffic Big Data. J. Adv. Transp. 2021, 2021, 8823292. [Google Scholar] [CrossRef]
- McCarthy, P.; Rasul, M.G.; Moazzem, S. Comparison of the performance and emissions of different biodiesel blends against petroleum diesel. Int. J. Low-Carbon Technol. 2011, 6, 255–260. [Google Scholar] [CrossRef]
- Wang, Y.; Hao, C.; Ge, Y.; Hao, L.; Tan, J.; Wang, X.; Zhang, P.; Wang, Y.; Tian, W.; Lin, Z.; et al. Fuel consumption and emission performance from light-duty conventional/hybrid-electric vehicles over different cycles and real driving tests. Fuel 2020, 278, 118340. [Google Scholar] [CrossRef]
- Huang, Y.; Ng, E.C.Y.; Zhou, J.L.; Surawski, N.C.; Lu, X.; Du, B.; Forehead, H.; Perez, P.; Chan, E.F.C. Impact of drivers on real-driving fuel consumption and emissions performance. Sci. Total Environ. 2021, 798, 149297. [Google Scholar] [CrossRef]
- Huang, J.; Gao, J.; Wang, Y.; Yang, C.; Ma, C. Real-World Pipe-Out Emissions from Gasoline Direct Injection Passenger Cars. Processes 2023, 11, 66. [Google Scholar] [CrossRef]
- Fayyazbakhsh, A.; Bell, M.L.; Zhu, X.; Mei, X.; Koutný, M.; Hajinajaf, N.; Zhang, Y. Engine emissions with air pollutants and greenhouse gases and their control technologies. J. Clean Prod. 2022, 376, 134260. [Google Scholar] [CrossRef]
- Wu, X.; Zhang, S.; Wu, Y.; Li, Z.; Ke, W.; Fu, L.; Hao, J. On–road measurement of gaseous emissions and fuel consumption for two hybrid electric vehicles in Macao. Atmos. Pollut. Res. 2015, 6, 858–866. [Google Scholar] [CrossRef]
- Kwak, J.; Park, B.; Lee, J. Evaluating the impacts of urban corridor traffic signal optimization on vehicle emissions and fuel consumption. Transp. Plan. Technol. 2012, 35, 145–160. [Google Scholar] [CrossRef]
- Liao, T. A fuel-based signal optimization model. Transp. Res. Part D Transp. Environ. 2013, 23, 1–8. [Google Scholar] [CrossRef]
- Pandian, S.; Gokhale, S.; Ghoshal, A.K. Evaluating effects of traffic and vehicle characteristics on vehicular emissions near traffic intersections. Transp. Res. Part D Transp. Environ. 2009, 14, 180–196. [Google Scholar] [CrossRef]
- Wu, L.; Ci, Y.; Chu, J.; Zhang, H. The Influence of Intersections on Fuel Consumption in Urban Arterial Road Traffic: A Single Vehicle Test in Harbin, China. PLoS ONE 2015, 10, e0137477. [Google Scholar] [CrossRef]
- GB 17691-2005; Limits and measurement methods for exhaust pollutantsfrom compression ignition and gas fuelled positive ignition engines of vehicles (III, IV, V). China Environmental Science Press: Beijing, China, 2005.
- Ayissi, M.Z.; Newen, I.A.; Alloune, R.; Bitondo, D. Effects of Gasoline and Hydrogen Blends on Exhaust Gas Emissions and Fuel Consumption from Gasoline Internal Combustion Engines. J. Combust. 2022, 2022, 5526205. [Google Scholar] [CrossRef]
- Fussell, J.C.; Franklin, M.; Green, D.C.; Gustafsson, M.; Harrison, R.M.; Hicks, W.; Kelly, F.J.; Kishta, F.; Miller, M.R.; Mudway, I.S.; et al. A Review of Road Traffic-Derived Non-Exhaust Particles: Emissions, Physicochemical Characteristics, Health Risks, and Mitigation Measures. Environ. Sci. Technol. 2022, 56, 6813–6835. [Google Scholar] [CrossRef]
- Wang, X.; Gronstal, S.; Lopez, B.; Jung, H.; Chen, L.A.; Wu, G.; Ho, S.S.H.; Chow, J.C.; Watson, J.G.; Yao, Q.; et al. Evidence of non-tailpipe emission contributions to PM(2.5) and PM(10) near southern California highways. Environ. Pollut. 2023, 317, 120691. [Google Scholar] [CrossRef]
- Puškár, M.; Fil’O, M.; Kopas, M.; Harachová, D.K. Analysis of Various Factors’ Influence and Optimization of Low-Temperature Combustion Technology. ACS Omega 2024, 11, 13274–13283. [Google Scholar] [CrossRef]
- Reşitoğlu, İ.A.; Altinişik, K.; Keskin, A. The pollutant emissions from diesel-engine vehicles and exhaust aftertreatment systems. Clean Technol. Environ. 2015, 17, 15–27. [Google Scholar] [CrossRef]
- Ravi, S.S.; Osipov, S.; Turner, J.W.G. Impact of Modern Vehicular Technologies and Emission Regulations on Improving Global Air Quality. Atmosphere 2023, 14, 1164. [Google Scholar] [CrossRef]
- Yan, L.; Zhang, Q.; Zheng, B.; He, K. Modeling fuel-, vehicle-type-, and age-specific CO2 emissions from global on-road vehicles in 1970–2020. Earth Syst. Sci. Data 2024, 16, 4497–4509. [Google Scholar] [CrossRef]


Disclaimer/Publisher’s Note: The statements, opinions and data contained in all publications are solely those of the individual author(s) and contributor(s) and not of MDPI and/or the editor(s). MDPI and/or the editor(s) disclaim responsibility for any injury to people or property resulting from any ideas, methods, instructions or products referred to in the content. |
© 2024 by the authors. Licensee MDPI, Basel, Switzerland. This article is an open access article distributed under the terms and conditions of the Creative Commons Attribution (CC BY) license (https://creativecommons.org/licenses/by/4.0/).